
booksbooks
The Arduino-Inside Measurement Lab
An 8-in-1 test & measurement instrument for the electronics workbench


 Burkhard Kainka
The Arduino-Inside Measurement Lab
An 8-in-1 test & measurement instrument for the electronics workbench
● Burkhard Kainka● This is an Elektor Publication. Elektor is the media brand of Elektor International Media B.V.
PO Box 11, NL-6114-ZG Susteren, The Netherlands
Phone: +31 46 4389444
● All rights reserved. No part of this book may be reproduced in any material form, including photocopying, or storing in any medium by electronic means and whether or not transiently or incidentally to some other use of this publication, without the written permission of the copyright holder except in accordance with the provisions of the Copyright Designs and Patents Act 1988 or under the terms of a licence issued by the Copyright Licencing Agency Ltd., 90 Tottenham Court Road, London, England W1P 9HE. Applications for the copyright holder's permission to reproduce any part of the publication should be addressed to the publishers.
● Declaration
The author, editor, and publisher have used their best efforts in ensuring the correctness of the information contained in this book. They do not assume, and hereby disclaim, any liability to any party for any loss or damage caused by errors or omissions in this book, whether such errors or omissions result from negligence, accident or any other cause. All the programs given in the book are Copyright of the Author and Elektor International Media. These programs may only be used for educational purposes. Written permission from the Author or Elektor must be obtained before any of these programs can be used for commercial purposes.
● British Library Cataloguing in Publication Data
A catalogue record for this book is available from the British Library
●
ISBN 978-3-89576-603-9 Print
ISBN 978-3-89576-604-6 eBook
● © Copyright Elektor International Media
www.elektor.com
Editor: Jan Buiting, MA
Prepress Production: D-Vision, Julian van den Berg
Printers: Ipskamp, Enschede, The Netherlands
Elektor is the world's leading source of essential technical information and electronics products for pro engineers, electronics designers, and the companies seeking to engage them. Each day, our international team develops and delivers high-quality content - via a variety of media channels (including magazines, video, digital media, and social media) in several languages - relating to electronics design and DIY electronics. www.elektormagazine.com
● 4
Contents ● 5 Contents Foreword .......................................................... 7 Chapter 1 ● Preparations .............................................. 8 1.1 Choice of the Controller ........................................... 8 1.2 The Arduino Nano ............................................... 9 1.3 Supply Voltage ................................................ 11 Chapter 2 ● Preliminary Tests .......................................... 13 2.1 Port Outputs .................................................. 13 2.2 Analog inputs and outputs ........................................ 16 2.3 The Serial Plotter ............................................... 18 2.4 PWM Signal Generator . . . . . . . . . . . . . . . . . . . . . . . . . . . . . . . . . . . . . . . . . . . 21 2.5 A Sawtooth Generator ........................................... 23 2.6 Direct Digital Synthesis .......................................... 25 Chapter 3 ● GCC Programming ......................................... 28 3.1 Fast port outputs ............................................... 28 3.2 PWM Output .................................................. 28 3.3 Timer Interrupt ................................................ 32 3.4 Fast Sine Wave Generator ........................................ 33 3.5 AD Buffering .................................................. 39 Chapter 4 ● The 'MSR’ Laboratory ...................................... 46 4.1 Two-channel DDS Generator ....................................... 47 4.2 Binary Serial Transmission ........................................ 48 4.3 Frequency Setting 51 4.4 Deflection Times and Dual-channel Operation 54 4.5 Triggering 58 4.6 DC Voltage Output 60 Chapter 5 ● Additional Inputs and Outputs ............................... 63 5.1 DDS Phase Adjustment 63 5.2 Signal Generator up to 8 MHz 64 5.3 Frequency Measurement 68 5.4 Additional Analog Inputs 72
The Arduino-Inside Measurement Lab ● 6 5.5 Capacitance Measurement from 1 pF 74 5.6 Resistance Measurement up to 1 MΩ ................................. 76 5.7 Resistance Measurement from 1 Ω .................................. 78 Chapter 6 ● Measurements and Experiments .............................. 80 6.1 Subsampling .................................................. 80 6.2 Examination at Higher Frequencies .................................. 82 6.3 Measurements on a Synchronous Signal 84 6.4 Frequency Response of a Low-pass Filter 86 6.5 An LC Low Pass ................................................ 89 6.6 LC Resonance ................................................. 91 6.7 Transistor Test Circuit 93 Chapter 7 ● Firmware Extensions ....................................... 97 7.1 Alternative DDS Functions ........................................ 97 7.2 Reduced Amplitude 98 7.3 Triangle and Sawtooth . . . . . . . . . . . . . . . . . . . . . . . . . . . . . . . . . . . . . . . . . . . 99 7.4 X-Y Representation ............................................ 101 7.5 Frequency Sweep 104 7.6 Ramp Function ............................................... 106 7.7 Measurement of Characteristic Curves ............................... 110 Chapter 8 ● Application Examples ..................................... 114 8.1 The Emitter Follower ........................................... 114 8.2 Emitter Follower as Impedance Converter............................. 115 8.3 Sallen-Key Filter 116 8.4 Beat-Frequency Generator ....................................... 117 8.5 Operational Amplifier ........................................... 120 8.6 Voltage Doubling 121 8.7 All-pass Filter ................................................ 123 8.8 Bandpass Filter . . . . . . . . . . . . . . . . . . . . . . . . . . . . . . . . . . . . . . . . . . . . . . . 125 Appendix......................................................... 128 A.1 Bill of Materials 128 A.2 Breadboard Drawings ........................................... 128 A.3 Support Software ............................................. 128
Foreword
A well-equipped electronics lab is crammed with power supplies, measuring devices, test equipment and signal generators. In addition, there are tools, components and the many assemblies and projects you’re working on. It can get crowded in the lab. Wouldn’t it be better to have one compact device for almost all tasks? All in one, small and versatile, as well as inexpensive and easy to procure.
After several attempts with other systems, the choice fell on the Arduino Nano. On this basis, a PC interface as versatile as possible for measurement and control is to be developed. It simply hangs on a USB cable and, depending on the software, forms the measuring head of a digital voltmeter or PC oscilloscope, a signal generator, an adjustable voltage source, a frequency counter, an ohmmeter a capacitance meter, a characteristic curve recorder and much more.
The circuits and methods collected here are not only relevant for exactly these tasks in the electronics laboratory, but many details can also be used within completely different contexts. Often, you encounter complex tasks in the field of measurement technology during development work with microcontrollers and the methods from this book can be used in these cases, offering a starting point to develop the software in the desired direction.
Stay creative!
Burkhard KainkaSoftware and more information about the book: https://www.b-kainka.de/MeasurementLab.html
● 7
Chapter 1 ● Preparations
The first considerations for a universal measuring system went in the direction of a digital PC oscilloscope combined with a signal generator. The decisive factor is the achievable cutoff frequency.
1.1 Choice of the Controller
In the first experiment I tested a Bluepill board with a STM32 controller. This Cortex M3 controller with a clock rate up to 72 MHz has a very fast AD converter and an integrated USB interface. Basically, all tasks can be done by the same controller. Analog data is stored while at the same time values of a DDS table are sent to the fast PWM outputs to generate sine signals or other waveforms.
The experiments went quite far, but in the end some interfering factors became known. For the tasks ahead, it is important that the measuring sample and the outputs run in a fast and very accurate time limit. Sampling rates up to 100 kHz at a PWM frequency of 125 kHz with two output and two input channels each were achieved. But there was a permanent slight flutter within the time limit, caused by simultaneous demands of the USB interface. If the actual measurement and signal output is executed within a timer interrupt at 100 kHz, no other interrupt should be allowed. As soon as a second timer interrupt or, as in this case, a USB interrupt is added, the absolutely uniform time grid is over.
In addition, there were delivery problems. The general semiconductor crisis in 2021 meant that the Bluepill board was also hard to come by, so that also ended this way. Bye, bye Bluepill!
There are also other STM controllers. A development board STM32 Nucleo with a Cortex-M0 controller F040R8 with up to 64 MHz was used. The crucial difference was that it has no internal USB interface and transfers its data via the serial interface. The controller transmits its data only when it is measured and is hardly "loaded" by it serial data transmission. In fact, this completely eliminated the signal processing flutter. Actually, the project was on a good path. But I would have had to build a separate board with the STM32 controller and a USB/serial converter, which would have been relatively expensive in the end.
When you enter the 32-bit microcontroller world, the high clock rate is usually the first thing you notice. The rate should allow fast signal processing in real time. However, disappointment often follows as the more complex software seems to defeat the speed advantage. This and the procurement problems made some existing 8-bit controllers more interesting again.
The third attempt employed an 8051-compatible N76E003 from Nuvoton. It has 16 kByte and runs at 16 MHz. Its main advantage is several timers and an on-board PWM unit. This made it possible to achieve a clock rate of 50 kHz, in which both the analog data for the oscilloscope could be measured and the DDS data could be output to the PWM. All timecritical operations would run in a single timer routine.
The Arduino-Inside Measurement Lab ● 8
During further development, the requirements increased because a trigger function had to be included and the gate time of a frequency counter had to be measured at the same time. Therefore, the sampling rate had to be reduced to 32 kHz.
At this point I became curious: What would an ATmega328 do in comparison? First, I tested it with Bascom and was positively surprised right away. Although the controller used in the Arduino has only three timers, it is possible to use one timer at the same time for PWM output as well as for a timer interrupt. The sampling rate is now equal to the PWM output frequency 62.5 kHz. In addition, the serial transmission rate of 1 Mbit/s could be used, making intermediate storage of the measured values unnecessary. This effectively allows the same speed that was achieved with an STM32. In addition, many of the additional functions were proven to fit into the interrupt without consuming too much time.
That was four attempts with the same goal. The winner so far was the ATmega328 on an Arduino Nano. The system is cheap, widely used, and many readers may already have this board. However, this is not necessarily true for Bascom, hence the desire was to work with the Arduino IDE if possible. However, Arduino sketches are not real-time capable, because there are things going on in the background that you don’t necessarily see. This is the reason Bascom is much faster than the Arduino-C in most cases.
The decisive breakthrough came with the realization that the Arduino IDE can also be used for pure C. This permits using the familiar programming environment with its reliable bootloader and simple operation, while at the same time achieving maximum working speed of the controller.
This establishes the essential cornerstones of the development: An Arduino Nano is supplied with data and energy via its USB cable and returns measured values. Everything is evaluated and displayed on the PC. Programming the PC software with VB6 is only dealt with in passing, whereby the user can fall back on ready-made programs. The book focuses on firmware development in C, optimization of the measurement procedures and typical use of the measurements.
You don’t need much more than a solderless breadboard and a Nano. There is still room on the board for an operational amplifier and other components for filters or circuits to be tested. This also demonstrates the correct use of digital measurement devices. With this simple, low sampling rate device, many possible measurement errors can occur in the same way as with a fast DSO. If you work with it on a small scale, you will get fewer surprises on a large scale. In this way, working with the small measurement laboratory doubles as a useful basic course.
1.2 The Arduino Nano
All measurement programs presented in this book run on the Arduino Uno as well as on the Arduino Nano. It only depends on the controller, the ATmega328. The Arduino Nano has the advantage that it can be put on a breadboard together with other components.
Chapter 1 ● Preparations ● 9
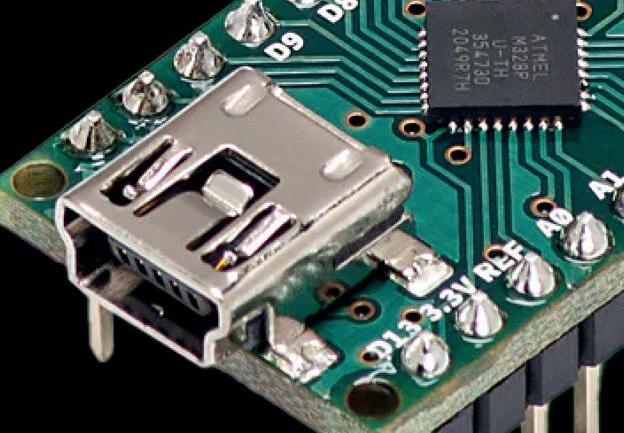
Besides the original Arduino Nano, there are several very inexpensive replicas. All of them use the same pinout and can be used for the experiments in this book. They differ in some technical details and often also in the USB socket. Mostly, a USB mini connector is used. It has the advantage of greater mechanical stability, which benefits experimental work. However, USB micro or USB C cables are now more common.
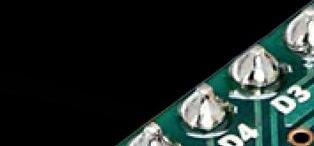
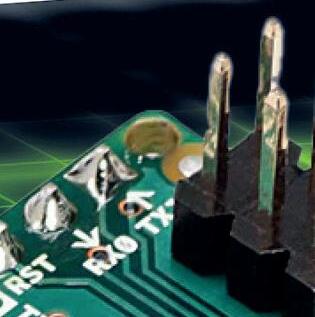
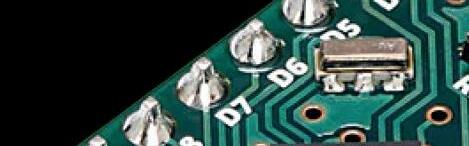
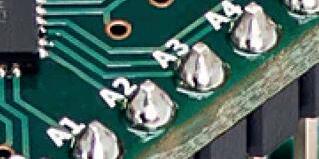
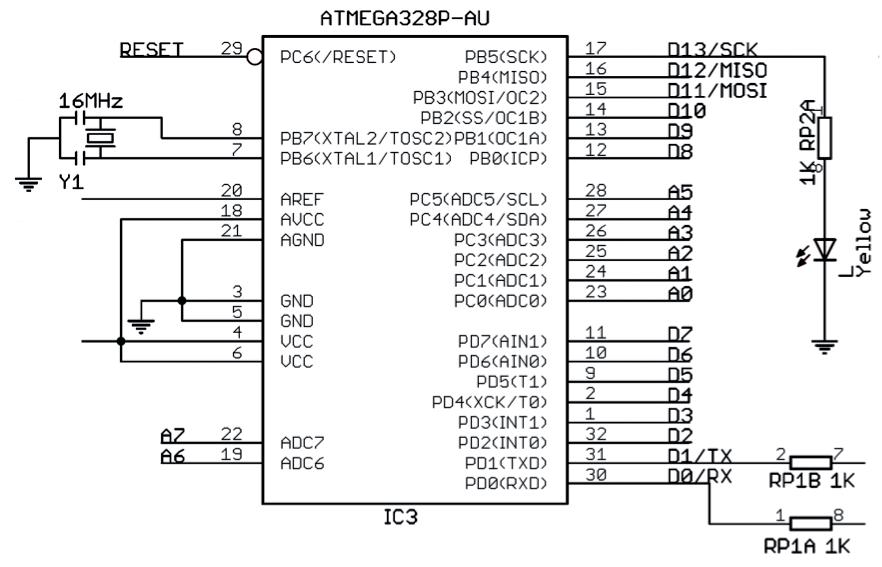
The outer connectors have been renamed to D0 through D13 and A0 through A7 according to Arduino style, and they can be addressed with the Arduino IDE under these names. But for deeper programming it is important to also know the original names of the controller.
The Arduino-Inside Measurement Lab ● 10
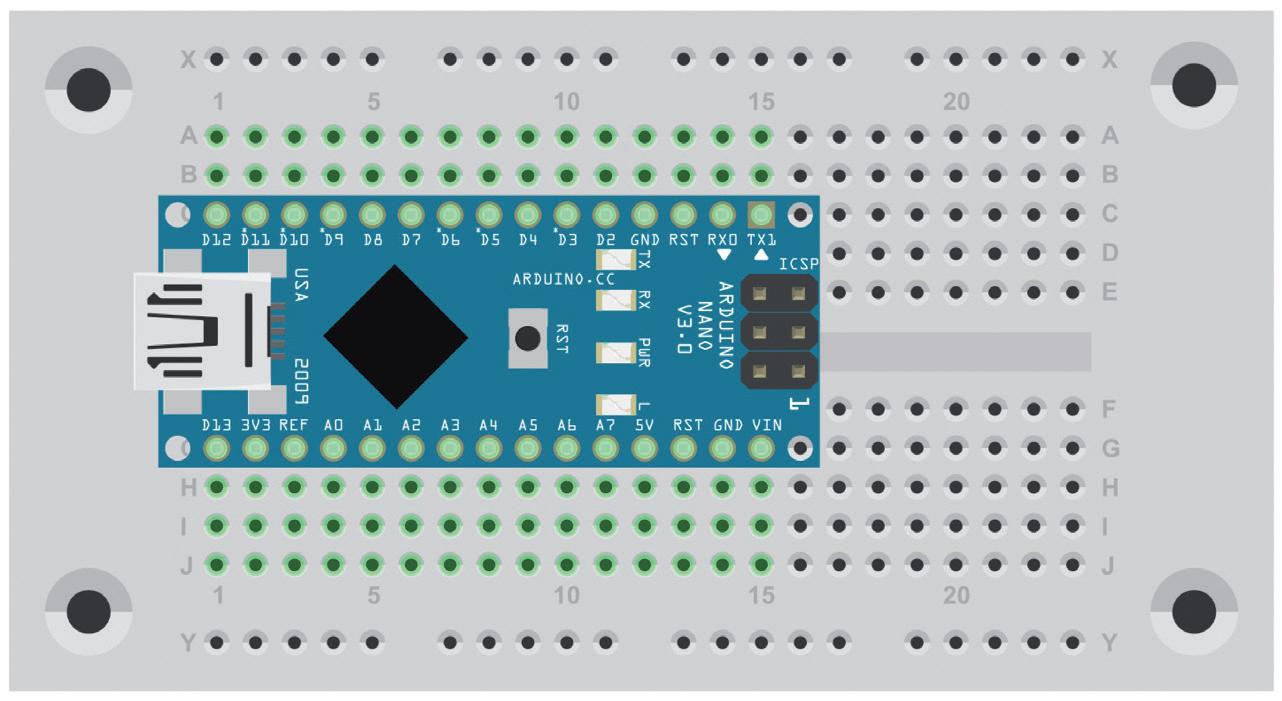
Arduino Nano on a breadboard.
A section from the Arduino Nano circuit diagram.
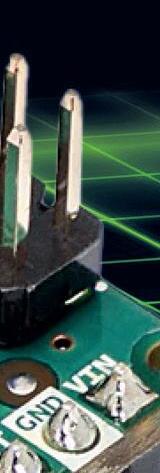
1.3 Supply Voltage
The original Arduino Nano uses an FT232RL USB converter whose internal voltage regulator also provides the 3.3 V supply voltage to the outside circuitry. Besides there are several replicas which use the cheaper CH340 USB converter. This also has a 3.3 V output but with less current capacity. Some replicas therefore use an additional voltage regulator, while others use the CH340output or leave the 3.3 V output completely free.

Like any Arduino, the Nano can get its 5 V operating voltage either from the USB or from an external voltage source with at least 7 V to Vin. The original Nano uses a Schottky diode in series with the USB supply, whose forward voltage reduces the operating voltage by up to 0.3 V. This diode prevents damage to the PC if a higher voltage is ever accidentally applied to the Nano.
Some Nano replicas omit the series connected Schottky diode in the interest of the full operating voltage. Often, two diodes are connected in antiparallel between VCC and GND. This provides protection against incorrectly polarized voltage, but not against overvoltage at VCC.
"Overvoltage? That can never happen to me", everyone would say. But while authoring this book it happened nevertheless. Because the Arduino Nano was simultaneously programmed as an oscilloscope and as a signal generator, adjustable within wide limits, it should examine the switching behaviour of a reed relay, which was connected to the laboratory power supply outputting 30 V via a switching transistor. There must have been a mistake and the 30 V came directly to the A0 analog input and from there, via the internal protection diode, at the port connector of the ATmega to the VCC line. The Nano survived this almost unscathed, only pin A0 had an internal termination against GND afterwards. But a USB hub and a webcam connected to it at the same time were destroyed. Later, it was found out that the USB hub had a series diode, which probably prevented even bigger damage to the PC.
By the way, the replica version of the Nano mostly used in Franzis Verlag packages would have prevented this damage just like the original Nano, because both have the Schottky diode in series with the USB supply.
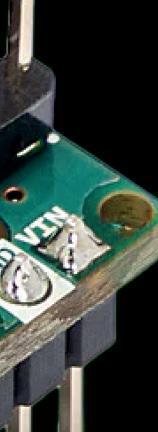
Another pitfall lurks with all Nanos: the VIN connection normally remains free when the controller is powered via USB. If you connect it to GND, the 5 V voltage regulator goes into
Chapter 1 ● Preparations ● 11
a forbidden state, which can lead to a latch up. The regulator then triggers like a thyristor and can get extremely hot. Also, a relatively large capacitor between VIN and GND can trigger this state at power-up due to its charging current. So this pin should be left free if you don’t want to connect an external power supply.
General precautions mainly concern the power supply used. An external power supply to Vin should only be used in exceptional cases because double caution is then necessary. The safest way is to supply power via the USB port, with an USB hub in between for even more safety. The disadvantage is often a reduced voltage at VCC, where instead of 5.0 V often only 4.5 V are measured. If the USB hub has an optional external power supply, this can be connected if high accuracy is required. VCC also serves as a voltage reference for the AD converter.
If a higher voltage is needed internally, voltage doubling can be used, which is presented in section 8.6. Possible errors are then less perilous because the circuit cannot supply large currents.
All connections to the outside world, for example, to external measuring objects, should be checked particularly carefully. For safety, additional 1 kΩ to 10 kΩ series resistors may be connected in series to test leads, which provide effective current limitation in the event of a fault.
The Arduino-Inside Measurement Lab ● 12
Chapter 2 ● Preliminary Tests
At first, quite regular Arduino sketches will to be discussed and used here. They allow you to test the different inputs and outputs, get to know typical measurement methods, and at the same time examine how fast the controller is able to work with them.
2.1 Port Outputs
Whenever I want to test an Arduino, I first load the program "Blink" from the examples (group 01. Basics).
void setup() { pinMode(LED_BUILTIN, OUTPUT);
}
void loop() {
digitalWrite(LED_BUILTIN, HIGH); delay(1000);
digitalWrite(LED_BUILTIN, LOW); delay(1000);
}
The built-in LED will then flash at a rate of 0.5 Hz, as it is turned on for one second and turned off, also for one second.
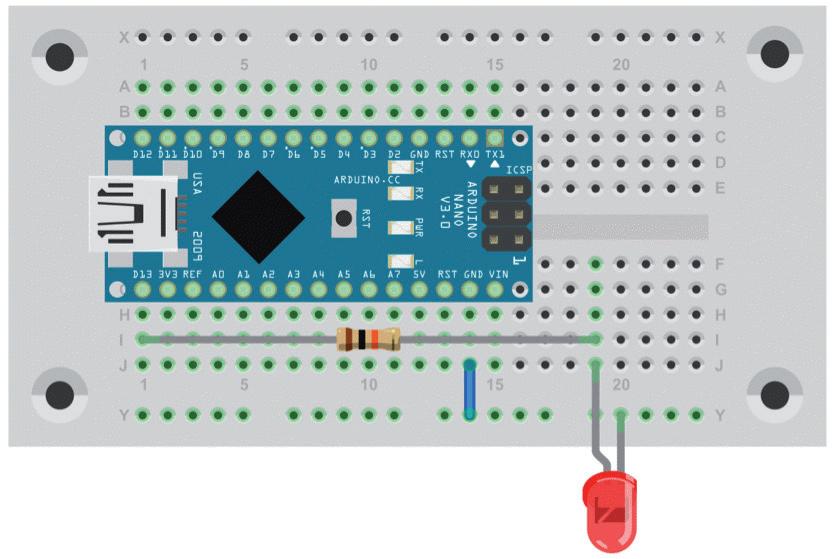
The internal LED is connected to pin D13 through a series resistor. Here you can connect an additional external LED with its own series resistor. With modern, high-efficiency LEDs, a low current far under 1 mA is sufficient. Therefore, a 10 kΩ resistor is suggested here.
Chapter 2 ● Preliminary Tests ● 13
Additional connection of an external LED.
Now you can experiment with the wait times or "delays". Is flashing at 25 Hz still clearly perceptible to the eye? The wait times must be reduced to a total of 40 ms.
void loop() {
digitalWrite(LED_BUILTIN, HIGH); delay(20);
digitalWrite(LED_BUILTIN, LOW); delay(20);
With a further reduction to two times 1 ms, a tone of 500 Hz can already be generated. A piezo loudspeaker is sufficiently high-impedance to be connected directly to the port. You should hear a pure tone. The first impression is therefore that the Arduino is "real-time capable in the millisecond range".

Piezo speaker connection.
A loop without any delays in it gives an even better impression. The decisive question is what speed is achieved then. The test first shows that the LED seems to be permanently lit. And an audible sound is no longer produced.
void loop() {
digitalWrite(LED_BUILTIN, HIGH);
digitalWrite(LED_BUILTIN, LOW);
An examination with an oscilloscope shows that the port is switched on for about 3 µs and remains off for about 3.8 µs. A frequency counter measures 147 kHz, resulting in a period of 6.8 µs.
The Arduino-Inside Measurement Lab ● 14
}
}
Chapter 2 ● Preliminary Tests

Fast square wave signals.
Even closer examination shows that isolated interruptions of a few microseconds occur in the signal. They are probably due to the time measurement in the Arduino. A timer interrupt runs in the background, which periodically interrupts the program flow to measure time. This is important if you want to execute operations at defined times but is rather annoying for time-critical tasks. So the goal must be to disable all interfering background processes. While the Arduino is best suited for simple tasks, the controller used can do much more when it comes to time-critical processes.
Chapter 2 ● Preliminary Tests ● 15

2.2 Analog inputs and outputs
A good starting point for processing analog quantities is the program AnalogInOutSerial from the examples (group 03. Analog). It performs measurements at input A0 and sends the measured values via the serial interface with 9600 baud. In addition, the data is output as a PWM signal via the quasi-analog output at pin 9.
const int analogInPin = A0; const int analogOutPin = 9;
int sensorValue = 0; int outputValue = 0
void setup() { Serial.begin(9600); }
void loop() {
sensorValue = analogRead(analogInPin); outputValue = map(sensorValue, 0, 1023, 0, 255); analogWrite(analogOutPin, outputValue); Serial.print("sensor = "); Serial.print(sensorValue); Serial.print("\t output = "); Serial.println(outputValue);
The Arduino-Inside Measurement Lab ● 16
An interruption in the signal.
delay(2);
For the first tests it is a clever idea to connect an LED to D9. Additionally, you can connect the piezo transducer to get an impression of the PWM signal.
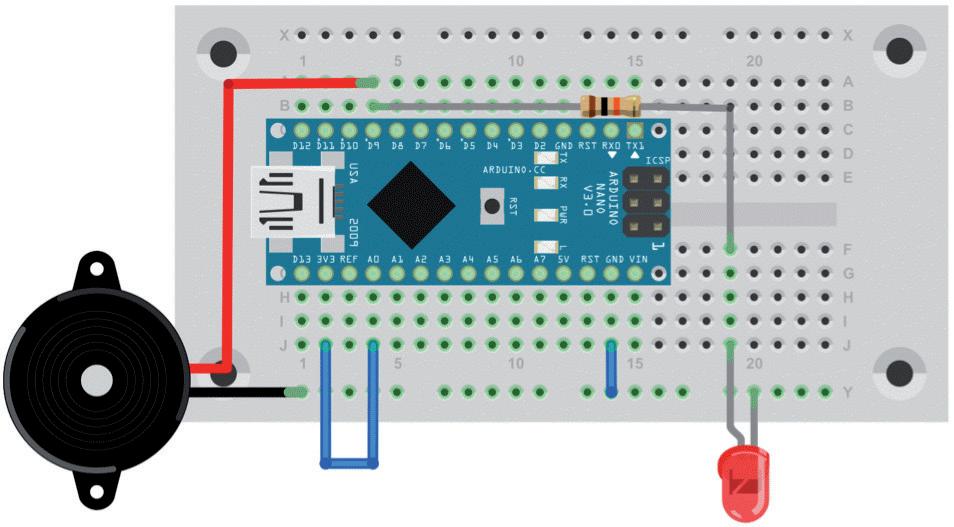
Listening to the PWM signal.
First, the analog input A0 is to be connected to 5 V, i.e. to the highest measurable voltage. The LED is on. With a connection to 3V3 the LED lights up weaker. And if you connect A0 to GND, it is completely off. At 5V and GND the piezo remains silent; at other voltages the PWM signal is heard as a tone.
Because the program sends its data serially to the PC, you can view them with the Serial Monitor. For the highest voltage, i.e., 5 V, you get the measured value 1023, which is the largest possible 10-bit number, because the AD converter in the ATmega has a resolution of 10 bits. This value is converted to 255 for the output, because all PWM outputs in the Arduino are driven at a resolution of 8 bits. The smallest value, 0, is measured when the input is connected to GND.
Chapter 2 ● Preliminary Tests ● 17
}
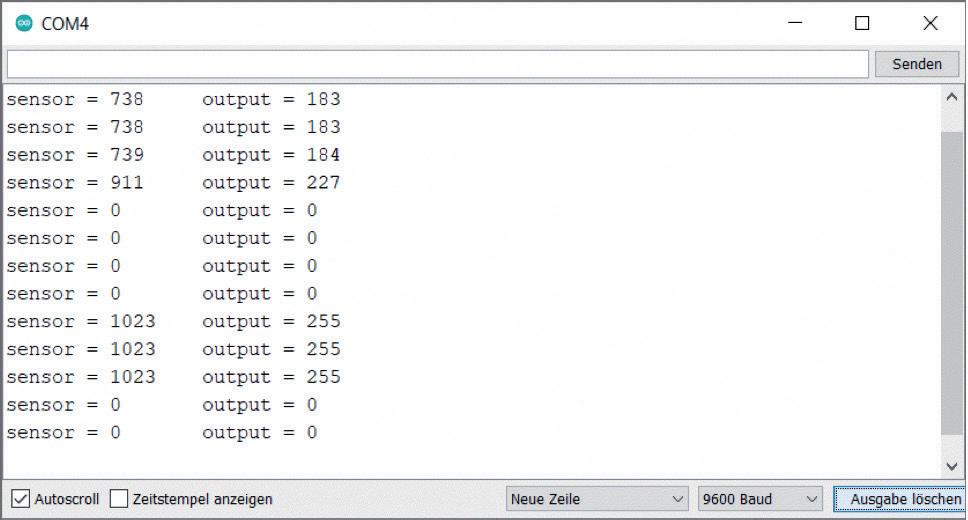
Data viewed in the Serial Monitor.
When measuring the stabilized voltage of 3.3 V, an analog value of 738 is displayed. This can be used to calculate for a reference of 5 V:
738 / 1023 × 5 V = 3.61 V
This measurement error of about 10% originates from the fact that the reference voltage is actually the operating voltage VCC. VCC obviously had an error of about 10% because the Arduino was connected to the USB via a hub. In fact, a voltmeter was used and showed 4.5 V at VCC. But this can be modified: the Arduino can be connected directly to the PC; a 5 V power supply can be connected to the hub or an additional supply of 9 V to 12 V can be connected to Vin so that the built-in 5 V regulator provides an accurate operating voltage. Exceptional care must be taken when connecting a voltage higher than 5 V.
2.3 The Serial Plotter
If you start the Serial Plotter instead of the Serial Monitor, you get a diagram of the measured data. Text and numbers are separated and the numerical values are plotted in assorted colours. The plotter automatically adjusts its y-axis to the occurring numerical values. The x-axis has a width of 500 measuring points.
The Arduino-Inside Measurement Lab ● 18

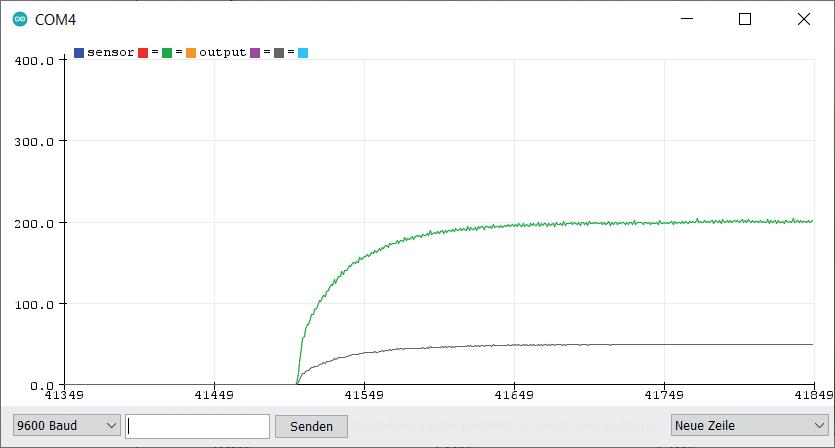
3.3 V fixed-voltage and ripple voltages.
The diagram shows different situations. Initially, A0 was at 3.3 V so the known measured value of 738/739 got plotted. Then the measuring cable was disconnected. The displayed voltage decreased only slowly because the capacitance of the measurement input was still charged to the previously measured voltage. After that, the open input was touched with a finger. You can already recognize the approach of the finger by a rising 50 Hz interference signal. When touched completely, the extreme values 0 and 1023 also appeared. After releasing, the input had a random voltage, which again changed only slowly.
The result looks somewhat different if the input is first connected to GND and then disconnected. The open input then slowly strives towards an average value of 200. The AD input charges up to this value by the measurements. This has to do with the way the AD converter works. A very small capacitor is first connected to the input to take a sample. After that, its charge is measured in several steps, while it itself is partially charged. For a reliable measurement, the connected DUT must not be too high impedance. If you value that an open input shows zero like a usual DVM, you have to add a resistor against GND.
Chapter 2 ● Preliminary Tests ● 19
Voltage at the open input.
The sketch was reduced to the absolute minimum in the interest of higher speed. In addition, the highest standard baud rate was set to 115200 bits per second.
void setup() {
Serial.begin(115200);
void loop() {
Serial.println(analogRead(A0));
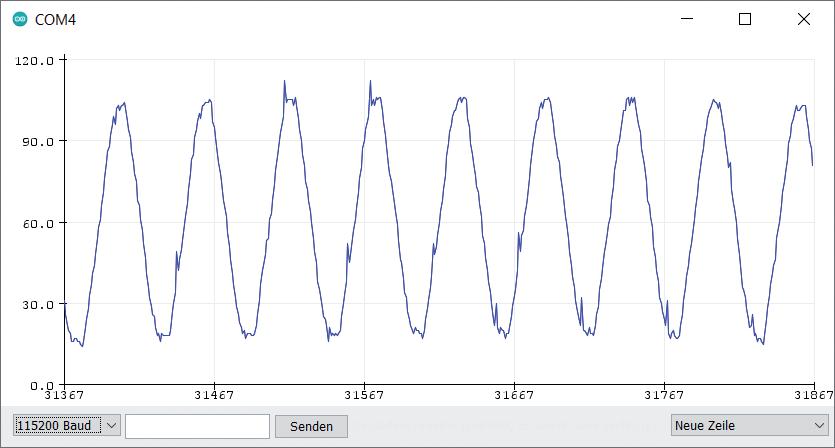
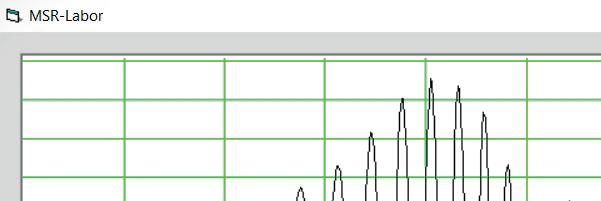
Fast measurement of a 50 Hz signal.
The signal source was a simple piece of cable on the table that picked up 50 Hz noise. The distortions and deviations from the pure sinusoidal form originate from electrical loads which impulse the network. We can now see about nine full periods of 20 ms each, which adds up to 180 ms for a total of 500 measurement points. This results in a time interval of the measurements of 360 µs, i.e. a sampling rate of 2.8 kHz.
A further increase in transmission speed to 1 Mbaud only produced a slight improvement.
void setup() {
Serial.begin(1000000);
void loop() {
Serial.println(analogRead(A0));
The Arduino-Inside Measurement Lab ● 20
}
}
}
}

Measurement at 1 Mbaud.
Now five periods are imaged at 20 ms each. This results in an effective sampling rate of 5 kHz, so that the mapped period is 100 ms. For comparison: In the end, up to 62.5 kHz is achieved with the same hardware and pure C programming.
2.4 PWM Signal Generator
Here, signals are to be generated at the same time as the measurement, which are then measured again themselves. For this purpose, a PWM signal with a pulse ratio of 100/255 is generated at pin 9. Additionally analog input A0 must be connected with the PWM output D9.
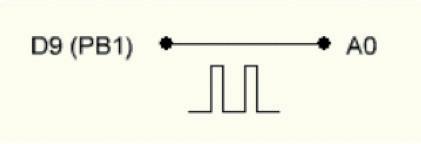
void setup() { Serial.begin(1000000); analogWrite(9, 100);
}
void loop() { Serial.println(analogRead(A0)); }
Chapter 2 ● Preliminary Tests ● 21
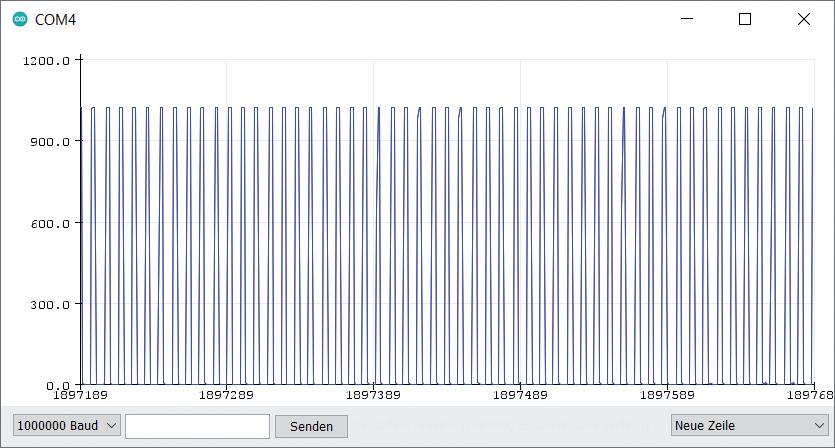
The measured PWM signal.
The measurement clearly shows that the generated square wave signal has a pulse width of less than 50%. The time resolution is not sufficient for even more precise statements. However, the frequency can be determined. 53 pulses can be recognized. With a measuring time of 100 ms, this equals a frequency of 530 Hz. Using an external frequency meter, 490 Hz was measured.
Using a fast oscilloscope, the measurement clearly shows the pulse ratio. The signal has a period of 2 ms, which confirms the frequency of 500 Hz. The PWM signal does not show any interruptions or phase jitter because it is generated solely by the timer hardware in the ATmega and thus is not influenced by the program flow.
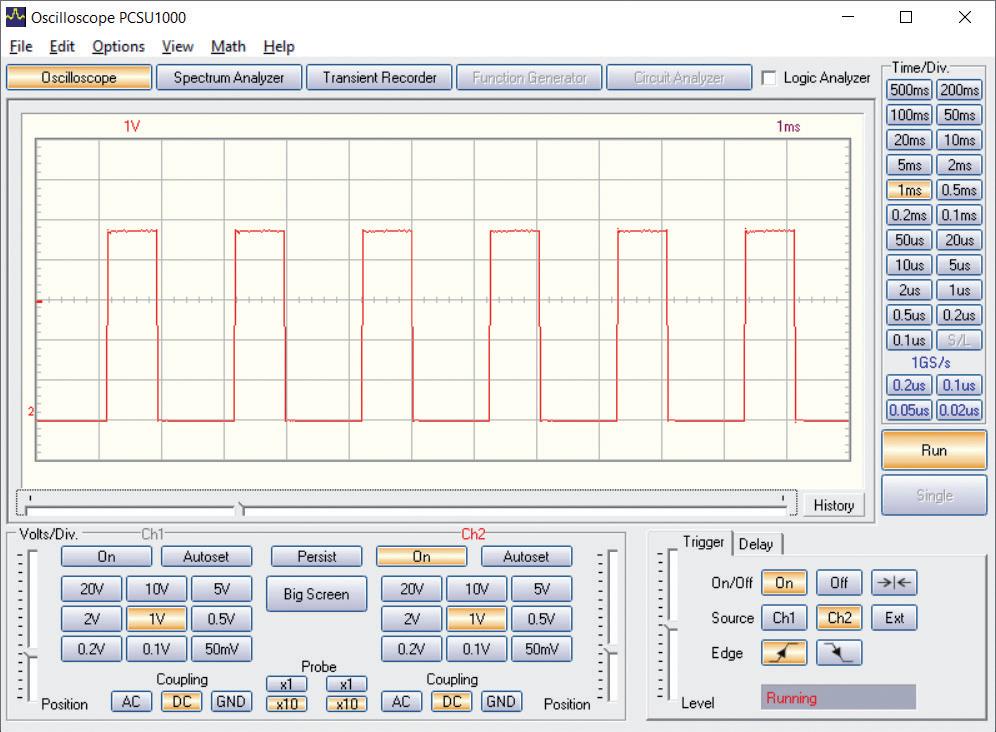
The Arduino-Inside Measurement Lab ● 22
The PWM signal at high resolution.
The PWM frequency of approx. 500 Hz is sufficient to control the brightness of LEDs, but it is too low for many other tasks. For comparison: in the end, the Arduino-Inside Measurement Lab works with a PWM frequency of 62.5 kHz, which is more than a hundred times higher.
2.5 A Sawtooth Generator
Despite the low PWM frequency, the basic principle of digital signal generation can already be tested: you output new voltage values of the desired waveform in regular intervals. The PWM output serves here as a simple DA converter and in addition needs an RC element as a low pass filter.
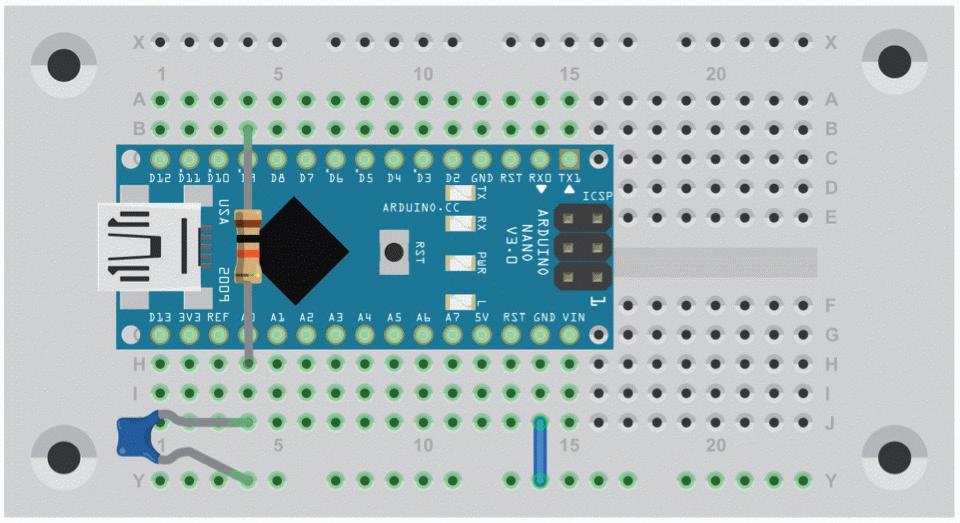
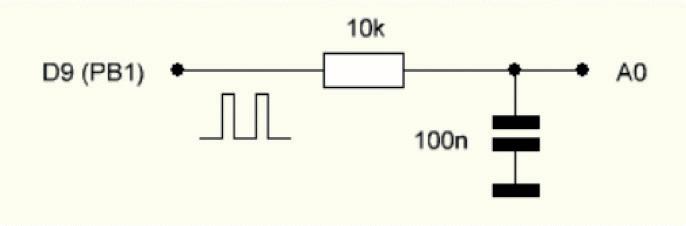
Smoothing of the PWM signal.
Here, 10 kΩ and 100 nF were used, which means a cutoff frequency of 160 Hz, which is below the PWM frequency.
First, a sawtooth signal is to be generated. The output value is increased continuously until there is an overflow from 255 to 0. The calculation and the output must be included in the measurement loop.
unsigned char out; void setup() { Serial.begin(1000000); } void loop() { Serial.println(analogRead(A0)); out++; analogWrite(9, out); }
Chapter 2 ● Preliminary Tests ● 23
The Arduino-Inside Measurement Lab
An 8-in-1 test & measurement instrument for the electronics workbench
A well-equipped electronics lab is crammed with power supplies, measuring devices, test equipment and signal generators. Wouldn‘t it be better to have one compact device for almost all tasks?
Based on the Arduino, a PC interface is to be developed that’s as versatile as possible for measurement and control. It simply hangs on a USB cable and — depending on the software — forms the measuring head of a digital voltmeter or PC oscilloscope, a signal generator, an adjustable voltage source, a frequency counter, an ohmmeter, a capacitance meter, a characteristic curve recorder, and much more.
The circuits and methods collected here are not only relevant for exactly these tasks in the “MSR” electronics lab, but many details can also be used within completely di erent contexts.
Burkhard Kainka (1953) — ham radio operator with the callsign DK7JD, worked for many years as a physics teacher. Since 1996 he is an independent developer and author in the fields of electronics and microcontrollers. Burkhard runs the websites www.elektronik-labor. de and www.b-kainka.de, with his contributions to the Hobby Corner and a general fondness for the basics of electronics.
Elektor International Media www.elektor.com
booksbooks