RURAL PROPERTY UPDATE
July - September 2022

Q3 EDITION

Elders Rural Property Update - Q3 -2022 (July - September ) 2

3 Contents About the Research 4 Foreword 5 Executive Summary 6 Key Drivers 7 Results snapshot 10 Australia 13 Queensland 15 New South Wales 17 Victoria 19 Tasmania 21 South Australia 23 Western Australia 25 Northern Territory 27 For more information 31
About the Research
Elders uses a range of analytical techniques to achieve robust and repeatable analysis. Our dataset is subject to the following criteria:
⋅ Only transactions above 40 hectares (ha) are included, except for Tasmania where transactions above 30ha are included.
⋅ Transactions which list a primary purpose that isn’t classed as rural are excluded. Local government areas (LGAs) which fall within a metropolitan area are excluded from the analysis.
Vast pastoral areas of Australia without sufficient transaction volume are excluded from the analysis.
Outliers by price per hectare are excluded. This involves visual and statistical assessment of all $/ha values for a region, and this is performed every quarter.
Several data fields are available in the Elders dataset, including median price per hectare, transaction volume, value, area, date of sale and land use. The quarterly update focuses on median price per hectare growth and transaction volume expressed both as a total and split by land size.
This data is not intended to be a valuation of any one property and is merely a method of tracking growth over time for a given dataset.
Definitions within the update include:
CAGR – refers to the compound average growth rate for a given period.
QoQ – quarter on quarter growth
YoY – year on year growth
1yr rolling performance – the median price per hectare for one year from the latest data point. For example, the 1yr rolling median $/ha for Q3-2022 runs from 01/10/2021 to 30/09/2022; the next quarter will roll to the 01/01/2021 to 31/12/2022. The dataset changes by one quarter at a time which helps smooth out volatility and give an indication of long-term trends.
Elders Rural Property Update - Q3 -2022 (July - September) 4
Elders rural property update draws on transactional data from every rural land sale in Australia. This data is supplied by Corelogic and analysed by Elders. Every effort is made to clean the data in order to provide an accurate account of price and volume movements.
from
on
The information contained in this article is only general and while we have provided this information in good faith and based on what we believe are accurate sources, the information may not be complete or accurate for your purposes. The information provided does not take into account everyone’s individual situation. General information should not be relied on instead of professional advice specifically directed to you and your circumstances. We are not responsible for any actions taken as a result of you relying on or in any way using information contained in this article and will not be liable for any damages resulting
your reliance
or use of this information.
Foreword
Australian farmland values have experienced significant appreciation over the last 3 - 4 years supported by an improvement in seasonal and trading conditions and low interest rates.
The Q3-2022 edition of Elders Rural Property Update shows that Australian agricultural land remains in high demand. This edition shows continued low sales volumes and strong year-onyear price appreciation despite a slight quarterly decline.
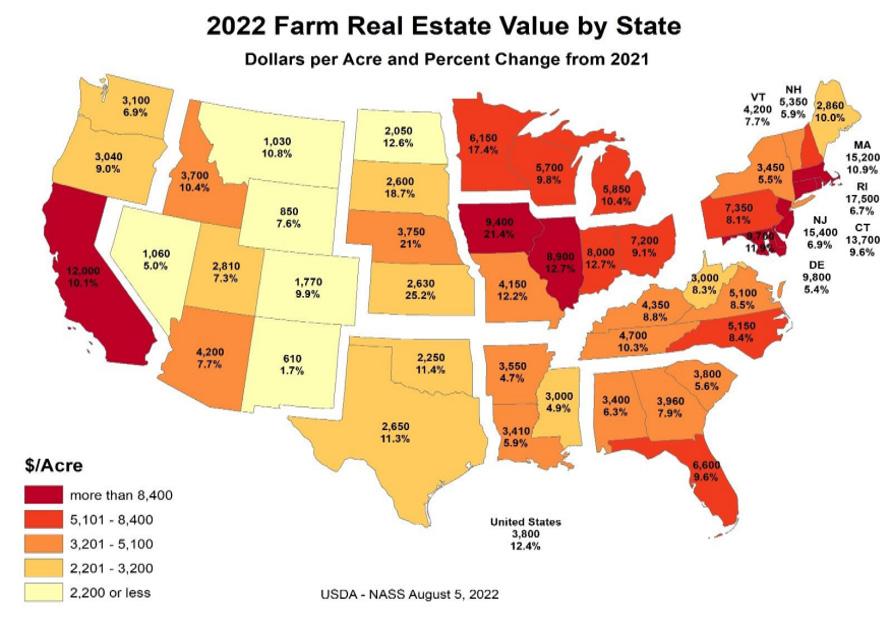
The US agricultural sector has also been experiencing strong growth over the same period. Up to August 2022, US farmland appreciated 12.4 per cent compared to 14.6 per cent for the same period in Australia. Since 2020 US farmland has increased by 20 percent similar to Australian farmland at 35.4 per cent.
Like Australia, there were some outstanding regional rates of appreciation contributing to the US national result.
The farmland performance in the US is attributed to strong trading conditions, like those experienced by Australian farmers (for a good summary see Farmer MAC, The Feed Winter 2022 – 23). It’s forecast that US farm cash incomes in 2022 will be the highest since the mid 1970’s and will be the sixth consecutive year of growth.
There are several reasons why trends in US farmland values are important for Australian farms. One of the most important is that Australian agriculture competes for capital. If Australian farmland values fall behind US growth rates, investment will flow out of Australia to the US and vice versa. Whilst Australian farmers remain the dominant owners of Australian agricultural land, foreign capital makes up approximately 14 per cent of the market and is a competitor in many transactions, particularly larger ones.
Ultimately, strength in Australian farmland values relative to those in our trading competitors means our sector is performing well and our exports are in demand.
As always, the Elders Rural Property Update provides important market information and is supported by our network of local sales experts who are equipped to apply the findings of this report to your local area.
Mark Barber General Manager Farmland Agency and Agribusiness Investments
Foreword 5
Executive Summary
Elders Rural Property Update shows a slight decrease in median price per hectare at national level in Q3-2022, driven by a decline in transaction volume in New South Wales and Victoria which represent higher priced parcels of land.
Nationally, median price per hectare decreased by 0.6 per cent (pc) in Q3-2022, taking the quarterly median price to $8,109 per hectare (ha). In contrast to Q2-2022, transaction mix shifted away from higher priced states, particularly New South Wales. However, a similar mix of properties sold in terms of size, favouring smaller parcels in grazing and livestock regions due to the seasonal nature of the market. National transaction volume declined by 13.5pc, totalling 1,357.
At state level, Victoria recorded the highest growth in median price per hectare in Q3-2022, up 33.3pc to $15,159/ha, primarily driven by a shift in transaction mix favouring high priced parcels in Gippsland and the South-Central regions. Tasmania recorded the second largest increase, up 16.5pc in Q3-2022 to $11,573/ha.
In contrast, median price per hectare declined in Queensland, down 10.1pc to $6,500/ha, driven by an increase in transactions in the lower priced regions of Central and West Queensland.
Transaction volume was mixed across states, declining by 39.4pc in South Australia and 22.4pc in New South Wales. In contrast, volume increased by 69.2pc in the Northern Territory and 28.6pc in Tasmania.
The national one year rolling median price per hectare increased by 3.8pc in Q3-2022 to $7,737/ ha, continuing an upward trend in underlying value. The one year rolling median price per hectare increased across five of the seven states and territories analysed, ranging from a 17.8pc increase in South Australia to a 3.5pc increase in New South Wales.
In contrast, the one year rolling median price per hectare decreased in Western Australia, down 6pc to $6,705/ha, driven by a greater percentage of comparatively lower priced cropping properties transacting in the past year. Tasmania recorded a small decline of 0.2pc, driven by transaction mix favouring the lower priced South region.
The value of rural property traded totalled $2.6 billion in Q3-2022, down 10.7pc compared to Q2-2022, this was a function of significant declines in transaction volume especially for larger land holdings.
We expect tight supply in late 2022 will keep property values high into 2023, however, commodity prices have softened, and interest rates will continue to rise which may prompt an increase in listings early in 2023. We expect any increase in listings to be met with strong buyer demand after a long period of tight supply throughout 2022.
Elders Rural Property Update aggregates transaction data from 39 regions across Australia. To get in touch please refer to the ‘For More Information’ page at the end of this update.
Elders Rural Property Update - Q3 -2022 (July - September) 6
Key Drivers
Buyside drivers are not as favourable as previous quarters due to interest rate rises and a decline in select commodity prices particularly for livestock. However, these buyside factors are yet to turn into reasons to sell and supply remains tight, driven by overall favourable seasonal conditions and production volumes remaining high.
⋅ Australian grain prices remain buoyant compared to last season; barley (+15pc YoY), wheat (+13pc YoY) and canola (+8pc YoY). In contrast, beef, lamb and wool prices are softer; beef (-19pc), trade lamb (-16pc YoY) and the eastern wool indicator (-11pc).
⋅ Business interest rates continue an upward cycle, medium business rates increased 0.3pc during Q3-2022 taking the average rate to 4.9pc which is 89.2pc higher than the lowest rate in March 2022. Large business rates increased by 0.3pc in Q3-2022 taking the average rate to 4.1pc, 175.3pc higher than the lowest rate in December 2021.
⋅ Debt to Agriculture, Forestry and Fishing increased by 4.5pc in Q3-2022 to $105.8 billion. The monthly increase in debt balances has grown at a slower rate compared to the same period in 2021, highlighting both a reduction in transactions and an element of paying down debt.
⋅ The National Farm Management Deposit (FMD) balance has declined by 12.6pc since the high point in June to $5.9b. However, the decline was smaller than the same period in 2021 where the balance fell 14.5pc.
The likely outcome from the above drivers is that rural property prices will continue to grow into 2023 while supply remains tight and profitability holds, driven by increased production. However, this will be dependent on the perception of where commodity prices will go in 2023, knowing that interest rates will continue to rise, and the season may not be as favourable from a rainfall perspective.

The gap between commodity prices and rural property prices closed again in Q3-2022, driven by softer commodity prices. If the current softening trend in commodity prices continues there could be more emphasis on listing properties while they have good soil moisture rather than farming them because future profitability may not be at the level of the past few years.
If there is a sustained increase in listings throughout 2023 it could slow the rate of appreciation in property values as more supply enters the market. However, demand remains high after a long period of low supply and strong profitability on farm, which will likely result in further appreciation for rural property values in the first half of 2023.
50 60 70 80 90 100 110 120 130 140 150 2020-21 = 100 National median $/ha and rural commodity prices indexed Rural commodity prices National Median $/ha Q2-2022 Q4-2021 Q3-2021 Q2-2021 Q1-2021 Q4-2020 Q3-2020 Q2-2020 Q1-2020 Q4-2019 Q3-2019 Q2-2019 Q1-2019 Q4-2018 Q3-2018 Q2-2018 Q1-2018 Q4-2017 Q3-2017 Q2-2017 Outstanding business rates Q1-2022 Q3-2022 1.0 1.5 2.0 2.5 3.0 3.5 4.0 4.5 5.0 5.5 Large business Medium business 31/10/2022 30/09/2022 31/08/2022 31/7/2022 30/6/2022 31/5/2022
Data: RBA
The value of rural property traded totalled $2.6 billion in Q3-2022, down 10.7pc compared to Q2-2022, this was a function of signi cant declines in transaction volume especially for larger land holdings.
Executive Summary, page 6
LARGEST PERCENTAGE INCREASE
MOST VALUABLE $12,672
LARGEST PERCENTAGE DECREASE
Elders Rural Property Update - Q3 -2022 (July - September ) 10
July
Median price per hectare performance Q3 - 2022 -50 -25 0 25 50 75 100 QLD NSW VIC TAS SA WA NT* -10.1% $6,500/ha -0.2% $8,082/ha 33.3% $15,159/ha 16.5% $11,573/ha 7.0% $6,880/ha -8.4% $7,474 /ha -2.7% $1,809/ha National -0.6% $8,109/ha * Northern Territory results are highly variable due to low transaction volume
median price per hectare (Q4-21 to Q3-22) Median $/ha % change QLD $6,624 7.2% NSW $7,866 3.5% VIC $12,672 9.0% TAS $11,573 -0.2% SA $5,978 17.8% WA $6,705 -6.0% NT $2,157 4.6% AUS $7,737 3.8%
Results snapshot Q3
- September 2022
1yr rolling performance
17.8 % South Australia
Victoria
-6.0 % Western Australia
Results Snapshot 11
Q3 July - September 2022 Transaction volume performance Q3 - 2022 -110 -75 -40 -5 30 65 100 QLD NSW VIC TAS SA WA NT* 7.7% 335 -22.4% 552 -39.4% 117 +0.0% 145 69.2% 22 -9.1% 159 28.6% 27 National -13.5% 1,357
PERCENTAGE INCREASE compared to Q2 2022 69.2% Northern Territory
TRANSACTIONS 552 New South Wales TRANSACTIONS made nationwide from Q4-21 to Q3-22 6651 Nationwide 1yr rolling performance transaction volume (Q4-21 to Q3-22) Transactions % change QLD 1,487 -5.2% NSW 2,754 -16.6% VIC 823 -17.1% TAS 137 24.5% SA 708 -5.2% WA 718 -6.5% NT 64 23.1% AUS 6,651 -11.8%
Results snapshot
LARGEST
MOST
“We expect to see land values supported into 2023 in WA and SA on the back of strong harvest results. There is potential for some sales held over in flood affected areas on the east coast to come onto the market but this is unlikely to see a material shift in rebalancing supply and demand.”
 Mark Barber
Elders GM Farmland Agency & Agribusiness Investments, Australia.
Mark Barber
Elders GM Farmland Agency & Agribusiness Investments, Australia.
Australia
Historic performance
Quarterly Review
National median price per hectare decreased by 0.6pc, driven by declines in Queensland and Western Australia.
Transaction volume declined sharply down by 13.5pc, primarily due to fewer sales in New South Wales, South Australia and Victoria.
In contrast, the 1yr rolling median price per hectare increased by 3.8pc in Q3 to $7,737/ha, the thirteenth consecutive quarter of growth. Rolling transaction volume declined for a fifth consecutive quarter, down by -11.8pc to 6,651.
Australia Review 13
“Australian land values remained strong in Q3 maintaining most of the gains made in recent months, while low transaction volumes continued.”
Mark Barber
Elders GM Farmland Agency & Agribusiness Investments, Australia.
QoQ YoY (Q3-2022 vs. Q3-2021) Median $/ha: $8,109 -0.6% +13.6% Transactions: 1,357 -13.5% -39.6% Value traded: $2.6b -10.7% -22.5%
Median $/ha distribution by state Transaction distribution by state QLD NSW VIC TAS SA WA NT Q2-2022 Q3-2022 Quarterly Comparison (%) Transaction volume Median $/ha 1 Year Rolling Performance (Australia) -40 -20 0 20 40 Rolling volume Rolling median $/ha QLD NSW VIC TAS SA WA NT Q2-2019 Q3-2019 Q4-2019 Q1-2020 Q2-2020 Q3-2020 Q4-2020 Q1-2021 Q2-2021 Q3-2021 Q4-2021 Q1-2022 Q2-2022 Q3-2022 9.8% 5 yr ca g r Q3-2022 Q2-2022 Q1-2022 Q4-2021 Q3-2021 Q2-2021 50 80 110 140 170 200 Q1-2019 = 100
“Some potential investors have dropped out of the buying equation due to interest rate rises and some softening in cattle prices. That said, there is a distinct lack of listings across all property types and given the number of pre-approved buyers taking a long-term view on farmland assets and the fundamentals for Australian agriculture remaining strong, values and demand are likely to sustain.”
 Rob Anderson, State Real Estate Manager, QLD/NT
Elders Rural Property Update - Q3 -2022 (July - September ) 14
Queensland
Quarterly Review
Median price per hectare decreased by 10.1pc in Q3. Every region recorded a modest decline; however, transaction mix was the key driver, favouring lower priced regions.
Transaction volume increased in Q3, particularly in the lower priced Central and West regions. This shifted transaction mix away from the high-priced South region.
The 1yr rolling median price per hectare increased by 7.2pc in Q3 to $6,624/ha, the eleventh consecutive quarter of growth. Rolling transaction volume declined by 5.2pc to 1,487.
QoQ
(Q3-2022 vs. Q3-2021)
Historic performance
Queensland Review 15
“We have continued to see strong interest in rural property, with grazing and cropping properties particularly sought after. Record prices have been achieved in the last quarter of 2022 which is a testament to the confidence in the longterm outlook.”
Rob Anderson State Real Estate Manager, QLD/NT
YoY
Median $/ha: $6,500 -10.1% +40.3% Transactions: 335 +7.7% -19.7% Value traded: $663.8m +4.8% -15.4%
Transaction distribution by region Q2-2022 Q3-2022 Quarterly Comparison (%) Transaction volume Median $/ha -40 -20 0 20 40 Central North West South Q3-2022 Q2-2022 Q1-2022 Q4-2021 Q3-2021 Q2-2021 North West South 1 Year Rolling Performance (Queensland) Rolling volume Rolling median $/ha Q2-2019 Q3-2019 Q4-2019 Q1-2020 Q2-2020 Q3-2020 Q4-2020 Q1-2021 Q2-2021 Q3-2021 Q4-2021 Q1-2022 Q2-2022 Q3-2022 50 80 110 140 170 200 Q1-2019 = 100 9.8% 5 yr ca g r
Median $/ha distribution by region
“November and December delivered much less rainfall than previous months to the point where many regions began to display dryer conditions.
“The new year has opened with similar sentiment where last year left off, inquiry outstripping supply.
“Early Autumn we expect a number of delayed campaigns and new to market listings to become available, offering both strong sales results and sound investment opportunities.”
 Richard Gemmell, State Real Estate Manager, NSW
Elders Rural Property Update - Q3 -2022 (July - September ) 16
New South Wales
Historic performance
Quarterly Review
Median price per hectare eased 0.2pc in Q3, driven by declines in the Central Tablelands and Hunter regions.
Transaction volume dipped sharply, decreasing by 22.4pc, primarily due to disruptions from wet weather in the Riverina Murray region limiting listings.
The 1yr rolling median price per hectare increased by 3.5pc in Q3 to $7,866/ha, the eighth consecutive quarter of growth. Rolling transaction volume decreased by 16.6pc to 2,754, continuing the downward trend.
New South Wales Review 17
“Flood waters continued to move downstream through river systems creating havoc for many communities and farmland. Buyer interest remained in positive territory with several strong sales occurring leading into Christmas.”
Richard Gemmell State Real Estate Manager, NSW
QoQ YoY (Q3-2022 vs. Q3-2021) Median $/ha: $8,082 -0.2% +10.8% Transactions: 552 -22.4% -49.8% Value traded: $1.02b -28.1% -38.2%
Median $/ha distribution by region Transaction distribution by region Q2-2022 Q3-2022 Quarterly Comparison (%) -40 -20 0 20 40 Central Tablelands Hunter Northern Tablelands Central West North Coast North West Riverina Murray South East Western Central Tablelands Hunter Northern Tablelands Central West North Coast North West Riverina Murray South East Western Transaction volume Median $/ha 1 Year Rolling Performance (New South Wales) Rolling volume Rolling median $/ha Q2-2019 Q3-2019 Q4-2019 Q1-2020 Q2-2020 Q3-2020 Q4-2020 Q1-2021 Q2-2021 Q3-2021 Q4-2021 Q1-2022 Q2-2022 Q3-2022 50 80 110 140 170 200 Q1-2019 = 100 10.5% 5 yr ca g r Q3-2022 Q2-2022 Q1-2022 Q4-2021 Q3-2021 Q2-2021
“The 2023 selling season has commenced well with a healthy volume of assets due to present to market in the coming weeks, which we anticipate will be met with vigorous demand.
“This ongoing confidence demonstrates that investors are continuing to support a positive longterm outlook for the industry. “
 Nick Myer, State Real Estate Manager Victoria/Riverina and Tasmania
Victoria
Historic performance
Quarterly Review
Median price per hectare increased by 33.3pc in Q3, driven by strong growth in Gippsland, South Central and the Wimmera Mallee.
Transaction volume declined by 9.1pc in Q3, shifting the transaction mix in favour of smaller parcels of land located in high value grazing regions such as Gippsland and South Central.
The 1yr rolling median price per hectare increased by 9pc in Q3 to $12,672/ha, the seventh consecutive quarter of growth. Rolling transaction volume tightened further, down by 17.1pc to 823.
Victoria Review 19
“The Victoria and Riverina regions have experienced record prices across most sectors in the second half of 2022, despite forecasted economic headwinds. Supply was met with strong demand in most regions with buyer confidence being ultimately underpinned by strong commodity prices and historically low interest rates.”
Nick Myer State Real Estate Manager Victoria/Riverina and Tasmania
YoY (Q3-2022 vs. Q3-2021) Median $/ha: $15,159 +33.3% +53.4% Transactions: 159 -9.1% -51.7% Value traded: $248.2m +10.4% -39%
QoQ
Median $/ha distribution by region Transaction distribution by region Q2-2022 Q3-2022 Quarterly Comparison (%) -40 -20 0 20 40 Central South Central Gippsland North East South West Wimmera-Mallee South Central Gippsland North East South West Wimmera-Mallee Transaction volume Median $/ha 1 Year Rolling Performance (Victoria) Rolling volume Rolling median $/ha Q2-2019 Q3-2019 Q4-2019 Q1-2020 Q2-2020 Q3-2020 Q4-2020 Q1-2021 Q2-2021 Q3-2021 Q4-2021 Q1-2022 Q2-2022 Q3-2022 50 80 110 140 170 200 Q1-2019 = 100 12.2% 5 yr ca g r Q3-2022 Q2-2022 Q1-2022 Q4-2021 Q3-2021 Q2-2021 Central
“The 2023 selling season has commenced well with a healthy volume of assets due to present to market in the coming weeks, which we anticipate will be met with vigorous demand.
“This ongoing confidence demonstrates that investors are continuing to support a positive longterm outlook for the industry.”
Nick Myer, State Real Estate Manager Victoria/Riverina and Tasmania
Tasmania
Historic performance
Quarterly Review
Median price per hectare increased by 16.5pc in Q3, driven by strong growth in the North West and South regions.
Transaction volume increased in all three regions of the state, marking the first quarterly increase in volume since Q2-2021.
The 1yr rolling median price per hectare decreased by 0.2pc in Q3 to $11,573/ha. Rolling transaction volume increased by 24.5pc to 137, ending a long period of decline.
Tasmania Review 21
QoQ YoY (Q3-2022 vs. Q3-2021) Median $/ha: $11,573 +16.5% +2.7% Transactions: 27 +28.6% -32.5% Value traded: $27.2m -8.9% -59.7%
$/ha distribution
Transaction distribution by region Q2-2022 Q3 -2022 Quarterly Comparison (%) Transaction volume Median $/ha -60 -40 -20 0 20 40 60 Islands North West Northern South Islands North West Northern South 1 Year Rolling Performance (Tasmania) Rolling volume Rolling median $/ha Q2-2019 Q3-2019 Q4-2019 Q1-2020 Q2-2020 Q3-2020 Q4-2020 Q1-2021 Q2-2021 Q3-2021 Q4-2021 Q1-2022 Q2-2022 Q3-2022 0 40 80 120 160 200 Q1-2019 = 100 6.8% 5 yr ca g r Q3-2022 Q2-2022 Q1-2022 Q4-2021 Q3-2021 Q2-2021
Median
by region
“The Tasmanian market continued to perform strongly in the second half of 2022, with all asset classes achieving record or near record results throughout most sectors.”
Nick Myer State Real Estate Manager Victoria/Riverina and Tasmania
Elders Rural Property Update - Q3 -2022 (July - September ) 22
“Interestingly, traditionally cheaper land in more marginal rainfall areas is receiving inquiry from a wider geographical range of buyers than normal, resulting in additional demand and in some places a sharp increase in price. Whilst the RBA’s strategy to influence rising inflation with monthly interest rate rises has had an impact on residential housing demand and pricing across the nation – the cooling effect of this strategy is not as evident on farmland at this stage.”
Phil Keen, State Real Estate Manager, South Australia
South Australia
Historic performance
Median
Quarterly Review
Median price per hectare increased by 7pc in Q3 due strong growth in the Eyre Peninsula and North regions.
Transaction volume declined sharply, driven primarily by fewer sales in the Yorke Peninsula and South East regions.
The 1yr rolling median price per hectare increased by 17.8pc in Q3 to $5,978/ha, the fifth consecutive quarter of growth. Rolling transaction volume decreased by 5.2pc to 708, the largest decline since Q2-2019.
QoQ YoY
South Australia Review 23
“South Australian rural land continues to receive strong and sustained demand particularly for grain and livestock production areas. Record, or near record, prices are continuing, this is evident in all classes of land.”
Phil Keen State Real Estate Manager South Australia.
(Q3-2022 vs. Q3-2021) Median $/ha: $6,880 +7% +55.2% Transactions: 117 -39.4% -25% Value traded: $188.2m -44.6% -14.4%
$/ha distribution by region Transaction distribution by region Q2-2022 Q3-2022 Quarterly Comparison (%) Transaction volume Median $/ha -40 -20 0 20 40 60 80 Adelaide and Fleurieu Pastoral Eyre Peninsula Mallee Riverland South East Yorke North Adelaide and Fleurieu Pastoral Eyre Peninsula Mallee Riverland South East Yorke 20 North Q3-2022 Q2-2022 Q1-2022 Q4-2021 Q3-2021 Q2-2021 1 Year Rolling Performance (South Australia) Rolling volume Rolling median $/ha Q2-2019 Q3-2019 Q4-2019 Q1-2020 Q2-2020 Q3-2020 Q4-2020 Q1-2021 Q2-2021 Q3-2021 Q4-2021 Q1-2022 Q2-2022 Q3-2022 50 70 90 110 130 150 Q1-2019 = 100 10.4% 5 yr ca g r
“Growers, investors and corporate groups all remain active in the market and enquiry for all rural property types remains strong.
“The WA grain harvest is drawing to a close and yields have been “best on record” for many regions which is further fuelling demand for broadacre farmland.
“Increased price volatility in the livestock markets through 2022 does not appear to have dampened demand for land in higher rainfall grazing areas, with increased competition from the forestry sector seeing prices continuing to increase in these zones.
“The increased cost of production continues to receive attention from farmers and their trusted advisors with the push for further production efficiencies continuing in earnest.”
Simon Cheetham, Senior Rural Real Estate Executive Western Australia
Western Australia
Simon Cheetham Senior Rural Real Estate Sales Executive Western Australia
Quarterly Review
Median price per hectare decreased by 8.4pc in Q3 after a 42.6pc jump in Q2. The decline was driven by a higher proportion of larger parcels which characteristically sell for a lower price per hectare. However, strong growth in price was observed for larger parcels when viewed in isolation.
Transaction volume remained unchanged, however there more sales in the Avon-Midland, Northern and South West regions compared to Q2.
The 1yr rolling median price per hectare decreased by 6pc in Q3 to $6,705/ha, ending a long upward trend. Rolling transaction volume decreased by 6.5pc to 718, further tightening supply.
QoQ
YoY (Q3-2022 vs. Q3-2021)
Median $/ha: $7,474 -8.4% -13.9%
145 +0%
Historic performance
Western Australia Review 25 Median $/ha distribution by region Q2-2022 Q3-2022 Transaction distribution by region Quarterly Comparison (%) Transaction volume Median $/ha -40 -20 0 20 40 60 Avon-Midland Northern Central Eastern South Coast South West Great Southern Avon-Midland Northern Central Eastern South Coast South West Great Southern Q3-2022 Q2-2022 Q1-2022 Q4-2021 Q3-2021 Q2-2021
Year Rolling Performance
Rolling volume Rolling median $/ha Q2-2019 Q3-2019 Q4-2019 Q1-2020 Q2-2020 Q3-2020 Q4-2020 Q1-2021 Q2-2021 Q3-2021 Q4-2021 Q1-2022 Q2-2022 Q3-2022 50 90 130 170 210 250 Q1-2019 = 100 16.7 % 5 yr ca g r
1
(Western Australia)
“Supply of broadacre properties has been tight with very limited land availability in many key regions. Growers, investors and corporate groups all remain active in the market and enquiry for all rural property types remains strong.”
Transactions:
-25.6% Value traded: $319.2m +45.9% +24.1%
Northern Territory
Historic performance
Quarterly Review
We acknowledge the limited transaction volume in the NT increases short term volatility; quarterly data should be viewed with caution.
Median price per hectare eased slightly in Q3 driven by an increase in sales in the lower priced Outback region.
The 1yr rolling median price per hectare increased by 4.6pc in Q3 to $2,157/ha, the third consecutive quarter of growth. Rolling transaction volume increased by 23.1pc to 64.
Northern Territory Review 27
“Good wet season rainfall across most of the NT has been welcomed by most pastoralists. In other segments of the market, cotton gin construction is progressing and there is still interest from established growers. However, land tenure, clearing guidelines and water policies have restricted development somewhat.”
Alison Ross
Rural Real Estate Specialist Northern Territory
QoQ YoY (Q3-2022 vs. Q3-2021) Median $/ha: $1,809 -2.7% +98.6% Transactions: 22 +69.2% +120% Value traded: $175.6m +86.8% +753.1%
Quarterly Comparison (%) Transaction volume Median $/ha -85 -20 45 110 175 240 Q3-2022 Q2-2022 Q1-2022 Q4-2021 Q3-2021 Q2-2021 1 Year Rolling Performance (Northern Territory) Rolling volume Rolling median $/ha Q1-2019 Q2-2019 Q3-2019 Q4-2019 Q1-2020 Q2-2020 Q3-2020 Q4-2020 Q1-2021 Q2-2021 Q3-2021 Q4-2021 Q1-2022 Q2-2022 80 134 188 242 296 350 Q1-2019 = 100 9.9% 5 yr ca g r
We expect tight supply in late 2022 will keep property values high into 2023, however, commodity prices have so ened, and interest rates will continue to rise which may prompt an increase in listings early in 2023. We expect any increase in listings to be met with strong buyer demand a er a long period of tight supply throughout 2022.
Executive Summary, page 6
For more information
The analysis above is replicated across 39 regions Australia wide, and is summarised by local government area. Elders clients enjoy exclusive access to these detailed levels of analysis and additional content via our expert real estate agents.
If you are considering selling or purchasing land, we encourage you to speak to our team and discover how expert local knowledge backed by data, can help you make an informed decision.

Media
E: Elders.Communications@elders.com.au
General Real Estate
W: eldersrealestate.com.au/contact-us/ Analysis
E: matt.ough@elders.com.au
State based Real Estate
Queensland and Northern Territory – rob.anderson@elders.com.au
New South Wales – richard.gemmell@elders.com.au
Victoria and Riverina (NSW) – nicholas.myer@elders.com.au
Tasmania - nicholas.myer@elders.com.au
South Australia – phil.keen@elders.com.au
Western Australia – simon.cheetham@elders.com.au
