RURAL PROPERTY UPDATE
October - December 2022


October - December 2022


Elders uses a range of analytical techniques to achieve robust and repeatable analysis. Our dataset is subject to the following criteria:
⋅ Only transactions above 40 hectares (ha) are included, except for Tasmania where transactions above 30ha are included.
⋅ Transactions which list a primary purpose that isn’t classed as rural are excluded. Local government areas (LGAs) which fall within a metropolitan area are excluded from the analysis.
Vast pastoral areas of Australia without sufficient transaction volume are excluded from the analysis.
Outliers by price per hectare are excluded. This involves visual and statistical assessment of all $/ha values for a region, and this is performed every quarter.
Several data fields are available in the Elders dataset, including median price per hectare, transaction volume, value, area, date of sale and land use. The quarterly update focuses on median price per hectare growth and transaction volume expressed both as a total and split by land size.
This data is not intended to be a valuation of any one property and is merely a method of tracking growth over time for a given dataset.
Definitions within the update include:
CAGR – refers to the compound average growth rate for a given period.
QoQ – quarter on quarter growth
YoY – year on year growth
1yr rolling performance – the median price per hectare for one year from the latest data point. For example, the 1yr rolling median $/ha for Q4-2022 runs from 01/01/2022 to 31/12/2022; the next quarter will roll to the 01/04/2022 to 31/03/2023. The dataset changes by one quarter at a time which helps smooth out volatility and give an indication of long-term trends.
Elders Rural Property Update draws on transactional data from every rural land sale in Australia. This data is supplied by Corelogic and analysed by Elders. Every effort is made to clean the data in order to provide an accurate account of price and volume movements.
Land values continued to increase, and total property turn over declined across the year. The trends suggest that historically low interest rates, sound commodity fundamentals and favourable seasonal conditions have been fully factored into land values, and the market is looking for some direction as we move into 2023.
Some of the factors the market will be looking for direction on in 2023 are likely to be:
Relative performance of agriculture to other investment options
⋅ Fundamental support for commodity prices
⋅ The impact alternative land uses such as renewable energy, biodiversity offsets and carbon sequestration opportunities
Whilst there is some volatility creeping into agricultural operating conditions, it is likely that the relative performance of rural land as an asset class compared to other investment options is playing a strong role in investment decisions. That is, land holders are reluctant to sell out of agriculture unless they see viable investment options in other asset classes. Similar sentiment is held by buyers. Ongoing volatility in financial markets is likely to be supportive of farmland values.
Most property owners and potential new entrants take a long-term view of operating conditions when making investment decisions (retaining rural land is an investment decision just as selling or buying is). Cost pressures continue to erode margins, but there is limited evidence of a sustained change in demand for food and fibre. The FAO food price index has fallen during 2022 but remains well above historical levels, second only to the peak in real terms in the mid1970s. As reported in previous editions, there is a strong correlation between commodity prices and farmland values.
Alternative land uses, such as carbon sequestration (carbon farming) and bio-diversity offsets (locking up high quality vegetation on a farmland to offset environmental impacts elsewhere such as roads or urban development), may deliver alternative revenue streams for some land holders. We are seeing rising demand for farmland that can provide carbon sequestration and bio-diversity credits.
Sustainable management of the natural resources used to produce food and fibre is also an important consideration for many consumers. Farmers will be increasingly asked to demonstrate their environmental credentials.
The farmland based carbon and environmental “services” market will continue to evolve in 2023 and likely to have an increasing impact on farmland values.
It is important to take into consideration all these factors when assessing the market to make an investment decision. Elders has an experienced sales team across all regions of Australia, backed by a range of technical and subject matter experts to ensure you make an informed decision.
Mark Barber General Manager, Farmland Agency and Agribusiness InvestmentsWelcome to the Q4 edition of the Elders Rural Property Update. It is no surprise to any readers of this Rural Property Update Series that there has been strong year on year appreciation of land values across the country and across land use types.
Elders Rural Property Update Q4-2022 highlights the calendar year performance of Australia’s rural property market. Prices were incredibly strong in most markets compared to 2021, highlighting the resilience of rural property as an asset class at a time where other asset classes have struggled.
Nationally, median price per hectare increased by 11.2 per cent (pc) in Q4-2022, taking the quarterly median price to $9,019 per hectare (ha). Calendar year results showed an increase of 18.1pc compared to 2021, resulting in a step change in median price per hectare, skipping the $7,000/ha mark and jumping straight to $8,142/ha.
Significant increases were a product of very tight supply across the country with many markets skewing towards smaller high-priced parcels of land. The five-year compound average growth rate now stands at 10.5pc, indicating that median price per hectare is doubling every 7.5 years.
National transaction volume declined by 1.7pc, totalling 1,334 in Q4-2022. Transaction volume was very tight for the calendar year, down by 37.5pc to 5,794. The decline in sales was present in six of the seven state and territories, with the Northern Territory (NT) being the exception.
At state level, the NT and Tasmania recorded the highest growth in median price per hectare in Q4-2022, up 59.6pc and 36.5pc respectively, primarily driven by a shift in transaction mix favouring high priced parcels in the Top End region of the NT and the Northern region of Tasmania.
The NT and South Australia (SA) recorded the strongest growth in median price per hectare for the 2022 calendar year. In the NT prices increased by 59.5pc to $2,267/ha driven by an increased volume of high-priced parcels from the Top End region. Meanwhile, SA recorded growth of 46.9pc in 2022 reaching $6,346/ha after two years of flat price growth at state level; the increase was driven by the South East and Yorke regions.
Transaction volume was mixed across states in Q4-2022, declining by 27.3pc in the NT and 22.2pc in Tasmania. In contrast, volume increased by 17pc in Victoria and 12pc in SA.
The significant decline in transaction volume for the calendar year was most pronounced in Tasmania with a decline of 48.9pc followed by Victoria down by 45.9pc. Transaction volume in most states came off a high set in 2021 after a flurry of sales driven by drought relieving rains.
The national one year rolling median price per hectare increased by 5.2pc in Q4-2022 to $8,142/ ha, continuing an upward trend which stretches for 14 consecutive quarters.
The value of rural property traded totalled $3 billion in Q4-2022, an increase of 13.3pc compared to Q3-2022, this was a function of strong price growth, very large one-off transactions and the transaction mix favouring smaller higher priced parcels of land.
We expect tight supply to remain a key factor for price growth in 2023 despite some buyside drivers softening.
Elders Rural Property Update aggregates transaction data from 39 regions across Australia. To get in touch please refer to the ‘For More Information’ page at the end of this update.
Buyside drivers are mixed this quarter with falling commodity prices, particularly for beef and lamb. Interest rates continued to increase however this has largely been priced into land sales already. While debt levels came off a high in November 2022 and farm management deposit balances remain well above this time last year.
⋅ Australian grain prices have slipped in recent weeks but remain above year ago levels with the exception being canola; barley (+16pc YoY), wheat (+7pc YoY) and canola (-26pc YoY). In contrast, beef and lamb prices corrected early in 2023; beef (-38pc YoY) and trade lamb (-13pc YoY). While the eastern wool indicator price found support (+2pc YoY).

⋅ Business interest rates continue an upward cycle, medium business rates increased 0.4pc during Q4-2022 taking the average rate to 5.3pc. Large business rates increased by 0.5pc in Q4-2022 taking the average rate to 4.6pc.
Debt to Agriculture, Forestry and Fishing increased by 2.1pc in Q4-2022 to $106.9 billion. However, the month on month debt balance declined in December and January by 0.8pc and 0.5pc respectively, coming off a peak balance of $107.8 billion in November 2022.
The National Farm Management Deposit (FMD) balance declined by 1.8pc in Q4-2022 to $5.9 billion, which is 10.8pc higher than December 2021.
Tight supply remains the key driver of rural property markets in 2023. We do expect some supply relief in 2023 however it will be coming from a very low base set in 2022 which would imply that land prices will continue to increase.

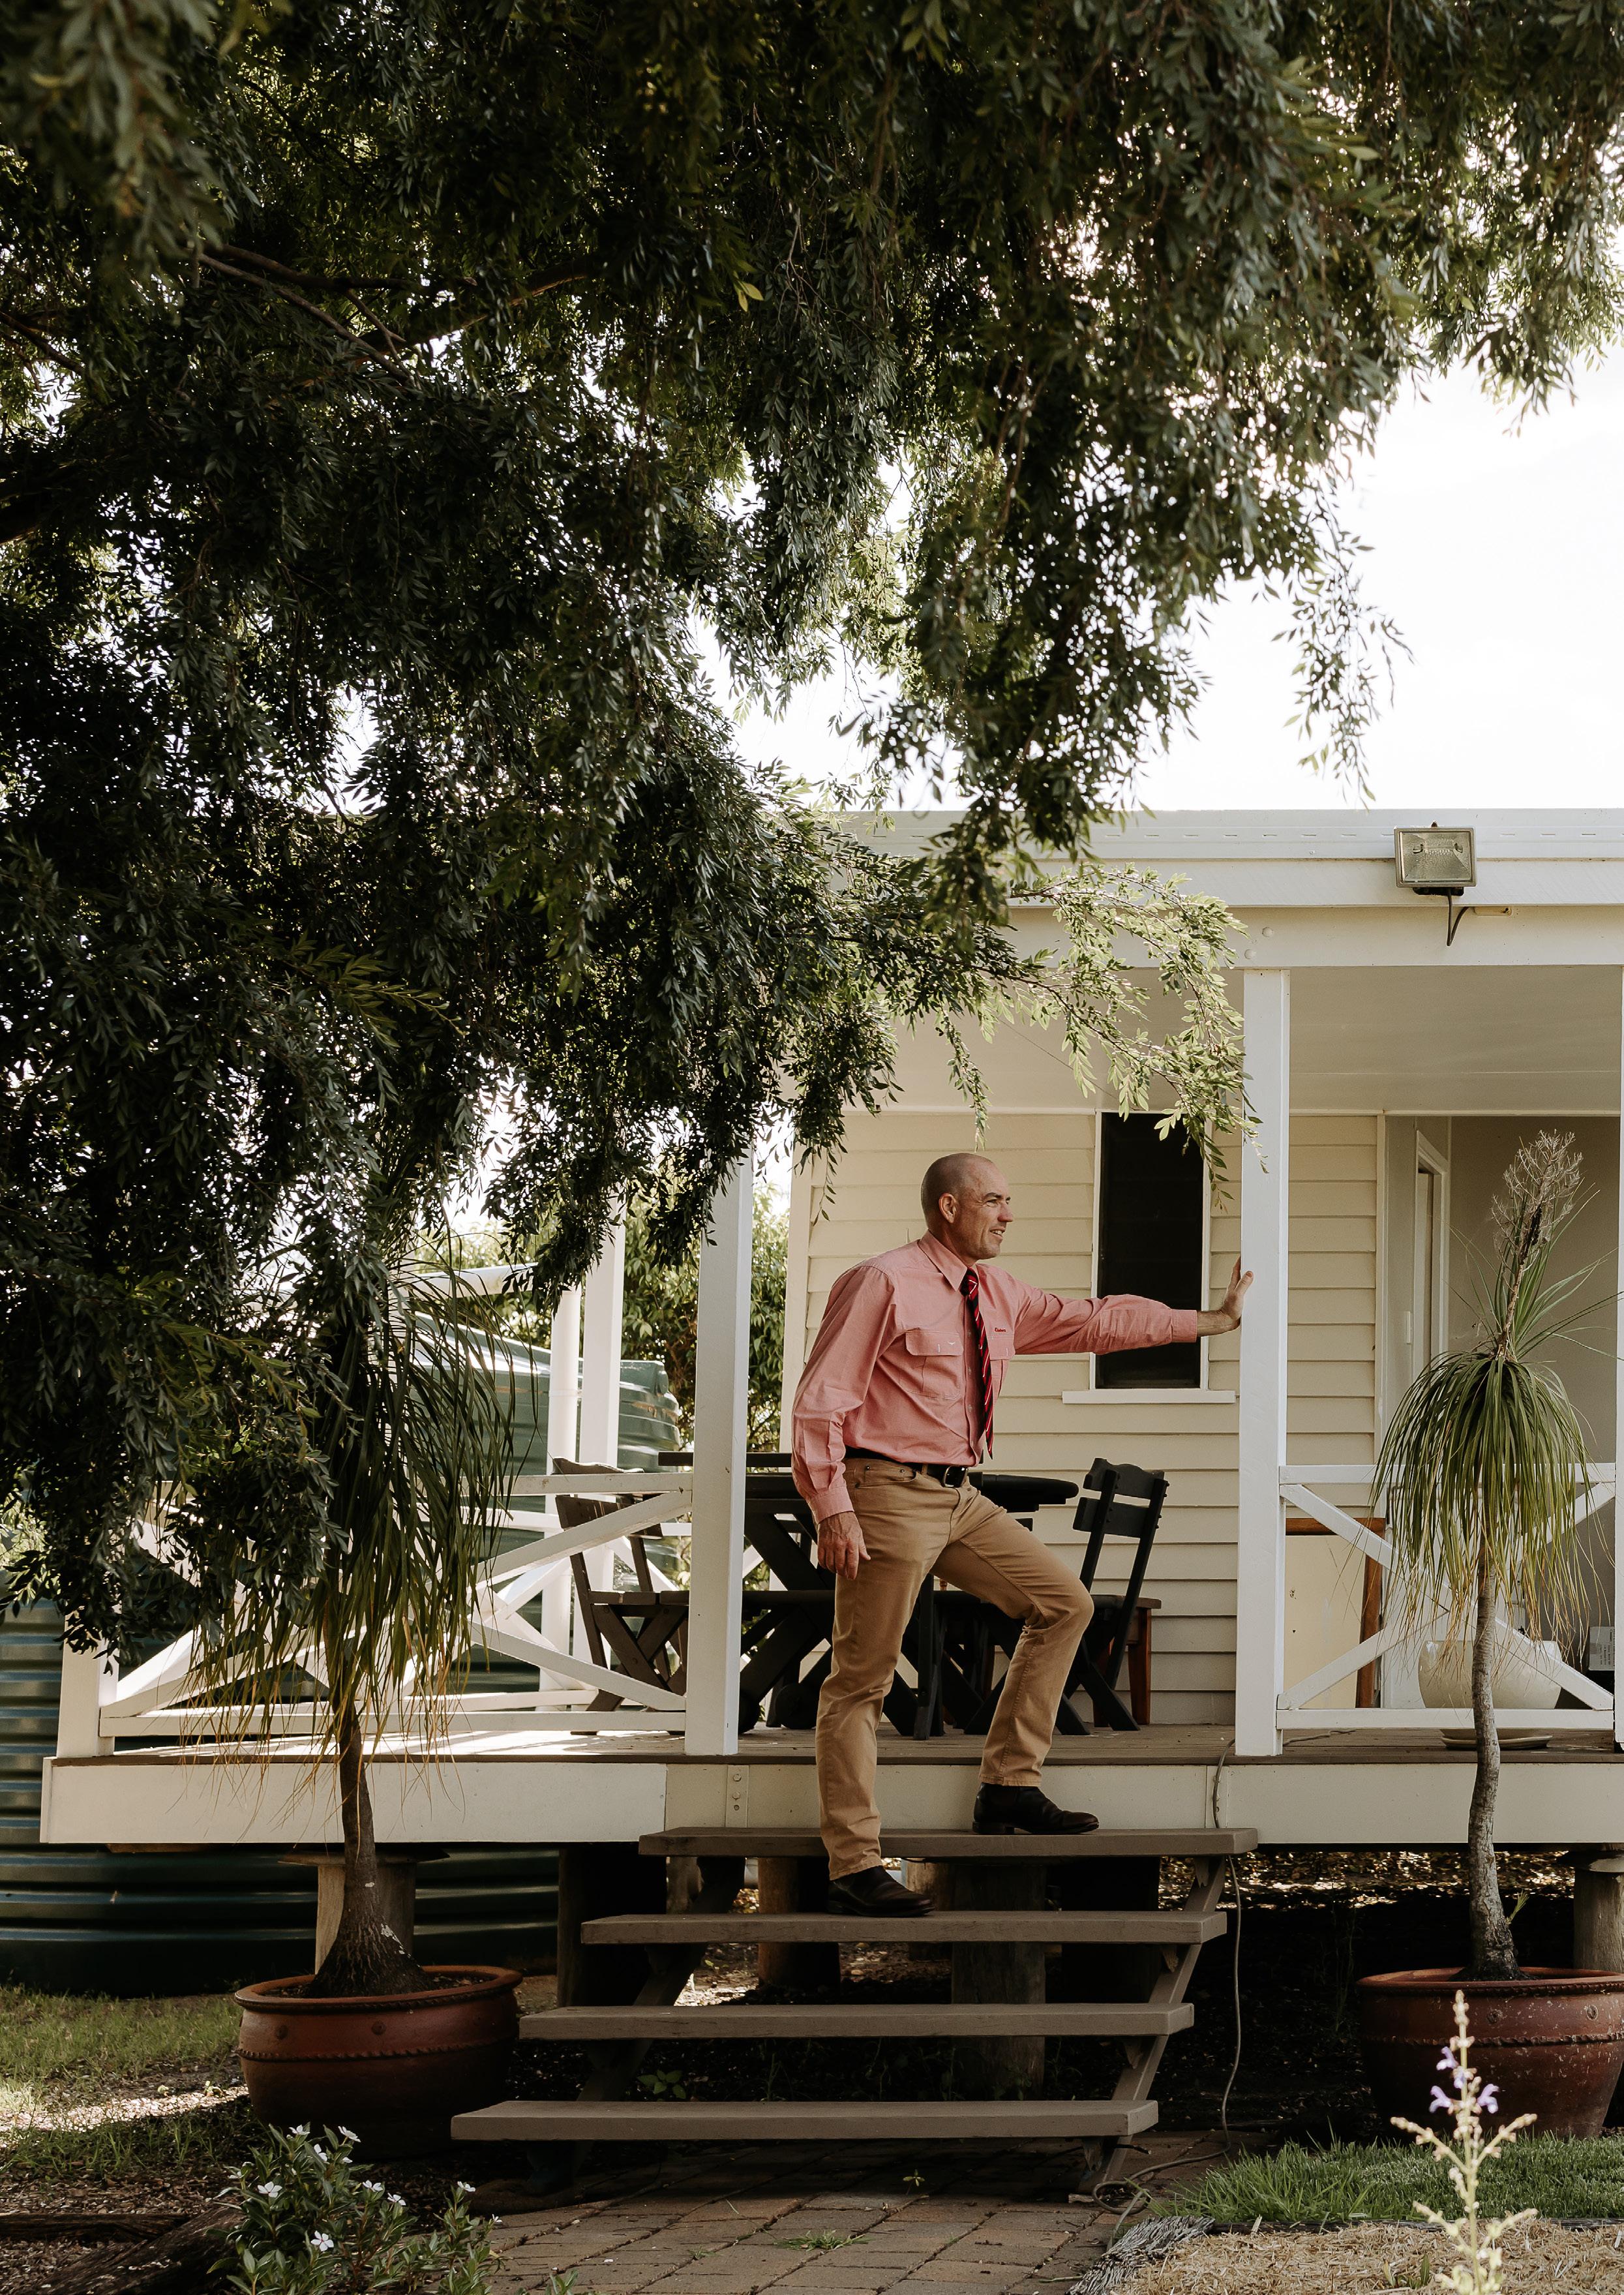
The signi cant increase was a product of very tight supply across the country with many markets skewing towards smaller high-priced parcels of land.
 Executive Summary, page 6
59.5% Northern Territory
LARGEST PERCENTAGE INCREASE
MOST VALUABLE $12,937 Victoria
6.1% Western Australia
SMALLEST PERCENTAGE INCREASE
40.8% Northern Territory
LARGEST PERCENTAGE INCREASE compared to 2021
2,333 New South Wales
MOST TRANSACTIONS
5,794 Nationwide
TRANSACTIONS made nationwide from 2021 to 2022
“Whilst there is some volatility creeping into agricultural operating conditions, it is likely that the relative performance of rural land as an asset class compared to other investment options is playing a strong role in investment decisions. That is, land holders are reluctant to sell out of agriculture unless they see viable investment options in other asset classes.”
Mark Barber Elders GM Farmland Agency & Agribusiness Investments, Australia.
National median price per hectare increased by 11.2pc, driven by strong results in Tasmania, New South Wales and South Australia.
Transaction volume eased by 1.7pc due to mixed results at state level. Victoria recorded an increase while Queensland tightened further.
The 2022 calendar year recorded another significant increase in median price per hectare, up 18.2pc to $8,142/ha. Driven by strong results in most states against a backdrop of very tight supply which resulted in a higher proportion of small high value parcels. Transaction volume declined by 37.5pc to 5,794.
“Australian land values showed impressive growth in Q4-2022, rounding out a year of resilient price growth at a time of economic uncertainty. We expect some supply relief in 2023 but it will be coming from a low base keeping competition high.”
Mark Barber
Elders GM Farmland Agency & Agribusiness Investments, Australia.
“The supply of buyers are plentiful in the 2023 market place, even with interest rates continuing to rise and inflation at an all time high. The strength in the rural property sector shows the resilience that farming continues to deliver. Investment in rural properties is coming from a wide range of buyers from the corporates through to the first-time purchasers.
Queensland’s weather conditions in recent times have also been favorable for most, assisting in high weight gains and high yielding crops. Elders continues to invest in quality staff in Queensland adding five new sales agents since January, so contact your local branch today and speak to our experienced team.”
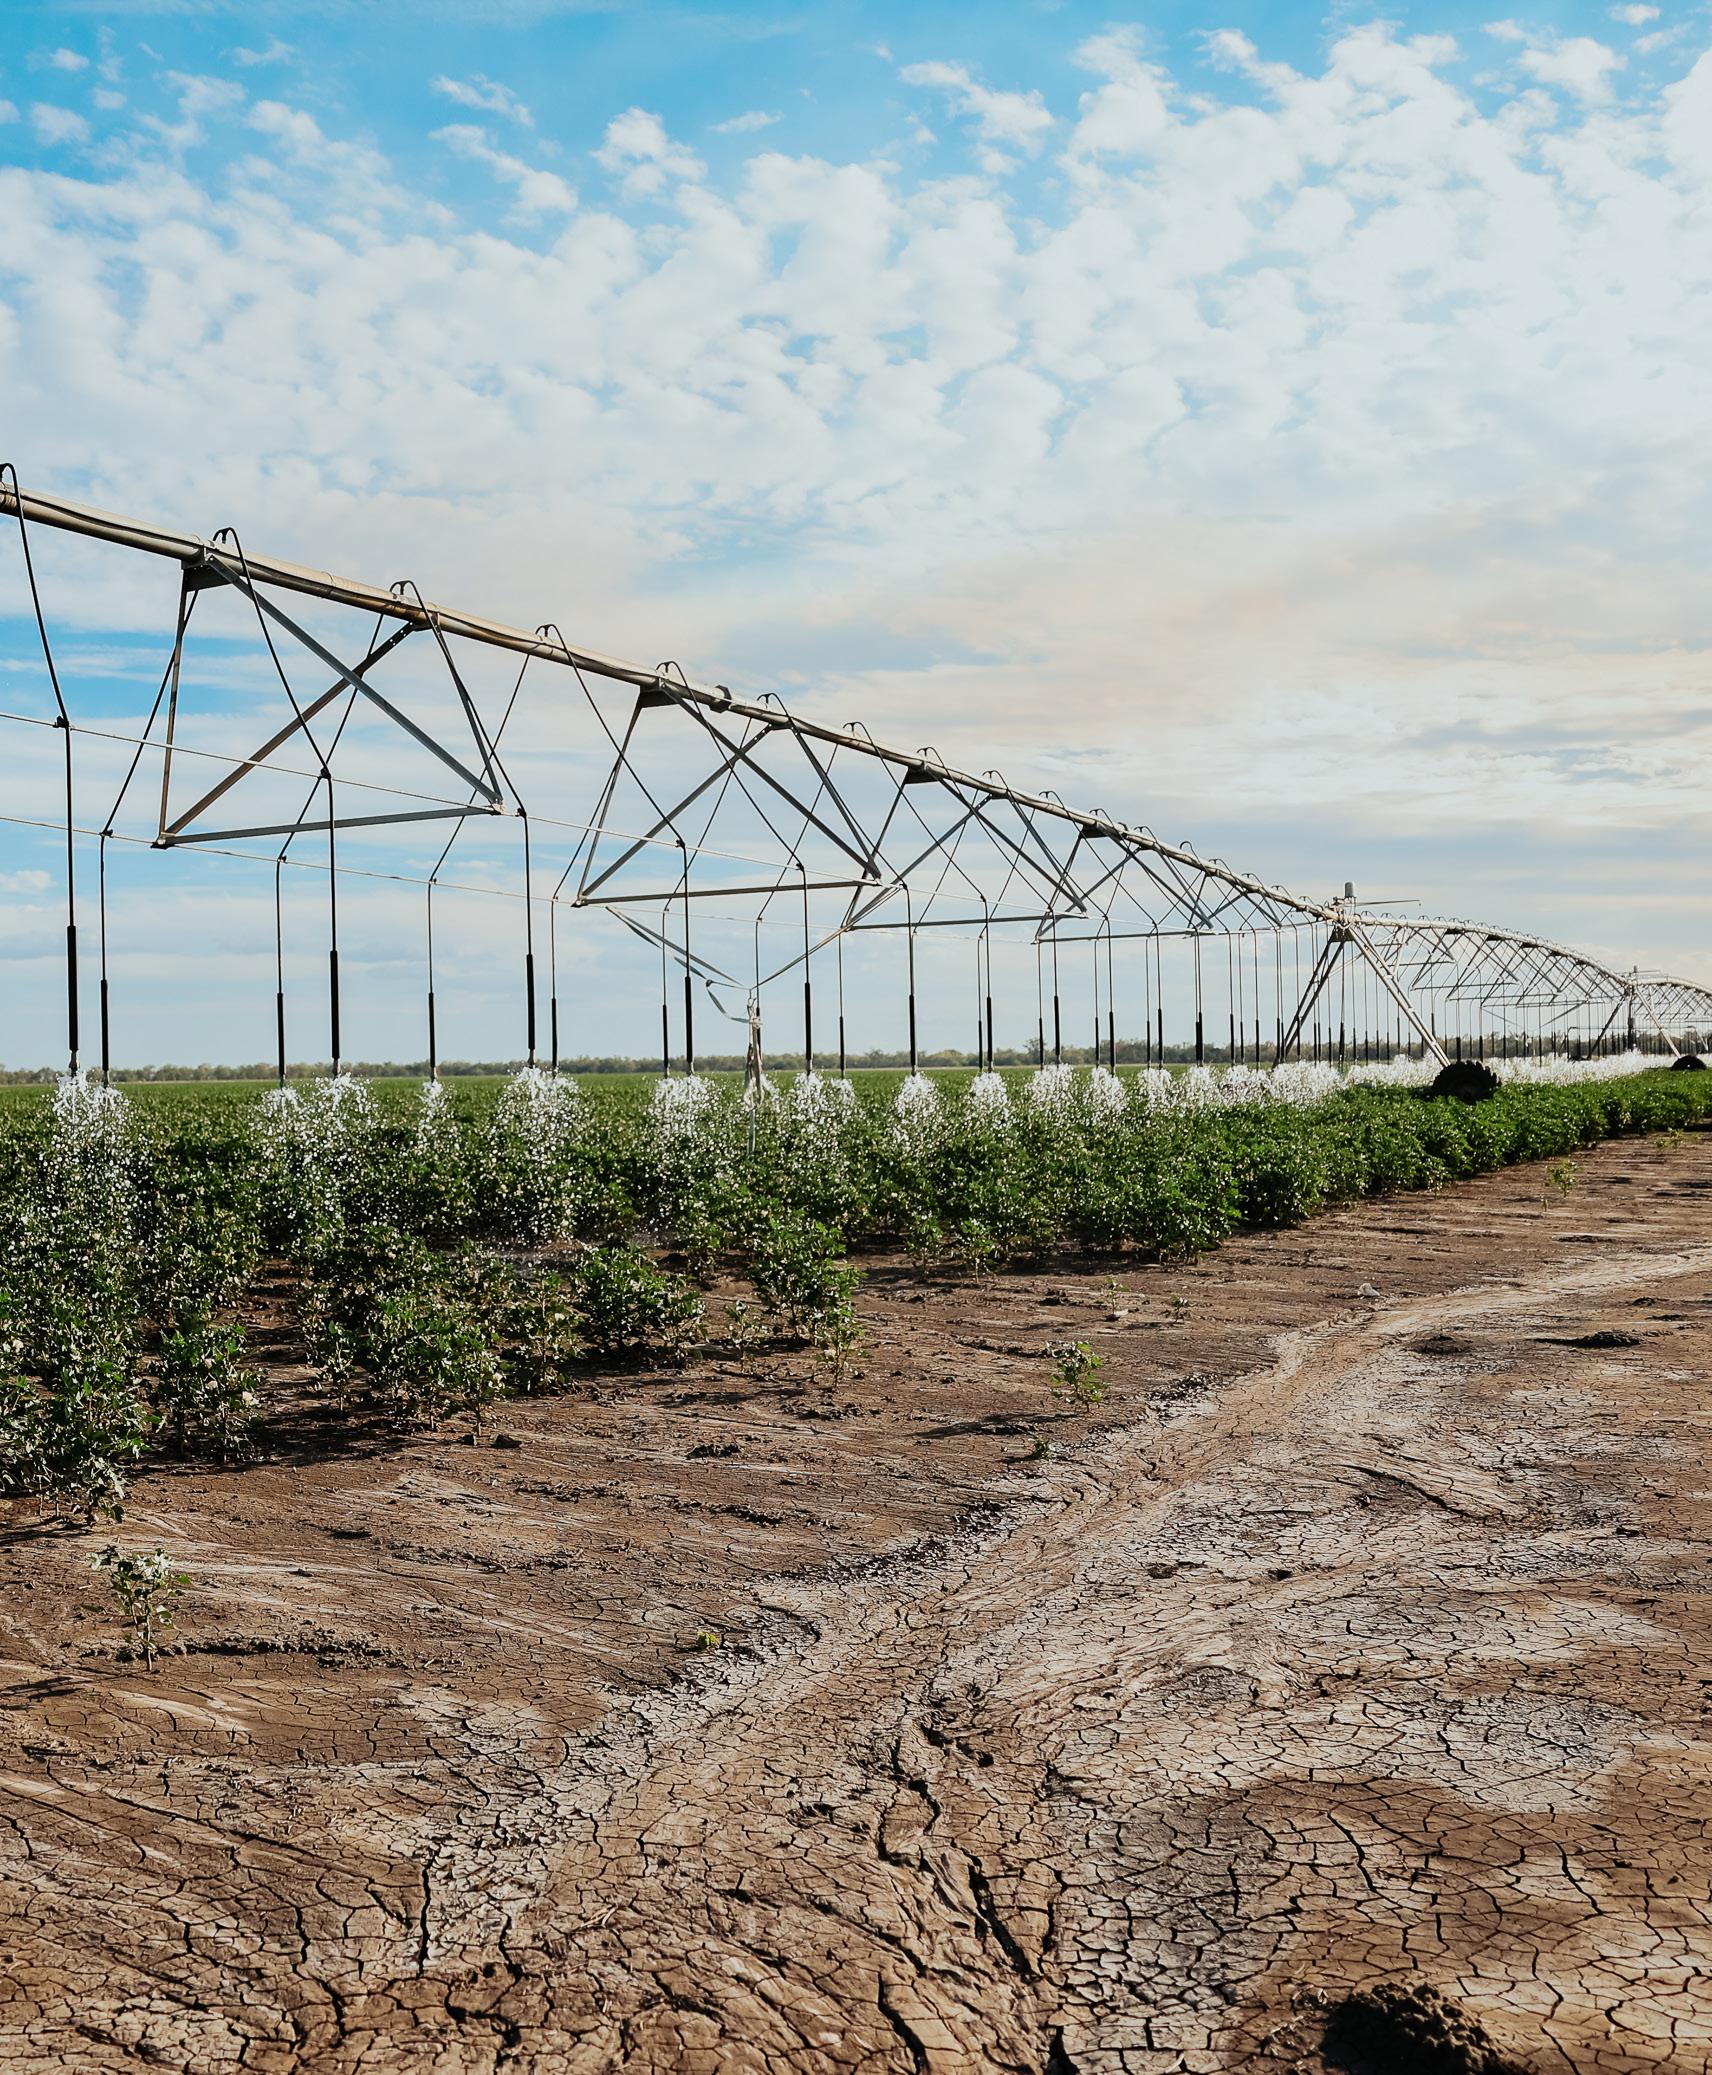 Daniel Roberts, State Manager Real Estate, QLD/NT
Median $/ha distribution by region
Median price per hectare decreased by 7.4pc in Q4, driven by the North and Central regions. Transaction volume decreased, particularly in the South and West regions, resulting in transaction mix favouring smaller parcels.
The calendar year results showed a sharp increase in prices, up 27.5pc to $6,756/ha. Transaction volume declined sharply, down by 40pc to 1,238, with transaction mix favouring the Central region. The strongest region performance was in West QLD, where price increased 36.1pc compared to 2021.
“The listings across Queensland remain tight, while this happens prices will likely trend higher.
“While the supply is so low and the demand so high, rural real estate will remain strong with interest rates having little to no impact on property prices in Queensland.”
Daniel Roberts, State Manager Real Estate, QLD/NT
“With production being reinstated to align with more average seasonal conditions than we experienced at the end of 2022, throughout the cropping districts there has been a flurry of activity with paddock preparation in readiness for planting.
“There is some speculation around the traps as to how the market may react to interest rate rises and commodity prices, in particular beef, however, we continue to experience strong sale results across the board.”
 Richard Gemmell, State Real Estate Manager, NSW
Median price per hectare increased by 20.5pc in Q3, driven by increases in the Hunter, Northern Tablelands and Riverina Murray regions.
Transaction volume held firm, increasing by 0.7pc, primarily due to a decline in the Central and sharp increase in the Riverina Murray.
The calendar year results showed a strong increase in price, up 19.9pc to $8,508/ha, the fourth consecutive year of double-digit increases. Top performing regions included West and North West NSW. Transaction volume declined sharply, down by 41.9pc to 2,333, with smaller parcel sizes dominating the overall transaction mix.
“Sales of farmland across the state continues to occur with good competition reported by most of our agents, despite the expected increase in listings. Auction results throughout the Central Tableland districts continue to be in positive territory, with some very good listings in the pipeline about to hit the market that will provide some great opportunities for discerning investors.”
Richard Gemmell State Real Estate Manager, NSW
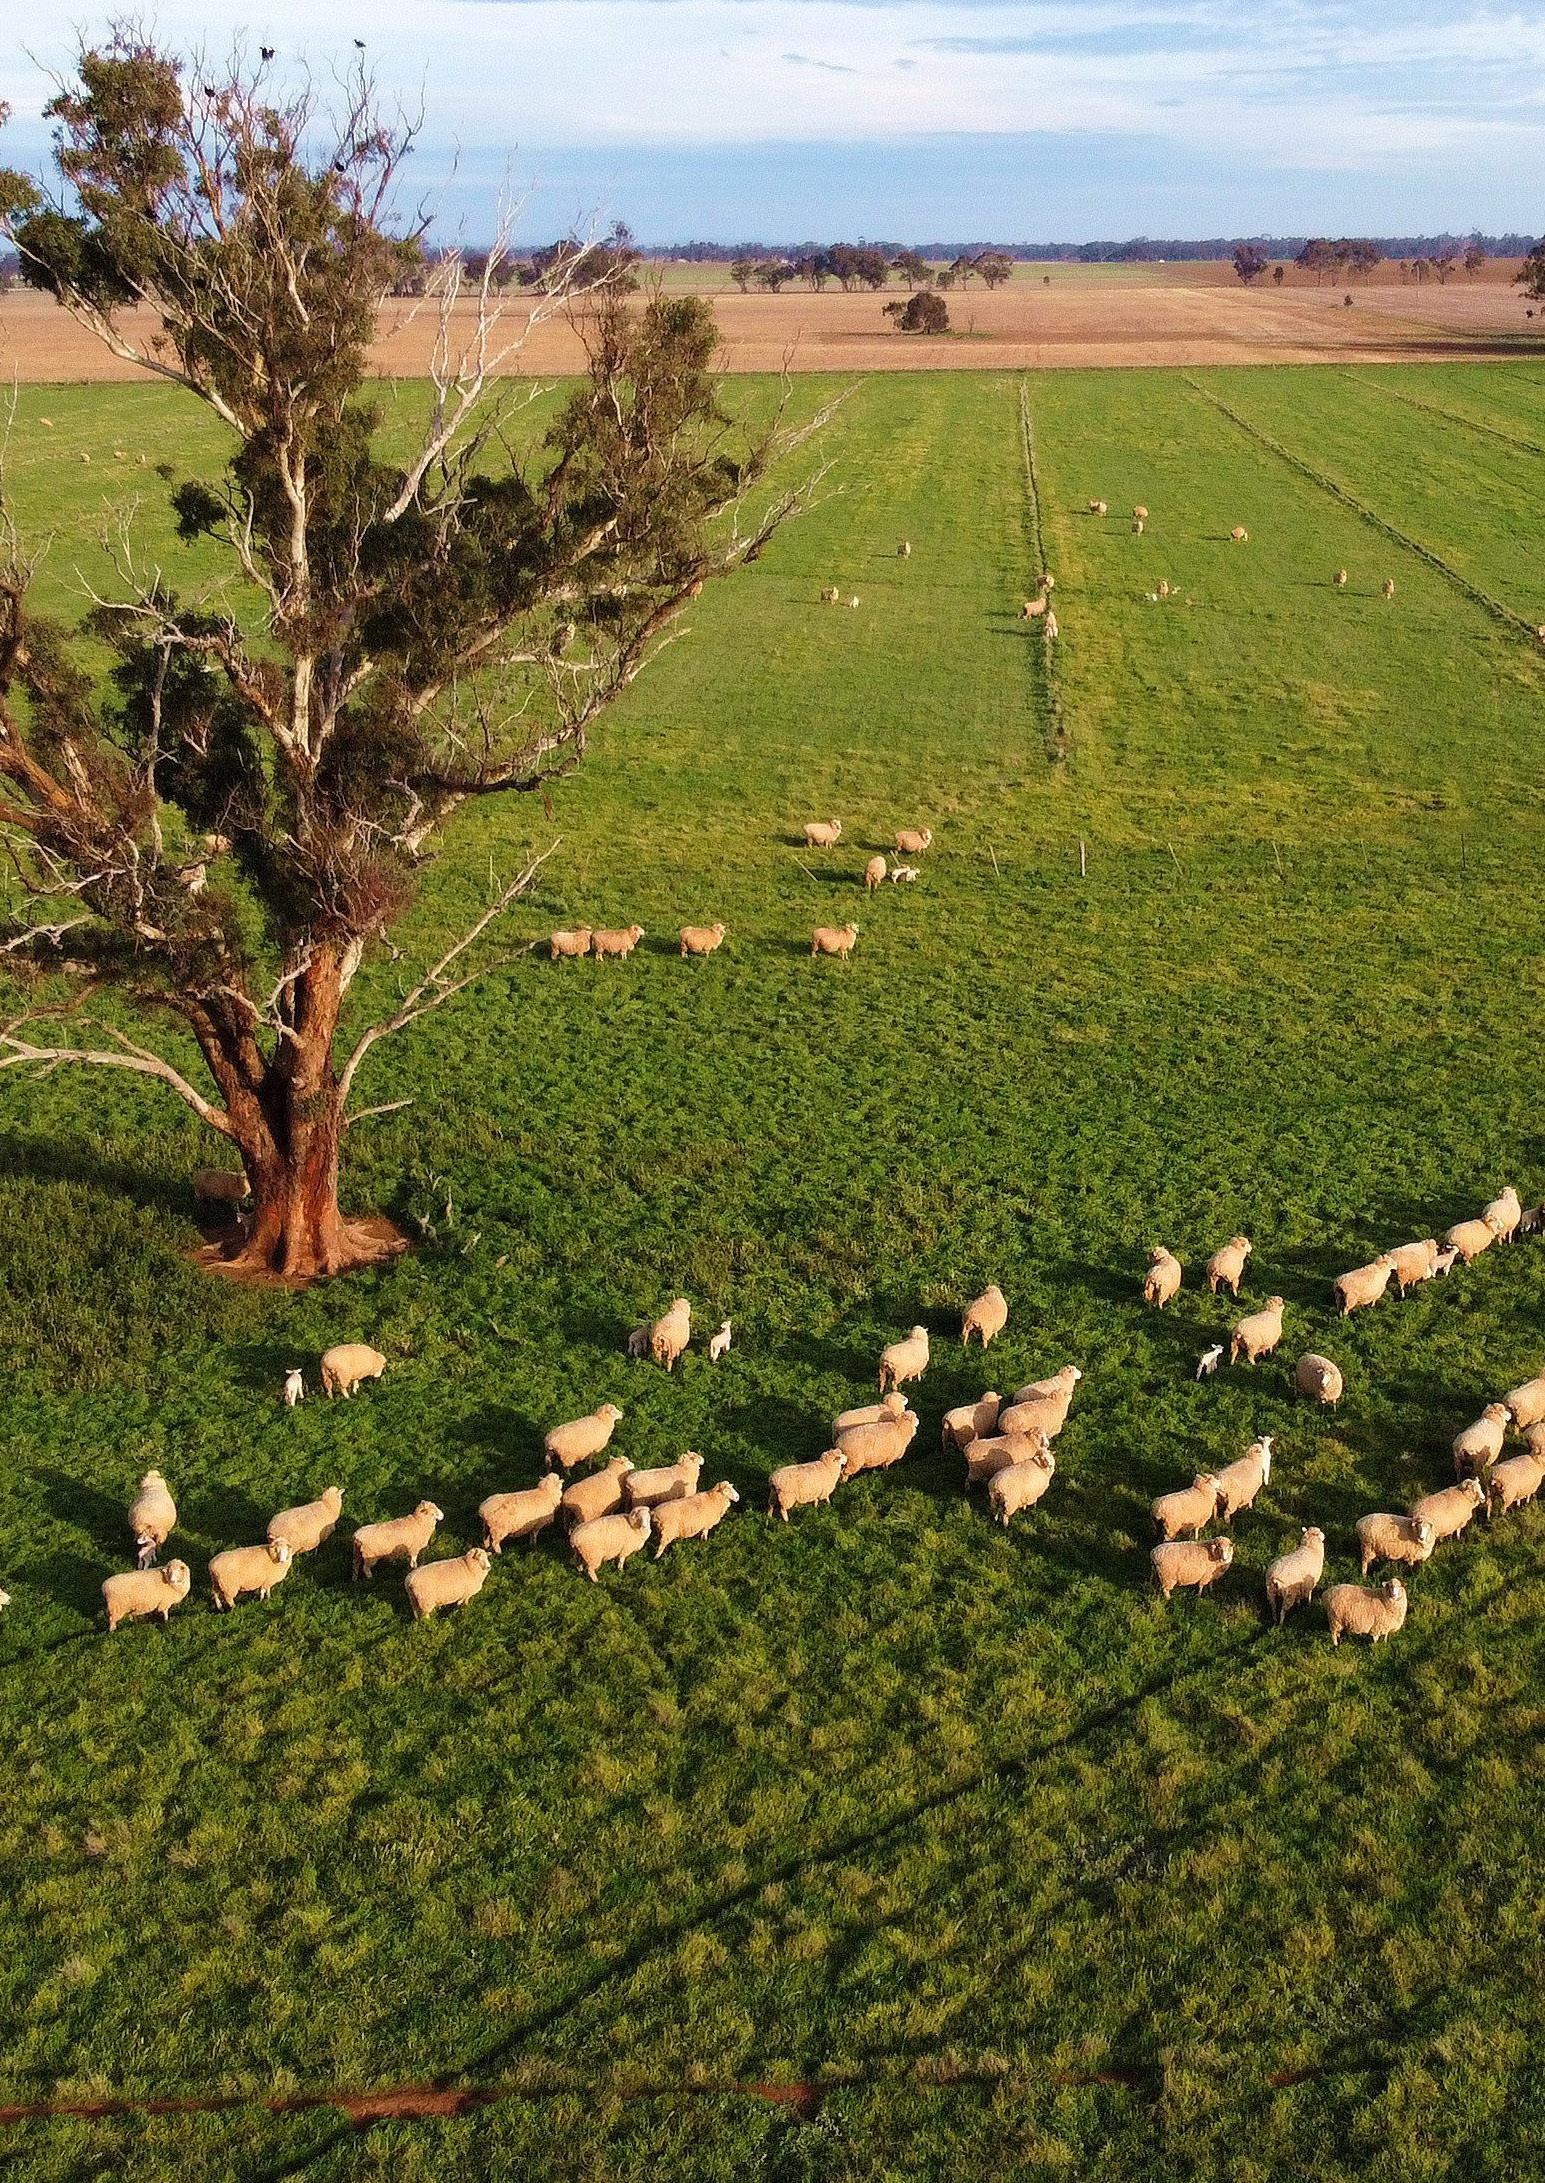
“Whilst quality assets continue to be met with strong demand and are achieving excellent results, there are isolated instances where the market has confirmed signs of levelling out.”
Nick Myer, State Real Estate Manager Victoria/Riverina and Tasmania
Median price per hectare eased by six per cent in Q4, driven by mixed performance across regions with Gippsland and South Central contracting.
Transaction volume increased sharply up by 17pc in Q4, shifting the transaction mix in favour of larger parcels in the Wimmera-Mallee and South West.
The calendar year results showed a strong increase in price up by 22.5pc to $12,937/ha, the second consecutive year of growth above 20pc. This was driven by a sharp decline in transaction volume down by 45.9pc to 722, most of the decline occurred in the larger parcel size range. This shifted transaction mix towards higher priced smaller parcels.
“The first quarter of 2023 selling season has commenced well with a healthy volume of assets presented to market which are being met with strong demand.
Disruptions as a result of seasonal conditions in the second half of 2022 saw opportunities planned for market postponed and subsequently being presented in the first quarter of 2023.”
Nick Myer State Real Estate Manager Victoria/Riverina and Tasmania
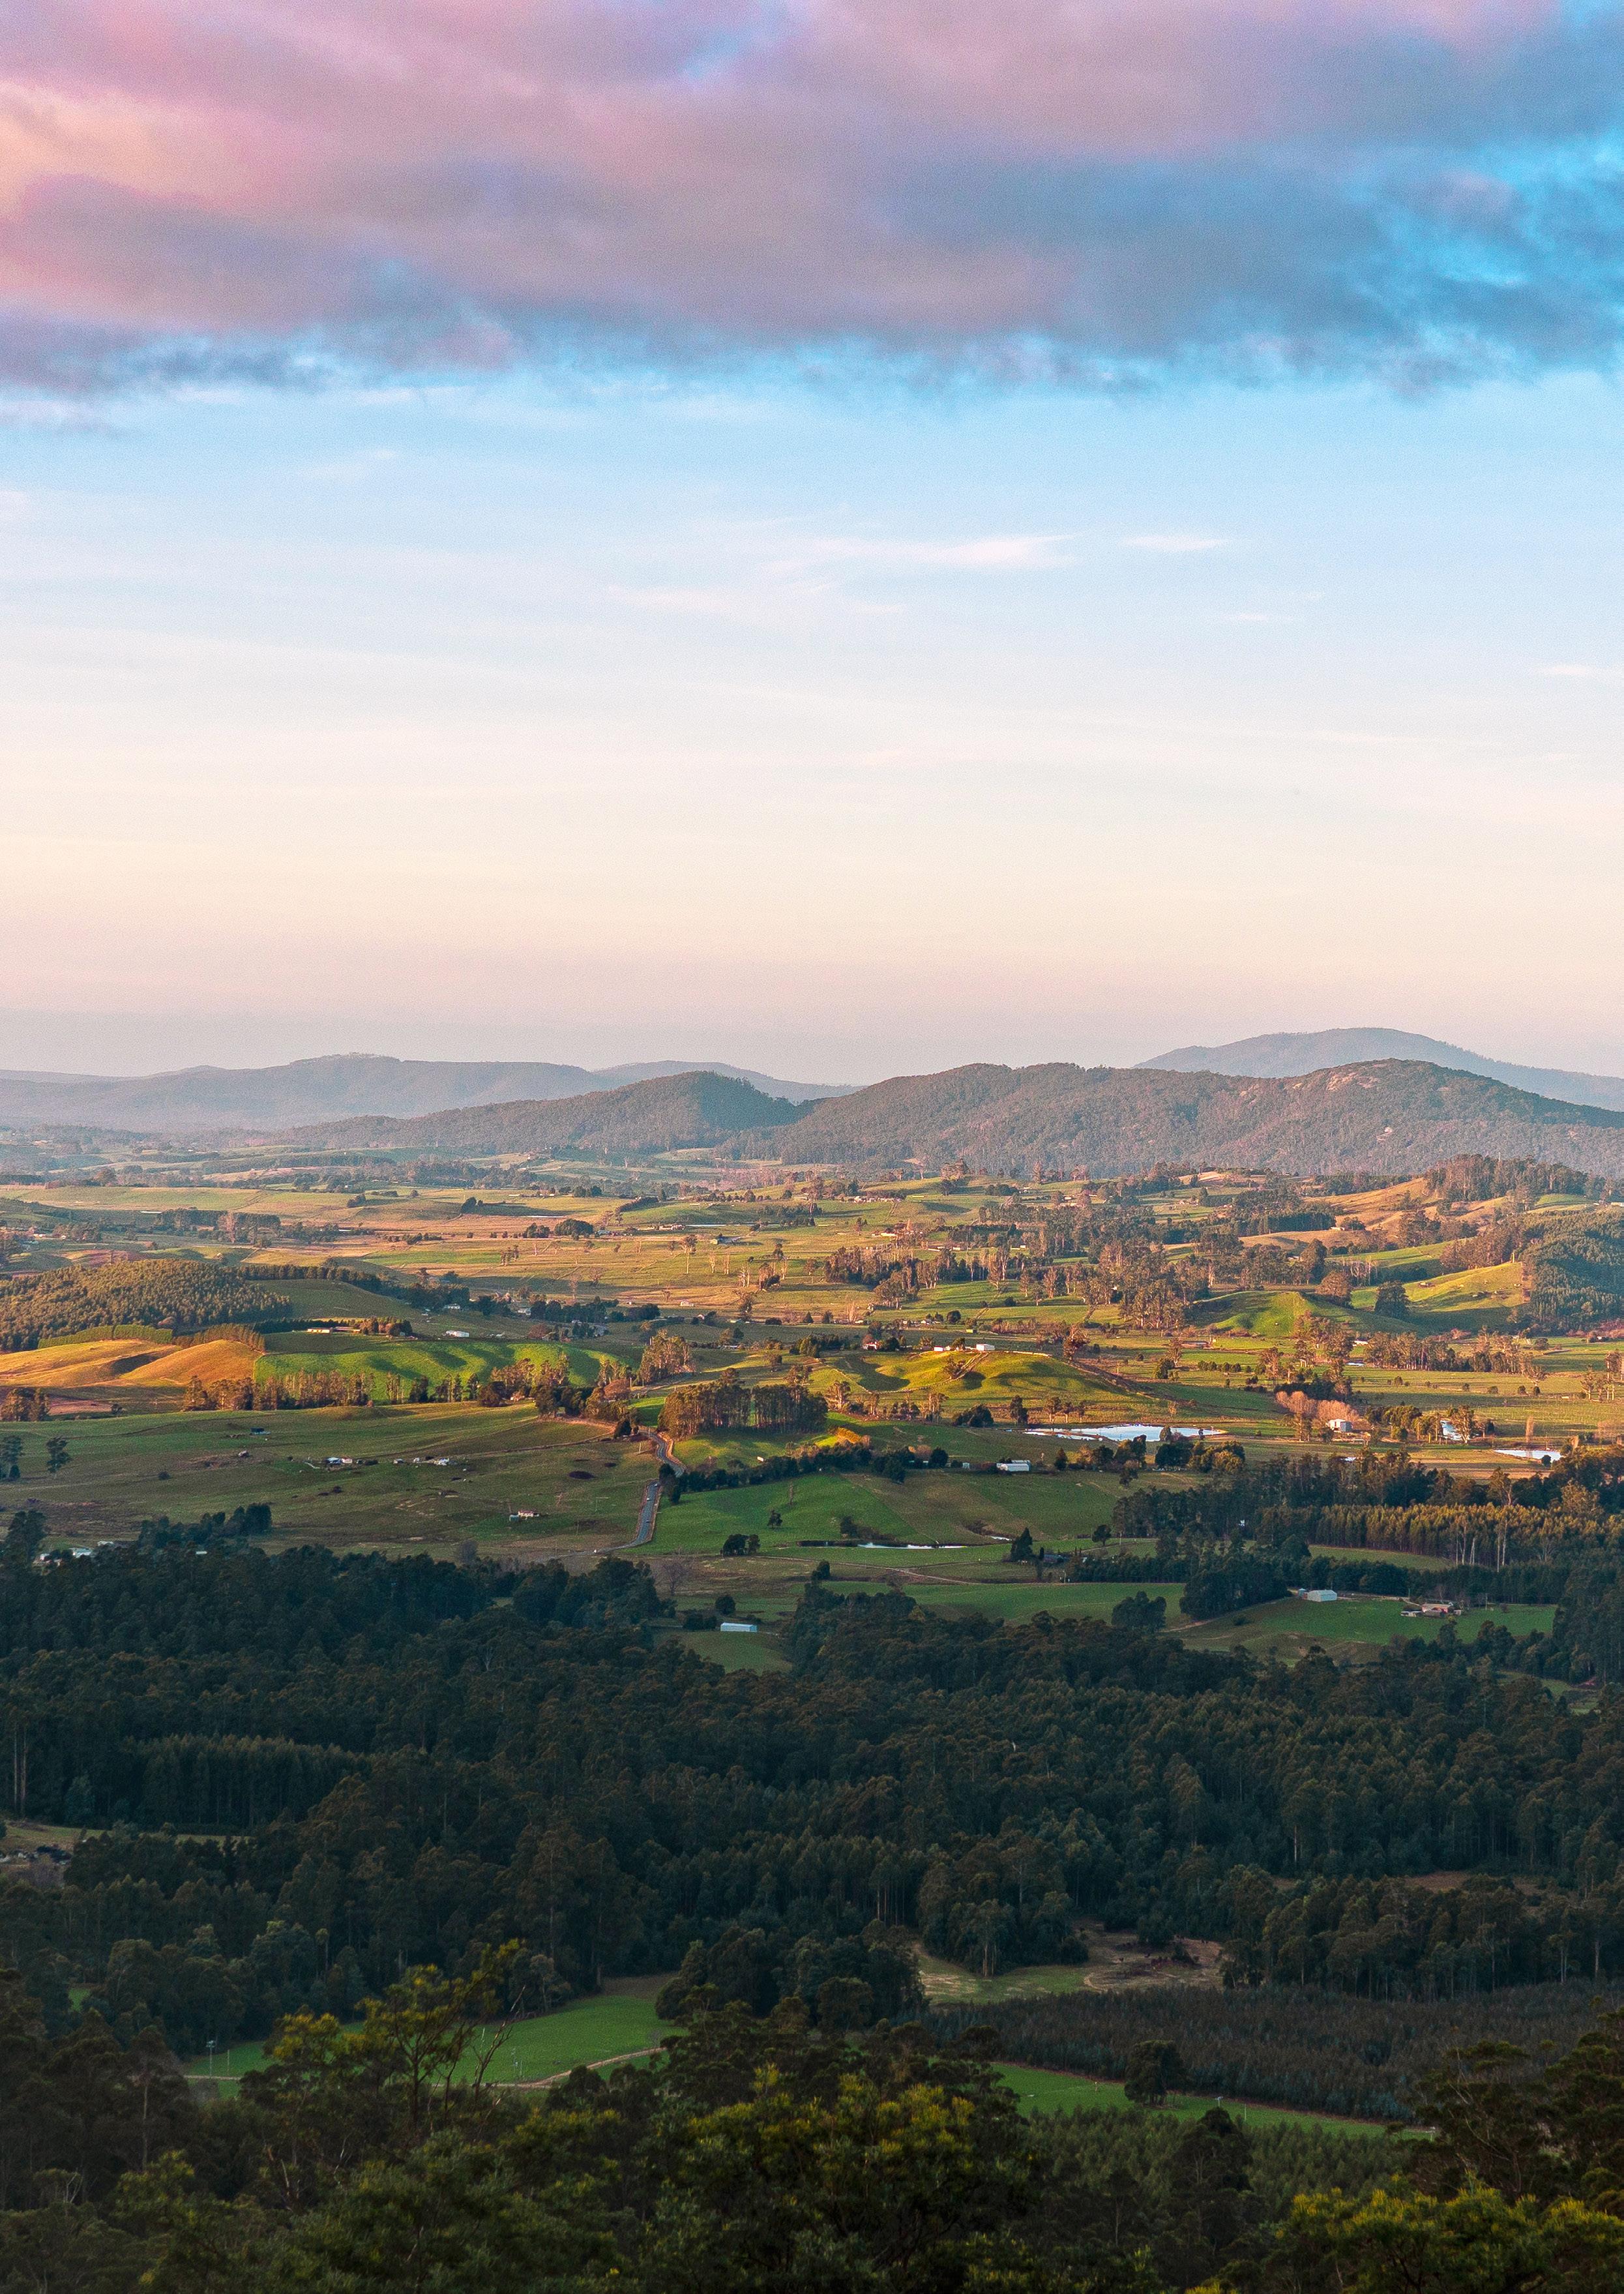
Median
Median price per hectare increased by 36.5pc in Q4, driven by strong growth in the North West and Northern regions.
Transaction volume decreased sharply in Q4 driven by fewer sales in the Northern region. Transaction mix shifted towards higher priced parcels in the South and North West regions.
The calendar year results showed that prices increased by 7.1pc to $11,543/ha, rebounding from a decline in 2021. The Northern region was responsible for most of the growth at state level. Transaction volume tightened further in 2022, down by 48.9pc to 92.
QoQ
YoY (Q4-2022 vs. Q4-2021)
Median $/ha: $15,802 +36.5% +1.8%
Transactions: 21 -22.2% -19.5%
Value traded: $38.6m +42.3% -4.9%
“The Tasmanian market continues to see limited supply. Demand remains high for good quality assets that present to market, a trend we expect to continue in 2023.”
Nick Myer State Real Estate Manager Victoria/Riverina and Tasmania
“The outlook for the balance of 2023 remains reasonably optimistic despite some light headwinds. With a decline in both cattle and sheep commodity prices (from extreme values) and interest rates becoming more of a consideration for potential buyers, the market is now starting to flatten. Whilst there may be fewer buyers milling around, those who look longer term certainly remain confident in Australian agriculture - as do we.”
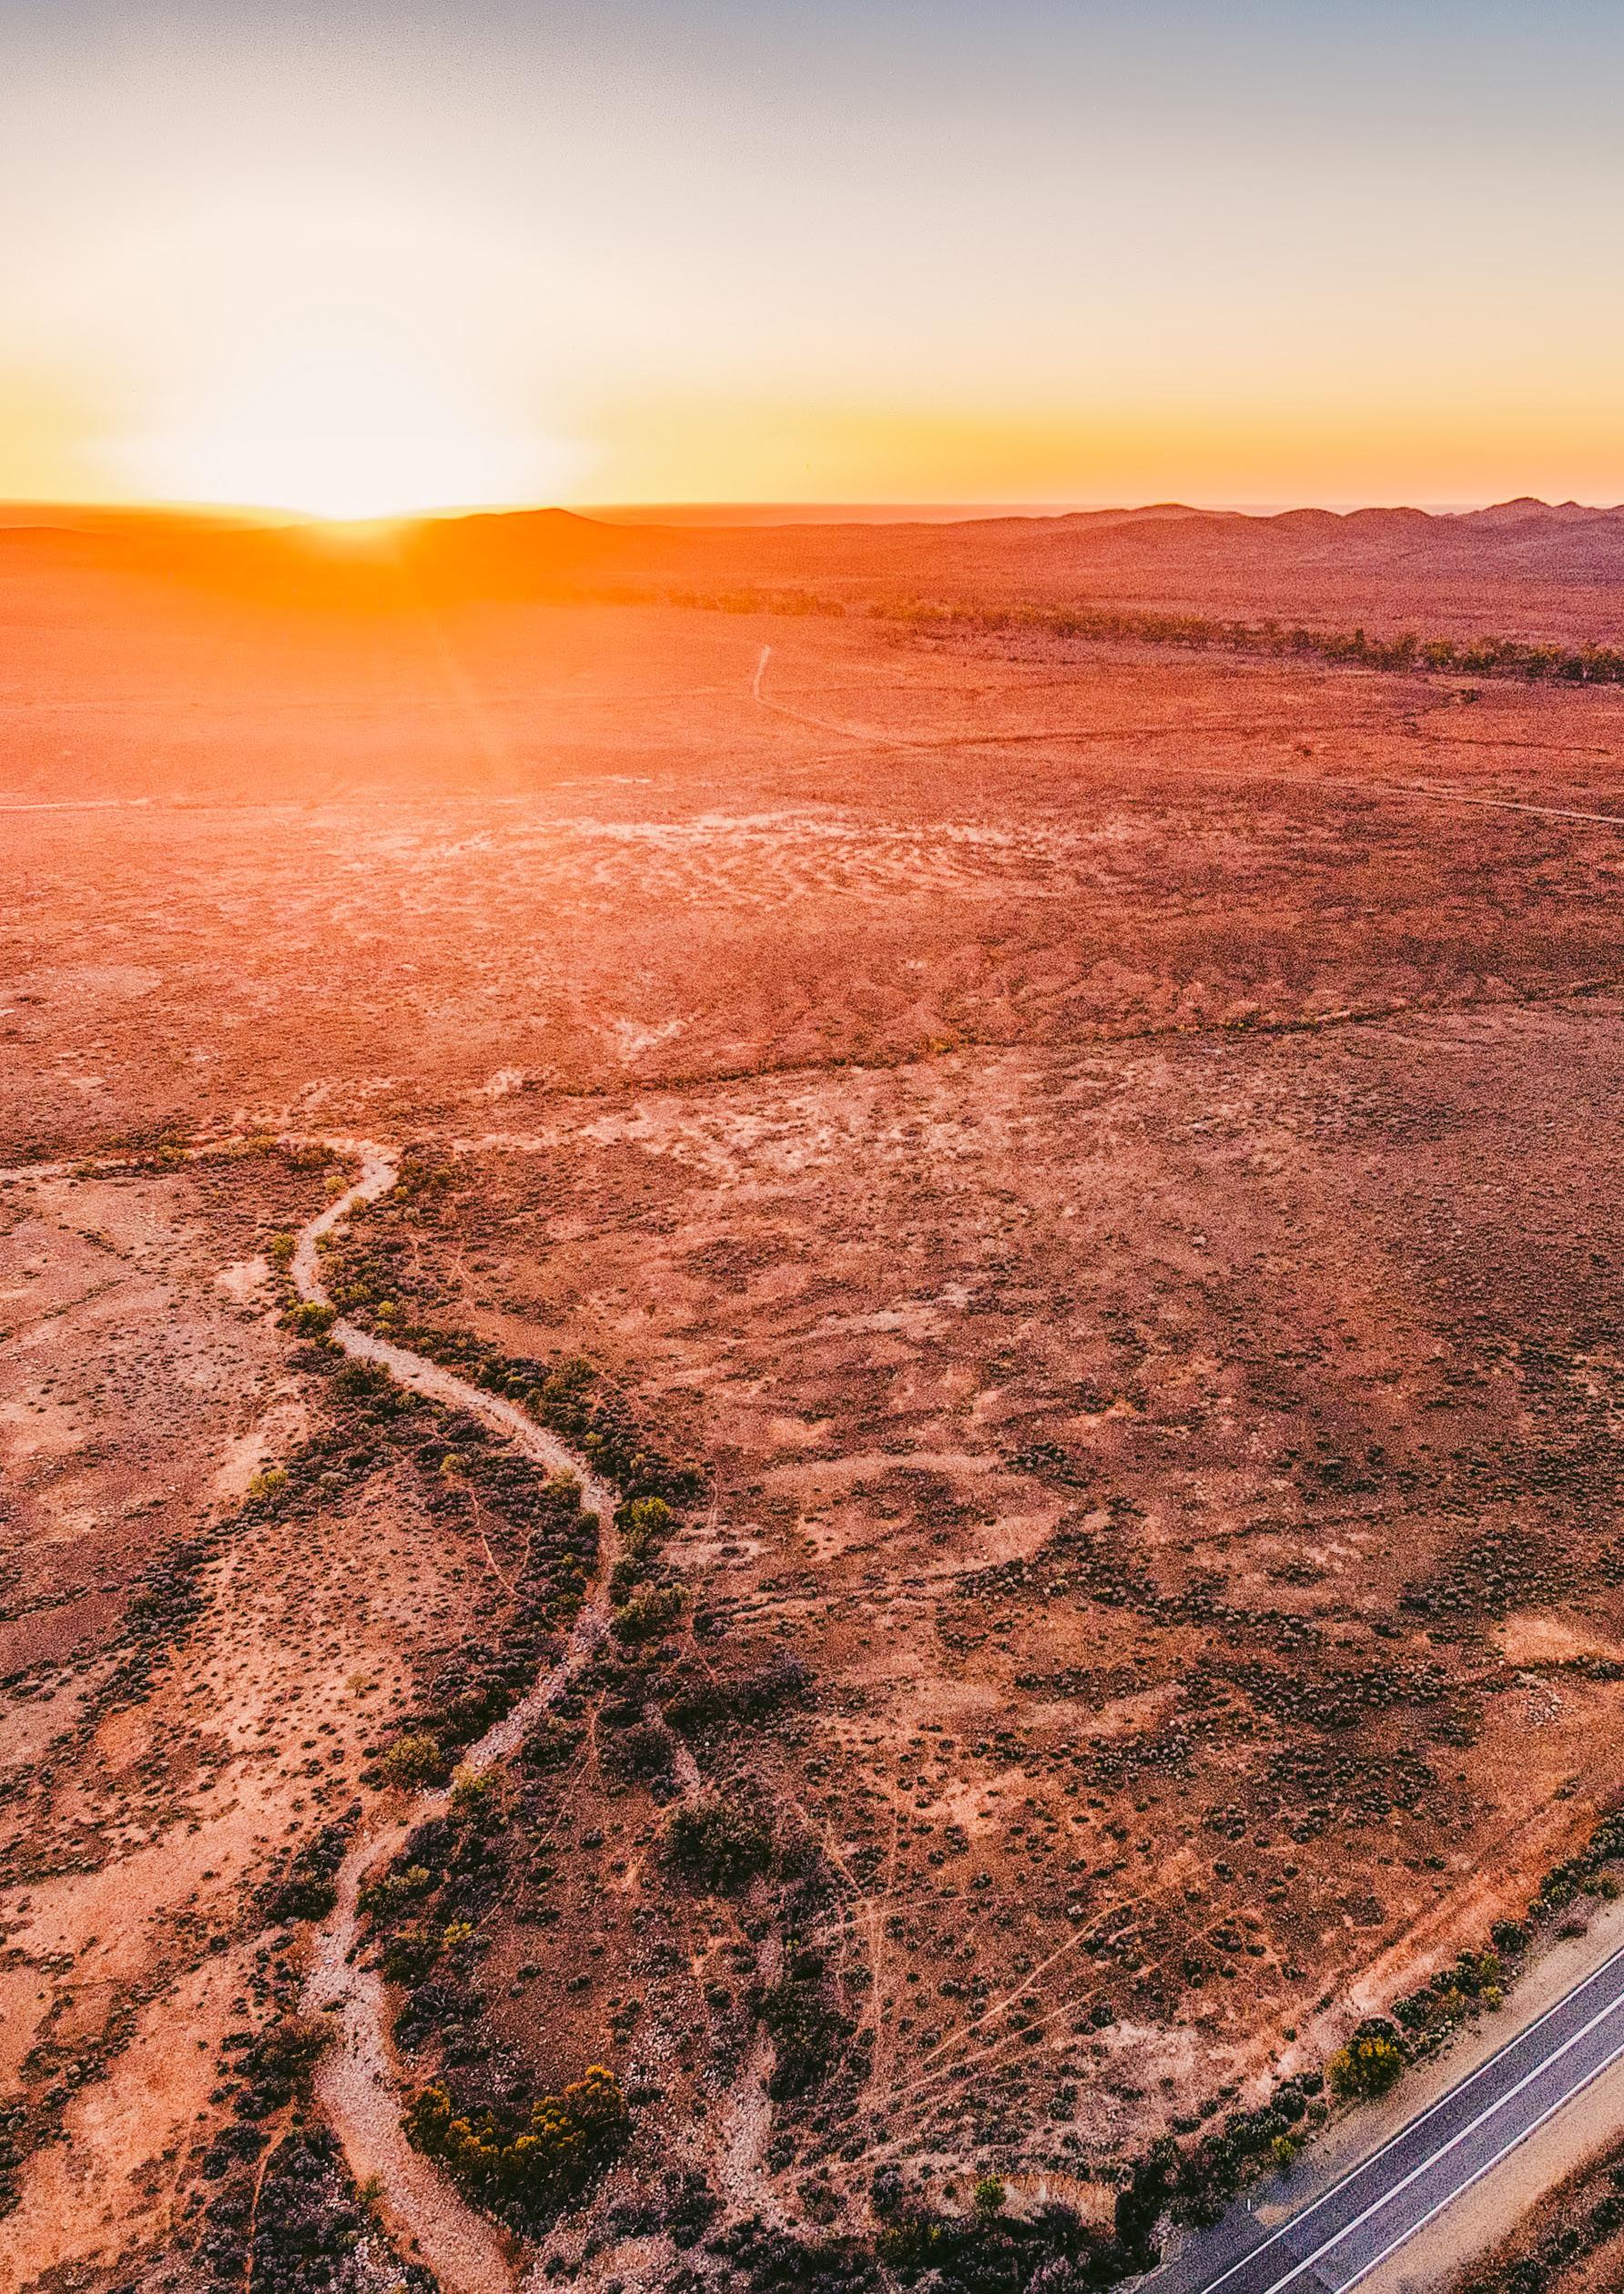 Phil Keen, State Real Estate Manager, South Australia
“Sales across South Australia over the last six months of 2022 eased slightly compared to the previous two years activity. Historically high grain, sheep and cattle commodity prices gave producers, who were contemplating selling, added confidence. Favourable financial returns are a big motivator to continue with agribusiness pursuits. Land prices continued to break local and district records across most areas of SA.”
Phil Keen State Real Estate Manager South Australia.Median price per hectare increased by 18.6pc in Q4 due strong growth in the Adelaide and Fleurieu and South East regions.
Transaction volume increased driven by the South East and Mallee Riverland regions. Transaction mix shifted towards smaller high value parcels across the state.
The calendar year results showed a significant increase in median price per hectare, up by 46.9pc to $6,346/ha after two years of flat growth. The South East, Yorke and Mallee Riverland regions drove the state result. Transaction volume declined by 8.3pc to 670, volume was mixed across regions with more activity in the South East and less in the Adelaide and Fleurieu
“Anecdotally, prices continue to trend upwards across WA, with a number of headline sales setting new benchmarks for the respective areas throughout the latter half of 2022 and into 2023.
“Cautious optimism remains the order of the day. As a generalisation, farmers across WA are in a strong financial position with aspirations to continue to expand, however all remain acutely aware of the vagaries of farming.”
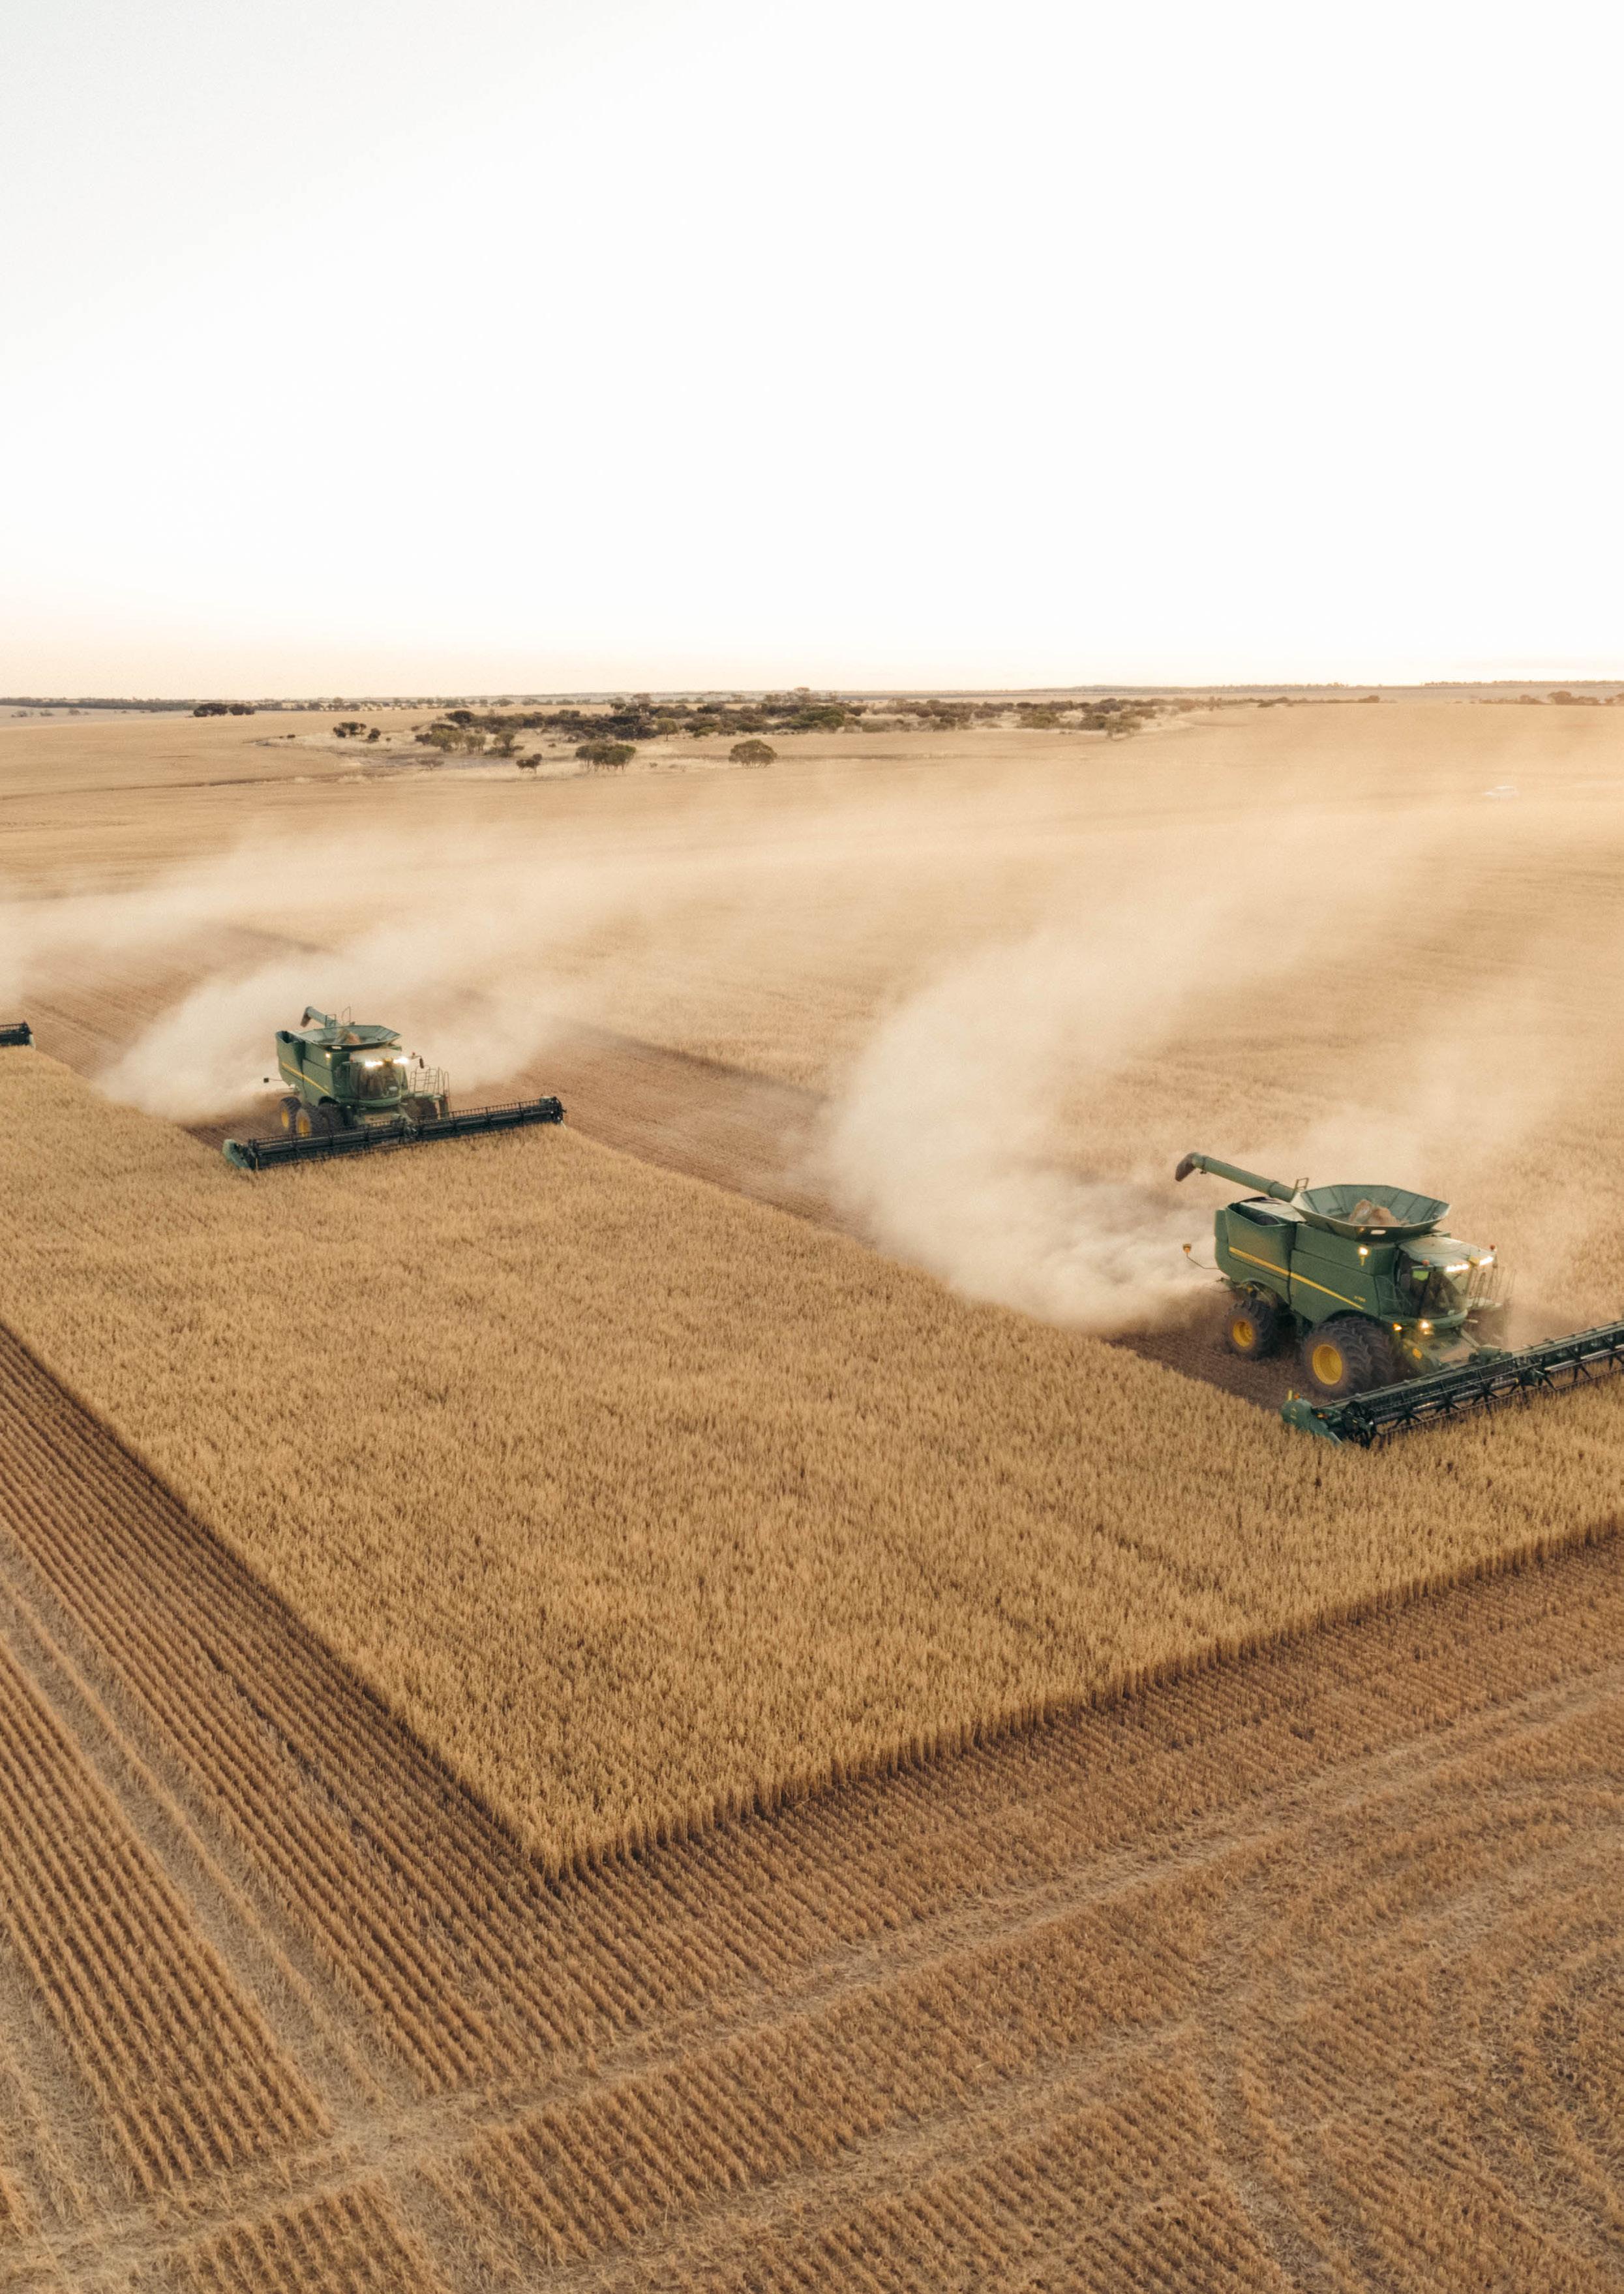 Simon Cheetham, Senior Rural Real Estate Executive Western Australia
Median price per hectare decreased by 8.4pc in Q4. The state result was driven by an increased proportion of larger parcels making up the overall mix. However, at region level there were strong increases in the Avon-Midland and South West regions.
Transaction volume remained relatively unchanged, with fewer sales in the Avon-Midland region and an increase in the Eastern and Great Southern regions.
The calendar year results showed an increase of 6.1pc taking the median price per hectare to $6,929/ ha, this follows a 41pc increase in 2021. The Central and Avon Midland regions performed strongly. Transaction volume declined sharply down by 24.5pc to 670.
“Farms with scale in the coveted medium to high rainfall cropping zones of WA are particularly scarce with the carbon sector having a growing influence on the property market. A handful of sellers across the state have taken the decision to offer their properties to market in March 2023, which is later than the norm for broadacre properties, however the majority of these have received strong interest with many sales pending.”
Simon Cheetham
Senior Rural Real Estate Sales Executive Western Australia
“Demand remains steady for both undeveloped grazing and cropping land, however with limited supply and challenges with subdivision, few properties of this type are available.
“Opprtunities in the carbon market have seen to be the unknown component to some high-priced sales late in 2022.
“Horticultural property listings have slowed with just the one larger mango operation for sale in the greater Darwin region. Demand has remained steady with both interstate producers and fund managers registering their interest.”
 Alison Ross, Rural Real Estate Specialist Northern Territory
We acknowledge the limited transaction volume in the NT increases short term volatility; quarterly data should be viewed with caution.
Median price per hectare increased sharply in Q4 driven by a shift in transaction mix with more sales coming from the higher priced Top End region.
The calendar year results showed a significant increase in median price per hectare, up 59.5pc to $2,267/ha. The increase follows a 44.5pc decline in 2021. This was largely driven by an increase in transaction volume, up 40.8pc to 69 with a higher percentage of sales occurring in the higher priced Top End region.
“Good rainfall across the Top End has been a refreshing return to a normal wet season. This has highlighted the challenges presented with access along main highways and arterial roads and re-enforces the need for continued investment in major infrastructure to develop the north. There has only been the one larger aggregation come to market for the second time, over the past three months.”
Alison Ross
Rural Real Estate Specialist
Territory
The value of rural property traded totalled $3 billion in Q4-2022, an increase of 13.3pc compared to Q3-2022. This was a function of strong price growth, very large one-o transactions and the transaction mix favouring smaller higher priced parcels of land.
 Executive Summary, page 6
The analysis above is replicated across 39 regions Australia wide, and is summarised by local government area. Elders clients enjoy exclusive access to these detailed levels of analysis and additional content via our expert real estate agents.
If you are considering selling or purchasing land, we encourage you to speak to our team and discover how expert local knowledge backed by data, can help you make an informed decision.


Media
E: Elders.Communications@elders.com.au
General Real Estate
W: eldersrealestate.com.au/contact-us/ Analysis
E: matt.ough@elders.com.au
State based Real Estate
Queensland – daniel.roberts@elders.com.au
New South Wales – richard.gemmell@elders.com.au
Victoria and Riverina (NSW) – nicholas.myer@elders.com.au
Tasmania - nicholas.myer@elders.com.au
South Australia – phil.keen@elders.com.au
Western Australia – simon.cheetham@elders.com.au
Northern Territory – alison.ross@eldersrealestate.com.au