RURAL PROPERTY UPDATE
January - March 2023


January - March 2023


Elders uses a range of analytical techniques to achieve robust and repeatable analysis. Our dataset is subject to the following criteria:
⋅ Only transactions above 40 hectares (ha) are included, except for Tasmania where transactions above 30ha are included.
⋅ Transactions which list a primary purpose that isn’t classed as rural are excluded. Local government areas (LGA’s) which fall within a metropolitan area are excluded from the analysis.
Vast pastoral areas of Australia without sufficient transaction volume are excluded from the analysis.
Outliers by price per hectare are excluded. This involves visual and statistical assessment of all $/ha values for a region, and this is performed every quarter.
Several data fields are available in the Elders dataset, including median price per hectare, transaction volume, value, area, date of sale and land use. The quarterly update focuses on median price per hectare growth and transaction volume expressed both as a total and split by land size.
This data is not intended to be a valuation of any one property and is merely a method of tracking growth over time for a given dataset.
Definitions within the update include:
CAGR – refers to the compound average growth rate for a given period.
QoQ – quarter on quarter growth
YoY – year on year growth
1yr rolling performance - the median price per hectare for one year from the latest data point. For example, the 1yr rolling median $/ha for Q1-2023 runs from 01/04/2022 to 31/03/2023; the next quarter will roll to the 01/07/2022 to 30/06/2023. The dataset changes by one quarter at a time which helps smooth out volatility and give an indication of long-term trends.
Elders rural property update draws on transactional data from every rural land sale in Australia. This data is supplied by Corelogic and analysed by Elders. Every effort is made to clean the data in order to provide an accurate account of price and volume movements.
Welcome to the Q1-2023 edition of the Elders Rural Property Update. The market remains strong and continues to be supported by low volumes of property coming onto the market. Continuing declines in total property sale volumes demonstrates strong confidence in the sector by Australian farmers.
There has been a change in the mix of properties coming onto the market in some regions causing some variation in results across states, but this does not indicate any shift in general price trends. One of the benefits of collecting and publishing property price data is that it enables our clients to understand what is driving changes in the market enabling more informed investment decisions. We match the data with experienced transaction specialists based across all major agricultural areas to give deep market insights.
Whilst there has been some short-term softening in commodity prices, other factors are likely to start driving further demand for land. As noted in previous editions, we are seeing increased demand for carbon credits and renewable energy, both of which are land intensive. We’ll be continuing to report on the impacts of these emerging drivers in future editions.
The chart above shows the historic relationship between rural property price drivers. Statistically, rural property prices correlate most strongly with commodity prices. Commodity prices will also have a reasonably strong link to farm incomes although production levels will vary the result.
Over time commodity prices have been trending higher, gaining pace from 2016 to a peak in May 2022. Strong export performance for a range of agricultural products and a period of restocking helped push commodity prices unusually high in 2021 and 2022. Farm incomes followed and so did rural property prices.
Interest rates do have a negative correlation with rural property values but it’s not to the degree that most would assume. Serviceability is impacted but on balance future returns remain positive and that’s something that gets factored into buying decisions.
The key difference with agriculture is the demand for the products that are produced and the store of wealth in the land itself. When interest rates rise and disposable incomes decline people won’t eat less food, demand is somewhat fixed, and a more likely outcome is substitution but not complete abandonment, as would happen to spending on some other goods and services.
Commodity prices have since settled back to 2020 levels while rural property prices have continued to climb, even with interest rates increasing at such a rapid pace, albeit from an
historically low base. The decline in commodity prices in 2022 and 2023 to date have largely stemmed from a correction in cattle prices after a period of rebuilding. However, demand for beef and Australia’s contribution to exports remains sound.
A fall in commodity prices doesn’t automatically translate to a fall in rural property prices. It can however change the transaction mix, often resulting in a higher percentage of sales in the mid to upper tier of pricing, a reflection of demand for quality listings.
On top of these other market factors is the changing landscape of property size and a contraction in transaction volume. In November 2022, Elders Market Insights published an article which noted that in 41.7 years there will be half the number of farms there are now in Australia. The rationalisation driven by a trend in bigger farms getting bigger. The ‘sweet spot’ for scalability in broadacre farming was around 2,000 hectares.
The article remains relevant to rural property price performance because scarcity is a factor that underpins the rural property market. Even in a scenario whereby operational returns weaken, the number of rural properties to buy in the future declines. Which is why agricultural land as an investment is looked upon favourably by those who understand the operational cycles of farming.
Mark Barber General Manager, Farmland Agency and Agribusiness InvestmentsElders Rural Property Update Q1-2023 shows that the one year rolling national median price per hectare increased by 1.9pc to $7,852/ha. The primary driver of the increase being tight supply with the transaction mix favouring higher priced properties.
The results were similar at state level, with increases recorded for four of the seven states and territories analysed. The largest increase in the one year rolling median price per hectare was in South Australia, increasing by 5.7pc.
Buyside factors softened further in Q1-2023 and have continued that trend into Q2-2023 which has caused a divergence between the median price per hectare index and the commodity price index. The relationship between the two variables suggests there could be more subdued growth in median price per hectare in 2023 given the outlook for softer commodity prices is expected to continue in the short term.
These factors could be partially offset by tight supply which will continue to play a role in demand for quality properties as will seasonal conditions which despite drier forecasts have so far proved favourable across much of the country.
Elders Rural Property Update aggregates transaction data from 39 regions across Australia. To get in touch please refer to the ‘For More Information’ page at the end of this update.
As transaction volume declines there is evidence of more volatility in the dataset, particularly when changing from one season to the next. With that in mind Elders has put the focus of this edition onto the 1yr rolling median price per hectare and transaction volume to help smooth out seasonality in the dataset.
Buyside drivers softened further in Q1-2023 led by a fall in sheep and cattle prices. Resulting in the largest divergence between the national median price per hectare and commodity price indexes since Q3-2020. It is likely the commodity price index will remain at present levels for most of 2023 which could suggest more subdued growth in the median price per hectare given the historically strong relationship between the two variables.
A fall in commodity prices doesn’t automatically translate to a fall in rural property prices. Analysis during 2023 will be telling as to which way rural property prices and commodity prices move because there are other factors at play. The rural property market remains tightly held which will play a role in where median price per hectare trends in 2023. We know that the first quarter of the calendar year is seasonally influenced by a higher proportion of lower priced cropping land compared to the transaction mix for the remainder of the year.

⋅ Australian grain prices have adjusted for 2023 with barley down (-37pc YoY), wheat (-30pc YoY) and canola (-30pc YoY). Beef prices are down (-48pc YoY) and trade lamb (-26pc YoY). Wool prices are down (-12pc YoY) while farm gate milk prices are up by approximately (+1.7pc YoY).
⋅ Medium size business interest rates increased by 0.2pc during Q1-2023 taking the average rate to 5.68pc, however, interest rates in this category eased -0.12pc in Q2-2023 averaging 5.56pc. Large business rates increased by 0.2pc in Q1-2023 taking the average rate to 4.97pc, increasing further in Q2-2023 to 5.05pc.
⋅ Debt to Agriculture, Forestry and Fishing increased by 1.8pc in Q1-2023 to $108.9 billion compared to Q4-2022. The monthon-month debt balance increased further in April to $110.7 billion.
⋅ The National Farm Management Deposit (FMD) balance declined by 0.9pc in Q1-2023 to $5.82 billion, which is 10.3pc higher than Q1-2022. As at the end of May 2023 FMD balance was $5.83 billion, 10.1pc higher than May 2022.
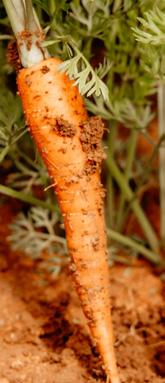
Interest rates do have a negative correlation with rural property values but it’s not to the degree that most would assume. Serviceability is impacted but on balance future returns remain positive and that’s something that gets factored into buying decisions.
Foreword, Page 5


LARGEST PERCENTAGE INCREASE
MOST VALUABLE
SMALLEST PERCENTAGE INCREASE
2,591 New South Wales
6,344
made nationwide from 2022 to 2023

The one year rolling median price per hectare increased by 1.9pc to $7,852/ha in Q1-2023. The fifteenth consecutive quarter of growth.
The one year rolling transaction volume declined by 6pc to 6,344 in Q1-2023, the seventh consecutive quarter of decline.
National median price per hectare was driven by a seasonal shift towards cropping dominant sales which characteristically sell for a lower price per hectare.
“Continued low transaction volumes point to strong confidence in the sector by Australian farmers. The results also point to a change in the mix of properties coming onto the market. This makes it more important to get expert local advice from our experienced team.”
Mark Barber
Elders GM Farmland Agency & Agribusiness Investments, Australia.
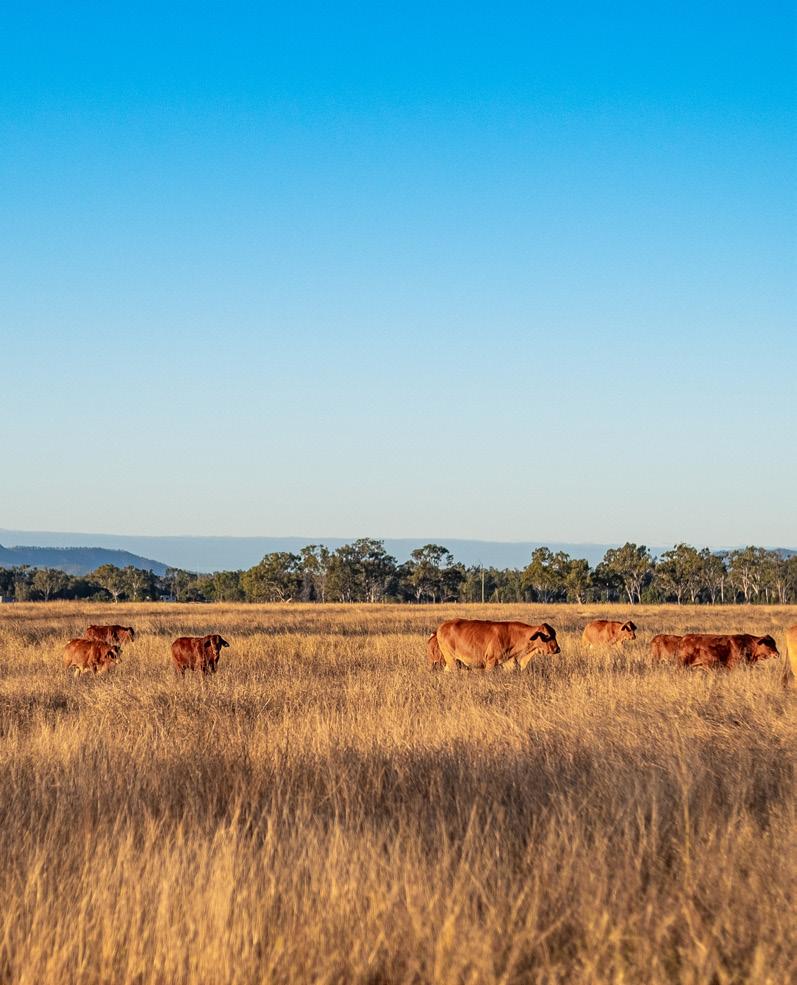
The one year rolling median price per hectare increased by 2.3pc to $6,430/ha in Q1-2023. The sixth consecutive quarter of growth. The one year rolling transaction volume declined by 5.7pc for the quarter to 1,463, the second consecutive quarter of decline.
Median price per hectare increased in Q1-2023, driven by strong growth in the North and South regions. Transaction volume favoured the larger parcels in the West and Central regions compared to the previous quarter.
“The supply of commercial scale listings across the state is tightening up at present which should continue to support the current rates per ha seen over the last 3-6 months. July will be a good guide to see if interest rates, commodity prices and access to capital start to affect the buy side of a transaction. To date there has not been any evidence of that with demand for scalable property still strong.”
Tim Lane State Manager Real Estate, QLD/NT
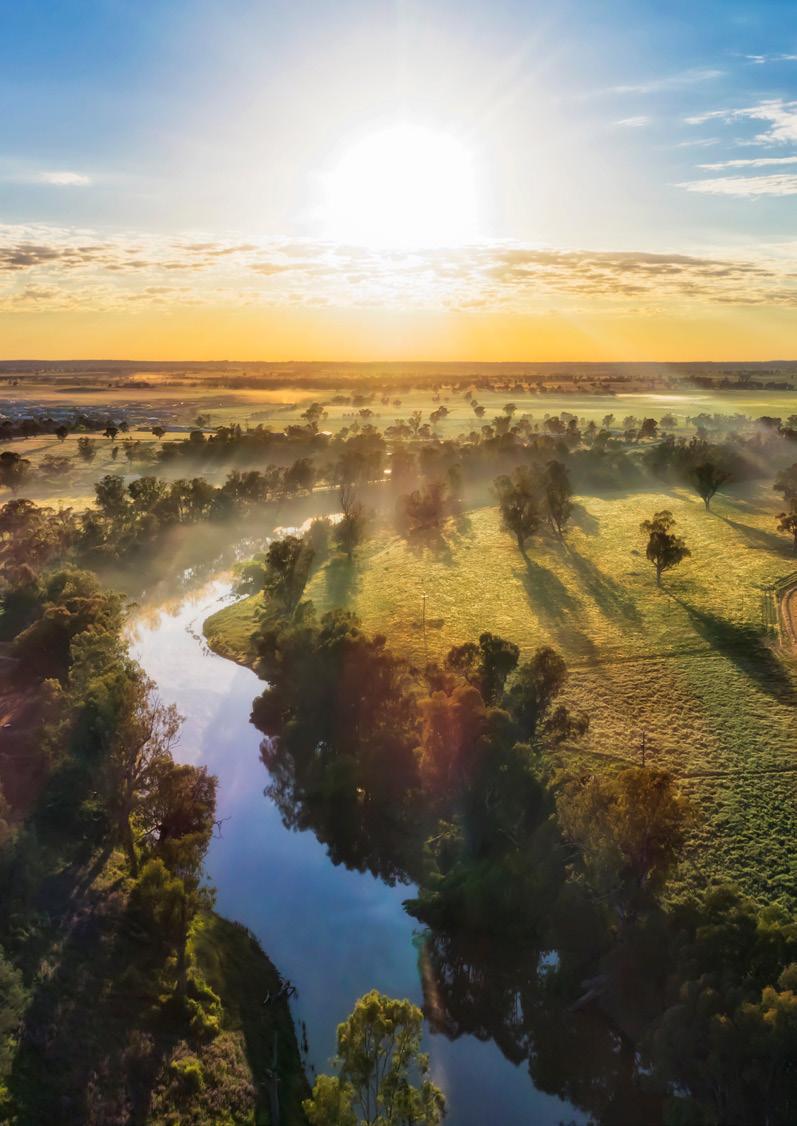
“Strong inquiry continued across all categories of rural land for the first quarter, together with an expected increase in listings from the previous quarter. Sales achieved of both grazing and cropping country exceeded expectations with the view that listings would decrease as winter approaches. Seasonal conditions will continue to play an important role in decision making as the winter crop sowing window remains ajar awaiting beneficial rains.”
Richard Gemmell State Real Estate Manager,The one year rolling median price per hectare increased by 2.3pc to $8,185/ha in Q1-2023, driven by increases in the Hunter, North Coast and Riverina regions. The tenth consecutive quarter of growth. The one year rolling transaction volume declined by 4.7pc for the quarter to 2,591, the sixth consecutive quarter of decline.
Most of decline in transaction volume in Q1-2023 came from the Riverina Murray and South East regions.
NSW
 Real Estate Manager
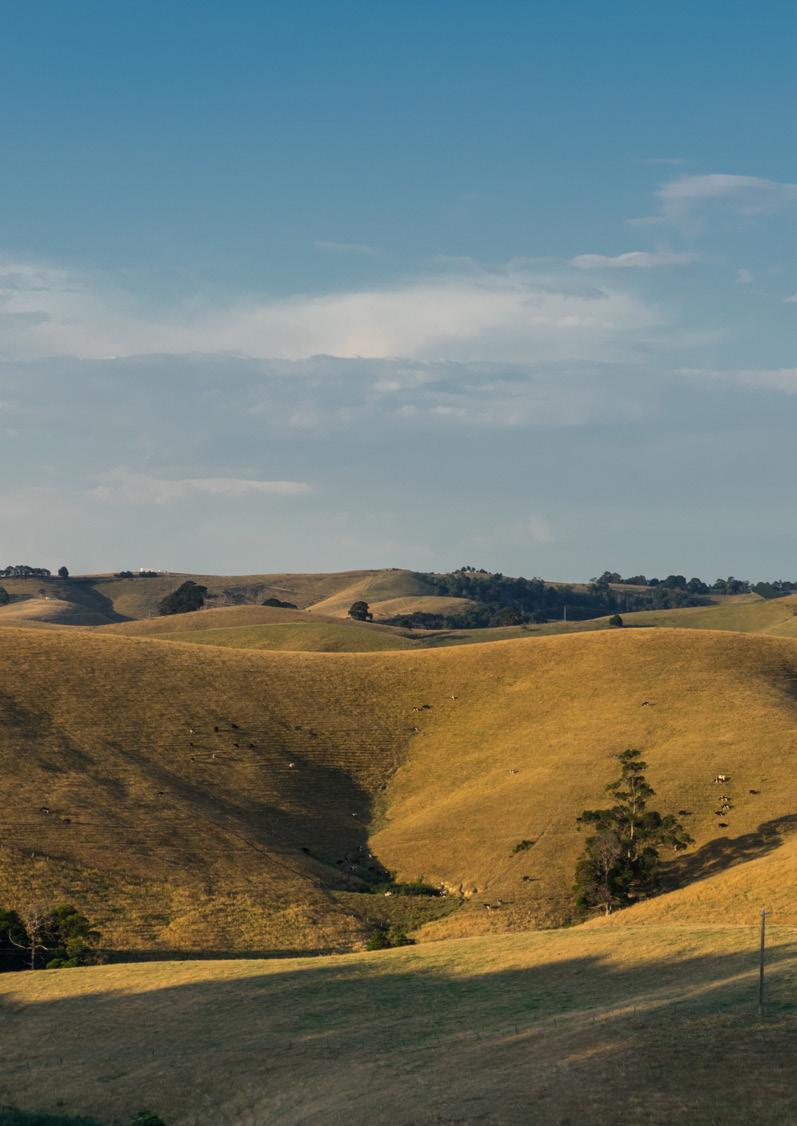
The one year rolling median price per hectare increased by 0.6pc to $12,597/ha in Q1-2023, driven by growth in Gippsland and the South West region. The third consecutive quarter of growth.
The one year rolling transaction volume declined by 8.9pc for the quarter to 818, the seventh consecutive quarter of decline.
Transaction volume decreased sharply, shifting the transaction mix in favour of larger parcels in the Wimmera-Mallee.
“All regions of Victoria and the Riverina witnessed strong enquiry throughout Quarter 1 of 2023, with quality assets continuing to be met with strong demand and excellent sale results being recorded across all industry sectors.”
Nick Myer State

The one year rolling median price per hectare decreased by 6.9pc to $9,786/ha in Q1-2023, driven by a contraction in higher priced parcels in the North West region. The second consecutive quarter of decline.
The one year rolling transaction volume declined by 8.9pc for the quarter to 102, the second consecutive quarter of decline.
Transaction volume decreased sharply in Q1 to 13, driven by fewer sales in the Southern region.
“Enquiry levels have remained strong over all asset classes in Quarter 1 of 2023 with certain regions witnessing record sale averages. The demand for rural assets continues to stem from a combination of local, mainland and international investors. We expect this trend to continue throughout the balance of the year.”
Nick Myer State Real Estate Manager Victoria/Riverina and Tasmania
The one year rolling median price per hectare increased by 5.7pc to $6,708/ha in Q1-2023, driven by a larger proportion of lower priced cropping parcels selling in the first quarter of the year. The seventh consecutive quarter of decline.
The one year rolling transaction volume increased by 2.2pc in Q1-2023 to 685 after three quarters of decline.
Transaction volume increased driven by high volumes on the Eyre and Yorke Peninsula’s.
“Cropping areas continue to perform strongly with examples of record prices in some areas. Grazing property demand has slowed driven by softer livestock prices. We have seen some hesitation with potential sellers going to market despite close to or record high land prices.”
Phil Keen State Real Estate Manager South Australia.
The one year rolling median price per hectare decreased by 0.7pc to $6,306/ha in Q1-2023, driven by a seasonal increase in lower price per ha parcels of land as a proportion of total sales in the Eastern and Central regions. However, growth remained positive at regional level particularly for Eastern WA.
The one year rolling transaction volume decreased by 13.5pc in Q1-2023 to 649 the seventh consecutive quarter of decline.
Transaction volume declined with fewer sales in the Great Southern and South West regions.
“Supply of quality farmland has remained tight for some time, as noted by the drop in transaction volumes across the state. Buyer demand remains strong, with several transactions recently negotiated off market. Qualified buyers are positioning themselves to purchase those properties to be marketed during our late Winter / Spring selling season.”
Simon Cheetham
Senior Rural Real Estate Sales Executive Western Australia
 Rural Real Estate Specialist Northern Territory
We acknowledge the limited transaction volume in the NT increases short term volatility; quarterly data should be viewed with caution.
The one year rolling median price per hectare decreased by 8.1pc to $2,084/ha in Q1-2023, driven by a shift in transaction mix with more sales coming from the lower priced Outback regions where properties are much larger.
The one year rolling transaction volume decreased by 17.4pc in Q1-2023 to 57 after two consecutive quarters of
“The demand for both pastoral and farming land across the top end remains strong. Whilst there has been recent uncertainty around quarantine matters with Lumpy Skin detections in Indonesian feedlots, investors are still looking for agricultural investments for long term supply of beef. The cotton gin is moving closer to completion with most cotton now harvested and baled in the north, many producers have chosen to stockpile to avoid added freight costs for processing. There is continued demand for mixed farming operations, preferably freehold, and with the shortage of supply of this type of property, prices will remain strong.”
Alison Ross
A fall in commodity prices doesn’t automatically translate to a fall in rural property prices. Analysis during 2023 will be telling as to which way rural property prices and commodity prices move because there are other factors at play.
Key Drivers, Page 7
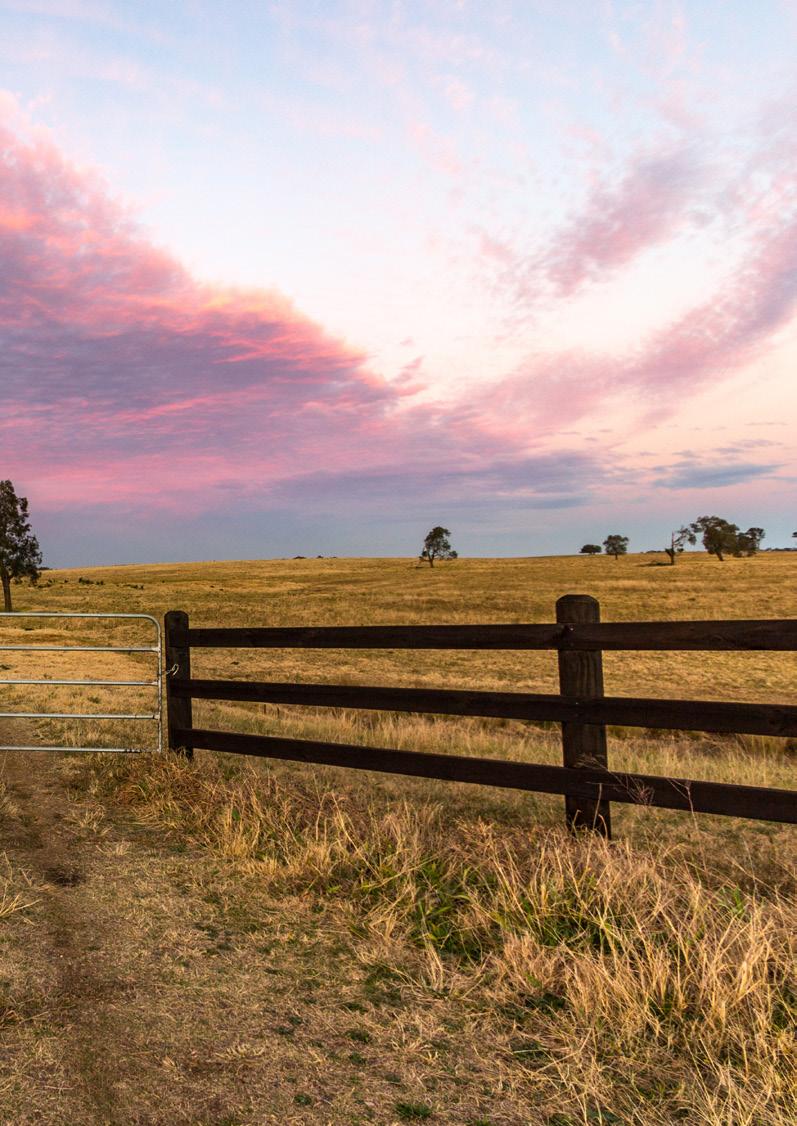
The analysis above is replicated across 39 regions Australia wide, and is summarised by local government area. Elders clients enjoy exclusive access to these detailed levels of analysis and additional content via our expert real estate agents.
If you are considering selling or purchasing land, we encourage you to speak to our team and discover how expert local knowledge backed by data, can help you make an informed decision.

Media
E: Elders.Communications@elders.com.au
General Real Estate
W: eldersrealestate.com.au/contact-us/ Analysis
E: matt.ough@elders.com.au
State based Real Estate
Queensland – tim.lane@elders.com.au
New South Wales – richard.gemmell@elders.com.au
Victoria and Riverina (NSW) – nicholas.myer@elders.com.au
Tasmania - nicholas.myer@elders.com.au
South Australia – phil.keen@elders.com.au
Western Australia – simon.cheetham@elders.com.au
Northern Territory – alison.ross@eldersrealestate.com.au