RURAL PROPERTY UPDATE
April – June 2023


April – June 2023


Elders uses a range of analytical techniques to achieve robust and repeatable analysis. Our dataset is subject to the following criteria:
⋅ Only transactions above 40 hectares (ha) are included, except for Tasmania where transactions above 30ha are included.
⋅ Transactions which list a primary purpose that isn’t classed as rural are excluded. Local government areas (LGA’s) which fall within a metropolitan area are excluded from the analysis.
Vast pastoral areas of Australia without sufficient transaction volume are excluded from the analysis.
Outliers by price per hectare are excluded. This involves visual and statistical assessment of all $/ha values for a region, and this is performed every quarter.
Several data fields are available in the Elders dataset, including median price per hectare, transaction volume, value, area, date of sale and land use. The quarterly update focuses on median price per hectare growth and transaction volume expressed both as a total and split by land size. This data is not intended to be a valuation of any one property and is merely a method of tracking growth over time for a given dataset.
Definitions within the update include:
CAGR – refers to the compound average growth rate for a given period.
QoQ – quarter on quarter growth
YoY – year on year growth
1yr rolling performance - the median price per hectare for one year from the latest data point. For example, the 1yr rolling median $/ha for Q2-2023 runs from 01/07/2022 to 30/06/2023; the next quarter will roll to the 01/07/2022 to 30/06/2023. The dataset changes by one quarter at a time which helps smooth out volatility and give an indication of long-term trends.
Elders rural property update draws on transactional data from every rural land sale in Australia. This data is supplied by Corelogic and analysed by Elders. Every effort is made to clean the data in order to provide an accurate account of price and volume movements.
Elders is pleased to present the Q2 2023 Rural Property Update. This report shows that Australian rural property values have remained strong with small gains in the rolling 1-year median price across most regions. Perhaps the most important aspect of the of the report this quarter is the continued decline in the volume of properties coming onto the market. This quarter is the sixteenth successive quarter of a decline in total property turnover by number.
Low volumes indicate that property owners are seeing through short term commodity price volatility and seasonal conditions and are making a conscious decision to continue to invest in agricultural land. This confidence, combined with the strength in farm balance sheets, familiarity with advantages of investing in the agricultural sector, are very supportive of land values. Those wishing to buy need to take this into account.
The low volumes are also increasing the amount of enquiry we are fielding for a range of properties where buyers, unable to find what they are looking for on-market, are asking our team to find them properties that meet their investment criteria.
International interest in Australian farmland shows no sign of waning with increased inquiry and a range of new funds being launched by institutional fund managers. Whilst institutional investors still make up a relatively small proportion of total
land ownership in Australia, they are important participants in the market. The current weakness in the AUD compared to the USD increases the attractiveness of Australian farmland for offshore investors. Alternative land uses, such as carbon and biodiversity offsets and credits, are also encouraging a range of new entrants, many of which have no previous experience in the market.
Elders publishes the RPU to inform property owners and potential buyers of the trends in the property market over time. To make the most of valuable information, it is important to discuss with one of experience team familiar with your local market, what the trends mean for your property. There are a wide range of factors that contribute to individual property value, and local market conditions.
Elders is the only Rural Real Estate Company that has the combination of corporate research and analysis, and deep local knowledge and insights. Our agents don’t crisscross the country servicing their clients, we have experienced local agents with deep local knowledge, supported by our national network.
Mark Barber General Manager, Farmland Agency and Agribusiness InvestmentsElders Rural Property Update Q2-2023 shows that the one year rolling national median price per hectare increased by 0.1pc to $7,958/ha. The primary driver of the increase was strong growth in prices in Tasmania and Victoria against a backdrop of tight supply across the country.
The results at state level were mixed, with increases recorded for four of the seven states and territories analysed while median price remained unchanged in Queensland and Western Australia. The largest increase in the one year rolling median price per hectare was in Tasmania, increasing by 19pc. In contrast, South Australia recorded a decline of 4.1pc compared to last quarter.
Buyside factors softened further in Q2-2023 as commodity prices declined across most markets. Meanwhile, Farm Management Deposit (FMD) balances recorded a healthy increase as farmers hold more cash in the system. Supply once again remains tight across the country offering up limited buying opportunities with transaction mix in most states favouring higher quality properties, holding median price per hectare values higher.
Elders Rural Property Update aggregates transaction data from 39 regions across Australia. To get in touch please refer to the ‘For More Information’ page at the end of this update.
As transaction volume declines there is evidence of more volatility in the dataset, particularly when changing from one season to the next. With that in mind Elders has put the focus of this edition onto the 1yr rolling median price per hectare and transaction volume to help smooth out seasonality in the dataset.
Buyside drivers softened further in Q2-2023 with both sheep and cattle prices dragging the index lower. Commodity price and the national median price per hectare do historically track together, however, rural property prices are holding firm against a backdrop of tight supply.
The traditional Spring supply peak is expected to bring several properties to market, however, wet weather in southern states has made for a slower start. Recent highs in Farm Management Deposit (FMD) balances highlight good levels of cash in the system, which is likely a strategic move from farmers in the face of softer commodity prices. However, many have been starved of opportunities to buy and we expect purchasing power to remain strong for suitable listings.


Australian grain prices show canola down (-18pc YoY), barely down (-13pc) and wheat down (-12pc YoY). Beef prices are down (-57pc YoY) and trade lamb down (-38pc YoY).
Medium size business interest rates increased by 0.5pc during Q2-2023 taking the average rate to 6.04pc.
⋅ Large business rates increased by 0.5pc in Q2-2023 taking the average rate to 5.59pc.
⋅ Debt to Agriculture, Forestry and Fishing increased by 8.8pc in Q2-2023 to $118.5 billion compared to Q1-2023. The monthon-month debt balance decreased in July to $116.8 billion.
⋅ The National Farm Management Deposit (FMD) balance increased by 22pc in Q2-2023 to $7.1 billion driven by the end of financial year. As at the end of July 2023 FMD balance was $6.2 billion, 2.6pc higher than July 2022.
Q2-2023 shows that the one year rolling national median price per hectare increased by 0.1pc to $7,958/ha. The primary driver of the increase was strong growth in prices in Tasmania and Victoria against a backdrop of tight supply across the country.
Executive Summary, Page 6

LARGEST PERCENTAGE INCREASE
MOST VALUABLE
SMALLEST PERCENTAGE INCREASE
MOST TRANSACTIONS
2,365 New South Wales TRANSACTIONS made nationwide from Q1-2023 to Q2-2023
6,180 Nationwide

The one year rolling median price per hectare increased by 0.1pc to $7,963/ha in Q2-2023. The sixteenth consecutive quarter of growth.
The one year rolling transaction volume declined by 9.1pc to 6,180 in Q2-2023, the eighth consecutive quarter of decline.
National median price per hectare edged higher in Q2-2023 driven by strong gains in Tasmania and Victoria.
“The low volumes are increasing the amount of enquiry we are fielding for a range of properties where buyers, unable to find what they are looking for on-market, are asking our team to find them properties that meet their investment criteria.”
Mark Barber Elders GM Farmland Agency & Agribusiness Investments, Australia.

The one year rolling median price per hectare remained unchanged at $6,500/ha in Q2-2023. The one year rolling transaction volume declined by 7.7pc for the quarter to 1,469, the third consecutive quarter of decline.
Median price per hectare increased in the North and West regions. Transaction volume favoured the larger parcels in the North and Central regions compared to the previous quarter.
“Our agents continue to field enquiry for quality assets at scale with listings difficult to source as reflected in the transaction data summary. This has supported the current price levels being achieved in the market to date.”
Tim Lane State Manager Real Estate, QLD/NT
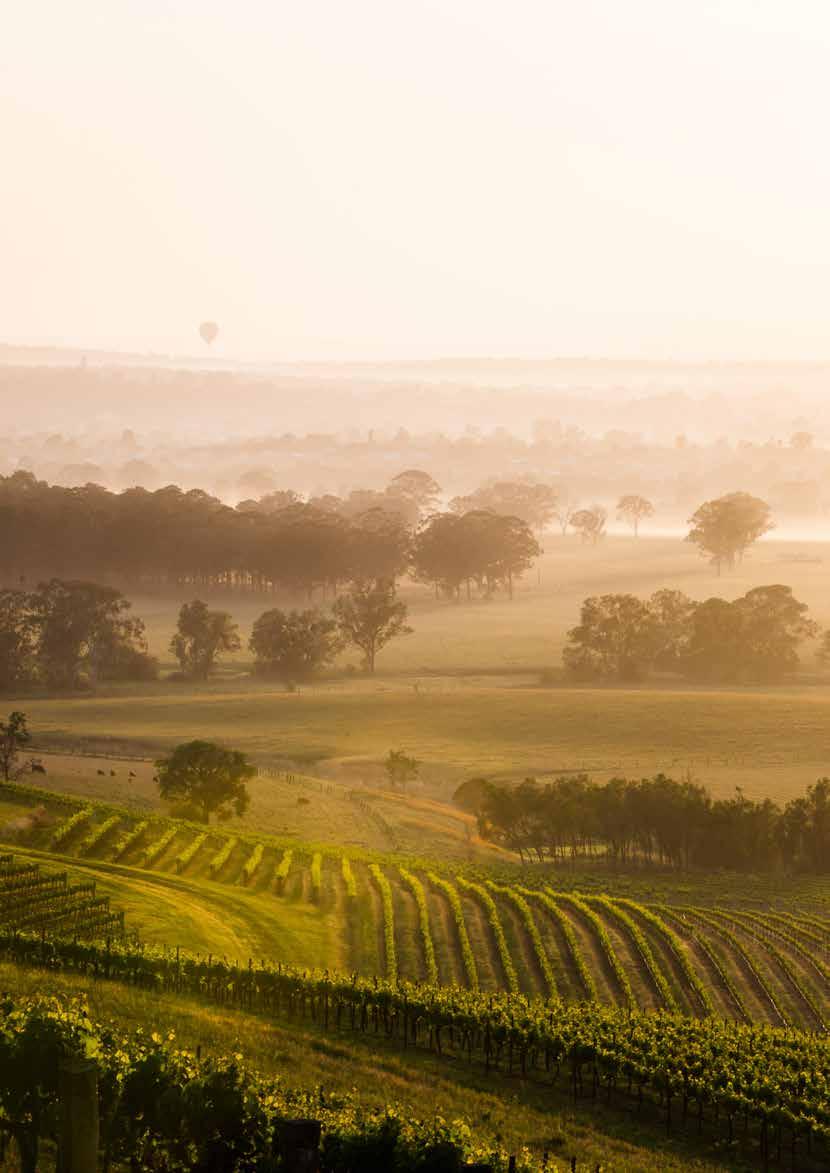
The one year rolling median price per hectare increased by 2.3pc to $8,297/ha in Q2-2023, driven by increases in the Northern Tablelands, South East and Riverina regions.
The one year rolling transaction volume declined by 11.7pc for the quarter to 2,365, the seventh consecutive quarter of decline.
Most of decline in transaction volume in Q2-2023 came from the Riverina Murray and North West regions.
“Demand and sales continue for property whilst remaining strong for well-presented large scale farms. With less buyers in the market for small to medium farms, we are seeing longer periods on market with vendors aligning their expectations. With various factors effecting the rural market, farmland offering differing production streams may deliver differing market results. The season will continue to impact on production and income as we head into the hotter months.”
Richard Gemmell State Real Estate Manager, NSW
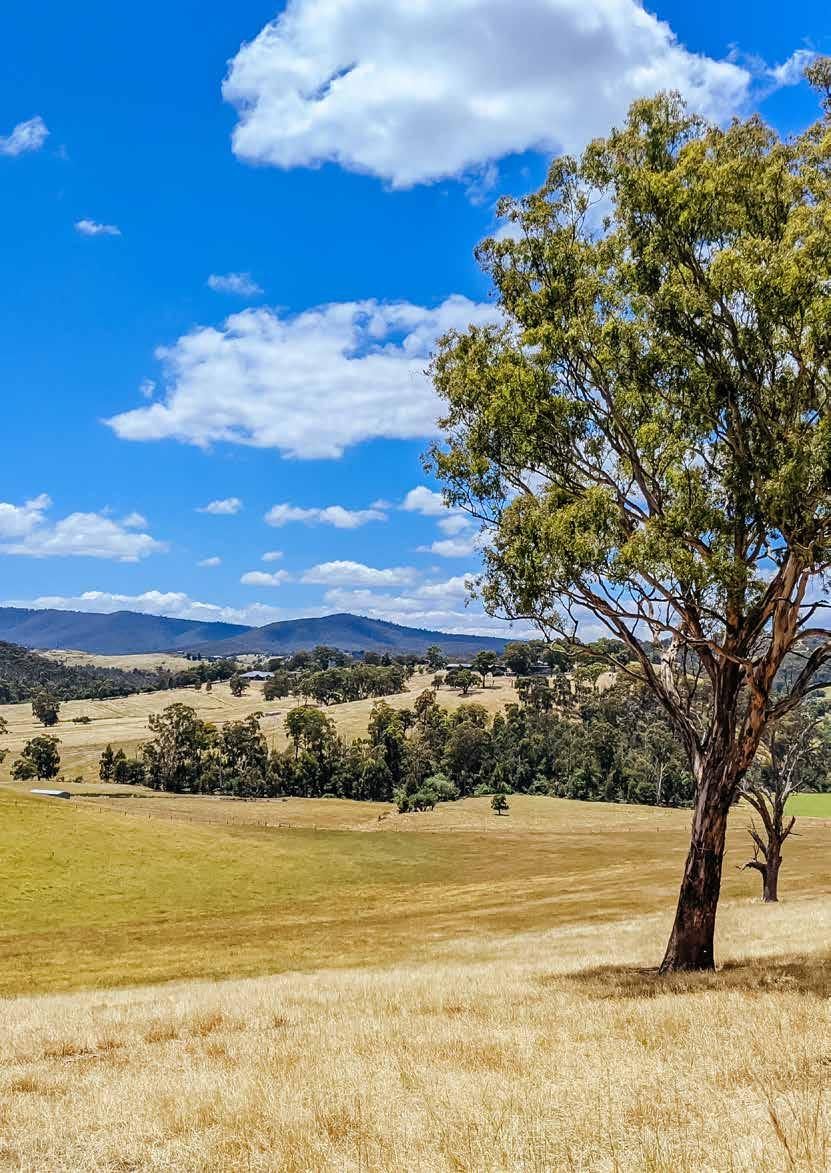
The one year rolling median price per hectare increased by 4.5pc to $13,475/ha in Q2-2023, driven by growth in the Central and South Central regions. The one year rolling transaction volume declined by 13.6pc for the quarter to 788, the eighth consecutive quarter of decline. Transaction volume decreased sharply in the Wimmera-Mallee and South West regions.
Median $/ha distribution by region
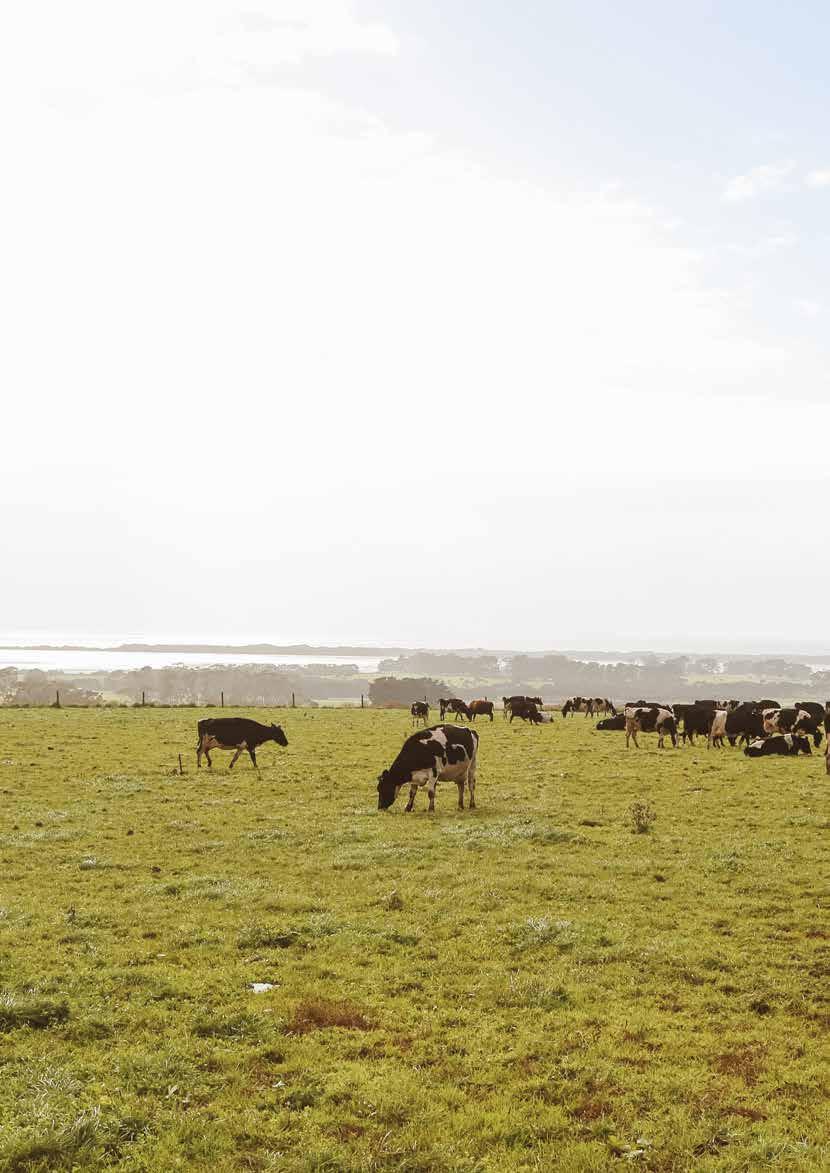
The one year rolling median price per hectare increased by 19pc to $12,896/ha in Q2-2023, driven by an increase in the North West region. The one year rolling transaction volume declined by 5.2pc for the quarter to 127, the third consecutive quarter of decline. Transaction volume decreased in the Northern region of the state which was partially offset by an increase in the South.
Median $/ha distribution by region Transaction distribution by region
The one year rolling median price per hectare decreased by 4.1pc to $6,652/ha in Q2-2023, driven by a larger proportion of lower priced cropping parcels selling in Mallee Riverland region.
The one year rolling transaction volume decreased by 3.2pc in Q2-2023 to 674.
Transaction volume declined most significantly in the South East and Adelaide Fleurieu region.
“Demand for arable cropping country in SA continues strongly buoyed by strong grain prices supported by what is shaping as another potentially excellent harvest across much of the state. Properties suitable for livestock production are receiving interest and sales are being transacted though more subdued than 6 months ago. The impact of the current commodity price drop with lamb, mutton and beef is yet to be properly tested with many Spring property campaigns now underway.”
Phil Keen State Real Estate Manager South Australia.
 Simon
Senior Rural Real Estate Sales Executive Western Australia
The one year rolling median price per hectare remained unchanged at $6,552/ha in Q2-2023. The Northern and South West regions recorded steady growth but that was offset by slight declines elsewhere.
The one year rolling transaction volume decreased by 4pc in Q2-2023 to 719 the eighth consecutive quarter of decline.
Transaction volume declined in the Great Southern and Central regions.
“Throughout WA, quality farms that came onto the market during late Winter and early Spring generally received very strong interest. Prices achieved to date often exceeding initial seller expectations, in many cases setting new district benchmarks per arable hectare, particularly land suited to cropping in WA’s high and medium rainfall zones.”
Cheetham
 Rural Real Estate Specialist Northern Territory
We acknowledge the limited transaction volume in the NT increases short term volatility; quarterly data should be viewed with caution.
The one year rolling median price per hectare decreased by 1.7pc to $2,191/ha in Q2-2023, driven by a slight decline in values in the Top End region.
The one year rolling transaction volume decreased by 1.7pc in Q2-2023 to 58.
“The top end is reliant on trade relationships with southeast Asia and for the live export market. Recent government talks have strengthened the relationships for the support of live export. Certainly, a tightening market has brought prices back and a stricter requirement of specifications leaving a slight over supply, however the demand for quality Australian produce remains strong. Weather is starting to warm up in line with normal seasonal conditions, and rain should start to be seen as we move into October and November across the north.”
Alison Ross

The traditional Spring supply peak is expected to bring several properties to market, however, wet weather in southern states has made for a slower start. Recent highs in Farm Management Deposit (FMD) balances highlight good levels of cash in the system, which is likely a strategic move from farmers in the face of softer commodity prices. However, many have been starved of opportunities to buy and we expect purchasing power to remain strong for suitable listings.
Key Drivers, Page 7

The analysis above is replicated across 39 regions Australia wide, and is summarised by local government area. Elders clients enjoy exclusive access to these detailed levels of analysis and additional content via our expert real estate agents.

If you are considering selling or purchasing land, we encourage you to speak to our team and discover how expert local knowledge backed by data, can help you make an informed decision.
Media
E: Elders.Communications@elders.com.au
General Real Estate
W: eldersrealestate.com.au/contact-us/
State based Real Estate
Queensland – tim.lane@elders.com.au
New South Wales – richard.gemmell@elders.com.au
Victoria and Riverina (NSW) – nicholas.myer@elders.com.au
Tasmania - nicholas.myer@elders.com.au
South Australia – phil.keen@elders.com.au
Western Australia – simon.cheetham@elders.com.au
Northern Territory – alison.ross@eldersrealestate.com.au