1 minute read
Act One - Preston Cartographically I.I Preston Demographically


Preston is a fairly rural area with vast zones of the area having a low population density. The central suburban zone has increasingly dense population heading toward the city centre. Population trends show a huge increase in population since 2000, following the dip in 1970 with the decline of industries in the area. The graph predicts an increase of 1% between now and 2030.

Advertisement
Preston has an increasingly aging population with a quarter of the population being aged 65 or older. In stark contrast the student population who influx in and out of the city make up only 11% overall. While 2/3 of the population are at working age, this is increasingly becoming skewed towards an elderly generation.

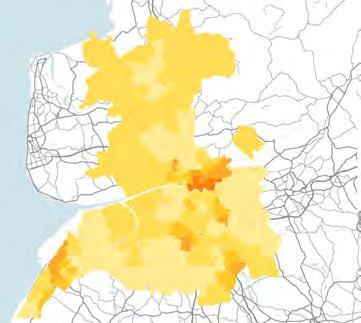
The map adjacent shows the average percentage of housing costs whether rental or mortgage in comparison to the average income. The maximum percentage for affordable housing is 30%. Within the areas of Preston town centre and its suburbs the general cost of housing is above this affordable guideline.


*Please refer to the Appendix pp.51 to refer to the entire body of individual demographic research
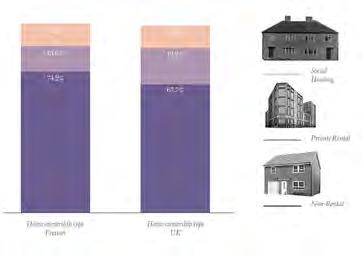
Preston has a slighter higher percentage of home ownership than the national average at 74%, and only 13% of housing is private rental. Home size varies from the suburbs to the rural countryside with the average size of home in the town centre being between 30-60m 2. Social housing supply is slightly lower than the national average despite the high levels of unemployment.