
NOVEMBER 2017 ELECTRICITY SCENARIOS FOR BELGIUM TOWARDS 2050 ELIA’S QUANTIFIED STUDY ON THE ENERGY TRANSITION IN 2030 AND 2040

2 1. INTRODUCTION 12 1.1. Elia’s 2050 Vision 13 1.2. Context and objectives of this report 14 1.3. Structure of the report 18 2. SCENARIOS AND ASSUMPTIONS 19 2.1. Current situation and trends in the energy sector 21 2.1.1. Future energy trends 21 2.1.2. Energy efficiency and savings 22 2.1.3. Electrification of the fossil-based energy sectors 22 2.1.4. Decarbonisation of the electricity sector through an increase of renewables in the energy mix 22 2.1.5. Consumption of energy in Belgium 24 2.1.6. Greenhouse gas emissions in the energy sector in Belgium 25 2.2. Study framework 26 2.2.1. Time horizons considered 26 2.2.2. Simulation perimeter 27 2.3. Long-term scenario development 28 2.3.1. Scenario storylines 28 2.3.2. Additional European sensitivities for 2040 31 2.3.3. Overview of data needed for scenario definition 32 2.3.4. Summary of the scenario framework 32 2.4. Belgian demand and generation assumptions 33 2.4.1. Electricity consumption 33 2.4.1.1. Demand growth driven by economic and energy efficiency 33 2.4.1.2. Additional electrification 34 2.4.1.3. Thermo-sensitivity 34 2.4.1.4. Total consumption after adding electrification and thermo-sensitivity 36 2.4.2. Demand response in the market 37 2.4.2.1. Demand shedding 38 2.4.2.2. Demand shifting 38 2.4.3. Renewable generation 39 2.4.3.1. Biomass 41 2.4.3.2. Onshore wind 41 2.4.3.3. Offshore wind 41 2.4.3.4. Solar 42 2.4.3.5. Geothermal 42 2.4.3.6. Hydro run-of-river 42 2.4.4. Storage 42 2.4.4.1. Pumped-Storage 43 2.4.4.2. Stationary batteries: 43 2.4.4.3. ‘Vehicle-to-Grid’ 43 2.4.5. Thermal generation fleet 44 2.4.5.1. Evolution of existing nuclear generation 44 2.4.5.2. Evolution of existing CCGT and OCGT units 44 2.4.5.3. Evolution of CHP and waste capacity 45 2.4.5.4. Additional thermal capacity to ensure adequacy 45 2.4.6. Summary of assumptions for Belgium 46 2.5. European demand and generation assumptions 47 2.5.1. Evolution of electricity consumption 48 2.5.1.1. Additional electrification 48 2.5.1.2. Evolution of demand flexibility options 48 2.5.2. Renewable production in EU22 49 2.5.2.1. Solar 49 2.5.2.2. Onshore and offshore wind 50 2.5.2.3. Other RES 50 2.5.2.4. Pumped-storage 50 2.5.2.5. Stationary batteries 51 2.5.2.6. ‘Vehicle-to-Grid’ 51 2.5.3. Thermal generation at EU level 52 2.5.3.1. The Netherlands 52 2.5.3.2. France 52 2.5.3.3. Germany 53 2.5.3.4. Great-Britain (GB) 53 2.6. Assumptions on balancing reserves 54 2.7. Assumptions on interconnections 55 2.7.1. Modelling 55 2.7.2. Reference assumptions on Belgian interconnections 55 2.7.3. Additional Belgian interconnections assessed 56 2.7.4. Assumption on European interconnections 56 2.7.5. European ‘GRID+’ sensitivity 57 2.8. Economic assumptions 58 2.8.1. Variable costs 58 2.8.1.1. Fuel and emission costs 58 2.8.1.2. Variable operation and maintenance costs 60 2.8.1.3. Supply merit order 60 2.8.2. Fixed costs 60 2.8.2.1. Fixed Operation and Maintenance costs 60 2.8.2.2. Investment costs and cost of capital 60 2.8.2.3. Summary table of assumptions 61 2.8.3. Levelised cost of electricity for RES 62 2.9. Summary of scenarios and sensitivities used in this study 63 3. METHODOLOGY 64 3.1. Ensuring adequacy of the country and its neighbours 66 3.1.1. Adequacy criteria to be respected for each country 66 3.1.2. Iterative process ensuring European and Belgian adequacy 67 3.1.3. Adequacy simulation 68 3.2. Hourly electricity market model 70 3.3. Identification of the optimal capacity mix for new thermal generation in Belgium 72 3.4. Cost-benefit analysis for additional interconnections 73 CONTENTS
3 4.9. Total investment and fixed costs for each scenario 109 4.9.1. Investments costs per scenario 109 4.9.2. Market welfare comparison between scenarios 110 4.9.3. Additional benefits of more renewables in the system 111 4.9.4. Cost-benefit analysis between scenarios 111 4.10. Summary of findings 112 5. MARKET DESIGN OPTIONS 113 5.1. Supply shock, timing issues and a call for action 115 5.1.1. The Belgian supply shock is steep and unprecedented in liberalised markets 115 5.1.2. The clock is ticking... fast 115 5.1.3. The time to decide is now 116 5.2. Reflection on market design options 117 5.2.1. EOM complemented with out-of-market capacity 118 5.2.2. Design options aiming for in-the-market capacity 118 5.3. Conclusion: a targeted auction as pragmatic way forward, at least in a first stage 120 6. CONCLUSIONS AND MAIN POLICY CHALLENGES 121 6.1. Methodology and Assumptions 123 6.2. Decarbonising the electricity system 124 6.3. Economic scenario assessment 125 6.4. Adequacy: to keep the lights on 126 6.5. Market design: how to reach adequacy at the least cost 127 6.6. Scenarios for the nuclear phase-out 127 6.7. Grid and interconnector development 128 7. ANNEXES 129 7.1. Literature review 130 7.2. Assumptions 131 7.2.1. Additional electrification in EU22 131 7.2.2. Thermal and other RES capacity in EU22 132 7.3. Methodology 133 7.3.1. ‘Monte-Carlo’ method 133 7.3.2. Unit Commitment 134 7.3.3. ANTARES model 135 7.4. Additional results 137 7.4.1. Belgian residual load 137 7.4.2. Belgian cross-border exchanges 139 7.4.3. RES revenues 140 7.4.4. Wholesale market price difference between Belgium and its neighbours 142 7.4.5. Total investment costs and market welfare difference between scenarios in 2040 143 8. ABBREVIATIONS 145 9. BIBLIOGRAPHY AND REFERENCES 147 3.5. Additional indicators resulting from the market study 74 3.5.1. Unit profitability and running hours 74 3.5.1.1. Running hours of each unit are calculated by the model based on the marginal cost of generation 74 3.5.1.2. Unit revenues and inframarginal rent 74 3.5.1.3. Assessing unit profitability 74 3.5.2. Wholesale electricity prices calculated by the model 75 3.5.3. CO2 emissions 75 3.5.4. Renewable share in the electricity consumption 75 3.5.5. Energy exchanges and balance 75 3.5.6. Production mix 75 4. SIMULATION RESULTS 76 4.1. Adequacy requirements 78 4.1.1. Need for thermal generation in Belgium 78 4.1.1.1. Results for 2030 (and back casting to 2025) 79 4.1.1.2. Results for 2040 (long-term perspective) 79 4.1.1.3. Additional capacity needed if neighbouring countries are not adequate 81 4.1.2. Storage, RES and demand flexibility contribution to adequacy 81 4.1.3. Results for the European perimeter 85 4.1.3.1. Results for 2030 85 4.1.3.2. Results for 2040 85 4.2. Sustainability indicators 86 4.2.1. European indicators 86 4.2.1.1. Results for 2030 87 4.2.1.2. Results for 2040 87 4.3. Energy mix 88 4.3.1. Belgian production mix 88 4.3.2. Belgian cross-border exchanges 89 4.3.3. European generation mix 90 4.3.4. Energy curtailed in Europe 91 4.3.5. Cross-border exchanges in Europe 91 4.4. Optimal share of the new thermal generation fleet in Belgium 92 4.5. Gas-fired unit: economic results 94 4.5.1. Unit profitability 94 4.5.2. Unit running hours 96 4.5.3. Results for the least efficient CCGT in the market 97 4.6. Additional interconnectors: economic results 98 4.7. Economic impact assessments on a partial nuclear extension, CHP and large-scale biomass 101 4.7.1. Impact assessment for keeping 2 GW of nuclear generation online for 10 years after 2025 101 4.7.2. Additional large-scale biomass 103 4.7.3. Additional Combined Heat and Power (CHP) 103 4.8. Economic competitiveness of Belgium 104 4.8.1. Wholesale electricity price 104 4.8.2. Marginal technologies 106 4.8.3. Belgian competitiveness 107 4.8.3.1. Additional interconnectors and an efficient gas thermal fleet to keep Belgium’s competitiveness 107 4.8.3.2. An ‘in the market’ thermal fleet to deliver on welfare 108 CONTENTS
By 2025 two thirds of Belgium’s current electricity generation capacity will disappear nearly overnight. This is an unprecedented Thechallenge.energysector is changing. Driven by decarbonisation, we see a growth of renewable and decentralised energy generation, increasing digitalisation, new technologies and trends like the advent of electrical mobility that are resulting in a rapidly evolving energy landscape. And the energy transition is not just happening in Belgium; it is an almost unstoppable development across all of Europe. Belgium has passed legislation to phase-out nuclear power by 2025. Combined with the planned closure of a few older, gas-fired power stations, two thirds of the country’s current electricity production will disappear nearly overnight. This is an unprecedented challenge and, as such, it requires immediate attention. Moreover, we don’t have everything in our own hands: our largest power plants are owned by foreign energy companies.
As the operator of the Belgian high-voltage grid, Elia is taking its responsibility very seriously. In our capacity as transmission system operator we are not only at the heart of the energy transition, we also ensure that the electricity system remains adequate and we keep the lights on. Ultimately it is not up to us to make important societal decisions. We will take care not to do so. However, we do think that our analyses can make an important contribution to the debate resulting in decisions that secure both our energy system and our welfare. OF
To make our social contribution as good as possible, we worked out long-term scenarios for both 2030 and 2040. We also produced an outlook for 2050. There are multiple options for how Belgium can deal with the energy transition.
FOREWORDIN THE INTEREST
For our long-term scenarios, we are using the vision Elia published in June 2017 as our basis. We are assuming an open market in which Belgium is fully integrated in Europe. After all, in a renewable world, our country is too small to efficiently implement decarbonisation on its own. However, our favourable central location can be an opportunity for the future. Belgium can indeed make energy decisions that will contribute positively to the welfare of future generations.
SOCIETY
Dear reader, The public debate on the future of the Belgian electricity system generally takes place within a short-term context. Should we extend the life of nuclear power stations by a few years? Should we keep inefficient gas-fired power stations in our generation fleet via the Strategic Reserves? And so on. This short-term thinking all too often masks the immense challenges we face. At the end of the day, where do we want to go? How do we want to get there and how quickly?
Our central location is an opportunity. Belgium can make proper energy choices that will contribute favourably to the welfare of future generations.
4

The window for making positive decisions that support our future welfare is closing very quickly. At the COP21 climate conference in Paris in 2015 attendees agreed to decarbonise our economy by 80-95% by 2050. This can only succeed if we improve energy efficiency, electrify key sectors such as transport and heating, and thoroughly decarbonise the electricity system.
Publishing this study is an act of corporate social responsibility. After all, the power grid is a crucial pillar of energy policy. Thanks to an integrated European grid Belgium can, in the decades ahead, ensure an adequate, low-carbon and competitive electricity system.
FOREWORD
This study dismantles a number of persistent misconceptions requiring Ourattention.futurestudy dismantles a number of persistent misconceptions requiring attention: Any future scenario requires a large volume of new controllable (thermal) generation capacity in order to guarantee security of supply. To replace the full nuclear capacity after 2025, we will need at least 3.6 GW. For such investments, additional measures are needed on top of the current market mechanisms. Once these generation units are built, they will play an ongoing role in the energy transition until at least 2040. Additional electrical interconnections are necessary to achieve decarbonisation objectives and to keep wholesale prices competitive. Such interconnections have no adverse effect on our own generation market. In a proactive scenario they even create industrial opportunities if Belgium profiles itself in the concept of the ‘Energy Roundabout’.
Chris Peeters Elia CEO
5
With this quantified study, Elia intends to support the debate on the future of the Belgian energy system with facts and analyses. We also want to send a signal that the window for making positive decisions that support our future welfare is closing very quickly.
6 SUMMARYEXECUTIVE
With the Inter-federal Energy Pact coming soon, Belgium is about to take important decisions on the future of the energy system. The Belgian energy sector needs a clear vision and a guiding policy. The rapid and fundamental changes brought about by the energy transition create new needs and Asrequirements.akeyplayer in the Belgian electricity system, Elia wants to be actively involved in finding the most efficient solutions to address the challenges posed by the energy transition. In June 2017 we published a vision paper in which we refer to the industrial opportunities offered by the energy transition as Europe’s Energy Roundabout. In this follow-up report we put figures to the various future scenarios for both 2030 and 2040, as well as the outlook for 2050. We are working towards a reliable, sustainable and affordable energy system. We set out the various policy options and any associated consequences. We also make a call for action, because the window for making positive choices that support the future prosperity of Belgium is closing very quickly indeed.
SUMMARYEXECUTIVE
THE REASON FOR THIS STUDY
7
CONTEXT OF THE ENERGY TRANSITION
This study starts with Europe’s commitment to decarbonise our society by 80-95% by 2050. Accordingly, Europe is aiming for the targets set out at the COP21 climate conference in Paris in December 2015. Our future scenarios comply with, or exceed, Europe’s agreed electricity goals for 2020 and 2030. The speed of progress towards the 2050 decarbonisation target will depend on the progress made with renewable energy, among other things. The proposed climate objectives are very much the driving force behind the energy transition, which is already clearly visible today and unstoppable. Conventional energy sources are giving way to low-CO2 (renewable) energy generation, which is breaking through on a large scale. The energy system is decentralising and electricity generation is moving away from major consumption centres. Due to digitalisation and the advent of new technologies, electricity is evolving towards a two-way flow. The end-consumer is playing a more prominent role. We are gradually seeing the breakthrough of electric vehicles, battery technology and growing demand-side management and energy efficiency. At the same time, we are also seeing the rising internationalisation of the electricity sector thanks to the growing number of electricity interconnectors. The energy transition will only be successful if it delivers maximum benefits for all three pillars in the ‘Energy Trilemma’: reliability, affordability and sustainability. This requires a radical transformation of the European energy system, with a simultaneous focus on improving our energy efficiency, electrifying key sectors such as transport and heating, and dramatically decarbonising the electricity system by more than 90%.

3. ‘Large Scale RES’ scenario (RES) = base-case scenario plus, inter alia, additional renewable energy generation via largescale projects which are mainly in onshore and offshore wind power (up to 4 GW of offshore wind in 2030 and 8 GW in The2040).study also factors in a number of variants, both in Belgium and abroad (22 European countries). After all, there is no certainty about the speed at which additional interconnectors will be built or the composition of the future (thermal) generation fleet in Belgium.
To keep the policy options as broad as possible, we have expanded on three different scenarios:
8
APPROACH This quantified study builds on the report Elia published in 2016 on ‘The need for adequacy and flexibility in the Belgian electricity system for 2017-2027 ’. In addition to putting figures to the various future scenarios for 2030 and 2040, we also focus on a few options for sustainably ensuring security of supply in the short term. These are needed in order to cope with the planned 2025 nuclear exit and to provide sufficient replacement capacity for guaranteeing security of supply. For the period after 2040 we assume the need for additional technological and social developments that are currently unknown or insufficiently mature. In this study, we analyse both short-term and long-term policy options on the future energy mix for Belgium on the path towards 2050. Bearing in mind the planned nuclear phase-out in 2025 we are striving towards a sustainable and adequate electricity system with prices that are competitive compared to our neighbouring countries.
1. ‘Base Case’ scenario (BC) = scenario that is in line with the current policy for reaching the 2030 European climate targets, involving the electrification of sectors such as heating and transport.
In each scenario we assume a strong growth in both demand-side management and energy storage. The ‘Decentral’ scenario, for instance, includes a demand-side management capacity of 2 GW and a decentralised storage capacity that grows from 3 GW in 2030 to 5 GW in 2040. All scenarios also take account of the extensive electrification of sectors such as transport and heating.
SUMMARYEXECUTIVE
Despite growing electrification and expected economic growth, there is no strong increase in annual electricity demand. This is due to greatly improved energy efficiency. In 2030, annual electricity consumption is estimated at 90 TWh and in 2040 between 90 TWh and 98 TWh (reference: 2016 around 85 TWh).
METHODOLOGY
2. ‘Decentral’ scenario (DEC) = base-case scenario plus, inter alia, additional renewable energy generation via decentralised sources, such as a large number of photovoltaic installations (up to 11.6 GW in 2030 and 18 GW in 2040) in combination with storage devices (from 3 GW in 2030 to 5 GW in 2040; including stationary and EV batteries and pumped storage) and in which prosumers (consumers that also produce) play a prominent role.
The methodology used in this study goes further than an analysis of the adequacy requirements (security of supply), as was done in the 2016 study. Crucially, sustainability criteria, welfare gains and the cost of the future generation mix are also taken into account in the new study.
The study confirms the vision Elia published in June 2017: Belgium benefits most from an EU-integrated electricity system based on renewable energy sources, in which the full domestic potential is exploited and supplemented via interconnectors with energy from renewables and other differentiated foreign generation units.
SUMMARYEXECUTIVE9
MAIN CONCLUSIONS
The speed and magnitude of the above mentioned energy transition will be determined by, among other things, higher prices for CO2 and fossil fuels at European level. These will result in an increase of the market price and thus lead to investment costs being increasingly covered by the market itself, this both for renewable and thermal capacity. Support mechanisms will remain in that context still necessary but the level of support is Thanksdwindling.to rising digitalisation and the advent of battery technology, we are seeing the growing importance of demandside management and energy storage. However, their flexible contribution to the energy system will be insufficient for coping with variable energy generation from renewable energy and guaranteeing security of supply for long periods with little sun and wind (for example during a cold snap). In doing so, there remains within the time scale covered by this study a need for adjustable thermal capacity.
In our study, we have not factored in the (positive) impact of additional interconnectors on security of supply. Elia used the precautionary principle. In the winter if renewable energy generation and import opportunities are also more limited Belgium must be able to fall back on its own adjustable thermal generation capacity in order to guarantee an adequate system.
2
The Belgian electricity system is mainly supported in the mediumterm by a generation mix made up of maximum quantities of renewable energy, in combination with flexible thermal capacity and supplemented by cross-border electricity transmission via interconnectors. Demand-side management and energy storage are increasingly important, but do not guarantee security of supply during long periods without wind or sun. 1
By 2022 just before the first wave of nuclear decommissioning Belgium will be electrically interconnected with France, the Netherlands, the UK (Nemo Link® project as of 2019) and Germany (ALEGrO project as of 2020). The findings of our study show that, in addition to the aforementioned interconnection capacity (a total of 6500 MW), Belgium will benefit ecologically and economically from investing in additional electrical interconnectors. After all, we are a small country and our opportunities for renewable energy are limited. Additional interconnectors provide access to the various energy mixes in neighbouring countries and create prosperity through international price convergence. In 2030 the price advantage is already significant and as the energy transition proceeds, the economic benefit will rise quickly. Additional interconnectors also make it possible to maximally decarbonise our electricity system via European-level exchanges of low-CO2 power Ingeneration.theRES scenario (including large volumes of onshore and offshore wind) the net prosperity gain due to additional interconnectors is the greatest. In 2040 they will yield approximately €200 million annually. This is in line with our vision that the inclusion of large volumes of onshore and offshore wind at international level is the most cost-optimal way to decarbonisation for a country like Belgium.
Additional interconnectors are a ‘no regret’. They contribute towards the achievement of Belgium’s climate goals and offer the best guarantee for ensuring prices that are competitive compared to neighbouring countries. Additional interconnectors also bring industrial (export) opportunities for our domestic generation market: Belgium can establish itself as a first mover to realise the concept of the ‘Energy Roundabout’ within a European context.
It is also important to point out that our study dismantles the misconception that additional interconnectors are a threat to the profitability of domestic power stations. On the contrary, Elia sees industrial opportunities for efficient Belgian generation units as via an interconnected system they can play a role at European level.
4
In each future scenario for 2050 there is, as of 2025, a need for additional adjustable (thermal) generation capacity in order to cope with the shock of the nuclear exit and guarantee security of supply. In the event of a full nuclear phaseout by 2025, that will be at least 3.6 GW. 3 Belgium has passed legislation to phase-out nuclear power by 2025. Nuclear power currently accounts for one third of our installed generation capacity and half of the generated electricity. In combination with the anticipated closure of a few gas-fired power stations in that same period, two thirds of Belgium’s current electricity production will disappear ‘nearly overnight’. This kind of capacity shock has never been seen. To guarantee an adequate electricity system in which the lights stay on, it is necessary in all future scenarios to build replacement capacity. Based on the assumptions in this study, in the event of a full nuclear exit by 2025, Belgium must develop at least 3.6 GW of new capacity that will come onstream by no later than winter 2025-2026.
Elia has also put figures on the partial nuclear exit that was suggested in other studies by Febeliec, Energyville, FEB and others. In such a scenario, the 3.6 GW of required new capacity in 2025 will drop to around 1.6 GW. Nevertheless, both scenarios (full and partial nuclear exit) require additional measures to guarantee replacement capacity. The market will not do this on its own. See point 4.
In calculating this 3.6 GW, Elia paid particular attention to energy efficiency, demand-side management, energy storage and the expected increase in renewable energy. It was also assumed that in 2025 there will be at least 2.3 GW of existing gas-fired power stations (both CCGT and OCGT). If our neighbouring countries are not able to ensure their own ‘adequacy’, an additional 1 to 2 GW is needed. Since this capacity will only be deployed in the event of scarcity and therefore only on an occasional basis, various sources are eligible, such as the extension of older power stations, additional demandside management, new peak power stations with a short construction time, etc.
Due to low electricity prices, the current market model cannot guarantee that the necessary replacement capacity will actually be built to cope with a 2025 nuclear exit. The electricity wholesale price is not sufficient to pay back the investment. In view of the urgency and the risks of scarcity, price spikes and even serious supply problems, a focused auction mechanism can offer a solution in a first phase.
10
SUMMARYEXECUTIVE
Within the confines of the current market model it is unlikely that there will be sufficient investment signals to cope with the production shock caused by the nuclear exit. This will also lead to scarcity, price spikes and even serious supply problems. In our calculation model for 2030, the impact on the wholesale price in the event of 1.5 to 2 GW market scarcity, is estimated at € 1 to 1.5 billion per year. In view of the fact that the required replacement capacity to be developed will not automatically come from the market, and in order to avoid the above-mentioned (price) risks, additional measures will be needed to remunerate the required 3.6 GW of Thecapacity.tighttimeframe also poses a challenge. In order develop the necessary replacement capacity by the planned 2025 nuclear exit, the investment decision must be made by no later than 2020-2022, depending on the selected technology. So, there is a short period of just three or four years to develop an alternative market design approved both nationally and at European level. Given the urgency, the most realistic solution seems a one-shot operation with targeted auctions. Subject to multiple uncertainties and aware that auctions will be challenged on competition-related grounds, Elia is of the opinion that such a mechanism will have a reasonable chance of being operational by 2020. That means there is just enough time to build the replacement capacity. In the next phase, a more general market mechanism can be developed which offers the best medium- and long-term solutions, while being based on the best existing practices.
11 CALL TO ACTION
SUMMARYEXECUTIVE
if Belgium wants to comply with the legally required 2025 nuclear exit, then at least 3.6 GW of replacement capacity is needed that can only come via a support mechanism. To meet the 2025 deadline, it is necessary to develop an alternative market design by the deadline set in place by the government. There is just enough time to calibrate the new support mechanism with Europe and to deliver the replacement capacity.
This quantified study clearly shows that it is high time to take decisions if we want to keep the future in our own hands. Not deciding almost automatically means extending the lifetime of 4 GW nuclear However,capacity.
By quickly and intelligently anticipating those opportunities that arise, Belgium can ensure an adequate, low-carbon and competitive electricity system that will help support prosperity for generations to come.
12 1.1 — ELIA’S 2050 VISION 13 1.2 — CONTEXT AND OBJECTIVES OF THIS REPORT 14 1.3 — STRUCTURE OF THE REPORT 18 INTRODUCTION 01
INTRODUCTION 13
On 15 June 2017, Elia has presented its point of view on the Energy Vision for 2050 and its key elements, in order to contribute to the current ongoing energy debate in Belgium [ELI-10]. Elia believes: — in a renewables-based and EU integrated electricity system where the full extent of our domestic potential is valorised and complemented – via interconnections – with affordable energy from the most efficient and sustainable resources abroad; — that the grid is key for integrating large amounts of renewables into both centralised and decentralised systems. Belgium should build upon its existing energy infrastructure (electricity and gas), by maintaining and further developing a strong and reliable electricity grid –both onshore and offshore – as well as interconnections with our neighbouring countries;
— that short-term storage (e.g. batteries) and demand response are and will continue to help the system in terms of flexibility. They help balance the system and manage the daily variability of renewables (e.g. day-night cycles of solar photovoltaics). However, achieving full decarbonisation in the longer run (close to or beyond 2050) could require long-term storage technologies (e.g. ‘power-to-gas’, or ‘power-to-heat’), which are not mature enough today;
Belgium should leverage on existing and upcoming energy infrastructure and its central EU position, to benefit from European renewable potential and the diversified energy mix of our neighbouring countries. In an energy world that is becoming more renewable and decentralised, with increasing levels of digitalisation and with consumers becoming increasingly active, Belgium could become an ‘Energy Roundabout for Europe’. This will provide:
Europe has committed to the decarbonisation of its society, with a target of an 80% reduction in greenhouse gas emissions (compared to 1990 levels) by 2050, as stated in the COP21 Paris Agreement. On the path towards 2050, Belgium is set to phase-out its nuclear generation by 2025. Currently this accounts for about one third of Belgium’s total installed capacity and for half of the produced electricity.
— that gas-fired plants will play an important role for decades to come after the nuclear exit to ensure reliability (and contribute to sustainability in the short-term by replacing coal and lignite plants);
3. A reliable energy system facilitating economic activity, thanks to an energy mix (renewables, imported energy via interconnections, demand response and storage, and ther mal plants) that can meet demand at all times.
In its vision document, Elia announced that it would carry out a comprehensive study that objectivises its views and brings forward answers – where possible – to some outstanding questions which will help policy makers by enabling them to take informed decisions.
2. An affordable energy system enabling a competi tive economy, by building upon the complementarity of the generation mix of European countries. Thanks to its well interconnected infrastructure, Belgium can access energy from the most efficient resources located domestically and abroad. Digitalisation and an enhanced market design will help exploit the full value of the system.
— that Belgium should stay a competitive country at the centre of Europe – with a reliable energy supply – in order to create a stable environment for industry and citizens alike.
1.1 ELIA’S
1. A sustainable energy system enabling a decarbonised society, thanks to a renewable-based system where the full extent of our domestic potential is exploited, and where it is complemented with renewables sourced from abroad via interconnections.
BOX 1 - BELGIUM IN 2050: AN ‘ENERGY ROUNDABOUT FOR EUROPE’ 2050 VISION
2050 BELGIUM IN 2050: AN ENERGY ROUNDABOUT FOR EUROPE (FIG. 1)
— In 2023, the ‘structural block’s’ capacity would be 0.5 GW;
— In 2021, the ‘structural block’ would have a capacity of 0 GW, following the commissioning of two new interconnections (NEMO Link ® and ALEGrO) accounting for 2 GW, the expansion of the offshore wind farms and 600 MW of capacity from new biomass-fired power plants;
INTRODUCTION 14 BOX 2 - ELIA STUDY ON THE ’ADEQUACY’ AND FLEXIBILITY NEEDS OF THE BELGIAN ELECTRICITY SYSTEM FOR THE PERIOD 2017-2027 1.2 CONTEXT AND OBJECTIVES OF THIS REPORT 1.2.1. CONTEXT
— In 2027, the ‘structural block’ would be 4 GW, with the first 2 GW needed from 500 to 2000 hours on average during the year to ensure adequacy. The remaining part of the ‘structural block’ will only be needed for a very limited number of hours for adequacy purposes.
The report, as published in April 2016, summarises the conclusions of the study conducted by Elia at the request of the Belgian Federal Minister of Energy regarding two key aspects about how the electricity-market will function in the run-up to 2027: — the ‘adequacy’ needs of the power system: the assessment aimed to identify the volume of adjustable electrical power Belgium needs in order to be adequate, the so-called ‘structural block’ which is assumed to be 100% available; — the flexibility needs: the assessment aimed to identify the quantity of flexible sources needed, in particular those required for the balancing needs of the Transmission System Operator (TSO), along with their characteristics.
In addition, Elia has been recognised by the Belgian federal government (in its coalition agreement) to take action by fulfilling a role of expert, facilitator and coordinator in the context of the debate on security of supply. This led Elia to deliver a study on the ’adequacy’ and flexibility needs of the Belgian electricity system (2016 Elia study). The study was performed in 2016 at the request of the Federal Minister of Energy, Mrs Marie-Christine Marghem, and has been developed in cooperation with the Cabinet of the Minister and the Belgian Energy administration of the Federal Public Service (FPS) Economy [ELI-6]. An addendum to this study (published September 2016) was carried out following the public consultation organised by FPS Economy’s DG Energy on the initial Elia study [ELI-10].
About the ‘adequacy’ needs of the electricity system When applying the methodology based on assumptions used in the 2016 Study, the results of the ‘Base Case’ scenario (without taking into account the flexibility needs) were as follows:
The European electricity system is profoundly and rapidly reshaping, as it is facing unprecedented changes and needs to adapt to meet major challenges - integrating high volumes of variable renewables, the increasing decentralisation, digitalisation and the appearance of new players - whilst safeguarding security of supply and ensuring competitiveness with our neighbouring countries. As the Transmission System Operator (TSO) for the Belgian electricity system, Elia will play a central role in these developments. In this respect, Elia is actively working to enable the energy transition through innovation and continuous improvement in its role of developing and maintaining the transmission infrastructure, operating the system and facilitating the market.
STUDY REGARDING THE ‘ADEQUACY’ AND FLEXIBILITY NEEDS OF THE BELGIAN POWER SYSTEM for the 2017-2027period NOVEMBER 2016
— In 2017, the capacity of the ‘structural block’ would be 2.5 GW, with the entire block being constituted on the basis of the existing resources;
— Given Belgium’s high level of interconnection with neighbouring countries and its central position in Europe, any deliberations on whether to eventually introduce a potential capacity remuneration mechanism should preferably be examined (and, as the case may be, implemented) in a coordinated/harmonised way with these neighbouring countries and not in an isolated manner.
The requested additional assumptions shared the common scenarioThegenerationfeaturethattheywerebasedonadrasticreductionoftheavailablecapacityinBelgium’sneighbouringcountries.initialstudyalreadyincludedsucha‘Lowcapacity’withthesameplannedshutdowns.Therefore,itwas
Discussions with a view to taking decisions in this regard should start as soon as possible, as it is absolutely essential that market players have a clear and stable framework so that they can make appropriate, well-informed decisions and anticipate the planned evolutions in the Belgian energy mix.
If the capacity mechanism currently in place (the Strategic Reserves mechanism) does not guarantees this coverage, one or more targeted solutions should be envisaged to ensure that the TSO is able to fulfil its mission of maintaining the balance of the Belgian control area over the timeframes mentioned above.
INTRODUCTION 15
expected (and it was confirmed in the addendum) that the results of this ‘additional scenario’ would be similar to the ‘Low capacity’ scenario from April 2016, which was presented by Elia as a ‘stress test’. in particular on the technological maturity of the other flexibility sources and on the current balancing mechanism. OF THE RESULTS
POOLING
The flexibility requirements that have to be met...
1. aFRR: automatic Frenquency Restoration Reserve CAPACITY OF ‘THE STRUCTURAL BLOCK’ RESULTING FROM THE ‘ADEQUACY’ AND FLEXIBILITY ASSESSMENT FOR THE ‘BASE CASE’ SCENARIO (FIG. 2)) 1000200030004000500060000 2017 2018 2019 2020 2021 2022 2023 2024 2025 2026 2027 inblockstructuraltheofCapacityMW 2500 4000 2-4 CCGT units* * Depending
— Targeted improvements to the current Strategic Reserve mechanism (such as inclusion of new production units, introduction of a market stabiliser, the irreversible nature of Strategic Reserves) might also provide answers to the problems if there is insufficient market response.
Potential measures to respond to adequacy problems As regards potential measures to be taken to respond to the ‘adequacy’ problems, the following remarks were made in the study:
The conclusions of the ‘adequacy’ assessment have shown that the ‘structural block’ will not be needed for adequacy purposes between 2021 and 2023, the year when the first nuclear reactors of the production park will be phased out. However, the flexibility assessment revealed that a number of CCGT units might be necessary in 2021 and 2023 to cover the need for secondary control (aFRR1 – R2) given the specific characteristics required.
Addendum to the Elia Study on the ’adequacy’ and flexibility needs of the Belgian electricity system for the period 2017-2027 Following that report, the FPS Economy’s DG Energy orga nised a public consultation, at the end of which the Federal Minister of Energy, Mrs Marie-Christine Marghem, asked Elia to analyse a number of additional scenarios based on various new assumptions. The results where presented in the adden dum to the initial Elia 2016 Study as described above.
Therefore, it would be worth considering appropriate mechanisms to ensure the availability of such resources by 2025, given that there is no guarantee that the current mechanisms (the ‘energy-only’ market complemented by the Strategic Reserve mechanism) will be sufficient in order to ensure that market players will make the necessary investments to cover all the anticipated needs. As part of these deliberations on future mechanisms, Elia suggests the following options (non-exhaustive) that might be worth exploring:
— For the subsequent years of the period investigated (20232027): a clear ‘adequacy’ issue emerges, hence the increase of the ‘structural block’ up to 4 GW in 2027. In addition, this result is particularly sensitive to the situation in the other countries considered here: for example, in a scenario of more substantial decommissioning of generation units in Belgium’s neighbouring countries (the ‘Low capacity scenario’), the Belgian ‘structural block’ could even reach a capacity of 8 GW.
— The assessments performed did not point to significant ‘adequacy’ problems in the first few years of the period investigated (2017-2022): given the current composition of the production park, the current Strategic Reserves mechanism should be sufficient to cover the defined ‘adequacy’ needs without the development of an additional or alternative structural mechanism.
The conclusions of the ‘adequacy’ assessment show that the ‘structural block’ will not be needed between 2021 and the year when the first nuclear reactors in the Belgian production park will be phased out (2023). However, the flexibility assessment reveals that a number of CCGT units might be necessary in 2021 and 2023 to cover the need for secondary control (aFRR). If the capacity mechanism currently in place does not guarantee this coverage, one or more targeted solutions should be envisaged to ensure that the TSO is able to fulfil its mission of maintaining the balance of the Belgian control area over the timeframes mentioned above.
Currently in Belgium, debates are taking place at federal and regional level, aiming to define Belgium’s long-term energy vision on the energy objectives by 2030 and 2050. These will be concluded in an inter-federal Energy Pact, focusing on the future energy mix, governance, market design, flexibility and interconnections. These developments are of particular importance given the decision to phase-out Belgian nuclear generation by 2025, and Belgium’s commitment to the COP21 Paris Agreement which sets a target of an 80% reduction in greenhouse gas by 2050. In this framework, Elia is willing to contribute to the debate on the Belgian energy vision and on the roadmap to make it happen. Taking a systemic approach, we have assessed, factualised and tried to bring forward answers to some outstanding key questions – such as the costs, benefits and implications for the transition period (2030-2040) - to support policy makers to make informed decisions.
INTRODUCTION16 CompetitivenessAdequacy THIS STUDY WILL ASSESS FUTUR ENERGY CHOICES OF BELGIUM FROM A SUSTAINABLE, ADEQUATE AND COMPETITIVENESS POINT OF VIEW (FIG. 3) Flexibility 2017 - 2027 Adequacy & Flexibility Apr./Sep. 2016 Sustainability 2030 - 2040 Long term energy vision Ensuring… Nov. 2017 Policy options How to get there ?
This study follows upon the ‘Elia Study on Adequacy and Flexibility for the Belgian System’ performed for the period 2017-2027, at the request of the Minister for Energy, in April 2016 and its Addendum of September 2016. Adequacy

THIS ASSESSING A LONGER TIME HORIZON (FIG. 5) reserve evaluation to Y+3) 10 year adequacy and flexibility study (Y+3 to Y+10) Electricity Scenarios for Belgium towards 2050 (Y+10 to
STUDY COMPLEMENTS THE EXISTING ELIA STUDIES
For 2050, scenarios become too speculative in terms of the maturity and possible technologies that can allow high levels of decarbonisation to be achieved. As such, we have not quantified the defined scenarios in 2050.
SOLVING THE ENERGY TRILEMMA (FIG. 4) Decarbonisation Competitiveness Security of supply 1.2.2. OBJECTIVES OF THE STUDY
Strategic
— Indicating the economic and industrial opportunities to be captured by the investments resulting from the various scenarios in renewable and thermal generation, in a smart system with storage, demand flexibility and interconnectors.
This study aims to complement existing studies on 2050 trajectories and focuses on the electricity sector in Belgium within Europe, based on extensive data sets from a large perimeter of 22 European countries.
(Y+1
INTRODUCTION 17
— Assessing the contribution of the electricity sector in various scenarios for the achievement of sustainability, in particular regarding the climate objectives;
By elaborating electricity scenarios for 2030 and 2040 on the way towards 2050, the study aims to provide a solid basis for the choices that Belgian authorities will make for the development of the electricity sector in the three dimensions of the ‘Energy Trilemma’:
volume
Y+20) TODAY 2030 2040 20502020
— Further elaborating on the electricity mix scenarios, as developed in the Elia Study of April 2016 for ensuring a reliable electricity supply, in particular regarding the choices to be made in view of the planned nuclear exit;

THE REPORT IS DIVIDED IN SIX PARTS (FIG. 6) 1 INTRODUCTION 2 SCENARIOS AND ASSUMPTIONS 3 METHODOLOGY 4 SIMULATION RESULTS 5 MARKET DESIGN OPTIONS 6 CONCLUSIONS AND MAIN POLICY CHALLENGES
Chapter 3 sets out the methodology that is used and the framework for the probabilistic and economic assessment.
STRUCTURE OF THE REPORT
Chapter 4 sets out the simulation results for the time horizons 2030 and 2040. On top of the ‘Base Case’; ‘Large Scale RES’ and ‘Decentral’ scenario, several sensitivities are extrapolated to capture the risks around various key assumptions.
INTRODUCTION 18 1.3
Chapter 5 focuses on market design options enabling the necessary investments to ensure that the Belgian system can remain adequate also beyond 2025 and the nuclear phaseout. The study ends with Chapter 6 setting out the conclusions and main policy challenges of this report. More detailed information for some parts of the study can be found in Annexes. It will be clearly indicated in the text when more information is available in the annexes. The sources and references to other studies can be found in the Bibliography A list of Abbreviations used in this study is also provided.
Chapter 2 takes an in-depth look at the assessment’s key parameters, scenarios and assumptions. The focus here is on available generation, storage, flexibility resources and consumption in Belgium as well as the situation in the neighbouring countries.
This report contains six chapters and is structured as followed: Chapter 1 presents the relevant background, context and explains why Elia has taken the initiative to produce this comprehensive study.
19 2.1 — CURRENT SITUATION AND TRENDS IN THE ENERGY SECTOR 21 2.2 — STUDY FRAMEWORK 26 2.3 — LONG-TERM SCENARIO DEVELOPMENT 28 2.4 — BELGIAN DEMAND AND GENERATION ASSUMPTIONS 33 2.5 — EUROPEAN DEMAND AND GENERATION ASSUMPTIONS 47 2.6 — ASSUMPTIONS ON BALANCING RESERVES 54 2.7 — ASSUMPTIONS ON INTERCONNECTIONS 55 2.8 — ECONOMIC ASSUMPTIONS 58 2.9 — SUMMARY OF SCENARIOS AND SENSITIVITIES USED IN THIS STUDY 63 SCENARIOS AND ASSUMPTIONS 02
Interconnections between countries modelled through available commercial exchanges are explained in Section 2.7 More details on the Belgian interconnections can also be found in this section. Variable and fixed costs of the different technologies used for market simulations and economic assessments are detailed in Section 2.8.
This chapter elaborates on the current energy trends, scenario framework and assumptions used in this study. A coherent set of hypotheses is defined and reflects a wide range of futures for the European and Belgian electricity systems based on expected trends.
The Section 2.5 provides more information on the generation and demand assumptions used for Europe. The assumptions on balancing reserves are elaborated in Section 2.6.
Details on the Belgian generation and demand assumptions are given in Section 2.4
Finally, a summary of scenarios and sensitivities to be performed is provided in Section 2.9.
The Section 2.2 sets the framework of the study. Time horizons and the geographic perimeter are also defined.
For more information certain data can be found in the Annexes, or in other documents for which references are included throughout the study.
This chapter is divided in eight sections.
The goal of long-term scenario building is not an accurate prediction of the future, but to assess the robustness of certain policy choices that Belgium has to make at the present time. In order to model the electricity system, large amounts of data with different granularity are needed. A detailed overview of the assumptions taken in account for Belgium and the other 21 countries simulated in this study is also provided.
The Section 2.1 gives a detailed overview of current energy consumption in Belgium, expected trends, associated greenhouse gas emissions and sustainability targets
The Section 2.3 deals with scenario definition. Three future scenario storylines are constructed for the electricity system based on expected trends. Those are inspired by the recent draft scenario development report for the Ten Year Network Development Plan (TYNDP) 2018 published in October 2017 (joint ENTSO-E and ENTSO-G) [ENT-1]. Additional sensitivities have also been constructed to capture different evolutions of the electricity market.
SCENARIOS20 ASSUMPTIONSAND
The latter two trends must be pursued simultaneously. If electricity is generated from fossil fuels, it will not contribute to the sustainability goals.
— Electrification of the sectors relying on fossil fuels (such as heat&cooling and transport);
In order to reach the 80% reduction in GHG in 2050, the power sector will need to reduce emissions by more than 90%. Other energy sectors will also count on the power sector to use some of the electricity for transportation and heating for example. The Figure 7 shows an estimation of ranges for 2020, 2030, 2040 of reductions in CO2 emissions2 to achieve the 2050 targets for the European electricity sector. More information can be found in: [ECL-1], [IPC-1], [EPA-1], [EUC-1], [EUC-2] POWER SECTOR WILL NEED TO BE ALMOST CARBON FREE BY 2050 (FIG. 7) [EUC-2] 2000 2020 2035 2040 2040 -85%to -93-99%to Energy efficiency in all sectors, electrification of the sectors relying on fossil fuels and an increase of RES are key to achieve decarbonisation.
The European electricity system will have to be almost carbon free (more than 90% reduction in emissions) by 2050 in order to achieve the European Union targets. 2009 the European Union committed itself to reduce its greenhouse gas (GHG) emissions by at least 80% by 2050 (compared to the 1990 level). In 2015, most of the countries around the world have set the same ambition during the COP21.
2045 2050* *
In
In order to achieve the sustainability targets while keeping affordability and reliabiltiy of the supply, long term studies have demonstrated that the following three trends will be —key:Increasing energy efficiency in all sectors to reduce consumption and hence emissions;
CO2emissions100=Baseyear1990 1009080706050403020100 Source:
SCENARIOS21 ASSUMPTIONSAND 2.1 CURRENT SITUATION AND TRENDS IN THE ENERGY SECTOR 2.1.1. FUTURE ENERGY TRENDS
2005 2010 2015
2. Note that several greenhouse gases exist with different warming potentials (e.g. carbon dioxide, methane, nitrous oxide,...). The reference gas is carbon dioxide (CO2) which by definition has a global warming potential of ‘1’. The other gases potential is therefore expressed in comparison to carbon dioxide. Concerning the electricity sector, carbon dioxide is mainly emitted when producing electricity from fuel combustion.
values are an extrapolation from 2030 and 2050. 1990 level -25-35%to -54-68%to -70
1990 1995
— Decarbonisation of the electricity system by increasing the share of renewable generation (where technologies are available to harvest renewables). Note that other carbon low generation is also possible and might constitute part of the European mix depending on national policies and technological developments (e.g. nuclear, carbon capture and storage ...)
THE
2025 2030

Less consumption will lead to lower GHG emissions. The potential in total energy savings will mainly depend on the following (non-exhaustive list): — Behavioural changes of the end-consumer, energy intensive industries, ...;
SCENARIOS22 ASSUMPTIONSAND
— Awareness creation around energy usage (access to data, audits, information on energy consumption of devices, buildings, ...);
— Mature technologies exist to easily convert electricity to any other form of usable energy (heat, movement, ...).
The electricity share in the final energy consumption will increase with additional electrification
THE FUTURE ENERGY TRENDS (FIG. 8) Energy
2.1.4. DECARBONISATION OF THE ELECTRICITY SECTOR THROUGH AN INCREASE OF RENEWABLES IN THE ENERGY MIX
Given that: — most renewable sources need space (PV, wind, biomass) to be harvested; — the potential is geographically distributed and not necessarily close to major load centres (hydro, wind, ...);
The increase of renewables in the energy mix and particurarly in the electricity sector will increase
— Technologies are available to produce electricity from renewable sources (PV, wind, hydro, biomass, geothermal, ...); Source: [EUC-6]
2.1.3. ELECTRIFICATION OF THE FOSSILBASED ENERGY SECTORS
The total energy consumed will be reduced with additional energy efficiency measures
On top of energy efficiency, an increase of RES supported by the required grid infrastructure is key to achieve decarbonisation of the electricity system.
ElectrificationefficiencyShareofRES
Accommodating large amounts of renewable sources in the electricity system will require a strong grid infrastructure, a flexible generation fleet, demand flexibility and storage
There is a broad consensus between long-term energy studies on this [EUC-8] mainly due to three main reasons:
— New technologies and improved efficiency of current technologies using energy for lighting, transport, heating, ... (e.g. LED lighting, more efficient cars, automation, smart appliances, efficient boilers, ...) and industrial processes;
2.1.2. ENERGY EFFICIENCY AND SAVINGS
Electricity is seen as the major contributor to the decarbonisation of the economy in most long-term studies.
FROM TO Total Energy Non RES RES Electricity — If electricity is produced from renewable sources, it saves the production and transportation energy/emissions of the needed fossil fuels as well as the transformation losses when using those to produce electricity;
— they have an intermittent character linked to meteorological effects (PV, wind,...).
— Energy efficiency in buildings (insulation, doubled glazed windows...) More information can be found in: [EUC-7] ,[ECI–1], [MCK-1] These changes should be driven by incentives, regulatory frameworks, policies and consumer awareness. In this framework the European Union has set an energy efficiency target of 20% by 2020 and proposes to increase this to a 30% target by 2030 for energy consumption.
The third trend is the increase of renewables in the energy mix and more particularly in the electricity sector given that mature technologies are available to convert RES sources into electricity.
BOX
If a similar methodology would be applied as for the 2020 country RES targets this could correspond to around 20% for Belgium (but depends on energy efficiency savings, economic growth and other developments). A possible breakdown for each country can be found in the following study [KOT-1].
RES targets in relation to the energy consumption
2020
consumption) Estimations**Extrapolation/ ≈ 30% ≈ 50% ≈27%20%17%29%15%8% Based NREAP*on ≈ 21% ≈20%13%34%
RES targets in relation to the electricity consumption Given that the present study only covers the electricity sector, estimations of targeted RES penetration in the electricity sector are needed. The targeted RES-E share (share of renewables in the electricity consumption) depends on developments in the other sectors as targets are set on the total energy consumption. In 2015, the Belgian RES share of the energy consumption was 8%, and renewable electricity generation on final electricity consumption was 15%. The historical evolution is given in Figure 10. For 2020, an EU RES-E share of 34% was estimated based on the NREAP that each country has submitted. For Belgium 21% was expected to be the RES-E share to achieve the total energy targets.
SCENARIOS23 ASSUMPTIONSAND
The EU has set intermediary goals to reduce greenhouse gas emissions by 20% in 2020 and by 40% in 2030 compared to the 1990 levels: The EU is responsible for the GHG emissions that fall under the EU Emissions Trading System (ETS). Electricity GHG emissions are part of the ETS; Each member state is responsible for the non-ETS emissions. Those consist of binding targets for each member state. For Belgium, the proposal is to achieve a 35% reduction for the non-ETS sectors in 2030.
RES-E share (share
Sources: [EEA-1], [EUC-9] How does the ETS work ? Electricity falls under the EU ETS. It consists of a cap and trade system where companies receive and can trade emission allowances. The cap (i.e. the maximum amount of emissions that can be emitted per year) is reduced over time in order to achieve the targets. A carbon price reflects the supply and demand of allowances. More information can be found at [EUC-10].
10%15%20%25%5%0% RES share in (fromBindingenergyRES-targetconsumption.electricityEstimatedfromtheNREAP21%shareintotalconsumption.2020TargetNREAP)-13% 2005 2006 2007 2008 2009 2010 2011 2012 2013 2014 2015 2016 2017 2018 2019 2020 [OBS-1] [EUC-3] RES SHARE IN ENERGY AND ELECTRICITY CONSUMPTION IN BELGIUM (FIG. 10) 21% 15% 13% RES share 3 -
Belgium has committed to a share of 13% (RES share) of energy to be generated from renewable sources in relation to the final energy consumption. The NREAP for Belgium provided forecasts for renewable shares in the main energy sectors: Heat&Cooling, Transport and Electricity.
2004
RES TARGETS ON ENERGY AND ELECTRICITY CONSUMPTION IN EUROPE AND BELGIUM (FIG. 9)
For 2030, the European Commission proposed a 27% EU binding RES target as part of its ‘Clean Energy for all European Package’. In the course of 2018 and 2019, the European Council and Parliament will need to agree on this EU-wide target and national implementation will follow via the Integrated National Energy and Climate Plans of the member states (as part of the European Energy Union Governance framework).
Country based targets for the share of renewable energy in 2020 were defined to achieve the 20% target of renewable energy in the final energy consumption. Following the Renewable Energy Directive (2009/28/EC), each country has submitted a National Renewable Action Plan (NREAP) explaining which measures and mix is expected following the binding targets [EUC-11].
The European Union has a goal to reduce the greenhouse gas emissions by 80 to 95% (compared to 1990 levels) by 2050 [EUC-12]. The EU 2050 Energy Roadmap was published in the course of 2012 [ECI-1] and [EUC-8] with indicative pathways for the different sectors. Those goals are in line with the more recent COP21 agreement and with the Kyoto protocols which the EU has also committed to.
The European Commission [EUC-2] has estimated the GHG emissions reductions per sector needed to achieve the longterm commitments. Those are gathered in Figure 9. Electricity would need to achieve the following GHG emissions reductions (compared to 1990 level) to meet the targets: between 25% to 35% in 2020; between 54% to 68% in 2030; between 70% to 85% in 2040 (values extrapolated from 2030 and 2050); between 93% to 99% in 2050.
8% RES-E [%] Total
Sources:
EUROPEAN GHG EMISSIONS AND RES TARGETS
Sources: [EUC-3] [EUC-4] [KOT-1] The RES-E share target is an estimation as it depends on the developments in other energy sectors (transport, heat, …) and shifting between sectors (electrification, …). Those data are based on NREAP that were submitted by each country. Sources: [EUC-3], [EUC-4] ** No national targets yet defined. Estimations are based on studies of possible targets [KOT-1] 2015 2030 RES share (share of RES in energy mix) of RES in electricity
*
For 2030, the breakdown of RES targets for electricity was estimated to be around 50% for Europe and around 30% for Belgium in [KOT-1].
Total Primary Energy Supply Oil Oil Other RES RESSolidHeat SolidNuclearfossil Elec Gas Gas
SCENARIOS24 ASSUMPTIONSAND 2.1.5. CONSUMPTION OF ENERGY IN BELGIUM
Electricity represented 17% of the final energy consumption in Belgium Belgium imports more than 90% of its primary energy supply Belgium depends on more than 75% on fossil fuels for its primary energy supply 53.2 Mtoe (619 TWh) 41.7 Mtoe (485 TWh) Energy transformation and other losses
Belgium had a total primary energy supply of 53.2 Mtoe3 (which corresponds to 619 TWh) in 2015 [OBS-1]. After transformation and losses, the final energy consumption of Belgium was of 41.7 Mtoe in 2015 (485 TWh). Figure 11 indicates the proportions of the different fuels in the primary and final energy consumption of the country.
Final Energy ConsumptionSource: [OBS-1]
The final energy consumption of the country remained stable over the past 10 years, as did the share of energy carriers: — around 50% of oil; — around 25% of gas; — less than 20% of electricity; — rest consisting of direct heat, renewables and solid fossil fuels.
TOTAL PRIMARY ENERGY SUPPLY AND FINAL ENERGY CONSUMPTION IN BELGIUM IN 2015 (FIG. 11)
Belgium has no or low potential in primary fossil fuel resources: no gas and it phased out its coal production a long time ago. Therefore the only local energy comes from its renewable energy sources. Belgium is dependent on imports for more than 90% of its primary energy supply as all fossil fuels are sourced abroad. More than 75% of the primary energy used in the country is coming from fossil fuels (oil, gas, coal, ...), and the same conclusion can be drawn when looking at the final energy consumption.
3. Mtoe: Million tonnes of oil equivalent
SCENARIOS25 ASSUMPTIONSAND
2.1.6. GREENHOUSE GAS EMISSIONS IN THE ENERGY SECTOR IN BELGIUM 1990
100120806040200/year]CO[MT2
The energy sector in Belgium was responsible for more than 100 MTonnes/year CO2 equivalent emissions per year until the mid-2000s where a decreasing trend has been observed since then (see Figure 12). The 2014 GHG emissions were around 80 MTonnes of CO2 which represents a reduction of 21% compared to the 1990 level (usually taken as a reference for GHG targets).
Source: [EEA-1] TOTAL GHG EMISSIONS IN
national emissions from electricity becoming a net importer (or conversely, increase them by exporting if the generated electricity is from fossil origin) but this has not been taken into account in these figures as it only concerns national generation. Belgian emissions’ reduction is mainly due to coal generation being phased-out as it still accounted for around 20% of generated electricity in 2000. With the increase of interconnections between countries and the integrated market, it has become common practice to evaluate electricity emissions globally at the European perimeter In this respect, European electricity sector CO2 emissions are traded under the EU Emission Trading System where a cap is set on the total European emissions and not on a country basis. 1991 1992 1993 1994 1995 1996 1997 1998 1999 2000 2001 2002 2003 2004 2005 2006 2007 2008 2009 2010 2011 2012 2013 2014 BELGIUM ENERGY AND ELECTRICITY SECTOR (FIG. 12) CO2 emissions from the energy sector -34%-21%CO2 emissions from the electricity sector 1990 level 1990 level
FROM
The electricity sector accounts for around one fifth of the energy GHG emissions in Belgium (more than 20 MTonnes/ year until the mid-2000s). The observed decrease (from 1990 level) in 2014 amounted to 34%. It is important to note that electricity might be produced in one country and exported to another country. A country could ‘artificially’ reduce its
costs for renewables and storage facilities,
For 2050, scenarios become too speculative in terms of the maturity of possible technologies that may allow for high levels of decarbonisation to be achieved. As such, scenarios for 2050 have not been quantified. Although there are many uncertainties on the path from 2040 to 2050, there will be enough elements to support decision-making in the short-term in order to achieve the intermediate stage up to 2040. recent steep decrease in as well as an expected further reduction, volatile depend on many drivers that are for the large part very hard to predict. Different sensitivities have been analysed to cover such uncertainties. to Belgian law, the nuclear phase-out is planned between 2022 and 2025. The first time horizon analysed will also be used the years right after the planned phase-out.
to provide a view on adequacy requirements for
THE STUDIED TIME HORIZONS WILL ALLOW TO COVER 2 IMPORTANT MILESTONES TO REACH THE 2050 TARGET (FIG. 13) Growing uncertainties with time Uncertainties 20502040 Studied horizons 20302020 Uncertainties TODAY • Nuclear and coal phase out in CWE • Load growth • Decarbonisation ambitions • Pace of RES development and associated costs • Pace of electrification • Fuel prices • Additional decommissionings • New thermal plants • Storage developments • Load flexibility • Macro-economics• Market Design • Energy efficiency developments • CO2 market reforms • High voltage grid development • New technologies — 2030: This time horizon was already quantified and analysed by several national and European studies. The European Union has set targets in terms of renewables, CO2 emissions reductions and energy efficiency. The way to achieve them and how the effort will be split among member states and sectors is not fully known yet. This horizon also corresponds to changes in the thermal generation mix as several countries have announced nuclear, coal and lignite phase-outs or closures. A
and
Pursuant
26 SCENARIOS ASSUMPTIONSAND 2.2 STUDY FRAMEWORK 2.2.1. TIME HORIZONS CONSIDERED This study covers the period towards 2050. In order to evaluate the different options for Belgium to solve the Energy Trilemma, two time horizons will be studied in a more detailed manner: — 2040: This time horizon will be used to assess if shortand medium-term developments are robust in a future with growing uncertainties. For this reason, additional sensitivities at European level covering possible future trends in the electricity system such as the development of additional grid infrastructure and increased flexibility of the demand will also be performed.
could also profoundly impact the upcoming 10 years. Fuel and CO2 prices are
Iberia consisting of Spain and Portugal;
27 SCENARIOS ASSUMPTIONSAND THE SIMULATION PERIMETER COVERS 22 EUROPEAN COUNTRIES = EU22 (FIG. 14) Nordics BeNeLux British Isles France Iberia IT-SI Central DE-AT-CH EU22 2.2.2. SIMULATION PERIMETER
— The Italian-Slovenian region (IT-SI) consisting of Italy and Slovenia;
Twenty-two countries are explicitly modelled in detail for this study (named ‘EU22’). Those countries were clustered in eight regions for the purpose of showing detailed scenario —assumptions:
Given the position of Belgium in the heart of the European electricity system and its degree of interconnection, it is a must to simulate a large part of Europe. This will allow to accurately take into account European developments that have an impact on the country. Moreover, in order to properly assess the achievement of the decarbonisation targets the European electricity system has to be analysed as a whole.
— The BeNeLux region consisting of Belgium, the Netherlands and Luxembourg;
Other European countries are not modelled. No exchanges are assumed between the simulated perimeter and the non-modelled countries. Note that for the United Kingdom, Northern Ireland was considered as a separate entity given it is electrically disconnected from Great Britain. Northern Ireland and Great Britain were counted as countries although Northern Ireland is not one.
4.
— France;
— The British Isles consisting of the United Kingdom4 and the Republic of Ireland;
— The Central region consisting of Hungary, Slovakia, the Czech Republic and Poland;
— The Nordics consisting of Norway, Denmark, Sweden and Finland. All market simulations assume the current EU bidding zone configuration. Other configurations are out of scope of this study. Due to the specific market situations in Italy, Denmark, Norway and Sweden, these countries are modelled with more market nodes inside their country. This type of specific modelling is in line with the approach used in other studies done within the ENTSO-E context.
— The German-Austrian-Swiss region (DE-AT-CH) zone consisting of Germany, Austria and Switzerland;
The scenario build-up starts with defining possible future scenario storylines and their underlying causes and consequences. This is an important step enabling a more detailed quantification of the different technologies in the future. Given the large amount of parameters and assumptions, it is impossible to analyse all combinations. On the other hand, a coherent set of assumptions driven by key trends can be established. SENSITIVITIES FRAMEWORK (FIG. 15) SCENARIO STORYLINES
3 FOR THE FUTURE OF THE ELECTRICITY SYSTEM
Decentral [DEC] Base Case [BC] Large Scale RES [RES] Detailed quantification for 2030 and 2040 Energy Transition lead by decentral RES development and driven by prosumers and high electrification
Current trends & national policies reaching the 2030 RES targets
WERE CONSTRUCTED (FIG. 16)
— ‘Base Case’ [BC]: a future driven by national policies and current trends reaching the EU 2030 RES targets; — ‘Decentral’ [DEC]: a future driven by prosumers and high electrification on track with the 2050 targets;
28 SCENARIOS ASSUMPTIONSAND 2.3 LONG-TERM SCENARIO DEVELOPMENT
SCENARIOS AND
— ‘Large Scale RES’ [RES]: a future driven by European climate policies and cooperation enabling large scale RES development on track with the 2050 targets.
BE interconnections Additional interconnectors are economically assessed BE new thermal capacity Different new-built thermal mixes Scenarios 3 European future scenario storylines (and 2 sensitivities) Merit order 2 sets of fuel and CO2 price assumptions€ Ñ Ñ Ñ 2.3.1.
SCENARIOS
Large Scale RES development path and driven by global climate policies and European cooperation Today 2020 2030 2040
Three future scenario storylines were constructed for the electricity sector. Those are inspired by the draft scenario development report for the Ten Year Network Development Plan (TYNDP) 2018 published in October 2017 (joint ENTSO-E and ENTSO-G deliverable) [ENT-1]. Stakeholders were largely consulted about the various scenarios which will be used for the European gas and electricity network development reports to be published in 2018. This study has taken similar scenario storylines and adapted some of the assumptions to better reflect recent evolutions in national policies. More detailed assumptions for France, Great Britain, the Netherlands, Germany, Switzerland, Austria and an extensive amount of sensitivities for Belgium were Figureassessed.16 illustrates the three paths considered in this study:
SCENARIOS29 ASSUMPTIONSAND
is low as no major incentives are given to convert transport and heating installations to electricity usage. Nevertheless some users are switching to electrical transportation given the predicted cost reduction and maturity of technology.
New PV installations are also being installed in Belgium but at a slower pace than in the ‘Decentral’ scenario as it is more interesting to install them in the southern parts of Europe.
DEC THE ‘DECENTRAL’ SCENARIO
Electrification of heat and transport is moderately growing in all countries while flexibility options are put in place to manage this additional consumption. In order to accelerate the reduction of emissions, all European countries are rapidly phasing out their coal and lignite production.
A framework is set up to enable the most efficient use of storage facilities by increased digitalisation (smart meters, price signals, ...) and to enable flexible use of the Electrical Vehicles (EV) charging infrastructure and heating devices. Digitalisation also enables a higher amount of voluntary load shedding during peak winter periods, allowing additional reduction in demand from industrial and commercial consumers.
BC THE ‘BASE CASE’ SCENARIO
Whether this scenario will reach long-term decarbonisation targets is not known and will depend on the developments in the other sectors. Given the low electrification of the other sectors, the probability is high that a deviation from this path could happen or a larger gap will need to be filled between 2040 and 2050 to achieve the sustainability targets that Europe has committed to.
In the ‘Decentral’ scenario, the energy transition is on track and lead by prosumers The cost of PV and batteries is falling rapidly. Digitalisation and consumer’s price signals enable enough incentives for residential and some commercial and industrial users to invest massively in such technologies. In parallel, those ‘prosumers’ are switching to electric vehicles that can be charged at home given the surplus of energy produced by their PV installations. Heating electrification, combined with the increased efficiency of buildings, are also being further developed.
This scenario represents the minimum that has to be achieved to reach the EU 2030 targets. RES is being developed in a moderate way and mainly driven by national subsidy schemes and policies. After 2030, the same trends are Electrificationassumed.
RES THE ‘LARGE SCALE RES’ SCENARIO
In the ‘Large Scale RES’ scenario, the energy transition is on track and driven by European policies and cooperation between member states to use renewable resources on the European continent more appropriatly. This scenario presents the highest renewable share in electricity consumption, which is driven by large amounts of onshore and offshore wind developments in the North Sea and PV in Southern Europe.
The 10-year network development plan is a binding document drafted by ENTSO-E every two years (a similar document is issued by ENTSO-G). It contains the cost-benefit analysis of future transmission and storage projects with socio-economic and environmental criteria. It follows different consultation processes and is finally adopted by the European Commission.
What are the TYNDP2018 scenarios?
The cost-benefit analysis of future infrastructure is evaluated on different scenarios. The TYNDP2018 draft scenario report was released in October 2017 and contains the scenarios that will be used for the transmission infrastructure cost-benefit analysis [ENT-3]. For 2030 and 2040, three scenarios are considered together with one EC scenario: — Sustainable Transition Targets reached through national regulation, emission tradingschemesandsubsidies,maximisingtheuse ofexisting infrastructure. 2020 2025 2030 2040
BOX 4 - TYNDP SCENARIOS
What is the TYNDP – Ten Year Network Development Plan?
Figure 17 shows the ENTSO-E scenarios which are used as a basis for the TYNDP2018. The so called ‘bottom-up’ scenarios are based on data provided by TSOs. The ‘top-down’ scenarios are constructed based on the ‘Sustainable Transition 2030’ scenario with additional optimisation and rules.
GenerationDistributed Best ‘gas-before-coal’Best‘coal-before-gas’estimateestimate TransitionSustainable ActionGlobalTransitionSustainableClimate
How were the TYNDP2018 scenarios constructed?
— Distributed Generation Prosumers at the centre small scale generation, batteries and fuel switching society engaged and empowered.
European 2030 Target Scenario Best estimate
Source: [ENT-1]
SCENARIOS30 ASSUMPTIONSAND
The ‘Base Case’ scenario can be mapped to ‘Sustainable TheTransition’.‘Decentral’ scenario can be mapped to ‘Distributed TheGeneration’.‘LargeScale RES’ scenario can be mapped to ‘Global Climate Action’ for 2040. In 2030, the ‘Global Climate Action’ scenario was replaced by the ‘EUCO30’ scenario from the EU Commission [ENT-3].
ENTSO-E STORYLINES (FIG. 17)
GenerationDistributed Top-downBottom-upExternal
The TYNDP scenarios were developed in close cooperation with European energy stakeholders (environmental, consumer and producer associations, regulators, member Astates, ...).firstconsultation was held in the course of May/June 2016 on the scenario selection and additional input to take into account in the process. Several public workshops were organised with the stakeholders, member states, regulators and the European Commission [ENT-1]. The results of those workshops can be consulted online. The data for the ‘bottom-up’ scenarios were collected among TSOs at the end of 2016. The optimisation and build-up of ‘top-down’ scenarios was performed during the course of 2017. Correspondence between TYNDP and the scenarios of this study: The scenarios in this study are in-line with the three scenario storylines developed at ENTSO-E level. The following correspondence was set:
— Global Climate Action Full speed global decarbonisation, large scale renewables development in both electricity and gas sectors.
European 2030 Target Scenario (EUCO30) – External scenario developed by the European Commission Scenario developed by the EC with the PRIMES model targeting the achievement of the 2030 climate and energy targets and an energy efficiency target of 30%.
Thermal units are modelled unit by unit in the CWE region, Spain and Great Britain with the most recent forecasts based on national studies and the latest energy policies. In the TYNDP modelling framework, these units are aggregated per technology category;
2.3.2. ADDITIONAL EUROPEAN SENSITIVITIES FOR 2040
An additional 30 GW of interconnection capacity is added in both directions between all European countries.
Given that the scenarios were developed without having the full set of assumptions from the TYNDP2018 available to us, some data differences can be observed and are based on other studies and forecasts. Moreover, Elia improved some parts of the modelling to take into account the most recent information for the CWE region (if available when constructing the scenarios).
For 2040, additional sensitivities were constructed to reflect possible evolutions in terms of interconnections, flexibility and renewable development in Europe. Their impact on European indicators is assessed and the robustness on Belgian technology options tested.
The main differences are: This study covers 22 countries while the TYNDP covers the whole of Europe. This has very limited or no impact on the results for Belgium; The study performs a full adequacy assessment for each scenario and sensitivities which is not the case in the TYNDP simulations where adequacy is ensured but with lower accuracy (less climate and ‘Monte-Carlo’ years and no thermal derating for balancing reserves); Demand response shedding is modelled explicitly in this study for all countries and time horizons while the TYNDP covers a limited number of countries based on TSO input; Demand response shifting modelling for all countries (this is not yet included in the TYNDP modelling framework);
The generation merit order (fuel and CO2 prices) is one of the sensitivities in this study. In the TYNDP, each scenario is linked to one set of fuel and CO2 price assumptions; Possible commercial exchanges between countries in Europe might differ slightly as this study starts from the 2025 grid applied for the ENTSO-E Mid-Term Adequacy Forecast (MAF) while the reference grid used for the TYNDP2018 will only be known after the collection of projects that will be finalised by the end of 2017; The goal of this study is to assess different options for Belgium. Therefore a large amount of sensitivities are considered for Belgium. In the TYNDP2018 only one set of assumptions can be used for a country for a given scenario.
These possible future scenarios are based on past observations and current trends. On top of the three scenarios, different sensitivities will be assessed both at the 2030 and 2040 time horizons to test their robustness against changes to some key assumptions for Europe and Belgium.
What are the differences between TYNDP and the scenarios of this study?
Grid+ THE ‘GRID+’ SCENARIO
SCENARIOS31 ASSUMPTIONSAND
This sensitivity is based on the ‘Large Scale RES’ scenario All assumptions are identical besides the amount of interconnections between the European countries in the studied perimeter (except for Belgium as the increase of interconnection capacity is assessed as sensitivity for all scenarios).
The details on the initial interconnection assumptions and sensitivities can be found in Section 2.7 Flex+ THE ‘FLEX+’ SCENARIO
This scenario is based on the ‘Decentral’ scenario where the demand flexibility was increased for all the countries In this scenario 50% of the EVs can be used as storage devices on the grid (the so called ‘Vehicle-to-Grid’ V2G) and on top of this, 50% of EVs and heat pumps consumption can be fully optimised during the day. See the Section 2.4.2.1 and 2.4.2.2 for more details on these assumptions.
SCENARIOS32 ASSUMPTIONSAND 2.3.3. OVERVIEW OF DATA NEEDED FOR SCENARIO DEFINITION Figure 18 gives an overview of all the data required to perform the simulations of the EU22 electricity market. For each constructed scenario, assumptions will be made on: 2.3.4. SUMMARY OF THE SCENARIO FRAMEWORK SUMMARY OF THE EUROPEAN GENERATION AND DEMAND SCENARIOS USED IN THIS STUDY (FIG. 19) 20402030 Main scenarios BCBC DECDEC RESRES Flex+ AdditionalGrid+EUsensitivities The three scenarios storylines defined in this sections will be assessed for both the 2030 and 2040 time horizons. Additionally for 2040, two European sensitivities will also be simulated consisting of: — Additional interconnections between European countries (+30 GW); — Additional flexibility of the demand for all countries. Those scenarios will be combined with two different merit orders, which differ in fuel and CO2 prices (see Section 2.8.1 for more details) Demand Total consumption Energy Economicefficiencygrowth Additional electrification Electric vehicle penetration Heat pump penetration Demand response Shifting of demand Shedding of demand Available resources Generation Nuclear and fossil Renewables Storage BatteriesPumped-storage VariableEconomicscosts Fuel and CO2 prices Operation and Maintenance costs Fixed costs FixedCAPEXOperation & Maintenance costs WACC ClimatologicalcapacitiesSimultaneousCross-borderInterconnectionsexchangecapacitiesmaximumimportVariablesvariables Solar production Wind HydrologicalDemandproductionthermo-sensitivityconditions Outage of units Planned, i.e. maintenance Unplanned definitionScenario DATA TO BE DEFINED FOR EACH SCENARIO (FIG. 18) € — Interconnections (cross-border exchange capacities and simultaneous maximum import capacities) between all simulated market zones; — Variables (Climate and unit availability) needed to perform probabilistic studies (dealt with in the next chapter). — Variable and fixed costs for each technology; — Demand (total consumption evolution, electrification and demand response) for each country; — Available resources (generation and storage) for each country;
different penetrations; 3.
Economicgrowth/populationEnergyefficiency Electricvehicles Heatpumps Growth electrificationAdditional2 sensitivityThermo-3 DEMAND CONSTRUCTION STEPS (FIG. 20) 1 Total demand Total normalised demand [TWh] 80828486889092 2010 2011 2012 2013 2014 2015 85.6 2.4.1.1.
For
1.
The future consumption profiles (and hence total demand) constructed in three steps as shown on Figure 20: Growth of the consumption due to economic growth/ population Additional electrification is quantified and added to the profile based on Thermo-sensitivity of the consumption is applied which lead to different profiles and volumes for each climate year.
2.4.1. ELECTRICITY CONSUMPTION
are
SCENARIOS33 ASSUMPTIONSAND 2.4 BELGIAN DEMAND AND GENERATION ASSUMPTIONS
Most of the assumptions used in this study for Belgium were defined on the basis of a review of national and European studies (see Annex 7.1 for more information). is important to mention that there is no guarantee that the volumes of demand response, RES, storage and thermal units defined for each scenario and for each country will be developed or invested in. the next three years (2018-19, 2019-20 and 2020-21), more detailed information for Belgium can be found in the Elia report on the need for Strategic Reserve for winter 2018-19 and in the Excel file submitted for public consultation [ELI-1]. Demand growth driven by economic and energy efficiency all scenarios and time horizons, it has been assumed that for Belgium energy efficiency savings in the electricity sector will be compensated by the economic population growth of the country. This leads to a demand growth (excluding additional electrification) of 0%. The normalised consumption profile and total normalised demand of 85.6 TWh is therefore taken as basis for the future.
It
and energy efficiency; 2.
For
The methodology and tools used are based on the developments made in the framework of adequacy studies and TYNDP. More information can be found in the ‘Mid-Term Adequacy Forecast’ 2017 published by ENTSO-E in October 2017 [ENT-2].
A part of the electric vehicle fleet is assumed to allow bi-directional flow (‘Vehicle-to-Grid’ (V2G)) to act as storage for the system. Those are modelled as demand flexibility and storage facilities, see Section 2.4.2 and Section 2.4.4 for more information on the amount considered and modelling. 45% 25% 15% (FIG. 21)
For 2030, it is assumed that there will be a penetration of 5% for hybrid heat pumps in all scenarios on the total heating installations in Belgium. Concerning the electric heat pumps, a penetration of 3% is foreseen for the ‘Base Case’ and ‘Large Scale RES’ scenarios and 10% in the ‘Decentral’ scenario.
≈
2.4.1.2. Additional electrification Additional electrification (on top of the existing devices in 2015 already taken into account in the normalised and total consumption profile) was added by considering the increase of electric vehicles (EVs) and heat pumps (HPs). Electric vehicles Figure 21 summarises the expected evolution of electric vehicles penetration until 2040. These data are mainly based on the ‘Global EV Outlook 2016’ [IEA-1] for the ‘Base Case’ and ‘Large Scale RES’ scenarios. For the ‘Decentral’ scenario, a penetration of electric mobility of around 45% of the total vehicle fleet in 2040 was considered (which corresponds to around 2.5 million light-duty vehicles in Belgium). Higher penetrations of electric mobility are assumed in this study for ‘Decentral’ and ‘Large Scale RES’ scenarios compared to the TYNDP2018 scenarios.
[millions]BEinEVsof# 0.51.52.53210 2010 2015 2020 2025 2030 2035 2040 DECBCRES Year PENETRATION 2007 2008 2009 2010 2011 2012 2013 2014 2015 2016 2017 Number of EVs (thousands) in BE 2007-2017 [SPF-1] 101550 0.4 Mio 0.9 Mio 0.5 Mio 2.5 Mio 1.3 Mio 0.9 Mio
Heat pumps are seen as one of the future ways to reduce emissions in the heating sector. Two types of heat pumps are considered: electric and hybrid. The first option could lead to a major impact during cold winter peaks as the system will mainly be powered by electricity. A commonly proposed solution to this issue is the use of hybrid heat pumps which means that electricity can be used in base load times and usually gas during the peak load periods. The penetrations of electric and hybrid heat pumps, (i.e. compared to the total number of installed heating units) estimated for each scenario and time horizon, is based on the approach used in the TYNDP modelling framework as described in the draft scenario report [ENT-1].
EVOLUTION OF THE NUMBER OF ELECTRIC VEHICLES PER SCENARIO IN BELGIUM
pumps
Heat
SCENARIOS34 ASSUMPTIONSAND
≈
≈
The additional consumption is taken into account with several typical charging profiles depending on user behaviours. Those were created by the French TSO (RTE) and used by ENTSO-E to construct the demand profiles [RTE-1]. Those consumption profiles already assume that part of the vehicle fleet is optimally charged to minimise the consumption during peak moments
For 2040, the electric heat pump penetration for the ‘Base Case’, ‘Large Scale RES’ and ‘Decentral’ scenarios is set to 10%, 20% and 30% respectively . For hybrid heat pump penetration, 10% is assumed for the ‘Base Case’ and ‘Large Scale RES’ and 15% for the ‘Decentral’ scenario. Figure 22 summarises these assumptions.
ELECTRIC/HYBRID HEAT PUMP PENETRATION FOR EACH SCENARIO IN BELGIUM (FIG. 22) BC DECRES 3% / 5% 10% / 10% 3% / 5% 20% / 10% 10% / 5% 30% / 15%20302040 2.4.1.3. Thermo-sensitivity
The normalised hourly load profile of 2015 (i.e. without thermo-sensitivity effect) is used as a reference to construct thirty-four hourly load profiles by considering a large range of temperature conditions. In this way, thirty-four historical daily temperature time series are used in the computation to provide an hourly load profile for each climatic year. This process is performed through a centralised tool in ENTSO-E for European studies. More information on the methodology can be found in the MAF report pages 36-40 [ENT-2]. The Belgium consumption is therefore taken into account by the model through thirty-four different load profiles with an hourly resolution.
pumps EVs
[%]
BOX 5 -
SCENARIOS35 ASSUMPTIONSAND
Thermo-sensitivity
Total electricity demand Economicpopulationgrowth/ Energy efficiency Electric vehicles Heat penetration HPs
penetration [%] THE TOTAL DEMAND IS BASED ON 5 MAIN DIMENSIONS (FIG. 23) BC DECRES BC DECRES DEMAND CONSTRUCTION – ILLUSTRATION WITH A WEEKLY PATTERN (FIG. 24) Ê Ê National normalised load National load with thermo-sensitivity effect National load with thermo-sensitivity effect and EVs consumption National load with thermo-sensitivity effect, EVs and HPs consumption Thermo-sensitivityeffectisaddedto thenormalisedloadprofile Monday Tuesday Wednesday Thurdsday Friday Saturday Sunday 101213141598[GW] Electric vehicle hourlyis addedconsumption Monday Tuesday Wednesday Thurdsday Friday Saturday Sunday 101213141598[GW] Heat pump hourlyis addedconsumption Monday Tuesday Wednesday Thurdsday Friday Saturday Sunday 101213141598[GW] Forecasted national load profile for a climate year Monday Tuesday Wednesday Thurdsday Friday Saturday Sunday 101213141598[GW] =
Step 3: Thermo-sensitivity effect is added through the historical 34 daily temperature time series from the Pan-European Climate Database (ENTSO-E) leading to 34 different load profiles for each scenario/time horizon; In summary, the demand evolution will depend on five main parameters as described in Figure 23. Figure 24 illustrates the construction of the Belgian load profiles taking into account the penetration of EVs and HPs in a given week. HOW ARE CONSUMPTION PROFILES CONSTRUCTED?
The methodology used to construct these profiles is based on the approach followed in TYNDP2018 and MAF for European studies [ENT-1] [ENT-2]. The construction of consumption profiles for all countries is based on the following process: Step 1: The total demand growth (energy efficiency, economic growth, ...) is defined and applied to the normalised hourly load profile of 2015 (i.e. where temperature effects are removed); Step 2: The penetration of electric vehicles and heat pumps are defined for each scenario and added to the hourly consumption profiles.
36 SCENARIOS ASSUMPTIONSAND
204020302027 PEAK LOAD EVOLUTION IN BELGIUM FOR EACH SCENARIO (FIG.
101112131415161718[GW]loadPeak From growth/year0%publishedAdeqFlex2017-2027inApr.20160.6%growth/year Legend MinP10P50P90Max 16.5 15.5 14.414.4 14.214.2 14.6 13.5 BC BCDEC DECRES RES 8990.4 88.8 90.294.197.6Historical nomalised total demand 2010 2011 2012 2013 2014 2015 2016 2017 2018 2019 2020 2021 2022 2023 2024 2025 2026 2027 2028 2029 2030 2031 2032 2033 2034 2035 2036 2037 2038 2039 2040 EVOLUTION OF THE TOTAL ELECTRICITY CONSUMPTION FOR EACH SCENARIO (FIG. 25) 10297928782[TWh] DECBCRES 85.6 Different electrification assumptions will create a range of total consumption values between scenarios. Figure 25 gives the evolution of the total electricity consumption for Belgium in the three scenarios. For 2030: — the ‘Large Scale RES’ and ‘Base Case’ scenarios have a similar average consumption of around 89 TWh; — a slightly higher total consumption of 90.4 TWh is obtained in the ‘Decentral’ scenario.
To allow the comparison with the Elia ‘Adequacy and Flexibility’ Study 2017-27 published in April 2016, the peak load distribution used for 2027 (0%/year & 0.6%/year growth scenarios) is also represented on Figure 26.
2.4.1.4. Total consumption after adding electrification and thermo-sensitivity
For 2040 the spread between scenarios is higher: — the average demand in the ‘Base Case’ scenario is around 90 TWh; — the ‘Large Scale RES’ scenario around 94 TWh and; — the ‘Decentral’ scenario around 98 TWh.
The represented range around each scenario on Figure 25 corresponds to the climate uncertainty on the total electricity consumption, and does not significantly differ per scenario.
Figure 26 shows the peak load distribution for each scenario before applying any demand flexibility (shedding or shifting) and storage. Those devices are economically dispatched by the model as described in Section 2.4.2 and Section 2.4.4.
The peak load distributions in 2030 are lying between the load growth scenarios (0%/year and 0.6%/year) developed in the 2016 Elia study. For 2040, given a higher spread in electrification assumptions (both in heat pumps and electric vehicles), a difference of 1 GW on average between the scenarios is observed. The ‘Large Scale RES’ scenario has a peak demand of 1 GW higher than the ‘Base Case’ scenario. The same difference can be observed between the ‘Decentral’ and ‘Large Scale RES’ scenarios. 26)
37 SCENARIOS ASSUMPTIONSAND 2.4.2. DEMAND RESPONSE IN THE MARKET Figure 27 provides the considered characteristics of both demand response types and the associated limitations that are taken into account. DEMAND FLEXIBILITY MODELLING (FIG. 27) Without demand-side integration With demand-side integration Pricing Activation price from 300 to 1000 €/MWh per step of 50 €/MWh Economically optimised Max use per day 3 hours Maximum amount of energy that can be shifted daily Recovery of demand No Yes, within the day LOAD SHIFTING 0h 12h 18h 24h [MW] 0h 12h 18h 24h LOAD SHEDDING [MW] Demand response reacting to price signals is taken into account by modelling shedding and shifting of consumption The demand response contracted for ancillary services is not modelled as it is assumed not to participate in the modelled market and as such providing part of the needed flexibility options to balance the grid.
The demand shifting assumptions are given in Figure 29. The following assumptions were taken to derive the data (% of electric vehicles and heat pumps that are optimised by the model):
2016 2017 2018 2019 2020 2021 2022 2023 2024 2025 2026 2027 2028 2029 2030 2031 2032 2033 2034 2035 2036 2037 2038 2039 2040 LOAD SHEDDING VOLUMES ASSUMED IN EACH SCENARIO (WITH A MAXIMUM OF 3 HOURS OF ACTIVATION PER DAY) (FIG. 28) 0.51.52.5210[GW] RESDEC2 1.11.1GWGWGW 0.8 GW 0.6 GW 2 1.3GWGW1.1GW BC 31 GWh/day 6 GWh/day 2016 2017 2018 2019 2020 2021 2022 2023 2024 2025 2026 2027 2028 2029 2030 2031 2032 2033 2034 2035 2036 2037 2038 2039 2040 DAILY LOAD SHIFTING VOLUMES IN WINTER ASSUMED IN EACH SCENARIO FOR BELGIUM (FIG. 29) [GWh/day] Flex+DECRES2 GWh/day 1.40.7GWh/dayGWh/day303132109876543210 0.6 GWh/day BC
— For the 2016-2020 period, a growth of +5%/year was assumed as agreed for the short-term forecast to be used in the framework of the Strategic Reserves volume evaluation;
In this study, it is assumed that:
38 SCENARIOS ASSUMPTIONSAND
— For 2030, the same assumptions used in the Elia ‘Adequacy and Flexibility ’ study 2017-2027 were taken for the ‘Base Case’ and ‘Large Scale RES’ scenarios (1.1 GW) and which was based on the market response study performed in 2016 [ELI-6]. This would correspond to a yearly growth of around 4% from the current value to the 2030 time horizon. For the ‘Decentral’ scenario, this value was increased to 2GW which corresponds to a yearly growth of 8% per year from current values;
— Total volume of shedding response is equally distributed by activation price and steps of 50€/MWh.
2.4.2.1. Demand shedding Load shedding are consumers that can reduce part of their consumption when prices reach a certain level (called the ‘activation price’). An activation price merit order was constructed based on the assumed volume of demand —shedding:Activation price between 300 and 1000 €/MWh;
2030 — ‘Base Case’: 0%; — ‘Large Scale RES’: 5%; — ‘Decentral’: 10%; 2040 — ‘Base Case’: 5%; — ‘Large Scale RES’: 5%; — ‘Decentral’: 10%; For the ‘FLEX+’ scenario, it was assumed that 50% of the electric vehicles and heat pumps can be optimised on the model price. This results in 31 GWh/day for Belgium.
The demand shedding assumptions for Belgium are taken from the yearly study carried out to evaluate the market response for the Strategic Reserves volume evaluation. Estimations were done in 2015 and 2016 [ELI-3] and most recently during 2017 [ELI-4].
In the latest market response evaluation study conducted for the Strategic Reserves evaluation in 2017, the market response was evaluated to be 637 MW in 2016. Note that on top of the price-responsive demand response, 441 MW of demand response was also contracted by Elia for ancillary services in 2016 (this volume is not reacting to market prices given that it should remain available in real-time to provide balancing reserves).
— The same amounts were assumed for 2040 in the ‘Decentral’ and ‘Base Case’ scenarios. A small growth was foreseen for the ‘Large Scale RES’ scenario, which reached 1.3 GW in 2040.
2.4.2.2. Demand shifting ‘Load shifting’ consists of consumption that can be moved to another moment within the day. This kind of flexibility option can be used to optimise the consumption profile in relation to electricity prices or other signals. Enhancing such flexibility will require the installation of smart meters or other devices enabling information exchange and monitoring of consumption in real-time.
— Additional electrification is eligible for demand shifting; — A percentage of heat pumps and electric vehicles consumption is therefore considered as flexible within a day; — The shifting of consumption is optimised to minimise the total costs of operation of the system (hence optimised on the hourly marginal electricity price resulting from the model).
Figure 28 illustrates the assumptions for each scenario.
‘A low-carbon roadmap for Belgium FPS Health, Chain Safety and Environment’ with a large amount of references to RES potentials [FPS-1].
renewable
SCENARIOS39 ASSUMPTIONSAND
spatial, public
offshore wind, biomass, geothermal, hydro).
6 - BELGIAN RENEWABLE POTENTIAL FOR ELECTRICITY GENERATION
Walloon region RES potential (Clusters Technologiebelow:WallonneEnergie2011)[CTW-1];Flanderspotentialfor2020(Infrax,Eandis,Elia2012)[ELI-5]; BELGIAN LONG TERM RES POTENTIAL (>2050) IS LIMITED DUE TO AVAILABLE SPACE, VERY DENSE URBANISATION OF THE COUNTRY, WEATHER CONDITIONS AND TOPOGRAPHY (FIG. 30) Estimations of max wind & PV potentials If combined, those could reach in theory a maximum of 90TWh (if we assume all the energy produced can be evacuated to the consumer) in the long run. Given technical and other constraints, reaching such RES production earlier than in 2050 is very optimistic. Note also that the build-up rate of the installations as well as public acceptance and integration in distribution and high voltage grid could be limiting factors. Other RES sources Sources: [CTW-1][ELI-5] [FPS-1] [FPB-1] < 40 GW All Belgian rooftops with PVPV < 8 GW Ambitious potential given restricted areas in the Belgian Exclusive Economic Zone offshorewind < 4 GW Maturity, challengestechnicalthermalGeo < 0.15 GW Very limited due ofhydrography/topographytoBelgiumHydro Local biomass potential is very onSustainabilitylimited.concernsimportedbiomass.Biomass 2.4.3. RENEWABLE GENERATION The first step consists in defining the boundaries for RES development based on the maximum RES potentials in Belgium. The installed renewable capacities taken into account in each scenario were constructed to follow the defined scenario storylines. The values cover the range observed in other Belgian or European studies on this matter. < 9 GW Max potential taking into account some restricted areasonshorewind
Food
onshore
The evaluation of the potential for renewable generation is not an easy task as it should consider technical, acceptance and constraints. Several studies were conducted in the past for the Belgian regions to evaluate such potentials. An non-exhaustive overview of studies that took or calculated such assumptions are given
Figure 30 provides a summary of the installed maximum capacities for the most common sources (PV, and Other sources or emerging technologies were not considered.
The assumptions taken by Elia are mainly based on the study ‘Towards 100% renewable energy in Belgium by 2050’ (Federal Planning Bureau, ICEDD, VITO 2012) [FPB-1].
BOX
meteorological
Biomass potential is usually calculated as follows: the total amount of sustainable biomass possible in the world, divided by the amount of inhabitants of each country (several methods are used to spread the potential per capita) [FPB-1].
The retained value from the [FPB-1] study is 4 GW Note that the electricity generation from geothermal is based on thermal units which can make it more controllable and non-intermittent.
Photovoltaic potential
Public acceptance and other criteria (aviation routes, landuse, ...) are limiting factors for the onshore wind’s development.
Studies and reports have shown concerns on the sustainability of large-scale biomass based on imported fuel given the large amount of indirect emissions due to the transportation and fine particles’ emissions [GPE-1] [BXE-1].
Belgium has the smallest Exclusive Economic Zone in the North Sea (compared to our neighbours) where wind turbines could be installed. The ‘first wave’ of offshore concessions are expected to achieve 2.3 GW of installed offshore generation by Additional2021.
The current installed capacity could be slightly increased but remains very limited (around 150 MW) [FPB-1].
wind turbines could be built in other areas of the sea after taking into account constraints such as navigation routes, protected areas, distance to the shore, ... which limit the available space for additional wind development. It is assumed in this study that 8 GW of offshore wind is the maximum potential for the Belgian sea (potential also assumed in [FPB-1]). Depending on how the above constraints would evolve, this ambitious amount could require wind turbines to be installed in other countries’ zones and connected to the Belgian grid. On top of sea use constraints, the grid has to be developed accordingly in order to evacuate the produced energy. Additional studies on Belgian offshore wind potential were conducted by Belspo and can be found in [BEL-1].
Some studies have demonstrated (after making a cartography of the territory applying some distance rules) that this could amount to 9 GW in Belgium [FPB-1]. Technically, the energy has also to be evacuated from the production location or stored which will require grid upgrades, storage facilities or temporary curtailments.
SCENARIOS40 ASSUMPTIONSAND
There is some geothermal potential in the Limburg region in Flanders (estimated to be around 3 GW by VITO) and in the Mons area [FPB-1]. Currently there is one unit in Saint-Ghislain producing heat for 75% of its inhabitants (around 15 MW but not for electric power) [LES-1] [NSC-1].
Note that the electricity generation from biomass is based on thermal units which makes this technology more controllable and non-intermittent. Hydro potential
Moreover, given that Belgium is one of the European countries with the highest population density (>300 inhabitants per square kilometer), available space is limited.
Offshore wind potential
The potential for the generation of electricity from hydro is very limited given the relief and hydrology of the country.
Given very limited local potential in Belgium, no value was assumed in this study. The current installed biomass and waste capacity was assumed to remain stable for the future time horizons.
The large surface needed for the PV panels leading to geographically distributed production; The evacuation (or storage) of the excess of energy when penetration levels increase. If all rooftops (excluding shadow zones) are covered with PV panels (around 250 km² for Belgium), this would correspond to about 40 GW of generation capacity [FPB-1]. This value is retained as maximum potential but reaching such amounts would certainly require massive curtailment or large amounts of local storage capacities and/or local grid upgrades to evacuate or store the produced energy surplus. As mentioned in some studies (see sources above), the potential could be much greater considering other surface types such as fields, roads, along highways and train tracks, windows, walls, ...
Onshore wind potential
Geothermal potential
In Belgium, energy from the sun is converted into electricity with photovoltaic panels which are mostly installed on rooftops. Other installations use solar energy to heat water, but those are out of scope of this study. Main challenges are:
Biomass potential
The installed onshore wind capacity was expected to increase by 170 MW/year (based on the projections made by the regions in 2016). A more up-to-date forecast can be found in the report for the Strategic Reserve volume evaluation for winter 2018-19 that will be published by the end of 2017.
SCENARIOS41 ASSUMPTIONSAND
2.4.3.1. Biomass In the model, a distinction is made between the biomass units with and without CIPU5 contracts as is done in the framework of the volume determination of the Strategic Reserves: — The biomass units with CIPU contracts are modelled individually with historical availability rates; — The non-CIPU biomass units are taken into account by the model through hourly normalised profiles. These time series are constructed on the basis of available historical data.
900 MWBiomass in all scenarios signatory of the CIPU contract is the single point of contact at Elia aspects of the management of the production unit injecting electricity into the high-voltage grid. The CIPU contract serves as the basis for the provision of other reserve and the activation by Elia of such reserve power.
The installed capacity forecasted by the regions for 2020 is assumed to remain stable in the future. The total installed capacity (both CIPU and non–CIPU) considered is 900 MW for all scenarios and time horizons. In the model, these units are set as ‘must run’, i.e. they operate baseload given industrial reasons or following other specific requirements (heat, demand, ...).
42005900 INSTALLED ONSHORE WIND CAPACITY PER SCENARIO IN BELGIUM (FIG. 31) 1000200030004000500060007000800090000[MW] 2010inforecasted201620112012201320142015 2016 2017 2018 2019 2020 2021 2022 2023 2024 2025 2026 2027 2028 2029 2030 2031 2032 2033 2034 2035 2036 2037 2038 2039 2040 8400 33005400 2400 RES + 300 MW / YEAR DEC + 170 MW / YEAR + 90 MW / YEAR BC4200 2300 DECRES INSTALLED OFFSHORE WIND CAPACITY PER SCENARIO IN BELGIUM (FIG. 32) 1000200030004000500060007000800090000[MW] 2010 2011 2012 2013 2014 2015 2016 2017 2018 2019 2020 2021 2022 2023 2024 2025 2026 2027 2028 2029 2030 2031 2032 2033 2034 2035 2036 2037 2038 2039 2040 2300 80005000 4000 BC 4000 5. CIPU: Contract for the Injection of Production Units. The
for
Following the scenario storylines it was assumed that for: — the ‘Base Case’ scenario, around half of the expected growth rate of 2015-20 is applied for the future. This leads to 3.3 GW in 2030 and 4.2 GW in 2040; — the ‘Decentral’ scenario, the expected growth rate of 201520 is applied for the upcoming years. This leads to 4.2 GW in 2030 and 5.9 GW in 2040; — the ‘Large Scale RES’ scenario, twice the expected growth rate of 2015-20 is applied, reaching 8.4 GW in 2040 (almost the maximum potential of the country for this technology).
2.4.3.2. Onshore wind
power,
2.4.3.3. Offshore wind
These assumptions are summarised in Figure 31.
The installed offshore wind capacity is expected to reach around 2.3 GW by the end of 2021 according to the latest planning of offshore concessions. The future evolution beyond 2021 was assumed as follows:
— No increase of offshore wind in the ‘Decentral’ and ‘Base Case’ scenarios towards 2030; — A ‘second offshore wave’ enabling offshore capacity to reach 4 GW in 2030 for the ‘Large Scale RES’ scenario. For 2040: — the ‘Base Case’ scenario was assumed to reach 4 GW; — for the ‘Decentral’ scenario: 5 GW; — and the ‘Large Scale RES’ scenario assumed to reach the maximum potential of 8 GW These assumptions are summarised in Figure 32. The maximum potential was assumed to be reached in the ‘Large Scale RES’ scenario by 2040 based on the fact that the optimisation performed at ENTSO-E for the TYNDP2018 ‘Global Climate Action’ scenario has shown that in the case of coordinated developement of RES in Europe, the maximum potential is reached in Belgium. This is also in-line with the ‘Large Scale RES’ scenario storyline which considers accelerated development of offshore wind favouring places with better wind conditions.
through thirty-four historical monthly production
—
2.4.3.5. Geothermal Production of electricity from geothermal sources was only assumed in the ‘Large Scale RES’ scenario (100 MW in 2030 and 500 MW in 2040). No geothermal development was hydro
considered in the ‘Base Case’ and ‘Decentral’ scenarios. Figure 34 summarises those assumptions. 2.4.3.6. Run-of-river
Belgium between
115 MWHydro in all scenarios ASSUMED GEOTHERMAL GENERATION CAPACITY IN THE 'LARGE SCALE RES' SCENARIO (FIG. 34) 100 MW 500 MW thermalGeo 20402030 RES 2.4.4.
latest
This
growth in PV installations
development
‘Decentral’
—
The potential for is limited As only small projects are planned for the of this are taken into account by the model profiles. STORAGE
’
—
300 MW/year
build up rate of 600 MW/year was
6 GW in
This study has considered pumped-storage units, alone . Seasonal storage technologies are not mature yet as technological improvements and demonstration projects are still ongoing. Therefore no seasonal storage such as ‘Power-to-X’ were considered for the studied time horizons. Those solutions could be key to bridge the gap from 2040 to 2050 given the large amount of intermittent generation that will need to be evacuated.
SCENARIOS42 ASSUMPTIONSAND
with only a few additions per year. A renewed growth in installations is
PV grows
type of production, the additions were neglected. Theses units
2.4.3.4. Solar PV installations were mainly installed in 2008 and 2012. The build-up rate decreased afterwards expected on forecasts. was assumed that: the ‘Base Case scenario is around 100MW/year reaching 2040; the ‘Large Scale RES’ scenario with obtaining 2040; the scenario assumed. leads
stand–
renewable
in the next years based
10 GW in
run-of-river hydro
in Belgium (around 150 MW).
Beyond 2020 it
to 18 GW in 2040. These assumptions are summarised in Figure 33. 3500 10000 7000 18000 11600 INSTALLED SOLAR CAPACITY PER SCENARIO IN BELGIUM (FIG. 33) 10000120001400016000180002000080006000400020000[MW] 2010 2011 2012 2013 2014 2015 2016 2017 2018 2019 2020 2021 2022 2023 2024 2025 2026 2027 2028 2029 2030 2031 2032 2033 2034 2035 2036 2037 2038 2039 2040 6000 5000 + 300 MW / YEAR RES + 600 MW / YEAR DEC + 100 MW / YEAR BC
batteries and electric vehicles’ batteries
[GW]capacityInstalled
— A domestic fast charger of around 7 kW [ZAP-1] [SIB-1] [NGR-1]; Assuming that: — half of a vehicle battery could be used as pure storage facility for the system; — a roundtrip efficiency of 90% and no limitations concerning charge/discharge cycles; This results in: — A V2G can offer around 25 kWh of storage with 7 kW of power to the system which roughly corresponds to the characteristics of a battery with 7 kW of power and 3 hours of storage.
— An average vehicle battery of around 50 kWh [SIB-1];
It is important to note that the model will optimise the operational cycles of the V2G fleet to minimise the total cost of the system (and not to balance a residential load nor to provide ancillary services) which implies that there are hourly price signals and that the vehicle is connected permanently to the grid.
Figure 36 summarises the batteries assumptions for Belgium (both stationary and V2G). STORAGE V2G 36)
TOTAL AMOUNT OF
2.4.4.1. Pumped-Storage
CAPACITY IN STATIONARY AND
2.4.4.3. ‘Vehicle-to-Grid’: A part of the electric vehicle fleet is assumed to allow bidirectional flows between the vehicle batteries and the grid, so-called ‘Vehicle-to-Grid’ (V2G). Those vehicles - when connected to the power grid - can store or release energy based on different signals. Energy can therefore be stored in the vehicle batteries and released at a later stage.
Considering:
The share of the vehicle fleet and corresponding amount that is permanently connected to a fast charger and that uses the battery to optimise the system for each scenario:
2.4.4.2. Stationary batteries: The installed capacity (power) of stationary batteries was computed following a percentage of installed solar capacity:
SCENARIOS43 ASSUMPTIONSAND
2030 — ‘Base Case’: 0%; — ‘Large Scale RES’: 5%; — ‘Decentral’: 10%; 2040 — ‘Base Case’: 5%; — ‘Large Scale RES’: 10%; — ‘Decentral’: 10%;
The current installed capacity of 1.3 GW for pumped-storage in Belgium (Coo 1 & 2 and Plate Taille) is considered to remain in all scenarios and time horizons. The dispatchable reservoir volume is 5.3 GWh (5.8 GWh where 0.5 GWh is considered to be reserved for ancillary services). For the ‘Large Scale RES’ scenario in 2030 and 2040, a new unit of 600 MW was considered in Coo (‘Coo 3’) (see Figure 35). The total reservoir was increased proportionally 7.7 GWh [ENG-1]. PUMPED-STORAGE CAPACITY FOR BELGIUM FOR EACH SCENARIO (FIG. 35) 0.20.40.60.81.21.41.61.8210 1.9 GW 1.3 GWBC DEC RES Coo 3
— No limitations in terms of the amount of charge/discharge cycles (the utilisation is only limited by the available energy in the reservoir at a given time).
BATTERIES (FIG.
[GW]capacityInstalled 10.012.08.06.04.02.00 Stationary V2G BC DECRES BC DECRES 20402030 Flex+ 1.88.71.81.80.91.01.20.20.4 0.6 0.0 0.30.3
2030 — ‘Base Case’: 0%; — ‘Large Scale RES’: 5% - 25.000 V2G; — 10%‘Decentral’:-90.000 V2G; 2040 — ‘Base Case’: 5% - 45.000 V2G; — ‘Large Scale RES’: 10% - 1 30.000 V2G; — 10%‘Decentral’:-250.000 V2G; The ‘FLEX+’ scenario considers 50% of V2G (1.25 million vehicles) in the total EV fleet.
The following set of characteristics were considered to determine the usable storage capacity of the vehicles:
The operation cycles of pumped-storage units are optimised by the model, where it determines the ideal moment to use them based on the hourly price (i.e. economic dispatch). In order to consider the limited energy that can be stored, a reservoir volume is associated with each unit.
The following characteristics are also considered:
— All batteries are assumed to have an energy content of 3h (versus nominal capacity); — A roundtrip efficiency of 90%;
Given the limited reservoir of pumped-storage units in Belgium, they usually follow daily cycles: the reservoirs are filled during the night in order to be able to compensate for the peak demand occurring during the day. This cycle could differ in the future with larger penetrations of PV installations where it could be more interesting to pump energy during the day (when PV is producing the most). This is taken into account in the model with the economic optimisation of the storage facilities. A roundtrip efficiency of 75% is considered.
pumped-storageCurrentcapacity
SCENARIOS44 ASSUMPTIONSAND 2.4.5. THERMAL GENERATION FLEET
This
BOX 7 - LIFETIME ASSUMPTION FOR EXISTING THERMAL GENERATION FLEET IN BELGIUM
Existing CCGT and OCGT capacities are assumed to be decommissioned from the market after 25 years of operation, leading to 2.3 GW of capacity in 2025/2030 and 0 GW in 2040. For the winter 2017-18, 3.8 GW of CCGT and OCGT capacity are present in the market. The evolution of those units for 2030 and 2040 is based on a 25 years lifetime assumption
planned in 2025 (as legally determined) is used as a reference for all scenarios in this study. Figure 37 illustrates
Nowadays, the Belgian thermal generation fleet is mainly composed of gas, nuclear and biomass units. section provides an overview concerning the assumptions for the Belgian thermal facilities for each scenario and time horizon. Note that oil-fuelled “turbo jets” are also part of the system today but are not considered in this study as they due to be decommissioned in the coming years.
the current law [GOV-1] . The planned decommissioning dates for each nuclear reactor are: — Doel 3: 1st October 2022; — Tihange 2: 1st February 2023; — Doel 1: 15 February 2025; — Doel 4: 1st July 2025; — Tihange 3: 1st September 2025; — Tihange 1: 1st October 2025; — Doel 2: 1st December 2025. However,
ASSUMED EVOLUTION OF phase-out the evolution of assumption based on as suggested by some a sensitivity with a 2 GW nuclear extension for 10 years was also assessed (see Section 4.7.1.), which would result in a full nuclear phaseout by 2035.
BELGIUM'S EXISTING CCGT/OCGT AND NUCLEAR CAPACITY (FIG. 37) 2017 2018 2019 2020 2021 2022 2023 2024 2025 2026 2027 2028 2029 2030 2031 2032 2033 2034 2035 2036 2037 2038 2039 2040 121086420[GW]capacityInstalled Assuming 25 years lifetime for nuclearExistingCCGT/OCGTD3 & T2 in D1,D2,T1,D4,T32022-23 in 20253.85.9 3.9 2.3 0 2.4.5.1. Evolution of existing nuclear generation The nuclear
stakeholders,
2.4.5.2. Evolution of existing CCGT and OCGT units
The yearly evolution for existing nuclear and CCGT/OCGT units is shown in Figure 37.
the installed capacity for the existing nuclear and gas (CCGT/OCGT units) fleet. The reference
Vivoorde announced its closure and was in the Strategic Reserves for three winters from 2014-15. Vivoorde has around 20 years of operation; Twinerg has closed its operations in 2016 with around 15 years of operation. It is also important to note that depending on the technology and usage of the unit (amount of cycles, maintenance, ...) the technical lifetime can differ. Based on the above observations, 25 years of operation in the market was taken as an assumption for the units built in the 1990s.
on the existing nuclear generation in Belgium is
The 25 years assumption is based on the past and current announcements for closures/mothballing in the Belgian thermal generation fleet. A non-exhaustive overview is given here:Drogenbos announced its closure for 2020 (it will then have around 25 years of operation); Seraing announced its closure and was in the Strategic Reserves for three winters from 2014-15. Seraing has around 23 years of operation;
exclusively
THERMAL CAPACITY NEEDED TO ENSURE ADEQUACY (FIG. 38)
[GW]
Figure 38 illustrates the need for additional thermal capacity while already taking into account the other technologies in the Assumptionssystem. are made for each scenario on: — Demand to be served by the system; — Generation technologies (RES and CHP); — Storage facilities; — Demand flexibility; — Cross-border exchange capabilities.
The optimal share between both technologies will be determined by the economic assessment (see Section 3.3 for the methodology and Section 4.4 for the results).
In order to ensure an adequate system, additional thermal capacity will be needed (CCGT, OCGT, biomass, CHP, nuclear,...) and will be quantified through an adequacy study (see Section 3.1. on methodology and Section 4.1 for the Inresults).the
Based on this lifetime assumption, ‘Combined Cycle Gas Turbine’ (CCGT) and ‘Open Cycle Gas Turbine’ (OCGT) units in the market in 2017 considered for closure between 2017 and 2030 in this study are: — Angleur TG 31-32 & TV33; — Drogenbos GT1 & GT2 & ST; — Herdersbrug GT1 & GT2 & ST; — Ringvaart STEG; — Izegem; — Saint-Ghislain STEG. Note that the units in the Strategic Reserves for winter 2016-17 are also considered to have been decommissioned by 2030: — Seraing TG1 & TG2 & TV; — Vilvoorde GT. These assumptions result in the following evolution of existing CCGT/OCGT installed capacities: — 2030 (and 2025 as the same amount is obtained): 2.3 GW; — 2040: no existing CCGT/OCGT. 2.4.5.3. Evolution of CHP and waste capacity
InterconnectionsStorageDSMRESCHP/waste
scope of this study, only two technologies were considered to be able to fill the additional thermal capacity: OCGT and CCGT. The units are taken into account with standard unavailability rates and as having the technical characteristics of new units.
There is no guarantee that the abovementioned assumptions will be realised nor that their realisation will need any kind of support to be economically viable. Indications on revenues from the wholesale market will be provided based on the simulations for gas fired units (see Section 4.5).
capacityThermalDemand
Note that additional CHP capacity can be considered to fill the ‘additional thermal capacity’ needed to ensure adequacy (see Section 4.7.3). 2.4.5.4. Additional thermal capacity to ensure adequacy Additional thermal capacity needed to ensure adequacy in Belgium will be calculated taking into account different forecasts and penetrations of demand, demand flexibility, RES, storage, CHP and cross-border exchanges. The adequacy methodology used to determine the ‘thermal capacity’ needed is described in Chapter 3. Depending on the results of the adequacy study for each scenario, if new thermal capacity is required, this could be filled by technologies such as OCGT, CCGT, CHP, reciprocating engines, waste incinerators, biomass, nuclear, etc.
The same CHP and waste capacity was assumed up to 2040 in all scenarios: — Around 300 MW of waste; — Around 1.800 MW of CHP (both individually modelled and profiled units); Which corresponds to the current installed capacities. CoGen 2.1 GWCHP waste& in all scenarios
Thermal capacity needed to ensure adequacy is calculated taking into account different forecasts of demand and penetration of DSM, RES, storage, CHP, waste and with cross border exchanges.
SCENARIOS45 ASSUMPTIONSAND
•…••••••adequate.CalculatedforAssumptionseachscenariotobeCanbe:CCGTOCGTCHPBiomassNuclearPeakingunits
46 SCENARIOS ASSUMPTIONSAND Assumptions for Belgium 2016 2030 2040 BC DEC RES BC DEC RES Flex+ Demand Energy efficiency Energy efficiency compensates the economic/population growth Economic growth Number of electric vehicles < 10k 400k 900k 500k 900k 2.500k 750k 2.500k Heat pumps (electric/hybrid)penetration ≈ 0%/1% 3%/5% 10%/5% 3%/5% 10%/10% 30%/15% 20%/10% 30%/15% Resulting total normaliseddemandyearly ≈ TWh85 TWh88.8 TWh90.4 89 TWh TWh90.2 TWh97.6 TWh94.1 TWh97.6 ResponseSideDemand DSM shedding (max 3 hours per day) ≈GW0.6 1.1 GW 2 GW 1.1 GW 1.1 GW 2 GW 1.3 GW 2 GW DSM shifting (demand that can be shifted within a winter day) ≈ 0 0 GWh/day 2 GWh/day GWh/0.6day GWh/0.7day 6 GWh/day GWh/1.4day 31 dayGWh/ Storage Pumped-storage 1.3 GW 1.3 GW 1.3 GW 1.9 GW 1.3 GW 1.3 GW 1.9 GW 1.3 GW Decentral storage (3h duration) (it includes a part of EV connected to the grid as V2G) ≈ 0 0 GW 1.8 GW 0.6 GW 0.6 GW 3.6 GW 1.9 GW 10.5 GW RES Onshore wind 1.5 GW 3.3 GW 4.2 GW 5.4 GW 4.2 GW 5.9 GW 8.4 GW 5.9 GW Offshore wind 0.7 GW 2.3 GW 2.3 GW 4 GW 4 GW 5 GW 8 GW 5 GW Solar 3 GW 5 GW 11.6 GW 7 GW 6 GW 18 GW 10 GW 18 GW Hydro RoR 0.12 GW - existing units Biomass 0.9 GW - existing units Geothermal 0 0 0 0.1 GW 0 0 0.5 GW 0 Thermal CHP + waste 2.1 GW - existing units Nuclear 5.9 GW 0 GW Existing CCGT/OCGT units 3.8 GW Decomissioning 25 years lifetime = 2.3 GW Decomissioning 25 years lifetime = 0 GW New OCGT/CCGT / Different mixes of OCGT or CCGT. Enough to meet adequacy criteria. SUMMARY OF ASSUMPTIONS FOR BELGIUM (FIG. 39) 2.4.6. SUMMARY OF ASSUMPTIONS FOR BELGIUM Figure 39 summarises the data for Belgium per scenario that were described in the previous sections for thermal capacity, renewable sources, storage facilities, total consumption evolution and demand flexibility. These elements constitute the main input data provided to the model in order to perform the simulations.
— Great-Britain: based on the latest ‘Future Energy Scenarios’ published in July 2017 by NationalGrid [NGR-1], where the input data for GB is based on:
Assumptions for Belgium BC RES DEC Demand Demand 2030 Inline with the TYNDP2018 scenarios 2040 Demand shifting/ Demand shedding 2030 0% of HP and EV/ 5% of normalised peak demand 5% of HP and EV/ 7% of normalised peak demand 10% of HP and EV/ 10% of normalised peak demand 2040 5% of HP and EV/ 7% of normalised peak demand 5% of HP and EV/ 10% of normalised peak demand 10% of HP and EV/ 15% of normalised peak demand Storage Pumped-storage 2030 TYNDP2018 - ‘Sustainable Transition’ 2030 2040 batteries/'V2G'Stationary 2030 No 5% of PV installed/ EV fleet 10% of PV installed/ EV fleet 2040 5% of PV installed/ EV fleet 10% of PV installed/ EV fleet 10% of PV installed/ EV fleet Thermal Thermal (nuclear, lignite,gas,...)coal/ 2030 Unit per unit database regularly updated by Elia for DE,FR,AT,CH,GB,ES,NL Other countries are based on TYNDP scenarios. Additional gas capacity was added/removed through adequacy study2040 RES Wind 2030 TYNDP2018‘Sustainable Transition’ 2030 Wind Europe‘High’ scenario Wind Europe‘Central’ scenario 2040 TYNDP2018‘Sustainable Transition’ 2040 TYNDP2018‘Global Climate Action’ 2040 TYNDP2018‘Distributed Generation’ 2040 Solar 2030 TYNDP2018‘Sustainable Transition’ 2030 Same as ‘Base Case’ besides better data for countriesneighbouring Interpolation ‘Decentral’‘e-Highway2050’fromscenario 2040 TYNDP2018‘Sustainable Transition’ 2040 TYNDP2018‘Global Climate Action’ 2040 TYNDP2018‘Distributed Generation’ 2040 Other RES (biomass, hydro,..) 2030 Inline with the TYNDP2018 scenarios 2040 andPricesgrid Fuel and CO2 prices 2030 Two scenarios (‘gas-before-coal’ and ‘coal-before-gas’) based on World Energy Outlook 2016 from IEA2040 Grid 2030 NTC assumptions based on MAF adequacy study at ENTSO-E. A sensitivity is also performed where an additional 30 GW of interconnection capacity is added in both directions between all European countries ('Grid+' scenario).2040 SUMMARY OF SOURCES USED FOR EU22 ASSUMPTIONS (FIG. 40)
— Germany: based on the Netz Entwicklungs Plan [AMP-1];
47 SCENARIOS ASSUMPTIONSAND 2.5
— ‘Slow Progression’ FES scenario for ‘Base Case’ scenario; — ‘Consumer Power’ FES scenario for ‘Decentral’ scenario; — ‘Two Degrees’ FES scenario for ‘Large Scale RES’ scenario;
— France: data used in TYNDP2018 and different assumptions for nuclear capacity in 2030 reflecting the current uncertainties [RTE-1]; Figure 40 summarises the data for EU22 per scenario that will be described in the following sections for thermal capacity, renewable sources, storage facilities, total consumption evolution and demand flexibility.
EUROPEAN DEMAND AND GENERATION ASSUMPTIONS
— The Netherlands: based on the latest Adequacy report of Tennet published in 2016 and data collected through other European adequacy studies [TEN-1];
This section deals with the assumptions used for the 22 European countries (EU22) modelled in the studied perimeter (see Section 2.2.2) for each scenario. Most of the data are taken from the recent TYNDP2018 draft scenario report [ENT-3], where the full dataset used as a basis for the quatification are available in Excel format on the ENTSO-E website [ENT-2]. The differences with this dataset are explained in detail in this section.
For Belgium’s neighbouring countries, the latest national studies and information (known before the beginning of August 2017) are taken into account:
48 SCENARIOS ASSUMPTIONSAND 2.5.1. EVOLUTION OF ELECTRICITY CONSUMPTION The details of the demand profile construction can be found in the latest ENTSO-E ‘Mid-Term Adequacy Forecast’ (MAF) [ENT-2]. The approach used in TYNDP2018 to derive the electricity consumption profiles per market node is described in the scenario report [ENT-3]. Figure 41 summarises the average total electricity demand for each region and for each scenario. TOTAL ELECTRICITY DEMAND IN EU22 FOR EACH SCENARIO (FIG. 41) DE-AT-CH BeNeLux Central Nordics Iberia France British Isles IT-SI [TWh] 10001500200025003000350040005000 2030 BC RESDEC 3240 3282 3277 BC 2040DEC RES 3317 3614 3449 3003 2015 LOAD SHIFTING ASSUMPTIONS PER SCENARIO IN EU22 (FIG. 42) BC DECRES EU22 Flex+ 0% 5% 10% 5% 5% 10% 50%/ 0 38 70 38 86 167 835/2040203020302040 % of the heat pump and electric vehicle demand that can be shifted within a [GWh/day]day of energy that can be shifted within a winter day …this translates to…
The construction of demand profiles for each country is performed with a centralised tool provided by ENTSO-E. The same approach as described in Section 2.4.1 for Belgium is used. Three main dimensions are considered for each country, each scenario and each time horizon: — growth of the demand based on economic growth, energy efficiency and additional baseload forecast in some countries (data centres...); — thermo-sensitivity effect; — additional electrification (based on penetration of electric vehicles and heat pumps).
2.5.1.2. Evolution of demand flexibility options
Two demand flexibility options are modelled for each country: demand shifting and demand shedding Demand Shifting As is the case for Belgium, additional electrification was assumed eligible for demand shifting. For this reason, a percentage of heat pumps and electric vehicles is considered flexible within a day. The shares considered in each scenario are provided in Figure 42, as well as the amount of energy that can be shifted during a typical winter day in Europe.
For 2030, 24 million electric vehicles are estimated for EU22 in the ‘Base Case’ scenario against 33 and 37 million respectively in the ‘Large Scale RES’ and ‘Decentral’ scenarios.
2.5.1.1. Additional electrification Additional electrification on top of the existing devices in 2015 was added by taking into account the penetration of electric vehicles and heat pumps for each country. The detailed assumptions can be found in Annex 7.2. The data considered for the European perimeter are the same as the ones for the TYNDP2018 scenarios for heat pumps and electric vehicles.
For 2040, 47 million of electric vehicles are assumed in the ‘Base Case’ scenario with a higher penetration of electric vehicles in the ‘Large Scale RES’ and ‘Decentral’ scenario respectively estimated at 59 and 78 million. Note that the consumption profiles of electric vehicles already assumes some flexibility of the user avoiding charging during peak hours. The same modelling followed for Belgium is used for each country in the studied perimeter.
Given[EUC-5].limitations in terms of industrial processes, this shedding capacity was considered to have a maximum usage of 3 hours per day. The same hypotheses were used in the ‘Decentral’ and ‘FLEX+’ scenario.
2.5.2.1. Solar Figure 40 summarises the main data sources used for the installed solar capacities in EU22. The assumptions for our neighbouring countries are based on the latest national Forstudies.2030, the data are constructed based on an interpolation from the ‘e-Highway 2050’ study [EHW-1], except for our neighbouring countries which are based on national studies. In order to avoid inconsistency between the scenarios, this interpolation takes into account the solar capacity in the ‘Sustainable Transition 2030’ scenario as lower limit. The same solar capacities were assumed for the ‘Large Scale RES’ 2030 and the ‘Base Case’ 2030, except for neighbouring countries which are based on the national studies as described in Section 2.5.
LOAD SHEDDING ASSUMPTIONS PER SCENARIO IN EU22 (FIG. 43) BC DECRES EU22 5% 7% 10% 7% 10% 15% 26 36 51 36 51 772040203020302040 % of the normalised peak demand of each country that is possible to be shedded with a maximum of 3 times per day [GW] of demand that can be simultaneously shedded in the considered perimeter …this translates to… INSTALLED CAPACITY IN PV IN EU22 PER REGION (FIG. 45) [GW]capacityInstalled 1002003004005006007008000 DE-AT-CH BeNeLux Central Nordics Iberia France British Isles IT-SI BC RES BC 2040DEC2030DEC RES 231 366 267 324 710 480 DATA SOURCES USED FOR THE INSTALLED SOLAR CAPACITY IN EU22 (FIG. 44) 2030 2040 BC TYNDP2018'Sustainable2030Transition' TYNDP2018'Sustainable2040Transition' DEC Interpolation (Decentral'e-Highway2050'fromscenario) TYNDP2018'Distributed2040Generation' RES Same as ‘Base Case’ besides better data for neighbouring countries TYNDP2018'Global Climate Action' Obtained2040following RES optimisation performed in TYNDP2018 The ‘Decentral’ scenario presents by definition the highest penetration of solar capacity. In 2040, the installed capacity assumed in the studied EU22 perimeter amounts to 710 GW. Figure 45 gives the overview of installed solar capacity per region.
The data for renewable installed capacities (solar, onshore and offshore wind, hydro and biomass) are mainly based on the data from TYNDP2018 available before the beginning of August 2017. For 2040, the distribution of solar and wind capacity in Europe is based on a RES optimisation performed within the scope of TYNDP2018, where the location of RES (PV, onshore and offshore wind) in the electricity system is optimised to minimise the total costs of operation of the European system given certain limits (see TYNDP scenario report for more information [ENT-3]). The assumptions used for 2030 are described in the next sections as they slightly differ from the TYNDP2018 scenarios given that the data were not available for the ‘Distributed Generation’ at the time of construction of the scenarios and the absence of the ‘Global Climate Action’ scenario for 2030 in the TYNDP2018.
In order to calculate the different shares in each country, a percentage of the normalised peak demand, excluding additional electrification, was taken into account for each country. The normalised peak demand is the peak consumption of the country at a normalised temperature. The resulting volumes are in line with other European studies on demand response and are summarised in Figure 43 [SIA-1],
Demand Shedding Demand shedding is assumed to be mostly industrial load that can reduce part of its consumption when prices are above a certain level (activation price).
Figure 44 summarises the assumptions used for the installed solar capacity for each scenario and each time horizon. The hourly solar load factors are based on the Pan-European Climate Data Base, which is also used for TYNDP2018.
2.5.2. RENEWABLE PRODUCTION IN EU22
SCENARIOS49 ASSUMPTIONSAND
The ‘Decentral’ scenario for this study was sourced on the ‘central’ scenario from the study [WEU-1] from Wind Europe, except for our neighbouring countries which are based on the national studies. In order to avoid inconsistency between the scenarios, this interpolation takes into account the wind capacity in the ‘Sustainable Transition 2030’ scenario as lower limit. For the ‘Large Scale RES’ scenario, the ‘high’ scenario from the Wind Europe study is used as a reference, except for our neighbouring countries which are based on the national Figurestudies.46 summarises the main data sources used for the assumptions of installed wind capacity in Europe.
DATA SOURCES USED FOR THE INSTALLED WIND CAPACITY (FIG. 46) 2040scenarios scenario)
IN EU22
2.5.2.3. Other RES
'Sustainable2040Transition' DEC Wind Europe*Wind energy
The installed capacity for pumped-storage is considered as being constant for 2030 and 2040. Figure 48 summarises these assumptions for all scenarios and time horizons.
TYNDP2018'Distributed2040Generation' RES Wind Europe*Wind energy scenarios for 2030 ('High' scenario) TYNDP2018'Global Climate Action' Obtained2040following RES optimisation performed in TYNDP2018 * Source: [WEU-1]
for onshore
2.5.2.2. Onshore and offshore wind
The assumptions taken for the other renewable production (biomass, geothermal, hydro) are based on the data from TYNDP2018. The ‘Sustainable Transition’ 2030 scenario is used as reference for all scenarios (‘Base Case’, ‘Decentral’ and ‘Large Scale RES’) and time horizons (2030 and 2040) of this study, except for our neighbouring countries which are defined on the national studies.
2030
for 2030 ('Central'
SCENARIOS50 ASSUMPTIONSAND INSTALLED WIND CAPACITY (ONSHORE+OFFSHORE) IN EU22 PER REGION (FIG. 47) [GW]capacityInstalled 100150200250300350400450500500 DE-AT-CH BeNeLux Central Nordics Iberia France British Isles IT-SI BC RES BC 2040DEC2030 278 296 358 367 391 473 DEC RES INSTALLED CAPACITIES IN PUMPED-STORAGE IN EU22 PER REGION FOR 2030/2040 (FIG. 48) DE-AT-CH BeNeLux Central Nordics Iberia France British Isles IT-SI 51.2GW Note that for Belgium additional 0.6 GW of scenariothewaspumped-storageconsideredfor'Large Scale RES'2030/2040
2.5.2.4. Pumped-storage
BC TYNDP2018'Sustainable2030Transition' TYNDP2018
Figure 47 summarises the installed capacity and offshore wind together. As for solar production, the hourly load factors for onshore and offshore wind are based on the ENTSO-E Pan-European Climate Data-Base also used as the basis for TYNDP2018.
electric vehicles per
2040
Figure 50 summarises the amount of capacity considered in scenario.
The share of the vehicle fleet and corresponding amount that is permanently connected to a fast charger and that uses the battery to optimise the system for each scenario:
— ‘FLEX+’: 50%
2.5.2.5. Stationary batteries As for Belgium, the installed capacity of stationary batteries for EU22 was computed following a percentage of installed solar capacity: 2030 — ‘Base Case’: 0%; — ‘Large Scale RES’: 5%; — ‘Decentral’: 10%; 2040 — ‘Base Case’: 5%; — ‘Large Scale RES’: 10%; — ‘Decentral’: 10%;
The pumped-storage units are optimised by the model. For each market node, the dispatchable reservoir volume is explicitely modeled. The assumptions used for the reservoir are based on the TYNDP2018. Note that in the ‘Global Climate Action’ 2040 scenario, an increase of pumped-storage capacity was considered. This is not taken into account in the ‘Large Scale RES’ scenario of this study.
5%; —
INSTALLED CAPACITY IN STATIONARY BATTERIES IN EU22 PER REGION (FIG. 49) [GW]capacityInstalled 10203040506070800 DE AT CH BeNeLux Central Nordics Iberia France British Isles IT-SI BC RES BC 2040DEC2030 48 71 1613 37 0 DEC RES 0 AMOUNT OF STORAGE CAPACITY CONSIDERED IN ELECTRIC VEHICLES FOR EACH SCENARIO (FIG. 50) [GW]capacityInstalled 1020304050600 DE AT CH BeNeLux Central Nordics Iberia France British Isles IT-SI BC RES BC 2040DEC2030 26 12 16 55 41 % of electric vehicle fleet that is considered as a storage device that can be fully optimised on the electricity price 0% 10% 5% 5% 10% 10% DEC RES
2.5.2.6. ‘Vehicle-to-Grid’ For all European countries in the studied perimeter, it is assumed that a part of the electric vehicle fleet allows bidirectional flows between the vehicle batteries and the grid. The same characteristics are used for Belgium for all market nodes. Note that this technology is not taken into account in the TYNDP scenarios.
2030 — ‘Base Case’: 0%; — ‘Large Scale RES’: 5%; — ‘Decentral’: 10%; — ‘Base Case’: ‘Large Scale RES’: 10%; 10%;
storage
SCENARIOS51 ASSUMPTIONSAND
The same characteristics described in Section 2.4.4.2 are used for Belgium: — All batteries assumed with an energy content of 3h (versus nominal capacity); — A roundtrip efficiency of 90%; — No limitations in terms of amount of charge/discharge cycles (the utilisation is only limited by the available energy in the reservoir at a given time).
Figure 49 summarises the assumptions for stationary batteries in EU22. As shown below, no stationary batteries in the market are considered in 2030 for the ‘Base Case’ scenario.
— ‘Decentral’:
2.5.3. THERMAL GENERATION AT EU LEVEL
SCENARIOS52 ASSUMPTIONSAND 2.5.3.1. The Netherlands [GW] 5.70.5 2016 BC RES 0.5 0.5 0.5 4.6 4.6 3 2030DEC BC 2040 X X X 3 X X RESDEC NUCLEAR AND COAL GENERATION ASSUMPTIONS FOR THE NETHERLANDS (FIG. 51)
Note that the French TSO (RTE) published a long-term adequacy report at the end of October 2017 with different long term scenarios for the country. Those were not taken into account in this study given the timing of the publication.
2.5.3.2. France [GW] 633 2016 BC RES 52 52 38 X X X 2030DEC BC 2040 30 30 30 X X X RESDEC NUCLEAR AND COAL GENERATION ASSUMPTIONS FOR
Figure 51 summarises all these assumptions. FRANCE
For all the modelled countries, assumptions are made on the future evolution of their thermal production fleet. It was assumed that nuclear and coal generation are mainly driven by national policies, while gas-fired capacities are installed to meet adequacy standards for each country (see Section 3.1 for reliability standard assumptions). Although gas-fired power plant capacity is not mentioned in this section on the CWE countries, such units have been accounted for in the model to reach the adequacy standards.
(FIG. 52)
The installed capacities are in line with the ‘Monitoring report’ of TenneT [TEN-1] and the dataset used in the TYNDP2018 scenarios. A decommissioning of 1.5 GW of coal capacity is assumed in the ‘Large Scale RES’ scenario in 2030 and a full decommissioning in 2040 in the ‘Decentral’ and ‘Large Scale RES’ scenarios. In the ‘Base Case’ scenario in 2040, it is assumed that 3 GW of the newest coal capacity is still available. Nuclear decommissioning is assumed to happen between 2030 and 2040. Note that according to the new ‘Goverment agreement’ of the Netherlands, decided on 10 October 2017, the complete phase-out of coal is planned by 2030. This information is not included in the scenarios, although the impact on the results is limited for the indicators assessed in this study [NOS-1].
Uncertainties on the future of nuclear generation remain, despite the announcements of the French government to reduce the power output of this technology to 50% of the consumption by 2025 following the law on ‘Transition Energétique’. Achieving such target could represent the closure of up to 17 nuclear reactors according to the French Minister of the Energy Transition. The pace by which this reduction will take place is still uncertain given that decreasing the installed nuclear capacity in France could lead to adequacy concerns if no replacement is found [LEG-1] [LEM-1]. In the ‘Base Case’ and ‘Decentral’ scenario for 2030, a decommissioning of around 10 GW of nuclear generation was assumed. This presumes that the nuclear generation plants will be in operating for 50 years. In the ‘Large Scale RES’ scenario, it is assumed that 25 GW of nuclear capacity is decommissioned by 2030. This scenario is in line with the French law ‘Transition Energétique’ and is in accordance with the input provided by the French TSO (RTE) for the TYDNP2018 scenarios. In 2040, 30 GW of installed nuclear capacity was considered in all scenarios. This corresponds to half of the capacity installed today in France. Coal capacity in France is to be removed from the system before 2030 for all scenarios, which is inaccordance to the French government plans. Figure 52 summarises all these assumptions.


The German data are based on the NEP (Netzentwicklungs plan) scenarios for 2030 [NEP-1].
The FES ‘Slow Progression’ scenario is used for the ‘Base Case’ scenario;
2.5.3.3. Germany [GW] 4811 2016 BC RES X X X 25 20 20 2030DEC BC 2040 X X X 12 12 X RESDEC NUCLEAR AND COAL GENERATION ASSUMPTIONS FOR GERMANY (FIG. 53)
While coal capacity in GB is assumed leaving the market by 2030, a different evolution for nuclear is taken for the different scenarios. In the ‘Large Scale RES’ scenario, new units are being built to compensate for the planned closures as these plants are reaching their maximum technical lifetime. This leads to similar level of installed nuclear capacity as today: 8 GW in 2030. In 2040, additional nuclear reactors bring this to 16 GW. In the other scenarios, the construction rate is lower. 54 summarises these assumptions.
The ‘Base Case’ scenario follows the ‘NEP scenario B’ where a decommissioning of around 20 GW of coal and lignite capacity between 2014 and 2030 is forecasted. This leads to 25 GW of installed coal and lignite in 2030. For the ‘Decentral’ and ‘Large Scale RES’ scenario, the ‘NEP scenario C’ is followed which results in 20 GW of installed coal and lignite generation in 2030. For 2040, it was assumed that 12 GW of coal and lignite capacity remain in the ‘Base Case’ and ‘Decentral’ scenarios and a full phase-out in the ‘Large Scale RES’ scenario. No nuclear generation is considered in 2030 which is in line with nuclear phase-out plans in Germany.
SCENARIOS53 ASSUMPTIONSAND 2.5.3.4. Great-Britain (GB) [GW] 139 2016 BC RES 4 4 8 X X X 2030DEC BC 2040 9 14 16 X X X RESDEC NUCLEAR AND COAL GENERATION ASSUMPTIONS FOR GREAT BRITAIN (FIG. 54)
The translation from FES scenarios is made as follows:
The assumptions of generation capacity are based on the latest ‘Future Energy Scenarios’ (FES) produced by National Grid as released in July 2017. Those scenarios have been subject to wide-scale consultation and detail different energy futures for GB.
Figure
— The FES ‘Consumer Power’ scenario is used for the ‘Decentral’ scenario;
— The FES ‘Two Degrees’ scenario is used for the ‘Large Scale RES’ scenario.
—

For Belgium it was assumed that 500 MW of balancing reserves were provided by thermal generation units and pumped-storage. Therefore, a derating of 500 MW of the thermal and pumped-storage capacity was considered. This capacity cannot be dispatched for economic reasons as it should be kept for balancing purposes. The additional balancing needs (on top of the 500 MW) are considered to be demand response and storage facilities not taken into account in the assumptions as capacity that is modelled in the market.
The market tool used in this study simulates the hourly European market assuming a perfect foresight of demand and RES with an hourly step. As it must be possible to deploy the balancing reserves to restore deviations in real time, independently from the market output, the volume contracted from generation units for frequency containment and restoration reserves is taken into account in the simulations as a reduction in available capacity.
ASSUMPTIONS ON BALANCING RESERVES
SCENARIOS54 ASSUMPTIONSAND 2.6
The assumptions on the quantity of balancing reserves for all countries are taken from the ‘Mid-term Adequacy Forecast’ (MAF) Study performed at ENTSO-E level for 2025. The same amounts are considered in all scenarios and time horizons, despite the fact that due to the increase of RES, more deviations could be observed. It is assumed that other flexible options will be available to balance the system (increased amount of demand response, storage...). More detailed analyses should be performed in the future to quantify the need for such flexibility more accurately.
Balancing reserves are contracted with certain producers and consumers to increase or decrease generation or demand at certain sites to ensure an efficient, secure and reliable grid. Using those reserves, the TSO can restore the balance between generation and demand. Such imbalances can be caused for example by the unforeseen loss of a production unit, renewable infeed fluctuations or demand forecasting errors. Therefore, these kinds of reserves need to be available at all times in order to restore the balance.
SCENARIOS55 ASSUMPTIONSAND 2.7
2.7.1. MODELLING
The possible commercial exchanges between countries are modelled with ‘Net Transfer Capacities’ (NTC). These values correspond to fixed maximum commercial exchange capacities for cross-border exchanges between two countries. The values are taken from studies conducted by ENTSO-E and from bilateral and multilateral contacts with TSOs and reflect a best forecast, taking into account planned and new interconnection projects for all borders. The values used for this study are detailed in the next sections.
55. COMMERCIAL EXCHANGE ASSUMPTIONS - REFERENCE FOR 2025-2030-2040 (FIG. 56) Border NTC from/to and to/from Consists of PlanDevelopmentFederalID projectTYNDP2016ID information Additional BE-NL 3400/3400 Brabo I, II, III & 'Further Reinforcement North Border': Zandvliet – Rilland /OR Van Eyck –Maasbracht (studies have meanwhile concluded that first Zandvliet-Rilland is to be upgraded) Brabo & 16 24, 297 & 262 [ELI-8] BE-FR 2800/4300 FR-BE I: Avelin-Avelgem–Horta (BE-FR phase I) & FR-BE II: Aubange – Moulaine 17 & 18 23 & 173 BE-DE 1000/1000 ALEGrO project 20 92 [ELI-9] BE-GB 1000/1000 NEMO Link® 19 74 [NEM-1] BE-LU 300/180 Luxembourg-Belgium interco I: PST Schifflange 21 & 22 Note that the SOTEL grid of Luxembourg is explicitly modelled and assumed to be in the Belgian regulation zone COMMERCIAL EXCHANGE ASSUMPTIONSREFERENCE FOR 2025-2030-2040 (FIG. 55) 3400 3400 10001000 10001000 28004300 300 180 Max simultaneous import 6500 MW NL LUDEFR GB Which projects are behind the NTC values used as reference for Belgium? The description of the projects included in these assumptions is shown in the latest Federal Development Plan [ELI-7] and the TYNDP2016 [ENT-3]. The reference case assumes a maximum simultaneous import capacity of 6.500 MW.
Additionally, the total maximum simultaneous import level for Belgium is capped at 6500 MW. For a relatively small country with big and roughly adequate neighbours, the simulations show that a variable import volume up to the maximum of 6500 MW can happen, thanks to the non-simultaneousness of peaks between the countries. But during certain hours, there is not enough generation capacity abroad due to simultaneous needs in two or more countries which will result in a lower import potential for Belgium. This effect is taken into account in the model.
2.7.2. REFERENCE ASSUMPTIONS ON BELGIAN INTERCONNECTIONS
It should be noted that these assumed NTCs do not provide a guarantee that such exchanges between countries will be possible at every point in time for the time horizon under study.
The Belgian NTC assumptions are given in Figure
Determining the need of potential additional grid reinforcements to enable the cross-border exchanges at times when they are required, is the objective of other studies such as the ENTSO-E TYNDP and the Belgian Federal Development ThePlan.
ASSUMPTIONS ON INTER CONNECTIONS
hourly commercial electricity exchange between countries is optimised by the model, depending on the supply and demand curves in each country. The model therefore does not a priori assume a given level of import energy at the critical moments for system adequacy. The actual volumes of imported energy will depend on the extent to which excess generation capacities are available for export in the other countries and on the result of the market.


The North-South (NS) and East-West (EW) Corridor together
the optimal capacity for the concerned interconnectors, which
The perspective behind these reinforcements is to maximise the capacity of the existing infrastructure by fully deploying PSTs7 and HTLS8 technology. This reinforcement comes on top of the projects reflected in Figure 56, which also make use of PSTs and HTLS technologies but do not yet cover all cross-border lines. The CAPEX of these two interconnectors is currently estimated at 170 M€ (Belgian part of the invetsment). Note that this figure is subject to further feasibility studies and subsequent choices in terms of reinforcement options.
6. The 1 GW is a working assumption. Further bilateral feasibility studies will evaluate could GW depending on technological evolutions, Phase Shifting Transformer. High Temperature
The different options are summarised in Figure 57.
The North-South (NS) Corridor A further reinforcement of the BE-NL and BE-FR interconnectors increasing the exchange capacity by 1 GW will be assessed. This is referred to as the ‘North-South’ Corridor in this study.
go beyond 1
related costs and benefits. 7.
8.
ReferenceEast-WestBorders + + BordersNorth-South + + EW & BordersNS + + + + ADDITIONAL CORRIDORS ASSESSED (FIG. 57) + = Reinforcement +1000 MW (both directions)
The combination of both corridors (resulting in 4 GW of possible additional cross-border exchanges) for Belgium is also assessed in each scenario.
Low Sag conductors. 2.7.4. ASSUMPTION ON EUROPEAN INTERCONNECTIONS The NTC assumptions for all borders are based on the reference grid for 2025 used in the framework of the ‘Mid-term Adequacy Forecast’ (MAF) performed at ENTSO-E level and published in October 2017 [ENT-2]. Figure 58 shows the NTC values used for the simulated perimeter (only cross-border values are shown on the Figure). 1400 4501100 500 4000100010001400 700 1640 3700216033001000435013004300 2800 5500 5000 35004200 3100 1500200030006005853000 740100017001300600680 18006008001100 2000 100583537356065 2100 1700 7500 1200800 1200 950900 990 20006001315 1400 7005000 3400 Values on the chart are the NTC expressed in MW
One of the main options for Belgium to maintain its competitiveness with its neighbouring countries and enable the energy transition is to increase its cross-border exchanges capabilities with its neighbours. The economic assessment of additional interconnectors is performed by taking into account additional ‘corridors’ on top of the reference cross-border exchanges presented in Section 2.7.2. The level of maximum simultaneous import capacity was always maintained to a level of 6500 MW for adequacy assessments but was increased for market exchanges.
The CAPEX of these two interconnectors is currently estimated at 800 M€ (Belgian part of the invetsment). Note that this figure is subject to further feasibility studies and subsequent choices in terms of capacity, connection point and routing.
56 SCENARIOS ASSUMPTIONSAND 2.7.3. ADDITIONAL INTERCONNECTIONSBELGIANASSESSED
The East-West (EW) Corridor An increase of both the BE-DE and BE-GB exchange capacity, each with an additional 1 GW6 is considered, reflecting the ongoing studies that were introduced in the Federal Development Plan and TYNDP. Those developments correspond to additional capacities on top of the ongoing projects of ALEGrO and NEMO Link®


The increased capacity on the different borders is shown in Figure 59. This corresponds to an additional 30 GW of crossborder capacity between countries.
RES Grid+ From the ‘Large Scale RES’ scenario, the European cross-bor der exchanges were increased as follows: +0.5 GW for all the borders between or with AT, SK, HU, SI, CZ, FI, IE, NI; • +3 GW between ES and FR given the large amount of projects planned in the TYNDP2016. Note also that the reference capacity between those two countries in the TYNDP2016 for 2030 amounts to 8 GW; • +3 GW between FR and GB given the large amount of projects planned; • +1 GW for the other borders.
2.7.5. EUROPEAN ‘GRID+’ SENSITIVITY For 2040, a scenario with additional cross-border capacity between European countries will be assessed. Given the TYNDP2016 project list and the ambition of several countries across Europe to increase their cross-border capacities in order to maximise their exchanges, enable further integration of renewables and benefit from the most economical generation, a large amount of projects are considered.
57 SCENARIOS ASSUMPTIONSAND
•
The robustness of the Belgian choices in such context is evaluated by a scenario named ‘GRID+’ that is created based on the ‘Large Scale RES’ scenario.
‘GRID +’ – ADDITIONAL NTC PER BORDER IN BOTH DIRECTIONS (FIG. 59) +1000 +3000 +3000 +700 +500 +500 +500+500+500 +500+500+500 5+00 ++500500 +500 +500+100 +500 +500 +500+500+1000 +1000 +1000+1000+1000 +1000+1000 +1000 +500 +500 +1000 +1000 +1000+1000 +1000 +1000 Values on the chart are the NTC expressed in MW
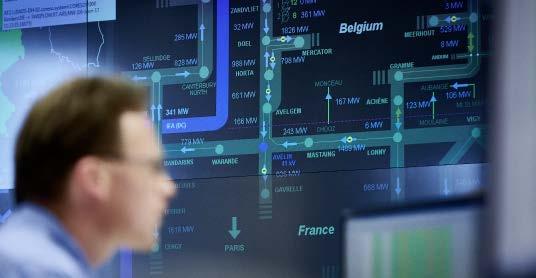
— The fuel costs needed to produce the energy;
Variable costs of generation and DSM are needed to determine which unit will be dispatched for each hour. Each generation (or DSM unit) is associated with a marginal cost (or activation price) which represents the variable cost of producing 1 MWh of energy (or of shedding 1 MWh of energy).
— The ‘New Policies Scenario’ which is the reference scenario of the IEA which takes into account the current and planned commitments of each country;
In order to capture the impact of different price evolutions in the future, two different sets of assumptions will be evaluated for each scenario based on the IEA scenarios from the WEO (see Box 8 for more information):
The gas, hard coal, oil and CO2 prices are based on the WEO [IEA-1]. The lignite and nuclear prices are taken from the TYNDP2018. Given that there is no global market for lignite, the price is very dependent on the cost of extraction, calorific value, etc. and it is assumed to be stable over the future. The nuclear fuel costs are also assumed to stay in similar ranges in the future.
The variable cost of each generation unit is based on the sum of three components:
58 SCENARIOS ASSUMPTIONSAND 2.8
— The emission costs resulting from burning the fuel;
— The ‘450 Scenario’ which is a scenario achieving a maximum of 2°C increase in the long term by reducing GHG emissions.
Emission costs in electricity generation in Europe are mainly driven by the EU Emissions Trading System (ETS). Some countries such as the United Kingdom have set additional emission costs. Those are not taken into account in this study.
One of the main differences between the two scenarios of the IEA is the price of CO2 which leads to a ‘merit order shift’ between coal and gas. Given this main difference, the two sets of prices will be referred to as ‘coal-before-gas – C2G’ and ‘gas-before-coal – G2C’:
— The Variable Operations & Maintenance costs (VOM) (costs associated with the operation of the unit that are proportional to the generation output).
2.8.1. VARIABLE COSTS
The fuel and emission costs are based on the World Energy Outlook (WEO) 2016 edition from the International Energy Agency (IEA). Fuel and emission costs are key elements for the economic assessment of the different options. Fuel prices are depending on many external factors such as geopolitics, macro-economics, world supply and demand.
The ‘coal-before-gas’ merit order (C2G) is based on the ‘New Policies’ scenario from the IEA.C2G The ‘gas-before-coal’ merit order (G2C) is based on the ‘450’ scenario from the IEA.G2C
The resulting generation merit order (ranking of the available capacity resources by their variable costs) is calculated for each country and will determine the supply curve.
The most economic dispatch is found by combining the different generation/DSM units in all countries (with storage), subject to the grid constraints represented by the NTC values per border.
ECONOMIC ASSUMPTIONS
2.8.1.1. Fuel and emission costs

SCENARIOS59 ASSUMPTIONSAND SUMMARY OF FUEL AND CO 2 PRICES USED IN THIS STUDY (FIG. 60) Prices in €2015/$2015 2016 2030 2040 (indicative prices) New Policies C2G 450 G2C New Policies C2G 450 G2C Hard Coal [€/tonCoal] ≈60 67 51 69 46 Gas [€/MWh] ≈15 32 29 35 30 CO2 price [€/tCO2] ≈5 33 90 45 126 Crude oil [$/barrel] ≈60 111 73 124 78 Source: [IEA-3] An overview of the assumptions on fuel and CO2 prices are given in Figure 60.
BOX 8 - THE WORLD ENERGY OUTLOOK - IEA
The World Energy Outlook is one of the deliverables from the International Energy Agency (IEA) that is issued on a yearly basis. It provides different outlooks in terms of the energy mix, consumption, prices and other analyses for all the regions of the world. It allows to assess possible futures of the energy sector applying different policies.
In order to capture differences in terms of prices of fuels and emissions, the ‘New Policies’ and ‘450’ scenarios are used in this study.
— ‘Current Policies Scenario ’ assumes no changes in policies from the mid-point of the year of publication (previously called the Reference Scenario); — ‘450 Scenario ’ sets out an energy pathway consistent with the goal of limiting the global increase in temperature to 2°C by limiting concentration of greenhouse gases in the atmosphere to around 450 parts per million of CO2.
Three scenarios are usually developed by the IEA: From the IEA website: [IEA-2] — ‘New Policies Scenario ’ of the World Energy Outlook broadly serves as the IEA baseline scenario. It takes account of broad policy commitments and plans that have been announced by countries, including national pledges to reduce greenhouse-gas emissions and plans to phase-out fossil-energy subsidies, even if the measures to implement these commitments haveyet to be identified or announced;
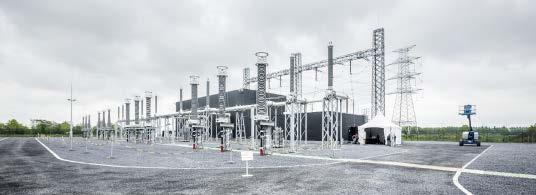


The WACC might be different depending on the investor’s risk appetite, market conditions and other factors. In the different calculations, three different WACC values were taken into account which are covering the ranges found in the literature (6% - 9% - 12%). In accordance with long term perspectives of the regulatory framework, the WACC for transmission investments in Belgium is assumed to be 6%.
[€/MWh]costMarginal 1001502002503000 0 50
2.8.2.2. Investment costs and cost of capital Investment costs are calculated with: — the CAPEX (CAPital EXpenditure); — the Weighted Average Cost of Capital (WACC). For wind, PV and batteries, future CAPEX decreases are very hard to estimate as they are driven by technology developments and economies of scale. Different future projections can be found in the literature. For each technology, only one CAPEX value was taken which is based on different sources. The sources and some additional comments are included in the table with fixed costs assumptions.
150
2.8.1.3. Supply merit order
Sorting the marginal cost of each unit results in the generation merit order. The European (EU22) supply merit order of this study for the ‘Base Case’ scenario and following the ‘coalbefore-gas’ price assumptions is shown on Figure 62. Renewable generation, decentral CHP and DSM are not represented in this Figure. Note that DSM with its activation price is also modelled (see Section 2.4.2 in the assumptions for more linked to the output of taken from a study by the Joint Research Centre of the European Commission [EUC-13] and from the ENTSO-E database for the other generation units, as shown in Figure 61. 61)
60 SCENARIOS ASSUMPTIONSAND
a generation facility (excluding fuel, emissions and personnel Thecosts).VOM costs are
2.8.2. FIXED COSTS
for gas units
Nuclear
EU22 THERMAL GENERATION MERIT ORDER FOR THE 'BASE CASE' SCENARIO - ‘COAL-BEFORE-GAS’ (FIG. 62) 100 200 250 300 350 400 Coal thermal capacity (excluding decentral CHP/Biomass) [GW]
electrical
information). 2.8.1.2. Variable operation and maintenance costs The Variable Operation and Maintenance costs (VOM) of units are costs that are
Variable Operation and Maintenance costs [€/MWh] CCGT 2 OCGT 11 Nuclear 9 Coal/Lignite/Biomass 3 to 4 Sources: [EUC-13][ENT-3]
VARIABLE OPERATION & MAINTENANCE COSTS (VOM) FOR THERMAL UNITS (FIG.
RecentCCGT Oldergasunits PeakingOCGT Installed
The Fixed Operation and Maintenance costs (FOM) do not directly depend on the electricity generation of a unit. The cost of a technical lifetime extension is not included either and should be taken into account on top of the FOM costs.
2.8.2.1. Fixed Operation and Maintenance costs
— An average estimate based on possible routes, connection points and technologies for the North-South and EastWest additional corridors.
61 SCENARIOS ASSUMPTIONSAND FIXED COSTS, ECONOMIC LIFE TIME, WACC CONSIDERED FOR GENERATION, STORAGE AND DEMAND RESPONSE IN THIS STUDY (FIG. 63) Costs in € 2015 CAPEX [€/kW] lifetimeEconomic[yr] WACC [€/kW]FOM Source/more info Technology 2016 2030 2040 unitsExisting CCGT 21 a OCGT 17 a CHP 75 a Biomass 50 a capacityNew-built New CCGT 850 850 850 20 [6%/9%/12%] 21 a New OCGT 550 550 550 20 [6%/9%/12%] 17 a New CHP 880 880 880 20 [6%/9%/12%] 75 a New Biomass 850 850 850 20 [6%/9%/12%] 40 b Offshore wind 3400 2500 2200 20 [6%/9%/12%] 77 c Onshore wind 1500 1100 1000 20 [6%/9%/12%] 29 d PV 1700 1000 800 20 [6%/9%/12%] 20 e Nuclear extensionlife Nuclear 10 years extension 800 10 [6%/9%/12%] 112 f (BEinterconnectionsNewpart) North-South AC corridor (FR, NL) + 2 GW 85 85 25 6% ≈0 g East-West DC corridor (UK, DE) + 2GW 400 400 25 6% 8 g Storage Coo 3 1000 1000 25 [6%/9%/12%] 45 h Coo I & II & Plate Taille 45 a Stationary batteries (with 3 hours storage) 1400 800 600 10 [6%/9%/12%] 11 i responseDemand DSM shedding (industrial) 0 0 0 [6%/9%/12%] 10 j DSM shifting (residential) device450€/ device450€/ device450€/ 8 [6%/9%/12%] device10€/ k a - [EUC-13] b - Weighted average from current/past projects in Belgium - [GRE-1] c - Elia assumption based on: Baringa, BEIS, [EUC-13] d - Elia assumption based on: Baringa, BEIS, Carbon Tracker, [EUC-13] e - Elia assumption based on: [EUC-13], Fraunhofer [FRA-1], Baringa, BEIS, [AGO-1]. Average of different installation sizes taken into account f - ENGIE - D1D2 extension [ENG-2] - BNB/CREG [NBB-1] g - ELIA average based on possible routes & technologies h - ENGIE [ENG-1] and [EUC-13] i - Elia assumption based on: [EUC-13], [BNF-1], Baringa, BEIS j - Cost of reservation of industrial load [CRE-1] k - Assuming cost being the cost of a smart meter [CRE-1] 2.8.2.3.
— A study performed by E-cube for the French regulator (CRE) was used for the DSM fixed costs. For the DSM shifting, the values are given per device (smart meter) that is needed to enable shifting of heat pumps and electric vehicles consumption;
— For specific cases such as Coo3 and the nuclear extension costs, public sources were used;
Summary table of assumptions Figure 63 summarises the fixed cost and economic lifetime assumptions taken in order to calculate the annuities of the different investments. The following sources were used to construct this table:
— The study by the Joint Research Centre of the European Commission was used for most of thermal capacity sources [EUC-13]; — The estimations for the large scale biomass new-built units are based on the current and past projects in Belgium [GRE-1]; — Different sources (Baringa, BEIS, Carbon Tracker, BNEF, Fraunhofer,...) were used for renewables and batteries projections;
62 SCENARIOS ASSUMPTIONSAND
The ‘Levelised Cost Of Electricity’ (LCOE) is the cost of producing 1 MWh of electricity taking into account the fixed and variable costs. An assumption is therefore made on the running hours of the different technologies (or ‘load factor’). For the RES production, the ‘load factor’ depends on the weather conditions. For Belgium, in 2030 and 2040, around 11% on average per year was assumed for PV, onshore wind 28% and offshore wind 42%. Based on the fixed costs assumptions for PV and wind generation (see Figure 64): LCOE FOR WIND AND PV BASED ON EXPECTED INVESTMENT COSTS (FIG. 64) [€/MWh]
2.8.3.
— The offshore wind LCOE is expected to decrease from around 130 €/MWh to around 70 €/MWh in 2040. The CAPEX assumed already includes a part for grid connection costs, although additional grid costs could be required depending on the distance from the shore and other parameters.
100150200250300500 Overnight costs per year Cost of Capital 6% Cost of Capital 9% Cost of Capital 12% PV 2016 2030 2040 2016 2030 2040 2016 2030 2040 214 134 112 132 82 73 92 62 58 Onshore windOffshore wind
— The onshore wind LCOE is expected to decrease under 60 €/MWh in 2040. LEVELISED COST OF ELECTRICITY FOR RES
— The LCOE of PV is expected to decrease from around 200 €/ MWh to values around 100 €/MWh in 2040. Note that lower LCOE are obtained for large-scale installations and in countries with a higher load factor. With large penetrations of PV in distribution grids, additional investments might be required to evacuate or store the surplus of energy during the day;
2.9 SUMMARY OF SCENARIOS AND SENSITIVITIES USED IN THIS STUDY SUMMARY OF SCENARIOS AND SENSITIVITIES FRAMEWORK (FIG. 65) BE interconnections BE new thermal MeritScenarioscapacityorder€ Ñ Ñ Ñ RESBC DEC Grid+ Flex+ C2G G2C 100% 100%25%75% 50%50%OCGTCCGT Base Case Large Scale RES Decentral Reinforcement of EU corridors in RES More flexibilitydemandinDEC ‘coal-before-gas’setting mixescapacityNeededsetting‘gas-before-coal’thermalnew-builtfilledwithdifferentofCCGT/OCGT No reinforcementadditional reinforcementbordersEast-West reinforcementbordersNorth-South North-South & East West reinforcementborders +1 GW +1 GW +1 GW +1 GW +1 GW +1 GW +1 GW +1 GW CCGT CCGT75 CCGT50 OCGT
63 SCENARIOS ASSUMPTIONSAND
Additionally, for 2040, the ‘GRID+’ and ‘FLEX+’ scenarios will be assessed in the ‘gas-before-coal’ setting with the thermal mixes and cross-border reinforcement sensitivities.
The three main scenarios (‘Base Case’, ‘Large Scale RES’ and ‘Decentral’) will be assessed for 2030 and 2040 with both merit orders, different new thermal capacity mixes and with four configurations of cross-border exchanges
This results in a large amount of combinations that were simulated with the full climate database to derive indicators. Additional sensitivities were also simulated such as a partial nuclear extension of 2 GW and additional large-scale biomass for FigureBelgium.65summarises the different combinations.
This chapter presented the scenarios and sensitivities, including detailed data for Belgium and neighbouring countries (and references to European studies for the others).


64 3.1 — ENSURING ADEQUACY OF THE COUNTRY AND ITS NEIGHBOURS 66 3.2 — HOURLY ELECTRICITY MARKET MODEL 70 3.3 — IDENTIFICATION OF THE OPTIMAL CAPACITY MIX FOR NEW THERMAL GENERATION IN BELGIUM 72 3.4 — COST BENEFIT ANALYSIS FOR ADDITIONAL INTERCONNECTIONS 73 3.5 — ADDITIONAL INDICATORS RESULTING FROM THE MARKET STUDY 74 METHODOLOGY 03

METHODOLOGY USED IN THIS STUDY (FIG. 66)
Scenario definition Adequacy study Market study InterconnectorIndicatorsassessmenteconomicassessment
After defining the scenarios and sensitivities that will be performed, the methodology used in this study consists of the following steps (see Figure 66).
Optimal fleet BE Cost-Benefit analysis of additional corridor reinforcements Cost-Benefit analysis to find the most optimal mix for new thermal generation in Belgium Market simulation with optimal dispatch for each hour Ensures that all countries are adequate within an upper and lower average LOLE boundary by adding and removing units. Calculates the need for new thermal generation in Belgium.
Based on the adequacy results, hourly market simulations are performed for each sensitivity. See Section 3.2 for more Outputsinformation.ofthe market simulation will be used to calculate: — an optimal thermal mix for Belgium for each scenario following welfare and costs calculations of the different options. See Section 3.3; — an economic cost-benefit assessment of additional interconnectors for Belgian society in each scenario given the identified optimal mix. The economic assessment is also based on the welfare benefits for Belgium given the costs of additional cross-border infrastructure. See Section 3.4 Additionally to the results above (see Section 3.5); — other economic indicators such as the profitability of gas-fired units and wholesale electricity marginal prices are derived; — CO2 emissions are quantified to assess the sustainability of the scenarios and impact of sensitivities on these criteria; — dispatch indicators such as the energy mix and crossborder exchanges also complement the analysis.
This study is based on the most advanced models and tools available and uses the expertise shared between TSOs at European and regional level for adequacy and economic studies.
Hourly electricity market simulations of 22 European countries are the core of the analysis. Based on the scenarios defined in the previous chapter, a large amount of sensitivities will allow to cover uncertainties in terms of generation fleet, demand, storage, interconnections, fuel prices... Assessing indicators resulting from those simulations will help quantifying the impact of different choices to be made for the Belgian electricity sector.
0 1
For each scenario
For each sensitivity
Once the European scenario storylines and quantification are defined, ensuring adequate scenarios for the future is a must. This part consists of calculating the thermal capacity needed to ensure an adequate electricity supply for the European and Belgian consumers (see Section 3.1). A full European adequacy study is therefore performed for each of the scenarios/sensitivities.
METHODOLOGY65
€ 011010001011001
Elia continuously improves its methods and data in order to include the latest developments and trends.
Based on scenario storylines: Quantification of RES, demand, DSM, thermal generation, storage, interconnections and costs for all countries. 2 4 RESBCGrid+DECFlex+
3
Economic BE marginalWholesaleUnitwelfareprofitabilityelectricityprices Sustainability CO2 RES-Eemissionsshare Dispatch Energy mix Energy exchanges
BOX 9 - ADEQUACY CRITERIA IN EUROPEAN COUNTRIES
A full adequacy analysis is performed iteratively in order to ensure that each country is within certain adequacy criteria (upper and lower average Loss Of Load Expectation (LOLE) boundaries), see Section 3.1.1. The most up-to-date methodology to perform adequacy studies is used at each iteration (which is also used in European, regional and Belgian adequacy assessments).
METHODOLOGY66
The upper and lower average LOLE boundaries are defined in Section 3.1.2 3.1.1. ADEQUACY CRITERIA TO BE RESPECTED FOR EACH COUNTRY
LEGAL ADEQUACY CRITERIA OF BELGIUM (FIG. 67) For Belgium, the Electricity Law [GOV-1] describes the level of security of supply (adequacy) that needs to be achieved following a two-part LOLE criterion (see Figure 67). The model Elia uses for the probabilistic assessment enables the calculation of both indicators.
ENSURING ADEQUACY OF THE COUNTRY AND ITS NEIGHBOURS
The purpose is to measure this risk through a probabilistic approach by considering an adequacy criterion for each country. One of the most common criterion analysed for adequacy studies is the Loss Of Load Expectation (LOLE).
The latest Mid Term Adequacy Forecast (MAF 2017, page 33 –[ENT-2]), has made a summary of the reliability indices used in each country. Differences exist in the methodology and indicators used across Europe. CEER9 also published a report in 2014 giving an overview of the adequacy assessments in various European countries [CEE-1]. Most of Belgium’s neighbouring countries use the LOLE criteria as one of the reliability criteria to assess their adequacy
In order to meet future electricity demand while considering the uncertainties characterising the climatic conditions and the thermal generation availability, the risk of structural shortage is quantified through an adequacy study.
The LOLE is a statistical calculation used as a basis for determining the anticipated number of hours during which it will not be possible for all the generation resources available in a given country/zone to cover the load, while taking into account interconnectors, demand flexibility options and storage for an average year.
9. CEER: Council of European Energy Regulators (Great Britain – 3 hours, France – 3 hours and the Netherlands – 4 hours in an isolated situation). Other countries such as Greece, the Republic of Ireland and Portugal also have a LOLE criteria defined. European and regional adequacy studies also use the LOLE as one of the indicators. The LOLE criteria were therefore chosen in this study to define the level of adequacy in each country.
3.1
Given the fact that most of Belgium’s neighbouring countries work with the LOLE criteria, this study assumes that each simulated country should stay between the two defined boundaries for each scenario: — Under 3 hours of average LOLE (to ensure an adequate power supply); — Above 1 hour of average LOLE (to avoid countries in oversupply, which would affect the needed generation capacity calculated for Belgium). These criteria are key assumptions when calculating the needed capacity in Belgium to ensure adequacy. As observed in the ‘Low capacity’ scenario from the Elia ‘Adequacy and Flexibility’ Study published in April 2016 [ELI-6], the level of adequacy of our neighbours is a key driver. Average LOLE < 3 hours LOLE95 < 20 hours
Belgian adequacy is also assessed during this process.
— An adequacy simulation being performed;
ADEQUACY CRITERIA TO BE RESPECTED (FIG.
• The average LOLE of each country is calculated and compared to the defined boundaries;
Assumptions in terms of renewables, demand side response, total demand (including electrification), thermal generation capacities (coal, nuclear, gas, oil) and cross-border exchange capacities are defined for each scenario for all the countries.
3.1.2. ITERATIVE PROCESS ENSURING EUROPEAN AND BELGIAN ADEQUACY
• If the average LOLE is under the minimum boundary, capacity will be removed from the country;
67 METHODOLOGY
As removing or adding capacity in one country affects the adequacy level of the others, an iterative approach was followed to find an equilibrium. At each step this included:
Legal adequacy criteria of BE 1 hour < Average LOLE < 3 hours 3 hours < Average LOLE < 8 hours Hydro dominated countries. Average LOLE found close to zero Not modelled PROCESS TO OBTAIN AN ADEQUACY EQUILIBRIUM FOR ALL COUNTRIES (FIG. 69) Initial fromproductionthermalfleetallcountries Start For all countries*: If 1h < average LOLE < 3h Adequacy simulation Add/remove thermal capacity in countriesconcerned Thermal production fleet with an adequacy equilibrium End NO YES * For Belgium: Average LOLE < 3h / LOLE95 < 20h
The adequacy criteria to be respected in each country for each scenario are given in Figure 68.
The adequacy level of each country is dependent on the neighbouring countries’ level of generation and demand, given that cross-border exchange capabilities are taken into account in the assessment. In order to ensure that each country remains within the boundaries defined in Section 3.1.1., thermal capacity will be either added or removed (the assumptions on DSM, storage, RES and demand are fixed for each country per scenario).
— A new adequacy simulation is performed until each country is within the defined boundaries.
Required thermal capacity is therefore identified using the results from the iterative process. This analysis is performed for each scenario and time horizon. 68)
• If the average LOLE is above the maximum boundary, capacity will be added to the country;
The market model used to perform the adequacy simulation (ANTARES) is the same as the one used for the market outputs (see Annex 7.3.3 for more detailed information). The main differences between adequacy simulations and market simulations are:
The methodology used is largely inspired from the study on volume determination of the Strategic Reserves performed each year according the Belgian Electricity law. It is detailed in Chapter 2 (pages 21 to 36) in the latest report on the need for Strategic Reserves for winter 2017-18 [ELI-11]. A brief summary of the methodology is described here.
— The output analysed: The adequacy simulation looks only at the moments of structural shortage while the market study derives economic, sustainability and dispatch data.
3.1.3. ADEQUACY SIMULATION
An adequacy simulation consists of the hourly simulation of a large amount of ‘Monte-Carlo’ years also called ‘future states’. Each future state is a combination of: — Historical climate conditions for temperature, wind, sun and precipitation. These data are used to create a time series of renewable energy generation and consumption by taking into account the ‘thermo-sensitivity’ effect, see Section 2.4.1.3. The correlation between climate variables is retained both geographically and time wise. For this reason, the climatic data relating to a given variable (wind, solar, hydroelectric or temperature) for a specific year will always be combined with the data from the same climatic year for all other variables, see Figure 70. This rule is applied to all countries in the studied perimeter; — Random samples of power plant availability are drawn by the model by considering the parameters of probability and length of unavailability (in accordance with the ‘MonteCarlo’ method). This results in various time series for the availability of the thermal facilities for each country. This availability differs in each future state.
METHODOLOGY68
GENERATION OF A 'MONTE-CARLO' YEAR (FIG. 70) year i year i year i year i
What is the “Monte-Carlo” method? More information available on Annex 7.3.1.?
Selection of year 'i' based on the same climatic year N future states (or 'Monte-Carlo' years) Random selection from a large set of availability thermal time series Hundred thermal time series (available thermal capacity) 34 wind seriestime 34 solar time series 34 hydroseriestime 34 load time series
A 'Monte-Carlo’year A time series for the power plant availability will be associated to an historical ‘climate year’ (i.e. wind, solar, hydroelectric and electricity consumption) to constitute a ‘Monte-Carlo year’ or ‘future state’.
Climate conditions based on 34 historic years Thermal unit availability based on probability parameters
Each climate year is simulated a large number of times with the combination of random draws of power plant availability. Each future state year carries the same weight in the assessment. The LOLE criteria are therefore calculated on the full set of future states.
— The amount of future states: The adequacy study simulates the climate dataset several times with a different unavailability draw for each future state in order to obtain enough accuracy on the LOLE indicator. The market simulation simulates the set once with different unavailability draws for each future state;
Daily temperature Hourly consumption taking into account the thermo-sensitivity
Monthly hydraulic production Hourly production decided by the model by minimising the cost of the system
The wind, PV and temperature data related to each variable are the ones used by ENTSO-E for adequacy and market studies. MODEL'S VARIABLES (FIG. 71)
Hourly wind speed Hourly wind production
METHODOLOGY69
Sunshine hours, temperature Hourly solar production
The climatic variables are modelled on the basis of 34 historical years, namely those between 1982 and 2015 [ENT-2]: A set of 34 time series of correlated temperature (used in order to add the thermo-sensitivity effect to the demand), wind and solar generation are used to perform the simulations. These data are provided by the ENTSO-E Pan-European Climate Data Base (PECD).
The hydroelectric power generation data are based on historic generation values from each country for the years 1991 to 2015. The data from 1982 to 1990 are reconstructed on the basis of historical precipitation data for each country (based NCDC BOX 10 - MODEL’S VARIABLES
Finally, a random draw on the thermal generation facilities is performed based on historical availability rates: Availability rates for the Belgian thermal generation facilities are based on an historical analysis of the years from 2006 to 2015 (as defined in the Strategic Reserves volume evaluation report [ELI-1]). For the other countries, unavailability parameters from the ENTSO-E studies or from bilateral contacts are used.
Probability and duration of failure Random selection of the daily availability by the model data [NCD-1]). Note that hydro modelling in ENTSO-E studies takes only three hydro years into account for each country (normal, wet and dry).
—
These data are introduced by means of hourly or monthly time series or are established for a whole year.
The inputs provided to the tool enable the simulation of the market and determine the ‘future states’ based on a random selection from the associated time series. As described in INPUT AND OUTPUT DATA FOR THE MODEL (FIG. 72) DATA Centralised thermal production facilities Decentralised thermal production facilities production Interconnection capacity between countries flexibility 22 countries tooptimisationdispatchminimisecosts Economic generation
Section 3.1.3, the climatic data relating to a given variable for a specific year will always be combined with data from the same climatic year for all other variables and applied to all the countries.
Based on these inputs, the optimisation problems are solved with an hourly time step and a weekly time-frame, making the assumption of perfect information at this time horizon but assuming that the evolution of load and RES is not known beyond this. Fifty-two weekly optimisation problems are therefore solved in a row for each ‘Monte-Carlo’ year.
— Renewable
—
ANTARES calculates the most-economic unit commitment and generation dispatch, i.e. the one that minimises the generation costs while respecting the technical constraints of each generation unit. The dispatchable generation (including thermal & hydro generation, storage facilities and demand side response) and the cross-border market exchanges
—
— Storage — Demand
indicators • Market welfare, total costs, unit revenues, running hours Sustainability indicators • Emissions, RES share Dispatch indicators • Imports/exports,
INPUT
per type
The optimal dispatch is based on market bids on the marginal costs of each unit [€/MWh]. When this optimum is found, the following output can be analysed:
— Hourly dispatch of all the units; — Hourly commercial exchanges between market zones. constitute the decision variables of an optimisation problem, which essentially aims to minimise the total operational costs of the system.
The main input data for each country are: The hourly consumption profiles (including thermosensitivity effect, demand growth, consumption of heat pumps and electric vehicles); The installed capacity of thermal generation facilities and associated availability parameters or hourly production profiles for distributed generation; The installed PV, wind and hydroelectric capacity and associated production profiles based on the climate years; The interconnections or fixed commercial exchange capacities between countries and simultaneous max import capacities (NTC method) .
MODEL OUTPUT Hourly dispatch for all units in each country Commercial exchanges between countries — Hourly marginal prices — Adequacy indicators • LOLE, ENS
70 METHODOLOGY 3.2
For
—
SIMULATIONS Hourly
HOURLY ELECTRICITY MARKET MODEL
— Locational marginal prices based on market bids (in this study locations are market zones);
— Consumption —
In order to simulate the European electricity market, several assumptions and parameters must be defined. These elements are described in Section 2.3.3. Figure 72 gives an overview of the input and output data of the model.
An electricity market simulator developed by RTE, called ANTARES, is used to perform the electricity market and adequacy simulations.
—
—
— A curtailment cost is set from 50 to 100 €/MWh to penalise the surplus of energy in the system that cannot be evacuated or stored at a given moment.
How is the Unit Commitment and Economic Dispatch performed? More information available in Annex 7.3.2. ?
— Adequacy indicators (LOLE, ENS);
— A perfect market is assumed (no market power, bidding strategies,...) in the scope of the model;
— The commercial exchange capacities between all countries, including the CWE area, are modelled through the maximum fixed commercial capacity (NTC – ‘Net Transfer Capacity’);
Following the simulations, the output data provided by the model enables a large range of indicators to be determined:
— Perfect foresight is considered for renewable production, consumption and unit availability. This is not the case in reality, where forecasting deviations and unexpected unit outages are happening. Note that in the modelling approach for each market zone, a part of the capacity is reserved for balancing purposes and cannot be dispatched by the model in order to cope with such events;
— Hourly simulations of the market are performed considering that all the energy is sold and bought in the day-ahead market. There is no explicit modelling of longer term markets nor shorter time-frame markets (intraday and balancing);
— A single point of efficiency is considered for each thermal unit (no partial load efficiencies are considered): in reality this efficiency depends on the generated power of the unit;
71 METHODOLOGY
— The value of lost load used in the model was set to 3000 €/MWh which is currently the price cap used in the day-ahead market. Note that the effective loss of load value is higher;
— Sustainability indicators (emissions, RES shares); — Dispatch indicators (imports/exports, generation per fuel/ technology).
— Prices calculated in the model are based on the marginal price of each unit;
A number of modelling assumptions are important to be highlighted to correctly interpret the results:
— Economic indicators (welfare, total costs, unit revenues, running hours,...);
— Pumped storage units, batteries and demand flexibility are dispatched in order to minimise the total operation costs of the system. In reality this could be different as they could be used to net a certain load in a smaller zone or to react to other signals. The modelling approach also assumes that price signals are driving the economic dispatch of those technologies;
— An optimal solution is sought in order to minimise the total costs of operation of the whole simulated system;

Once the required additional thermal generation is identified for Belgium as described in Section 3.1, an optimal mix of new-built capacity is sought. The volume identified for each scenario and time horizon is either filled with: — OCGT: gas units with lower investments costs, but higher variable costs given lower efficiency; — CCGT: gas units with higher investments costs, but lower variable costs compared to OCGT (higher efficiency).
For each scenario (‘Base Case’, ‘Decentral’, ‘Large Scale RES’ and ‘FLEX+’) and time horizon (2030 and 2040), four different mixes will be assessed: — CCGT: 100% fulfilled with CCGT units; — CCGT75: fulfilled with 75% of CCGT and 25% of OCGT; — CCGT50: fulfilled with 50% of CCGT and 50% of OCGT; — OCGT: 100% fulfilled with OCGT units.
CCGT
OVERVIEW
PROCESS FOR THE IDENTIFICATION OF THE OPTIMAL CAPACITY MIX FOR THERMAL GENERTION IN BELGIUM (FIG. 73)
AnnuityTotalBE
72 METHODOLOGY
CCGT75
The market results obtained in STEP 2 are analyzed to extract the market welfare for each CCGT/OCGT mix. The associated annuity is taken into account to identify the most benefical mix option for Belgium in the scenario i CCGT75 CCGT50 OCGT CCGT CCGT50 OCGTOCGTCCGT Market welfare Annuity ,
3.3
welfaremarket [M€]totalBEand
A more detailed analysis on large scale biomass and CHP can be found in the results in Sections 4.7.2 and 4.7.3. In the end, the market shall determine the optimal mix between technologies. This economic study gives only an indication of what would be the most optimal solution for Belgium for each scenario given the costs and market welfare gain.
The additionnal needed thermal volume identified in the adequacy study for the scenario i is filled with 4 CCGT/OCGT mixes For scenarioeach Scenario i is simulated for each CCGT/OCGT mix defined in STEP 1
IDENTIFICATION OF THE OPTIMAL CAPACITY MIX FOR NEW THERMAL GENERATION IN BELGIUM
For each configuration, the optimal solution from an economic point of view for Belgium is calculated based on the market simulation output, see Figure 73 (see Box 11).
Note that other thermal units such as Combined Heat and Power (CHP), biomass,... could also be considered to fill the identified capacity. In such case, these technologies will replace part of the new-built thermal generation needed.
Hourly market simulation
Additionnal needed thermal capacity for scenario i [MW] STEP 2 STEP 3STEP 1

3. Market welfare: expresses the gain/loss for the consumer, producer and congestion rent for Belgium. The sum of those 3 factors called ‘net welfare’ represents the gain in welfare brought by the investment taken into account the yearly costs of the investment for the given area:
In order to determine the market weflare generated by the investment, two simulations are performed (with and without the investment).
Of what consists the market welfare?
The market welfare used in the calculation is an indicator to determine the additional gain/loss induced by an investment for the consumers, producers and congestion rents.
The Producer surplus
The Cost-Benefit analysis is computed from a Belgian perspective. The results provided in this study are based on the average results obtained for the different ‘MonteCarlo’ years simulated in the economic assessments.
FOR ADDITIONAL INTERCONNECTIONS
ANALYSIS
The producer surplus is defined as the market price multiplied by the quantity of energy produced minus the total variable cost of production.
The Congestion rents The congestion rent is defined as the price differences between the importing and exporting area multiplied by the traded energy quantity for each hour.
CONSUMER AND PRODUCER SURPLUS (FIG. 74) SupplysurplusConsumercurve = marginalcostProductionsurplusProducercost[€/MWh]Price Demand Quantity [MWh] 3.4
The methodology used to assess the societal value of a project is based on the methodology described in the Cost-Benefit Analysis of Grid Development Projects report published by ENTSO-E [ENT-5], see also Box 11. This approach allows the benefit of transmission projects to be determined by analysing the market welfare brought by a new investment, while considering its investment costs.
BOX 11 - HOW IS THE COST-BENEFIT ANALYSIS PERFORMED IN THIS STUDY?
73 METHODOLOGY
1. Annuity: represents the annual payment for an investment taking into account weighted average cost of capital (WACC) and a given economic lifetime; 2. Fixed O&M10 (FOM) costs: the yearly fixed costs needed to keep a device in operation;
The consumer surplus is defined as the difference between the maximum price at which the consumer is willing to pay and the actual price they do pay. COST-BENEFIT
The Consumer surplus
The market welfare will always be assessed against a reference case. Only deltas on the above-mentionned indicators will be provided.
Net welfare = Marketwelfare — FixedO&M — Annuity
In order to assess a given investment (generation, interconnection,...) or a combination of those, three factors are considered:
A Cost-Benefit Analysis is used to calculate the optimal thermal mix and to evaluate the economic benefits of additional interconnections. The evaluation of the additional interconnections follows the same methodology as described in the GuidelineforCost-BenefitAnalysisofGridDevelopment Projects published by ENTSO-E is used [ENT-5].
10. Fixed O&M: Fixed Operation and Maintenance
74 METHODOLOGY
Figure 75 illustrates the different concepts used in this section to evaluate the profitability of units. The figure is an example for a theoretical unit assuming no outages nor other dispatch constraints. Note that the indicators will be given for the most efficient generation unit in the system (without taking into account outages). An indication will also be given for the least efficient unit in the system. to
3.5.1.2. Unit revenues and inframarginal rent
3.5.1.3. Assessing unit profitability
3.5.1.1. Running hours of each unit are calculated by the model based on the marginal cost of generation
3.5 ADDITIONAL INDICATORS RESULTING FROM THE MARKET
Is an existing unit economically viable ?
1.
ancillary services, capacity remuneration, subsidies...).
3.5.1.
Energy
The unit profitability and running hours of gas-fired units are calculated based on the following model outputs: — hourly dispatch for each unit; — hourly marginal price.
Is a new investment profitable ?
An existing unit on the market is economically viable (assuming no cost of capital/investment) if the inframarginal rent can cover its fixed operation and maintenance (FOM) costs. The FOM represent the costs to maintain the installation, independent of the number of running hours (excluding investments costs and costs of capital).
Inframarginal rent (h)unit A = Revenues(h)unit A-Variable production cost(h)unit A = [Market price(h) * produced (h)unit A] – [Fuel costunit A + CO2 emission costunit A+VOM ] Additional revenues are not taken into account (e.g
lowest for a given year Running hours
The revenues of each unit are calculated based on the ‘inframarginal rent’. The inframarginal rent for a given generation unit is defined as the difference between the revenues of the unit on the market (market price multiplied by the generated energy) and the variable costs defined above. For a given hour, the inframarginal rent is defined as follows:
If the unit’s inframarginal rent can cover the FOM and investment costs, a new unit is considered as profitable. Given that this study only looks at two specific years, the investment costs will be expressed in annuities taking into account the ‘Weighted Average Costs of Capital’ (WACC), the economic lifetime and the CAPEX. The input data used in this study for annuity computation are summarised in Section 2.8.2.3. Based on this indicator, if the unit’s inframarginal rents are lower than the annuity and FOM for a given year, a new unit has a low probability of being built. Note that investment decisions are based on future assumptions over the whole expected lifetime of a unit. This study has only analysed two specific years and a range of climate years, which gives only an indication. Note that other factors such as risk tolerance are also crucial for investment decisions. STUDY UNIT PROFITABILITY AND RUNNING HOURS
EXAMPLE: INFRAMARGINAL RENT, PRODUCTION COSTS, MARGINAL PRICE AND RUNNING HOURS FOR A GIVEN AREA (FIG. 75) [€/MWh] 87600 0 Hours of the year Yearly inframarginal rent Yearly production costs Marginal price of theHourlyunit marginal prices of an area sorted from highest
The input data used in this study for the FOM for each technology is summarised in Section 2.8.2.3.
The running hours of each unit are a direct output of the model based on its marginal costs. The marginal cost is equal to the variable cost of production of each unit and is the sum of three elements: Fuel costs; 2. Direct emission costs; 3. Variable operation and maintenance costs (VOM). The marginal cost (short-term) of a production unit is defined as being the cost to produce an additional amount of energy (1 MWh) and is expressed in €/MWh produced.
Each generation unit in the model is characterised by a CO2 equivalent emission rate (expressed in kgCO2/MWh). The CO2 emitted by the unit depends on the fuel burned and its efficiency. The yearly amount of direct CO2 emitted by all thermal plants is computed for each simulation. Only the direct CO2 emissions emitted by units during their operation are computed. Biomass and nuclear are considered as emission-free technologies. Figure 77 provides the emissions rate for each fuel per amount of fuel used. The emissions from the electricity sector are the average over the climate years simulated.
75 METHODOLOGY
3.5.5. ENERGY EXCHANGES AND BALANCE
The model outputs the generation per unit for each area. The sum of generation per fuel or type and per year enables the production mix and shares of different types of generation for each country to be calculated.
The RES-E share calculated is the average of the shares of all the simulated ‘Monte-Carlo’ years.
3.5.6. PRODUCTION MIX
In order to quantify the portion of renewable energy in the total electricity consumption, the RES-E share is used as an indicator. The RES-E share is defined as the ratio between the electricity generated from RES in a country (where spilled energy is deduced) and the total electricity consumption This is also the definition used by the authorities to define the RES targets: RES-E share(country A) [%] = (RES productioncountry A Spilled energycountry A) Total demandcountry A Spilled energy is defined as excess energy from renewable generation that has to be curtailed in order to maintain the balance between generation and load (after taking into account all flexibility options such as storage, cross-border exchanges, demand flexibility,...) [RTE-2].
THE MARKET PRICE IS THE INTERSECTION BETWEEN THE SUPPLY CURVE AND DEMAND FOR EACH HOUR (FIG. 76) [€/MWh]costgenerationMarginal
DIRECT CO 2 EMISSION FACTOR PER FUEL (FIG. 77) Fuel CO2 emissions factor per fuel [kg/MWh] Biomass 0 Nuclear 0 Gas 215 Oil 280 Coal 405 Lignite 430
The commercial hourly electricity exchanges between countries are optimised by the model in function of the supply and demand curve of each country (see Annex 7.3.3 for more information). Based on this hourly optimisation, the imported and exported energy (with an hourly resolution) can be extracted from the results. The following indicators were calculated: — Total exports per year; — Total imports per year; — The net balance (exports minus imports) per year. The Belgian energy exchanges with the neighbouring countries and the Belgian net balance are the average of all the ’Monte-Carlo’ years simulated.
The model identifies the optimal solution which minimises the total production costs of the system according to the supply and demand of each country for each hour. The market price for each hour is the marginal cost of consuming an additional unit of energy for a given market area. The marginal unit of a given area is not necessary inside the area. If there is enough cross-border capacity available, the marginal unit might be abroad.
3.5.4. RENEWABLE SHARE IN THE ELECTRICITY CONSUMPTION
3.5.3. CO 2 EMISSIONS
Marginal price at hour hInstalled capacity [MW] Solar Wind Nuclear Coal Gas - CCGT Gas - OCGT Peaking units Demand price
3.5.2. WHOLESALE ELECTRICITY PRICES CALCULATED BY THE MODEL
76 4.1 — ADEQUACY REQUIREMENTS 78 4.2 — SUSTAINABILITY INDICATORS 86 4.3 — ENERGY MIX 88 4.4 — OPTIMAL SHARE OF THE NEW THERMAL GENERATION FLEET IN BELGIUM 92 4.5 — GAS-FIRED UNIT: ECONOMIC RESULTS 94 4.6 — ADDITIONAL INTERCONNECTORS: ECONOMIC RESULTS 98 4.7 — ECONOMIC IMPACT ASSESSMENTS ON A PARTIAL NUCLEAR EXTENSION, CHP AND LARGE-SCALE BIOMASS 101 4.8 — ECONOMIC COMPETITIVENESS OF BELGIUM 104 4.9 — TOTAL INVESTMENT AND FIXED COSTS FOR EACH SCENARIO 109 4.10 — SUMMARY OF FINDINGS 112 SIMULATION RESULTS 04
This chapter provides a detailed overview of the following results:
— Belgian gas-fired unit profitability and running hours based on revenues from the simulated wholesale market indicate that the probability is low that the needed thermal investments will happen without support (Section 4.5);
— Belgian competitiveness based on wholesale market prices will show that an efficient generation fleet in Belgium combined with additional interconnectors are a must (Section 4.8);
— Total investments costs for each scenario and market welfare difference will allow assessing the costbenefits of an accelerated energy transition (Section 4.9)
— Economic impact assessments of a partial nuclear extension, new large scale biomass and CHP were assessed (Section 4.7);
— Adequacy requirements for Belgium and Europe in each scenario demonstrating the need for thermal generation until at least 2040 to keep the lights on (Section 4.1);
— Additional interconnector benefits were assessed based on welfare/cost results. The results show that additional interconnectors are a must do for the country to keep its competivity with the neighbouring countries, integrate the renewable production and create industrial opportunity (Section 4.6);
— Energy mix and cross-border exchanges. Towards decarbonisation, the production mix will mainly be composed by RES and gas in Belgium with an increase of electricity exchanges in both directions (Section 4.3);
— Optimal Belgian production fleet based on welfare/cost calculations showing that in the long run an efficient fleet of power plants is the most robust option for Belgium across the scenarios (Section 4.4);
— Sustainability indicators for each scenario, mainly assessing the GHG emissions reduction in the electricity sector (Section 4.2);
This chapter presents the results from the electricity market modelling. The scenarios, assumptions and the methodology are explained in details in Chapters 2 and 3. All the data and analyses are based on an economic dispatch market model and with a large set of climate years and ‘Monte-Carlo’ draws on unavailability of thermal units.
RESULTSSIMULATION77
FOR EACH SCENARIO IN BELGIUM (BY
The first step consists of the evaluation of the capacity needed to ensure that the Belgian legal adequacy criteria are fulfilled and that the other European countries are within an upper and lower boundary of average LOLE. Pursuant to Belgian law, Elia is in charge of conducting the periodic adequacy forecast for determining the need of Strategic Reserves. In this context, tools and methods are continuously developed to take into account the latest information and the most up-to-date methodologies.
TAKING INTO ACCOUNT EXISTING CHP AND EXISTING BIOMASS) (FIG. 78) Given uncertainties
RESULTSSIMULATION 78 4.1
the neighbouring countries’ production fleet in the future, an additional 1 to 2 GW could be considered to maintain the legal adequacy criteria. Keeping only existing units < 25 years Keeping only existing units < 25 years decomissioningNuclear [GW] BC RES DEC BC RES DEC Grid+ Flex+2017 2020 2023 2026 2029 2030 2032 2034 2036 2038 2040 Undefined Undefined can be: new biomass, new ccgt/ocgt, nuclear extension, new chp… Existing CCGT/OCGT Existing units in the system are assumed decomissioned after 25 years Existing nuclear Follows the current law > 5.9 > 5 > 5.6 > 6.1 > 5.6 > 6.7 > 5.6 > 6.2 2.33.6 2.32.7 2.33.3 6.1 5.6 6.7 5.6 6.2
A long-term study like the present one does not aim to determine concrete figures for the next winters. Given the large number of uncertainties, the calculated values give an indication based on the assumptions taken for the studied time horizons. Different scenarios and sensitivities quantify the impact of other hypotheses on adequacy requirements.
The thermal capacity needed in Belgium in the different scenarios in 2030 and 2040 is shown on Figure 78. Note that the identified need of thermal capacity comes on top of existing CHP, waste and biomass capacity (around 3 GW in total) considered as available for all the scenarios. Different technologies can constitute the new-built thermal generation identified such as CCGT, OCGT, biomass units, CHP... 9.73.85.9
The capacity additions or reductions are performed for all the countries at the same time as explained in Section 3.1.2 in the methodology chapter. It results in an adequate generation fleet for each country with between 1 and 3 hours of average LOLE.
To keep the lights on, there is a need for new-built thermal capacity (new CCGT, new OCGT, new CHP, new biomass,…) in all scenarios after the nuclear phase-out and this for the whole time horizon covered by this study. According to the study’s results, this new-built capacity needs to reach at least 3.6 GW by 2025. This figure of 3.6 GW counts upon an important contribution from DSM, RES and storage, which is considered separately and comes on top of the new-built capacity needs.
DSM volumes, RES and storage are already taken into account to calculate the adequacy requirements. Quantification depends on the scenario.
4.1.1. NEED FOR THERMAL GENERATION IN BELGIUM
2030 2040TODAY On top of this capacity, 3 GW of biomass/waste & CHP were considered for all scenarios and time horizons.
2017-2030 NEED FOR THERMAL GENERATION IN 2030 AND 2040 ALREADY on
ADEQUACY REQUIREMENTS
The needed capacity calculated in this study should be seen as thermal capacity where the normal industrial availability of the different technologies has already been taken into account Distincts penetration levels of DSM, storage and RES to adequacy are considered which results in different needs for thermal generation.
The long-term need for thermal capacity to ensure adequacy is the main finding from the 2040 adequacy results. The model results confirm that the required new-built generation capacity for 2025 will not be stranded for adequacy reasons, at least not until after 2040 Indeed, new-built capacity is needed to keep the lights on during periods of sustained low wind and solar injection, which cannot be covered by batteries, other storage or demand side flexibility. It can be observed that, even in a scenario with large amount of demand flexibility and decentralised storage, substantial thermal generation will be needed to ensure adequacy (see Box 13).
From the total thermal capacity needed in the scenarios, 2.3 GW of thermal generation is assumed to be from existing units built after 2005 (not reaching the 25 years of operation in 2030). The need identified in the ‘Base Case’ scenario can also be extrapolated for the period right after the planned nuclear phase-out (in 2025-2026). This results in a need for at least 3.6 GW of new-built thermal generation capacity that has to be developed in Belgium in order to compensate for the planned steep drop in thermal generation following the expected decommissioning of old gas units and the nuclear phase-out. It is important to mention that the 3.6 GW takes into account the expected contribution of energy efficiency, demand flexibility, storage, the expected growth of intermittent renewable sources and, as set out in the assumptions, all relevant grid investments to 2025. Therefore, the calculated capacity is to be filled by thermal units (see Box 13 for more information).
The adequacy study indicates a need for 5.9 GW of thermal generation capacity to be available in Belgium in 2030 in the ‘Base Case’ scenario. Lower needs were identified in the ‘Large Scale RES’ (5 GW) and ‘Decentral’ (5.6 GW) scenario, which is mainly linked to increased renewable penetration, storage and demand side response compensating for the higher demand in those scenarios.
Results for 2040 show that the thermal capacity needed is almost equivalent to the capacity identified in 2030. The small increase is driven by the additional electrification considered in all scenarios. High volumes of electric vehicles and heat pumps will result in higher peak demand (see Section 2.4.1.4).
RESULTSSIMULATION 79 4.1.1.1. Results for 2030 (and back casting to 2025)
4.1.1.2. Results for 2040 (long-term perspective)
Part of this increase can be compensated by additional RES, combined with storage and DSM.
The results and conclusions of this long term study are in line with the ‘Adequacy and Flexibility study 2017-27’ performed by Elia last year (2016).
The lifetime assumption of 25 years with regard to existing thermal generation has substantial impact on the results of the adequacy analysis right after the planned nuclear phaseout. Indeed, 3 units, totalling 1.2 GW (Herdersbrug, Ringvaart, Saint-Ghislain), will be slightly older than 25 years in 2025 and are therefore considered out of service at this moment. This assumption is justified by the necessity to keep a margin (a.o. by lifetime extension beyond 25 years) for managing the risk related to decisions that will be taken in the neighbouring countries concerning their adequacy. Indeed, the need identified for Belgium is strongly connected with the adequacy level of the neighbouring countries. As identified in the ‘Adequacy and Flexibility study 2017-27’ [ELI-6], the need could sharply increase in line with the inadequacy of neighbouring countries (see Section 4.1.1.3 for more details).
In the Elia study on ‘Adequacy and Flexibility for the 2017-2027 period’, published in April 2016, the term ‘structural block’ was introduced and was referring to a 100% theoretically available generation, storage or demand response capacity. In this study, the concept ‘thermal capacity’ is introduced and refers to thermal generation (CHP, CCGT, OCGT, biomass, coal, nuclear...) of existing or new units needed to ensure adequacy on top of the assumed penetration level of the other technologies taken into account in the different scenarios. Different levels of DSM, Storage and RES are already given for each scenario. Note that existing CHP and biomass are assumed available for the whole time horizon in all the Thescenarios.results obtained in this study are in line with the ‘Adequacy and Flexibility’ study performed in 2016 for the 2017-2027 period. Starting from the ‘structural block’ volume of 4 GW (assumption of 0% demand growth for Belgium), 100% available: THIS STUDY
and RESUnavailability of units No new biomass 0.6%/y growth “low capacity” 2027
ALREADY TAKES THE CONTRIBUTION OF DSM, RES AND STORAGE INTO ACCOUNT. THE CAPACITY CALCULATED IS TO BE FILLED BY THERMAL UNITS THE UNAVAILABILITY RATES OF THOSE IS TAKEN INTO ACCOUNT THE VOLUME IDENTIFIED (FIG. 79) RES 0%/y growth Adequacy Flexibility study 2017-27 (Apr. 2016) Demand growth around 0%/y and new biomass considered. Electricity Scenarios for the Energy Transition (Nov. 2017) Demand growth around +0%/y but different levels of electrification taken into account on top of that; biomass increase is not expected anymore in the short term; Different levels of DSM, storage, RES per scenario. levels of storage, DSM - STRUCTURAL capacity was assumed assumed with
&
+0.6%/y; • 600 MW
•
BLOCK This
100% available and technology neutral 2030 - THERMAL CAPACITY This capacity is
— The ‘structural block’ volume was considered as 100% available. The ‘thermal capacity’ assumes thermal generation with its forced and planned outages, based on industrial statistics;
Belgian
80
— Finally, the levels of electrification, DSM, storage and RES are different for each scenario, which leads to different needs between scenarios.
— Additional new biomass (600 MW) as considered in the 2017-27 study is not taken into account anymore in any of the scenarios given the cancellations of the projects;
RESULTSSIMULATION
• A
— Demand growth is slightly different from the ‘Base Case’ of the 2017-27 study and differs with the penetration of electric vehicles and heat pumps for each scenario. This additional electrification leads to a higher need in all scenarios compared to ‘Base Case’ scenario of the 2017-27 study and differs per scenario;
•
[GW] BC
DEC
•
outages and filled by thermal units (new biomass, new gas units or existing units) 8 GW > 5.9 GW > 5.6 GW > 5 GW 5 GW 4 GW
Electrification ≠
IN
WHERE
BOX 12 - THERMAL CAPACITY VS. STRUCTURAL BLOCK
Mature storage technologies and demand flexibility will contribute to the adequacy of the system but will not eliminate the need for thermal generation as they cannot provide a solution for long periods without wind and sun. This study takes into account the contribution of DSM, RES and storage. Demand flexibility and storage will have an increased role for balancing the system and daily cycling and solve local congestions given the increased amount of intermittent RES in the system.
4.1.2. STORAGE, RES AND DEMAND FLEXIBILITY
The Elia study of 2016 has demonstrated that significant additional domestic capacity needs may be required in cases of insufficient generation capacity in neighbouring countries. These needs come on top of the necessary new-built capacity, which is calculated with the assumption of neighbouring countries being adequate. Due to the fact that these additional needs will be activated infrequently, they can be served by a variety of resources, including the life extension of old plants (beyond the 25 years assumed in this study), additional demand side flexibility or storage, new peakers with relatively short construction time, etc. The exact additional need can be more accurately assessed in a few years time based on the evolution of neighbouring countries’ adequacy.
RESULTSSIMULATION 81
With the increase of distributed and intermittent renewable generation, digitalisation will play a major role in enhancing demand flexibility and the most efficient use of the grid infrastructure and storage devices. During some days of the year, in ‘high renewable’ scenarios, there is enough generation in Belgium complemented with storage devices, DSM and cross-border exchanges to ensure adequacy. Balancing the system in such conditions could be challenging given that PV and wind are depending on the weather conditions. Flexibility options such as decentral and centralised storage, demand flexibility and interconnections will help the system to remain in balance.
2.3 With low utilisation rates for adequacy BC 2025-2030
In order to qualitatively describe the effect of DSM and storage in a high renewable context, two weeks in the ‘FLEX+’ scenario are analysed (Belgian assumptions: 18 GW PV, 11 GW of wind, 11.5 GW storage (through home batteries, electric vehicles, pumped-storage and 35 GWh reservoir). It is worth mentioning that the energy mix of this rather extreme 2040 scenario is, at best, two decades later than the present situation.
INCREASED NEED IN CASE THAT NEIGHBOURING COUNTRIES ARE NOT ADEQUATE (FIG. 80) [GW] 3.6 +1 to 2 GW
4.1.1.3. Additional capacity needed if neighbouring countries are not adequate
Additional capacity (generation, DSR and possibly some high-volume storage) could be needed if the neighbouring countries’ production fleet is not adequate (estimated at 1 to 2 GW additional capacity resources but with low utilisation rate).
CONTRIBUTION TO ADEQUACY
Excess of national RES generation exported and stored3 During the weekend, the wind blows again in Belgium. Given lower demand during those days due to economic activity, the excess of renewable generation in the country is exported. Some energy is also stored in batteries, pumped-storage reservoirs, and electric vehicles to be used the following week.
higher
National RES generation complemented with RES imports2 The second part of the week experiences a drop in wind generation in Belgium but there is still enough renewable generation abroad to be imported into Belgium. The drop is therefore complemented with additional imports.
Enough with national RES generation and flexibility options1 During the first three days of the week, RES combined with must run generation (biomass, hydro run of river and CHP) is enough to ensure adequacy of the system. No gas-fired generation (other than biomass and CHP) was started up for market economic reasons as there is enough with renewables and flexibility options in all neighbouring countries. The effect on DSM and storage can be clearly identified where the reservoirs are filled during the day and emptied during and after sunset. Demand is shifted from the evening to the day when there is excess generation.
RESULTSSIMULATION 82 ONE WEEK IN SUMMER/INTERSEASON 'FLEX+' SCENARIO* IN 2040 (FIG. 81) Note that net cross-border exchanges are not shown. Those are the difference between the demand curve, generation stored/shifted and generated energy. * 35 GWh of storage - 18 GW of PV - 11 GW of wind PV Storage DSM Wind CHP/biomass/hydro CCGT/OCGT Demand Mon Tue Wed Thur Fri Sat Sun 1 2 3 [GW] -1010152050-5 andstorage,pumped-(batteries,andEnergyinenergyGeneratedBelgiumstoredshiftedEV,...)DSM
The first week is a summer/interseason week where PV production usually
is
Wind and efficient gas generation exported1
During the first part of the week, there is enough renewable generation in Belgium to cover the load but not enough abroad. The efficient gas fleet in Belgium is exporting energy abroad to cover the demand of its neighbours. National RES generation complemented by efficient gas generation2
The following days of the week, a lower wind production is observed which leads to a need for thermal generation in Belgium. In this case there is enough generation from efficient gas units to cover almost the entire Belgian demand. In other cases, there is not enough to cover it with national generation and more energy is imported from abroad.
The second week analysed is a winter week. Wind is usually more predominant than PV
Enough with national RES generation and flexibility options3
The wind blows again during the weekend in Belgium and abroad. Gas-fired generation is not dispatched given the excess of renewable generation. Saturday experienced both a high wind and PV production. The excess generation was stored in the batteries/pumped-storage/EVs to be used the next week. The rest is exported. During some hours, an excess of generation is simultaneously happening in more than one country, which leads to curtailment of energy. The generated energy is lost as it could not be stored, shifted or exchanged. Such moments will increase in the future with the increase of variable RES production.
RESULTSSIMULATION 83 Mon Tue Wed Thur Fri Sat Sun ONE WEEK IN WINTER - 'FLEX+' SCENARIO* IN 2040 (FIG. 82) Note that net cross-border exchanges are not shown. Those are the difference between the demand curve, generation stored/shifted and generated energy. * 35 GWh of storage - 18 GW of PV - 11 GW of wind [GW] -1010152050-5 PV Storage DSM Wind CHP/biomass/hydro Gas Demand andstorage,pumped-(batteries,andEnergyinenergyGeneratedBelgiumstoredshiftedEV,...)DSM 1 2 3
BOX 13 - ‘DUNKELFLAUTE’: NEED FOR THERMAL GENERATION DURING PERIODS OF LOW RENEWABLE INFEED
The most dimensioning moments for adequacy are cold periods during winter (increase of consumption due to heating). Cold spells are usually accompanied by low wind generation, which leads to the so-called “Dunkelflaute”: no wind and little sun (it’s winter). During those periods, that can last from a few days to one or two weeks, thermal generation is the only technology that can ensure the adequacy of the country complemented with imports (if excess of thermal generation is available abroad).
Therefore, there can be days or weeks where additional thermal generation is not needed. On the other hand, periods with low renewable infeed could last several days as seen in the figure. As an indication, the energy that has to be stored to cope with such periods, is higher than 1000 GWh. Even if current storage technologies are fully used for this purpose they would not be able to meet this need. In those moments imports and thermal generation will be key to keep the lights on.
The Figure 84 illustrates a longer period during winter. An entire month with the renewable infeed and must run capacity (biomass, hydro and CHP) is shown. The remaining need (difference between demand curve and renewable infeed) has to be filled by thermal generation, imports and other flexibility options. The wind and PV fluctuations have temporal scales (daily variations very pronounced for PV, seasonal patterns but also variations over multiple days).
84 (if there is enough capacity available in the neighbouring countries) or by national thermal generation. DSM can play a role but given limitations such as the limited amount of consumption that can be shifted over a day, the full need will not be covered by such flexibility. Even if the demand would be completely flattened, the need would remain. Demand would need to be shifted over several days or weeks. Reduction of demand during some moments (DSM shedding) can help but would be needed for long periods (several days in a row) to be effective.
Such periods of cold weather and low wind were experienced recently during the month of January 2017. See related article in the press about this phenomenon: [DER-1], [ENT-4].
RESULTSSIMULATION
NEED FOR THERMAL GENERATION FOR ADEQUACY: 'DUNKELFLAUTE' (FIG. 83) * 35 GWh of storage - 18 GW of PV - 11 GW of wind [GW] -1010152050-5 PV Storage DSM Wind CHP/biomass/hydro Gas Demand EV,...)pumped-storage,(batteries,andEnergyinenergyGeneratedBelgiumstoredshiftedandDSM Thermal generation will be needed to cope with long periods without wind & sun even in a scenario with increased flexibility ('FLEX+' scenario). Mon Tue Wed Thur Fri Sat Sun STORAGE NEEDED TO COPE WITH LONG PERIOD WITH LOW RES INFEED - 'FLEX+' SCENARIO (FIG. 84) * 18 GW of PV - 11 GW of wind ** if connected permantly to the grid and batteries of EV only used to store energy to balance the system [GW] 10121416182086420 PV Wind CHP/biomass/hydro Demand 1000 GWh 1700 GWh pumped-Existingstorage 1 batteries""homeMio 2EVMio** 100 GWh15 GWh6 GWhHow much can be stored in ?
Figure 83 illustrates such a week with low wind infeed and high consumption in the ‘FLEX+’ scenario (35 GWh of storage in batteries/EV/pumped-storage, 18 GW of PV and 11 GW of wind). As indicated in the figure, the remaining gap after using all RES and storage capability, will need to be filled by imports
Storage is already included in the figure (35 GWh of storage reservoir consisting of electric vehicles assumed as ‘Vehicle-toGrid’, pumped-storage and ‘stationary batteries’). It can clearly be seen that it won’t solve the need for thermal generation/ imports during cold winter weeks to ensure adequacy.
RESULTSSIMULATION 85
— The installed thermal capacity in the ‘Decentral’ scenario can be reduced by 32 GW compared to the ‘Base Case’ scenario, despite a higher demand in all countries driven by electrification. This shows how the combination of PV+storage and DSM in the medium-term contribute to adequacy;
4.1.3.2. Results for 2040 Despite the increase in demand for all the scenarios from 2030 to 2040, the thermal capacity needed for adequacy purposes is lower overall in 2040 than in 2030, thanks to an assumed increase of RES, storage and demand flexibility in all Thecountries.threescenarios present similar levels of required thermal capacity to be adequate. The marginal additions of RES contribute less to adequacy given the already high amounts in the system (wind blows at the same time in a given country, sun is shining at the same moment across a country,...). Despite the lower effect of RES additions for adequacy, it compensates for the increase of the need of additional capacity due to electrification.
— The increase of wind in the ‘Large Scale RES’ scenario also lowers the needed thermal capacity by 21 GW compared to the ‘Base Case’ scenario. A higher wind penetration is also beneficial to lower the adequacy needs in the medium Noteterm.that a higher amount of renewable capacity in the system could require additional thermal generation to balance the system depending on the development of other flexibility sources, evolution of forecasting methods,... Adequacy in each European country is ensured at between 1 and 3 hours of average LOLE with some specific cases (other national criteria or hydro-dominated countries).
4.1.3. RESULTS FOR THE EUROPEAN PERIMETER 20402030 (-32 GW) (-21 GW) (+3 GW)(-9(-10GW)GW)(-4 GW) 397 GW 400 GW 393 GW 391 GW 383 GW 442 GW 410 GW 421 GWDECRESBC INSTALLED EU22 THERMAL CAPACITY FOR EACH SCENARIO (FIG. 85) Grid+Flex+ 4.1.3.1. Results for
The total thermal capacity (including decentralised CHP, biomass...) amounts to 442 GW in 2030 in the ‘Base Case’ scenario. Keeping the same level of adequacy for each country leads to a decrease in the thermal capacity needed for the studied perimeter in the ‘Large Scale RES’ and ‘Decentral’ scenarios:
European interconnection corridors (total of around 30 GW of additional interconnection capacity between European countries (excluding the Belgian projects separately analysed) leads to a decrease of around 10 GW of the thermal capacity required in the other countries (‘GRID+’ compared to the ‘Large Scale RES’ scenario). Additional interconnections over long distances allow the benefits from different energy mixes, weather conditions, demand flexibility and storage capacities in the different European countries and regions to be shared. 2030
The optimisation of generation capacity is done step by step (see Section 3.1.2). Results of the optimisation are shown in the Figure 85.
DSM can play a role contributing to adequacy. Additional demand flexibility can further reduce the need for thermal generation (‘FLEX+’ scenario compared to the ‘Decentral’ Additionalscenario).

4.2
SUSTAINABILITY INDICATORS
— Maximising the RES penetration in Europe and inside of Belgium, combined with energy policies (on networks, generation, digitalisation) will enable the energy transition;
BC DEC
RESULTSSIMULATION 86
The renewable share in the electricity consumption is one, but not the only one, of the key drivers that enable the GHG emission reductions to be achieved. Other low emission technologies could also be used and in the short-term decommissioning of the most GHG emitting ones. The European Union has set different targets for 2020 and the effort was shared between member states. This section will deal with European indicators. The Belgian RES share values are assessed in the Section 4.3.
Additional emissions reductions in other sectors driven by additional electrification considered in the scenarios are not reflected in this figure. RES Flex+ Grid+ ‘gas-before-coal’ ‘coal-before-gas’
GHG emissions from the electricity sector in the different scenarios indicate that:
The electricity sector will need to be almost carbon free by 2050 in order to meet the decarbonisation targets set by the European Union (see Section 2.1.4 for more information).
4.2.1. EUROPEAN INDICATORS
The ‘Large Scale RES’ and ‘Decentral’ scenarios achieve much higher RES-E shares given the assumptions taken in terms of PV and wind penetration.
— Sustainability of the electricity generation should be assessed on the European perimeter as with more variable renewable sources, more cross-border exchanges will be observed.
Figure 86 indicates the level of renewable penetration in the electricity sector and the corresponding GHG reduction (from the 1990 level) for each scenario. The possible ranges in emission reductions for the electricity sector for 2030 and 2050 are also indicated.
— The ‘Decentral’ and ‘Large Scale RES’ will be most probably on track towards 2050 sustainability targets;
Following the different scenarios, assumptions were taken for the installed capacities in each country in order to reach at least 50% RES-E share in 2030, and 60% in 2040. For 2030, this corresponds to a possible target to be achieved by the electricity sector but will depend on other parameters such as total energy demand (hence energy efficiency), pace of decarbonisation of the other sectors...
Given that electricity can be traded between countries and the fact that emissions are falling under the EU Emissions Trading System, the national perspective will not be assessed.
CO 2 EMISSIONS REDUCTION IN THE ELECTRICITY SECTOR AND RES-E SHARES IN EU22 FOR EACH SCENARIO (FIG. 86) EU22 RES-E share [%] 2040 2020 2016 COelectricitydirectEU222reductionssince1990level[%] -100%-90%-80%-70%-60%-50%-40%-30%-20% 2030 possible ranges to be on track 2040 possible ranges to be on track 2050 possible ranges to be on track 30% 40% 50% 60% 70% 80% 90% 100% 2030
— The ‘Base Case’ scenario reaches the 2030 ‘electricity targets’ only in a ‘gas-before-coal’ setting and will be most probably fall behind the track towards 2050 targets;
The reduction in emissions resulting from the merit order shift is due to the decrease in coal and lignite production.
87 between 2040 and 2050. Other emerging technologies could also solve part of the gap however the challenge is significant.
Additional flexibility (‘FLEX+’) in the ‘Decentral’ scenario will lead to higher RES-E shares and reductions in GHG emissions because curtailments in renewable energy can be reduced (see Section 4.3.4 for more information). Note that the ‘Decentral’ scenario has the highest electricity demand by massive electrification of other sectors. This also means that reductions of GHG emissions will be higher in transport and heat (this is not taken into account in the figure nor was quantified as only the electricity emissions were calculated).
Due to the fact that in this scenario it was assumed that most of coal generation is decomissioned in Europe, the difference between ‘coal-before-gas’ and ‘gas-before-coal’ merit order is very small. In both the ‘Large Scale RES’ and ‘Decentral’ scenarios, an approximate additional 20% GHG should be reduced between 2040 and 2050 to achieve the 2050 targets.
The ‘Decentral’ scenario achieves a -70% in GHG reduction.
The ‘Large Scale RES’ scenario achieves the highest GHG emission reduction with -75%. Additional grid (‘GRID+’) on the ‘Large Scale RES’ scenario leads to higher RES-E share and emissions reduction by reducing the curtailment of renewable energy (see Section 4.3.4 for more information).
The ‘Base Case’ scenario achieves 60% of RES-E penetration at the EU22 level (by assumption). In terms of GHG emission reductions, depending on the merit order it could range from -60% to -67%. This reduction might not be enough to reach the targets in 2050 unless the other sectors achieve more (but given that the ‘Base Case’ scenario presents the lowest electrification compared to the other scenarios, the probability is low). The remaining gap (around a 30% additional reduction to be achieved in 10 years) is to be filled
RESULTSSIMULATION
4.2.1.1. Results for 2030
The ‘Base Case’ scenario achieves 50% of RES-E penetration at the EU22 level (by assumption). In terms of GHG emissions reduction, depending on the merit order it could range from -48% to -56%. A strong CO2 price enabling a ‘gas-before-coal’ merit order is key to stay on track towards the 2050 targets.
The ‘Decentral’ and ‘Large Scale RES’ scenarios present similar levels of RES penetration (almost 60%) and GHG reductions (around -60% in C2G and -65% in G2C). The GHG reduction targets could be achieved in both merit orders. A strong carbon price could be needed to ensure that investments in renewables will be made (see Section 4.8 for more information).
4.2.1.2. Results for 2040
The biggest contributor to the RES share in Belgium is wind. PV contribution is lower given the low load factor of this technology in Belgium. Even with 18 GW of installed PV capacity, it represents roughly 20% of the electricity mix in Belgium in 2040 in the ‘Decentral’ scenario. Given the favourable windy conditions of Belgium, from a European perspective, investing in more wind is beneficial. In 2040, in the ‘Large Scale RES’ scenario, the country is almost neutral in terms of cross-border exchanges. While imported volumes of electricity remain similar between 2030 and 2040, exports volumes increase with the increase of RES in the system. The corresponding RES-E shares are provided in the in Figure 88.
RES-E SHARE IN BELGIUM FOR THE DIFFERENT SCENARIOS (FIG. 88) 20402030 DECRESBC 57%40%40%30% 2015 15% 68%46% 2030 2040 ELECTRICITY PRODUCTION MIX AND CROSS-BORDER EXCHANGES IN BELGIUM WITH 100% NEW CCGT (FIG. 87) BC G2C DEC G2C RES G2CG2C BC DEC G2C RES C2G C2G C2GC2G C2G C2GG2C Net imports Gas PV Wind Biomass/geothermal/hydro [TWh] 100120806040200 [TWh] -40-30-20-10102030400 importsexports 17402156 30321765 253011196 312411196 13362867 17312867 14402565 20342565 6 6 8 8 32 32 46 46 17 17 10 10 35 29 26 26 8 15 6 6 -3413 -37 -37 -38 -27 -30 -30 -30 -28 -31 -282220151511 -282216 101287 4.3 ENERGY MIX 4.3.1. BELGIAN PRODUCTION MIX The future Belgian electricity mix will mainly be composed by RES and thermal capacity, while further increasing cross-border exchanges (relatively high imports in a ‘status quo’ approach, balanced exchanges in a more proactive approach). Due to the weather conditions of Belgium, a RES mix with a relatively higher share of wind is beneficial. After the nuclear phase-out, there will mainly be two types of generation capacity in Belgium: RES and gas-fired units. Gas will remain a predominant fuel for the transition in Belgium. The higher the RES penetration, the higher the cross-border Onexchanges.Figure87 shows the different shares of generation for Belgium. Detailed Belgian residual demand analysis can be found in the Annex 7.4.2?
RESULTSSIMULATION88
(FIG.
Impact of merit order2 In 2030, there will still be coal generation in some countries in Europe. Assuming that Belgium will rely on gas-fired generation (after the nuclear phase-out), it is more beneficial for the country to be in a ‘gas-before-coal’ setting where gas-fired units have lower marginal costs than coal units. An unfavourable merit order for gas could lead to 10 TWh of additional imports for Belgium. This difference will decrease with the decommissioning of coal-fired generation in Europe.
RESULTSSIMULATION 89 4.3.2. BELGIAN CROSS-BORDER EXCHANGES
(ELECTRICITY
4 1 32 DEC DECRES RESBC BC -21.5 -25.4 -12.5 -13.7 -6.7 -3.9 100% CCGT 100% OCGT
C2GG2C
Cross-border exchanges in each scenario are shown in Figure 87 with the energy mix of Belgium. Both imports and exports are provided. With the increase of RES more electricity is exchanged, taking advantage of different weather conditions in Europe (see also Section 4.3.5 for detailed analysis).
2030
The cross-border exchanges between Belgium and its neighbours will mainly depend on three drivers: The penetration of RES in Belgium and abroad; The merit order, given that no more coal is installed in Belgium; — The production fleet efficiency of Belgium. Note that additional interconnections between Belgium and its neighbours will not affect the net balance (exports minus imports) as additional energy will be exported and roughly the same amount imported during other moments. The above drivers are also illustrated in Figure 89. G2C CCGT CCGT
NET
2040 G2C 100%
interconnectionsImpact
-21.5 -50-40-30-20-100Wh][T -50-40-30-20-100Wh][T
—
100%
—
The efficiency of the Belgian production fleet is the biggest driver when looking at the net balance of the country. An inefficient production fleet (filled with OCGT or peaking units) will lead to much higher import volumes. The country will then import electricity generated from more efficient gas units abroad, leading to net import volumes close to 40 TWh a year in the ‘Base Case’ scenario.
Impact of additional 4GW interconnections4 More interconnections (+4 GW in this case) lead to higher cross-border exchanges in both directions and have no or little impact on the net balance of the country.
Impact of production fleet efficiency3
Detailed results on energy exchanges for each scenario can be found in Annex 7.4.2?
Impact of merit order Impact of production fleet efficiency Impact of additional 4GW of additional RES in Belgium BALANCE OF BELGIUM IN THE DIFFERENT SCENARIOS EXPORTS MINUS IMPORTS) 89) -38.7 -21.5 -30.1 -21.5 -21.7
Impact of additional RES in Belgium1 RES is the only primary energy that Belgium has. More RES in Belgium will mean more electricity exports. Additional wind is always beneficial to reduce the net electricity balance of the country. Additional PV also reduces the net balance unless there is high electrification such as in the ‘Decentral’ scenario. In such a scenario, the demand is higher compared to the other scenarios and requires more imports in 2030, although the opposite is observed in 2040 (more wind was considered in 2040 for Belgium). In 2040, all scenarios assumed an increase of renewable production in Belgium. The net balance will be reduced and could even be close to zero for some climate years with windy conditions in the ‘Large Scale RES’ scenario (the value shown on the chart being the average of all climate years).
RESULTSSIMULATION 90 4.3.3. EUROPEAN GENERATION MIX In 2015, the 22 countries analysed in this study generated around 3000 TWh of electricity: — Around 30% from RES sources; — 25% from nuclear; — 20% from coal and lignite; — 15% from gas; — <10% being generated from other fossil fuels and oil. Figure 90 shows the historical generation mix of 2015 and the generation mixes obtained from the simulated scenarios for the 22 countries analysed in this study in a ‘gas-before-coal’ Thesetting.energy mix is going to evolve in the future given national policies on nuclear and coal units and an increasing share of Therenewables.following trends are observed in all scenarios: — An increase of the renewable share in the generation mix From 50% in the ‘Base Case’ scenario to almost 60% in the ‘Decentral’ and ‘Large Scale RES’ scenarios; — A decrease of the nuclear share given the planned phase-outs or decrease of capacity announced in some western European countries (Belgium, Germany, France, 2030 RES Gas Nuclear Oil & Other Coal & Lignite ELECTRICITY GENERATION MIX IN EU22 IN EACH SCENARIO (‘GAS-BEFORE-COAL’) (FIG. 90) DECRESBC 20402015 645 1014811 93487 3050 TWh 1609 10250620751 3240 TWh 8403882028 8 71 3335 TWh 1887 8 593 199 596 3282 TWh 2424 7404137 63 3647 TWh 4 1944 529 174 627 3278 TWh 65540712 26 2384 3484 TWh Data provided by ENTSO-E Switzerland, Spain). In the analysed scenarios, the share decreases from 25% today to 20% in 2030 and to around 10% in 2040; — A reduction in coal and lignite generation in all European countries driven by national/European sustainability policies. As coal is the most GHG a emitting fuel, a reduction leads to a sharp decrease in emissions from 2015 to 2030. In 2040, the share of coal-fired generation is lower than 3% in all the scenarios; — An increase of gas-fired generation in all scenarios. Gas will mainly compensate for the phase-out of coal-fired and nuclear generation during the energy transition. In 2040, in all scenarios, the production mix is essentially composed of RES, nuclear and gas. RES and nuclear direct emissions are close to zero (no fossil fuel is burned to produce electricity). In order to achieve additional emission reductions after 2040, the amount of electricity generated from fossil gas is to be reduced. Other ways of achieving the remaining step could be by increasing the proportion of ‘green gas’, other low carbon generation (nuclear, CCS,...) or other technologies and techniques not yet mature or known at the present time.
4.3.5. CROSS-BORDER EXCHANGES IN EUROPE
SPILLED ENERGY IN EU22 FOR EACH SCENARIO (FIG. 91)
2030
In the 2030 time horizon, curtailments from 8 TWh to 21 TWh are observed in the different scenarios in EU22. The ‘Large Scale RES’ scenario presents the highest curtailment volume driven by the highest share of wind in the scenarios. Wind patterns are correlated spatially across hundreds of kilometres and can result in moments with excess energy in more than one Additionalcountry. renewable production in 2040, compared to 2030, leads to higher amounts of curtailed energy (from 40 TWh to 120 TWh). This shows the importance of flexibility options to shift this production to other moments of the day/week with DSM/storage or by exporting it to other regions in Europe where there is no excess (with interconnections). The impact of those options is clearly seen with the ‘FLEX+’ and ‘GRID+’ scenarios: — additional demand flexibility and storage in the system (‘FLEX+’ compared to ‘Decentral’) helps to reduce the curtailed energy from 59 TWh to 19 TWh in 2040; — the same can be observed when additional interconnections are considered between the countries in this study (30 GW of interconnections were added on top of the reference grid considered). This results in a decrease in curtailed energy from 120 TWh to 86 TWh (‘GRID+’ compared to the ‘Large Scale RES’ scenario). More energy could be therefore evacuated.
DECRESBC
4.3.4. ENERGY CURTAILED IN EUROPE Flexibility options (DSM, storage, ...) and the grid should be further developed to allow higher shares of renewable production in the system. With large amounts of intermittent renewables in the system, moments with excess renewable generation will increase in the future. The curtailed energy is the excess of generation that could not be evacuated to the other countries at a certain moment. Note that the market model used considers each country as a copperplate. The amount of curtailed energy could be even higher if some parts of the grid could not evacuate the excess energy or store it in certain zones of one country.
The results in terms of average total energy curtailed in the studied perimeter are given in Figure 91.
The total cross-border market exchanges are illustrated in Figure 92. Those values represent the sum of the yearly market exchanges between the countries. It can be clearly observed from the Figure 92 that cross-border exchanges will increase in the future, driven by additional variable, renewable generation and more flexibility.
CROSS-BORDER MARKET EXCHANGES IN EU22 FOR EACH SCENARIO (FIG. 92) DECRESBC 2030 2040 TWh Grid+Flex+ 501 586 530 595 606 527 646 795
Intensified cross-border energy exchanges in the EU will support the integration of increased RES generation.
Grid+Flex+
In 2040, the ‘Large Scale RES’ scenario presents the highest electricity market exchanges which are driven by large amounts of wind in the system. Enabling higher cross-border capacities (by around 30 GW in both directions) leads to an increase of the exchanged energy by around 150 TWh per year. More interconnections in a high RES context and exchanging surpluses will lessen the impact of the sensitivities between Incountries.the‘Decentral’ scenario, higher amounts of energy are also exchanged. The ‘FLEX+’ scenario simulated for 2040 shows how additional flexibility (storage, DSM,...) in the system facilitate additional exchanges. Interconnections allow additional flexibility to be used more efficiently between countries.
The energy spillage in TWh is the total curtailment of energy in the market. Additional curtailment could be observed due to local congestions when high volumes of RES have to be evacuated. 2040 TWh 120 8619 405921108
The increase of renewable production will lead to higher electricity exchanges between countries. A more decentral scenario with flexibility options will also drive higher crossborder market exchanges between countries. The flexibility options are shared with the other countries thanks to crossborder capacity and are used more efficiently.
RESULTSSIMULATION 91
2040
-150-100100150500-50 CCGT
TOTAL FOR BE IN 2030 COMPARED TO THERMAL CAPACITY FULL CCGT (FIG. 93) [M€] CCGT75 CCGT50 OCGT BC C2G 2030 DEC C2G 2030 RES C2G BC G2C 2030 DEC G2C 2030 RES G2C thermal capacity
Theopportunity.optimalproduction mix calculated in this study is following a theoretical approach based on the welfare gain for Belgium (consumer, producer and congestion rent) and the associated annuities of investments needed to be adequate. It only concerns the new-built generation. In 2030, 2.3 GW of existing units are assumed to be available in the system (of which a part are OCGTs).
For each scenario, combinations of CCGT and OCGT shares were tested. Based on the results obtained for 2030 and 2040, an optimal mix is identified for each scenario and merit order. Given that only two snapshots are analysed and that an investment in thermal capacity is made for around 25 years, the results are only giving an indication. Note that in the end the market should determine the optimal mix between technologies following producers’
New
2030
-250-200-150-100100150500-50 CCGT
2030
The annuities for new efficient units are higher than those of peaking units (with lower efficiency) for the same amount of capacity. The optimal fleet is therefore a tradeoff between the lower investment costs of peaking units such as OCGT and the welfare gain driven by an efficient thermal park (such as CCGT).
Moreover,investments.as mentioned in the Section 4.1.1, other thermal technologies such as biomass or CHP could be part of this mix. An evaluation of those can be found in Section 4.7.2 and Figure4.7.3.93 and Figure 94 summarise the net results (sum of welfare gain/loss and annuities of investments) for Belgium for 2030 and 2040.
GAIN/LOSS
As expected, the results from the simulation show that a more efficient, new thermal fleet (CCGTs) is beneficial for Belgian welfare (lower wholesale electricity prices lead to a lower producer surplus which is compensated by a much higher consumer surplus). Relying on large amounts of peaking units (OCGTs) will increase the wholesale prices and hence decrease the consumer welfare (see also Section 4.8.3.1).
TOTAL GAIN/LOSS FOR BE 2040 COMPARED TO THERMAL CAPACITY FULL CCGT (FIG. 94) [M€] CCGT75 CCGT50 OCGT BC C2G 2040 DEC C2G 2040 RES C2G 2040 BC G2C 2040 DEC G2C 2040 RES G2C thermal capacity mix
IN
—
mix
New
RESULTSSIMULATION 92 4.4 OPTIMAL SHARE OF THE NEW THERMAL GENERATION FLEET IN BELGIUM
Based on these results, two main drivers were identified (the first having a higher strenght than the second one): Future fuel and CO2 prices constitute the main driver for one or the other technology. The higher the prices, the more interesting it is to invest in efficient units. In contrast, the lower the prices, the better it is to invest in peaking units. This effect can be observed when comparing 2030 and 2040 results (in 2040 the optimal option is to consider a more efficient fleet for all scenarios) and when comparing results between both merit orders, the G2C merit order is more favourable for an efficient new-built production fleet than the C2G.
A Belgian new thermal fleet with a higher proportion of efficient units (CCGT) is the most interesting option for the country to remain competitive with its neighbouring countries and to create industrial
— In a ‘gas-before-coal’ setting, a new thermal fleet comprising new CCGT units is considered the optimal option; In a ‘coal-before-gas’ setting, a new thermal fleet comprising at least 50% of CCGT. New-built thermal generation increase of renewable penetration in the system favour a production fleet on As be indicated the running hours of efficient units decrease with a higher penetration of It is important to mention that the level of fuel and CO2 price holds more weight in the choice of the optimal mix than the increase in renewable production. also sensitive to the evolution of the generation mix in the neighbouring countries (such as the proportion of OCGT/CCGT in those countries). If a higher proportion of peaking capacity/OCGT is installed in the rest of Europe, it will be even more interesting to rely on an efficient
RESULTSSIMULATION 93 generation mix for Belgium. This ratio between OCGT/ peaking capacity and CCGT is 25%/75% in the scenarios in the EU22 studied perimeter. Based on these elements, Figure 95 summarises the thermal capacity mix selected for each scenario and constitutes the reference new-built thermal fleet for the other economic assessments presented in the next sections.
NEW-BUILT THERMAL GENERATION MIX ASSUMED IN EACH SCENARIO (FIG. 95) 2016 Higher prices21 More RES, decentralisation BC BC RES RES DEC DEC G2CC2G 1002575505075251009010 Key drivers 100[%] OCGTCCGT — The
will
in the following Section 4.5,
Those findings are
peaking units.
renewables.
based
will
will
—

— FOM (Fixed Operation & Maintenance Costs); — FOM + investment annuity of a new unit (WACC 6%);
The profitability will be assessed based on the inframarginal rent that a unit gets from the ‘Energy-Only’ market. Ancillary services and additional revenues other than those from the ‘Energy-Only’ market are not considered in those figures. It is however assumed that such revenues would not overthrow the conclusions on profitability.
RESULTSSIMULATION 94 4.5
FOM + Annuity
If the inframarginal rent of an existing unit cannot cover the fixed operating costs (FOM), there is a high probability that is not economically viable.
Four key indicators have been added to the figures:
Under the current market design - while keeping prices roughly convergent with neighbouring countries - the study demonstrates that the wholesale market will not remunerate the full costs of the necessary thermal investments. Additional measures to ensure new capacity investments will be necessary.
The economics of gas-fired units are based on model results (as explained in Section 3.5.1 of the methodology). This section will provide an indication on the unit profitability of CCGT and OCGT, as well as the running hours of those technologies for new and existing units. Revenues of RES technologies can also be found in Annex 7.4.3.
GAS-FIRED UNIT: ECONOMIC RESULTS
The position on the European merit order is key: — the most efficient CCGT in the system will run between 4000 and 7500 hours in 2030 depending on the scenario; — the least efficient CCGT will only run 1000 hours in 2030.
4.5.1. UNIT PROFITABILITY
12% FOM + Annuity WACC 9% FOM + Annuity WACC 6% FOM INFRAMARGINAL RENT OF THE MOST EFFICIENT CCGT IN THE SYSTEM INSTALLED IN BELGIUM FOR 2030 AND 2040 IN EACH SCENARIO (FIG. 96) BC BC BC BCRES RES RES RESDEC DEC DEC DEC C2G C2GG2C G2C [€/kW] 100120140160180200806040200 Legend P10P40P50P60P90 2030 2040 400 400 Revenues of wind and PV can be found in Annex 7.4.3?
The results for CCGT and OCGT profitability are shown on Figure 96 and Figure 97. WACC
— FOM + investment annuity of a new unit (WACC 9%); — FOM + investment annuity of a new unit (WACC 12%).
Moreover, if the inframarginal rent of the unit is lower than the FOM + annuity cost, it is very unlikely that new investments will be made in the market for this type of technology.
The profitability of CCGTs is strongly linked to gas and CO2 prices. In this way, in a ‘gas-before-coal’ setting where the prices are higher, higher revenues for CCGTs are identified in all scenarios. The increase of renewables in the system will also lead to lower revenues from the wholesale market. In all 2030 scenarios, the revenues can recover the FOM costs but not a new investment cost. In 2040, this could change driven by higher CO2 prices and by relying more on DSM for adequacy. Investments driven by wholesale market revenues are more likely to happen in such conditions.
FOM + Annuity WACC 12% FOM + Annuity WACC 9% FOM + Annuity WACC 6% FOM INFRAMARGINAL RENT FOR NEW OCGTS IN BELGIUM FOR 2030 AND 2040 IN EACH SCENARIO (FIG. 97) BC BC BC BCRES RES RES RESDEC DEC DEC DEC C2G C2GG2C G2C [€/kW] 100120140160180200806040200 Legend P10P40P50P60P90 2030 2040 320 350
Based on the results obtained for all scenarios in 2030, it can be stated that the wholesale market prices until 2030 are not expected to incentivise all new-built investments needed to ensure adequacy, neither for CCGT nor OCGT. The inframarginal rents identified for CCGTs in 2030 cover their fixed and operation maintenance costs in all scenarios. This is also generally the case for existing CCGTs, which would imply that they have little incentive to actually leave the market in the presented scenarios.
RESULTSSIMULATION 95
The profitability of OCGTs is strongly impacted by the occurrence of scarcity periods. The FOM cost is not covered in all scenarios, but it will be more and more dependent on weather effects with the increase of renewables. In 2040, similar levels of revenues are observed when compared to 2030 except for the ‘Decentral’ scenario where, driven by higher amounts of DSM, the revenues could almost cover the investment costs in 50% of the cases.
The results indicate that wholesale market prices (with high CO2 prices) in 2040 could incentivise new-built investments for CCGTs to cover the whole need for adequacy, depending on the capital costs and scenario. This trend is not identified for OCGT units where the revenues are depending on technologies’ pricing at higher marginal prices such as DSM and other peaking generation. In a decentral scenario where adequacy is relying on more DSM, the wholesale market price could also incentivise such investments.
The inframarginal rents also have significant volatility depending on the weather conditions of a given year. This volatility is increasing between 2030 and 2040 due to the increased penetration of climate dependent renewables (solar, wind, hydro) and the fact that some scenarios are relying more on flexibility options for adequacy.
Running hours do not provide the full picture as only the hours when the plant is inframarginal are contributing to the profitability of the unit. This implies that fewer running hours is not necessarily a bad thing from an investor perspective. With the increase of renewables in the system, the running hours of CCGTs will decrease. This trend will be compensated in the medium term by the decomissioning of nuclear and coal capacity (in ‘coal-before-gas’). In 2030, the most efficient CCGT in the market would run for around 4000 to 7500 hours depending on the scenario and merit order. With the increase of renewables in the system, the running hours will decrease. In the ‘Large Scale RES’ scenario, given that an accelerated coal phase-out in CWE and nuclear phase-out in France were considered, the running hours are higher than in the ‘Decentral’ scenario.
1000200030004000500060007000800090000 2040 BC BC BC BCRES RES RES RESDEC DEC DEC DEC C2G C2GG2C G2C
hoursRunning
The running hours of the most efficient CCGT in the market and OCGT are given on Figure 98 and Figure 99.
hoursRunning
Legend P10P40P50P60P90 2030
4.5.2. UNIT
RESULTSSIMULATION 96
This shows that those results will depend on the energy mix choices of the other countries. In 2040, the running hours will be lower than in 2030 given the increase of renewables in the system (from 3000 to 7000 hours). In ‘coal-before-gas’ scenarios, running hours will be similar to 2030 given the coal phase-out compensating for the running hours decrease driven by additional renewable Thepenetration).running hours of OCGT are only slightly affected by the increase of renewables in the system given that all values are lower than 1000 hours in all scenarios for 2030 and 2040. Higher running hours are observed in 2040 than in 2030, which is linked to the fact that adequacy is more relying on DSM (assumed having a higher marginal price of activation than OCGT). RUNNING HOURS
RUNNING HOURS OF THE MOST EFFICIENT CCGT IN THE SYSTEM INSTALLED IN BELGIUM FOR 2030 AND 2040 FOR EACH SCENARIO (FIG. 98)
Legend P10P40P50P60P90 2030
RUNNING HOURS OF OCGTS IN BELGIUM FOR 2030 AND 2040 (FIG. 99)
100020003000400050006000700080000 2040 BC BC BC BCRES RES RES RESDEC DEC DEC C2G C2GG2C G2C
DEC
RESULTSSIMULATION 97 4.5.3. RESULTS FOR THE LEAST EFFICIENT CCGT IN THE MARKET FOM + Annuity WACC 12% FOM + Annuity WACC 9% FOM + Annuity WACC 6% FOM INFRAMARGINAL RENTS OF THE LEAST EFFICIENT EXISTING CCGT UNIT VERSUS A NEW-BUILT EFFICIENT CCGT IN BELGIUM FOR 2030 IN THE ‘BASE CASE’ SCENARIO (FIG. 100) C2GG2C [€/kW] 100150200250500 Legend P10P40P50P60P90 CCGTefficientLeastexistingunit CCGTefficientLeastexistingunitCCGTNew-builtefficientunit CCGTNew-builtefficientunit RUNNING HOURS OF THE LEAST EFFICIENT EXISTING CCGT UNIT VERSUS A NEW-BUILT EFFICIENT CCGT IN BELGIUM FOR 2030 IN THE ‘BASE CASE’ SCENARIO (FIG. 101) C2GG2C Legend P10P40P50P60P90 CCGTefficientLeastexistingunit CCGTefficientLeastexistingunitCCGTNew-builtefficientunit CCGTNew-builtefficientunit [€/kW] 1000200030004000500060007000800090000 The place of the CCGT in the merit order is key for the amount of running hours. While the most efficient CCGT could be dispatched for up to 8000 hours per year, the least efficient CCGT in Belgium will only run for around 1000 hours. The revenues of the least efficient CCGT are much lower than the most efficient one but remain just above the FOM. The Figure 100 and Figure 101 provide the results for profitability and running hours of the least efficient unit in the system compared to the most efficent for the ‘Base Case’ scenario in 2030.

— The results obtained through the ‘GRID+’ scenario assess the robustness of the economic results obtained in the 2040 ‘Large Scale RES’ scenario by considering an additional 30 GW of interconnection capacity (added in both directions) between all European countries. The increased capacity on the different borders for ‘GRID+’ is described in Section 2.7.5;
— A North-South corridor adding 1 GW with NL and FR;
Figure 102 summarises the yearly net gain for Belgium (market welfare gain from which the annuities were deducted) generated by each additional corridor following all the scenarios considered in this study. Additional interconnections are a must to enable the necessary decarbonisation while keeping prices convergent with the neighbouring countries. Their realisation needs to be anticipated taking into account the often long construction delays.
The favourable Cost-Benefit Analysis of additional interconnectors results from better market and renewables integration, without taking into account (in this study) the additional contribution to adequacy at critical peak moments.
This section deals with the results obtained through the cost benefit analyses performed for additional interconnectors in Belgium. As described in Section 2.7.3, an increase of Belgium’s cross-border exchanges capabilities was assessed for 2030 and 2040 as follows:
— An East-West corridor adding 1 GW with DE and GB; — Both corridors at the same time. The interconnectors are assessed by considering the optimal thermal mix identified for each scenario as described in Section 4.4. The yearly average gain for the Belgian market welfare is compared to the annuity and fixed costs of the projects considered for each corridor. It identifies the benefits of additional cross-border exchanges with our neighbouring the results, additional interconnection capacity is a must do for Belgium from an economic point of view. With the increase of RES, additional interconnections are a ‘no regret’ option in the long-term and a benefit to Belgian society. The welfare increase in Belgium is mainly driven by lower wholesale electricity prices with additional interconnectors allowing Belgium to remain competitive with its neighbours. In 2040, the robustness of those investments was evaluated with two additional European sensitivities for 2040 (‘GRID+’ and ‘FLEX+’):
4.6 ADDITIONAL INTERCONNECTORS: ECONOMIC RESULTS 2030 2040BE additional corridors YEARLY GAIN FOR BELGIUM WHEN INVESTING IN + 2GW CORRIDORS IN M€/YEAR (FIG. 102) -20 -20 -20 -10 ≈ 0 ≈ 0 40 60 130 40 110 130 40 30 20 ≈ 0 30 20 40 30 20 10 40 40 100 110 80 20 -10 -30 -20 -20 20 ≈ 0 50 60 150 50 190 210 100 50 +1 GW +1 GW +1 GW +1 GW +1 GW +1 GW +1 GW +1 GW BC C2G C2GG2C G2C DEC RES C2G G2C C2G G2C DEC RESBC C2G C2GG2C G2C Grid+ Flex+ G2C G2C From
it can be stated that
— In the ‘FLEX+’ scenario, the economic results obtained are relatively close to the gain obtained in the 2040 ‘Decentral’ scenario. For this time horizon, it can be stated that more demand flexibility has a limited impact on the positive economic trend identified for new Belgian corridors.
It is important to note that this economic assessment is limited to Belgium and does not consider the economic results for the other countries. The market welfare results and annuities considered are the ones for Belgian society. The assessment does not quantify the benefit of additional interconnections for adequacy. Depending on the level of adequacy of the neighbouring countries, such benefits would increase the business case. However, they are not taken into account in this study.
RESULTSSIMULATION 98 countries (on top of the already planned investments).
order.
OF BELGIAN
in IMPACT ON EFFICIENT CCGT REVENUES BY ADDING 4 GW OF INTERCONNECTORS IN BELGIUM (FIG. 103) [€/kW]inrevenuesCCGT 1009080706050403020100 2030 - C2G BC RESDEC [€/kW]inrevenuesCCGT 1009080706050403020100 2030 - G2C BC RESDEC [€/MWh]price[Marginal ADDITIONAL INTERCONNECTIONS DO NOT SIGNIFICANTLY IMPACT THE REVENUES FOR GAS FIRED UNITS - HOURLY MARGINAL PRICE FOR BELGIUM IN THE 'BASE CASE - C2G' SCENARIO IN 2030 FOR A GIVEN ‘MONTE-CARLO’ YEAR (FIG. 104) 100150200250500 Without additionnal corridor With additionnal EW+NS corridors 0 1000
1 2 3 1
3
UNITS
RESULTSSIMULATION 99
revenues.
(+4 GW) with Belgium have
BOX 14 - ADDITIONAL INTERCONNECTIONS ARE NOT SIGNIFICANTLY IMPACTING THE REVENUES GAS
price in
The favourable Cost-Benefit Analysis of additional interconnectors results from better market and renewables integration. Note that this result only assessed the benefit from additional corridors (no individual project) for Belgian society. Western Europe (see also Section 4.8.1) most of the time. Additional interconnectors will enable more energy to be imported when prices are lower or equal to the marginal cost of efficient CCGTs. On the other hand, when prices are higher than the marginal cost of a CCGT (hence CCGTs inframarginal rent is positive), the same level of price is observed in the neighbouring countries which leads to a similar amount of revenues inboth cases. Figure 104 illustrates those results for a given ‘Monte-Carlo’ year in the ‘Base Case’ scenario for 2030.
wholesale
Moreover, additional interconnection capacity will be necessary to achieve high decarbonisation rates while maintaining prices in line with our neighbouring countries by integrating more renewable generation. With the unfolding energy transition, their positive economic contribution will steadily increase: the faster the decarbonisation of the electricity system, the better the economics of interconnector development
Additional interconnections in 2030 and 2040 will not significantly impact the revenues of an efficient Belgian thermal fleet. The result in CCGT revenues for each scenario with and without interconnectors can be seen in Figure 103. It results that the additional interconnectors no significant impact on finding be explained by the fact that gas-fired generation the the market 2000 3000 4000 5000 6000 7000 8000 Hours when there is an inframarginal rent CCGT. Additional interconnectors will not significantly impact the as those are moments when the prices in the neighbouring countries are also higher than the CCGT marginal price (low penetration of RES) or at the same level. CCGTs are marginal. The flat curve shows that the efficiency of the unit will be key to determine its position in the merit While the most efficient units in the system would run around 5000 hours in this specific case , the units with a slightly lower efficiency will only run 1000 hours a year. When CCGTs are marginal, no or very low inframarginal rent is captured by those units as the price is set by the same technology. Moments with high penetration of renewables in the neighbouring countries will impact the prices in Belgium when adding additional interconnectors. Given that those moments are not in the first zone (when CCGTs are making revenues), it will only impact the prices below or equal to CCGTs being marginal thus not affecting their
can
for
efficient CCGT revenues. This
will set
2
revenues
‘12 Insights on Germany’s Energiewende’ – Agora Energiewende [AGO-1]
“Several European analyses highlight the strategic geographic situation of Belgium. From a European perspective, the optimal solution requires an increase in transmission capacity in Belgium to allow for electricity transfers between European states. Belgium would therefore become an electricity transmission hub within Europe.” ‘Scenarios for a low carbon Belgium by 2050’ - Federal Climate Change Service commissioned a study by CLIMACT and VITO [CLV-1] “Upgrading the grid infrastructure is, however, the most cost–effective way to keep a power system in transition secure and reliable. Less transmission build-out will lead tolessoptimaluseofRESandadditionalneedforback-up capacity ” ‘Power Perspectives 2030’ – European Climate Foundation [ECL-1]
“Grids decrease the need for flexibility: fluctuations in generation (wind and PV) and demand are equilibrated alarge distances.”
“Transmission grids reduce overall system costs with relatively small investment costs.”
The need for additional interconnection capacity is not only a key enabler for the Belgian energy transition. Several recent studies, from academia, authorities, industrial and non-governmental bodies confirm the growing international consensus that significant transmission developments are urgently needed to underpin the energy transition in the most cost-efficient way. Not only do interconnections limit the curtailment of excess renewable energy, they also enhance the possibility of reaching the EU renewable targets by incentisizing renewable investments in the most suitable areas: wind in the North, especially in offshore and large coastal areas, solar in the South, biomass where local sources are available and hydro in the North and in mountain areas.
Rolando A. Rodriguez, Sarah Becker b, Martin Greiner, [SCD-1]
‘e-Highway 2050’ study [EHW-1]
“The network extension rate is driven by the increase of generation capacities, especially renewable energy sources”.
“Grids enable access to cost-effective flexibility options in Germany and Europe.”
“We observe that a sufficiently large transmission system is worthmorethanitcostsforhigherpenetrationsofrenewables,astheyreducethetotalsystemcostduetoreducedbackup capacity and energy.”
“This analysis demonstrates the potential for regional smoothing through interconnection, illustrating the changing role of transmission grids under high shares of VRE” “Grids can expand the potential of variable renewables and increase their value” IEA – ‘World Energy Outlook 2016’ [IEA-3]
‘Cost-optimal design of a simplified, highly renewable pan-European electricity system’
BOX 15 - SEVERAL STUDIES HAVE DEMONSTRATED THE NEED FOR FURTHER INTERCONNECTIONS ACROSS EUROPE TO ENABLE THE ENERGY TRANSITION
RESULTSSIMULATION 100
“Investments in transmission and distribution grids for integratingVREareasmallportionofthetotalinvestments in the power sector”
— In a first step, the market model calculates the ‘market welfare gain’ for consumers and producers based on the wholesale market price, without taking into account investment cost.
— The cost of extending the life for 10 years is based on the data for the prolongation of the nuclear reactors, Doel 1 and 2, in 2015. This results in around 800 €/kW [ENG-2]
Given the above assumptions, for a 2 GW nuclear extension:
4.7 ECONOMIC IMPACT ASSESSMENTS ON A PARTIAL NUCLEAR EXTENSION, CHP AND LARGE-SCALE BIOMASS BC
1.62.32
RESULTSSIMULATION 101
A partial nuclear extension of 2 GW will result in a need for new-built thermal capacity in 2025/2030 of at least 1.6 GW. Additional measures will be needed to ensure that this thermal capacity is available by the nuclear phase-out, since the same conclusions in terms of profitability of new-built thermal units remain valid as in the case of the full nuclear phase-out. An economic comparison between a thermal fleet composed from 3.6 GW of new CCGT and the partial nuclear phaseout (2GW nuclear + 1.6 GW CCGT) was performed. This sensitivity was assessed in all scenarios for both merit orders configurations for 2030.
— In a second step, the annuity and fixed costs of the respective investments are accounted for which yields the net welfare gain: – the investment savings in new-built CCGT capacity; – the cost of nuclear extension.
A rounded total of 470 M€ per year is needed to cover the extension and fixed costs.
The costs assumptions for the nuclear extension were taken from public sources:
— the investment annuity is 249 M€/year (considering a WACC of 9% and a 10 year extension); — the FOM is 223 M€/year.
The net welfare gain for the country is calculated in two steps:
Note that no other indirect costs that those mentionned above were considered.
Cost of nuclear extension
4.7.1. IMPACT ASSESSMENT FOR KEEPING 2 GW OF NUCLEAR GENERATION ONLINE FOR 10 YEARS AFTER 2025 As suggested by some stakeholders and other studies (Energyville on behalf of Febeliec, VBO), a partial nuclear phase-out (keeping 2 GW online until 2035) was examined as a sensitivity in the present study. Such a nuclear extension still needs to be accompanied by additional measures to ensure new-built thermal capacity. BC A PARTIAL NUCLEAR EXTENSION OF 2 GW STILL NEEDS TO BE ACCOMPANIED BY ADDITIONAL MEASURES TO ENSURE NEW-BUILT THERMAL CAPACITY IN 2025 (FIG. 105) [GW] > 5.9 > 5.9 New-built Existing nuclear Existing CCGT/OCGT 2.33.6
— The nuclear production costs (including fixed costs) taken into account in this study are around 29 €/MWh which is based on the nuclear rent calculation made by different parties in 2011 [NBB-1], to which the inflation was taken into account: – The variable costs assumed in this study (fuel + VOM) equal 14€/MWh – inline with ENTSO-E studies (nuclear fuel price of 0.47 €/GJ and VOM of 9 €/MWh); – The remaining 15 €/MWh are treated as fixed costs. Assuming 7500 running hours for a nuclear unit, it results in a Fixed O&M (FOM) of 112 €/kW.
—
Note that after 2035, the investments costs of a new-built generation should be accounted. Welfare gain of the nuclear extension
The market welfare gain for Belgium is mainly due to a higher producer surplus driven by market revenues and fuel economy. On the consumer side, the gain is caused exclusively by the wholesale market price. This gain is relatively limited, since wholesale prices in the coupled CWE market are mostly determined by the marginal fossil or renewable units. As mentioned in the chapter on adequacy, it is assumed that sufficient thermal capacity is added to keep the Belgian system compliant with the adequacy criteria and thus to avoid that scarcity structurally affects the Belgian market price.
The market welfare gain calculated by the model is between 480 M€ and 790 M€/year for Belgium when comparing the nuclear extension scenario with the full nuclear phase-out (note that congestion rents were included in the consumer surplus): M€/year (rounded to 10M€)
Scenario welfareMarketgain Investments saving in new CCGT Nuclearcostsextension Net gain for Belgium BC Base Case – C2G 710 230 470 470 Base Case – G2C 720 480 DEC Decentral – C2G 480 240 Decentral – G2C 690 450 RES Large Scale RES – C2G 560 320 Large Scale RES – G2C 790 550 NET GAIN FOR BELGIUM BASED ON MARKET WELFARE GAIN AND INVESTMENT COSTS FOR A NUCLEAR EXTENSION OF 2 GW FOR 10 YEARS FROM 2025 (FIG. 107) MARKET WELFARE GAIN M€/YEAR WHEN EXTENDING 2 GW OF NUCLEAR (INSTEAD OF 2 GW NEW CCGT INVESTMENT) (FIG. 106) surplusConsumergain surplusProducergain gainWelfaretotal Base Case - C2G 140 570 710 Base Case - G2C 120 600 720 Decentral – C2G 270 210 480 Decentral – G2C 270 420 690 Large Scale RES – C2G 220 340 560 Large Scale RES – G2C 240 550 790
The results above, are dependent on the assumptions taken for costs, fuel and CO2 prices. Other assumptions will lead to other figures. Note that only one year was analysed to give an indication in terms of costs and welfare.
Finally, the results on the net welfare gain for Belgium do not include any conclusion on a transfer mechanism between producers and consumers, if any, on top of the wholesale price.
RESULTSSIMULATION
102 Investment savings in new-built CCGT capacity
in
Net welfare analysis of the nuclear extension
Given the costs and the market welfare benefits, it results in a net gain for Belgium between 240-550 M€/year depending on the scenario for the 2025-2035 period.
The 2 GW of nuclear capacity are replacing the need for 2 GW of new-built CCGT capacity. The fixed costs of CCGT can be found in Section 2.8.2. This results in saving the annuity and FOM costs for 2 GW of new CCGT. Assuming a WACC of 9%: Annuity saved: 186 M€; — FOM saved: 42 M€. A total (rounded) of 230 M€ is saved per year by avoiding new-built capacity for the period considered (2025-2035).

The production of electricity from the new thermal capacity needed is correlated with the temperature (the lower the temperature, the higher the gas part in the electricity generation mix), see Figure 109. Most heat demand processes are also correlated with the temperature in the same way. It can therefore be interesting to combine both demands by generating electricity and heat for industrial processes, district heating...
Given the limited potential of biomass and green waste in Belgium (see Section 2.4.3.1), the fuel usually has to be imported from other countries.
4.7.2.
A sensitivity was assessed by replacing 400 MW of new CCGT by biomass in Belgium in 2030 for the ‘Base Case’ scenario.
WELFARE GAIN/LOSS BY ADDING REPLACING 400 MW NEW CCGT IN BELGIUM BY BIOMASS IN 2030 (FIG. 108) M€ ConsumerSurplus ProducerSurplus Totalwelfaremarket Base Case - C2G 20 -390 -370 Base Case - G2C 20 -120 -100
the ‘coal-before-gas’ scenario given the lower wholesale prices compared to the ‘gas-before-coal’. This loss is usually compensated by subsidies.
DAILY PRODUCTION FROM NEW CCGT VERSUS TEMPERATURE IN 2030 - ‘BASE CASE - G2C’ (FIG. 109) 10152025303540455050 -10 -5 0 5 10 15 20 25 Temperature [°C]
The following assumptions were used (for a large scale biomass unit of 400 MW): — Fixed costs (investments and FOM) are equivalent to a new CCGT (note that those could be higher based on other sources. FOM is usually higher than for a CCGT); — Cost of fuel (in this case pellets from USA/Canada): around 30€/MWh; — Efficiency: 35%; — Hours generating electricity: 7500 h (assumed ‘must run’ behaviour); — VOM: 4 €/MWh. This results in a variable cost of 90 €/MWh for the biomass Sources:unit. [GRP-1], [CBM-1], [EUC-13]
Given that it was assumed that the fixed costs for an investment in CCGT and biomass units are identical, the analysis consists in comparing the market welfare gains/ losses (see Figure 108).
Biomass production is considered as a renewable production by the European Commission to define the RES targets (note that according to [EUC-13] the indirect emissions of biomass are around 150g CO2/kWh). Given this characteristic, the units are usually producing baseload power. The main difference with the other renewable production is that the fuel is not free as it should be bought, extracted/collected, processed and transported in order to be used. Without support, the unit typically loses money on the ‘Energy-Only’ wholesale market as its marginal costs of production is usually higher than the electricity price nowadays. Support mechanisms are needed to ensure that the unit can produce electricity in such conditions. The cost of these support mechanisms will decrease with an increasing wholesale market price, mainly driven by the carbon price (see Section 4.8).
The fixed costs of a gas CHP are higher than classical gas units (generating only electricity) but the heat revenues should also be added to the equation [EUC-13]. Additionally the heat also has to be transported which might require additional infrastructure costs. Different sizes of CHP exist depending on the application and quantity of heat needed. Costs may vary depending on the size. In this study (see Section 2.4.5.3), 1.8 GW of CHP was assumed for all scenarios and all time horizons, which corresponds with the current installed capacity. It is assumed that additional CHP installations above 1.8 GW will be part of the new-built thermal capacity needed to ensure adequacy. ADDITIONAL LARGE-SCALE BIOMASS New biomass could be part of the new thermal generation needed to ensure adequacy as it is non intermittent (i.e. independent of the weather) and controllable.
Combined Heat and Power (or co-generation) is the simultaneous generation of heat and electricity. Given this combination, a higher overall efficiency can be achieved than generating heat and electricity separately. It reduces the overall fuel consumed and hence the GHG emissions.
4.7.3. ADDITIONAL COMBINED HEAT AND POWER (CHP)
RESULTSSIMULATION
103
Given that the CHP technology is non-intermittent and controllable, it can therefore constitute a part of the identified new thermal generation needed to ensure adequacy.
If biomass would be economically dispatched based on its variable costs, without accounting for subsidies, the unit would run approximately 800 hours in the ‘Base Case - C2G’ and around 2500 hours in the ‘Base Case G2C’. Note that some biomass units are also producing heat together with electricity (see next Section 4.7.3). Heat revenues should also then be considered in the equation which was not quantified here.
3.6thefromproducedelectricityAverage [GWh]CCGTnewGW
The comparison shows that the biomass increases the consumer surplus by 20M€ in both merit orders. Given the high costs of fuel for biomass and its ‘must-run’ behaviour, it results in a loss for the producer driven by the loss of the biomass unit owner. The loss is much higher in
Short term variations of wholesale prices are due to fuel price variations (coal, gas...), carbon price (CO2), weather conditions (dry or wet years, cold or warm winters,...) and unit unavailabilities (long-term unavailability of units,...).
RESULTSSIMULATION 104
4.8
competitiveness based on the wholesale price will demonstrate that additional interconnectors and an efficient thermal fleet operated by market players in the wholesale market are key to keeping the country competitive with its neighbours.
— The coal price is around 60€/tonne.
ECONOMIC COMPETITIVENESS OF BELGIUM
The model simulates the electricity market as if all the energy was sold on the day-ahead market. This implies the assumption that day-ahead price levels propagate to other timeframes (e.g. forward prices) and supply contracts. In order to compare the output prices of the model, the average yearly historical prices of the day-ahead market were analysed for Belgium and its neighbouring countries. The comparison is displayed in Figure 110. Based on the average day-ahead price in Belgium and its neighbouring countries in the past five years, it can be observed that on average:
The current fuel and CO2 prices are low compared to the levels of a few years ago:
— Prices in GB were 12 €/MWh above the BE prices. This is mainly a result of to the carbon price floor in GB and its low interconnection level with the continent;
— The carbon price is around 5 €/tCO2; — The gas price is around 15 €/MWh;
— Prices in NL were 1 €/MWh under the BE prices.
The evolution of the wholesale electricity price in the different scenarios will be calculated and compared to neighbouring Thecountries.Belgian
The wholesale market price is key. An increase of the market price due to a CO2 and fossil fuel price increase (at EU level) will imply that the costs of needed investments, both in renewable and thermal capacity, will be increasingly covered by the market price, with less recourse to support mechanisms.
The wholesale electricity price is calculated by the model as the marginal price for each hour for each market zone based on the variable costs of the generation, storage and demand side response fleet. The wholesale price does not include any additional payments (taxes, subsidies, grid costs, ...). See Section 3.5.2 for more information on the modelling approach and underlying assumptions.
— Prices in FR were 4 €/MWh under the BE prices mainly driven by the low marginal cost of production of its nuclear fleet;
— Prices in DE were 8 €/MWh under the BE prices. This is due to a higher penetration of renewables, the nuclear fleet and coal/lignite units (the past five years experienced a ‘coalbefore-gas’ merit order favouring coal generation);
AVERAGE 2012-2016 WHOLESALE DAY-AHEAD MARKET PRICE DIFFERENCE WITH BELGIUM IN €/MWH (FIG. 110) +12 -4 -8 -1 4.8.1. WHOLESALE ELECTRICITY PRICE
in the system 2030 G2C 90 €/tCO2 29 €/MWh gas 51 €/t coal 2030 C2G 33 €/tCO2 32 €/MWh gas 67 €/t coal 2040 C2G 45 €/tCO2 35 €/MWh gas 69 €/t coal 2040 G2C 126 €/tCO2 30 €/MWh gas 46 €/t coal Fuel and CO2 prices AVERAGE WHOLESALE ELECTRICITY PRICE IN BELGIUM FOR THE DIFFERENT SCENARIOS (FIG. 111) G2C BC RESDEC C2G BC RESDEC BC RESG2CDECBC RESC2GDEC [€/MWh] 100120806040200 2030 20402012 2013 2014 2015 2016 ≈40 70 59 56 90 77 73 74 98 88 56 63 44 Average 2012-16 43€/MWh The increase of the carbon and gas prices will lead to an increase of the wholesale prices in Europe and hence Belgium in 2030. The average electricity wholesale price will also depend on the level of renewables in the system, particularly those with (close to) zero marginal costs. The electricity wholesale prices in each scenario for Belgium are shown in Figure 111. —
—
—
— In both scenarios assessed (C2G and G2C), an increase of the wholesale price is observed in all simulated scenarios for 2030: • 70 €/MWh on average in the ‘Base Case - C2G’ and 90 €/ MWh in ‘G2C’; 59 €/MWh on average in the ‘Decentral - C2G’ and 77 €/ MWh in ‘G2C’; 56 €/MWh on average in the ‘Large Scale RES - C2G’ and 73 €/MWh in ‘G2C’;
The ‘IEA - World Energy Outlook 2016’ scenarios used in this study consider an increase in gas and CO2 prices linked to an increase of the world demand for the first and a stronger policy signal for the second in order to reach the sustainability targets.
— If the gas and carbon prices would stay similar to today’s levels, the wholesale electricity price would remain in the ranges observed nowadays. The price in 2030 will be mostly driven by gas marginal units, which would set the price for around 6000 hours a year;
•
— The increase in wholesale electricity prices will reduce the need for support mechanisms for renewables given that a larger part of their revenues will be covered by the wholesale market (see also Annex 7.4.3 for more details);
Historical prices driven by: - fuel prices (gas, CO2, coal, ...) - demand - weather - unit availability Price range for BE with the same fuel and CO2 prices as today: - ≈5€/tCO2 - ≈15 €/MWh gas - ≈60 €/ton coal
•
RESULTSSIMULATION 105 Results in terms of wholesale electricity prices reveal that:
Increase of wholesale price will be mainly driven by gas and CO2 price increase and compensated by increase of RES For 2040, the following prices are obtained: 74 €/MWh on average in the ‘Base Case-C2G’ and 98 €/ MWh in ‘G2C’; • 63 €/MWh on average in the ‘Decentral-C2G’ and 88 €/ MWh in ‘G2C’; 44 €/MWh on average in the ‘Large Scale RES-C2G’ and 56 €/MWh in ‘G2C’; After 2030, with large penetrations of renewables, the prices could decrease to ranges observed today. Depending on the evolution of investment costs, support mechanisms might be needed to be increased again; The yearly price volatility will also rise in the future given the development of weather dependent renewables in the system. Relying on more demand side response for adequacy will have the same effect (depending on the activation price for DSM).
•
•
WHICH
RESULTSSIMULATION 106
20402030 RES Nuclear CCGT CCGT old OCGT Other DECDECRESRESBCBCG2CG2C 21% 4% 20%4%1% 49% 3% 12% 43% 15% 2% 24% 19%2%14%50%5%8%9% 7% 12%12% 50% 49% 18% 6% 12%12%6%7% 6% 8% 6%41%13%27% 0% 10% 20% 30% 40% 50% 60% 70% 80% 90% 100%
4.8.2. MARGINAL
It can be observed from the Figure 112 that: — with the increase of renewables, close to zero prices will occur more often. Those could be up to 40% in 2040 in the ‘Large Scale RES’ scenario; In all scenarios, gas technologies (CCGTs and OCGTs) are setting the price for more than 50% of the time. TECHNOLOGIES
The development of RES in the system and the decommissioning of nuclear and coal in Central Western Europe will impact the wholesale electricity prices. The share of marginal technology (the technology that ‘sets’ the price in the market) will also evolve. Figure 112 indicates the marginal technology in each scenario for the ‘gas-before-coal’ setting in 2030 and 2040. TECHNOLOGY SETS THE PRICE IN BELGIUM (‘GAS-BEFORE-COAL’ SCENARIOS) (FIG. 112)
—
RESULTSSIMULATION 107 +0.5 -1.9 -3.6 -3 +1.6 -0.4 -1.6 -1 AVERAGE WHOLESALE MARKET PRICE DIFFERENCE BETWEEN BELGIUM AND NEIGHBOURING COUNTRIES ON THE 'BASE CASE - C2G' - 100% CCGT SCENARIO (FIG. 113) -3.1 -5.6 -7.5 -6.7 Impact of additional interconnections1 Impact of a less efficient fleet1 2030 C2G 100% CCGT Replace CCGT by OCGT Add interconnections+4GW Average difference with our neighbours Average difference with our neighbours Average difference with our neighbours -2.0 €/MWh -0.4 €/MWh -5.7 €/MWh Starting point: • Adequate scenario for all countries • ‘Coal-before-gas’ • 3.6 GW new CCGT in Belgium More efficient park in BE = Benefits for competitiveness More interconnections = Benefits for competitiveness BC (negative = price in the neighbouring country is lower) 4.8.3. BELGIAN COMPETITIVENESS An efficient national generation fleet combined with additional interconnectors is key to maintaining competitive, wholesale electricity prices compared to neighbouring countries. The competitiveness is assessed using average wholesale electricity prices resulting from the economic dispatch of the electricity market model. It is important to note that it only constitutes a part of the electricity bill. The other components vary from country to country. Three cases will be illustrated based on the 2030 ‘Base Case - C2G’. Other scenarios and merit orders result in similar conclusions. The price difference between Belgium and neighbouring countries in the other scenarios can be found in Annex 7.4.4. 4.8.3.1. Additional interconnectors and an efficient gas thermal fleet to keep Belgium’s competitiveness
Figure 113 indicates that Belgium with 3.6 GW new-built CCGT has an higher average wholesale price of 2€/MWh (when taking the average of the differences with FR, DE, NL and GB) in the ‘Base Case – C2G’ scenario for 2030. Additional interconnectors are key for market integration with our neighbours: An additional 4 GW of interconnections were added to the system (the North-South corridor and the East-West corridor), which results in a higher price convergence of around 1.7€/ MWh (or around 150 M€/year) between Belgium and its neighbours. Efficient new CCGT compared with new OCGT (less efficient) in Belgium. When replacing brand new efficient CCGTs by less efficient gas units, it results in a higher wholesale price in Belgium of about 3.7 €/MWh (or around 350 M€/year) when compared to the neighbours. This clearly demonstrates the need for efficient gas units to keep Belgium competitive with its neighbours.
108
4.8.3.2. An ‘in the market’ thermal fleet to deliver on welfare As observed from the model results (see Section 4.5), the thermal fleet is not making sufficient revenue to cover its investment costs and therefore, there are insufficient incentives for new investments in such technology.
In this situation, with only 1.6 GW out of 3.6 GW provided by the market, an additional 2 GW of units should be available out of the market to keep the country adequate
The outcome in terms of wholesale market price is illustrated in Figure 114. It results from the sensitivity that the prices will be on average structurally higher in Belgium by around 15 €/MWh compared to those of neighbouring countries.
AVERAGE WHOLESALE MARKET PRICE DIFFERENCE BETWEEN BELGIUM AND NEIGHBOURING COUNTRIES ON THE 'BASE CASE - C2G' - 100% CCGT SCENARIO (FIG. 114) With current market design2 Remove 2 GW from the market Average difference with our neighbours -15.4 €/MWh Starting point: • Adequate scenario for all countries • ‘coal-before-gas’ • 3.6 GW new CCGT in Belgium Out of the market capacity in BE: • 17 hours of LOLE in the market in Belgium allowing the production park in the market to recover investments and fixed costs • 1.6 GW new capacity in the market • 2 GW capacity out of the market ensuring adequacy +0.5 -1.9 -3.6 -3 2030 C2G 100% CCGT Average difference with our neighbours -2.0 €/MWh BC (negative = price in the neighbouring countries is lower)
Results show that 1.6 GW of new CCGT would have to be built in the market, assuming that investors would rely on revenue expectation for a median year. When more capacity would be built in the market, revenues would become insufficient to cover the investment. In other words, removing around 2 GW from the market ensures that revenues from the wholesale market would cover the new investments’ fixed costs in an average year. In such a scenario, an average LOLE of 17 hours and a LOLE P95 of 57 hours are observed in the market. This is clearly above the legal criterion of 3 hours of average LOLE and 20 hours for the LOLE P95. The price during those hours is set at 3000 €/MWh in the model, i.e. the current day-ahead market price cap.
In order to estimate how much capacity the market may deliver, from the same initial case (3.6 GW of new CCGT), capacity was systematically removed (i.e. by artificially introducing scarcity in the model) until the median revenues (of the statistical population) from the remaining thermal fleet in Belgium are sufficient to cover the annuity + FOM of a new investment in the Belgian market.
RESULTSSIMULATION
More information on the concepts related to ‘out’ and ‘in’ the market mechanisms can be found in Section 5.2.
Compared to a situation where all capacity is operated in the market, keeping 2 GW as out-of-market capacity would result in: — a loss of 1,500M€/year for the consumer (due to the higher price levels); — a gain of around 300 M€/year in congestion rents; — a gain of around 600 M€/year for the producer .
The net welfare loss for Belgium amounts to 600 M€/year (sum of the three components above).
More developments on these findings can be found in chapter 5. -12.6 -15.2 -17.2 -16.4
As explained in Box 11, the quantification is based on the market welfare difference between scenarios (producer’s surplus, consumer’s surplus and congestion rents) and the annuities of investments. The net welfare (sum of both components) will reveal if the market welfare gains can compensate the difference in investments costs between scenarios.
The cost-/benefit analysis for the year 2030 reveals that the investments costs needed to achieve higher renewable penetration could be compensated by the market welfare gain brought to Belgium.
The total amount is expressed in annuities based on the expected costs of the different technologies for the given year. This amount should be interpreted as the needed investments per year to cover the assumed capacity in each scenario. Depending on the market conditions and other developments, part of these investments will be covered by market revenues and the other part might require additional support.
The investments in interconnections represent less than 2% of the total investment annuity needed in each scenario and will contribute substantially to the welfare of the country.
Note that no redeployment costs were considered for existing RES, storage, DSM, CHP and biomass in any of the time horizons. It might be the case in the future to replace or extend the life of existing generation units. Given that this capacity is assumed the same in all the scenarios, the comparison between the scenarios is not biased.
Based on the assumptions on fixed costs (CAPEX and the total costs of investments in interconnections and capacity per year are quantified (see Section 2.8.2 for more information on cost assumptions). Additionally, the cost to keep existing units considered available online in the different scenarios was evaluated.
The CAPEX costs of: — All generation, storage and flexible capacity online before 2020 were not considered. Only the FOM of this capacity was taken into account; — All grid reinforcements (distribution and high voltage) that are planned before 2025 were not quantified.
Each scenario is evaluated in its optimal setting of a new thermal mix in the ‘gas-before-coal’ merit order and additional interconnections (see Section 4.4):
The cost-/benefit analysis between the scenarios indicates that accelerating the energy transition (‘Large Scale RES’ and ‘Decentral’ scenarios) is roughly equivalent to following the path of the ‘Base Case’ scenario in 2030. Additional socio-economic benefits are also qualitatively enumerated based on other studies.
4.9 TOTAL INVESTMENT AND FIXED COSTS FOR EACH SCENARIO TOTAL ANNUALISED FIXED COSTS OF THE SYSTEM (EXISTING UNITS AND NEW INVESTMENTS NEEDED) FOR 2030 (FIG. 115) Existing units fixed Investmentcostscostswith9%WACCTOTAL ≈1 B€/year [M€]capacitynewforyearpercostsFixed 10001500200025003000350040005000 BC ≈0.9 B€/year ≈1.9 B€/year 170160250540970 DEC ≈2.1 B€/year ≈3.1 B€/year 1200570340360970 RES ≈2.1 B€/year ≈3.1 B€/year 1230970580350380 Cost of Capital 12% Cost of Capital 9% Cost of Capital 6% Overnight costs per year old Existing units fixed costs 4.9.1. INVESTMENTS COSTS PER SCENARIO
DSM
new generation, storage,
The following configurations were taken into account for all scenarios when calculating costs and benefits for Belgium: — 100% CCGT and +2 GW interconnections in 2030 for all scenarios; — 100% CCGT +4 GW interconnections in 2040 for all scenarios. For 2030, both fixed costs of existing units and new investment costs are shown in Figure 115.
The total fixed costs for each scenario are therefore composed by: — Existing unit fixed costs (FOM); — New investment CAPEX and fixed costs where different WACC assumptions are applied (6%, 9% and 12%).
FOM),
RESULTSSIMULATION 109
4.9.2. MARKET WELFARE COMPARISON BETWEEN SCENARIOS
•
• storage
SPLIT OF ANNUALISED INVESMENT COSTS PER TECHNOLOGY TYPE FOR 2030 FOR BELGIUM (FIG. 116) [M€]capacitynewforyearpercostsFixed 10001500200025005000 DEC RESBC New thermal New offshore wind New onshore wind New PV New interco New pumped-storage New storage DSM New DSM/storageinterco/NewRESNewthermal Taking a closer look
that: — In
— In
Assuming a WACC of 9% for all scenarios, the additional investments in capacity required are: around 0.9 B€/year in the ‘Base Case’; — around 2.1 B€//year in the ‘Decentral’; — around 2.1 B€/year in the ‘Large Scale RES’. that all costs might not be included in those figures. For instance, evaluation of additional reinforcements needed in distribution grids to integrate additional PV capacity or wind is not fully reflected in the figures. 116 shows the split of annuity per technology for each scenario. at noticed the ‘Base Case’: constitutes the major part of the the rest being (≈30%); the ‘Decentral’ scenario: the investment in PV consists of the biggest part (≈50%); thermal generation (≈30%); onshore (≈10%); and (≈10%); the ‘Large Scale RES’ scenario: onshore and offshore wind represent the main share of investments (≈50%); followed by thermal generation (≈25%); and PV (≈20%); Storage and DSM are filling the rest.
•
•
MARKET WELFARE GAIN/LOSS FOR PRODUCERS AND CONSUMERS IN THE 'DECENTRAL' AND 'LARGE SCALE RES' SCENARIOS COMPARED TO THE ‘BASE CASE’ IN 2030 (FIG. 117) [M€]inchangeWelfare -2000-1500-10001000150020005000-500 Total comparedwelfaretoBC LOSSGAIN Producer'ssurpluschange Consumer'ssurpluschange Producer'ssurpluschange Consumer'ssurplus change ≈950 M€/year ≈850 M€/year DEC RES 1020 1530 -670 -70 Storage surplus was included in the producer's surplus while congestion rents included in the consumer surplus
RESULTSSIMULATION 110
—
DSM
— In
The producer’s surplus is lower in ‘Decentral’ and ‘Large Scale RES’ due to the lower revenues of the production fleet but fuel cost savings are limiting this decrease. It results in a positive welfare for Belgium of around 950 M€/year for the ‘Decentral’ and 850 M€/year for the ‘Large Scale RES’ scenario in 2030.
The cost to keep existing units online is the same in each scenario and adds up to around 1 B€/year.
investments (≈70%); •
the cost split between technologies, it can be clearly
Comparing scenarios in terms of market welfare (consumer surplus, producer surplus and congestion rents) indicates that the ‘Decentral’ and ‘Large Scale RES’ scenario have a positive impact on the consumer’s surplus compared to the ‘Base Case’ scenario (see Figure 117 for 2030).
•
It is important to note that the market welfare of Belgium is also influenced by the assumed evolution of the energy mix in the neighbouring countries.
The increase of renewable technologies setting the price drives the wholesale prices down.
•
Figure
•
PV and onshore wind
•
• thermal generation
The additional interconnections represent less than 2% of the total annuities in the ‘Base Case’ and less than 1% in the other scenarios For 2040, the same calculations were performed. The details can be found in Annex 7.4.5. It results from the quantification that: — ‘Base Case’ – 2.7 B€/year of new investments are needed; — ‘Decentral’ – 4.9 B€/year of new investments are needed; — ‘Large Scale RES’ – 5.2 B€/year of new investments are needed.
wind
Note
≈0.9
— Studies by the Federal Plan Bureau have also demonstrated benefits in terms of trade balance for the country [PLN-2].
— Studies made by the Federal Plan Bureau have demonstrated that a scenario with additional renewable generation in Belgium will lead to additional direct and indirect jobs [PLN-1][PLN-2];
4.9.3. ADDITIONAL BENEFITS OF MORE RENEWABLES IN THE SYSTEM
≈0.85
Additional investment costs from 2020 with 9% SumWACCofproducer, consumer and congestion rents for Belgium compared to the BC Thescenariototal is the sum of additional invest ments needed, fixed costs of existing units where the welfare gain compared to the BC has been deducted for DEC and RES. 1 B€/year
RESULTSSIMULATION111
Existing
DEC RESBC B€/year ≈2.1 B€/year B€/year B€/year B€/year units B€/year 2.1 B€/year 2.2 B€/year
— A higher share of RES in the Belgian energy mix reduces the dependency on imported fossil fuel COST-BENEFIT ANALYSIS BETWEEN THE SCENARIOS (FIG. 118)
≈0.95
Different studies have demonstrated that additional renewables in the system are beneficial in terms of employment, trade balance and dependency on imported fossil fuels. The ‘Decentral’ and ‘Large Scale RES’ scenarios present additional benefits when compared to the ‘Base Case’ scenario. A non-exhaustive list with references to other studies is available below:
4.9.4. COST-BENEFIT ANALYSIS BETWEEN SCENARIOS
The net welfare between scenarios was computed based on the market welfare and investment annuities and is presented in Figure 118. Comparing the difference in annuities and the market welfare between scenarios for 2030, indicates that the different scenarios are roughly equivalent in terms of net welfare for Belgium. This conclusion is highly dependent on the evolution of the CAPEX costs of onshore and offshore wind, PV and batteries. Given the planned decrease of those in the future, accelerating the energy transition (‘Decentral’ and ‘Large Scale RES’) is roughly equivalent to the ‘Base Case’ scenario (which already reaches the 2030 targets).
The analysis for 2040 indicates that the market welfare gain for Belgium cannot compensate the investment annuities when comparing the ‘Decentral’ and ‘Large Scale RES’ scenarios. The detailed results for 2040 can be found in Annex 7.4.4.
≈2.1
Only costs for the Belgian society were assessed. The 3 scenarios also assumed different hypotheses for the neighbouring countries that have an impact on the welfare of the country. The costs of those investments were not taken into account in these calculations. The outcomes of this exercise are very dependent on the CAPEX evolutions of the different renewable Notetechnologies.thatother benefits for DEC and RES compared to BC exist in terms of: - trade balance; - dependency on fossil fuels; - employment. Fixed costs needed to keep the existing units from 2020 running in 2030 in Belgium
fixed WelfareAdditionalcostsinvestmentcostsgaincomparedtoBCTOTAL 1.9
RESULTSSIMULATION112 The Figure 119 summarises the key assumptions for Belgium and main quantitative results. 4.10 SUMMARY OF FINDINGS SUMMARY OF QUANTITATIVE FINDINGS (FIG. 119) 2016 2030 2040 BC DEC RES BC DEC RES assumptionsKey Belgiumfor Demand electrificationand Total demand (incl. electrification) ≈85 TWh 88.8 TWh 90.4 TWh 89 TWh 90.2 TWh 97.6 TWh 94.1TWh Amount of EV <10k 400k 900k 500k 900k 2500k 1300k FlexibilityDemand Shedding ≈0.6 GW 1.1 GW 2 GW 1.1 GW 1.1 GW 2 GW 1.3 GW Shifting ≈0 ≈0 2 GWh/day 0.6 GWh/day 0.7 GWh/day 6 GWh/day 1.4 GWh/day Storage in pumped-storage 1.3 GW 1.3 GW 1.3 GW 1.9 GW 1.3 GW 1.3 GW 1.9 GW in batteriesstationaryandEV(3h) ≈0 ≈0 1.8 GW 0.6 GW 0.6 GW 3.6 GW 1.5 GW RES ≈3 GW 5 GW 11.6 GW 7 GW 6 GW 18 GW 10 GW RES ≈1.5 GW 3.3 GW 4.2 GW 5.4 GW 4.2 GW 5.9 GW 8.4 GW 0.7 GW 2.3 GW 2.3 GW 4 GW 4 GW 5 GW 8 GW ThermalExisting Existing units assumed available 3.8 GWOCGTCCGT/ 3 GW 5.9bio/wasteCHP/GWnuclear 2.3 GW of existing CCGT/OCGT 3 GW of0CHP/Biomass/WasteGWNuclear 0 GW of existing CCGT/OCGT 3 GW of0CHP/Biomass/WasteGWNuclear resultsModel Ensuringadequateansystem Need forcapacitythermal >5.9 GW >5.6 GW >5.0 GW >6.1 GW >6.7 GW >5.6 GW Of which thermalnew-builtcapacity >3.6 GW >3.3 GW >2.7 GW Ensuring a (electricitysustainablefuturesystem) RES-E share in BE ≈15% 30% 40% 46% 40% 57% 68% RES-Ein EU22share ≈29% 50% 57% 59% 61% 67% 69% CO2 reduction in electricity sector EU (on track) ≈ -20% -55% -65% -67% -66% -70% -75% -48% -59% -58% -60% -64% -74% andAffordabilityindustrialopportunity Yearly Exports Yearly Imports ≈8 TWh ≈15 TWh ≈10 TWh ≈40 TWh ≈10 TWh ≈40 TWh ≈15 TWh ≈30 TWh ≈15 TWh ≈35 TWh ≈20 TWh ≈35 TWh ≈25 TWh ≈30 TWh Average marginalprice ≈40 €/MWh 90 €/MWh 77 €/MWh 73 €/MWh 98 €/MWh 88 €/MWh 56 €/MWh 70 €/MWh 59 €/MWh 56 €/MWh 74 €/MWh 63 €/MWh 44 €/MWh Total new investments annuity 0.9 B€/year 2.1 B€/year 2.1 B€/year 1.8 B€/year 4 B€/year 4.3 B€/year Welfare gain (compared to BC) +0.95 B€/year +0.85 B€/year +0.8 B€/year +0.9 B€/year To keep competitiveBE Additional interconnections An efficient thermal fleet in the market C2GG2CG2CC2G
113 5.1 — SUPPLY SHOCK, TIMING ISSUES AND A CALL FOR ACTION 115 5.2 — REFLECTION ON MARKET DESIGN OPTIONS 117 5.3 — CONCLUSION: A TARGETED AUCTION AS PRAGMATIC WAY FORWARD, AT LEAST IN A FIRST STAGE 120 MARKET DESIGN OPTIONS 05

Building further on the observed needs for new capacity resources, this chapter focusses on market design options enabling the necessary investments to ensure that the Belgian system can remain adequate, also after the completion of the nuclear phase-out.
By doing so and based on the findings of the present study, Elia – in its capacity of market facilitator – wishes to share its reflections on market design issues and to make a positive and pragmatic contribution to the complex and subtle market design puzzle on the road towards 2025 and beyond. Elia remains at disposal of the competent authorities to contribute to any further reflections on this matter.
MARKET DESIGN OPTIONS114
In this chapter, it is argued that during the next decade the Belgian market will be confronted with a situation that is beyond business-as-usual and without precedent, and that there are strong reasons to doubt that the market response will lead to sufficient and timely new investments. It turns out to be necessary to consider alternative market design options on the short term.
Next, this chapter reflects on such alternatives and provides an assessment on the basis of the findings in the present study. It builds further on the overview of possible options given in the April 2016 study. However, the provided assessment only explores in a high-level way different options and requires further research. For instance, a thorough legal analysis for compliance with European State aid rules, detailed design considerations,... clearly go beyond the scope of this contribution.
The supply shock Belgium is facing is unprecedented in relative terms and goes beyond any shock already encountered in liberalised electricity markets.
5.1 SUPPLY SHOCK, TIMING ISSUES AND A CALL FOR ACTION
The present study indicates that the wholesale market will likely not remunerate the full cost of the necessary investments.
byavailableshouldcapacityNewbe2025 TAKING INTO ACCOUNT REASONABLE LEAD TIMES FOR DEVELOPING NEW CAPACITY, THE WINDOW OF OPPORTUNITY FOR SETTING UP NEW MARKET DESIGN OPTIONS IS CLOSING FAST (FIG. 120) 2017 2018 2019 2020 2021 2022 2023 2024 2025 Remaining time for developing market design options, including: • Policital decision • Setting up the legal framework • Drafting market rules • Actual implementation • Obtaining EU State Aid approval Lead time for construction, varying per production technology: • 2-3 years for smaller, peaking units and demand response • 4-6 years for larger mid- or baseload units
From a market perspective, the nuclear phase-out as currently planned for is a very steep supply shock, i.e. a very significant share of the generation capacity to be closed over a short period. To our knowledge, this is unprecedented in relative terms (i.e. in terms of the magnitude of plant retirements over the total installed capacity within such a short timeframe) and goes beyond any shock already encountered in liberalised electricity markets. The potential closure in the same period of part of the existing gas-fired generation capacity being at the end of their life-time and/or for economic reasons only adds to the severity of the shock. Other supply shocks of several gigawatts have already been observed, but either they happened in a bigger market making the shock itself relatively speaking smaller and easier to absorb or were accompanied by side-measures such as extra market design features or other kinds of intervention. In the worst case, supply shocks led to inadequate situations that had to be tackled by far reaching measures negatively impacting the economy and the daily life of citizens (e.g. after the closing of nuclear capacity after the Fukushima disaster).
MARKET DESIGN OPTIONS115 not remunerate the full cost of the necessary investments. Moreover, even if in theory the market could deliver part of the needed investments, the situation would still not be adequate, i.e. the level of hours with unserved demand would clearly exceed the legal criterion. Clearly, this is a scenario which is not desirable and that should be avoided. Consequently, in order to overcome the supply shock and avoid the described negative impact on security of supply, alternative market design options should be considered.
Next to being unprecedented, it appears unlikely that the Belgian market would be capable of absorbing the entire supply shock on its own and trigger sufficient and timely investment in new resources, i.e. within the contours of the current market design. As illustrated in Section 4.5, the present study indicates that the wholesale market will likely
5.1.1. THE BELGIAN SUPPLY SHOCK IS STEEP AND UNPRECEDENTED IN LIBERALISED MARKETS
5.1.2. THE CLOCK IS TICKING... FAST When thinking of alternative market design options, it is crucial to realise that the window of opportunity is small and closing fast. From the present study it is clear that new capacity resources are needed by 2025. The lead-time for such new investments obviously varies with the technology and is most likely shorter (e.g. 2-3 years) for demand response and smaller peaking units and longer for bigger mid- or base load units (e.g. 4-6 years). Based on the study results, overall welfare levels are the highest when the capacity resource portfolio is also optimal, which suggests not tendering only for peaking units, but also including larger, more efficient units able to provide bulk energy at lower cost and with lower emission levels within the volume of 3.6 GW.
5.1.3. THE TIME TO DECIDE IS NOW
aid for
Looking back from 2025, investment decisions most likely have to be taken around 2020-2022, depending on the technology. This leaves a window of opportunity of about three or four years to set up alternative market design options and implement them.
MARKET DESIGN OPTIONS116
In addition, if some doubt might have arisen on the execution of the legal phase-out calendar, it should be dispelled promptly since it is not compatible with a clear investment framework to maintain security of supply. If no timely action would be taken, in a few years society will be confronted with only two options left, i.e. extending nuclear lifetime with about 4 GW of nuclear capacity or accepting the negative consequences in terms of inadequate supply (risking that the lights could go out) and higher prices for Belgian consumers.
11. EU Guidelines
Although this may seem a lot of time at first sight, today at the end of 2017, there is not yet any certainty on how to move forward and which direction to take. Moreover, once a political decision has been taken on the way forward, sufficient time is needed for putting the necessary legislation in place, determining concrete market rules and actually setting up the new market functioning together with all the stakeholders involved. This is a question of years rather than months and for some market design options it can easily span several years. Last but not least, the EC would have to be notified if there is any mechanism that would entail a kind of support for capacity resources and approval is needed within the framework of European state aid guidelines11. This is not to be taken lightly and although it may partly run in parallel with the conception and implementation of a concrete mechanism, it clearly adds to the overall time needed to put a good solution in place. on State environmental protection [ELX-1].
and energy 2014-2020:
It is necessary to develop alternative market design options within the term of this Combininggovernment.onthe one hand the concerns regarding timing for both developing new capacity resources and putting a new market design mechanism in place, with on the other hand, the unprecedented supply shock and the likely inability of the current market design to adequately cope without a negative impact on security of supply, can only lead to a single conclusion: the time to decide is now. The political community is called upon to take action fast to deliver by 2025. It is necessary to develop alternative market design options within the term of this government and in due time get in touch with the European authorithies in the context of state aid guidelines.

Two groups of market design options complementing the energy market are distinguished: Out-of-market mechanisms: For maintaining adequacy, out-of-market mechanisms concern capacity that is only available for activation in periods of (anticipated) scarcity. This capacity is contracted for this purpose by the TSO and operates in a strictly regulated environment that avoids interfering with the market as much as possible, e.g. maintaining scarcity price signals that would result from the market. This also implies that the owner or operator of this capacity cannot use it for its normal market activities. Today’s Strategic Reserves consisting of demand side contributions
New capacity resource
MARKET DESIGN OPTIONS 117 5.2
IN-THE-MARKET MECHANISM (FIG. 122)
OUT-OF-MARKET MECHANISM (FIG. 121)
New capacity resource
In-the-market mechanisms: In-the-market mechanisms provide incentives or firm commitments to develop new capacity (or to maintain existing capacity) as compensation for the service provided to the system allowing it to fully participate in the market. This means that the owner or operator of the plant is not restricted in its use of the capacity and can use it for its normal market activities. Market-wide capacity remuneration mechanisms (CRMs) and targeted auction mechanisms are examples of in-the-market mechanisms.
Additionally, even if the necessary conditions for an EOM to deliver on adequacy would be fulfilled, the market would be confronted with high price spikes and their consequences on the economy. Therefore, the remaining two options, a CRM or EOM complemented with (possibly enhanced) Strategic Reserves were deemed to be more promising.
Existing capacity resource
In its 2016 report Elia already reflected upon different market design options aiming for an adequate situation and fostering investments. In a nutshell, three market designs were explored: Energy-Only Market (EOM), Capacity Remuneration Mechanisms (CRM) and an energy-only market complemented with Strategic Reserves. For the latter option a number of possible improvements to the current Strategic Reserves mechanism were also presented. It was argued that today and for the following years a pure energyonly market is unlikely to deliver an adequate level of capacity.
Out-of-marketcapacity
In case of scarcity
Irrespective of the choice on how to complement the current market design with extra mechanisms, it is still vital to continue to develop the energy market at the same time. Before discussing any options further, it is important to emphasise that, irrespective of the choice on how to complement the current market design with extra mechanisms, it is still vital to continue to develop the energy market at the same time. For instance, implementing network codes, facilitating demand response, reducing barriers for market entry, etc. Enhancing market functioning in general will also contribute to limiting the need for extra mechanisms to what is strictly necessary. The energy market is and remains a (if not the) cornerstone of the electricity market and work is underway in Belgium to continue improving the functioning of the energy market.
REFLECTION ON MARKET DESIGN OPTIONS
A good energy market design is particularly important for those players and technologies for which at first glance no additional market design options are thought to be needed, such as could be the case for DSM and (sooner or later) some storage technologies.
Existing capacity resource and life prolongation of old generation facilities provides a clear example of an out-of-market mechanism.
An alternative to market design options relying on out-ofmarket capacity is to attract investments in new capacity resources via mechanisms that ensure that those investments can fully operate in the market. In terms of direct market impact, the main difference with out-of-market designs is that there is no longer a structural reliance on price spikes.
Firstly, although the main investment incentive in such a design should come from the energy market, reliance on volatile prices and scarcity events makes it doubtful whether the market will actually invest in significant volumes of new capacity. Given the need for at least 3.6 GW of new-built thermal capacity by 2025, it appears unlikely that most of this volume could be delivered by the market leaving only a residual part to be picked-up by the Strategic Reserves. This would render the need for and the role of the out-of-market capacity more prominent than today.
There are indications that in-the-market mechanisms also tend to provide higher overall and consumer welfare than out-of-market mechanisms, despite the higher direct cost of the Amongmechanism.themechanisms aiming for in-the-market capacity resources, the so-called capacity remuneration mechanisms or CRMs are probably the best known. They are well described in economic literature and different ways to implement them exist or are pursued in other European markets and beyond.
Elia’s 2016 study also examined CRMs and several of their key design aspects. One of the conclusions was that, although they don’t appear to be fundamentally incompatible with the Belgian market, CRMs are very complex mechanisms.
Taking into account lead times for developing new capacity and for rollingout (new) mechanisms, targeted tender mechanisms for new-built capacity in the market seems to be the most realistic option for covering the 2025 new-built needs.
There are indications that market design options ensuring new-built of generation capacity in-the-market are likely to create more welfare for society and consumers than market design options relying on out-of-market capacity mechanisms.
MARKET DESIGN OPTIONS1185.2.1. EOM COMPLEMENTED WITH OUT-OF-MARKET CAPACITY
In market designs with out-of-market capacity (like Strategic Reserves), the energy market is assumed to continue to function like an energy-only market but the out-of-market capacity is an addition that should only be relied upon and activated only in situations of scarcity. These capacities are operated in a regulated context Although Strategic Reserves relying on retiring generation capacity and demand side management are considered an appropriate mechanism to address adequacy issues in the shorter to medium term (cf. the introduction of the mechanism in Belgium in 2014), structurally relying on such a design in the longer run - with a clear need for new capacity resources - is more questionable.
Secondly, in such a scenario it seems unavoidable that new capacity resources are to be fostered through an out-ofmarket mechanism. As already pointed out in the 2016 study, allowing new-built generation capacity as Strategic Reserves is a possible design feature that could be added to the existing Strategic Reserves mechanism, but it raises questions on the volume that will have to be kept out-ofmarket. Market analysis suggests a structural need of at least 2 GW of Strategic Reserves might be necessary, and possibly significantly more during a transitory period if some of the necessary new-built investment is delayed. Note that the lead-time for developing new-built generation capacity is also accounted for in such out-of-market mechanisms, implying that – unlike today’s practice with Strategic Reserves – the tendering for this capacity should be organised three to four years in advance. Finally, the announcement years ahead of such tenders could spiral down the already insufficient investment incentives in the market. Designs relying on out-of-market capacity will inevitably lead to price divergence with neighbouring countries, leading to a competitive disadvantage for the Belgian Relyingeconomy.structurally on out-of-market capacity to guarantee generation adequacy also implies structurally increasing the occurrence of price spikes in the energy market. Despite other (past and future) market design and transmission investment efforts, this will inevitably lead to price divergence with neighbouring countries, leading to a competitive disadvantage for the Belgian economy.
Compared to scenarios with all capacity in-the-market, there are indications that both overall welfare and consumer welfare are likely to be lower in scenarios relying on out-ofmarket capacity. Stressing all the necessary caveats and warnings as to the difficulty of giving figures of such estimates, the Elia market model used in this study suggests that a market scarcity of 1.5 GW to 2 GW (that would have to be accounted for by a complementary Strategic Reserves mechanism to fulfill Belgian’s adequacy criteria) would cause a price increase for Belgian consumers in the order of 1 to 1.5 B€/year. Conversely, the cost for consumers of an in-the-market mechanism, avoiding such scarcity and the associated negative economic impacts, is still more difficult to estimate as long as its main design issues remain open, but estimates vary in a range lower than and up to around 500 M€ per year. In terms of total cost figures for a scenario (as discussed in section 4.8.3.2), such a mechanism is in principle not a new cost to be added at the level of the entire society, but should be considered as a welfare transfer towards producers to unlock the necessary investments.
5.2.2. DESIGN OPTIONS AIMING FOR IN-THE-MARKET CAPACITY
Being a small but highly interconnected market structurally relying on imports, Belgium is directly affected by market imperfections and political or operational decisions in neighbouring countries. This increases the relevance of finding an appropriate solution for cross-border arrangements. As in other countries a cross-border arrangement was not always considered at length in a first release of a CRM. This reduces hopes for a Belgian mechanism to move as fast as or even faster than those of other countries if a good cross-border solution is to be foreseen from the start.
auctions can be challenged from a competition or state aid perspective if they are not designed to be efficient and used in a specific context. Notwithstanding the need to further explore the arguments, the current specific Belgian context may provide arguments to justify the option of a targeted auction, at least as a first step to a more fundamental design transition. If such an option would be opted for, this would not be the first time for Belgium. It would be crucial to closely analyse the difficulties encountered by earlier initiatives and why the context may be different and justify such intervention now. As already mentioned above, a first argument may be found in timing because to be adequate by 2025 potentially better options may not be feasible. The need is urgent and significant. In addition, the specificities of the Belgium supply shock would likely make such option efficient and limit any potential distortion it would induce: the fact that such a targeted auction would aim to substitute the nuclear base load capacity by new capacity, significantly minimises the market impact on the existing generation fleet, thereby limiting (and – depending on the actual technologies winning the tender and their place in the merit order –potentially even avoiding) a crowding out effect for existing generation capacity and in the medium-term, limiting any ‘slippery slope’ Notwithstandingeffect. the need to further explore the arguments, the current specific Belgian context may provide arguments to justify the option of a targeted auction, at least as a first step to a more fundamental design transition.
like France and the UK show that it can easily take several years to set up a CRM (e.g. in both countries it took more than six years from the first discussions on legislative changes to the first auction) and then any lead-time for the construction of new capacities has to be added, which takes two to six years, depending on the technology. Mechanisms often require further fine-tuning in the years to come. Additionally, questions regarding the opportunity/feasibility of cross-border participation in CRMs or the development of a regionally coordinated CRM will also have to be addressed (e.g. recent evolutions in neighbouring countries, the proposals in the EC’s Clean Energy Package).
Altogether, there is more than reasonable doubt as to whether it is realistic to develop such a CRM mechanism on time, i.e. to be fully legally embedded, approved at EU level and fully implemented by about 2020 or 2021 to still leave sufficient time for investments to actually be operational by 2025. However, more work is needed to evaluate whether such a CRM mechanism – possibly in a regional coordinated way – could be a structural solution to longer term adequacy issues in Belgium.
MARKET DESIGN OPTIONS119
As this stringent time constraint renders a CRM rather unrealistic as a solution for in-the-market new-built capacity for the 2025 adequacy needs, other options with shorter implementation times may have to be considered. One such option is a targeted auction for new-built capacity. This capacity operates fully in-the-market for the entire volume needed. Such targeted auctions are less complex to design and organise and therefore could provide a faster and efficient solution. Even though a faster implementation could be feasible, the time to act is still now. Setting up the framework for a tender, thinking through a good tender design, obtaining European state aid clearance, etc. still requires a few years and such an initiative – if deemed a good option for Belgium – should also be launched as soon as Targetedpossible.
Although generally less complex than a CRM, the actual design for a targeted auction should be carefully reflected upon, not the least when aiming for large volumes up to several gigawatts. The following design aspects are extremely relevant amongst others: the remuneration mechanism (e.g. based on contract for differences), the evaluation criteria (e.g. price, maturity of the project, project per project or evaluation as a portfolio), the timing of tender (e.g. one or multiple rounds), the conditions for participation (e.g. project sustainability, technical criteria...).
For instance, they do not only enable the new capacity to be developed, but also involve existing capacity and cross-border contribution, they impact on existing roles and responsibilities for market participants and the TSO, they consist of several new long- and short-term contractual arrangements and require a significant package of new legislation and market rules to be Experiencesdeveloped.inothercountries
MARKET DESIGN OPTIONS 120 5 .3
The overall goal should be to ensure that necessary resources to maintain adequacy are built on time and at the least cost for society. In this respect it is important to bear in mind the overall picture and not only focus on the direct cost of the mechanism installed. The overall picture is measured by welfare gains and not only by the cost to finance such a mechanism. For instance, it may be the case that mechanisms aiming for in-the-market capacity, particularly market-wide CRMs, have a higher direct cost for financing the mechanism than mechanisms based on out-of-market capacity. However, indications are that despite a likely higher direct cost of the mechanism, the overall (and consumer) welfare gain still outperforms mechanisms with out-of-market capacity. The underlying driver is likely to be the higher average prices (due to the occasional, but structural price spikes) in the case of out-of-market mechanisms.
CONCLUSION: A TARGETED AUCTION AS PRAGMATIC WAY FORWARD, AT LEAST IN A FIRST STAGE
From a pragmatic point of view with a strong focus on readiness by 2025, and bearing in mind welfare and price level considerations, opting for a one-shot operation with targeted auctions aiming for the substitution of closing capacity of at least 3.6 GW may be a promising solution that needs further elaboration in the short term. Although subject to several uncertainties, such a mechanism may have a reasonable chance to be up and running by 2020 leaving sufficient time for new capacity resources to be developed by 2025. Depending on further investigation, such a mechanism based on targeted auctions could also be conceived as a first step towards a market-wide CRM. However, more work is needed to evaluate whether such a CRM mechanism – possibly in a regional coordinated way – could be a structural solution to longer term adequacy issues in Belgium. If so, this could then be developed in parallel, but at a rhythm that allows for a careful design tailored to the Belgian situation for the medium and longer-term and in accordance with the best practices in this respect.
121 6.1 — METHODOLOGY AND ASSUMPTIONS 123 6.2 — DECARBONISING THE ELECTRICITY SYSTEM 124 6.3 — ECONOMIC SCENARIO ASSESSMENT 125 6.4 — ADEQUACY: TO KEEP THE LIGHTS ON 126 6.5 — MARKET DESIGN: HOW TO REACH ADEQUACY AT THE LEAST COST 127 6.6 — SCENARIOS FOR THE NUCLEAR PHASE-OUT 127 6.7 — GRID AND INTERCONNECTOR DEVELOPMENT 128 CONCLUSIONS AND MAIN POLICY CHALLENGES 06
122
CONCLUSIONS AND MAIN POLICY CHALLENGES
In this chapter, we will first give a factual overview of the main assumptions and methodology which are crucial for the interpretation of the results of the study. Then we will summarise the main findings and conclusions of the study, grouped along the three pillars of the Energy Trilemma. Based on these findings, we will list some policy suggestions concerning: — market design for system adequacy and competitiveness around the nuclear phase-out; — grid development and its cross-border interconnections.
Since the study focuses on the long-term evolution of the Belgian system in a European context, the model and the study scope have limitations, which are either out of the scope of Elia’s activities or will be the subject of further work:
The model does not a priori assume a given level of imported energy at the critical moments for system adequacy. Instead, it assumes a given level of simultaneous grid import capacity, distributed over the borders. The actual volumes of imported energy result from the market as they are computed by the model, and depend on the extent to which excess generation capacities are available for export in the other countries. All scenarios respect the legal calendar for the nuclear phaseout. For 2030, a sensitivity has been computed for a 2 GW lifetime extension for 10 years (2025-2035).
As regards energy efficiency, the study assumes that it compensates the electricity consumption increase driven by economic growth. Additional electrification in heating and mobility are taken into account. Annual demand is assumed to be around 90 TWh in 2030 and between 90 and 98 TWh in The2040.market model focuses on the wholesale market price. In a second step, by comparing the costs of investments with their revenue from the wholesale market, estimates of the additional cost of subsidy mechanisms for renewable energy or for other storage, demand or generation resources (if any) can be made. This second step is not part of the Elia model, but some qualitative insights are given.
— Consequently, the degree of uncertainty surrounding the ‘Decentral’ scenario is higher than for the other scenarios. The large-scale integration of photovoltaics, with the accompanying strong development of battery systems, is especially subject to technical and economic challenges.
— ‘Base Case’ (BC), a sustainable transition in accordance with the existing EU targets for 2030; — ‘Large Scale RES’ (RES), complementing the ‘Base Case’ scenario mainly with large-scale onshore and offshore wind developments; — ‘Decentral’ (DEC), complementing the ‘Base Case’ scenario with stronger penetration of decentralized solar and local storage devices and consequently a more prominent role for the prosumer.
The use of the ‘Large Scale RES’ and ‘Decentral’ scenarios highlights the challenges of setting high decarbonisation targets for the country and Europe. It does not imply any position by Elia on their effective implementation, nor their feasibility.
— Since the focus is on the long-term, abstraction has been made to a large extent of constraints imposed by the legal and regulatory framework.
123 6.1
For example:
METHODOLOGY AND ASSUMPTIONS
Three main scenarios have been quantified:
— the ‘Large Scale RES’ scenario assumes a very strong increase of offshore wind up to 4 GW in 2030 and 8 GW in 2040; — The ‘Decentral’ scenario assumes very strong developments of photovoltaics up to 11.6 GW in 2030 and 18 GW in 2040.
In all scenarios, significant developments of demand side response and storage facilities have been assumed, up to different and steadily increasing levels as described in more detail in the study. As an example, in the ‘Decentral’ scenario, the DSM shedding capacity is assumed to be 2 GW and 6 GWh/day in DSM shifting. The capacity of storage devices (including stationary batteries, EV batteries and pumped storage) evolves from 3 GW in 2030 to 5 GW in 2040.
A sensitivity with 12 GW of storage devices and 31 GWh/day of DSM shifting was also simulated.
— Distribution costs and constraints, especially regarding the integration of renewables, distributed generation in general and flexibility tools, are not taken into account.
CONCLUSIONS AND MAIN POLICY CHALLENGES
The methodology used in the study is a further development of Elia’s probabilistic, so-called ‘Monte-Carlo’ type model with an hourly time resolution for 34 different climate years, covering a perimeter of 22 countries.
— The range of scenarios has been chosen to illustrate pathways towards the decarbonisation of the power sector by 2050. Although the ‘Base Case’ scenario is in line with known policies and objectives, the other two scenarios contain elements for which the feasibility has not yet been fully assessed. Examples are the 8 GW of offshore wind in 2040 in the RES scenario (probably requiring cross-border North Sea coordination) and the 18 GW PV in the ‘Decentral’ scenario (requiring at least 4 GW of decentralised storage and bringing challenges for integration in the distribution systems).
Concerning the generation mix in the neighbouring countries, the study assumes that generation capacity in those countries will be maintained or developed in order to keep each individual country adequate while taking into account their respective import potential. The import potential for each country takes into account the non-simultaneous nature of peak consumption and the differences in intermittency of wind and sun simulated with a large amount of ‘Monte-Carlo’ Theyears.grid model is based on the ongoing and firmly decided grid and interconnection reinforcements, bringing the Belgian import/export capacity to 6.500 MW before the nuclear phase-out. Sensitivities with additional interconnection capacity in 2030 and 2040 have been analysed. But in all sensitivities, an import capacity of 6.500 MW was used for the adequacy assessments.
— Tariff and support mechanism design for renewables and thermal capacity, each with their respective incentives, have not been taken into account (except as far as strictly necessary for the analysis of the nuclear phase-out).
DECARBONISING THE ELECTRICITY SYSTEM
The final stages for reaching the 2050 target will need additional technological and societal developments, which are unclear for the time being. Nevertheless, quantified scenarios until 2040 have been elaborated upon, based on today’s mature technologies in the fields of generation, storage, networks and digitalisation.
In terms of the share of renewable energy in the Belgian electricity consumption, the figures for 2040 give 40% in the ‘Base Case’ scenario and up to 68% in the ‘Large Scale RES’ scenario. The realisation of this latter scenario - requiring North Sea cooperation for offshore wind - promises to be challenging to say the least. Therefore, these figures illustrate the difficulty for a small and densely populated country with a short coastline and medium sunlight such as Belgium to reach the 2050 targets on a stand-alone basis.
124 CONCLUSIONS AND MAIN POLICY CHALLENGES 6.2
From the aforementioned findings, a vision for the Belgian electricity mix towards 2040 can be derived: the optimal development of renewables (but probably at a lower rate than the EU22 countries perimeter due to demographic and geographical reasons) goes hand in hand with a comparatively higher part of efficient gas-fired generation to fill the gap, benefitting from strong interconnections.
The 20 to 25% gas generation in this electricity mix will mainly be delivered by highly efficient, low emission plants (CCGT or CHP). These plants will ideally be situated close to the big load centers that are also densely interconnected with the other countries, for economic and reliability reasons.
In order to reach the European targets for the total energy system of 80% decarbonisation in 2050, the electricity system should be close to carbon free (more than 90%) at the 2050 Achievingmilestone.thistarget for the electricity system will require using the full potential of renewable energy sources, increased energy efficiency and reinforced grids, both local and crossborder. Electrification of energy vectors like transport, heating and others will also play an important role.
— The technologies considered in this study are mature: wind, PV, battery storage, generation and transmission technologies and digitalisation. The expected evolution of their cost is taken into account. Conversely, the legitimate expectation that other disruptive technologies could emerge in the future at a competitive cost, does not invalidate the urgency to take decisions today, based on today’s knowledge. Based on past experience, it was assumed that Belgium would take no bet on large scale development of technologies that are not economically or technically mature.
On the other hand, when looking at the energy mix for the EU22 perimeter countries, the model suggests that gas-fired power will still account for 20 to 25% of the electricity mix in 2040, alongside renewables (60 to 68%) and a remaining but decreasing share of nuclear. With this mix, the reduction of CO2 in 2040 would reach levels in the range of 66 to 75% for the EU22 country perimeter.

Finally, as guidance for the evaluation of the market design options, the impact of a potential scarcity in the market (that would have to be physically covered by out-of-market Strategic Reserves) on the wholesale price has been estimated. With all necessary caveats and warnings as to the uncertainty of such estimates, the model suggests that a market scarcity of 1.5 to 2 GW would cause a price increase for Belgian consumers in the order of 1 to 1.5 billion € per year.
— From a societal point of view, the cost of the investments is to be covered by the fossil fuel economies, based on adequate CO2 pricing;
Internalising the cost of the energy transition in the wholesale price by a harmonised CO2 price is essential for the competitiveness of the Belgian economy since it increases the convergence with the cost for consumers in neighbouring Twocountries.other important findings are that:
CONCLUSIONS AND MAIN POLICY CHALLENGES 6.3
As regards further development of renewables, above the ‘Base Case’ assumptions, the analyses suggest that these developments could be realised without significantly increasing the general cost level:
125
For the longer term, some of the scenarios for 2040 suggest that an efficient, gas-fired power plant, favourably positioned on the merit order, might recover its full investment costs.
— From consumers’ point of view, the cost of the explicit RES support mechanisms, if any, is to be compensated by a decrease of the wholesale market price, compared with the ‘Base Case’, due to the zero marginal cost of renewables.
— Providing an efficient thermal generation fleet after the nuclear phase-out: the difference between a 100% CCGT versus OCGT fleet would improve convergence with neighbours by 3.7 €/MWh or approximately 350 M€/year in 2030.
The findings are in line with the common knowledge that internalising the cost of the Energy Transition by higher and harmonised CO2 prices is a fundamental market driver for the Energy Transition. With a CO2 cost of 33€/tCO2 in 2030, the model reveals an average wholesale price of 70€/MWh in the ‘Base Case scenario. This increase, compared with present levels of around 40€/MWh, is mainly driven by the increase of gas and CO2 prices. This wholesale price increase will not cause an equivalent increase of the cost to consumers. Indeed, an increase of the market price due to a CO2 and fossil fuel price increase (at EU level) will allow that costs of needed investments, both in renewable and other capacity resources will be more and more covered by the market price, with less recourse to RES or CRM support mechanisms.
— Additional interconnectors would enhance convergence of market prices. The effect in 2030 is estimated at approximately 1.7 €/MWh or 150 M€/year. As the economic chapter shows, this amount will steadily increase as the energy transition evolves.
ECONOMIC SCENARIO ASSESSMENT
Again, this mainly depends on the evolution of the CO2 and gas prices. A second factor is the increasing impact of demand side and other flexibility providing resources setting the wholesale price during peak periods. This implies that the cost of a market mechanism to unlock the necessary investments if adequately designed would gradually decrease as the energy transition evolves.
The estimations of the model indicate that the renewables development for the ‘Base Case’ in 2030 could roughly be covered by the increased wholesale price.
Concerning thermal generation capacity, the market analysis has revealed that if prices are roughly convergent with neighbouring countries as described above, the wholesale market will not remunerate the full cost of the necessary investments to face the nuclear phase-out. This creates a challenge for realizing the Belgian Roundabout vision consisting of renewables, efficient gas plants and Despiteinterconnectors.theinsufficient revenue to recover the investment cost, the efficient units will operate during a significant number of hours, the CWE+ merit order being determined only by marginal cost. The yearly running hours for the most efficient CCGT in the market in 2030 are in the range 4000 to 7500 hours, and decrease to 3000 – 7000 hours in 2040, depending on the merit order sensitivity and scenario.
Finally, as expected, the partial nuclear phase-out by keeping 2 GW of nuclear capacity until 2035, would reduce the need to 1.6 GW in 2025, without having an impact on the 2040 scenario. A long-term study like the present one does not aim to determine concrete figures for the next winters. Nevertheless, taking the results for 2030 and checking them, mutatis mutandis, with the results of the 2016 study for the period 2017-2027, gives an assessment of the capacity needs for the adequacy of the Belgian system at the point of the nuclear phase-out in 2025.
The results confirm that this thermal capacity of 3.6 GW will not be stranded for adequacy reasons until beyond 2040, which is in line with the figures on running hours mentioned above. This finding remains valid in the sensitivity with extreme developments of storage and flexibility.
6.4 ADEQUACY: TO KEEP THE LIGHTS ON CONCLUSIONS AND MAIN POLICY CHALLENGES
126 until 2025. It also assumes a remaining fleet of centralized gas-CCGT and OCGT plants in 2025 of 2.3 GW.
To keep the lights on, the study shows that there is a need for new-built thermal capacity in all scenarios after the nuclear phase-out and this until beyond 2040. More specifically, the study results indicate a firm need of at least 3.6 GW new-built thermal generation capacity to be developed in Belgium at the moment of full nuclear phase-out at the latest, i.e. before the winter 2025-2026. Although the study mentions mostly gas-fired plants, for which technical and economic data are publicly available, any other thermal generation resource like additional biomass or CHP etc., is possible (in fact, all technologies with controllable output are).
It is important to mention that the 3.6 GW figure takes into account the expected contribution of energy efficiency, demand flexibility, storage, the expected growth of intermittent renewable sources and all grid investments
Referring to the general assumptions regarding generation capacity in the neighbouring countries, it must be clarified that additional domestic resources with low utilisation rates could be required in the case of insufficient adequacy in neighbouring countries. These additional resources are estimated to range between 1 to 2 GW and come on top of the 3.6 GW new-built capacity. Due to the fact that they will be activated infrequently, they can be served by a variety of resources, including the life extension of old plants, additional demand side flexibility or storage, new peaker plants with relatively short construction time, etc.

1. The respect of the legal phase-out agenda is confirmed and accompanied by the development of a market mechanism to ensure adequacy at competitive prices. Opting for a one-shot operation with targeted auctions aiming for the substitution of 3.6 GW is suggested in this study, for further examination. As demonstrated in the chapter on market design, the clock is ticking for the implementation of such a measure.
2. As an alternative, the nuclear phase-out agenda could be confirmed while relying on the market for replacement investments, without taking accompanying measures for keeping the lights on. The analysis suggests that the market
From a pragmatic point of view with a strong focus on readiness by 2025, and bearing in mind welfare and price level considerations, opting for a one-shot operation with targeted auctions aiming for the substitution of closing capacity of at least 3.6 GW may be a promising solution that needs further elaboration in the short term. Although subject to several uncertainties, such a mechanism may have a reasonable chance to be up and running by 2020 leaving sufficient time for new capacity resources to be developed by Depending2025. on further investigation, such a mechanism based on targeted auctions could also be conceived as a first step towards a market-wide CRM. However, more work is needed to evaluate whether such a CRM mechanism – possibly in a regionally coordinated way – could be a structural solution to longer term adequacy issues in Belgium. If so, this could then be developed in parallel, but at a rhythm that allows for a careful design tailored to the Belgian situation for the medium and longer-term and in accordance with the best practices in this respect.
127 will not bring the necessary investments for the adequacy with a price level that is competitive with neighbouring countries. This means that this “no intervention” scenario entails the risk of having to decide later, once its consequences become clear, on a lifetime extension of up to 4 GW, insofar as this would still be feasible from a security and technical perspective.
MARKET DESIGN: HOW TO REACH ADEQUACY AT THE LEAST COST
3. A third scenario is, as suggested by some stakeholders, to go for a partial phase-out. The economic consequences of a prolongation of 2 GW for 10 years have been estimated in the economy chapter. It is crucial that a prompt decision be taken in this case. Indeed, it is not expected that the market will bring sufficient volumes of capacity resources to fill the remaining adequacy gap of approximately 1.6 GW. Hence, this third scenario also requires a similar market mechanism, of smaller size, to avoid the risk of a later lifetime extension of up to 4 GW of nuclear capacity, if still feasible. FOR THE NUCLEAR PHASE-OUT
If some doubts might have arisen on the execution of the legal phase-out calendar, it should be dispelled promptly since it is not compatible with a clear investment framework to maintain security of supply. When combining the conclusions on adequacy, economy and market design, the following scenarios emerge:
The overall goal should be to ensure that necessary resources to maintain adequacy are built on time and at the least cost for society. In this respect it is important to bear in mind the overall picture and not only focus on the direct cost of the mechanism installed. The overall picture is measured by welfare gains and not only by the cost to finance such a mechanism. For instance, it may be the case that mechanisms aiming for in-the-market capacity, particularly market-wide CRMs, have a higher direct cost for financing the mechanism than mechanisms based on out-of-market capacity. However, indications are that despite a likely higher direct cost of the mechanism, the overall (and consumer) welfare gain still outperforms mechanisms with out-of-market capacity. The underlying driver is likely to be the higher average prices (due to the occasional, but structural price spikes) in the case of out-of-market mechanisms.
6.6 SCENARIOS
CONCLUSIONS AND MAIN POLICY CHALLENGES 6.5
It is estimated to amount to approximately 200 M€ per year in 2040. This is in line with the finding that large scale integration of onshore and offshore wind at a cross-border scale seems the cost-optimal decarbonization path for a country like Belgium.
The present study confirms this with concrete, cost-benefit figures for further interconnection increases of 2 to 4 GW, based on welfare analyses for 2030 and 2040. As the energy transition unfolds, their positive economic contribution will steadily increase: the faster the decarbonisation of the electricity system, the better the economics of interconnector development.
6.7 GRID AND INTERCONNECTOR DEVELOPMENT CONCLUSIONS AND MAIN POLICY CHALLENGES
The positive results are exclusively attributable to improved renewables and market integration outside the critical hours for Finally,adequacy.thestudy is in line with a growing international consensus between academia, authorities, industrial and non-governmental bodies that significant transmission developments are needed to underpin the energy transition in the most cost-efficient way.
As regards potential contribution to Belgium’s adequacy by these further interconnection increases above 6500 MW, this was not accounted for in the cost-benefit analyses.
— Create the opportunity for efficient, new-built generation to capture value in the integrated European market; — Allow for a better integration of RES, both in Belgium and in the neighbouring countries. Specifically for Belgium, it allows more imports from low-carbon sources in neighbouring countries, since the limit of renewables integration within Belgium will probably be reached in the period 2040-2050.
Additional grid reinforcement and interconnectors are a key component of the energy transition. With increasing levels of renewables, additional interconnection will: — Increase welfare, and ensure wholesale price convergence due to the diversified energy mix in the surrounding countries (even without taking into account the additional contribution to adequacy by interconnection);
128
The net welfare gain for the country of additional inter connectors is the highest in the ‘Large Scale RES’ scenario.
129 ANNEXES 07 7.1 — LITERATURE REVIEW 130 7.2 — ASSUMPTIONS 131 7.3 — METHODOLOGY 133 7.4 — ADDITIONAL RESULTS 137
An extensive litterature review has been performed in order to build the scenarios for Belgium. The following studies (non exhaustive list and excluding Elia studies) were consulted to define the scenarios: — “Energy Transition in Belgium – Choices and Costs” published by EnergyVille in 2017 following a request from Febeliec in order to provide an objective analysis of possible scenarios for electricity generation in Belgium for time horizons 2020-2030; — “Welfare analysis of a selection of policy scenarios on an adequatefutureBelgianpowersystem” by Federal Planning Bureau published in 2017 at the request of the DG Energy and its addendum published in September 2017 following the request of the Minister to perform additional analysis with interconnections;
— “Ten year Network Development Plan 2016” scenarios and 2018 draft scenario report – ENTSO-E; — “Europe’s future secure and sustainable electricity infrastructure” – e-highway2050 study – November 2015;
— “Scenarios for a Low Carbon Belgium by 2050” – November 2013 – by CLIMACT and VITO at the request the Federal Public Service Health, Food Chain Safety and Environment for the Climate Change Section;
ANNEXES 7.1 LITERATURE REVIEW
— “Our Energy Future 2016” by 3E – at the requested of Bond Beter Leefmilieu, Inter-Environnement Wallonie, WWG and Greepeace published in December 2016;
— “Towards 100% renewable energy in Belgium by 2050” –VITO / Federal Planning Bureau – ICEDD – December 2012;
130
— “Sustainability considerations: CO2-emissions with and withoutnuclearpowerinBelgium” by UGent – presentation given to the Nuclear Forum – November 2016;
— “Etude sur les perspectives d’approvisionnement en electricité à l’horizon 2030” – January 2015 – DG Energie –FPB; — “Le paysage énergétique Belge: perspectives et défis à l’horizon 2050” – Federal Plan Bureau – October 2014;
— “Power Perspectives 2030” by European Climate Foundation – 2011; — EU 2050 roadmap” by European Commission – 2011; — “Trends and projections in Europe 2016 – Tracking progress towards Europe’s climate and energy targets” – European Environment Agency;
— “EUCO scenarios » by the European Commission – 2016; — “EU Reference scenario” by the European Commission –2016; — “Roadmap 2050: a practical guide to a prosperous, lowcarbon Europe” – European Climate Foundation – April 2010; — “World Energy Outlook 2016” – IEA – 2016.
each
RES
TYNDP2018 * IEA EV-Outlook 2016 Figure 124 illustrates the number of electric vehicles considered in each
NUMBER OF ELECTRIC VEHICLES IN EU22 FOR EACH SCENARIO (FIG. 124) (millions)vehicleselectricofNumber 1020304050607080900 DE-AT-CH BeNeLux Central Nordics Iberia France British Isles IT-SI BC RES BC 2040DEC2030DEC RES 24 37 33 47 78 59 11 21 26 19 54 69 NUMBER OF HEAT PUMPS IN EU22 FOR EACH SCENARIO (FIG. 125) (millions)pumpsheatofNumber 10203040506070800 DE-AT-CH BeNeLux Central Nordics Iberia France British Isles IT-SI BC RES BC 2040DEC2030DEC RES For the European countries in the studied perimeter, additionnal heat pumps (hybrid and electric) and electric vehicles are considered on the basis of TYNDP2018. Within this ENTSO-E deliverable, the expected evolution of these technologies for 2025 and 2030 was collected from all TSOs during the bottom-up data collection (see BOX 4). On this basis, two types of information are used in order to determine the number of heat pumps and electric vehicles in each scenario: Number of HPs/EVs for 2030/2040 = Extrapolated number of HPs/EVs for 2030/2040 + Additional number of HPs/EVs for 2030/2040
The additional annual growth rate for heat pump is computed following the approach described in the draft scenario report for TYNDP2018 [ENT-3]. electric vehicles, the additional annual growth rate used for TYNDP2018 is based on the IEA EV-Outlook 2016 [IEA-1], see [ENT-3] for more information. the data sources used to quantify the of based on scenario Generation' 2040: data based on IEA* numbers 2040 'high' scenario Very high Data based on IEA* numbers 'mod' scenario 'Global Climate Action' 2040: data based on IEA* numbers 2040 'mod' scenario ENTSO-E scenario. in scenario.
SUMMARY OF FINDINGS 131
'Distributed
electric vehicles in EU22. 7.2.1. ADDITIONAL ELECTRIFICATION IN EU22 7.2 ASSUMPTIONS DATA SOURCES USED TO DETERMINE THE PENETRATION OF ELECTRIC VEHICLES IN EACH SCENARIO (FIG. 123) 2030 2040 Penetration of EVs BC 'Sustainable Transition' 2030: data collected from the TSOs estimations 'Sustainable Transition' 2040:
— Extrapolated number of HPs/EVs for 2030 and 2040 is based on the data provided by all TSOs (i.e. 2025 and 2030) during the bottom-up data collection; Additional HPs/EVs is obtained by considering the trends extracted from the bottom-up data collection and an additional growth rate specific to a given scenario.
—
penetration
2030
the reported numbers from TSOs for 2030 and growth from IEA* numbers 'low' scenario is used to derive penetration for 2040 Moderate DEC 'Distributed Generation' 2030: data based on IEA* numbers 2030 'high'
Figure 123 summarises
High Source:
Figure 125 illustrates the number of total heat pumps considered
For
DE-AT-CH
As described in Section 2.5.2.3, the European assumptions for the other renewable sources (biomass, geothermal, hydro) are based on the ‘Sustainable Transition’ 2030 scenario constructed in the the TYNDP2018, this for all scenarios of this study (‘Base Case’, ‘Decentral’ and ‘Large Scale RES’) and time horizons. However, the latest forecasting for our neighbouring coutries are based on the national studies. 127 summarises the installed capacities of other renewable sources in EU22 considered for all scenarios and time horizons. Detailed data can be found on the ENTSO-E website [ENT-2].
Iberia
The installed capacities in both run-of-river hydro and hydro reservoir in EU22 for all scenarios and time horizons are shown in Figure 128. Theses units are not dispatchable and are taken into account by the model through thirty-four historical production profiles.
197GW 47.5 1.5 55.2
Iberia
Central
Renewable sources in EU22
Iberia
British
132 ANNEXES 7.2.2. THERMAL AND OTHER RES CAPACITY IN EU22
This section provides an overview of assumptions used for thermal and ‘other RES’ capacity in EU22. The main data sources are based on TYNDP2018. Thermal capacity in EU22 The installed coal/lignite/gas/nuclear capacity in EU22 is based on the assumptions used in TYNDP2018, except for our neighbouring countries as described in the section 2.5.3. Concerning the ‘other non RES’ capacity, the assumptions are aligned with TYNDP2018 and summarised in Figure 126.
Figure
INSTALLED CAPACITIES IN 'OTHER NON RES' IN EU PER REGION FOR 2030/2040 (FIG. 126) BeNeLux Nordics France Isles IT-SI 9.4 8.63.6 12.3
DE-AT-CH
GW45 8.4 3.82.3 9.43.4 8.63.6 5.3
The installed capacity per country for all technologies used in the scope of TYNDP2018 can be found in Excel format on the ENTSO-E website [ENT-2].
INSTALLED CAPACITIES IN RUN-OF-RIVER HYDRO AND HYDRO RESERVOIR IN EU PER REGION FOR 2030/2040 (FIG. 128) BeNeLux Central Nordics France British Isles IT-SI 7.227.132.32.5 24.2
5.3 10.0 6.29.6 0.9
5.35.9
INSTALLED CAPACITIES IN 'OTHER RES' IN EU PER REGION FOR 2030/2040 (FIG. 127) BeNeLux Central Nordics France British Isles IT-SI
DE-AT-CH
GW50 8.4 3.82.3
3.4
7.3.1. ‘MONTE-CARLO’ METHOD
BASIC PRINCIPLE BEHIND THE DETERMINISTIC APPROACH (FIG. 129) Variable 1 (X1) Variable 2 (X2) Variable i (Xi) Variable p-1 (Xp-1) Variable p (Xp) Model f (x1 , x2 , ..., xi , ..., xp ) Output y1 = f (x1 , x2 , ..., xi , ..., xp )
The ‘Monte-Carlo’ method is used in various domains, among them probabilistic assessments of risks. The name of this quantitative technique comes from the casino games in Monaco, where the outcomes for each game were plotted in order to forecast their possible results following a probability distribution translating the probability of winning. In this same way, when a forecasting model is built, different assumptions are made translating the projections of the future system states for which expected values have to be determined. In order to do this, the parameters linked to the system state, characterised by inherent uncertainty, are determined and for each of these an associated range of values through a specific distribution function is defined. The deterministic approach considers that a unique state is associated with each system input. This means that the same output will provide independently the number of times the simulation is performed since the same input is used (see Figure 129).
3. Step 3: Evaluate the model for a given set of values and store the output yi
METHODOLOGY
The ‘Monte-Carlo’ method extends the deterministic method as it uses sets of random values as inputs translating the uncertainty associated to these parameters thanks to a distribution function (or a large amount of samples of this distribution). This method is a class of computational algorithms and relies on repeated random sampling. This approach is used when analytical or numerical solutions don’t exist or are too difficult to implement and can be described via four steps:
� N
4. Step 4: Iterate steps 2 and 3 for i = 1 to N, where N represent the number of iterations The error for the results arising from the ‘Monte-Carlo’ method decreases as 1 / . In this assessment, random samples are taken for the unavailability of the thermal facilities of each country. Future states are determined by combining these samples with the time series for electricity consumption and for specific weather conditions. The simulations are conducted in relation to these future states. Figure 130 shows a random sample for p independent variables, yielding N different future states.
1. Step 1: Build a model characterised by parameters (inputs with inherent uncertainties) for the studied system y = f (x1 , x2 , ..., xp )
2. Step 2: Generate a set of values for each input using a distribution function Input = { x1,i , x2,i , ..., xp,i }
133 ANNEXES 7.3

Wind and solar generation are considered as non-dispatchable and comes first in the merit order. More precisely, as other non-dispatchable generation, they are subtracted to the load to obtain a net load. Afterwards, ANTARES calculates which dispatchable units (thermal and hydraulic) can supply this net load at a minimal cost.
GRID TOPOLOGY
The topology of the network is described with areas and links (in this study, one area represents a market node). It is assumed that there is no network congestion inside an area and that the load of an area can be satisfied by any local power plant. Each link represents a set of interconnections between two areas. The power flow on each link is bounded between two Net Transmission Capacity (NTC), one for each direction.
For each ‘Monte-Carlo’ year (see Section 7.3.1), ANTARES calculates the most-economic unit commitment and generation dispatch, i.e. the one that minimises the generation costs while respecting the technical constraints of each generation unit. The dispatchable generation (including thermal and hydro generation) and the interconnection flows constitute the decision variables of an optimisation problem, whose objective is to minimise the total operational costs for the system. The optimisation problems are solved with an hourly time step and a weekly time-frame, making the assumption of perfect information at this horizon but assuming that the evolution of load and RES is not known beyond. 52 weekly optimisation problems are therefore solved in a row for each ‘Monte-Carlo’ year.
Moreover, in ANTARES, some binding constraints on power flows can be introduced. They are in the form of equalities or inequalities on a linear combination of flows. They have for instance been used to model flow-based domains in the CWE market-coupling area.
A LARGE NUMBER OF RANDOM SELECTIONS ON DIFFERENT VARIABLES ALLOWS TO BUILD THE FUTURE STATES (FIG. 130) Variable 1, year1 Variable 2, year1 Variable i, year1 Variable p-1, year1 Variable p, year1 Variable p, yearm ‘Monte-Carlo’ year’ 1 ‘Monte-Carlo’ year N Combinations of N future states Futurestate1FuturestateN Model f (x1 , x2 , ..., xi , ..., xp ) Variable p-1, yearmVariable i, yearmVariable 2, yearmVariable 1, yearm
7.3.2. UNIT COMMITMENT
For each node, thermal generation can be divided into clusters. A cluster is a single or a group of power plants with similar characteristics.
SUMMARY OF FINDINGS 134
WIND AND SOLAR GENERATION
For each cluster, beside the time series of available capacity, some parameters necessary for the unit commitment and dispatch calculation are taken into account by ANTARES: — the number of units and the nominal capacities, defining the installed capacities; — the cost, including marginal and start-up cost; — the technical constraints for minimum stable power, mustrun, minimum up and down durations. Concerning the technical constraint for must-run, 2 values can be put: a value considered only if the plant is switched on (minimum stable power), and a value that, if higher than 0, forbids the plant to be switched off in the dispatch (mustrun). The latter one is given on an hourly basis, whereas the first one is a single value for the whole simulation.
THERMAL GENERATION
schedule &
7.3.3.
Ready-madeTimeseriesTime Analyserseries ANTARES PROCESS (FIG. 131) HydroManagerEnergy
Three categories of hydro plants can be used:
ANTARES optimises the operation of ‘PSP’ alongside the other dispatchable units while making sure that the amount of energy stored (taking into account the efficiency ratio of the ‘PSP’) equals the amount of energy generated during the day/week.
— Storage plants which possesses a reservoir to defer the use of water and whose generation depends on inflows and economic data;
ParametersmodellingStochastic Monte-CarloBuilderScenario EconomyResults TimeGeneratedseries *UC
For storage plants, the annual or monthly inflows are first split into weekly amounts of energy. The use of this energy is then optimised over the week alongside the other dispatchable units. Each hydro unit can generate up to its maximum capacity.
HYDRO GENERATION
of
Pumped-storage plants have the possibility to pump water which will be stored and turbined later on. It is operated on a daily or weekly basis, depending on the size of its reservoir.
DEMAND RESPONSE One way of modelling demand response in the tool is by using very expensive generation units. Those will only be activated when prices are very high (and therefore after all available generation capacity is dispatched). This allows replicating the impact of market response as considered in this study. Activations per day and week can be set on this capacity. AdequacyResults Power UC* Optimiser - Unit Commitment ANTARES: A New Tool for Adequacy Reporting Electric Systems ANTARES MODEL
The market simulator used in the scope of this study is ANTARES11, a sequential ‘Monte-Carlo’ multi-area simulator developed by RTE whose purpose is to assess generation adequacy problems and economic efficiency issues. This power system analysis software is characterised by these following specifications: — representation of several interconnected power systems through simplified equivalent models. The European electrical network can be modelled with up to a few hundred of region-sized or country-sized nodes, tied together by edges whose characteristics summarise those of the underlying physical components.; — sequential simulation with a time span of one year and a time resolution of one hour;
Time Generatorsseries 11.
135 ANNEXES
— Pumped-storage station (PSP) whose power depends only on economic data. Run-of-river generation is considered as non-dispatchable and comes first in the merit order, alongside with wind and solar generation (as explained above).
— Run-of-river (RoR) plants which are non-dispatchable and whose power depends only on hydrological inflows;
— 8760 hourly time series based on historical/forecasted time series or on stochastic ANTARES generated times-series; — for hydro power, a definition of local heuristic water management strategies at monthly and annual scales; — a daily or weekly economic optimisation with hourly resolution This tool has been designed to address: 1. generation/load balance studies (adequacy); 2. economic assessment of generation projects; 3. economic assessment of transmission projects. A large number of possible future states can be extrapolated by working with historical or simulated time series, on which random samples are carried out in accordance with the ‘Monte-Carlo’ method. The main process behind ANTARES is summarised in Figure 131 [RTE-2]. The simulation scheme behind this process can be described in 4 steps:
The ANTARES ‘economy’ mode aims to find the optimal economic dispatch of each hydro and thermal unit, in other words, the one that minimises the total system costs taking into account generation constraints and possible energy exchanges.
ANNEXES
Step 3: Hydro storage energy management
Step 1: Creation of annual time series for each parameter For each parameter, generation or retrieval of annual time series, with an hourly resolution is needed. The number of time series for each parameter is usually between 10 to 100 and can be increased if necessary.
The aim of this step is to assess and provide to the optimiser weekly hydraulic energy volumes to generate from the different reservoirs of the system, for each week of the current ‘Monte-Carlo’ year. To perform this pre-allocation, the module breaks down annual and/or monthly hydro storage energy into weekly amounts, through a heuristic based on: Net demand pattern (Load minus RES and mustrun generation) calculated from scenario data; Hydro management policy parameters: to define how net demand is weighted for energy dispatching from year to months and from month to weeks; Reservoir rule curves: to define minimal and maximal curves in order to constrain the dispatching of hydro energy and to define the maximal power variation with the variation of the reservoir level.
Step 4: Power schedule and Unit Commitment (UC) optimiser Two optimisation issues can be addressed in this process: adequacy or economy.
The economy study requires a market modelling in order to determine which plants are delivering power at a given time. This process is performed through the economic dispatch method where the aim is to minimise the operating cost of the overall system by considering classically a ‘perfect market’ competition (market bids are based on short-term marginal costs).
136
The model is used in many European projects and national assessments: — the PLEF adequacy study [ENT-6]; — the TwenTies project [TWT-1]; — e-Highway2050 [EHW-1]; — ENTSO-E’s TYNDP [ENT-3]; — RTE French Generation Adequacy Report [RTE-1].
Step 2: Creation of a ‘Monte-Carlo’ future state (year)
The adequacy study analyses if there is enough available generation power, following the given state of the system, to meet the demand, whatever the prices or costs involved. In other words, no market modelling is needed since the function that has to be minimised is the amount of load that has to be shed in the whole interconnected system.
NB: The spatial correlations and the correlation between the various renewable energy sources (wind, solar, hydroelectric) and the temperature are modelled. In other words, this means a selection of wind, solar, hydroelectric generationand thermo-sensitive consumption is performed for a given year, coming from one of the 34 historical weather scenarios.
For each parameter, a random selection of the associated series is performed. This selection can also be made according to user-defined rules (probabilistic/deterministic mixes).
The data selection process for each parameter provides an annual scenario called a ‘Monte-Carlo’ year (see Annex 7.3.1). This process is repeated several times (several hundred times) in order to obtain a set of ‘Monte-Carlo’ years representing a set of possible futures.
[h] [h]
LOAD
The Figure 132 explains those fenomenons looking to the residual load curves for the three scenarios in both 2030 and 2040 on a yearly basis.
system. Given
—
Due the large additions of RES (assuming a copperplate in Belgium (no local/internal congestions), a need for export or storage can be observed for 10% of the time in the RES scenario in 2030 and for more than 30% in 2040. In some hours those needs could excess 10 GW in DEC and RES in 2040.
Another effect on the residual demand (on an hourly basis) will be observed in the flexibility requirements to cope with large penetrations of renewables in the system. Figure 132 gives only a small indication on how could the residual load look during a typical day in winter, summer and inter-season for the three scenarios in 2040.
—
The Belgian residual load analysis allows to understand the need for generation/imports or for exports/storage in the the planned increase in intermittent renewable generation, the residual load will evolve in different manners: The hours with the highest demand are usually linked to low renewable infeed (winter, cold spell with low wind and no sunshine); Other periods will lead to a lower residual load driven by wind and sun during those hours; Low demand or large penetration of renewables will also lead to higher needs for exports, DSM or storage to evacuate, shift or store this generation.
Due to the intermittent character of wind and no sunshine during winter peaks, the residual demand to be covered by imports, DSM, storage, national generation in the most extreme hours (very cold, no wind) is >12 GW in 2030 (less than 0.1% of the hours of the year). Those hours are dimensionning the needed capacity for adequacy purposes. The wind and PV additions, lower the need for imports/generation for the rest of the year. The impact is higher for the wind than for PV given the daily pattern of the latter one.
137 ANNEXES RESIDUAL LOAD OF BELGIUM - ALL CLIMATE YEARS (FIG. 132) 1 3 2
—
7.4 ADDITIONAL RESULTS 7.4.1. BELGIAN
[GW] 10121486 -15-10101550-5[GW] BC2040 RES2040 DEC2040 BC2030 RES2030 DEC2030 0 1000 2000 3000 4000 5000 6000 7000 8000 0 10 20 30 40 50 60 70 80 90 100 312
Need for imports, or generate the energy Need for exports or store the energy RESIDUAL
[h] [h] [h]
138 Figure 133 was constructed based on the average of all climate years simulated. Looking at hourly results of individual climate years, large variations from hour to hour could be observed driven by wind patterns. ANNEXES AVERAGE HOURLY RESIDUAL LOAD FOR A WEEKDAY IN THE 3 SCENARIOS PER SEASON FOR 2040 (FIG. 133) [MW]demandResidual -4000-200020004000600080000 1 2 3 4 5 6 7 8 9 10 11 12 13 14 15 16 17 18 19 20 21 22 23 24 1 2 3 4 5 6 7 8 9 10 11 12 13 14 15 16 17 18 19 20 21 22 23 24 1 2 3 4 5 6 7 8 9 10 11 12 13 14 15 16 17 18 19 20 21 22 23 24 DEC RESBC Winter Interseason Summer
The following can be observed from the figure:
— In the ‘Base Case’ scenario, the PV is only slightly affecting the residual load given that a low penetration has been assumed. The peak residual demand is as nowadays observed in the evening during the winter;
— In the ‘Decentral’ scenario, the large penetrations of PV will lead to high needs for exports/storage/flexiblity during the day and require flexible generation to cope with the steepness of the profile. Higher electrification leads to a higher residual peak demand during winter (compared to the ‘Base Case’ scenario) as there is no sun during those periods; — In the ‘Large Scale RES’ scenario, the large amount of wind will lead to a decrease of the average daily residual profile. Note that wind has a more constant daily pattern than sun and is therefore impacting the average daily profile almost uniformely. The other patterns of the wind generation over multiple days are not captured in this figure. Steepness of the residual demand will also occur and linked to weather effects (weather fronts, storms, ...). Given that wind is, on average, blowing more during winter, the average residual peak demand in winter is lower than in the ‘Base Case’ and ‘Decentral’ scenarios. This does not exclude that there are moments with high consumption and very low wind infeed which are usually driving the adequacy requirements of the country.
139 7.4.2. BELGIAN CROSS-BORDER EXCHANGES The cross-border exchanges in three different situations in all scenarios and merit orders are shown in Figure 134. The three situations are: — CCGT: the needed new-built capacity is filled with only new CCGTs; — OCGT: the needed new-built capacity is filled with only new OCGTs; — CCGT and +4 GW interconnections: the needed new-built capacity is filled with only new CCGTs and additional 4 GW of interconnections with Belgium. IMPORTS/EXPORTS FOR BELGIUM IN EACH SCENARIO AND FOR DIFFERENT SENSITIVITIES (FIG. 134) [TWh][TWh][TWh] -50-40-30-20-10-50-40-30-20-10-50-40-30-20-10102030400403020100403020100 2030 2040 CCGT OCGT CCGT CCGT OCGT CCGT CCGT OCGT CCGT ‘coal-before-gas’ ‘gas-before-coal’ ‘coal-before-gas’ CCGT‘gas-before-coal’OCGTCCGT DECRESBC -37.0 -44.4 -43.5 -34.0 -43.7 -40.4 -29.6 -40.9 -35.8 -29.6 -40.7 -36.0-36.9-35.1 -28.0 -39.9-36.2 -31.1 -43.5-42.2 -36.7 -44.8-42.7-29.8-38.5 -34.8 -37.0 -27.2 -33.6 -33.4 -28.1 -32.4 -37.0 -28.0 -32.0 -36.831.518.422.4 31.8 18.422.520.7 10.814.719.3 11.112.47.6 5.9 13.3 11.3 6.8 17.5 16.6 12.8 24.5 20.1 13.1 27.821.97.215.315.8 6.410.3 18.7 5.012.612.64.27.0 +4 GW +4 GW +4 GW +4 GW importsexports ANNEXES
7.4.3. RES
CO2 and fuel price levels on the ‘Base Case’ scenario, revenues are very close to the investment costs annuities. The PV revenues remain below the needed annuity and fixed costs. PV combined with storage devices could increase the business case by storing part of the energy when prices are low and releasing it after the sunset for example. It is important to note that the revenues were calculated assuming that the devices are curtailed iwhen the prices are negative (which might not be the case nowadays given the support mechanisms in place not favouring such behaviour). REVENUES
ANNEXES
The revenues for PV and wind from the wholesale market are shown in Figure 135, Figure 136 and Figure 137. With the expected decrease of renewables LCOE and increase in wholesale prices (driven by a higher CO2 price and gas prices), some new RES built projects could get sufficient revenues from the wholesale market to cover their investments costs. This trend is also observed in the current renewable market. In all scenarios, the wind revenues (both in offshore and onshore) are sufficient to recover the investment costs in 2030 and 2040. When applying a sensitivity with the current
140 Annuity + 6%/9%/12%FOM Price range for BE with the same fuel and CO2 prices as today: - ≈5€/tCO2 - ≈15 €/MWh gas - ≈60 €/ton coal Note that the revenues are calculated excluding negative prices (unit is therefore curtailed in such situations). REVENUES FOR PV IN THE WHOLESALE MARKET IN BELGIUM COMPARED TO FIXED COSTS (FIG. 135) [€/kW]inRevenues 100120140160180806040200 Legend P10P50P90 2030 2040 G2C G2C G2C G2C G2C G2CC2G C2G C2G C2G C2G C2G BC BCRES RESDEC DEC
141 REVENUES FOR WIND ONSHORE IN THE WHOLESALE MARKET IN BELGIUM COMPARED TO FIXED COSTS (FIG. 137) Price range for BE with the same fuel and CO2 prices as today: - ≈5€/tCO2 - ≈15 €/MWh gas - ≈60 €/ton coal Note that the revenues are calculated excluding negative prices (unit is therefore curtailed in such situations). [€/kW]inRevenues 100150200250500 Legend P10P50P90 2030 2040 G2C G2C G2C G2C G2C G2CC2G C2G C2G C2G C2G C2G BC BCRES RESDEC DEC Annuity + 6%/9%/12%FOM Price range for BE with the same fuel and CO2 prices as today: - ≈5€/tCO2 - ≈15 €/MWh gas - ≈60 €/ton coal Note that the revenues are calculated excluding negative prices (unit is therefore curtailed in such situations). Annuity + 6%/9%/12%FOM REVENUES FOR WIND OFFSHORE IN THE WHOLESALE MARKET IN BELGIUM COMPARED TO FIXED COSTS (FIG. 136) [€/kW]inRevenues 100150200250300350500 Legend P10P50P90 2030 2040 G2C G2C G2C G2C G2C G2CC2G C2G C2G C2G C2G C2G BC BCRES RESDEC DEC ANNEXES
142 — Germany is cheaper than Belgium in ‘Base Case’ and ‘Decentral’ in 2030. In the rest of the scenarios, Belgium is cheaper which is linked to the key position of the country benefitting from the diversified energy mix (wind, PV, nuclear,...) of its other neighbours (GB and FR);
— More grid investments are beneficial for market integration. Additional corridors allow the countries to share the excess of renewables and enhance the price convergence by utilising the optimal resources in each region. BETWEEN BELGIUM AND ITS
— In the future, GB average wholesale price could become cheaper than the continent if no additional reinforcements are planned between GB and the rest of Europe. This is mainly driven by additions of wind generation planned in GB. In some scenarios, this difference is above 10 €/MWh. The ‘GRID+’ sensitivity shows how additional grid investments between European countries will attenuate this spread;
7.4.4. WHOLESALE MARKET PRICE DIFFERENCE
2030 2040 Average price difference in €/MWh between the other countries and Belgium WHOLESALE MARKET PRICE DIFFERENCE BETWEEN THE OTHER COUNTRIES AND BELGIUM IN THE DIFFERENT SCENARIOS IN THE MOST OPTIMAL SETTING - ‘GAS-BEFORE-COAL’ (FIG. 138) (negative = price in the neighbouring countries is lower) -2.4 +4.6 -4.5 -2.5 -14.3 +11.2 +4.7 -1.2 +5 +8.7 +2.8 0.5 RES Grid+ -10.5 -5.6 -2 -1.7 -11.5 -4.1 +1.4 -1.7 -2.3 -19.4 +1.8 +2.4 DEC Flex+ -0.7 -2.2 -1.7 -1.2 -20.8 +2.4 0 -1.8 BC Future price differences between Belgium and its neighbours will depend on the energy mix of the neighbouring countries. With the increase of RES, more differences might appear depending on the pace of penetration of (close to) zero marginal cost renewables in the system. Given the assumptions considered for each country, we can observe that:
— The Netherlands stays in the range of Belgian prices. Depending on the scenario, spreads up to 2 €/MWh on average are observed.
— Additional flexibility in the system will reduce the spreads between the countries. It could reduce the price in southern countries with a large penetration of decentral generation by storing the surplus during the day and releasing it after sunset. The effect of Spain and Italy on France can be observed when comparing the ‘FLEX+’ scenario to the ‘Decentral’ scenario;
NEIGHBOURS ANNEXES
— In a ‘Decentral’ scenario, France might become even cheaper relying on more PV (with a higher load factor than in northern countries) and benefitting from the increase in its neighbours (Spain, Italy). In the ‘Large Scale RES’ scenario, the inverse trend is observed as northern countries are relying on wind and are hence cheaper than France. The nuclear phase-out in France will also be a key driver for the wholesale price in the country;
143 7.4.5. TOTAL INVESTMENT COSTS AND MARKET WELFARE DIFFERENCE BETWEEN SCENARIOS IN 2040 TOTAL ANNUALISED FIXED COSTS OF THE SYSTEM (EXISTING UNITS AND NEW INVESTMENTS NEEDED) FOR 2040 (FIG. 139) Existing units fixed Investmentcostscostswith9%WACCTOTAL 0.9 B€/year [M€]capacitynewforyearpercostsFixed 10002000300040005000600070000 BC ≈1.8 B€/year ≈2.7 B€/year 1100460280300930 2370930 930 1030610670 25101090660710 DEC ≈4 ≈4.9B€/yearB€/year RES ≈4.3 B€/year ≈5.2 B€/year Cost of Capital 12% Cost of Capital 9% Cost of Capital 6% Overnight costs per year Existing units fixed costs SPLIT OF ANNUALISED INVESTMENTS COSTS PER TECHNOLOGY TYPE FOR 2040 FOR BELGIUM (FIG. 140) [M€]capacitynewforyearpercostsFixed 100015002000250030003500400045005000 DEC RESBC New thermal New offshore wind New onshore wind New PV New interco New pumped-storage New storage DSM New DSM/storageinterco/NewRESNewthermal
For 2040, similar total welfare gains as for 2030 are observed in ‘Decental’ and ‘Large Scale RES’ compared to ‘Base Case’ but different dynamics are driving those gains: — in the ‘Large Scale RES’ scenario, the wholesale prices are structurally lower driven by wind generation. The consumer surplus gain is around 3.600 M€/year. The producer surplus loss is around 2.700 M€/year. The net gain is around 900 M€/year; — in the ‘Decentral’ scenario, flexibility options are flattening the wholesale prices which attenuates the effect when renewables are marginal (surplus of energy is shifted to other periods of the day). Additionally, the ‘Decentral’ scenario relies on more flexibility options for adequacy which leads to higher prices during peak demand. As seen on Figure 111, the wholesale price is much more volatile than the ‘Base Case’ and for certain, simulated years, it is even higher than the in the ‘Base Case’. This leads to a lower consumer surplus by around 250 M€/year. On the other hand, renewable energy captures more revenues and in some years, thermal generation aswell, which leads to a gain of around 1.000 M€/year. It results in a net gain of around 800 M€/year.
MARKET WELFARE GAIN/LOSS FOR PRODUCERS AND CONSUMERS IN THE ‘DECENTRAL’ AND ‘LARGE SCALE RES’ SCENARIOS COMPARED TO THE BASE CASE IN 2040 (FIG. 141) [M€]inchangeWelfare -2000-100010002000300040000 Total comparedwelfaretoBC Producer'ssurpluschange Consumer'ssurpluschange Producer'ssurpluschange Consumer'ssurplus change ≈800 M€/year ≈900 M€/year LOSSGAIN DEC RES -2750 3680 1040 -230 Storage surplus was included in the producer's surplus while congestion rents included in the consumers surplus ANNEXES The total investments costs (existing units fixed costs) and new-built generation, demand response, interconnection and storage for each scenario are shown on Figure 139.
144 Comparing the difference in annuities and the market welfare between scenarios for 2040, indicates that the cost for the ‘Decentral’ and ‘Large Scale RES’ scenarios are not fully COST-BENEFIT ANALYSIS BETWEEN THE SCENARIOS - 2040 (FIG. 142) DEC RESBC ≈1.8 B€/year ≈4 B€/year ≈4.3 B€/year ≈0.8 B€/year ≈0.9 B€/year Existing units fixed investmentAdditionalcostscostsWelfaregaincomparedtoBCTOTAL 2.7 B€/year 4.1 B€/year 4.3 B€/year Fixed costs needed to keep the existing units from 2020 running in 2040 in Belgium Additional investment costs from 2020 with 9% SumWACCofproducer, consumer and congestion rents for Belgium compared to the BC Thescenariototal is the sum of additional invest ments needed, fixed costs of existing units where the welfare gain compared to the BC has been deducted for DEC and RES. 0.9 B€/year ANNEXES compensated by the welfare gain. This conclusion is highly dependent on the evolution of the CAPEX costs of onshore and offshore wind, PV and batteries.
145 ABBREVIATIONS 08

ABBREVIATIONS146 — GRID+: Large Scale RES scenario with additional intercon nection capacities between countries — GT: Gas Turbine — HP: Heat pump — HVDC: High Voltage Direct Current — LCOE: Levelised Cost Of Electricity — LOLE: Loss Of Load Expectation — LOLE95: Loss Of Load Expectation for a statistically abnor mal year (95th percentile) — MAF: Mid-term Adequacy Forecast — NCDC: National Climatic Data Center — NS: North south corridor — NTC: Net Transfer Capacity — OCGT: Open Cycle Gas Turbine — PECD: Pan-European Climate Data Base — PLEF: Pentalateral Energy Forum — PSP: Pumped-storage station — PST: Phase Shifting Transformer — PV: Photovoltaic — RES: Renewable Energy Sources or ‘Large Scale RES’ scenario — RoR: Run-of-river — RTE: Réseau de Transport d’Electricité (French transmission system operator) — SO&AF: Scenario Outlook and Adequacy Forecast — SR: Strategic Reserves — TSO: Transmission System Operator — TYNDP: Ten Year Network Development Plan — UC: Unit Commitment — VOM: Variable Operations & Maintenance costs of a unit — WACC: Weighted Average Cost of Capital — ANTARES: A New Tool for Adequacy Reporting of Electric Systems — BC: Base Case scenario — C2G: ‘coal-before-gas’ merit order — CAPEX: Capital Expenditude — CCGT: Combined Cycle Gas Turbine — CCS: Carbon Capture Storage — CEER: Council of European Energy Regulators — CHP: Combined Heat & Power — CIPU: Contract for the Injection of Production Units — CM: Capacity Market — CRE: Commission de Régulation de l’Energie (French regu lator) — CREG: Commission for Electricity and Gas Regulation — CRM: Capacity Remuneration Mechanisms — CWE: Central West Europe — DEC: Decentral scenario — DSM: Demand Side Management — ENTSO-E: European Network of Transmission System Oper ators for Electricity — ENS: Energy Not Served — EOM: Energy-Only Market — ETS: European Trading System — EU22: 22 European countries defining the perimeter of the study — EV: Electric Vehicle — EW: East West corridor — FES: Future Energy Scenarios — FLEX+: Decentral scenario with additional flexibility of demand — FOM: Fixed Operations & Maintenance costs of a unit — FPS: Federal Public Service — G2C: ‘gas-before-coal’ merit order
147 ANDBIBLIOGRAPHYREFERENCES 09

— [ENT-1]:
—
— [ENT-3]: Methodology.pdfhttps://www.entsoe.eu/Documents/TYNDP%20documents/entsos_tyndp_2018_Scenario_Report_ANNEX_II_ — [ENT-4]: https://www.entsoe.eu/Documents/News/170530_Managing_Critical_Grid_Situations-Success_and_Challenges.pdf — [ENT-5]: approved%20by%20the%20European%20Commission%20on%204%20February%202015.pdfhttps://www.entsoe.eu/Documents/SDC%20documents/TYNDP/ENTSO-E%20cost%20benefit%20analysis%20 — [ENT-6]: https://www.entsoe.eu/publications/system-development-reports/outlook-reports/Pages/default.aspx — [EPA-1]: https://www.epa.gov/ghgemissions/understanding-global-warming-potentials — [EUC-1]: https://ec.europa.eu/clima/policies/strategies/2050_en — [EUC-2]: http://ec.europa.eu/archives/commission_2010-2014/hedegaard/headlines/topics/docs/com_2011_112_en.pdf — [EUC-3]: c3cc-4eff-a500-a30fa2c0535http://ec.europa.eu/eurostat/documents/38154/4956088/Average-share-electricity-renewables-2015.pdf/711d21d5-
— [ECI-1]: http://www.roadmap2050.eu/attachments/files/EnergySavings2020-FullReport.pdf [ECL-1]: https://europeanclimate.org/power-perspectives/ [EEA-1]: https://www.eea.europa.eu/data-and-maps/indicators/greenhouse-gas-emission-trends-6/assessment — [EHW-1]: http://www.e-highway2050.eu/e-highway2050/ [ELI-1]: the-volume-for-winter-2018-2019http://www.elia.be/fr/a-propos-elia/publications/Consultation-publique/Strategic-Reserve-input-data-for-determining— [ELI-2]: http://www.elia.be/~/media/files/Elia/users-group/Working-Group-Balancing/TF_Strategic_Reserves/E-CUBE_Elia_ Market_Response_TF.pdf
—
BIBLIOGRAPHY148 AND REFERENCES — [AGO-1]: 80%99s++Energiewende/https://www.agora-energiewende.de/en/topics/-agothem-/Produkt/produkt/86/12+Insights+on+Germany%E2% — [AMP-1]: https://www.netzentwicklungsplan.de/en/grid-development-plans/grid-de-vel-op-ment-plans-2030-2017 — [BEL-1]: http://www.belspo.be/belspo/organisation/publ/pub_ostc/AP/rAP42sum_nl.pdf — [BXE-1]: http://document.environnement.brussels/opac_css/elecfile/IF_Energie_ER12_Part_FR.PDF — [CBM-1]: https://www.canadianbiomassmagazine.ca/pellets/growing-demand-for-pellets-6074 — [CEE-1]: https://www.ceer.eu/documents/104400/-/-/a9517a5f-5a98-2974-dd61-e085c7971b53 — [CLV-1]: http://www.my2050.be/2050/en-be/scenario-analysis/ — [CTW-1]: pdf?ID=13096&saveFilehttp://clusters.wallonie.be/servlet/Repository/potentiel-d-energies-renouvelables-en-region-wallonne. — [DER-1]: http://deredactie.be/cm/vrtnieuws/binnenland/1.2900900
—
— [ENT-2]:
—
—
—
—
—
—
—
—
—
— [ELI-3]: http://www.elia.be/~/media/files/Elia/users-group/Taskforce%20Strat%20Reserve/20151008_TF_iSR-Public-ReportPoyry.pdf [ELI-4]: http://www.elia.be/~/media/files/Elia/users-group/20160922%20Users%20Group%20Plenary%20Meeting/20160922_ UG_TFiSR2016_PublicReportP%C3%B6yry_summary.pdf [ELI-5]: http://www.elia.be/~/media/files/Elia/publications-2/investment-plans/8343_studie_onthaalcapaciteit_v9.pdf [ELI-6]: http://www.elia.be/~/media/files/Elia/publications-2/studies/160421_ELIA_AdequacyReport_2017-2027_FR.pdf [ELI-7]: http://www.elia.be/fr/grid-data/grid-development/plans-d-investissements/federal-development-plan-2015-2025 — [ELI-8]: http://www.elia.be/nl/projecten/netprojecten/brabo [ELI-9]: http://www.elia.be/fr/projets/projets-reseau/alegro/alegro-content [ELI-10]: http://www.elia.be/~/media/files/Elia/publications-2/Rapports/Elia-view-on-Belgium-Energy-Vision-for-2050-EN.pdf [ELI-11]: http://economie.fgov.be/nl/binaries/Analyse_Elia_periode_hivernale-2017_2018_tcm325-281832.pdf [ELX-1]: http://eur-lex.europa.eu/legal-content/EN/TXT/?uri=CELEX%3A52014XC0628%2801%29 [ENG-1]: http://corporate.engie-electrabel.be/fr/actualite/coo-une-solution-de-stockage-a-grande-echelle-et-flexible/ [ENG-2]: http://corporate.engie-electrabel.be/wp-content/uploads/2017/09/kcd_ltod12_e_schets_05.pdf http://tyndp.entsoe.eu/tyndp2018/ https://www.entsoe.eu/outlooks/maf/Pages/default.aspx
—
— [FPB-1]: http://www.icedd.be/I7/mediatheque/energie/renouvelable/130419_Backcasting_FinalReport.pdf [FPS-1]: http://www.my2050.be/2050/files/8113/8383/9011/14_Energy.pdf
— [EUC-9]: http://ec.europa.eu/archives/commission_2010-2014/hedegaard/headlines/topics/docs/com_2011_112_en.pdf
—
— [EUC-11]: https://ec.europa.eu/energy/en/topics/renewable-energy/national-action-plans
— [GRP-1]: http://www.greenpeace.org/belgium/Global/belgium/report/2015/GP_Rapport_Biomass_FR_def.pdf
—
—
—
— [NSC-1]: https://www.naturalsciences.be/fr/news/item/5670
— [EUC-7]: https://ec.europa.eu/energy/en/topics/energy-efficiency/energy-efficiency-directive
149 — [EUC-4]: d9a28cb8beeahttp://ec.europa.eu/eurostat/documents/2995521/7905983/8-14032017-BP-EN.pdf/af8b4671-fb2a-477b-b7cf— [EUC-6]: http://www.climact.com/sites/default/files/euc_report-web.pdf
— [IEA-1]: https://www.iea.org/publications/freepublications/publication/Global_EV_Outlook_2016.pdf [IEA-2]: https://www.iea.org/publications/scenariosandprojections/
— [IEA-3]: http://www.iea.org/newsroom/news/2016/november/world-energy-outlook-2016.html
—
—
BIBLIOGRAPHY AND REFERENCES
— [GOV-1]: =loi&sql=dt=%27loi%27&tri=dd+as+rank&rech=1&numero=1http://www.ejustice.just.fgov.be/cgi_loi/loi_a.pl?language=fr&caller=list&cn=2003013138&la=f&fromtab
— [PLN-1]: http://www.plan.be/admin/uploaded/201310310806140.WP_1307.pdf
— [PLN-2]: http://www.plan.be/admin/uploaded/201702231020450.CBA_2017.pdf [RTB-1]: https://www.rtbf.be/info/belgique/detail_doel-1-et-2-voici-la-convention-de-prolongation?id=9153754 [RTE-1]: http://www.rte-france.com/sites/default/files/bp2016_complet_vf.pdf [RTE-2]: http://antares.rte-france.com/ [SCD-1]: http://www.sciencedirect.com/science/article/pii/S0360544215002212 [SIA-1]: http://energy.sia-partners.com/demand-response-study-its-potential-europe [SIB-1]: https://www.sibelga.be/en/connections-and-meters/electric-car/charging-times
—
—
—
—
—
— [EUC-10]: https://ec.europa.eu/clima/policies/ets_en
— [GPE-1]: http://www.greenpeace.org/belgium/fr/G-Mag/Gmag-20/Les-limites-de-la-biomasse/
—
— [IPC-1]: https://www.ipcc.ch/publications_and_data/ar4/wg1/en/ch2s2-10-2.html
— [OBS-1]: http://economie.fgov.be/fr/binaries/chiffres_cles_2015_energie_tcm326-282790.pdf
— [EUC-12]: https://ec.europa.eu/energy/en/topics/energy-strategy-and-energy-union/2050-energy-strategy — [EUC-13]: https://setis.ec.europa.eu/system/files/ETRI_2014.pdf
—
— [LEG-1]: legislature=14https://www.legifrance.gouv.fr/affichLoiPubliee.do?idDocument=JORFDOLE000029310724&type=general& — [LEM-1]: nucleaires_5158321_1653054.htmlhttp://www.lemonde.fr/energies/article/2017/07/10/nicolas-hulot-annonce-qu-il-faudra-fermer-jusqu-a-17-reacteurs[LES-1]: geothermie-profonde-est-au-tophttp://www.lesoir.be/578264/article/demain-terre/energie/2014-06-20/production-d-electricite-et-chaleur— [MCK-1]: https://www.mckinsey.com/business-functions/sustainability-and-resource-productivity/our-insights/pathways-toworld-class-energy-efficiency-in-belgium [NBB-1]: https://www.nbb.be/doc/ts/publications/creg/rapport.pdf [NCD-1]: ncdc.noa.org.gob https://www.ncdc.noaa.gov/ [NEM-1]: http://www.nemo-link.com/fr/ [NEP-1]: https://www.netzentwicklungsplan.de/en [NGR-1]: http://fes.nationalgrid.com/media/1281/forecourt-thoughts-v12.pdf [NOS-1]: https://nos.nl/artikel/2197308-dit-is-wat-je-moet-weten-over-het-regeerakkoord.html
—
— [EUC-8]: https://ec.europa.eu/energy/sites/ener/files/documents/2012_energy_roadmap_2050_en_0.pdf
— [KOT-1]: http://www.keepontrack.eu/contents/publicationsscenarioreport/kot--2030-res-targets-for-europe.pdf
—
150 — [SPF-1]: http://statbel.fgov.be/fr/statistiques/chiffres/circulation_et_transport/circulation/parc/ — [TEN-1]: Monitoring_Leveringszekerheid_2014-2030.pdfhttps://www.tennet.eu/fileadmin/user_upload/Company/Publications/Technical_Publications/Dutch/Rapport_ — [TWT-1]: http://www.twenties-project.eu/ — [WEU-1]: http://www.ewea.org/fileadmin/files/library/publications/reports/EWEA-Wind-energy-scenarios-2030.pdf — [ZAP-1]: https://www.zap-map.com/charge-points/connectors-speeds/ BIBLIOGRAPHY AND REFERENCES
Responsible editor: Patrick De Leener Elia – Boulevard de l’Empereur 20 1000 Brussels, Belgium www.elia.be Concept and layout: Chriscom
Discover the online version on: www.elia.be
