
5 minute read
OUR ESG POSITIONING


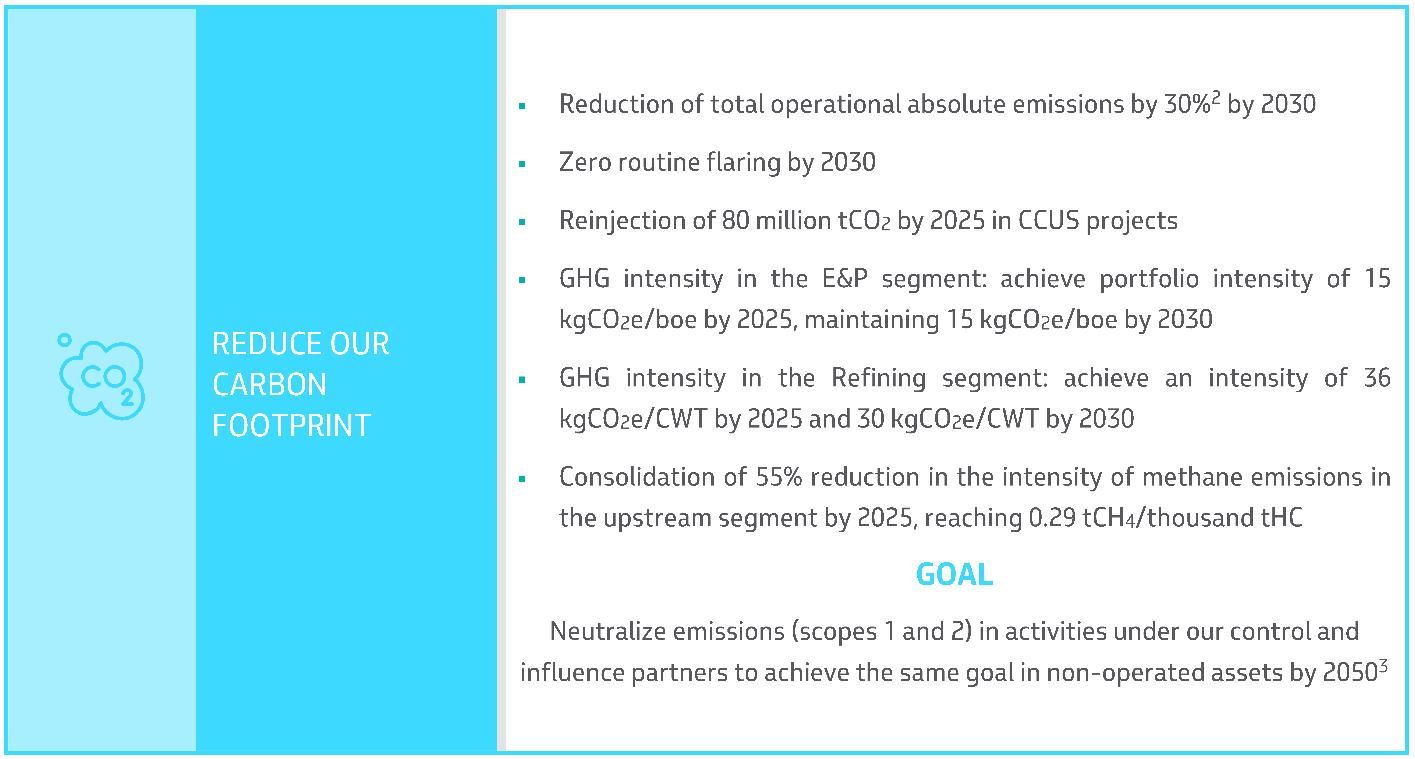
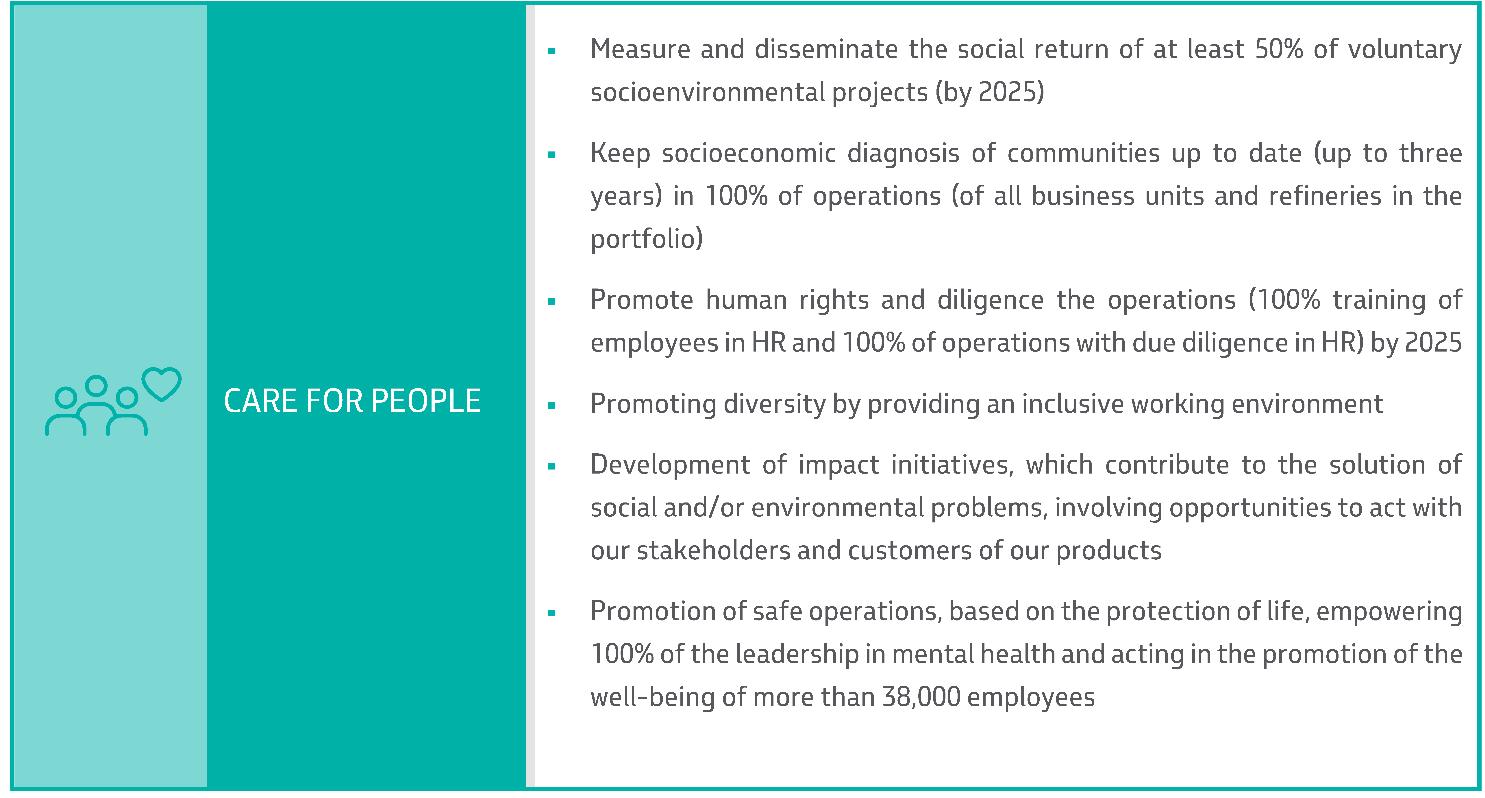
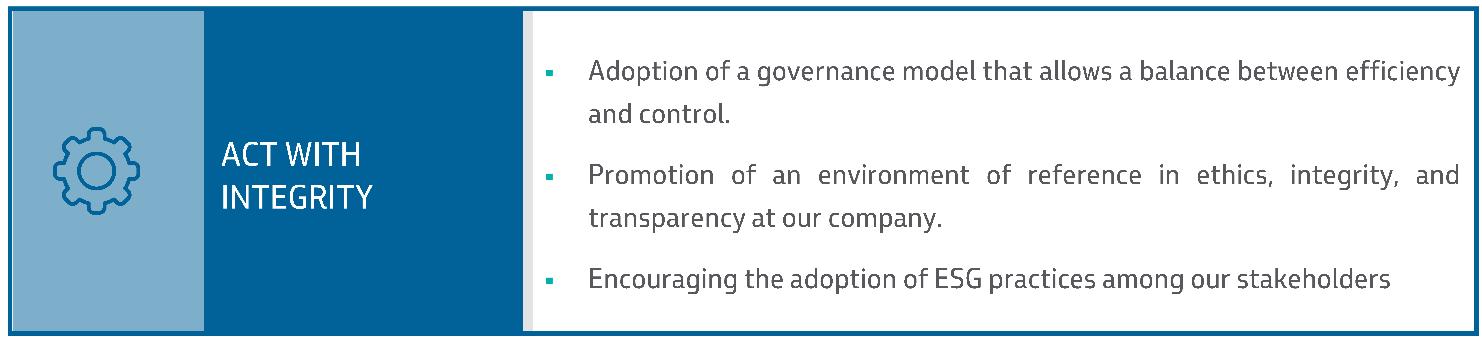
The commitments related to each of the four main ideas of the mandala were consolidated into a single list, in line with the concept of integrated ESG1: 2 3
—
1 The commitments that indicate a reduction percentage are based on 2015.
2 Regarding absolute emissions, Petrobras' commitment seeks to maintain the level of emissions in 2030 in relation to 2022 when we consider the emissions related to the average thermoelectric dispatch of the last 5 years in this year's projection. Petrobras' commitment is not to exceed 54.8 million tons of CO2 in 2030, unless there is a strong demand for electricity generation from thermal plants due to national water stress events. Achieving this commitment considers the possibility of using carbon credits as a complementary strategy and depends on actions to gain efficiency and divestments provided for in SP 2023-27.
3 Our ambition refers to emissions within Brazilian territory, where more than 97% of our operational emissions occur. For the other emissions, we also aim for neutrality within a period compatible with the Paris Agreement, in line with local commitments and international organizations.

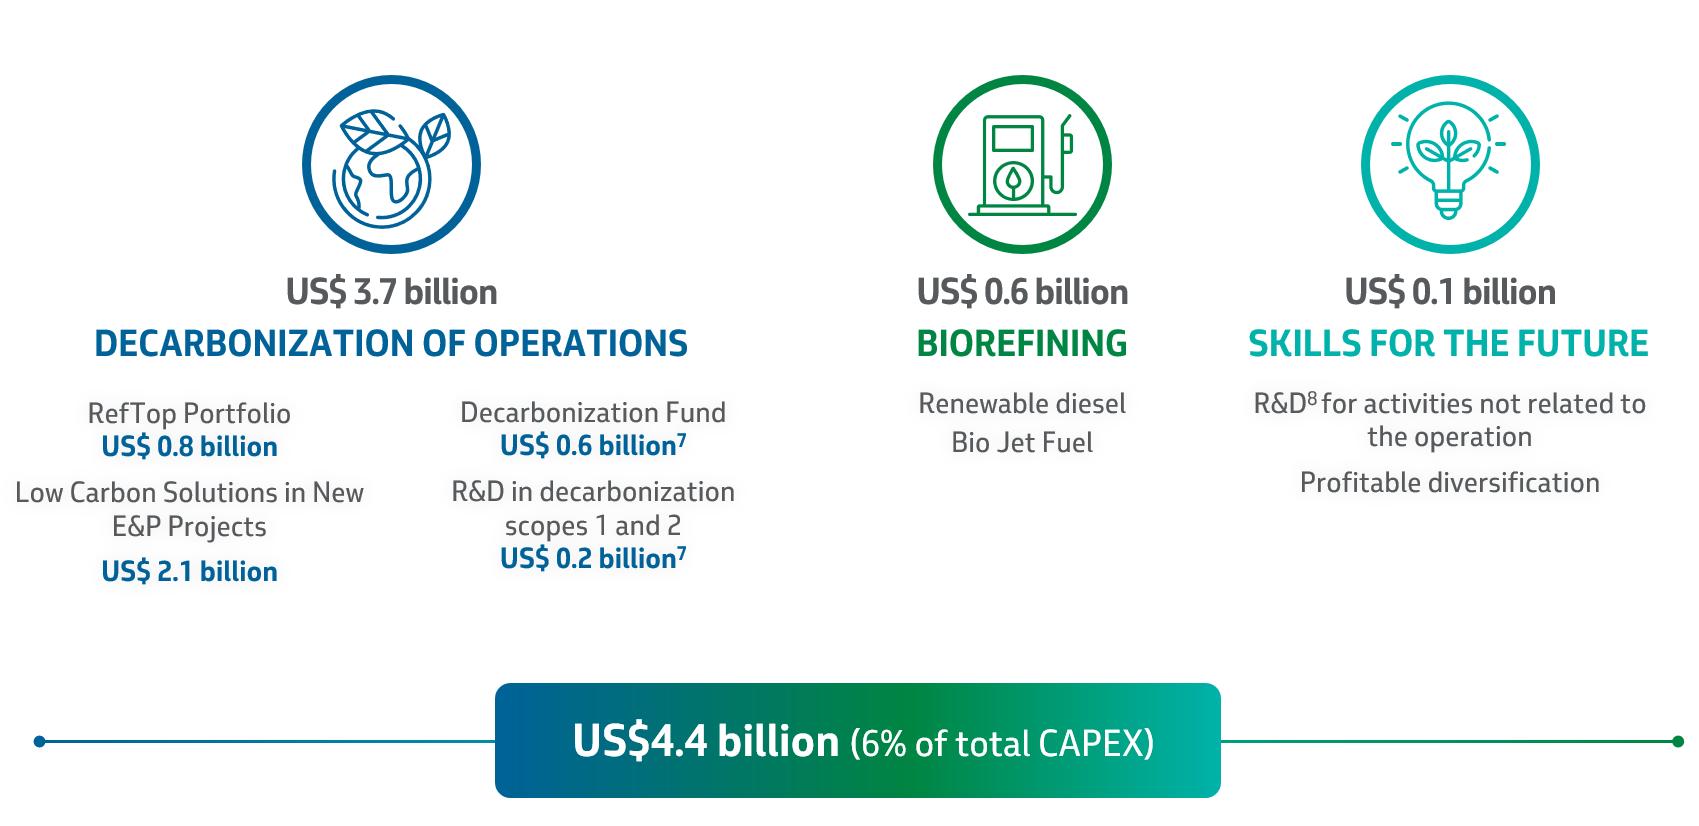
Seeking to reinforce the decarbonization initiative, our SP 2023-27 brings important elements that reinforced our sustainability agenda and low carbon positioning, allocating Capex6 of USD 4.4 billion: Note 78
The planned budget for the Decarbonization Fund in SP 2023-27 is USD 600 million over the five-year period, representing a significant growth compared to the previous plan, which was USD 248 million. Moving forward in initiatives aimed at profitable diversification, SP 2023-27 adds the businesses that were indicated by a multicriteria analysis, among several studied, as the most suitable for the company. We determined to deepen studies in the new businesses of offshore wind, hydrogen, and carbon capture, in addition to the continuity of biorefining efforts.
6 Acronym in English for expenses or investments in capital goods.
7 Expenditures classified as Capex can be allocated as Opex (operational expenditure) for amounts related to the decarbonization fund and spending on research and development (R&D).
8 The expected expenses for the low carbon portfolio correspond to 10% of the total R&D budget, which depend on the legal obligation.
MAIN SUSTAINABILITY METRICS9 (consolidated)
Actual result was above the volume leaked in 2021 (11.6 m3) and 82% above the warning limit established for 2022
Actual result 9.1% less than the emission intensity goal established for 2022
In July 2022, we signed a credit line with sustainability commitments (Sustainability-Linked Loan - SLL) in the amount of USD 1.25 billion and maturing in July 2027. The contract was made with Bank of China, MUFG and The Bank of Nova Scotia, with competitive costs compared to market benchmarks, and with incentive mechanisms for achieving sustainability commitments, based on GHG intensity indicators in E&P and Refining; and on the methane intensity indicator in the upstream segment.
This is the first time that Petrobras received financing associated with corporate sustainability goals, which reinforces the company's focus on decarbonizing its operations and expands its liability management strategy through the diversification of financing models, in line with sustainability requirements increasingly present in the debt markets.
9 Fatalities and TAR (Injury Rate per million man-hours) data include Petrobras Parent Company, Libra, Petrobras Bolivia S.A. (PEB), Petrobras International Braspetro B.V. – Sucursal Colombia (GDP-COL) and Transpetro. Emission data considers all companies that we have operational control over.
10 Leaked volume of oil and oil products. The volumes of oil and oil products leaked related to our operation are computed (not including clandestine deviations) of all occurrences with account for a volume leaked above one barrel (0.159m3) and that have reached water bodies or non-waterproofed soil.
11 Intensity of Greenhouse Gas Emissions
12Considering the unique profile of GHG emissions during the commissioning process of new E&P units, which do not represent the intrinsic performance of these units in full operation, as of 2023 the indicator of the E&P segment that will be part of our top metric will refer to the intensity of GHG emissions from currently implemented units (IGEE E&P Implemented Units). For 2023, the target for IGEE E&P Implemented Units is 15.04 kgCO2e/boe. The IGEE E&P indicator of the total portfolio, related to our history and commitment to sustainability, will be maintained and we will also start to monitor the GHG emissions performance of the new units only (IGEE E&P New Units). In this sense, we increased the transparency on the performance of the E&P segment by monitoring two new metrics.
MAIN ECONOMIC AND GOVERNANCE INDICATORS (consolidated)
—
13As of 2019, the unit of measurement of gas production is thousands of barrels of oil equivalent per day (Mboed)
14 We changed our free cash flow metric was to reflect the new Shareholder Compensation Policy, approved in 2021, and now includes net cash generated by operating activities less acquisition of property, plant and equipment and intangible assets. 2020 free cash flow has been recalculated based on changes in this metric for comparative purposes only and does not affect past dividends. The values for the years 2018 to 2019 were not recalculated and are presented considering the metric in force at the time of its calculation.
15The effects of the adoption of IFRS 16 occurred as of January 1, 2019, when the rule went into effect.
16In 2019, the amount includes the signing bonus of BRL 68,612 million for the acquisition of the Onerous Cession. In 2022, the amount includes a signing bonus of BRL 4,242 MM for the Sépia and Atapú fields.
17Net Debt/ (Net Debt + Market Cap)
18Excluding employees on long-term leave or assigned to other corporate holdings and external entities, the percentage is 99.7%. This data covers only employees of Petrobras Parent Company (including those assigned to subsidiaries).
19 Data from Petrobras Parent Company.
MAIN ENVIRONMENTAL INDICATORS (consolidated)
20 Revised 2021 value after third-party certification completed in July 2022, from 0.33 tCH4/mil tHC to 0.32 tCH4/mil tHC.
21Data from Petrobras Parent Company, Libra and Transpetro. The number of units with prepared PABs was maintained, however, the percentage of progress was revised due to the addition of units in the forecast for the preparation of plans, with the inclusion of those operated by our subsidiary Transpetro. The PABs expected to be prepared in 2022 were not carried out due to the need for a new bidding process, which was concluded at the end of the year. For 2023, our goal is to prepare (or revise) 36 PABs, when we will reach approximately 60% of our ESG Commitment in Biodiversity.
—
22 Some numbers have coverage specifics, as indicated.
23 Data from Petrobras Parent Company, Libra, PEB, PIB- COL and Transpetro
24 Until 2021 the number was just for the Petrobras Parent Company.
25 Business, Science and Technology.

26 The percentage considers the cumulative number of projects measured from 2019 onwards by the number of projects in the portfolio on December 31 of each year. Data from Petrobras Parent Company.
27 Until 2019 the number was just for the Petrobras Parent Company.
28 In the 2020 Sustainability Report, the numbers of employees and respective percentages were only from the Petrobras Parent Company In the current report we present the data including the subsidiaries in Brazil and abroad. Data prior to 2021 were adjusted considering this scope.
29 Self-declared employees of black or brown color/race, not including employees of contracted companies who work on the company's premises. In the 2020 Sustainability Report, the number of employees and respective percentages were only for Petrobras Parent Company. In 2021, we present data for the parent company and subsidiaries in Brazil. Data prior to 2021 were adjusted considering this scope. For cultural reasons in some countries, the information for 2018, 2019, 2020 and 2021 could not be obtained and consolidated, including the subsidiaries abroad. The 2022 numbers consider data from the Parent Company, subsidiaries in Brazil and subsidiaries abroad (Petrobras Netherlands B.V., Petrobras America INC., Petrobras Singapore Limited, Petrobras Operaciones S.A., Petrobras Oil & Gas B.V. – Turkey branch, Petrobras International Braspetro B.V.). For cultural reasons in some countries, this information cannot be obtained and consolidated for all companies abroad.
30 Until 2020 the number was just for the Petrobras Parent Company.


