5 minute read
03 Speed of Sound in Liquid


Speed of Sound
03 Speed of Sound in Liquid
Read
Sound travels faster through water than air. In this experiment you will try to measure the speed of sound in water. The experiment uses a simple container part filled with water. The method used is essentially the same as that used to determine the speed of sound in air, i.e. two microphones separated by a known distance. For convenience, one sensor is mounted on the outside surface of the container. The second sensor is placed in a water (and leak) proof bag which can be attached to the internal opposite facing surface of the container. With care, the second sensor can be positioned very close to the wall of the container, when the water is added to the apparatus the pressure of the water will help hold the sensor against the side of the container and press the enclosing bag against the sensor and microphone.
Polythene bag
Sensor 2 (connect to input 2) Direction of sound wave
Water Sensor 1 (connect to input 1)
Hit side of container here
Warning
The experiment works well and will show the speed of sound in water. The Stethoscope sensor is not water proof. It is the responsibility of the user to ensure that water does not come into contact with the sensor or logger. No liability can be accepted by Data Harvest for failure to take note of this warning.
What you need
1. An EASYSENSE logger capable of fast logging 2. 2 x Smart Q Stethoscope sensors set to Sound range with diaphragm removed. 3. 1 x Smart Q Temperature sensor or thermometer. 4. Large container at least 0.5 m long. 5. Polythene bag (without holes or damage i.e. both leak and water proof). 6. 2 x long sensor cables. 7. Masking tape, modelling clay or sticky tape (to attach bag and sensors to walls of containers).
Speed of Sound
What you need to do
1. Set up the apparatus as shown in the diagram. Fix sensor one to the outside of the container with the bell in contact with the outside wall of the container. Make sure the sensor is not touching the bench. To help when filling the container keep the sensor as low down on the container wall as possible, this will reduce the volume of water required. 2. Place the second sensor into a large polythene bag and fix the bag to the opposite inner wall of the container. The bell of the stethoscope should be facing the opposite wall of the container. 3. Check the bag is secured to the container, and that the opening of the bag is above the projected water level inside the container. 4. Fill the container with water, use enough to give a level of water above both of the sensors only. Check that as the water is added, the bag is not leaking and that the bag is pressing against the sensor. If a leak is noticed remove the bag at once, the sensor is not waterproof. 5. Start the EASYSENSE software and select Graph from the Home screen. 6. Use the set up table below to set the recording parameters. (Note: The value of the trigger may need adjusting). 7. Select Start and then tap on the wall of the container close to sensor 1 (the external sensor). A clear sharp sound is best; experience will show the best sound and how loud it needs to be. 8. If the sound was of the correct intensity logging will be triggered and you will see 2 traces. The red trace is the sound recorded by the sensor closest to the noise and the blue trace for the sensor furthest from the noise source. 9. You should notice the peaks on the red trace appear before the peaks on the blue trace. You need to measure the distance between the first red peaks and the first blue peaks, using the Interval tool (see below for details).
Set up of the software
The following set up should give good results for water tank 0.75 m long.
Recording mode Length of recording Intersample time Trigger event Pre trigger
Graph 50 ms 50 µs When sound sensor 1 rises above 100 mV 25%
Set the length & intersample time to the shortest available. Logger type and number of sensors may lead to a variation in choice. The trigger value may need adjusting down depending on the type of container used.
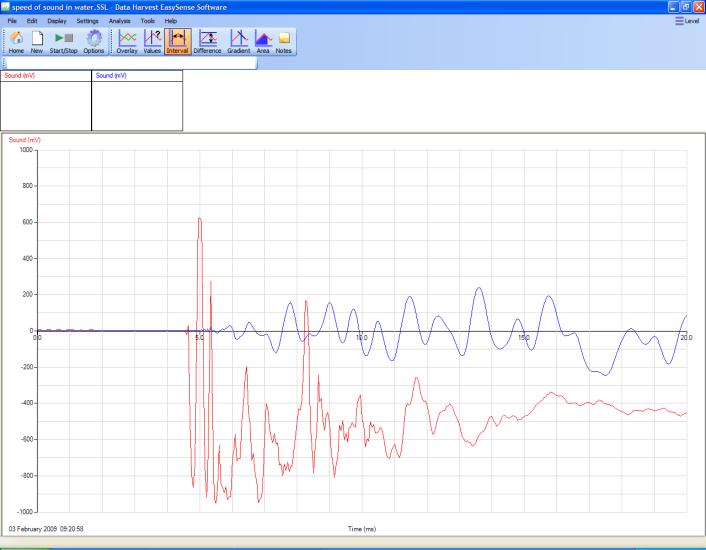
Sample result
Path between Stethoscope sensors was 0.6 m.
Note how the water smooths the waveform, this does make the difference between the two traces ambiguous. Use Zoom to help find the two start points
Speed of Sound
Trace from submerged sensor
Analysis

Zoom applied to the first part of the data. The Interval tool has been used to mark the beginning of the sound wave on each trace and reveal the time difference. With this data the time resolution gave a value of 0.450 ms or 0.500 ms, use the mean of the two estimates for calculation i.e. 0.475 ms
Calculations
In this example the distance between the Stethoscope sensors was measured at 0.60 m. The Interval tool revealed the time for the sound to reach the second sensor after reaching the first was 0.475 ms Speed of sound = distance / time = 0.6 / 0.000475 (time corrected from ms to s). = 1263 m/s
Speed of Sound
This is considerably faster than the speed of sound in air. No correction has been made for temperature. Use the Temperature sensor to find the water temperature and apply any correction factor as required. Speed of sound in water is normally quoted as 4 x faster than in air. You can use this as quick check to see how good your results were. Speed of sound in air is 331.1 m/s 1. If your result showed a big difference what were the sources of error that created this difference? 2. How could you control the experiment better on a repeat experiment? 3. What would be the effect of adding salt to the water (making artificial sea water)? 4. Does the depth of the water have an effect on the speed of sound?