
5 minute read
04 Speed of Sound in air by phase difference

Speed of Sound
04 Speed of Sound in Air by phase difference
Read
When you have a loudspeaker connected to a signal generator the tone being produced by the generator can be made audible (assuming the tone is within the audible range and the speaker’s response range). If you place a microphone in front of the loudspeaker you will (with the aid of a suitable logger or an oscilloscope) show the waveform of the tone. With a pair of microphones together (side by side) the wave signals from each microphone will be phase (peaks and troughs of the waves will line up). If you keep one microphone fixed, and move the other to be more distant from the loudspeaker the displayed waves will move out of phase (the peaks and troughs will no longer line up). If you keep moving the second microphone, you will eventually reach a point where the waves come back in phase. The distance between the points from when the waves are in phase and back in phase again, is one wavelength of the original tone being produced by the signal generator. We can show this using either a pair of Stethoscope sensors or a single Stethoscope sensor and a Voltage sensor. For convenience in this experiment you will use a Voltage sensor connected across the output of the signal generator and a single moving Stethoscope sensor.
What you need
1. An EASYSENSE logger capable of fast logging 2. 1 x Smart Q Stethoscope sensor set to Stethoscope range with the diaphragm removed 3. 1 x Smart Q Voltage sensor ±12 or 20 V 4. Signal generator 5. Loudspeaker matched to signal generators output 6. Patch leads 7. Retort stands and clamps
Speed of Sound
What you need to do
1. Set up the apparatus as shown in the diagram. Don’t worry too much about the separation of the Stethoscope sensor to loudspeaker at present. 2. Select a frequency of about 400 – 600 Hz, this gives a reasonable wavelength. 3. Place the Stethoscope sensor as close to the loudspeaker as possible. 4. Start the EASYSENSE software and select Scope from the Home page. No further set up of the software is required. 5. Turn on the signal generator and verify that a tone is being generated at the loudspeaker, adjust the amplitude / volume control to give an acceptable volume (pure tones, as generated by signal generators are especially invasive). 6. Select Start. Check the signal from the Voltage and Stethoscope sensors are approximately in phase (see note below). If not reverse the cables to the Voltage sensor. 7. Once you are happy the signals from both the Voltage and Stethoscope sensors are showing the same approximate phase start to move the Stethoscope sensor away from the loudspeaker, you should notice the relative position of the waves starts to move. Move the sensor until the wave from the signal generator (as measured by the Voltage sensor) is in phase with the wave being shown by the Stethoscope sensor. Mark this position or measure the position of the Stethoscope sensor from a reference point e.g. the frame of the speaker. You may need to right click and select Autoscale. 8. Once this in phase position has been marked, move the Stethoscope sensor until the waves go out of phase and then come back in phase with each other. Mark the bench / position of the Stethoscope sensor at the point when the waves are back in phase and measure the distance. You may need to repeatedly stop and restart logging so that you can use the Values tool to check how well the waves are phased.
As distance increase you may need to increase the volume, try not to use maximum volume. 9. Repeat to collect enough data for an average. 10. On the last run select Stop and Save the data, use the Voltage waveform data in the saved file to calculate or verify the frequency (displays of frequency are not always accurate).
Speed of Sound
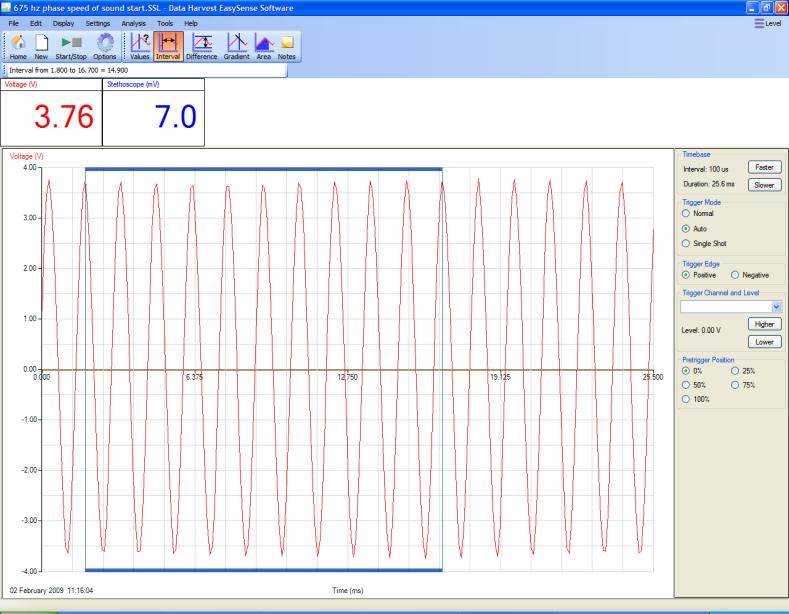
Sample data
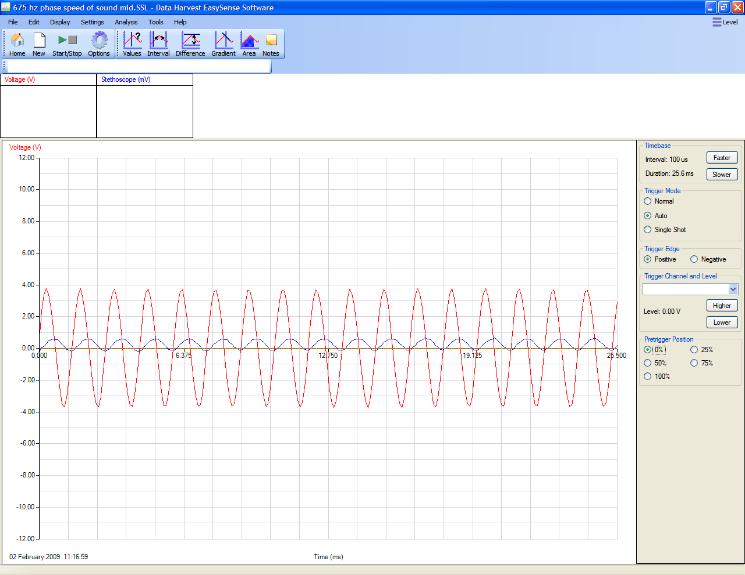
Voltage and Sound in phase with Stethoscope at its closest point to the speaker.
Sound and Voltage out of phase, as the Stethoscope is moved away from the loud speaker.
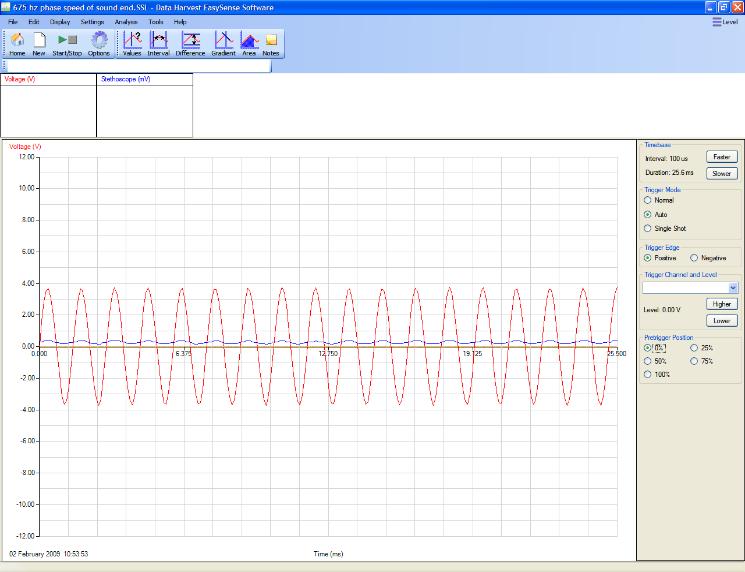
Sound and Voltage back in phase when the Stethoscope sensor is at its most distant from the speaker. You will need to use Autoscale at this point to check the phase difference.
Speed of Sound
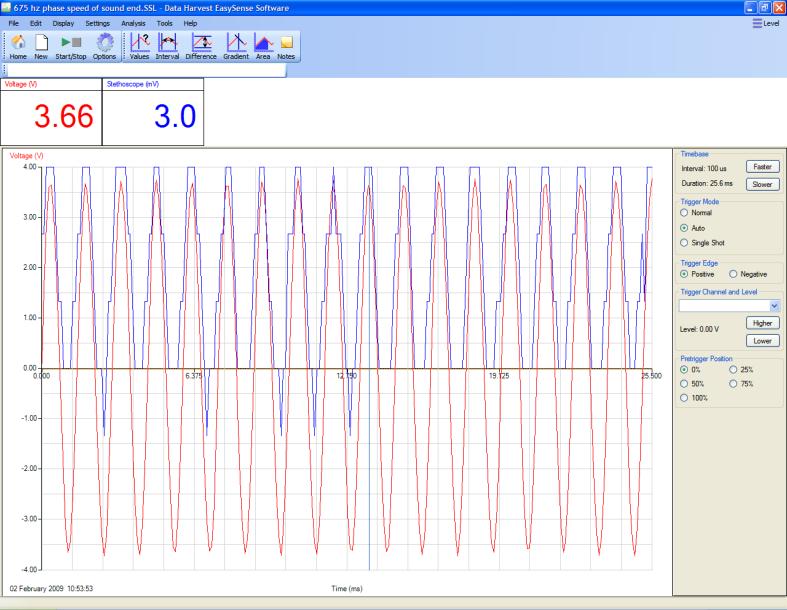
Using Autoscale on the data to see if the waves are in phase. Use the Values tool to check alignment.
Calculations
Find the frequency from the voltage wave. 1. Taking a single wave. Use the Interval tool to find the interval between two adjacent peaks. 2. Calculate 1/ interval (in seconds) = frequency in Hz. Take several peaks and produce an average.
Selecting 10 peaks to calculate frequency. 3. Using multiple waves. a. Use the Interval tool to find the time interval for 10 peaks. b. Divide the time interval by the number of peaks to find the time for one cycle. 4. Calculate 1 / interval (in seconds) = frequency in Hz
Speed of Sound
In the sample data the interval between adjacent peaks was 1.5 ms; this gave a calculated frequency of 666.66 Hz. Using several peaks allowed an average to be calculated. A frequency meter confirmed the frequency was 675 Hz. Using 10 peaks to calculate frequency gave a value of 672 (14.8 ms over 10 peaks) suggesting that this was a more accurate method of determining the frequency.
Calculate the speed of sound
Values taken from a recorded practical. 1. f = 672 Hz 2. L = 0.525 m (initial in phase distance 23 cm – final in phase distance 75.5 cm) 3. f / L = 352 m/s
Temperature of the room = 25ºC, correction = 0.607 m/s per 1ºC = 25 x 0.607 = 15.2. Expected value = 331.3 (speed at standard pressure and 0ºC) + 15.2 = 346.5. Experimental value = 352. (2% error over theory) Note: With the speaker and frequency being used, the first “in phase” was 23 cm in front of the speaker. This is due to a lagging phase shift between the sound wave and the changing voltage driving the speaker. The lag is created by impedance within the coil magnet system driving the speaker cone. The lag can be up to 45 degrees of phase difference or 45 / 360 = 12.5%.


