4 minute read
Experiment 1. Air Quality Meter


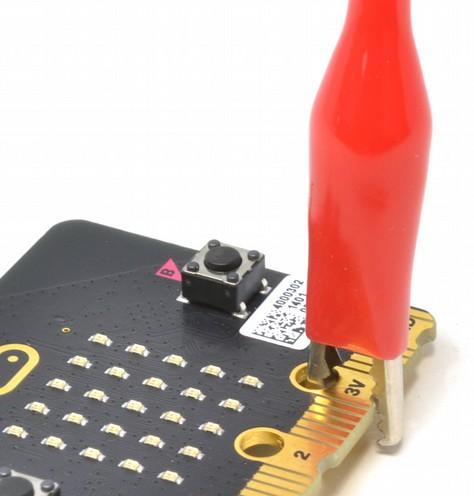
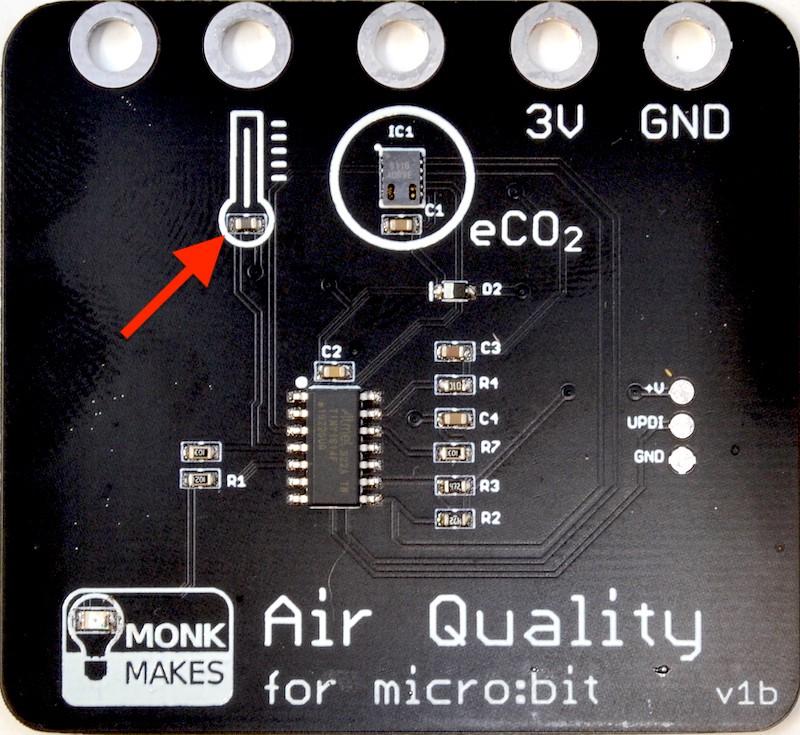
This first project displays the air quality as a bar graph. The more LEDs lit on the display, the lower the air quality. When all the LEDs are lit, this indicates an eCO2 (equivalent CO2) reading of 2000 parts per million. At any time, if you press button A, the micro:bit's display will show the eCO2 reading in parts per million. For more information about what these numbers mean, see the table on the previous page. For this project, you need your Air Quality Sensor to be connected to your micro:bit as shown on page 4. For this experiment, you can use either Makecode or MicroPython to program your micro:bit. We recommend that beginners use Makecode.
Makecode
For the Makecode version just go to this link and the code will appear in the browser. https://makecode.microbit.org/_TcPfHbikr20T
Tip: If you download an electronic version of this instructions manual from https://monkmakes.com/mb_cc, you can click on the link above to get the code.
Page 6
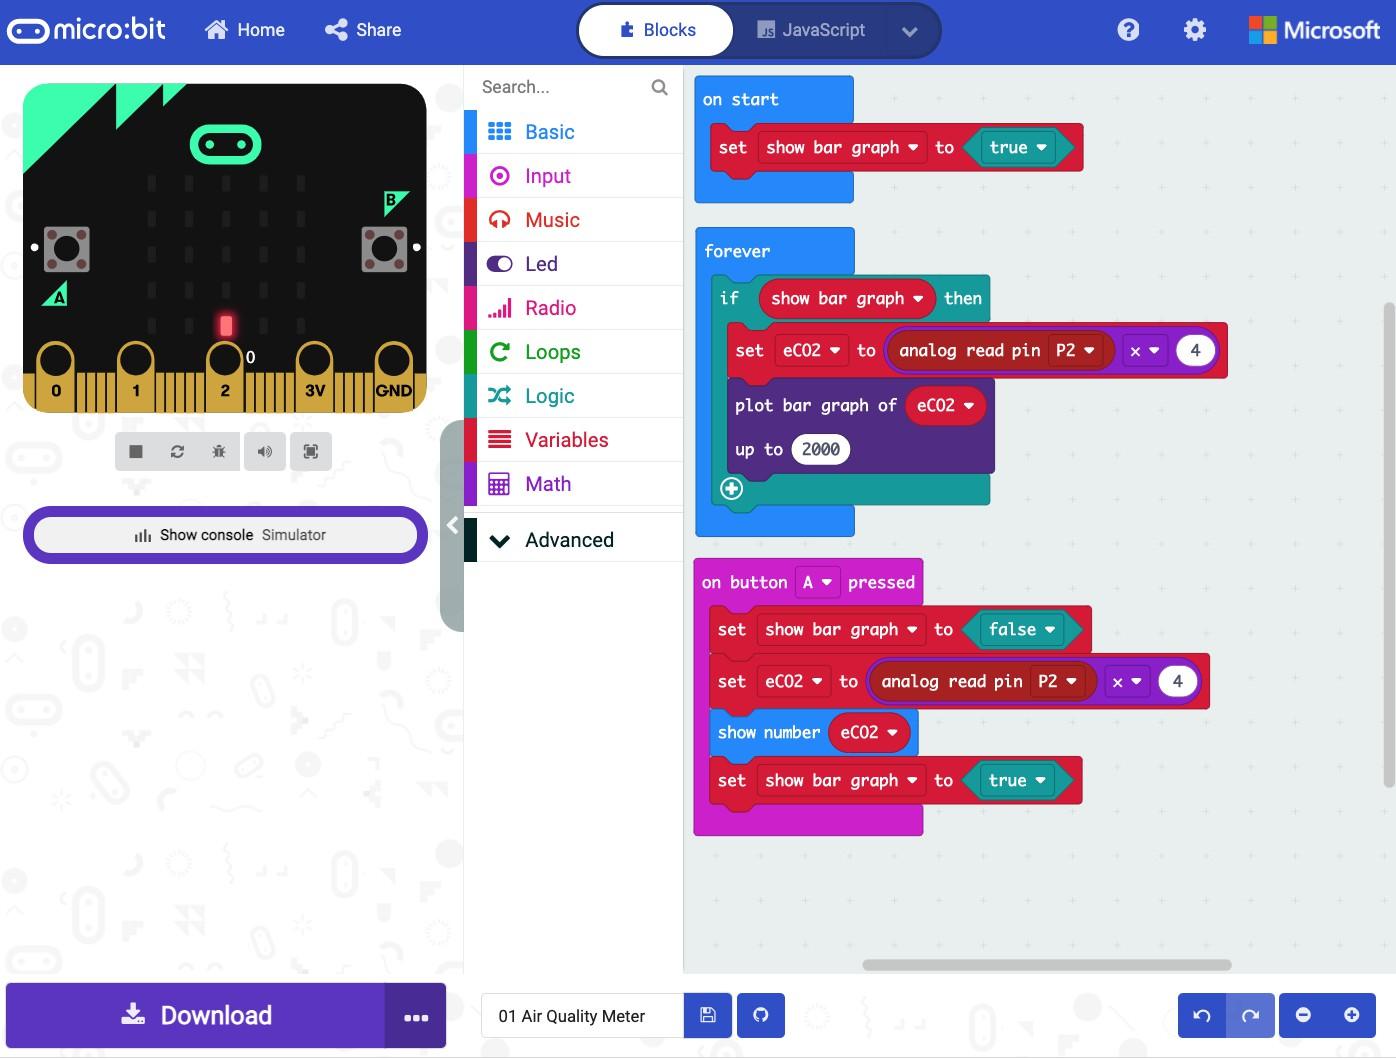
Click on the Edit button and the Makecode editor will open on the project as shown here.
Getting the code from your computer to your micro:bit can be done a number of ways. Once set up, the most convenient way is direct from your web browser over USB by Pairing your micro:bit with the browser. This will only work if your micro:bit has a fairly new version of its built-in firmware. So, if the procedure below does not work for your micro:bit, then follow the instructions here (https://microbit.org/getstarted/user-guide/firmware/) to upgrade your micro:bit to the latest version. Its actually very easy to do. You will also need to be able to pair your micro:bit to your browser for Experiment 4. Now, to pair your micro:bit before downloading, click on the menu button (three dots) to the right of the Download button.
Then click on the Pair device option. This will lead you to a window attached to the padlock symbol on your browser, where you can identify your micro:bit to grant the

Page 7
Makecode editor permission to connect to it over USB by clicking on Connect. The exact name of your micro:bit will differ.
When you click on the Download button it will transfer the program onto your micro:bit and display the message Download Completed!. Next time you want to download a program, it should remember that your micro:bit is paired. The m:b should now be showing a bar graph of the eCO2 level - probably just the bottom row of lights initially - and, if you breath gently near the sensor, you should see more LEDs light as the eCO2 level rises. Lets take a quick look at the code: The on start block initialises a variable called show bar graph to true. This variable is used so that when we press Button A to display the current reading we can stop displaying the bar graph so that is does not obscure the number being displayed. The forever block checks to see if the show bar graph variable is true, and if it is, it first sets the value of a variable called eCO2 to be the analog value read from pin P2 (which will be in the range 0 to 1023) times by 4. This gives a maximum eCO2 reading of 1023 x 4 = 4092 ppm. The plot bar graph of block is then used to display the eCO2 reading up to a maximum of 2000 ppm. When button A is pressed, the variable show bar graph is set to false to disable the bar graph display in the forever block and then the value of eCO2 is calculated and shown on the display.

Page 8
MicroPython
To fetch all the MicroPython programs for this kit, you will need to download them from the Github website where they are hosted. You will find them here: https://github.com/monkmakes/mb_aq

To download them, click on the green Code button and select the option Download ZIP. Extract the ZIP archive and you will find a directory containing the python programs for Experiments 1 to 3. There is no MicroPython version of the code for Experiment 4. To get this code into an editor and then onto your micro:bit we recommend that you use the online Python editor for micro:bit at: https://python.microbit.org

Page 9
Click on the Load/Save button.
You can now drag one of the files you downloaded and unzipped into the Load area and it will appear in the editor. Here the file 01_air_quality_meter.py for this project has been loaded.


Page 10
Now you just need to transfer the program onto your micro:bit. This involves pairing the micro:bit with your browser just like you would when using Makecode. So click on the Connect button and then select your micro:bit. Finally to install the program onto your micro:bit click on the Flash button.
Turning to the code for Experiment 1. The MicroPython version is quite similar to the Makecode version. from microbit import * import time

def bargraph(a): display.clear() for y in range(0, 5): if a > y: for x in range(0, 5): display.set_pixel(x, 4-y, 9)
while True: e_co2 = pin2.read_analog() * 4 if button_a.was_pressed(): display.scroll(e_co2) bargraph(e_co2 / 400) time.sleep(0.5)
However, the MicroPython library does not have a built in bar graph feature, so this is taken care of by the bargraph function that takes a number between 0 and 5 and lights that number of rows of LEDs.
Page 11