


004 China Fastener World no.68/2023


China Fastener World no.68/2023 005


008 China Fastener World no.68/2023


010 China Fastener World no.68/2023

China Fastener World no.68/2023 011


012 China Fastener World no.68/2023


China Fastener World no.68/2023 013

014 China Fastener World no.68/2023


China Fastener World no.68/2023 015
Eyeing Global Market Share with Stainless Steel Screws Hisener Industrial on a NEW Journey
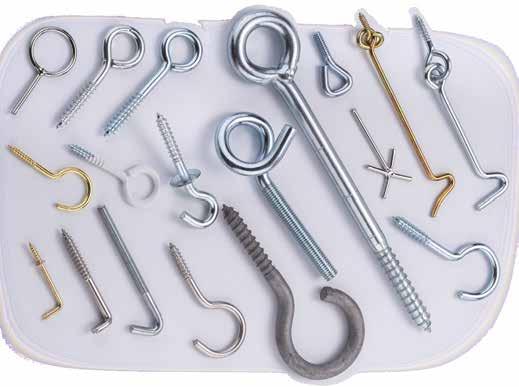
Hisener has become a benchmark Chinese manufacturer and one of the largest fastener suppliers in the world, working with 150 carefully selected partners to supply over 4,000 types of fasteners to customers in Europe, the U.S., South America, and Russia. Even though the pandemic once prevented face-to-face communication with customers, Hisener has been achieving major breakthroughs in the last two years. New products, capacity upgrade, automation and digitalization are Hisener’s keywords for 2023!
New Market Share for Stainless Steel Products
The new 32,000 square meter factory completed in the third quarter of last year has added a new manufacturing area for stainless steel products. Stainless steel screws have always been a product that Hisener wanted to produce inhouse. The new plant is a significant milestone since its establishment, as it is enlarged in area and equipped to produce this product. With years of experience in manufacturing, Simon Liang, the manager, has a deep understanding of the characteristics of stainless steel products and has mastered the best balance between drilling performance, price and cost. He believes his rollout of convenient one-stop purchasing will enable his products to gain market shares in the global market.

不銹鋼螺絲著眼全球市占 海迅精密科技「新」旅程
Cover Story 016 China Fastener World no.68/2023 惠達雜誌
Triple Production Capacity
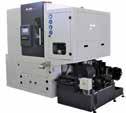
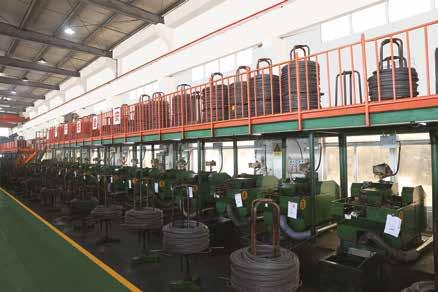
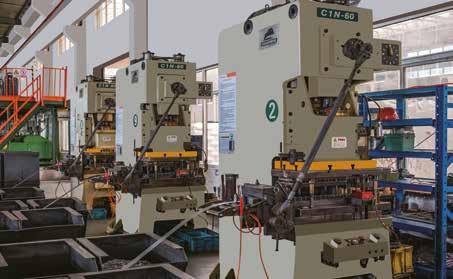
Hisener’s new factory has more than 300 machines, including 140 1-die-2-punch heading machines, 2 multi-stroke machines, 130 thread rolling machines, 8 self-drilling screw machines and 15 slotting machines, all imported from Taiwan. The 150 employees in the factory can manufacture 1,500 tons of screws for customers every month, significantly surpassing the previous production capacity of 500 tons.
Automation for High Speed and Stable Supply

The new factory includes a wire rod warehouse, semi-finished products warehouse, and finished products warehouse. The automated and digitalized connection between each warehouse and the production process achieves the upgrade to a smart factory. After connecting to ERP and WMS, every process can complete automatic material loading, significantly reducing labor and transportation costs and improving the operational efficiency of the factory. Customers will feel Hisener’s delivery becomes faster. The birth of the new factory is to provide customers with higher value-added products at better prices and bring elevated values to customers.
Larger Laboratory to Ensure Quality and Quantity

The new factory is equipped with a larger laboratory encompassing inspection equipment for dimensional analysis, composition analysis, metallurgical analysis, mechanical property analysis, surface treatment analysis and so on. The lab has 10 employees to master all aspects of products from material to production process, ensuring that each batch is strictly inspected and traceable.
Global Footprint and Further Communication with Global Customers

Simon noted the prospect for positive market demand development is up again, and he is doing his best to travel around the world to communicate with customers face to face, to better understand their pain points and difficulties, and to solve their problems through new products and the upgraded new factory. He also welcomes all customers to come to China to witness the transformation and upgrade of his new factory, further the bond of trust and expand collaboration!
Contact: Simon Liang Email:simon@hisener.com
by Dean Tseng, Fastener World 著作權所有:惠達雜誌

ET A-22/0584
Cover Story 017 China Fastener World no.68/2023 惠達雜誌


018 China Fastener World no.68/2023

China Fastener World no.68/2023 019


022 China Fastener World no.68/2023


China Fastener World no.68/2023 023


China Fastener World no.68/2023 025
Chinese Associations News 中國公協會新聞
compiled by Fastener World 惠達編輯部整理
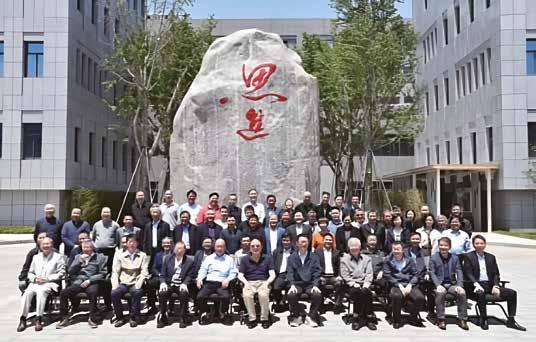
CMCA (China General Machine Components Industry Association) 7th Directors and Supervisors Meeting
On May 12, 2023, the meeting was successfully held in Qingdao City, with more than 270 members attending the meeting. The meeting discussed that in 2022 the industry was experiencing ups and downs, with factors such as rising costs, difficulty in capital return, and lack of market demand bringing adverse effects, and that it is important to promote high-quality development of the industry.
The meeting invited an IT company to give a speech on "Enterprise Technology Innovation and Intellectual Property Management" and Wintime Machinery to talk about “Domestic Mechanical Inspection Equipment to Replace Imports”. The feedback was positive.
In the afternoon, more than 250 conference delegates went to the factory of Qingdao Choho Industrial in Pingdu City to visit the digitization production area and laboratory, and listen to the company's achievements and plans in smart manufacturing, which was very fruitful.
Ningbo Fastener Industry Association 5th Executive Council


On the morning of May 2, 2023, the 5th Executive Council of Ningbo Fastener Industry Association was held in Sijin Intelligent Forming Machinery. The president, vice-president, supervisor, executive director and supervisor of Ningbo Fastener Industry Association attended the meeting, along with some enterprise representatives from Hebei, Shanghai, Jiangsu, Hangzhou, Wenzhou, Jiaxing, etc. Nearly 70 people attended the meeting.
During the meeting, All Bright Law Firm was invited to explain the progress of the EU anti-dumping lawsuit. The firm said that although the European Union reimposed heavy taxes on China's fastener exports last year, it was just a new starting point for China's fastener industry to fight and win again. In the international economic and trade field, China cannot be submissive and needs to turn passivity into initiative. He hopes that Chinese fastener industry will turn around in the new era.
Executive Vice Chairman of CMCA asked the fastener industry in China to actively respond to the difficulties and problems.

and people should be united and actively participate
 The EU anti-dumping case to China should be seriously studied,
in the work of responding to the lawsuit, and strive to obtain a legal victory.
The EU anti-dumping case to China should be seriously studied,
in the work of responding to the lawsuit, and strive to obtain a legal victory.
026 China Fastener World no.68/2023 Assoication 惠達雜誌
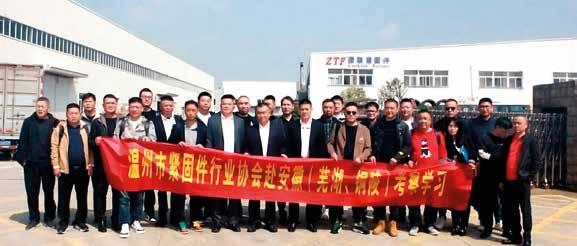
Wenzhou Fastener Industry Association Went to Anhui Province for a Business Visit
On April 8, Wenzhou Fastener Industry Association went to Yi'an District, Tongling City of Anhui Province for a business visit to look for collaboration opportunities and jointly promote the economic development of the two places. Nearly 50 people participated in the visit.
In the morning, the delegation visited the wastewater treatment facilities and plants of Anhui Tongqin Surface Treatment Industrial Park and Anhui Jiatong Industrial Park to learn more about the operation and production situation, management mode and supporting measures of the local enterprises, which increased the confidence of investing in Anhui. In the afternoon, the delegation participated in the investment promotion meeting held in Tongling City, Yi'an District. According to the introduction, Yi'an District is located in the south central part of Anhui Province. The location is superior and has formed an industrial development scale for power and energy, non-ferrous metals, fine chemicals, new building materials, machinery and electronics as the leading industrial development pattern, along with equipment manufacturing, biomedicine and other industries.
The Association expressed its willingness to strengthen collaboration with Yi'an District and provide more help and support for the development of the fastening industry in Yi'an District, so as to jointly create a new world for the fastening industry in Wenzhou and Tongling.
2023 Conference on Mold Forming Equipment and Auto Parts Manufacturing Technology and Market


In the afternoon of April 21, during the world's top auto show in Shanghai, "2023 Mould Forming Equipment and Auto Parts Manufacturing Technology and Market Report" was held in Shanghai Convention and Exhibition Center.
China Mould Industry Association invited leading enterprises in China's mold industry, including automobile mold manufacturers and automobile parts manufacturers, to introduce the technological development of China's automobile mold and response to market. The meeting talked about the future changes in the auto manufacturing industry, and the need for auto molds to continuously adapt to market and technological changes, and shared the direction for China's auto mold enterprises to actively explore the mold products.
China Fastener World no.68/2023 Assoication


China Fastener World no.68/2023 029
社論:新機會與新挑戰
New Opportunities and Challenges
Great Potential for New Energy Industry in 2023
The past three years of chaos may have disrupted the supply chain but haven’t been all dark days, because China awed the world with new energy car industry. According to the latest figures by China Association of Automobile Manufacturers, China's production and sales of new energy vehicles (NEVs, including pure electric vehicles, plug-in hybrid electric vehicles and hydrogen fuel cell vehicles) reached 7.058 million units and 6.887 million units respectively in 2022, up 96.9% and 93.4% respectively, and have topped the world for eight consecutive years. In 2022, the global NEV sales reached about 10.65 million units (63.6% year on year), of which China accounted for nearly 65%. By the end of 2023, China's NEV sales could grow 35%, reaching a market scale of 9 million units. Although this growth rate is only about one-third the rate of 2022, it is impressive that China has been able to achieve such growth despite the economic and inflationary challenges today.
Automotive sales have naturally lifts the demand for automotive fasteners. Several leading companies in China have invested in the NEV fastener market. Essence Fastening is one of the major precision fastener manufacturers entering the new energy industry.
Additionally, Fengning County in Hebei Province of China is building a production base of auto parts. Chery Automobile’s industrial park of automotive parts in Jinpu New District of Dalian City launched construction in March. A high-end automotive industry demonstration area is under construction in Anji District of Hebei Province with the aim to establish a local auto parts industry. Among them, Anji District made a turnover of RMB 1.74 billion in 2022, up 46.6%. SAIC Motor is working with the Guangxi government to build a world-class NEV industry area. The number of NEV production bases in China is increasing rapidly with strong development momentum.
It is important to note that NEVs use a large number of printed circuit boards which put the manufacturing technology of ultra-miniature screws to the test. Thinner and stronger boron steel and recycled plastic materials have found their use
on car bodies, both of which require innovating new fastener joining technologies. Obviously, NEV fasteners requires high-end and customized manufacturing technology. However, There still are technical bottlenecks for Chinese fastener enterprises and it is necessary to continue to upgrade and transform to cope with new forms of innovation in fastener manufacturing.
Besides NEVs, another booming new energy industry in China is solar energy parts. There are many local Chinese enterprises entering this field. For example, Ningbo Geobo Hardware quickly entered the photovoltaic parts field, providing one-stop parts procurement service for overseas fastener wholesalers and photovoltaic panel mounting companies. (Refer to the Ningbo Geobo Hardware report in this magazine.) NEV and solar energy markets will be the two points of focus this year.
CBAM, the Challenge in Focus
China has long been EU's largest trading partner. However, EU will extend the implementation of the Carbon Border Adjustment

030 China Fastener World no.68/2023 Editorial 惠達雜誌

Mechanism (CBAM) to the fastener industry on a trial basis starting October 1, 2023, and formally implement it in the end of 2026 or the beginning of 2027. This will impose significant carbon taxes on fastener manufacturers who fail to meet EU's carbon emission standards and who are unable to provide third-party verified carbon emissions data. This mechanism also poses a major challenge to Chinese manufacturers.
During the transition period (starting from October 2023), EU will require that the amount of imported products, the carbon content of the products, and proof that the exporter has paid the carbon fee and reported within one month after the end of "each quarter". During the transitional period, the carbon content of products may not necessarily have to go through verification. After formal implementation, the amount of imported products, the carbon content of products, the number of CBAM certificates, and the verification report shall be reported "annually at the end of May". The documents can be submitted directly to the European Commission or to the importer.
Table 1. China's Fastener Export Value to the World (in USD)
Table 2. China's Fastener Import from the World (in USD)
China's carbon reduction accompanied by the aforementioned new energy industry (electric vehicles and solar energy) boom is becoming a trend, but EU's carbon tax came fast and abruptly. Could Chinese fastener enterprises in this wave of new energy trend upgrade in time and develop fastener products and production line technology that can meet EU's carbon reduction regulations. These questions test fastener leaders’ technological innovation and integration capabilities. Perhaps they could succeed through collaboration with overseas enterprises and different industries.
China's Fastener Export Surpasses USD10 Billion Mark
From 2019 to 2021, China's fastener export to the world continued growing from USD 6.4 billion and USD 6.9 billion to USD 9.2 billion, and then exceeded the USD 10 billion mark in 2022, landing at USD 11.1 billion (Table 1). The U.S. has been China's largest fastener export destination for the past four years, and China exports much (at least two times) more fasteners to the U.S.
2019 2020 2021 2022 Partner Export Partner Export Partner Export Partner Export World 6,419,097,042 World 6,959,807,809 World 9,283,111,503 World 11,178,859,446 U.S.A. 1,004,114,571 U.S.A. 827,330,702 U.S.A. 1,262,828,358 U.S.A. 1,660,619,069 Russia 341,469,850 Vietnam 484,775,853 Russia 544,069,130 Germany 608,159,340 Japan 310,276,769 Russia 404,230,744 Germany 533,199,635 S. Korea 577,152,276 Vietnam 279,867,089 Germany 309,148,054 Vietnam 455,990,179 Vietnam 481,554,218 Germany 278,955,153 Japan 270,056,188 S. Korea 403,729,049 Russia 479,092,270 India 223,169,272 S. Korea 249,571,286 Japan 346,439,775 India 416,772,285 S. Korea 197,021,826 UAE 213,085,446 India 296,460,697 Japan 399,601,381 Australia 189,499,451 India 203,159,577 Italy 277,124,224 Mexico 298,089,922 UK 159,449,102 Myanmar 199,601,983 Australia 266,443,260 UAE 297,718,909 Italy 153,851,235 Thailand 196,292,352 UK 258,863,173 UK 296,288,973
2019 2020 2021 2022 Partner Import Partner Import Partner Import Partner Import World 2,839,393,284 World 2,786,542,569 World 3,280,746,110 World 2,857,704,941 Japan 839,746,319 Japan 852,790,240 Japan 983,969,032 Japan 806,726,292 Germany 556,294,921 Germany 561,700,799 Germany 630,243,449 Germany 556,832,553 U.S.A. 369,091,167 U.S.A. 315,945,338 U.S.A. 398,160,844 U.S.A. 392,529,165 Taiwan 218,244,164 Taiwan 234,702,416 Taiwan 324,224,022 Taiwan 284,625,712 S. Korea 160,280,472 Italy 141,111,449 Italy 172,577,180 Italy 140,189,255 Italy 124,061,441 S. Korea 130,805,250 S. Korea 132,572,356 S. Korea 118,696,684 France 73,735,995 France 62,370,515 France 73,700,211 France 67,104,206 U.K. 49,902,373 U.K. 46,517,579 U.K. 53,832,105 U.K. 47,406,276 Malaysia 26,830,637 Malaysia 28,608,755 Turkey 40,893,282 Turkey 39,145,466 Switzerland 24,756,491 Switzerland 28,247,190 Switzerland 33,779,764 Switzerland 32,677,036 032 China Fastener World no.68/2023 Editorial 惠達雜誌
than to other countries, indicating that China's fastener export is highly dependent on the U.S. Other major fastener export partners with China include the United States, Germany, South Korea, Vietnam, Russia, India, Japan, Mexico, UAE, and UK. China's fastener export to these countries have generally been growing for four consecutive years, indicating that the global demand for Chinese fasteners has been increasing up to last year.
On the import side, China's fastener import from the world fluctuated, falling from USD 2.8 billion to USD 2.7 billion, rebounding to USD 3.2 billion, and then falling back to the USD 2.8 billion during 2019 and 2021. Japan has been China’s largest source of fasteners in the past several years, followed by Germany, the U.S., Taiwan, and Italy, as shown in Table 2 . South Korea, France, and UK were respectively the sixth to eighth largest sources of fasteners for China in the past several years. It shows there is little change in China’s sources of fasteners.
Overall, although China is affected by factors such as geopolitical pressure, domestic economic challenges and global inflation in 2023, steady fastener import and an uptrend in export are still expected. Market research institutions predict that the global industrial fastener market value will grow 4% to USD 110.9 billion and automotive fasteners will grow 7% to USD 17 billion in 2023. With the prospect of expansion, it is a must for Chinese fastener manufacturers to capture overseas markets.

Pressing the Start Button for Grabbing Overseas Shares
Fastener Fair Global was the highlight of this spring where we saw exhibitors of China pavilion form a strong force competing with Taiwanese and Indian manufacturers for orders. Fastener World interviewed Chinese, Taiwanese, European and American exhibitors there and found they were facing two different situations. On one hand, we met those who claimed less than ideal numbers of orders received because inventory level remained high at the European customers’ side. On the other hand, there were those very satisfied to have met 60 existing customers and about 20 new customers in the first two days of the show, and these exhibitors hoped to book a larger booth next time. Some exhibitors found more customers from Central and Eastern Europe. Here we see fastener inventory level this spring was still quite varied among European customers, but no matter what, exposure is the window of opportunities to get orders. Some of the largest Chinese fastener manufacturers revealed to Fastener World that they would exhibit in Nashville and São Paulo shows this year, hoping to tap into more markets.
With the market fully open in 2023, there are already Chinese manufacturers planning to go in groups to Germany, the U.S., Italy, Japan, India and Taiwan to attend exhibitions and visit local enterprises this year. With the EU carbon tax as a new challenge, the new energy industry and upcoming exhibitions this year are new business opportunities that Chinese fastener industry is grasping.
by Dean Tseng, Fastener World 著作權所有:惠達雜誌

033 China Fastener World no.68/2023 Editorial 惠達雜誌


034 China Fastener World no.68/2023


038 China Fastener World no.68/2023


040 China Fastener World no.68/2023
簡單卻不簡單 固特金屬打造自動智慧化墊圈產線
Complexity of Simplicity
Builds Automated Intelligent Washer Manufacturing Line
Washers are the most basic but indispensable part of fasteners. Recognizing the importance of washers in industrial applications, SSF Industrial Co., Limited. has been actively engaged in the production and sales of carbon steel and stainless steel washers for over 20 years, providing domestic and overseas customers with standard and nonstandard products meeting the international standards of the U.S., Germany, France, etc. At present, it can provide products in sizes of M2-M100, with the hardness of 100HV-420HV, and with natural color, galvanized, mechanical galvanized, hot dip galvanized black oxide, and Dacromet surface treatments. In addition to washers, its product lineup has been also extended to include all kinds of stamped parts in response to market demand. Recently, it has successfully developed a new type of wood structure connecting part with very positive market expectation.

1,800 Tons of Monthly Capacity Mainly Sold to Europe and the U.S.
With a total area of 35,000 sq. m and around 100 employees, SSF’s factory is located near the most important distribution center for stamped parts in Northern China, making it easier to obtain raw materials at more competitive prices. In addition, 35 sets of numerical control stamping machines, a professional laboratory with calipers, hardness testers, zinc layer testers, salt spray testers and sorting machines, together with the production technology and experience accumulated over the years, have not only optimized SSF's production lines and operational efficiency, but also enabled it to strictly control the quality of products, which has always put it in the leading position in the industry. Its current production capacity is 1,800 tons per month, with over 95% of the production going to the U.S. and Europe.
“Our strength is not only the ability to provide customers with competitively priced products, but also our stable delivery, excellent service, and intelligent management which are why our customers choose us. On one hand, we plan to build an automated and intelligent factory to upgrade our production line, and on the other hand, we continue to develop new products and hope to explore more overseas markets,” said SSF Sales Manager Lilian Zheng.
SSF contact: Sales Manager Lilian Zheng
Email: lilian@ssfwashers.com
by Gang Hao Chang, Vice Editor-in-Chief of Fastener World 著作權所有:惠達雜誌
Ad at page 138
New Product Line- Wood Structure Connecting Part

As an ISO 9001:2015 certified company, SSF has not only introduced advanced equipment and expanded its factory in 2022, but has also recently extended the development to wood structural connecting parts and successfully developed new products, actively demonstrating an attitude of keeping up with the times to the market.
"Although the market entry barrier for wood structure connecting parts is high, it is not a difficult task for us. In the future, we will go deeper to understand the market and conduct technical analysis, so that we can get CE and ETA certifications for our new products and gain access to the European market. This is a new challenge and an opportunity. We will continue to improve our technology and production capability to meet the needs of more customers for precision products. The market is constantly advancing and we will definitely keep pace with it,” said Zheng.
"We always believe that fasteners are the most basic but indispensable part of industrial development, and as long as there is construction, there will be demand. Manufacturing is an industry where challenges and opportunities coexist. We have survived the industry's winter and market depression, and we believe that the future will be definitely getting better,” added Zheng.
Focused Suppliers This Month 041 China Fastener World no.68/2023 惠達雜誌
具成本、技術優勢 寧波嵊隆木用、建築、新能源螺絲
Featuring Cost & Technology Advantages
NINGBO SUNLONG Timber, Construction, and New-EnergyIndustry-Use Screws


With its factory close to major ports in Ningbo, Shanghai, and Hangzhou, Ningbo Sunlong Imp and Exp Co., Ltd specializes in all kinds of carbon and stainless steel screws and composite welded screws (e.g. wood construction screws, sandwich panel screws, A2/A4/A8 stainless steel screws...etc.). It mainly produces products in sizes of 3.0-10.0mm and lengths of 10-600mm, which have been widely used in wood, roofing and other new energy industries such as solar power, photovoltaic and other energy storage fields. The reliable quality, good reputation and competitive prices have made many domestic and overseas customers willing to become long-term partners of Sunlong, leading to the increase in its product export year after year. Ningbo Shengtai Fastener Technology Co., Ltd. (TARIC Code C821), the parent company of Sunlong, is also well known in the industry, and has over 30 years of history in the production of various types of drilling screws, wood screws and non-standard screws.

CE Certified Designated for Collaboration by Leading U.S. & European Companies
Sunlong’s factory has an area of around 16,500 sq. m and about 60 people are currently employed. In order to meet the huge demand from global customers, ensure a more efficient manufacturing process and guarantee perfect production quality, its factory has introduced nearly 100 sets of professional fastener processing equipment such as fastener straightening machines, cold headers, large extension cold headers, large extension thread rolling machines and extra long washer assembly machines. At present, its average monthly output reaches more than 700 tons.
In addition to being certified by the ISO9001 quality management system and China ’ s GB standard, Sunlong has also obtained the CE certificate and has established long-term cooperation with many major EU manufacturers. Moreover, Sunlong’s products have been also sold to N. America, S. America, Southeast Asia, East Asia, the Middle East, Oceania and Africa. “Europe, the Middle East and Russia are our main markets now. We’ll continue to participate in key exhibitions in Germany, Poland, the Middle East and Moscow to actively expand our overseas markets,” said Manager Du.
Sunlong contact: Manager Du

Email: yolanda@nbsunlong.com
New Product Release Showing Technical Development Strength
In addition to receiving orders, Sunlong also continues to develop new products. Recently, it has successfully released new stainless steel welded self-tapping screws and self-drilling screws. The new products feature a single screw made of two different materials. Although this is a new requirement and challenge for material nature, production process and surface treatment technology, the technical development team of Sunlong has successfully made it!
“We have the cost advantage to offer our customers a better price/ performance ratio for mature products with high usage (e.g. carbon steel screws). For new products, we have the technical strength of our professional team, which can be translated into production capabilities. New areas are a challenge for all of us, and the global environment is putting higher demands on the survival of enterprises. The only way to deepen and expand on the existing market is to continue to invest in R&D and develop new products; as a result, we can find our own competitive track,” said Ms. Du.
At the closing of the interview, Du also noted, “Fastener World Magazine is very good at facilitating communication between fastener buyers and sellers. I hope in the future Fastener World can continue to provide more industry and product info to boost the development of the fastener industry together.”
by Gang Hao Chang, Vice Editor-in-Chief of Fastener World 著作權所有:惠達雜誌
Focused Suppliers This Month 042 China Fastener World no.68/2023 惠達雜誌

鑫宇金屬- 完整規格螺母、沖壓件、墊圈生產供應
HEBEI XINYUSupply of a Complete Range of Nuts, Stamped Parts and

Washers
With a factory area of over 50 acres and around 40 employees, Hebei Xinyu Metal Products Co., Ltd. specializes in producing and exporting various specifications of furniture T-nuts, wing nuts, T-nuts with prongs, welded nuts, etc. The main materials used are carbon steel (08AL, 195L), stainless steel 304 (A2), and stainless steel 316 (A4). The innovative stamping technology, excellent quality and service have earned Xinyu Metal a wide reputation in the highly competitive global market over the years, making it one of the most recognized and innovative manufacturing companies in the industry.

Diverse Product Applications Bestselling in Europe, USA, and Southeast Asia

Xinyu Metal's product manufacturing process strictly follows international quality control systems and has obtained the ISO9001 certification. Its factory is equipped with more than 180 sets of stamping machines and tapping machines, with an average monthly capacity of 100,000,000 pieces. With the hard work of its team over the years, its products have been successfully sold to dozens of mainstream markets in Europe, the U.S., and Southeast Asia, and are widely used in furniture manufacturing, automotive assembly, rock climbing projects, decoration engineering, and other fields.
“We have a team of product development and mold design, and the forming of main products is automated. Our advanced production process guarantees excellent product quality and competitive prices. More importantly, our consistent product quality and on-time delivery have earned us a good reputation and enabled us to continue to lead in a competitive market,” said General Manager Yan.
Multiple Patents and Certificates
Stainless Steel 4-Prong T Nuts and Weld Nuts Sell Well on the Market

In addition to the ISO9001 and CE certification, Xinyu has a variety of invention patents. The recently developed stainless steel 4-prong T nut and stainless steel weld nut feature super corrosion resistance and can function safely under -270℃~400℃ for a long time. With good environmental performance and toughness, it can help users deal with wet, acid, alkaline and other indoor and outdoor extreme environments and maintenance, which has been favored by many customers in pursuit of top quality.
“In response to the new trend of shorter development time and higher material and mechanical performance, we have not only increased our efforts to introduce optical sorting machines to strictly inspect our products, but also expanded our mold development team to continuously explore and improve existing designs and introduce new ones in order to shorten the time required for mold development to production and to satisfy our customers' shorter time requirements,” said Yan.
Xinyu contact: General Manager Yan Email: xy@t-nuts.cn
Building a Topnotch Workshop & Reinforcing Sales to America
Although the risk of material cost changes is still high and soaring shipping costs are eating into profits, Mr. Yan believes that the product market and customer demand are slowly returning to normal. Next, Xinyu will focus on the American market such as the U.S., Brazil and Mexico, providing customers with the most complete product range and specifications to help them save purchasing and transportation costs.
Yan also noted, “We are currently expanding and renovating our factory, hoping to build a first-class workshop with the best technology to support the quality and timely delivery of products.”
by Gang Hao Chang, Vice Editorin-Chief of Fastener World 著作權所有:惠達雜誌
Focused Suppliers This Month 044 China Fastener World no.68/2023 惠達雜誌


Shanghai Fastenman Metal Product

Established in 2003 as a professional stainless steel fastener total solution provider, the headquarters of Shanghai Fastenman runs business on three core pillars— manufacturing, trading and warehousing/distribution. With more than 90 employees and an annual turnover of over US$30 million, their customers are located in Europe, South America, the Middle East and Australia.
Three Specialties to Open up Fastener Routes

Shanghai Fastenman has three main specialties. First, for customers in the wholesale distribution pipeline, they provide a wide range of product items (30,000 SKUs), over 6,000 tons of in-stock inventory, and customized packaging to achieve "full-range, fast, and excellent" supply. Then, in addition to general stainless steel fasteners, their products also cover a full range of Solar Photovoltaic (PV) components, including PV brackets, PV hooks, PV hanger bolts, PV hammer bolts, hexagonal and socket hexagonal bolts and nuts, and Bi-metal self-drilling screws.

Last but not least, they have a clear advantage in stainless steel special material fasteners, keeping sufficient stock of duplex stainless steel, high temperature alloy steel, corrosion resistant alloy steel, high strength alloy steel and so on all year round. Their products are widely used in the fields of petrochemical, shipbuilding, pressure pipeline vessel, power and energy, aviation and aerospace, and civil nuclear
power. These three characteristics enable their products to cover diverse markets both at home and abroad.
They have specialized laboratory equipment and a quality inspection team, equipped with optical analysis instruments, tensile testers, hardness testers, salt spray testers, fatigue testers, metallographic analyzers, drilling speed testers, etc. which carry out inspection according to ISO and GB standards. They can provide customers with one-stop services ranging from product development to manufacturing, surface treatment, optical sorting, finished product inspection, and OEM packaging.
Expanding Overseas Solar Photovoltaic Market Share
In the midst of the European energy crisis and the trend toward carbon neutrality, they see a relatively stable demand in the PV market. Since hanger bolts and hooks are key accessories to connect overseas PV panels and roof bases, they are selling PV fasteners and accessories to Germany, Italy, Brazil, Poland, Hungary and other countries.
15% Sales Increase In 2023
In 2023, they have arranged to participate in 5 overseas exhibitions and customers visit. The main purpose is to know market changes at a close distance and provide better services to meet the market demand. This way they will secure over 15% sales growth in 2023 and maintain a high service level as an excellent supplier in the stainless steel fastener industry.
046 China Fastener World no.68/2023 Company Focus 惠達雜誌
Full-range Stainless Steel Fastener Specialist with 30,000 SKUs Contact: Felix Zhang Email:felix@fastenman.com.cn ; stainlessfastener@yeah.net by Dean Tseng, Fastener World 著作權所有:惠達雜誌

China Fastener World no.68/2023 047
Ningbo Geobo Hardware Expanding Non-standard Parts to South America


Kerry Tu started in 2008 as a customized fasteners manufacturer for domestic clients. Then in 2012, he established Geobo and transitioned to international fastener trade. Over the years, his business has grown significantly, and by 2019, he had expanded his operations to include a bolt and a screw factory, and a broad range of products. With a production capacity of over 5,000 tons annually, now he owns more than 80 automated machines, including cold-forging, threading, and punching machines, to manufacture standard and customized bolts, screws, stamped and machined parts, and non-standard parts in various materials such as carbon steel, alloy steel, stainless steel, copper, and aluminum. Additionally, construction fasteners account for about 70% of his total export value.
To ensure quality control, he has set up a testing laboratory that assesses dimensions and performance of products and has passed ISO9001 quality system certification. With a do-it-yourself packaging plant spanning over 6,000 square meters, he offers a variety of fasteners to clients worldwide.
Core Competence: Non-standard Parts Production

Geobo has an R&D team and advanced manufacturing equipment enabling them to provide professional sample production services. They work according to customers' drawings and samples and cover product strength grades of 4.8 to 12.9. Additionally, they offer a wide range of surface treatment options, such as galvanized zinc plating, nickel plating, copper plating, mechanical zinc plating, Ruspert, Decromet, Magni, HDG, and lock glue.
Their packaging plant provides various materials and forms for do-it-yourself product packaging to ensure the products and packaging meet customers’ quality and appearance requirements. Product quality and on-time delivery are of utmost importance.
They have a strict quality inspection system equipped with high-precision inspection equipment which allows them to test products for tapping speed, salt spray resistance, hardness, and torque. They also use full-inspection optical sorting equipment and high-precision dimensional measurement projectors. They conduct regular random checks, precise checks, and third-party inspections to ensure meeting high-quality standards.
Great Sidekick for Photovoltaic Industry
The market has increased demand for cleaner energy, leading to exponential growth in the photovoltaic energy economy. The company produces some of the photovoltaic fasteners itself and keeps intimate cooperation with factories manufacturing other metal products, so they quickly enter the photovoltaic parts field and provide one-stop procurement service and quality assurance for foreign fastener wholesalers and solar panel mounting enterprises. They can also provide professional consultation and product support for overseas enterprises interested in entering the photovoltaic industry.
Expanding Sales to South America in 2023
Europe has been the driving force behind their overseas sales, but they're not stopping there. This year, they have ambitious plans to expand into new territories, such as Mexico, Brazil, and other South American markets, with optimism for the potential of South Africa. It's worth noting that they have already achieved a remarkable feat by exceeding last year's sales figures by 50%. They will maintain focus on key products such as outdoor and roof fasteners, stainless steel fasteners, and photovoltaic products. Kerry summed up: "Quality is the foundation of any successful company. Despite being in the basic fastening industry, we know product quality remains the bedrock of our steady progress."
by Dean Tseng, Fastener World 著作權所有:惠達雜誌

Company Focus 048 China Fastener World no.68/2023 惠達雜誌
非標緊固件拓銷南美 Contact: Kerry Tu Email: info@cngeobo.com
寧波卓邦金屬製品

China Fastener World no.68/2023 049
Zhejiang Ruizhao Technology Rising Dragon of High Quality Automotive Fasteners


Ruizhao Technology is a group of companies developing and manufacturing more than 3,000 types of standard and non-standard automotive fasteners, with an area of 38,880 square meters and multiple production bases. They employ about 166 people (including 24 people in R&D) and has total assets of RMB 155 million. Last year's turnover reached RMB 400 million, of which exports accounted for 20%. They entered the automotive market in 1996, supplying seat belt bolts, cylinder head screws, transmission parts, bolts, studs, screws, nuts, washers, retaining rings, rivets, pins, keys, plugs, grease nipples, clamps, snaps, seals, safety valves, CNC precision parts, more than 1,000 kinds of non-metallic automobiles fasteners, and many models of new energy vehicle fasteners that can be matched in bulk.
Excellent Conditions to Provide Competitive Edge for Global Customers
They are good at developing new products. With just a sample or drawing, they can do analysis, production and quality control on point. They have a full range of products and can provide manufacturers with one-stop service immediately, including raw material procurement, product development, cold heading, CNC machining, thread processing, hole drilling, slot milling, grinding, heat treatment, zinc and aluminum coating treatment, optical sorting, quality inspection, round check, laboratory check, packaging, and logistics. They control product quality starting from the source, and each manufacturing step has an inspection guideline. They save the cost of the control program and are moving towards the 50ppm goal. For the European market, they also offer a preferential tariff of 39.6%.


High-tech Enterprise with Multiple Certificates

They have passed ISO19001, IATF 16949:2016 quality system certification, ISO14001:2015 environmental management system certification and ISO45001:2018 occupational health and safety management system certification, and were awarded "Made in Zhejiang" and "National High-Tech Enterprise" in 2022. The trend of new energy vehicles is strong, and they have been paying attention to the fastener demand. Whether it is standard or nonstandard new product development, they will absolutely provide 300 samples (the number of samples depends on product characteristics) plus PPAP LEVEL 3 files to customers before mass production. It is for customers to confirm that the sample and PPAP files are correct before notifying Ruizhao Technology for mass production. In the face of the upcoming EU carbon tax, they are actively going for zero carbon emission. The production of fasteners during cold heading generates oil fumes, and the heat treatment line generates waste oil, waste water, waste gas, and waste from the zinc and aluminum coating line. In addition to waste separation, they also use purification equipment to improve the working environment in the workshop regardless of the cost. They reuse waste oil and waste water through purification loop to achieve environment protection.
Looking to Go Public on Stock Exchange
Their foreign trade team continues to grow, providing quality automotive fasteners and year-round after-sales to major global automakers, doubling their export value and paving the way to public trading on stock exchange. Looking ahead to the second half of 2023, they hope for steady growth in global economy, a rise in demand, and world peace while supporting the drive for global economy recovery.
050 China Fastener World Company Focus 惠達雜誌 Contact: Foreign Trade Manager, Mason Jiang Email:snlon@wz-snlon.com
World 著作權所有:惠達雜誌
浙江瑞昭科技 龍騰崛起的高品質汽車件 by Dean Tseng, Fastener


Haining Jinjie contact: General Manager Jacky Zhao
Email: jacky@gtfixen.com
Excellent Quality & Service HAINING JINJIE METAL Furniture Components are Sold Worldwide
Many market analysis reports show that previously low demand in the global housing market will soon bottom out by the end of this year as housing prices gradually stabilize and rebound, which is expected to indirectly drive the demand for peripheral furniture parts, and Haining Jinjie Metal Co., Ltd., specialized in the manufacture of a wide range of furniture parts, makes it one of the best and quickest ways for buyers around the world to get high quality furniture parts and complete after-sales service.
Advanced Processing Equipment & Quick Delivery
Haining Jinjie mainly produces deep hole hexagonal furniture screws, euro screws, JCBC screws, shelf supports, L&Z type Allen keys, connecting bolts, etc. Its factory is located in Haining City of Jiaxing (China) in the Yangtze River Delta Economic Zone, and is surrounded by Shanghai, Hangzhou, Ningbo and other major cities, with excellent geographical location and convenient transportation. It is very convenient for customers to visit its factory or export its products. In addition, in order to quickly respond to different needs of global buyers, Haining Jinjie has introduced 50 sets of advanced processing equipment into its 3,000 sq. m factory, including 10 sets of 1-die 2-blow heading machines, 2 sets of 2-die 4-blow heading machines, and 7 sets of 3-die 3-blow heading machines manufactured by Taiwanheadquartered Jern Yao Machinery. Its current monthly production capacity has reached an average of 12-15 containers, or 300 metric tons, which can quickly meet the product needs of customers around the world.
“With excellent product quality, competitive prices and well-recognized service, we have been receiving high reputation in Germany, Poland, Italy, Russia, Ukraine, Romania, USA and other countries for many years. We are looking forward to building stable and sustainable partnerships with more friends from around the world,” said General Manager Jacky Zhao.
Bestselling New Products, Continuous Eye-catching Sales in Europe
In addition to the stable supply of existing products, Haining Jinjie has recently developed two new furniture screws with specifications of 6m x 50mm and 7mm x 50mm, which have received positive feedback from many users and buyers in the market. Especially in its main export destination, Europe, the export percentage is as high as 40%.

“Furniture screws are a very important part of our product portfolio. With the use of high quality processing equipment from Taiwan and our export experience accumulated over the years, we are able to provide good and professional service to our customers,” said Zhao.

Haining Jinjie has obtained the ISO 9000 quality management and ISO 14000 environmental system certification. Its perfect management approach and behavior in the industry is obvious to all. “On the road of export sales, we also hope to expand into new markets such as South America in addition to Europe and other key markets. I am always optimistic about the challenges ahead, and I look forward to the company’s growth,” said Zhao.
by Gang Hao Chang, Vice Editor-in-Chief of Fastener World
著作權所有:惠達雜誌
品質服務俱佳
海寧金捷傢俱配件拓銷全球
5.0x50mm 6.3x50mm 7.0x50mm 7.0x70mm Company Focus 052 China Fastener World no.68/2023 惠達雜誌

Gwo Lian Celebrates 55th Years of Prosperity


Gwo Lian Machinery is not big but critical. From its workers to engineers, they all adhere to the spirit of “becoming a respected craftsman" in the future, which is also an internal declaration of Gwo Lian. Furthermore, the expectation for people to change their stereotype of the machinery industry and consider it “a driver of industry upgrade and value innovation” is also one of the reasons that the 55th anniversary event was given. Gwo Lian would especially like to thank all supporters on its road to success and hope that they can continue to give support and become Gwo Lian’s strong backup and motivation to go forward.
The event had shown quite active participation since the registration was open. The number of participants rose from the initial 550 to more than 700, not to mention those calling to confirm participation after the registration had been closed. The total number of guests from Taipei, other cities, and abroad was even over 300. “I’d like to express my sincere apology to all if anything was not arranged properly during the event and thank you all for your tolerance and understanding,” said President Ahung Chen.
The guests attending the event included political/commercial/ academic/art/hospital leaders, public interest groups, fasteners/ electronics/aerospace/hi-tech and other industries’ presidents, Business Weekly CEO, MISA, principals, professors, EMBA societies, and many other prominent figures (such as DirectorGeneral Tai-Hsiang Liao of Kaohsiung Economic Development Bureau, TIFI Vice Chairman Ann Hong and Supervisory Board Convener Simon Lin, TFTA Founder James Su and Honorary Former Chairmen Kosky Yen/Jim C.N. Chen/William Liao, Yieh Hsing Enterprise President Lin-Maw Wu, and MIRDC Chairman Ren-Yi Lin), clearly demonstrating Gwo Lian’s longterm dedication to the industries and President Chen’s wide and good personal connections.
“I’d attribute the perfect closure of the event to all guests on that day,” Gwo Lian President Chen said humbly.
On the same day, Gwo Lian and PwC Taiwan signed a cooperation agreement for the implementation of German SAP ERP system, looking forward to a higher level of corporate governance and digital transformation. President Chen, who humbly dares not to be called a Buddhist but is a follower of Buddhism, has been trained by his parents (Gwo Lian's founders) since he was a child and had an education for spiritual purification like Nalandabodhi Asia, as a result, he also donated NT$1.18 million to a Buddhist Institute in Hsinchu. In addition, Afnor Taiwan (one of the founders of ISO) also presented to
Company Focus
Gwo Lian President Chen awarded with AFNOR certificate as Sustainability Manager
Taiwanese artist BaiYu presents his painting to Gwo Lian President as the 55th anniversary gift
Lectures by Chief Sustainability Officer K.D. Tseng of WPG Holdings (revenue: TWD 700 billion), Executive Director Chaney Ho of Advantech (world’s top player in industrial computers with TWD 300 billion market value), and QST International President Mark Wu: • New Ways to Acquire Knowledge • Past, Present and Future of EVs • Exploring the Genes Behind Long-Standing Japanese Enterprises and the Path to the Century for Taiwanese Enterprises
From left to right: Excelsior Healthcare Group (Asia) President and GM Fang-Ming Fan, CB Ceratizit Chairman Wan-Lung Liao, Gem-Year Industrial President Yonglong Cai, Zhejiang Jiashan Taiwanese Company Association Honorary Chairman Chi-Li Chu, Gwo Lian President Chen’s wife Yuan-Yuan Chang
PwC President Jacky Lu signs collaborative contract with Gwo Lian Machinery on adopting German SAP ERP system President Chen, his mother and wife
Innovation, Heritage, Sustainability to Achieve Fastener
ESG-Driven
and Expects to Reach a New Height
Industry Upgrade and
Mission
創新、傳承、永續 實踐扣件產業升級ESG使命
President Chen a certificate to certify his excellent strategic management in sustainability.
With the 55th anniversary thanksgiving dinner, Gwo Lian hopes to do something special, not to sing the praises of something special, but to do something special with a normal heart and follow the altruistic spirit of the founders to give back to customers, colleagues and related supply chains. In addition to allowing industry professionals to get together, Gwo Lian also hopes to facilitate cross-industry exchanges and use this banquet to throw a brick to attract jade and call more attendees to support people and groups loving this land and making contributions, such as Lifeline Association of Kaohsiung, Bremer String Orchestra, MISA, Afnor, Artist BaiYu, Koji Pottery Artist Jung Wu, Artist Hsi-Chun Lin, Southern Taiwan Pops Orchestra Head Shu-Yuan Tsai and Director-General Jung-Hsiu Lu, etc.


ESG International Group CEO George Ren said: “Starting with design side, Gwo Lian knew the importance of the environment and pollution reduction, making environmental protection an integral element of themselves. As a secondgeneration successor, President Chen continues to carry forward the development foundation of the previous generation. Not only does he take good care of his employees, but he also values all aspects of ESG and sustainable development of his company.”
Chief Sustainability Officer K.D. Tseng of WPG Holdings said: “It's not easy for a company established 55 years ago to grow continuously. President Chen has been very serious and active in learning lots of things that should be learned for the sustainable development of a company. I believe his leadership will definitely make Gwo Lian stronger, and I wish Gwo Lian 100 years of prosperity.”
Executive Director Chaney Ho of Advantech said: “According to statistics, there are about 25,320 companies with a history of a century in Japan, while there are only 200500 in Taiwan. Currently, there are about 1,000 companies in Taiwan with a history of more than 55 years, and Gwo Lian is among them. President Chen is my first student in MISA. I wish continuous success to Gwo Lian celebrating its 55th anniversary under President Chen’s leadership, and I hope that Gwo Lian will take 100 years as the goal of sustainable development in the future.”
Minister of Labor Ming-Chun Hsu said: “In the past few years, the global environment has faced great changes, but Gwo Lian sees the future trend and begins developing smart


machinery to solve labor shortages, activates digital transformation, and strives to research and develop more environmentally-friendly but also efficient and ESG-driven machine models. Gwo Lian is definitely the best example of achieving a win-win in economic development and environmental protection.”
Kaohsiung City Deputy Mayor Da-Sheng Luo said: “Gwo Lian emphasizes sustainable innovation and has continued to grow its sales and profits despite the epidemic. Quality has always been its highest guiding principle, which has enabled it to create world-class machinery products. In addition, Gwo Lian focuses on the integration of proactive technology and has invested over NT$200 million in Luchu-based Kaohsiung Science Park to develop related digital wire drawing machines. In terms of ESG and net zero carbon emission, Gwo Lian has also developed related machines to minimize the damage of the industry to the environment, hoping to give the next generation a clean environment and fulfill the business mission. In the face of future challenges, Gwo Lian insists on high quality, high added value, and high value created by net zero to turn crises into business opportunities.”
Tong Ming President Ching Tung Tsai said: “I have been friends with President Chen and his father for over 40 years and have learned a lot from the legacy they have passed down through the generations. There must be a reason for the 55 years of prosperity of the company. President Chen's filial piety is also one of the reasons for the success of Gwo Lian’s business. President Chen’s thanks to his mother on his knees in a crowd of over 700 people is also an important spirit in Chinese traditional culture. In addition, President Chen is very good at learning and sharing, combining business and practice, and constantly realizing the value of life, which is not only worthy of recognition and blessing, but also can lead Gwo Lian to innovation and sustainable development.”
TAMI Chairman Larry Wei said: “President Chen is really serious about his business and continues to follow the spirit of ESG by introducing smart manufacturing in accordance with the requirements of the times. I wish that Gwo Lian will go up to the next level, its quality and profit will get better, and its machinery will be more advanced and can be marketed all over the world.”
President Chen said: “On behalf of Gwo Lian, I’d like to thank you all for accompanying us for the past 55 years. Because of you, we can have this humble achievement. Looking ahead, we see that the international supply chain has undergone radical changes. Gwo Lian recognizes the ESG concept and has a strong sense of mission for the development of Taiwan industries. Therefore, we regard environmental protection, social responsibility and corporate governance as our core values and invest more resources in them. We hope we can go to the next level and move towards the goal of being an outstanding 100-year enterprise, and make more contributions to Taiwan’s industry.”
Gwo Lian has thus far received international certifications from D&B, ISO9001, and CE. Its self-developed wire processing methods and machinery have also acquired patents in Taiwan, Japan, and EU. Its products have been successfully marketed in nearly 50 countries and have received high customer satisfaction and reviews industry-wide.
Hao Chang, vice editor in chief of Fastener World


055 China Fastener World no.68/2023 惠達雜誌
Minister of Labor Ming-Chun Hsu
Taiwan Association of Machinery Industry (TAMI) Chairman Larry Wei
President Ching Tung Tsai of Tong Ming Enterprise
Gwo Lian Machinery: +886-7-9515858 Gwo Lian Jia Xing: +86-573-84182518 Email: sales.dept@gwolian.com
Kaohisung City Deputy Mayor Da-Sheng Luo
國聯機械歡慶55周年 「五五生豐、再造巔峰!」
by Gang
著作權所有 惠達雜誌 :
President Chen donates NT$1.18 million to a Buddhist Tower in Taiwan during the 55th anniversary event, hoping that Buddhism will be passed down in Taiwan for 3,000 years
Gwo Lian is passionate about social welfare
The performance of Bremer String Orchestra
扣件新品大道
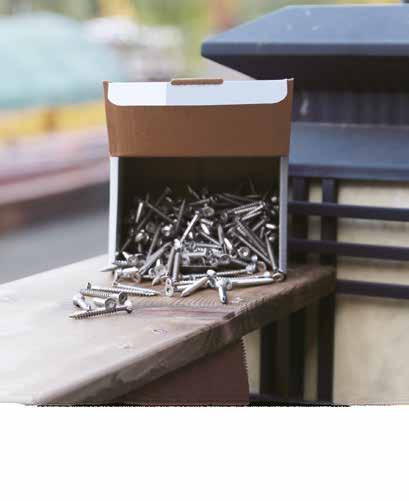
PowerPro® Structural Wood Screws

PowerPro® Structural Wood Screws available from Hillman are engineered for speed, low energy consumption, strength, and durability. A complete line of innovative Building Code Approved Structural Screws that outperform other fasteners. The new program provides a vast selection of screw sizes and head styles. The patented screw design offers features that are unmatched in the category and set a new benchmark for performance.
• Structural LAG – General purpose structural fastener designed for wood-to-wood construction and ideal for a variety of indoor and outdoor projects. Star-drive screw with low-profile head. 1/4", 5/16" & 3/8" diameters, lengths up to 12".
• TIMBERTITE® – Heavy-duty structural fastener ideal for landscape walls, decks, fencing, and other wood-to-wood connections. Hex-head screw. 1/4" diameter, lengths up to 10".
• LUMBERTITE® – General purpose, heavy-duty structural wood fastener designed for wood-to-wood construction without predrilling. Star-drive screw with low-profile flat head. 1/4" diameter, lengths up to 12".
• LEDGERTITE® – Designed to fasten the ledger board directly to the rim joist of a house without pre-drilling or the need for a washer. Hex-head screw with built-in washer. 5/16" diameter, 3-5/8" & 5" lengths.
• TRUSSTITE® – Designed to join engineered lumber together (LVL, PSL and LSL). Typically, these are joined with through bolts or nailing/screwing on both sides. Hex-head screw with built-in washer colored red for easy post-inspection identification.
Special Feature 056 China Fastener World no.68/2023 惠達雜誌
compiled by Fastener World (惠達編輯部整理)
New Fastener Accessory for Threaded Holes (NJD-2506)
"I'm a contractor and I wanted to create a new fastener accessory that can be used when reinserting a screw in a damaged threaded hole," said an inventor, from Milltown, N.J., "so I invented the NO MORE LOOSE SCREWS. My design would increase friction, allowing you to effortlessly drive the screw into the threaded hole."
The invention provides an effective way to help secure loose screws in wood with applications including cabinets, door hinges, and strikeplates. In doing so, it eliminates the spinning issues associated with damaged threads. As a result, it increases efficiency and it eliminates the need to re-drill and re-thread a hole. The invention features a practical design that is easy to install and use so it is ideal for contractors and do-it-yourselfers.
The original design was submitted to the New Jersey sales office of InventHelp. It is currently available for licensing or sale to manufacturers or marketers.
Disruptive Sealing Technology by JPB Système

The 5mm Smart Washer is a disruptive smaller-sized smart washer sealing technology that improves MRO efficiencies by reducing the need to manually check the torque level because of the touchless and wireless measurement of bolt axial load.
The thickness of the washer has been reduced by more than one-third. JPB Système from France has leveraged improvements in strain gauge technology to develop a smaller Smart Washer variant that is much easier to integrate and retrofit while delivering the same functional benefits as its larger counterpart. The smaller size of the washer allows for it to be used across an increased number of areas within the aircraft, whereas the original 7.6mm washer is more suitable to experimental scenarios in on-the-ground test environments.
The washer uses intelligent connectivity by incorporating a proprietary strain gauge, as well as a transmission system into the washer, which through an accompanying reading device (Smart Reader), relays the information to maintenance engineers. Engineers can be quickly alerted to fasteners that are too tight or too loose and can address them accordingly to limit aircraft downtime.
JPB now allows the engineers to view the percentage of the tension rather than just the value of the bolt axial load due to the relative measurement which calibrates the Smart Washer directly on the customer’s bolt. This has increased the accuracy of the device from +/- 6% to +/- 2.5%.
The new validated redundancy measurement allows Smart Washer to ‘control’ itself to eliminate incorrect readings in the unlikely event of a software issue. This is enabled by doubling the number of measurement points on the washer, which means that upon a false reading, the system immediately alerts the engineer before taking another measurement from another area of the device.
TAKECOAT-1000 from Japan
"TAKECOAT" developed by TAKENAKA SEISAKUSHO from Japan is claimed to take the highest share in the fluorocarbon polymer market globally. It can provide excellent rust and corrosion resistance in harsh environments such as in the sea and desert. It has 6-times the durability of hot-dip galvanizing as tested in a salt spray test.
TAKECOAT ® -1000 has a two-layer structure of fluorocarbon polymer as the upper film and a special under-treatment layer. Combined with a special treatment technology, the thin films are excellent in corrosion and rust resistance and have high lubricity, suited for fasteners. TAKECOAT has been used on bolts and metal parts used on bridges, insert pipes, marine structures and oil refineries.
Share Cross Drive Recess for Bits of Similar Sizes
In manual fastening and loosening of screws at construction sites and other workplaces, it is time-consuming to change bits for each screw drive recess, which causes users to disassemble and assemble with a bit that does not fit the recess, thus resulting in a collapsed recess.

To solve this problem, Japanese Nitto Seiko has developed "Share Cross" that can be used with bits of similar sizes. "Share Cross" is suited for various types of fastening and improves work efficiency in manufacturing operations.

"Share Cross" is a small cross-recess with another large cross-recess superimposed on it, so that bits of similar sizes (e.g., #2 or # 3) can be used on the same screw head recess. The structure is such that the drive surfaces for transmitting torque can be shared, which achieves the optimum fit of the bit and maximizes the performance.

Special Feature 057 China Fastener World no.68/2023 惠達雜誌
China Fastener World News
惠達特搜全球新聞
Association News
(China) Suzhou Fastener Smart Manufacturer Chamber Inauguration
On May 25, 2023, the inauguration conference of Suzhou Fastener Smart Manufacturer Chamber and the first Suzhou Fastener High Quality Development Forum were held in Suzhou. The conference was held in three stages, including Suzhou Fastener High Quality Development Forum, the inaugural conference and the dinner gala.

The first Board of Directors and Supervisors of the Chamber were announced. The general manager of Suzhou Guangxuan Fastener was elected as the president of the chamber. After that, the Chamber held a plaque awarding ceremony for the newly elected members of the Board of Directors and the Supervisory Board, and presented appointment letters to the advisor as well as the secretary of the Chamber.
The establishment conference of Suzhou Fastener Smart Manufacturers Chamber came to a successful end amidst the laughter in the dinner gala. The establishment of the Chamber represents a new chapter for the fastener industry in Suzhou, and adds new vitality and momentum to the quality development of the whole industry.
(China) Dongtai Fastener Industry Association Inauguration Conference


On April 22, Dongtai Fastener Industry Association celebrated its inauguration in the conference hall on the first floor of Qindong Government. Representatives from Guangdong Fastener Industry Association, Shenzhen Fastener Industry Association, Hangzhou Fastener Industry Association, Dinan Fastener Industry Association, Jiashan County Fastener Industry Association and Pinghu Fastener Hardware Association also attended.
The conference held a grand inauguration ceremony. Long-feng Huang was formally appointed as the president of Dongtai Fastener Industry Association, Yuan-ben Dai was appointed as the honorary president and Zhong-jian Yin was appointed as the honorary president, and the directors in the conference presented plaques to the three presidents and took a group photo.
Hong Kong Screw & Fastener Council 20th Anniversary Party and 10th Chairman Inauguration Ceremony
On the evening of May 15, about 500 members of Hong Kong Screw & Fastener Council (HKSFC) gathered together to celebrate the 20th anniversary.
The 10th Council Chairman, Mr. Ping-fai Tsui, expressed his gratitude to the leaders and guests who attended the ceremony. Over the past 20 years,
058 China Fastener World no.68/2023 惠達雜誌
compiled by
World
Fastener
惠達編輯部 整理
with the concerted efforts of everyone, the platform of HKSFC has become more and more stable and has received the care and support from the industry colleagues, the government and the society, which has enabled HKSFC to grow stronger and stronger.
On the spot, Mr. Ping-fai Tsui presented the appointment certificates to the 10th Council members. He encouraged the Association to continue to play a bridging role and contribute more to the Hong Kong fastener industry.
Industry Development

Structural Wood Screws Market to Hit US$7.5 Billion by 2032

Structural Wood Screws Market is expected to cross a valuation of USD 7.5 billion by 2032, according to the latest research report by Global Market Insights Inc.

The industry growth is driven by the increasing demand for these screws in construction and home improvement projects. Expansion of the construction industry has led to the extensive usage of these screws for framing, decking, and other structural applications. Additionally, the growing popularity of DIY projects among homeowners is likely to support the business expansion. As more and more people are taking up DIY projects to save money and customize their homes, the demand for these screws is expected to increase further.
The carbon steel structural wood screws market is set to gain immense traction from 2023 to 2032 owing to the robust expansion of the building sector in emerging nations and growing public awareness of the advantages of utilizing high-quality building materials. Carbon steel screws are ideal for use in building projects due to their high tensile durability and sturdiness. Additionally, they are less prone to corrosion and rust, which increases their lifetime, and contributes to their higher acceptance rate.
The structural wood screws market has been steadily growing from the furniture and crafts application segment as more manufacturers and DIY enthusiasts use these screws in their projects. One of the primary benefits of structural wood screws is their capacity to withstand heavy weights, which makes them ideal for use

in furniture where weight and pressure are a concern. Structural wood screws are used in the arts and crafts business to make a range of things, including picture frames and birdhouses, which are likely to foster segment growth through 2032.
The structural wood screws industry in Europe is set to register significant growth through 2032 as more constructions are opting for wood-based structures. The increasing focus on reducing carbon footprints, there is a growing preference for wooden structures over concrete and steel. Moreover, as the demand for wooden structures continues to grow, the regional market is set to record substantial development through 2032.

059 China Fastener World no.68/2023 China Fastener World News 惠達雜誌
EU Approved Several Major Climate Policies in Mid-April


The European Parliament approved several major climate policies on April 18 to pave the way for achieving EU's carbon reduction targets. First, the Emission Trading System (ETS) will phase out free carbon credits, while the carbon border adjustment mechanism (CBAM) will be officially implemented in 2026 to raise carbon tax on imported iron, steel, cement and other products. EU expects to set up a second ETS in 2027 to include carbon emissions from buildings and transportation. Finally, EU will also create a new social climate fund to reduce the energy and transport burden on the poor.
These bills are largely based on agreements reached between the European Parliament and EU member states at the end of 2022. Although the European Parliament will pass the bills and the member states will vote on them before they are formally adopted, it is expected that there will not be many changes. The series of bills passed by the European Parliament are all part of EU's large-scale climate change plan "Fit for 55", which aims to reduce net greenhouse gas emissions by 55% by 2030 compared to 1990.
The reform of the EU carbon market was approved by the European Parliament with 413 yeas, 167 nays and 57 abstentions. The carbon market mainly regulates the power generation industry and factories. Under the principle that polluters should be the ones to pay, they must purchase carbon credits to offset
their carbon emissions. The new rules require these sectors to reduce their greenhouse gas emissions by 62 percent in 2030 compared to 2005, and will phase out free carbon credits from 2026 to 2034.
Reuters reported that carbon emissions from the sectors covered by the ETS have been reduced by 43% since 2005. In addition, the price of carbon credits in the European carbon market has come to 94 euros per metric tonne, almost four times the price in early 2020, due to the expected psychological impact. In February this year, the price exceeded 100 euros per metric ton.
In addition, the European Parliament voted to set up a new carbon market, namely ETS 2, for the transport and construction sectors in 2027. The proviso is that if energy prices are unusually high in 2027, the schedule will be extended to 2028. The European Parliament has also voted to include the shipping sector in the ETS, and shipping will be required to pay for carbon emissions from 2024 onwards; in the aviation sector, free credits will be phased out by 2026 to encourage the use of sustainable aviation fuels.

India's Current Measures in Response to CBAM
India has set up an inter-ministerial group to study the impact of EU's Carbon Boundary Adjustment Mechanism (CBAM). India's initial assessment is that the main impact will be on exports of steel, iron and aluminum, which will be taxed at 20%-35% after the official


060 China Fastener World no.68/2023 China Fastener World News 惠達雜誌
implementation. The inter-ministerial group is exploring ways to mitigate the impact of the CBAM on Indian exports and is considering ways to assist the industry, including mutual recognition of inspection and certification bodies and the Carbon Credit Trading Scheme (CCTS); in addition, EU has developed different taxation standards for steel produced in lowemission short-process electric arc furnaces and steel produced in blast furnaces. India needs to investigate the structure of the domestic steel industry first to help manufacturers transform.
The CBAM Impact on China
EU's carbon tax policy will have a more obvious negative impact on China. The reason is that China is the world's factory in global division of labor, producing a large number of products for the world market, and it is also a major exporter of industrial goods, exporting a large number of products to developed markets. EU had been China's largest trading partner for years, and only in recent years has it receded to become China's second largest trading partner. Such characteristics put China right under the constraints of the EU's carbon tariff policy. For China, it not only consumes a lot of energy and environmental resources to produce products for the international market, but also has to bear the resulting carbon costs.

Among the products currently covered by the EU carbon tax, steel and aluminum are the main targets. Among the countries covered by the EU carbon tax, the largest source of both steel

and aluminum is China. However, the proportion of steel and aluminum in China's total exports to Europe is not high. According to the data provided by the industry, in 2022, China's steel exports to Europe amounted to 15.1 billion euros, accounting for 2.4% of China's exports to EU; aluminum exports to Europe amounted to 4.5 billion euros, accounting for 0.7% of China's total exports to EU.
The EU launched the carbon tax in an attempt to protect local enterprises in the EU. As the world's largest carbon emitter, China needs to study and prepare in advance in these aspects, and strive to intervene as soon as possible in the rule-making stage.
How Much Carbon Tax will China Steel Industry Have to Pay to the EU in the Future?
The director of the Institute of Metallurgical Industry Planning of China said that although CBAM was officially approved, the calculation method of the actual price paid for carbon emissions from steel products is not yet clear. Therefore, the annual carbon tariff that China's steel industry will have to pay to the EU after CBAM is implemented cannot be accurately estimated, and can only be roughly calculated based on the materials available and the understanding of the EU carbon market. Based on CBAM rules that have been issued, considering the annual volume of steel products exported from China to the EU (e.g., 3.89 million tons in 2022), as well as the total amount of steel products exported to the EU (e.g., US$6.44 billion in 2022), and the carbon price in the EU
061 China Fastener World no.68/2023 China Fastener World News 惠達雜誌
carbon market, a preliminary estimate shows that the export cost of the Chinese steel industry will increase by 4%-6%. Roughly UD$200 million to US$400 million per year in carbon tax will have to be paid to the EU.

(China) West Chongqing Region to Double the Size of the Parts Industry by 2027


On May 9, Chongqing Municipal People's Government released the "Action Plan for Doubling the Development of Smart Networked New Energy Auto Parts Industry in West Chongqing Region (2023-2027)" (hereinafter referred to as the "Action Plan"). According to the plan, by 2027, the scale of smart networked new energy auto parts industry in western Chongqing will double, the number of auto parts enterprises will reach 1,000, and the output value will reach RMB 400 billion.

Jiangjin District, Hechuan District, Yongchuan District, Dazu District, Bishan District, Tongliang District, Tongnan District, Rongchang District and other areas in western Chongqing are the "pillars" of the development of Chongqing's smart networked new energy auto parts industry.
In order to further promote the high-quality development of the smart networked new energy vehicle parts and components industry in western Chongqing, to build a high-quality ecology, and to strongly support the construction of Chongqing's world-class industry cluster, the Action Plan sets the goal of building a number of innovation platforms, breaking through a number of core technologies, developing a number of special products, developing a number of special products, creating a number of industrial chains, and accelerating the establishment of the country's leading industry base.
SAIC Group's New Energy Vehicles to Expand Overseas

From April 26 to 29, Shanghai Mayor led a delegation from Shanghai to Indonesia to promote high-level and pragmatic collaboration between Shanghai and Indonesia to build a link between China and Indonesia.
During his meeting with Minister of Maritime and Investment Coordination, Shanghai Mayor said he would further deepen the economic and trade relations and industrial cooperation between Shanghai and Indonesia, support enterprises to expand two-way investment cooperation, and welcome more Indonesian enterprises to participate in expositions. The Mayor and the Minister witnessed the
062 China Fastener World no.68/2023 China Fastener World News 惠達雜誌

China Fastener World no.68/2023 063
signing of a Memorandum of Understanding for SAIC-GMWuling Indonesia's new energy vehicle project.
On April 30, SAIC Group announced that its subsidiary SAIC-GM-Wuling and the Ministry of Marine and Investment Coordination of Indonesia officially signed a memorandum of understanding on new energy vehicle investment projects, which will actively expand investment in Indonesia, and introduce more new energy vehicles to the local market.
China's Crude Steel Output Rises to RMB 261.56 Million Tons in Q1
Official figures show that in the first quarter, China's crude steel production rose to 261.55 million tons, up 6.1% year-onyear; steel production rose to 332.59 million tons, up 5.8% year-on-year. In the first quarter, the apparent consumption of crude steel amounted to 243.42 million tons, up 1.9% year-onyear. In March, China's crude steel production averaged 3.09 million tons per day, the highest level ever for the same period.
According to China Iron and Steel Association (CISA), in the first quarter, the average China Steel Price Index (CSPI) was 117.32 points, down 13.68% year-on-year. Since the beginning of this year, despite the steel prices having picked up month by month, the end of March CSPI landed at 118.54 points, an increase of 2.88% over the end of last year, but in the same period, the price of imported iron ore was also rising month by month, reaching USD 117.70 per ton in March, an increase of 27.8% over the end of last year.
Almost Half of the Spanish will Consider Buying Chinese New Energy Vehicles
According to the Spanish press Diari de Tarragona, almost half of the Spanish people would consider buying a Chinese car as their next car, as Chinese new energy vehicles are on the rise. In Germany and the UK, the number of people who think so also reached 30% and 29% respectively. According to the report, China's new energy vehicles are of high quality and affordable, and are already leading the world in the field of electric vehicles.
A figure released in April by Spain's ANFAC (Association of Automobile Manufacturers) shows that the value of Chinese cars sold in Spain in 2022 will be about 1.39 billion euros, 68 million euros higher than in 2021, which means that Chinese car brands are gaining a foothold in the European market.

However, there are still some people who have opinions about cars made in China. For example, 47% of respondents have doubts about the quality of manufacturing, 43% are worried about aftersales service, 31% are unfamiliar with Chinese brands, and 17% and 9% are due to political stance and aesthetic issues.
Chongqing City Signs More Than RMB 200 Billion Projects Focusing on New Energy Vehicles
Chongqing City 2023 Q1 Investment Meeting and Contract Signing was held in Chongqing on April 6th, with 70 major investment projects, and the official contract investment amounting to RMB 208.67 billion. The project focuses on smart network for new energy vehicles, integrated circuit, biomedicine, software information, technology innovation and other key industrial areas.
According to the introduction there are 55 projects above RMB 1 billion , accounting for 78.6% of the signed contracts; among them are 5 projects of RMB 10 billion, 10 projects of RMB 5 billion, 10 projects of RMB 3 billion and 30 projects of RMB 1 billion. The projects are mainly industrial-based, with 49 industrial projects and a formal contract investment of RMB 176.85 billion, accounting for 70.0% and 84.8% of the signed contracts respectively.
Companies Development
SENCO Opens Global Headquarters in Cincinnati

KYOCERA SENCO Industrial Tools (SENCO), a global leader in fasteners and power fastening tools, has announced the opening of its official global headquarters in Cincinnati, Ohio. The newly renovated facility will bring employees from all SENCO divisions under the same roof, allowing closer collaboration and improved quality control, as well as fostering innovation.
The grand opening held on May 25 follows an extensive expansion and renovation of the company’s production facility that began in 2021. The renovation project added 32,000 square feet of new office space for business operations staff, including executive, sales, marketing, and administrative teams. SENCO employs 400 American workers, approximately 80% of whom are now headquartered at the new facility.
Kyocera Corporation, of Kyoto, Japan, acquired SENCO in 2017 and has invested millions of dollars in the Cincinnati facility to support manufacturing equipment and research and development projects over the past four years.
The construction project began in January 2022 and was recently completed with all Cincinnati based employees now
064 China Fastener World no.68/2023 China Fastener World News 惠達雜誌
working from the updated facility. Besides office and manufacturing space, the new facility is designed to have a campus-like atmosphere that inspires employees’ personal and professional development and engagement. It includes a cafeteria serving hot meals and a dedicated training, product education and innovation center.
BUMAX Continues to Deliver Fasteners That are Out of This World

Specialist fastener manufacturer BUMAX has been selected to provide crucial fasteners to be used on the International Space Station (ISS). BUMAX 88 fasteners will be used to secure a new payload going to the ISS to measure the speed of sound. BUMAX premium fasteners include some of the strongest in the world and are being used in a variety of extremely demanding and cutting-edge scientific applications, such as at the scientific research institute CERN in Switzerland and for the world’s largest optical telescope in northern Chile.
The space sector continues to benefit from the BUMAX fastener range with various applications. BUMAX extra strong and fatigue resistant model 88 has been selected to securely fasten the housing of a new payload on the ISS called Granular Sound. Granular Sound is an experiment in space to measure the speed of sound through a cube filled with glass balls (a so-called package) in microgravity at different package pressures. The experiment uses thousands of glass balls to simulate granular media like sand or concrete.
“The housing of this package will be securely fastened by BUMAX 88 fasteners to avoid the balls from flying around the ISS,” said Lukas Pfeiffer, Project Manager & Systems Engineer at OHB System AG. “The microgravity experiment will provide valuable data for various terrestrial and space applications – from more effective concrete processing to 3D printing in space or on the moon.”
The enhanced properties of BUMAX 88 fasteners are achieved through a combination of unique BUMAX manufacturing processes and the highest quality European steel. “Being trusted with supplying fasteners for projects such as CERN and ISS, which are essential to the evolution of mankind, is of course a source of immense pride and a testament to the quality of our products and BUMAX as a whole,” said Lars Holm, Managing Director, BUMAX. “Being chosen again and again for the most demanding applications means that all our existing and new customers can rest assured that they are getting the best of the best.
Huyett Welcomes New Regional Sales Manager John McCall

Huyett is proud to announce the addition of John McCall as Regional Sales Manager for the Northeast region and Ontario, Canada. McCall began his career in industrial parts and equipment sales 35 years ago as a sales manager for WAHA Company while completing his MBA at Union College in Schenectady, NY. He then moved into a retail consultant position at True Value Company, where he managed regional advertising programs, implemented open market surveys, and developed strategic business plans. During his time with True Value, he ranked #2 nationally in sales revenue increase and signed a record number of new stores in 2004. His career has earned him multiple records in sales activity at Briggs and Stratton Company and CNH Industrial and given him strategic, creative, and managerial marketing experience.
McCall states that his choice to join Huyett’s team was largely influenced by Huyett’s leadership, honesty, and values: “They don’t just have their mission statement on a wall. They live those words. It is not every day you see this culture and the people working in it. When you have an opportunity to be part of something like that, you take advantage of it and work to contribute and grow it.”
Huyett CEO, Timothy O’Keeffe, believes the new addition will bring unique expertise and experience to contribute to Huyett’s goal of developing personal customer relationships.
065 China Fastener World no.68/2023 China Fastener World News 惠達雜誌
French JPB Système Announces Production Milestone of Five Million Flight Parts
JPB Système, manufacturer of cost- and timesaving technology solutions for aerospace, aeronautic and other industries, has announced that it has manufactured five million separate flight parts since the start of its production operations over twenty years ago. The milestone predominantly comprises component parts used to produce JPB Système’s innovative LULYLOK™ B-nut selflocking device and borescope self-locking plug, both of which are supplied to global aircraft engine manufacturers including Safran, Rolls Royce, GE and Pratt & Whitney. The figure also includes a number of other smaller parts, fittings and fasteners produced across the company’s Industry 4.0 enabled manufacturing facilities.
As an advanced B-nut for fittings, JPB Système’s LULYLOK™ solution features a unique self-locking device to ensure the sealing of pipes and tubes, thereby preventing loosening and leakage caused by severe vibration and extreme thermal conditions.
Crucially, LULYLOK™ addresses safety concerns by eliminating the need for a lock-wire or safety cable, tab washers, cotter pins or any other method of fastening to secure the threaded parts within an aircraft’s engine. This eliminates foreign object damage while reducing maintenance costs and installation time. Similarly, the simpleto-use self-locking borescope plug – which, like LULYLOK™, comprises four separate components – eradicates the need for lock-wires when securing an engine’s connections prior to visual inspection. Initially created for SAFRAN in the 1990’s, the device reduces human error and overall risk while improving efficiencies by reducing maintenance time from one hour to just 10 seconds.
As has been the case for many years, JPB Système’s self-locking devices are deployed by many of the world’s leading aerospace manufacturers across various aircraft engine types. These include the CFM56 from GE/Safran joint venture CFM International – acknowledged as the best-selling engine in commercial aviation history and the standard engine across the Airbus A320 and Boeing 737 families; as well as CFM’s LEAP-1A, 1B and 1C engines, Pratt & Whitney’s GTF and Rolls Royce’s Trent 1000 for the Boeing 787 Dreamliner.
Leading Chinese Auto Parts Company Invests RMB 1.5 Billion in Zhongde Industrial Park

On May 28, the construction of Huaxiang New Energy Auto Parts Industrial Park was officially launched within Zhongde (Shenyang) High-End Equipment Manufacturing Industrial Park.

It is reported that the project of Huaxiang New Energy Auto Parts Industrial Park, with a total investment of RMB 1.5 billion, is a modernized park integrating R&D, production and sales. The park is planned to have a total construction area of about 120,000 square meters, mainly containing R&D and testing centers, industrial plants, comprehensive office buildings and related ancillary facilities.
After the project is completed, it will mainly support Brilliance BMW's new energy vehicles with automobile chassis, interior and exterior parts and battery shells, as well as develop upstream and downstream business related to the auto parts industry. The park is planned to be completed and put into production in May 2024. After the project reaches production target, it is expected to add an annual output value of RMB 1.8 billion and an annual tax of RMB 80 million.
(China) Essence Fastening Revenue in 2022 Grows 19.22%

Essence Fastening disclosed its 2022 financial report, showing that the company achieved revenue of RMB 470 million in 2022, up 19.22% year-on-year, and net profit attributable to shareholders of the listed company of RMB 6.2 million. In addition, the company intends to distribute a cash dividend of RMB2.5 (including tax) for every 10 shares to all shareholders.
The products are mainly used in the connection and fastening of key parts of automobile engine turbo systems, gearshift parking control systems, automobile exhaust systems, automobile seats, lights and mirrors and other interior and exterior systems.
In the first half of 2022, demand in the automobile industry shrank and sales volume declined year-on-year, while in the second half of 2022, with the introduction of a series of policies to promote automobile consumption, automobile sales volume rebounded and the company's performance rebounded. By quarter, the company's operating revenue in respective quarters of 2022 was RMB 103 million, 83 million, 148 million and 135 million.
066 China Fastener World no.68/2023 China Fastener World News 惠達雜誌
Acquisition

Ford Aerospace Acquired by SPIROL

SPIROL is pleased to announce that Ford Aerospace Ltd based in South Shields, UK will be joining the SPIROL group of companies. Ford Aerospace was founded at Tyne Dock in 1910 by Robert Ford, and the family business has most recently been led by the founder’s great-grandson, Chris Ford. The company specializes in manufacturing high precision metal components and sub-assemblies for the aerospace, industrial, and high-technology sectors. It’s been a leading supplier over its 113 year history dating back almost as far as the first recorded flight in 1903 by the Wright Brothers.


Speaking about the sale, Chris Ford said, “Ford Aerospace is, and always has been, here for the people, especially our dedicated and skilled team, and it was important that any new Ford Aerospace owner shares the values that have been at the heart of the company for over 100 years. Our two companies have a long history of working together, dating back to 1980 where SPIROL licensed a specialized manufacturing process from Ford Aerospace, which is still in use today. SPIROL respects Ford’s strong position in the UK market and our product manufacturing knowledge. SPIROL and Ford’s approach to its employees and its customers align wonderfully, and I am excited to see our strong business carry on as part of the successful SPIROL group.”
Ford Aerospace’s technical skills in ‘space compensating’ management – the production of laminated and solid shims which ensures fast, precision tolerance compensation used on products such as fuselages, gearboxes and movable components – was a key offering that attracted SPIROL. These solid and laminated shims enable clients to reduce stock of individual shims and offers the option of “sizing” a particular shim by adjusting the shim pack to the desired thickness on assembly. These products simplify the assembly process while simultaneously reducing the overall cost of the assembly.
067 China Fastener World no.68/2023 China Fastener World News 惠達雜誌

China Fastener World no.68/2023 068


China Fastener World no.68/2023 069


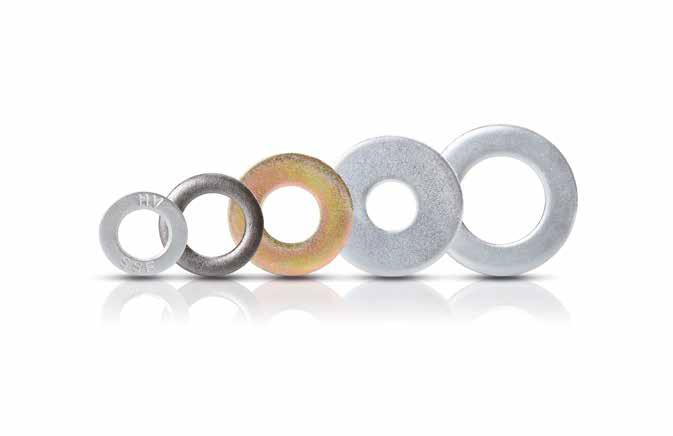


Comparing Chinese Automotive Fastener Market Demand Before and After the Pandemic
中國疫情前後車用扣件市場景氣比較
Automotive fasteners are an important component of the automotive industry, as they are used in the assembly and construction of vehicles. While specific statistics for automotive fasteners may vary, they are generally considered to be closely related to overall automotive statistics. Here are some potential connections between automotive fastener statistics and broader automotive trends. The number of fasteners used in a car can vary depending on the make and model, as well as the specific components and parts used in the vehicle. However, on average, a typical car is estimated to have around 3,000 to 4,000 fasteners. These fasteners can include a wide range of types and sizes, including bolts, screws, nuts, washers, and clips, among others. The exact number and type of fasteners used in a car can vary depending on factors like vehicle size, weight, and intended use, as well as the manufacturer's design choices and production processes. Therefore, analysing the automotive industry in China can illuminate the situation of automotive fastener situation in this country.
Chinese Automotive Market Before the Pandemic
Chinese automotive industry has long been considered one of the largest and fastest-growing industries in the world, and for a good reason. In 2019, China produced over 25 million vehicles, accounting for approximately 30% of the global production, providing employment for millions of people and being a significant contributor to the Chinese economy.
However, the outbreak of COVID-19 in early 2020 had a significant impact on the industry, with vehicle production and sales in China declining sharply in the first quarter of the year due to the lockdowns and travel restrictions imposed to contain the spread of the virus.

Despite this initial setback, Chinese automotive industry showed signs of recovery in the second half of the year as the Chinese government implemented measures to stimulate demand and support the industry's recovery. According to the data from China Association of Automobile Manufacturers (CAAM), vehicle sales in China reached 25.3 million units in 2019, representing a 9.6% decline from the previous year. However, the industry rebounded in 2020, with vehicle sales increasing by 6.4% to 25.3 million units.
The recovery was driven by increased demand for new energy vehicles, which saw a sales increase of 10.9% in 2020. This increase was partly due to the Chinese government's promotion of new energy vehicles and the implementation of policies to support the development of the industry.
In terms of production, the pandemic also had a significant impact, with China producing 25.72 million vehicles in 2019, but production declining by 2% in 2020 to 25.24 million units. However, the production of new energy vehicles increased by 10.9% to 1.37 million units in 2020, indicating a growing interest in sustainable and environmentally friendly modes of transportation.
The recovery of the Chinese automotive industry has been a significant boost to the country's economy, as it provides employment for millions of people and contributes significantly to GDP. The Chinese government's measures to stimulate demand and support the industry's recovery have also been instrumental in its resurgence.
Industry Focus 076 China Fastener World no.68/2023 惠達雜誌

In conclusion, while the outbreak of COVID-19 had a significant impact on the Chinese automotive industry, the industry showed remarkable resilience in bouncing back in the second half of 2020. Increased demand for new energy vehicles and the implementation of government policies to support the industry's recovery were crucial factors in this rebound. Chinese automotive industry remains a key player in the global market and will continue to be a significant contributor to the Chinese economy in the years to come.
Chinese Automotive Market After the Pandemic
According to industry reports and projections, Chinese automotive industry is set to continue its recovery in 2022 and 2023 after the disruptions caused by the pandemic. Despite the challenges faced by the industry in recent years, several factors are expected to contribute to its growth in the coming years.
1. Strong domestic demand is a major driver of the industry's growth. Chinese government has implemented measures to support the domestic auto market, including tax cuts and incentives for new energy vehicles. The growing middle class in China is also expected to continue driving demand for vehicles, particularly SUVs and luxury cars.
2. Another key factor is continued growth in new energy vehicles (NEVs). China is already the largest market for NEVs, and the government has set ambitious targets for their adoption. The production and sales of NEVs are expected to continue growing, driven by subsidies, incentives, and stricter emissions regulations.
3. Digitalization and automation are also playing a crucial role in the industry's recovery. Chinese automakers are investing heavily in technologies such as 5G, artificial intelligence, and robotics to improve efficiency, reduce costs, and enhance competitiveness.
4. In addition, China's Belt and Road Initiative is expected to create new export opportunities for Chinese automakers, further fuelling the industry's growth.
Chinese carmakers produced 27.02 million units in 2022, up by 3.4% year on year, while sales rose by 2.1% to 26.86 million units, the data from the China Association of Automobile Manufacturers (CAAM) shows. The year-on-on year growth in output and sales last year came despite multiple headwinds faced by the Chinese automotive industry, including the resurgence of Covid-19, a shortage of semiconductor chips, high battery raw materials prices and an unstable geopolitical situation, CAAM said. The purchase tax for vehicles priced below 300,000 yuan (US$45,000) and with 2-liter or smaller engines was 5% of the sticker price between June 1 and December 31, 2022, down from 10% previously, according to China’s Ministry of Finance. In December 2022, China’s automobile output totalled 2.38 million units, down by 0.3% month on month and down by
References:
18.2% year on year. Sales reached 2.56 million units last month, up by 9.7% month on month but down by 8.4% year on year. The rapid spread of Covid-19 in China following the relaxation of the country’s Zero Covid policy during December resulted in a decrease in consumer activity. As a result, automobile output and sales did not achieve the expected growth for the month, CAAM said. China’s output and sales of electric vehicles (EVs), meanwhile, continued to register strong growth in 2022, both setting fresh record highs in the final month of the year. EV output in China totalled 7.1 million units in 2022, an increase of 96.9% year on year, while sales of such vehicles rose by 93.4% to reach 6.89 million units. For December 2022, EV output came to 795,000 units, up by 3.52% month on month and up by 51.80% year on year. EV sales totalled 814,000 units last month, up by 3.56% month on month and up by 51.80% year on year.6
Car Production in China increased to 1,715,000 units (1,715K units) in February 2023; it was 1,397,000 units (1,397K units) in January 20237.
The Future of Car Manufacturing in China
Potential statistics that were projected include vehicle sales in China growing at an average annual rate of 2.1% from 2021 to 2025, reaching around 30 million units by 2025. NEV sales in China are projected to reach 6.6 million units by 2025, accounting for over 20% of total vehicle sales. China's share of the global NEV market is expected to grow to over 50% by 2030, up from around 45% in 2020. The market share of Chinese automakers in the global automotive market is expected to increase to around 20% by 2025, up from around 12% in 2019. Chinese automotive aftermarket is expected to grow at an average annual rate of 9.2% from 2020 to 2025, reaching around RMB 2.8 trillion (USD 400 billion) by 2025.

Overall, Chinese automotive industry is expected to continue its upward trajectory in the coming years, driven by strong domestic demand, growth in NEVs, digitalization and automation, and expanding export opportunities.
1. China Association of Automobile Manufacturers (CAAM). (2021). 2020 Automotive Industry Report. https://www.caam.org.cn/xinwen/gonggao/20210108/249804.html (in Chinese)
2. China Association of Automobile Manufacturers (CAAM). (2020). CAAM: China's Automobile Market in April 2020. https://www.caam.org.cn/xinwen/gonggao/20200514/244691.html (in Chinese)
3. Gao, Y. (2021). Chinese Auto Industry Recovery. International Trade Administration. https://www.trade.gov/knowledge-product/chinese-auto-industry-recovery
4. Li, C., & Dai, X. (2021). China's 2020 Vehicle Sales Rebound, But Global Chip Shortage Looms. Nikkei Asia. https://asia.nikkei. com/Business/Automobiles/China-s-2020-vehicle-sales-rebound-but-global-chip-shortage-looms
5. Statista. (2021). China: Passenger Cars in Use 2009-2020. https://www.statista.com/statistics/278634/passenger-cars-in-use-in-china/
6. https://www.fastmarkets.com/insights/chinese-automobile-output-sales-rise
7. https://take-profit.org/en/statistics/car-production/china/
Article by: Behrooz
Industry Focus 078 China Fastener World no.68/2023 惠達雜誌
Lotfian Copyright owned by Fastener World 著作權所有:惠達雜誌

Analyzing the Post-pandemic

Chinese Construction Fastener Market


TheCOVID-19 pandemic had a significant impact on the global economy, and the Chinese construction fastener market was not immune to this impact. However, with the rollout of vaccines and the gradual reopening of Chinese economy, the construction fastener market in China is poised to recover and grow.
Chinese Infrastructure Projects and Its Relation to Construction Fasteners


One of the key drivers of the Chinese construction fastener market is the country’s massive infrastructure development projects. Chinese government has announced plans to spend trillions of dollars on infrastructure (buildings, bridges, tunnels, and other infrastructure projects) over the next few years, which will create a huge demand for construction


分析疫後中國建築扣件市場
fasteners. Additionally, the increasing urbanization in China, coupled with rising disposable incomes, is expected to drive demand for housing, which will further fuel the construction fastener market. Some of the projects that improve the numbers in the construction fastener sector are:


Belt and Road Initiative: This is a massive infrastructure project that aims to connect Asia, Europe, and Africa through a network of roads, railways, ports, and other infrastructure. The Chinese government has already committed over US$1 trillion to this project, and it is expected to continue for many years.


High-speed rail: China has the world’s largest high-speed rail network, with over 22,000 miles of track. The government plans to continue expanding this network, with a target of 30,000 miles of high-speed rail by 2025.


Urbanization: China’s urbanization rate is expected to reach 70% by 2030, which will require significant investments in urban infrastructure such as transportation, housing, and utilities.

Industry Focus 080 China Fastener World no.68/2023 惠達雜誌
Renewable energy: China is the world’s largest producer of renewable energy, and the government plans to continue investing in this sector. In 2020, the government announced a plan to invest over $360 billion in renewable energy by 2025. (The construction of 5G infrastructure often involves the installation of small cell sites on utility poles, streetlights, and other existing infrastructure. This requires specialized fasteners that can securely attach the small cells to the existing infrastructure without damaging it.)
5G network: China is also investing heavily in 5G networks, with a target of providing 5G coverage to all urban areas by 2025. This will require significant investments in infrastructure such as base stations, fibre optic cables, and data centres. (The construction of 5G infrastructure requires a variety of construction fasteners that support the installation of 5G equipment. These fasteners are used in the installation of antennas, base stations, and other equipment that make up the 5G network.)
Airport expansion: China has the world’s largest aviation market and plans to expand its airport network significantly. The government has announced plans to build new airports and expand existing ones, with a goal of having 450 airports by 2035.
Rural infrastructure: Chinese government is also investing in infrastructure projects in rural areas, such as building new roads, bridges, and water supply systems. This is aimed at improving living standards and reducing poverty in these areas. Chinese government plans to invest CNY 1.2 trillion (approximately USD 183 billion) in rural infrastructure over the next three years.
The Chinese Consume Smart Fasteners in Their Construction Projects

Another trend that is expected to drive the Chinese construction fastener market is the growing adoption of smart fasteners. As the demand for safer and more durable structures increases, smart fasteners are likely to become more widely adopted. Chinese government has been promoting the use of smart fasteners in various infrastructure projects as a way to improve the efficiency and safety of these structures. Smart fasteners are designed to provide realtime monitoring of the performance of structures they are installed in, by measuring factors such as stress, temperature, vibration, and strain. Chinese government has recognized the potential benefits of using smart fasteners in various infrastructure projects, including bridges, tunnels, highways, railways, and buildings. The use of smart fasteners can help to detect potential problems early, prevent structural failure or damage, and reduce maintenance costs over the long term. In recent years, Chinese government has been investing in the research and development of smart fasteners and promoting their use in infrastructure projects. For example, the government has launched a Smart Fasteners Industrial Technology Innovation Strategic Alliance to coordinate research and development efforts in this area. In addition, Chinese government has included the use of smart fasteners in several key infrastructure projects, including Hong Kong-ZhuhaiMacao Bridge and Beijing-Shanghai High-Speed Railway. As the use of smart fasteners becomes more widespread in China, it is expected that this technology will play an increasingly important role in the country’s infrastructure development plans. According to a recent report by Grand View Research, the global smart fasteners market was valued at USD 187.4 million in 2019 and is expected to reach USD 414.2 million by 2027, growing at a CAGR of 10.4% from 2020 to 2027. China is the fastest growing country in the world in this sector.
E-commerce and Its Effect on Chinese Consumption of Construction Fasteners
The COVID-19 pandemic has also accelerated the adoption of e-commerce in the Chinese construction fastener market. Online sales platforms have become increasingly popular, providing customers with greater convenience and access to a wider range of products. This trend is expected to continue postpandemic, with more companies embracing e-commerce as a key channel for sales. According to a report by Technavio, the market size of online sales of industrial fasteners in China was estimated to be USD 1 billion in 2022 and is expected to grow at a compound annual growth rate (CAGR) of approximately 10% between 2023 and 2027. This suggests that a significant portion of fastener trade is now taking place online in China.
Conclusion
In conclusion, the Chinese construction fastener market is expected to recover and grow after the pandemic, driven by massive infrastructure development projects, increasing urbanization, rising disposable incomes, and the adoption of smart fasteners. The trend towards e-commerce is also expected to continue, providing customers with greater convenience and access to a wider range of products. According to these changes, the future of construction fasteners in China looks promising, with the market expected to experience steady growth over the coming years. According to a report by QYResearch, the construction fastener market in China was valued at approximately USD 11.0 billion in 2022 and is expected to reach USD 12.8 billion by the end of 2027, growing at a CAGR of 3.1% between 2022 and 2027.
Article by: Sharareh Shahidi Hamedani
Copyright owned by Fastener World
著作權所有:惠達雜誌 Industry Focus 081 China Fastener World no.68/2023 惠達雜誌
Chinese Fastener Machinery Market and 2023 Outlook

2022年中國緊固件機械市場與2023年展望
Introduction
China’s machinery industry is emerging as a global leader, as it enters a new phase of producing high-end products. According to the China Machinery Industry Federation, the industry achieved a sales revenue of 12.95 trillion yuan (USD1.87 trillion) in the first half of 2022, showing a 5.44 percent increase compared to 2021. The sales revenue and total profits of the strategic emerging subcategories accounted for 79.3 percent and 76.64 percent of the overall machinery industry, respectively, reflecting growths of 3.38 percent and 2.67 percent.
After years of efforts made by Chinese enterprises, the global engineering machinery market formerly dominated by manufacturers from Taiwan, Germany, Italy, the United States, and Japan is opening the door for Chinese players, as the key to such a situation is competitiveness.
Undoubtedly, in the past few years, the level of China’s manufacturing industrial chain in general and machinery industry in specific experienced a swift growth in development. This was the result of the systematic improvement of China’s comprehensive national strength and the qualitative leap in innovation capability.
In addition to that, the government’s beneficial policies promoted the development of China’s high-end smart manufacturing. Good examples are the development plans for Hunan and Jiangsu Provinces.
During the 13th Five-Year Plan period (2016-20), Hunan Province witnessed a significant growth in its R&D investment, with the total investment doubling. Furthermore, the sales revenue of the sector in Hunan exceeded one-quarter of the national level, and the total added value of high-tech industries in the province reached an impressive 1 trillion yuan. Hunan provincial government has continued to prioritize technological innovation during the 14th FiveYear Plan (2021-25), as evident in the draft guideline issued in 2021. The focus of the guideline is on making key technological breakthroughs, refining the technological innovation system, enhancing enterprises’ capacity for independent innovation, and consolidating technological foundation.
Industry Focus 082 China Fastener World no.68/2023 惠達雜誌
Overview of 2022


China Fastener World no.68/2023 083
Xuzhou, located in Jiangsu province, is renowned for its engineering machinery and is actively working to promote the industry to a world-class level. The engineering machinery cluster in Xuzhou was among the first batch of national advanced manufacturing clusters. Over the years, the government has been dedicated to building the cluster into one with a complete industrial chain. As of 2021, the output value of the machinery industry for enterprises whose annual business income hits 20 million yuan each in Xuzhou made up 30 percent of the city’s total industrial output value in the same category. Furthermore, in the first half of the year, the output value reached an impressive 77.5 billion yuan.
Fastener Machinery
As stated above, Chinese fastener machinery market is currently undergoing a shift towards high-quality development. Chinese manufacturers are proving their ability to produce not only high-quality products, but also to exercise advanced management skills, thereby transforming the label of “made in China” to “smart fastener machinery manufacturing”.
There are no shortcuts in the machinery industry; only by persistently striving towards innovation and development can enterprises lead the way towards the future of manufacturing. Chinese fastener machinery enterprises have seized domestic development opportunities and have demonstrated their prowess in enhancing technological innovation capabilities, manufacturing high-end machinery products equipped with independent core technologies.
China is one of the largest producers and exporters of fasteners in the world. The country has a highly fragmented market with many small and medium-sized enterprises. In the last few years, Chinese fastener machinery market was growing at a steady pace due to the high demand for fasteners from the construction and automotive industries.
The market is driven by the growing demand for fasteners in various industries, including automotive, construction, aerospace, and electronics, among others. According to a report by Grand View Research, the fastener machinery market in China was valued at USD 2.47 billion in 2020 and is expected to grow at a compound annual growth rate (CAGR) of 4.8% from 2021 to 2028.
The market is highly competitive, with many domestic and international players vying for market share. The fastener machinery market in China is characterized by intense competition, rapid technological advancements, and increasing automation. Many players in the market are investing heavily in research and development to improve the efficiency and quality of their machinery.
Chinese government has also been promoting the development of the fastener machinery industry, providing various incentives and policies to support domestic manufacturers. For example, in 2019, the government launched the “Made in China 2025” initiative, which aims to upgrade the country’s manufacturing industry, including the fastener machinery sector, through innovation and technology.
Despite steady growth, the fastener machinery market has been facing some challenges due to various factors such as rising labour costs, environmental regulations, and increasing competition from other countries. In response, like any other industry, industrial fastener machinery manufacturers in China are increasing their efforts to explore international high-end machinery markets by constructing internationalization levels and growing market shares.
Fastener machines have been drastically transformed by leveraging on disruptive technologies and become much smarter than before. Machines can assist fastener manufacturers in solving some of their key production issues, such as low automation rates, and poor production line flexibility. Chinese manufacturers have been investing in advanced technology and automation to improve efficiency and reduce costs.
The COVID-19 pandemic also had an impact on the market, with a slowdown in demand and disruptions in the supply chain. However, as the pandemic is brought under control, the market is expected to rebound and continue its growth trajectory in the coming years.
Overall, the outlook for the fastener machinery market in China remains positive, with a continued focus on innovation and technology likely to drive growth in the industry. Chinese fastener machinery market is expected to constantly increase its strength and performance through technical innovation and industrial upgrade. The increasing use of lightweight materials in the manufacturing of vehicles, coupled with the need for fasteners that are stronger, more durable, and corrosion-resistant, is also contributing to the growth of the market in 2023 and beyond.
Sources:
Machinery sector ups high-end transformation, ChinaDaily Market Analysis Report, Grand View Research
 Article by Shervin Shahidi Hamedani
Copyright owned by Fastener World 著作權所有:惠達雜誌
Industry Focus 084 China Fastener World no.68/2023 惠達雜誌


China Fastener World no.68/2023 085
2022年歐盟扣件進出口統計
2022 Fastener Trade Statistics of EU
HS 7318 Iron and steel screws, bolts, nuts, washers, etc.

(in EURO), in descending order according to volumes of 2022
The EU imported a total of about 2.03 million tons of fasteners from the world in 2022, with China and Taiwan as the main import sources, accounting for more than 60% of the total. In addition, Turkey, Vietnam and India were also very important import partners
086 China Fastener World no.68/2023 Industry Focus 惠達雜誌 Import Rank Partner 2020 (Euro) 2021 (Euro) 2022 (Euro) 2020 (kg) 2021 (kg) 2022 (kg) EU27 4,703,428,968 5,988,643,217 8,062,651,447 1,560,900,548 1,853,675,002 2,032,115,658 1 China 1,124,834,668 1,685,581,227 2,210,047,871 643,166,410 784,373,858 787,031,590 2 Taiwan 1,012,097,510 1,304,539,923 1,906,960,986 373,176,999 432,392,932 502,842,100 3 Turkey 250,113,831 363,799,836 562,403,729 78,892,138 116,211,570 147,794,916 4 Vietnam 193,789,700 220,459,099 404,967,185 99,433,492 98,578,051 133,270,667 5 India 187,415,500 277,337,771 411,086,901 67,732,375 97,778,212 125,971,724 6 Thailand 69,203,789 83,650,642 142,135,532 42,867,110 46,648,841 64,295,920 7 South Korea 145,461,539 179,056,244 214,855,946 30,802,225 37,193,166 40,109,675 8 Malaysia 64,884,737 74,328,333 117,280,008 32,364,162 33,575,378 37,905,366 9 U. K. 346,415,222 305,093,566 348,144,153 54,485,016 35,233,191 32,033,067 10 Switzerland 362,345,419 413,955,872 449,724,326 25,686,806 29,517,676 30,054,604


China Fastener World no.68/2023 089
Fastener Fair Global 2023 Inpour of People and Purchase Orders Drove Business Opportunity This Spring


As a major manufacturing city, Germany has huge potential for its industrial and automotive industries. Market research institutions have released the latest forecast that the global market scale of industrial fasteners will reach USD 87.3 billion by 2026, while automotive fasteners will reach USD 24.2 billion in 2028, of which Germany will occupy a significant share. Against the background of high demand prospects, the world waited four years and finally witnessed the 9th edition of Fastener Fair Global returning to Messe Stuttgart for a three-day period from March 21-23, 2023, attracting global fastener exhibitors and buyers to exchange and discuss collaboration opportunities.
The organizer's booth sales agent, Fastener World brought Taiwanese exhibitors to the event to gain more business opportunities for Taiwanese industry to export to the European market. Several Taiwanese fastener companies told Fastener World that the lineup of Taiwan exhibitors in the 2023 edition was a huge force that could not be underestimated. The reason why Taiwan attached great importance to the return of this show was because, for one thing, Taiwan saw the potential of this show in prompting buyers to place orders; for another, Taiwan was looking to grasp a wave of orders from this show in spring to replenish order books and to begin shipping worldwide from the second half of 2023. Additionally, the newly designed Taiwan Pavilion was particularly eye-catching and stood out in the venue, attracting inquiries from many local and overseas buyers and visitors.
During the show, Fastener World provided visitors with matchmaking and other collaboration opportunities, and recommended many suppliers' quality products and technologies through publications. One thing of interest was that the Fastener World’s staff took a group photo with one of the visitors in exotic clothes and screw hat, creating a joyful interaction.
人潮、訂單潮刺激春季商機 090 China Fastener World no.68/2023 Exhibitions 惠達雜誌
2023德國司徒加特螺絲展
According to the latest data from the organizer's press release issued on March 30 (German time), the three-day show attracted around 1,000 exhibitors from 46 countries and used 23,230 square meters of venue space in total (1,000 square meters more than the previous edition) in Halls 1/3/5/7. Exhibitors were mainly from Germany, Italy, Spain, Turkey, UK, the Netherlands, Poland, France, Taiwan, China and India. This year, with the lifting of lockdown in various countries, overseas buyers are eager to start replenishing their stock in large quantities. The 2023 edition brought an inpour of both people and purchase orders. Almost 11,000 trade visitors from 83 countries visited the Fair and they were mostly distributors, manufacturers, and suppliers from Germany, Italy, UK, Poland, France, the Netherlands, Switzerland, Spain, Czech Republic, Austria, and Belgium.

Fastener Fair Global showcased a wide range of products, including raw materials (wire rods), finished/semi-finished fasteners, tooling, machines and equipment, secondary processing, surface treatment, heat treatment, electroplating and baking, warehousing, and related products and services. Every year, the show attracted numerous visitors from the construction, automotive, aerospace, marine, electronics, light and heavy engineering, energy, communication technology, metal products, furniture manufacturing, and sanitary ware industries.
The next edition of Fastener Fair Global will take place again at Messe Stuttgart on March 25-27, 2025.


091 China Fastener World no.68/2023 Exhibitions 惠達雜誌


 Birlik Böllhoff
Tecfi
Brighton-Best International Eurobolt
Teknoform
Titgemeyer Zarri
Marcopol Nitto Seiko pgb
Precision Technology Supplies Puehl
Remaches Factory Reyher Schlöt
SOM Fasteners STAFA
Gala Precision Hafren Hyodong
Kaleliler KEBA Fastenings
Korea Pavilion Lederer Lobster
UPS Lakshmi Synergy Fixi SACMA Sunco
International Exhibitors 092 China Fastener World no.68/2023 Exhibitions 惠達雜誌
301 Express Fastbolt Achilles Seibert & Albert Pasvahl & Peter Schröder Ambrovit
Chinese Exhibitors


 Beijing Jinzhaobo
Xuzhou Ever Grand
Zhejiang Xinchun Tanco Consulting Wenzhou Longwan Shengjia
Jiaxing Victor Screw
Shenzhen Manju
Hebei Zhongjiu Energy Jiashan United East
Alfirste
Dahe Group Yuyao Jingtao Zhejiang Kunhou
Sailuk Rivet
Shanghai Tone Machine
Jingle-Tech Ningbo Geobo
Jiaxing Goodway
Jiaxing Kinfast Hisener
Haiyan Weishi
Handan Xiaojun
Hebei Goodfix
Haiyan Jiamei
Haiyan Gete
Chinfast Dongguan Grand Metal Foshan City Guangqingchang
Beijing Jinzhaobo
Xuzhou Ever Grand
Zhejiang Xinchun Tanco Consulting Wenzhou Longwan Shengjia
Jiaxing Victor Screw
Shenzhen Manju
Hebei Zhongjiu Energy Jiashan United East
Alfirste
Dahe Group Yuyao Jingtao Zhejiang Kunhou
Sailuk Rivet
Shanghai Tone Machine
Jingle-Tech Ningbo Geobo
Jiaxing Goodway
Jiaxing Kinfast Hisener
Haiyan Weishi
Handan Xiaojun
Hebei Goodfix
Haiyan Jiamei
Haiyan Gete
Chinfast Dongguan Grand Metal Foshan City Guangqingchang
093 China Fastener World no.68/2023 Exhibitions 惠達雜誌
2023 M-Tech Nagoya Increased Demand for Automotive Parts and Project Fasteners
The 8th M-Tech Nagoya was successfully held from April 12 to 14, 2023 in Hall 1 of the Port Messe Nagoya. A Japanese exhibitor at the show told Fastener World that the venue was packed with people on the first day of the show, and remained heavily patronized for three consecutive days. According to the data of the organizer, 8,044 people came on the first day, 9,093 on the second day, and 10,363 on the third day, increasing day by day for three consecutive days, reaching 275,000 people in total. In fact, Fastener World’s booth saw more visitors coming to seek matchmaking services on the third day.


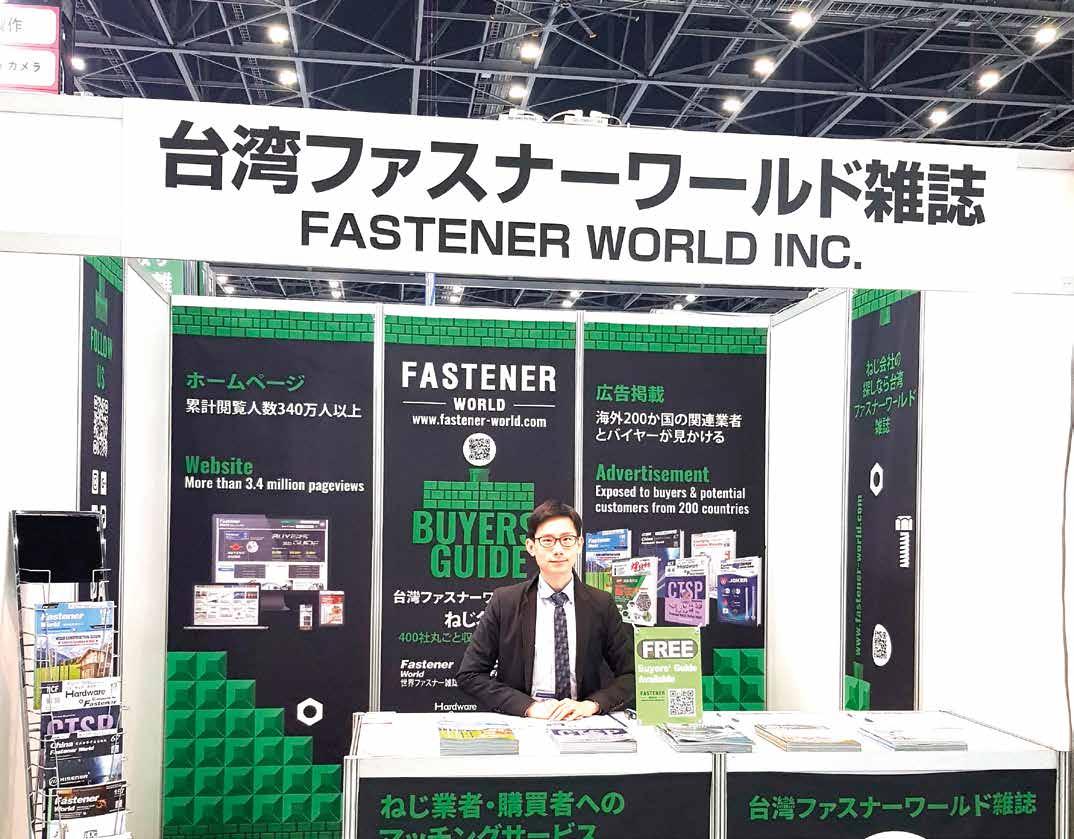
One visitor to Fastener World shared a new trend that is brewing in the international market— titanium alloy powder. This is a high precision material that can be used as a raw
material for the production of high-end products such as medical grade, aerospace grade, and automotive grade fasteners, and is gradually attracting the interest of many fastener manufacturers. Due to high plasticity and machinability, powdered titanium alloy is very suitable for forming high precision and highly customized fastener products. Even when customers request specific fastener shapes, powdered titanium alloy can handle. Therefore, the production using titanium alloy powder is very flexible and suitable for manufacturers who are upgrading to high value-added products. The potential of titanium alloy powder in the future is considerable.
The organizer announced that the next M-Tech Nagoya will be unveiled again on April 10-12, 2024.
M-Tech 094 China Fastener World no.68/2023 Exhibitions 惠達雜誌
2023


China Fastener World no.68/2023 095
TAIPEI AMPA
Taiwanese Automotive Parts OEM Capability Satisfies Global Demand
Taipei International Automobile & Motorcycle Parts & Accessories Show (TAIPEI AMPA) was held from April 12 to 15, 2023 in Hall 1 of Taipei Nangang Exhibition Center. For the first time the show combines 3 sub-fairs including TAIPEI AMPA, AUTOTRONICS TAIPEI, 2035 E-Mobility Taiwan. Across the 4 days, it attracted nearly 4,000 global buyers, 830 companies, 2,200 booths, over 50,000 professionals, and 4,000 domestic and overseas buyers from 103 countries. The majority of the buyers were from Japan, while others included Malaysia, the U.S., Singapore and South Korea.
During the show, the organizers arranged full-day forums, with electric vehicles being a major focus of discussion. Global EV sales have soared from 2.276 million units to 10.522 million units in the past three years, creating a huge
demand for parts and components. Taiwan provides automotive fasteners and parts OEM production technology that is equal to the world standard, so naturally it has become a hot spot for buyers from over 100 countries to come and purchase. At Fastener World's booth, we met domestic and foreign buyers who came to inquire about automotive fasteners, professionalgrade fastening tools and other high-end fastening products, expecting to find high quality sources of supply through our matching services. Judging from the post-show matchmaking result, the future potential of the automotive parts OEM market in Taiwan is still huge.
With this year's show coming to an end, the organizer announced the next TAIPEI AMPA, AutoTronics Taipei, and E-Mobility Taiwan 2035 will be held from April 17 to 20, 2024.


096 China Fastener World no.68/2023 Exhibitions 惠達雜誌

Fastener Fair USA Fastener World Magazine Receives Unanimous Recognition from Local Buyers


Fastener Fair USA was held on May 16-17 this year at the Music City Center in Nashville. This show is a professional exhibition that is gaining more and more attention from fastener manufacturers in North America and is aimed at providing a platform for mutual meeting, collaboration and communication among manufacturers, master distributors, equipment makers, processors, packagers and end users in the supply chain.
This year, the show attracted 233 local and foreign exhibitors from the U.S. and abroad to showcase their latest products and trends in industrial fasteners, construction fasteners, assembly and installation systems, fastener production technology, distribution/ storage/manufacturing equipment...etc. during the 2-day event.


Participants also included 31 exhibitors from Taiwan and 19 exhibitors from India. Exhibitors mainly came from advanced fastener manufacturing, fastener distribution, aerospace, agriculture, automotive and construction fields.
Fastener World Inc. was also present at the show to distribute free publications to explore more possibilities of industrial collaboration for manufacturers/advertisers. According to Fastener World’s staff onsite, Taiwan Pavilion was the largest overseas pavilion at the show, and more than 30 exhibitors showcased their latest products and services to attract the attention of visiting buyers, hoping to take advantage of the slow recovery of market demand to seize the perfect opportunity to gain access to the
098 China Fastener World no.68/2023 Exhibitions 惠達雜誌
美國納什維爾緊固件展 匯達專業採購專刊 獲在地買主一致肯定
supply chain of the fastener industry in the United States. The various publications and online sourcing platform of Fastener World were also highly appreciated by many local buyers in the U.S. at the event.


The show visitors this year didn't miss out the opportunities to meet face-to-face with fastener manufacturers, distributors and suppliers, discover the latest product technologies, attend educational seminars presented by industry experts, interact with competitive peers and potential customers, and observe trends and emerging markets in the fastener industry, either. Visitors from within the United States came primarily from Illinois, Michigan, Ohio, Pennsylvania and Tennessee. Another highlight of this year's show was the Fastening 101 Conference held by Fastener Training Institute on 05/15, the day before the show, which covered topics such as manufacturing processes, consensus standards, quality control, product and design fundamentals. In addition, the show's opening night party was held at the Country Music Hall of Fame on 05/16 with a live performance by a famous local Nashville singer and songwriter Tommy O'Keeffe.
The organizers also announced immediately after the show that the next edition will be held at the Huntington Convention Center of Cleveland on May 22-23, 2024.

099 China Fastener World no.68/2023 Exhibitions 惠達雜誌
Subcon Thailand 2023 A Quick Glimpse of the Latest Industry Trends


泰國曼谷國際工業零組件展一次飽覽最新產業趨勢
SUBCON THAILAND, Thailand's largest exhibition for industrial subcontracting and business matching, took place at BITEC (Bangkok International Trade & Exhibition Centre). The show was also co-located with INTERMACH & MTA Asia, an exhibition for the latest technology and modern machinery for manufacturing and related industries, attracting many business decision makers and high quality buyers from ASEAN countries.
The show was an excellent opportunity for industry players to showcase their latest industrial technologies, products and peripheral services, and for buyers and sellers to quickly communicate with each other. Fastener World Inc. also grasped such a good opportunity to exhibit on-site in order to develop potential business opportunities in Thailand and its neighboring countries for customers. Our staff also distributed our free publications to visiting buyers, hoping to build a bridge for industrial collaboration.
This year's exhibitors mainly came from the fields of metal/plastic automotive parts, electric/electronic parts, mold design, fasteners, automation, software, surface treatment, industrial supply and services, aerospace parts, medical parts, and mechanical parts. Visitors were mainly corporate owners and executives, engineers and technicians, procurement and production personnel, as well as personnel from the fields of automotive parts, electronics, metal machinery, air conditioning and refrigeration, industrial supply, aerospace and medical equipment.
According to Fastener World’s staff on site, the number of exhibitors this year reached 210. The organizer also invited a number of industry leaders to conduct several industry seminars during the event. In addition, electric vehicles, 5G technology, digital electronics, automation, medical and infrastructure were the most popular industry trends in the show, so the 4-day show attracted many professionals from both domestic and international industries, hoping to get a head start through face-to-face communication and consultation on the global market, which is gradually recovering after the epidemic.

100 China Fastener World no.68/2023 Exhibitions 惠達雜誌
International Fastener Show China is organized by China General Machine Components Industry Association as well as China Fastener Industry Association (CFIA) and has earned authority and credibility across the local fastener industry. This year the show was successfully held from May 22 to 24. The exhibition area covered 42,000 square meters, with nearly 800 exhibitors, using about 2,000 booths, attracting buyers from the United States, the United Kingdom, Germany, Brazil, Italy, Japan, South Korea, Russia, India, Iran, Turkey and other countries to visit the show.


The export value of fasteners from China surpassed the 10 billion mark last year, growing to 11.1 billion USD. This show was a great opportunity for exhibitors to seek orders from overseas buyers and is the main channel for visitors from all over the world to purchase fasteners with cost advantages. Fastener World’s exhibitor seized the opportunity to provide visitors with fastener intelligence and recommended suitable suppliers to push for China's integration with the international community and the development of the fastener industry.
The show covered raw materials, specialized equipment, dies and consumables, design technology, testing and experimentation, e-commerce platform, industry services, standard fasteners, special fasteners and stamping parts for visitors from construction, electronics, automotive, aerospace and other industries. The national wire and fastener industry chain summit was held on site, as well as seminars on advanced technology, smart manufacturing and digitalization. International Fastener Show China connects the whole industry chain in China and has developed into an industry benchmark for the fastener industry in the big city of Shanghai.
IFS China One-stop Purchase from the Whole Chinese Fastener Supply Chain


中國上海國際緊固件工業博覽會 一站式購足全中國緊固件供應鏈
101 China Fastener World no.68/2023 Exhibitions 惠達雜誌
After five years of hiatus, the 6th edition of Taiwan International Fastener Show returned to Kaohsiung Exhibition Center with an online plus physical exhibition. According to the show organizer’s post-show report, the show attracted nearly 300 exhibitors and used around 850 booths, as well as nearly 8,000 buyers from 60 countries on May 3-5. Overseas buyers were mainly from India, the U.S., Japan, Germany, and Thailand. During the event, the show organizer also gave lots of industrial forums, procurement meetings and the “Manufacturers Win” podcast, attracting many industry experts and scholars to share their experiences and achievements. Another highlight of this year’s event was the new “Raw Materials, Dies and Hand Tools Zone”, connecting through the entire fastener ecosystem.


The “Global Fastener Forum” held on the first day of the show invited the presidents of the U.S., German and Italian fastener distributors associations, as well as speakers from domestic leading companies to talk about net zero, international market analyses, smart manufacturing, electric vehicles and other issues, attracting over 200 domestic and overseas companies in attendance.
Taiwan
International Fastener Show 2023
High Quality Charm of Taiwan
Fasteners Attracts Global Visitors

2023台灣國際緊固件展
台灣緊固件品質「魅」全球
The show organizer also invited 49 international buyers from 18 countries, including Mexico, Germany, the United Kingdom, France, Brazil, New Zealand, Finland, the U.S., Canada, and the United Arab Emirates to participate in 152 one-on-one procurement meetings with 24 industry players, in order to facilitate business matching and opportunities.
Fastener World’s booth used the bar theme as the design concept, coupled with a popcorn machine to provide freshly popped popcorn, as well as bread, hot-pressed sandwiches, and beverages for visitors to take a break and to match with fastener suppliers from Taiwan and many other countries through Fastener World. We also met pipe related companies from the U.S. eagerly looking for high quality threaded rods, nuts and washers from Taiwan, as well as Japanese distributors looking for fasteners from Taiwan, and European fastener stockists
102 China Fastener World no.68/2023 惠達雜誌 Exhibitions


China Fastener World no.68/2023 103
Exhibitions
Exhibitions
looking for new and existing customers. During the three days, Fastener World’s stand was crowded with lots of customers. These overseas visitors unanimously expressed to us that although Taiwan is facing inflation and cost pressure together with the rest of the world, the high quality charm of Taiwan fasteners is still irresistible.


The show organizer has also made its announcement after the show that the 2024 edition of Taiwan International Fastener Show is to be given at Kaohsiung Exhibition Center on April 16-18. For more info about the show, please always keep yourself updated through reading Fastener World magazines and official website at www.fastenerworld.com.


104 China Fastener World no.68/2023
惠達雜誌


105 China Fastener World no.68/2023 Exhibitions 惠達雜誌 Exhibitions
South Asian Manufacturing Heartland Blooms with Fastener Business Opportunities


June 1 to 3 unveiled the curtain of Fastener Fair India which showcased industrial fasteners, mounting systems, warehousing and logistics services, fastener manufacturing technology and construction fasteners. Market research firms predict that India's industrial fastener market scale is expected to reach a sizeable INR 460 billion by 2023, supported in large part by local automotive and construction demand.
The automotive industry is the largest consumer of fasteners in India, and in 2022 Indian automotive industry was one of the world's highlights, with domestic passenger car sales up by a whopping 23% to 3,792,356 vehicles, in stark contrast to the sluggish European auto market. In the context of this year's slow market recovery, the demand for automobiles and automotive fasteners in India is expected to rise again, thus making Fastener Fair India even more anticipated.
Fastener World caught this uptrend in South Asia and we took the opportunity to hand out publications at the show and introduce fastener suppliers to Indian visitors. These visitors mainly came from Mumbai and New Delhi, while others from Qatar and other countries. Most of them were looking for manufacturers, traders and wholesalers who could supply versatile screws. The high number of visitors to our booth exceeded our expectation, reflecting the high demand for fasteners in India. Fastener business opportunities are blooming there.
The next Fastener Fair India has been amounced to be given


106 China Fastener World no.68/2023 Exhibitions 惠達雜誌
2023印度孟買螺絲展 南亞製造重鎮綻放緊固件商機

Torque Applied In Manufacturing
The function of any threaded fastener is to provide sufficient clamping force onto a joint that when properly tightened will achieve and maintain the desired clamp load for its intended application. Any type of joint movement must be overcome to prevent joint failure. This clamp load is achieved by means of torquing a fastener.
In a bolted joint, torque is measured in two different planes that are perpendicular to one another. Torque is a combined relationship between force, times distance and tension. Torque measures the reaction of rotational movement of the fastener, while tension measures the longitudinal movement of the same fastener.
The longitudinal movement (tension) is constrained by the joint members between the first engaged threads and the bearing surfaces of the bolt and nut. A portion of the rotational energy (torsion) is used to stretch (tension) the bolt while, at the same time, causes the joint members to compress.
The amount of energy that is applied to the bolt from rotation to create tension is determined by the energy losses due to the friction between the surfaces of the rotating parts and the joint. The relationship between the applied torque and the tension generated in the joint is the torquetension relationship.
While torque may seem universal in use, the torque-tension relationship is applied differently to three specific industries; mass assembly, structural assembly and in maintenance and repair.

The mass assembly of products include the automotive, truck and bus industries to name a few, excluding the electronics industries because vehicles experience heavy loading, vibration and shock. Also, because vehicles can become very dangerous to life and property if something breaks or loosens.
Recently Rivian Automotive has recalled approximately 13,000 of its vehicles for a loose steering assembly. It was reported that the fastener connecting the front upper control arm and steering knuckle “may not have been sufficiently torqued.”
The question to be asked is, why wasn’t there sufficient torque applied? How was the assembly tightened? Is there a calibration issue? Was the output data not interpreted correctly?
Automotive assembly lines (Fig. 1) use a variety of programmable, digital power tools for assembly that many will transmit data, such as torque and angle, to the data processor for error-proofing. The torqueangle measurement is a most accurate tool used for solid and stiff joints. In most cases the turn will negate friction variables, which is why a pre-torque is first applied to establish a hard base without any further joint compression.
However, in some cases it will not always mean that the preload has been achieved. This depends upon how the data is monitored. If the torque and angle have been achieved within a certain per cent window, then the joint is good.
However, if the angle goes significantly beyond the expected tolerance window to achieve the proper torque, this means the joint was not solid and there was interference between the joint, such as a burr, unexpected
扭力應用於製造業
Technology 108 China Fastener World no.68/2023 惠達雜誌

lubrication or even a non-conforming part that produced compression or resistance. If the torque becomes high and the angle was not reached, then this could mean debris in the threads, cross threading or something else that needs to be investigated. If none of these anomalies are noticed and the operator just inputs on torque alone, then there are problems later on, which is why there are recalls.
Automotive manufacturers are basically just assemblers of pre-made and assembled parts from other manufacturers. They also use a variety of fasteners and special fasteners besides the common bolt and nut. Many stampings will have extrusions where threads are tapped which will accommodate a threaded fastener and there are times where several stampings will be stacked together, some of which are designed to move about the fastener.
When several manufacturers are producing parts that are to be assembled together, tolerances and torque accuracy become paramount. Because movement of the assembled parts is involved, a thread locking chemical is used to help with vibrational loosening.
Loosening occurs in the presence of transverse and cyclic loads. It is subject to the relative slip between the threads and the joint surfaces. Since threads are a helix angle, which is nothing more than an inclined plane, there is a natural tendency for threads to relax and rotate in the downward or counter clockwise “off” position, which will cause joint loosening under cyclic, vibration or impacts to the joint.
To overcome any external forces of transverse loads, bending, vibration and tensile loads, the joint must develop and maintain a clamp load in excess of any of these external loads. Any significant amount of loss of clamp load will cause the joint to become loose.

For example, let’s assume one of the extrusions has a burr that is just slightly over tolerance. In this case, a burr that is only 0.43 mm (0.0169”) over tolerance can be most significant. The most important reason for loss of clamp load is not being able to maintain the required clamp load due to embedment during tightening and further embedment under service loads. These losses cause joint relaxation and looseness.
During assembly, torque has been applied by use of a positioning electronic torque wrench. It has a preset torque value which the results are stored for reference and error-proofing. There is no fault with the assembly method. However, once the torque is applied, the joint may still relax and lose clamp load.
The electronic torque wrench also measures rotation angle. Parameters were set for the amount of torque required to achieve a certain preload with respect to the viscosity of the thread locking material on the threads of the screw and with the amount of torque angle that should be achieved.

The assembly torque data is monitored to the extent that if the required assembly torque is not reached upon the second time, that bolt is discarded. However, the mistake here is not relating to the torque angle for potential problems.
For example, if the required torque was 25 lbft and took only 35 degrees of angular rotation to achieve clamp load, acceptable tolerances would be ± 5 lb-ft and ± 10 degrees rotation. However, suppose the torque was achieved at 24 lb-ft but at 90 degrees rotation or more. This should be an immediate red flag to the operator.
Unfortunately, in this case, the operators failed to observe the torque angle as a significant component of the entire assembly. The excessive rotation resulted in a loss of clamp load from embedment and weakened threads which permitted transverse loading. Adhesives are good at resisting rotational movement and cyclic tensile impacts, not lateral impacts. Therefore, the fastener becomes loose and joint failure occurs.
Error-proofing does not mean fool-proof. There are still variables that can cause errors.
Article by Guy Avellon
Copyright owned by Fastener World 著作權所有:惠達雜誌
Fig. 1. Automotive assembly line
Fig. 2. Thread locking chemical
Technology 110 China Fastener World no.68/2023 惠達雜誌


China Fastener World no.68/2023 111
Technical Innovation of Stainless Steel Wire Rods for Cold Forging in China
1. Overview
Bolt connection is one of the most common connection methods in automobiles. As the basic component of a connection node, a bolt is usually subjected to damaging loads such as acceleration, speed change and alternating load, which is crucial to the load-bearing safety of the structure. For this reason, a technical overview of the main applications of stainless steel materials in automobiles is given, and the crafting characteristics and technical elements of the four most widely used stainless steel materials, namely austenitic, ferritic, martensitic and austenitic-ferritic duplex stainless steel, are analyzed and explained, with the aim of providing a strong reference and theoretical basis for the selection of stainless steel materials for applications in automobiles and the formulation of the best connection.
With the rapid development of modern equipment industry, the demand for high strength and high performance is forcing equipment parts to go lightweight and high-strength. As a connection component, a bolt plays a pivotal role in

the safe operation of equipment, and the performance level will become higher and higher with the improvement of the overall performance of equipment. However, stainless steel bolts can be made from various stainless alloys, and their ultimate strength can reach 480 to 1500 MPa. Although high-strength carbon steel and alloy steel bolts are widely used for their higher strength and new design methods, their performance decreases faster in specific occasions, and the sensitivity of high-strength bolts to stress corrosion increases, and failure as well as rupture occur from time to time, bringing safety risks to the operation of the equipment. For this reason, the performance of stainless steel bolts is gradually improved, which has attracted attention.
2. Stainless Steel Coil for Cold Top Forging
Stainless steel wire rods for cold forging are used to manufacture various kinds of cold forged products like bolts, screws, nuts, rivets, pins, etc. Most of China’s current low-end cold forged products use Chinese materials, and high-end cold forged products still rely on imported materials. Therefore, it is necessary to vigorously promote the research and development of stainless steel wire rods for cold forging, formulate industry standards accordingly, take the lead in technology, improve the quality of Chinese cold forged products, provide reference and guidance for the development of Chinese cold forged products, and realize total domestication of high-end cold forged products in China.
112 China Fastener World no.68/2023 Technology 惠達雜誌
“冷頂鍛用不銹鋼盤條“技術創新內容
Article by: Hsien-Ming, Chang / Copyright owned by Fastener World 著作權所有:惠達雜誌
At present, there is no standard for stainless steel wire rods for cold forging at home and abroad. Meanwhile, because the quality of stainless steel wire rods for cold forging in China is still unstable, these wire rods usually use the American or Japanese standards. Based on the current state of the industry, the standard is compatible with the existing standards of China, Japan and the United States for stainless steel wire rods for cold forging, so that the standard is operable.
The industry standard of these wire rods mainly refers to the following standards: Steel wire standard: GB/T 4232 stainless steel wires for cold forging, ASTM A493 stainless and heat resistant steel wires for cold heading and cold forging, JIS G4315 stainless steel wires for cold heading and cold forging. Standard for wire rods: GB/T 4356 Stainless steel wire rods.
The purpose of the standard is to form the technical requirements of stainless steel wire rods for cold forging and to provide direction and basis for the technical and quality progress of the forging stainless steel manufacturing firms in China. At the same time, in order to enable customers to purchase materials based on this standard, they can produce stainless steel wires for cold forging that meet the requirements of different standards at home and abroad. The standard is determined mainly according to GB/T 4232, ASTM A493, JIS G4315, GB/T 4356, GB/T 4356, GB/T 4232, GB/T 4232, GB/T 4232, GB/T 4232, GB/T 4232, GB/ T 4232, GB/T 4232, ASTM A493, JIS G4315, GB/T 4356, GB/ T 4237 and other relevant domestic and international standards, relevant sample analysis data, various performance data during the development process, and laboratory testing data on productrelated indicators.
3. Introduction of Technical Innovation
In the standard of stainless steel wire rods for cold forging, the range of steel types and chemical composition covers the technical requirements for these wire rods specified in various standards, and the relevant requirements for stainless steel wire rods in China’s standard are referenced.

3.1 Chemical Composition
According to the application of stainless steel wire rods for cold forging at home and abroad and with reference to the Chinese standard for these wire rods, 24 steel grades are identified to fully cover the requirements on austenitic, ferritic, martensitic and austenitic-ferritic duplex stainless steel series.
These wire rods are recommended as an industry standard. The technical indexes of this standard are more stringent than the American standard ASTM A493 for "Cold heading, forging and heat resistant stainless steel wire rods" as well as the Chinese standard GB/T 4356 for "Stainless steel wire rods". The harmful sulfur content is reduced by more than 0.005%, which means this technical standard is on par with international advanced standards.
Carbon is a strong austenite forming element, which can significantly improve the strength of steel, but the higher the carbon content in stainless steel, the worse the plasticity, and carbon also has a negative effect on corrosion resistance. Chromium is the main ferrite forming element, and the


113 China Fastener World no.68/2023 Technology 惠達雜誌
combination of chromium and oxygen can produce the corrosion-resistant Cr203 passivated film, which is one of the basic elements to maintain the corrosion resistance of stainless steel. Nickel is the main austenite-forming element, which can reduce the corrosion phenomenon of steel and the growth of grains when heated. The application of nickel in stainless steel is mainly in combination with chromium in order to play a better role and change the structure of stainless steel, thus improving the mechanical properties, processing properties and corrosion resistance of stainless steel in certain corrosion media. In contrast, the tensile test reflects the overall macroscopic mechanical properties of wire rods, so the presence of decarburization and sulfide causes the actual strength of Chinese stainless steel wire rods to be lower than the theoretical strength, which must be noted.
In ferritic stainless steels, the increase of Si and Mn elements improves the solid solution strengthening of ferrites, while C and N have a great influence on toughness. Impurities in ferritic stainless steels, including oxygen, aluminum, phosphorus, silicon and manganese, reduce toughness, but their effect is small compared to that of carbon and nitrogen, and sulfur has almost no effect. Niobium and titanium are the main stabilizing elements in ferritic steels, and Niobium and titanium have opposite effects on toughness and plasticity, so the metallurgical design can be adjusted to the desired product shape.
In martensitic stainless steels, the mechanical properties are strongly influenced by the chemical composition; higher Cr content and lower Ni content result

in higher ferritic content and lower strength properties in a quenched and tempered condition. On the contrary, when the Cr content is lower and the Ni content is higher, the ferrite content in the steel is lower and the strength of the steel is higher.

The results of austenitic, ferritic, martensitic and austenitic-ferritic duplex stainless steel bolts were studied in the temperature range of 20600°C. At temperatures ≤ 450°C, the austenitic and martensitic stainless steel bolts can maintain the elastic modulus, yield strength and ultimate strength better than carbon steel and alloy structural steel bolts.
3.2 Surface Defects
Surface defects is an important factor that causes cold forging cracking. According to statistics on customer use, each year scrapped cold forging parts take up about 50% of all the scraps. Stainless steel wire rods used for cold forging must first go through cold-drawing. If surface defect is not eliminated after cold-drawing, there will likely be head cracking in the subsequent cold forging, resulting in scrapped parts. Therefore, it is necessary to restrict the allowable depth of defect on the surface of wire rods, and control the depth while comparing to the said standard and China’s national standard GB / T 4356, where when the allowable wire rod diameter is ≥ 4.5 ~ 14mm, the allowable defects depth is from ≤ 0.15mm to ≤ 0.08mm; when the wire rod diameter is > 14 ~ 20.0mm, the allowable defects depth is from ≤ 0.20mm to ≤ 0.15mm; when the wire rod diameter is >20 ∼40mm, allow the depth of defects according to mutual agreement.
3.3 Process and Mechanical Properties


The hardness of the ferritic and martensitic stainless steel wire rods for cold forging affects customers success rate in the cold forging.

114 China Fastener World Technology 惠達雜誌
plasticity and toughness, ensure corrosion resistance and eliminate stress. Generally, the annealing temperature of ferritic stainless steel is 750-850°C, and the annealing temperature of martensitic stainless steel is 800-900°C. After sufficient heat preservation, a homogeneous ferrite and carbide equilibrium state is obtained. After a small amount of drawing and cold forging, if the original hardness of the wire riods is too high, the hardness will be too high after drawing, and the cold forged portion will be likely to crack up. For ferritic and martensitic stainless steel wire rods for cold forging, the maximum hardness limit is specified.

Stainless steel wire rods need to undergo limited drawing deformation before going through cold forging. To ensure a smooth wire drawing process, the wire rods need to have a certain degree of plasticity. The original strength of the wire rods should not be too high, so the mechanical properties of the austenitic stainless steel wire rods for cold forging are limited. Austenitic-ferritic duplex stainless steel is heat treated and solution treated at 950-1120°C. The reason why hightemperature solution can be used is that the carbon content of duplex stainless steel is much lower than that of ferritic stainless steel. Considering the effect of solution temperature on microstructure, mechanical properties and corrosion resistance, the solution heating temperature of duplex stainless steel generally takes the middle limit value in the specification. To prevent the precipitation of σ phase, it should be cooled rapidly after the solution temperature is kept warm. The σ phase is distributed along the grain boundary. The plasticity of the steel is significantly reduced, and the dispersion is less
likely to affect toughness, and has a certain strengthening effect. The σ phase increases the notch sensitivity of the steel, has little effect on strength and hardness, and has a significant effect on toughness. The σ phase significantly reduces the plasticity, toughness, oxidation resistance, and intergranular corrosion resistance of steel, and increases the occurrence of thermal fatigue. After the σ phase is formed, the matrix is depleted of chromium (or molybdenum, tungsten), thus reducing the corrosion resistance of the matrix and weakening the effect of solid solution strengthening. In short, the σ phase is more harmful, and the appearance of this phase should be avoided as much as possible.
4. Metallographic Examination of Stainless Steel
4.1 Preparation of Samples
The preparation process for the metallographic samples of stainless steel is basically the same as that of high alloy steel. Among them, the matrix structure of austenitic stainless steel is relatively soft, the toughness is high, and it is easy to cause work hardening. It is difficult to prepare the sample, and it is easy to produce mechanical slippage and disturb the metal layer structure during the polishing process, which will affect the normal metallography. analysis and inspection. Improper sample preparation of semimartensitic steel will cause austenite to transform into martensite, so the preparation of the sample should not cause the sample to generate high heat. The polishing force should not be too large, and the polishing time should not be too long.
115 China Fastener World no.68/2023 Technology 惠達雜誌
4.2 Chemical Corrosion
Stainless steel has high corrosion resistance, so the etchant that shows its microstructure must be strongly erosive to make the structure clearly visible. The appropriate etchant should be selected according to the steel composition and heat treatment state. Commonly used etchants are:


1. Ferric chloride 5g + hydrochloric acid 50ml + water 10ml (applicable to A stainless steel and F-A stainless steel);
2. Hydrochloric acid 10ml + nitric acid 10ml + alcohol 100ml;
3. Picric acid 4g + hydrochloric acid 5ml + alcohol 100ml (harder to corrode samples can be heated in a water bath);
4. Hydrofluoric acid (5%) 1ml + nitric acid (5%) 4ml + water 45ml.
In addition, ferrite, austenite, carbide, δ ferrite, and σ may also appear in stainless steel at the same time, which can be distinguished by chemical erosion. In terms of morphology, austenite has twin grains, and ferrite is often band-like or dendritic; the ferrite becomes rose-colored after being corroded with red salt potassium hydroxide solution (red salt 10g-15g+NaOH 10g-30g+water 100mL, boiled at 60-90°C). The austenite body is bright, and after being corroded with alkaline potassium permanganate, the carbide is light brown, and the σ phase is orange-red.
4.3 Examples of Metallographic Structure


For ferritic stainless steel annealing, the metallographic structure is ferrite + M7C3 (carbide). If heated above 900 °C, the grains will expand and cannot be refined, so the temperature needs to be controlled. The structure of 1Cr17 steel heated to 850°C and air-cooled is ferrite + carbides distributed along the rolling direction, as shown in Figure 1
After the annealing of martensitic stainless steel is fully maintained, a uniform ferrite and equilibrium structure of carbide is obtained. Figure 2 shows the annealed state of 30Cr13 steel raw materials, corroded by ferric chloride hydrochloric acid aqueous solution; the structure is pointlike and spherical pearlite, as well as secondary carbides distributed intermittently along the grain boundaries.
Solution treatment of austenitic stainless steel, heats up to 1000 ℃ - 1100 ℃, so that all carbides are dissolved in austenite, and then quickly cooled to room temperature to obtain a uniform austenite structure. Figure 3 shows that the structure of 06Cr17Mn7Ni5CuN steel is austenite; Figure 4 shows that the structure of 0Cr19Ni10 steel is austenite + a small amount of ferrite.
In austenitic-ferritic duplex stainless steel heat treatment solution treatment (950℃ ~ 1140℃), the metallographic structure is ferrite + austenite, corroded by potassium ferricyanide and potassium hydroxide aqueous solution; the structure is white austenite and gray-black (brown) ferrite. δ phase (δ ferrite) is a phase formed in the high temperature region, generally called high-temperature ferrite, to distinguish from low-temperature α-ferrite. δ ferrite is a body-centered cubic lattice, but the lattice constant is different from that of α ferrite, and exhibits higher brittleness. The ferrite content should be inspected according to GB/T 13305-2008 "Metallographic Determination of α-phase Area Content in Stainless Steel". After negotiation between the supplier and the buyer, other inspection methods can also be used. The ferrite content must be controlled at 40% ~60%. Figure 5 shows that the structure of 022Cr23Ni5Mo3N steel after solid solution is austenite + ferrite.
5. Conclusion
In recent years, with the continuous improvement of automotive lightweighting, long service life and user-perceived quality requirements, coupled with the current stricter requirements for automobile emission regulations, stainless steel materials have been developed and applied relatively rapidly in China’s automobile industry. In order to track the rapid development and application of high-performance stainless steel materials in automobiles, it is necessary and urgent to increase the development and accumulation of advanced stainless steel material connection technologies for automobiles in the next step.
116 China Fastener World no.68/2023 Technology 惠達雜誌
Fig. 1 10Cr17 steel structure is ferrite + carbide
Fig. 2 30Cr13: pearlite + carbide
Fig. 3 06Cr17Mn7Ni5CuN structure is austenite
Fig. 4 0Cr19Ni10 structure is austenite + a small amount of ferrite
Fig. 5 022Cr23Ni5Mo3N structure is austenite + ferrite
Automobile production is one of the reference indicators for evaluating market development momentum, and it is also an important basis for predicting future demand for automotive fasteners and components. In addition, in recent years, the research and development focus of the world's major automakers has gradually moved towards electrification and modularization, which has led to changes in the market's demand for fasteners and demand types. This has also made many fastener manufacturers who focus on the development of automotive fasteners start to seriously think about whether the advent of the electric vehicle era will completely rewrite the layout of the fastener industry. In the following, the author will lead readers to have a glimpse of the current status and future of the automotive industry from the total output of automobiles in major countries around the world and the changes and growth in the output of various mainstream models (including passenger cars, light commercial vehicles, heavy trucks and heavy buses) in each country.
Comprehensive Output
First of all, judging from the latest data released by the International Organization of Motor Vehicle Manufacturers, OICA (see Table 1), global automobile production seems to have maintained a steady growth in the past three years despite the impact of major environmental factors such as the epidemic. From approximately 77.65 million vehicles in 2020, approximately 80.2 million vehicles in 2021, and a substantial increase to approximately 85.01 million vehicles in 2022, an increase of 6% year-onyear. Analyzed by continent, the automobile production in the Asia-Pacific region ranks first in the world, reaching 50.02 million vehicles in 2022, followed by the Americas with 17.75 million vehicles, and Europe with 16.21 million vehicles. The total production of Europe, America and Asia alone accounts for more than 98% of the world. In the African region, due to the small scale of the automobile manufacturing industry, it only maintains about 1 million vehicles per year.
The top five auto-producing countries in the Asia-Pacific region are: China, Japan, India, South Korea, and Thailand. China's record of 27 million vehicles accounts for more than half of the region's share and is growing every year. Japan's sound automobile manufacturing chain will continue to keep it in second place, reaching nearly 8 million vehicles in 2022. It is worth noting that in 2020, South Korea briefly surpassed India to become the third largest automobile producer in the region, but it was overtaken by India to rank fourth
2022 Global Automobile Production and Model Comparison

in the following two years. India currently ranks third with approximately 5.45 million vehicles. South Korea's production scale is roughly maintained at around 3.5-4 million vehicles. Thailand's production also shows that it is picking up year by year, reaching 1.88 million in 2022. If the market economy gradually improves, it is expected to return to the level of 2 million in 2023.


The top five producing countries in the Americas are, in that order: the United States, Mexico, Brazil, Canada, and Argentina. The United States accounted for more than 56% of the total production in the Americas, amounting to 10.06 million vehicles. Mexico, which ranks second, also has 3.5 million vehicles, and Brazil also has 2.37 million vehicles. It can be observed that the focus of car production in North America is still dominated by the United States and Mexico, and Brazil's position in car manufacturing in South America remains unshakable. The data also shows that compared with 2021, the automobile production in the United States, Mexico and Canada has a significant growth of about 10%. Regardless of whether it is North America or South America, its automobile production has shown a trend of increase year by year in the past three years. Originally, the Americas region was the third largest automobile production region in the world, but it successfully overtook Europe to be promoted to the second place last year.
The top five producing countries in Europe (including the UK) are: Germany, Spain, France, Czech Republic and Slovenia. Germany, which ranks first, had 3.67 million vehicles in 2022. Although it is lower than 2020, it is still higher than 2021. Spain, which ranks second, also had more than 2 million vehicles in 2022. France, the Czech Republic and Slovenia also roughly maintained the level of 1 million
Industry Focus 117 China Fastener World no.68/2023 惠達雜誌
2022 全球汽車生產及車型比較
Industry Focus 118 China Fastener World no.68/2023 惠達雜誌
All Vehicles Units 2019 2020 2021 2022 Variation 2022/2019 Variation 2022/2020 Variation 2022/2021 Europe 21,531,339 16,904,429 16,338,165 16,216,888 European Union 27 Countries + UK 17,978,353 13,781,659 13,129,583 13,801,210 -23% 0% 5% Germany, Cars and LCV Only 4,947,316 3,742,570 3,308,692 3,677,820 -26% -2% 11% Spain 2,822,632 2,268,185 2,098,133 2,219,462 -21% -2% 6% France, Cars and LCV Only 2,172,515 1,315,997 1,352,226 1,383,173 -36% 5% 2% Czech Republic 1,433,961 1,159,151 1,111,432 1,224,456 -15% 6% 10% Slovakia 1,107,902 990,598 1,030,000 1,000,000 -10% 1% -3% United Kingdom 1,381,405 987,044 932,488 876,614 -37% -11% -6% Italy 915,291 777,057 797,243 796,394 -13% 3% 0% Romania 490,412 438,107 420,755 509,465 4% 16% 21% Poland 649,864 451,382 439,421 483,840 -26% 7% 10% Hungary 498,158 406,497 416,725 441,729 -11% 9% 6% Portugal 345,688 264,236 289,954 322,404 -7% 22% 11% Belgium 285,797 267,293 261,038 276,554 -3% 4% 6% Sweden, Yearly Only 279,000 249,000 258,023 238,955 -14% -4% -7% Austria 179,400 125,000 136,700 107,500 -40% -14% -21% Netherlands, Yearly Only 176,113 127,058 107,021 101,670 -42% -20% -5% Finland, Cars Only 114,785 86,270 85,934 73,044 -36% -15% -15% Slovenia 199,114 141,714 95,797 68,130 -66% -52% -29% Serbia 35,120 23,375 21,263 4,498 -87% -81% -79% CIS (Excluding Belarus) 2,056,631 1,801,527 1,911,188 1,058,532 -49% -41% -45% Belarus 30,494 31,273 29,891 N/A Russia 1,720,487 1,435,551 1,567,007 608,460 -65% -58% -61% Uzbekistan 277,967 284,885 242,104 333,569 20% 17% 38% Kazakhstan 49,400 74,831 92,417 112,540 128% 50% 22% Azerbaijan 2,523 2,058 2,318 2,473 -2% 20% 7% Ukraine 7,266 4,951 8,153 1,490 -80% -70% -82% Turkey 1,461,244 1,297,878 1,276,140 1,352,648 -7% 4% 6% America 20,160,401 15,692,927 16,190,835 17,756,263 -12% 13% 10% NAFTA 16,822,606 13,374,404 13,467,065 14,798,146 -12% 11% 10% USA 10,892,884 8,821,026 9,157,205 10,060,339 -8% 14% 10% Mexico 4,013,137 3,177,251 3,194,858 3,509,072 -13% 10% 10% Canada 1,916,585 1,376,127 1,115,002 1,228,735 -36% -11% 10% South America 3,337,795 2,318,523 2,723,770 2,958,117 -11% 28% 9% Brazil 2,944,988 2,014,055 2,248,253 2,369,769 -20% 18% 5% Argentina, Cars and LCV Only 314,787 257,187 434,753 536,893 71% 109% 24% Colombia 78,020 47,281 40,764 51,455 -34% 9% 26% Asia-Oceania 49,333,841 44,276,549 46,768,800 50,020,793 1% 13% 7% China 25,750,650 25,225,242 26,121,712 27,020,615 5% 7% 3% Japan 9,684,507 8,067,943 7,836,908 7,835,519 -19% -3% 0% India 4,524,366 3,381,819 4,399,112 5,456,857 21% 61% 24% South Korea 3,950,614 3,506,774 3,462,404 3,757,049 -5% 7% 9% Thailand 2,013,710 1,427,074 1,685,705 1,883,515 -7% 32% 12% Indonesia 1,286,848 690,176 1,121,967 1,470,146 14% 113% 31% Iran, Yearly Only 821,060 880,997 894,298 1,064,215 30% 21% 19% Malaysia 571,632 485,186 481,651 702,275 23% 45% 46% Taiwan 251,304 245,615 265,320 261,263 4% 6% -2% Pakistan 186,751 117,375 238,702 235,454 26% 101% -1% Vietnam, Yearly Only 176,203 165,568 167,799 232,410 32% 40% 39% Philippines, Yearly Only 95,094 67,297 85,874 92,223 -3% 37% 7% Australia, Yearly Only 5,606 4,730 5,391 6,077 8% 29% 13% Myanmar, Yearly Only 15,496 10,753 1,957 3,175 -80% -71% 62% Africa (Excluding Egypt) 1,095,151 776,247 907,302 1,022,783 -7% 32% 13% Egypt, Yearly Only 18,500 23,754 N/A N/A South Africa 631,921 447,213 499,087 555,889 -12% 24% 11% Morocco 403,218 328,280 403,007 464,864 15% 42% 15% Algeria 60,012 754 5,208 2,773 -95% 268% -47% Total 92,120,732 77,650,152 80,205,102 85,016,728 -8% 10% 6% Estimate / N/A : Not Available / Source:OICA
Table 1. World Motor Vehicle Production by Country/Region
vehicles. Except for several typical automobile production countries in Western Europe, it can be seen that the development of the automobile manufacturing industry in Central and Eastern Europe can be described as blooming everywhere, and there is a trend of gradually catching up from behind. For car manufacturers, the Czech Republic, Slovakia, Romania, Poland, Hungary and Portugal are all attractive investments. Especially in Romania, Poland and Portugal, their performance in 2022 increased by 21%, 10% and 11% respectively compared to 2021. In addition, if Turkey is also counted in Europe, there is also a production scale of about 1.3 million vehicles, which can also set off a certain influence in the European auto supply chain.
The main producing countries in Russia and Central Asia are: Russia, Uzbekistan, Kazakhstan, Belarus and Ukraine. In the past, Russia's average annual production volume was about 1.5 million vehicles, which shrank sharply to 608,000 vehicles in 2022, which may be related to the factors of international economic sanctions and the embargo of raw materials from Western countries. On the contrary, although the production scale of Uzbekistan and Kazakhstan is not large compared with other countries, the production in 2022 showed a significant growth of 38% and 22% respectively compared with 2021. The automobile industries in Belarus, Ukraine, and Azerbaijan are relatively underdeveloped in terms of data, with only a few thousand or tens of thousands of vehicles.
On the whole, if you don't look at the African part (too small), the car production in the Americas has the most significant growth year-on-year, reaching 10%. The Asia-Pacific region followed closely behind, also growing by 7%. The European region is roughly the same as in 2021, with only a slight decrease of 1% (if you only look at the part of the EU 27 + the United Kingdom, there will also be a 5% growth).
Passenger Cars

Passenger cars are the mainstream purchases of general car consumers, and global passenger car production has grown year by year in the past three years. Passenger car production in 2022 increased by 8% compared to 2021 to approximately 61.59 million units, accounting for more than 72% of the total global car production. It can be seen that passenger cars are still the largest type of automobile production (see Table 2).
Benefiting from the demographic dividend in the region, about 68% of the passenger car production in the Asia-Pacific region reached 42.32 million units, accounting for 84% of the total automobile production in the Asia-Pacific region. Passenger vehicle production in the Asia-Pacific region is highly concentrated in China, Japan, India, South Korea and Indonesia, with 23.83 million, 6.56 million, 4.43 million, 3.43 million and 1.21 million vehicles respectively. In 2022, except for Japan, which experienced a 1% decline, the other five countries had a growth rate of more than 10% compared to 2021, especially Indonesia's 37% growth rate is the most obvious.
The second largest production center for passenger cars is Europe, whose production of passenger cars in 2022 reached 13.72 million units, accounting for about 84% of the total car production in Europe. The top five passenger car producing countries in the region are Germany, Spain, Czech Republic, France and Slovakia, with 3.48 million, 1.78 million, 1.21 million, 1.01 million and 1 million vehicles respectively. Among them, Germany, France and Czech Republic all showed a performance of 10% compared with the previous year.
As for the Americas, which is currently the second largest automobile production region in the world, the production data of passenger vehicles has a very unexpected performance. The production of passenger vehicles in the Americas region in 2022 was approximately 4.83 million units, accounting for less than 30% of its total vehicle
Units Pessenger Cars 2019 2020 2021 2022 Variation 2022/2019 Variation 2022/2020 Variation 2022/2021 Europe 18,700,957 14,534,879 13,822,390 13,725,107 -27% -6% -1% European Union 27 Countries + UK 15,835,919 12,045,025 11,338,938 12,025,961 -24% -0.2% 6% Germany 4,663,749 3,515,488 3,096,165 3,480,357 -25% -1% 12% Spain 2,248,291 1,800,664 1,662,174 1,785,432 -21% -1% 7% Czech Republic 1,427,563 1,152,901 1,105,223 1,217,787 -15% 6% 10% France 1,662,963 927,344 918,825 1,010,466 -39% 9% 10% Slovakia 1,107,902 990,598 1,030,000 1,000,000 -10% 1% -3% United Kingdom 1,303,135 920,928 859,575 775,014 -41% -16% -10% Romania 490,412 438,107 420,755 509,465 4% 16% 21% Italy 542,472 451,718 443,819 473,194 -13% 5% 7% Hungary 498,158 406,497 416,725 441,729 -11% 9% 6% Portugal 282,142 211,281 229,221 256,018 -9% 21% 12% Poland 434,700 278,900 260,800 255,100 -41% -9% -2% Sweden 279,000 249,000 258,023 238,955 -14% -4% -7% Belgium 247,020 237,057 224,180 232,100 -6% -2% 4% Austria 158,400 109,500 124,700 107,500 -32% -2% -14% Netherlands 176,113 127,058 107,021 101,670 -42% -20% -5% Finland 114,785 86,270 85,934 73,044 -36% -15% -15% Slovenia 199,114 141,714 95,797 68,130 -66% -52% -29% Serbia 34,985 23,272 21,109 4,358 -88% -81% -79% CIS 1,847,411 1,611,539 1,679,508 883,899 -52% -45% -47% Belarus 20,427 21,295 29,891 N/A - -Russia 1,523,607 1,260,518 1,352,740 448,897 -71% -64% -67% Uzbekistan 271,113 280,080 236,668 328,118 21% 17% 39% Kazakhstan 44,077 64,790 80,679 103,345 135% 60% 28% Azerbaijan 2,360 1,949 2,079 2,049 -13% 5% -1% Ukraine 6,254 4,202 7,342 1,490 -76% -65% -80% Turkey 982,642 855,043 782,835 810,889 -18% -5% 4% Industry Focus 119 China Fastener World no.68/2023 惠達雜誌 Estimate / N/A : Not Available
Table 2. World Passenger Cars Production by Country/Region
production (17.75 million units) in the same year, which is a relatively low proportion. The top 5 passenger car producing countries are Brazil, the United States, Mexico, Canada and Argentina in order, with 1.82 million, 1.75 million, 650,000, 289,000 and 257,000 vehicles respectively. Brazil has even surpassed the United States to become the most important passenger car production center in the Americas.
Light Commercial Vehicle
The production of light commercial vehicles is also a very important part of global automobile production. In 2022, the global production of light commercial vehicles reached 19.86 million units, an increase of 7% year-onyear, accounting for about 23% of the total global vehicle production in that year. (See Table 3)
Unlike passenger car production, which is mostly concentrated in the Asia-Pacific region, more than 60% of light commercial vehicle production is concentrated in the Americas (about 12.19 million units in 2022, an increase of 10% compared to 2020, and more than 87 % are concentrated in the United States and Mexico).
Production in the Asia-Pacific region also accounted for more than 26% (about 5.23 million vehicles), and it was mainly concentrated in China and Thailand, with 1.84 million and 1.28 million vehicles respectively.
In contrast, the production of light commercial vehicles in Europe in 2022 was only about 2.14 million, a decrease of 2% from 2021, accounting for only about 10% of the world. Judging from the published data, the most important manufacturers of light commercial vehicles in Europe are Spain, France, Italy, Poland and Germany. The Turkish part has maintained a production scale of 400,000 to 500,000 vehicles in the past few years.
Heavy Truck
The total production of heavy trucks in the world reached more than 4 million units per year from 2019 to 2021, but dropped sharply by 23% to 3.3 million units in 2022, mainly due to the performance of the Asia-Pacific region (data showed that in 2022, the heavy-duty trucks in the Asia-Pacific region production fell sharply by 32% year-on-year). See Table 4
The production of heavy trucks in the Asia-Pacific region in 2022 was 2.28 million units, accounting for nearly 70% of the total global heavy truck production in that year, with China, Japan and India as the main production centers.
The Americas is the second largest production base for heavy trucks. In 2022, the region produced a total of about 680,000 heavy trucks, accounting for about 21% of the global heavy truck production in the same year. Different from the Asia-Pacific region, the production of heavy trucks in the Americas shows a trend of annual growth. After a substantial growth of 44% in 2021, it will continue to grow by 11% by 2022. The United States, Mexico and Brazil are the top three major producers of heavy trucks in the region.
The production scale of heavy trucks in Europe is less than half of that in the Americas. In 2022, the production volume of heavy trucks in this region was about 300,000 units, a slight increase from 2021. Compared with the performance in 2020 and 2021, the growth performance of heavy truck production in Europe has a clear slowdown trend. At present, the most important heavy truck production bases in Europe are Spain, Italy, Belgium and the United Kingdom. Türkiye also has a production scale of nearly 40,000 vehicles.
Units Pessenger Cars 2019 2020 2021 2022 Variation 2022/2019 Variation 2022/2020 Variation 2022/2021 America 7,004,767 4,967,015 4,491,915 4,832,901 -31% -3% 8% NAFTA 4,369,893 3,219,558 2,559,194 2,699,108 -38% -16% 6% USA 2,511,711 1,924,398 1,562,717 1,751,736 -30% -9% 12% Mexico 1,396,812 967,479 708,242 658,001 -53% -32% -7% Canada 461,370 327,681 288,235 289,371 -37% -12% 0% South America 2,634,874 1,747,457 1,932,721 2,133,793 -19% 22% 10% Brazil 2,448,490 1,607,175 1,707,851 1,824,833 -26% 14% 7% Argentina 108,364 93,001 184,106 257,505 138% 177% 40% Colombia 78,020 47,281 40,764 51,455 -34% 9% 26% Asia-Oceania 40,650,626 35,822,949 38,188,956 42,324,447 4% 18% 11% China 21,389,833 19,994,081 21,444,743 23,836,083 11% 19% 11% Japan 8,329,130 6,960,411 6,619,245 6,566,356 -21% -6% -1% India 3,629,008 2,836,534 3,631,095 4,439,039 22% 57% 22% South Korea 3,612,587 3,211,706 3,162,727 3,438,355 -5% 7% 9% Indonesia 1,045,666 551,426 889,756 1,214,250 16% 120% 37% Iran, Yearly Only 770,000 826,210 838,251 997,519 30% 21% 19% Malaysia 534,115 457,755 446,431 650,190 22% 42% 46% Thailand 795,254 537,633 594,690 594,057 -25% 11% 0% Taiwan 189,549 180,967 196,749 191,409 1% 6% -3% Pakistan 156,623 95,504 193,991 190,555 22% 100% -2% Vietnam, Yearly Only 129,006 125,235 123,482 162,491 26% 30% 32% Philippines 57,238 37,141 46,278 41,663 -27% 12% -10% Myanmar, Yearly Only 12,617 8,346 1,519 2,480 -80% -70% 63% Australia 0 0 0 0 - -Africa 777,220 538,723 582,814 716,195 -8% 33% 23% Egypt, Yearly Only 18,500 23,754 N/A N/A - -Morocco 368,543 299,753 338,339 404,742 10% 35% 20% South Africa 348,665 238,216 239,267 309,423 -11% 30% 29% Algeria 60,012 754 5,208 2,030 -97% 169% -61% Total - 55,863,566 57,086,075 61,598,650 -8% 10% 8%
Focus 120 China Fastener World no.68/2023 惠達雜誌
Table 2. World Passenger Cars Production by Country/Region
Industry
Table 3. World Light Commercial Vehicle Production by Country/Region
Heavy Buses
Compared with the aforementioned models, the production scale of heavyduty buses is the smallest. In 2022, the global production of heavy-duty buses exceeded 250,000 units, a year-on-year increase of 28%. It also grew by 15% year-on-year before 2021 (see Table 5)
The Asia-Pacific region is the most important production base of heavy-duty buses. The output of heavy-duty buses in this region reached more than 170,000 in 2022, a substantial increase of 27% from the previous year, accounting for nearly 70% of the total global heavy-duty bus production in the same year. China and India are the main production centers.
The scale of production in the Americas and Europe is similar, probably accounting for nearly 40,000 vehicles. It is worth noting that the production scale of heavy-duty buses in the Americas increased by 71% and 64% in 2021 and 2022, respectively.
In particular, Mexico and Brazil almost cover the production of heavy-duty buses in the Americas.
In Europe, the Czech Republic and Poland are the main production bases for heavy-duty buses.

Units Light Commercial Vehicles 2019 2020 2021 2022 Variation 2022/2019 Variation 2022/2020 Variation 2022/2021 Europe 2,524,134 2,110,169 2,181,987 2,148,379 -15% 2% -2% European Union 27 Countries + UK 1,953,385 1,590,962 1,605,118 1,580,918 -19% -1% -2% Slovenia N/A N/A N/A N/A - -Finland / Netherlands / Sweden / Hungary Confidential Spain 524,504 430,616 383,736 377,779 -28% -12% -2% France 509,552 388,653 433,401 372,707 -27% -4% -14% Italy 312,377 277,067 290,021 268,430 -14% -3% -7% Poland, All CVS 207,802 166,445 173,417 223,680 8% 34% 29% Germany 283,567 227,082 212,527 197,463 -30% -13% -7% United Kingdom 57,442 51,244 55,644 80,210 40% 57% 44% Portugal 58,141 49,855 56,372 60,649 4% 22% 8% Serbia 126 93 145 140 11% 51% -3% Austria 0 0 0 0 - -Belgium 0 0 0 0 - -Czech Republic 0 0 0 0 - -Romania 0 0 0 0 - -Slovakia 0 0 0 0 - -CIS (Only Russia) 122,749 109,468 129,776 83,813 -32% -23% -35% Ukraine 136 51 43 N/A - -Russia 122,749 109,468 129,776 83,813 -32% -23% -35% Azerbaijan 0 0 0 0 - -Belarus 0 0 0 0 - -Kazakhstan 0 0 0 0 - -Uzbekistan 0 0 0 0 - -Turkey 447,874 409,646 446,948 483,508 8% 18% 8% America 12,444,040 10,225,219 11,055,411 12,197,931 -2% 19% 10% NAFTA 11,882,266 9,763,494 10,442,053 11,567,376 -3% 19% 11% USA 8,036,106 6,656,572 7,307,551 7,988,565 -1% 20% 9% Mexico 2,414,256 2,072,699 2,320,239 2,650,345 10% 28% 14% Canada 1,431,904 1,034,223 814,263 928,466 -35% -10% 14% South America 561,774 461,725 613,358 630,555 12% 37% 3% Colombia N/A N/A N/A N/A - -Brazil 355,351 297,539 362,711 351,167 -1% 18% -3% Argentina 206,423 164,186 250,647 279,388 35% 70% 12% Asia-Oceania 5,255,384 4,668,333 5,108,390 5,238,222 0% 12% 3% China 2,002,284 2,151,347 2,174,102 1,846,256 -8% -14% -15% Thailand, All CVs 1,218,456 889,441 1,091,015 1,289,458 6% 45% 18% Japan 839,582 697,423 708,524 752,774 -10% 8% 6% India 542,860 385,691 486,911 617,398 14% 60% 27% South Korea 258,534 229,040 227,673 245,547 -5% 7% 8% Indonesia 146,150 95,295 157,890 160,171 10% 68% 1% Vietnam 47,197 40,333 44,317 69,919 48% 73% 58% Taiwan 55,896 57,362 58,791 60,758 9% 6% 3% Iran, Yearly Only 40,800 43,778 44,785 53,295 31% 22% 19% Malaysia, All Cvs 37,517 27,431 35,220 52,085 39% 90% 48% Philippines, All CVs 37,856 30,156 39,596 50,560 34% 68% 28% Pakistan 25,373 18,629 39,128 39,306 55% 111% 1% Myanmar 2,879 2,407 438 695 -76% -71% 59% Australia 0 0 0 0 - -Africa 289,092 214,218 296,834 275,594 -5% 29% -7% South Africa 254,417 185,691 232,166 215,472 -15% 16% -7% Morocco 34,675 28,527 64,668 60,122 73% 111% -7% Algeria N/A N/A 0 743 - -Egypt 0 0 0 0 - -Total 20,512,650 17,217,939 18,642,622 19,860,126 -3% 15% 7% Industry Focus 121 China Fastener World no.68/2023 惠達雜誌
Estimate / N/A : Not Available
Summary
Judging from the data in the above tables, the overall global vehicle production volume has not shown a significant downward trend due to the epidemic in the past four years, but has increased year by year. This result may make many previous analysts who were pessimistic about the auto market. However, on the other hand, it may also mean that the demand for cars from global consumers is still strong, which in turn will boost the production willingness of various car manufacturers. Asia (especially China), the United States, Mexico, Brazil, Western European countries and major Central and Eastern European countries will continue to play very critical roles in global automobile production (whether it is passenger cars, light commercial vehicles, heavy trucks, or heavy buses).
Table 4. World Heavy Truck Production by Country/Region
Units Heavy Trucks 2019 2020 2021 2022 Variation 2022/2019 Variation 2022/2020 Variation 2022/2021 Europe 263,013 220,927 298,553 305,319 16% 38% 2% European Union 27 Countries + UK 174,018 133,062 174,154 182,675 5% 37% 5% Austria 21,000 15,500 12,000 N/A - -Slovenia N/A N/A N/A N/A - -Finland / France / Germany / Netherlands / Sweden Confidential - -Spain 49,837 36,905 52,223 56,251 13% 52% 8% Italy 60,294 47,937 63,167 54,499 -10% 14% -14% Belgium 38,434 30,070 36,785 44,357 15% 48% 21% United Kingdom 18,883 13,931 16,379 20,507 9% 47% 25% Portugal 5,389 3,039 4,338 5,714 6% 88% 32% Czech Republic 1,181 1,180 1,262 1,347 14% 14% 7% Hungary 0 0 0 0 - -Poland, See LVv 0 0 0 0 - -Romania 0 0 0 0 - -Slovakia 0 0 0 0 - -Serbia 9 10 9 0 - -CIS 69,992 64,615 85,825 76,074 9% 18% -11% Belarus 8,798 8,629 N/A N/A - -Ukraine Confidential - -Russia 60,262 52,103 70,506 63,723 6% 22% -10% Kazakhstan, All CVs 4,247 8,240 10,647 7,833 84% -5% -26% Uzbekistan 5,320 4,163 4,433 4,094 -23% -2% -8% Azerbaijan 163 109 239 424 160% 289% 77% Turkey 19,003 23,250 38,574 46,570 145% 100% 21% America 677,275 479,180 621,087 688,717 2% 44% 11% NAFTA 563,799 388,244 462,277 526,725 -7% 36% 14% USA, Including Buses 345,067 240,056 286,937 320,038 -7% 33% 12% Mexico 195,421 133,965 162,836 195,789 0% 46% 20% Canada 23,311 14,223 12,504 10,898 -53% -23% -13% South America 113,476 90,936 158,810 161,992 43% 78% 2% Argentina Confidential - -Brazil 113,476 90,936 158,810 161,992 43% 78% 2% Colombia N/A N/A N/A N/A - -Asia-Oceania 3,160,164 3,626,520 3,331,219 2,280,468 -28% -37% -32% Philippines N/A N/A N/A N/A - -Thailand N/A N/A N/A N/A - -Vietnam N/A N/A N/A N/A - -China 2,217,847 2,976,459 2,408,249 1,249,268 -44% -58% -48% Japan 506,541 405,451 506,938 512,809 1% 27% 1% India 254,165 122,576 246,407 327,369 29% 167% 33% Indonesia 91,757 41,379 72,983 93,679 2% 126% 28% South Korea 64,758 55,583 65,895 64,896 0% 17% -2% Iran 9,600 10,301 10,538 12,540 31% 22% 19% Taiwan 5,859 7,286 9,780 9,096 55% 25% -7% Australia, Yearly Only 5,606 4,730 5,391 6,077 8% 29% 13% Pakistan 4,031 2,755 5,038 4,734 17% 72% -6% Malaysia 0 0 0 0 - -Myanmar 0 0 0 0 - -Africa 27,840 22,567 26,969 30,249 9% 34% 12% Algeria N/A N/A N/A N/A - -Egypt 0 0 0 0 - -Morocco N/A N/A N/A N/A - -South Africa 27,840 22,567 26,969 30,249 9% 34% 12% Total 4,128,292 4,349,194 4,277,828 3,304,753 -20% -24% -23% Industry Focus 122 China Fastener World no.68/2023 惠達雜誌
Estimate / N/A : Not Available
This may also be good news for many manufacturers that focus on the production of automotive fasteners. Coupled with the continuous technological improvement of the automobile industry, if the automotive fastener industry can actively strengthen cooperation with customers in major automobile production markets to establish distribution channels, and at the same time grasp the changes and trends in the application of automotive fasteners in the future, automotive fasteners, I believe, will still be a profitmaking shortcut full of business opportunities.
Table 5. World Heavy Buses Production by Country/Region

Unit Heavy Buses 2019 2020 2021 2022 Variation 2022/2019 Variation 2022/2020 Variation 2022/2021 Europe 43,235 38,454 35,235 38,083 -12% -1% 8% European Union 27 Countries + UK 15,031 12,610 11,373 11,656 -23% -8% 3% Austria N/A N/A N/A N/A - -Finland N/A N/A N/A N/A - -Hungary N/A N/A N/A N/A - -Slovenia N/A N/A N/A N/A - -France / Germany / Netherlands / Sweden Confidential - -Czech Republic 5,217 5,070 4,947 5,322 2% 5% 8% Poland 7,362 6,037 5,204 5,060 -31% -16% -3% United Kingdom 1,945 941 890 883 -55% -6% -1% Italy 148 335 236 271 83% -19% 15% Belgium 343 166 73 97 -72% -42% 33% Portugal 16 61 23 23 44% -62% 0% Spain 0 0 0 0 - -Romania 0 0 0 0 - -Slovakia 0 0 0 0 - -Serbia 0 0 0 0 - -CIS 16,479 15,905 16,079 14,746 -11% -7% -8% Belarus 1,269 1,349 N/A N/A - -Ukraine 876 698 768 N/A - -Russia 13,869 13,462 13,985 12,027 -13% -11% -14% Kazakhstan 1,076 1,801 1,091 1,362 27% -24% 25% Uzbekistan 1,534 642 1,003 1,357 -12% 111% 35% Azerbaijan 0 0 0 0 - -Turkey 11,725 9,939 7,783 11,681 0% 18% 50% America 34,319 21,513 22,422 36,714 7% 71% 64% NAFTA 6,648 3,108 3,541 4,937 -26% 59% 39% Canada, See LCV & HCV N/A N/A N/A N/A - -Mexico 6,648 3,108 3,541 4,937 -26% 59% 39% USA, See LCV & HCV 0 0 0 0 - -South America 27,671 18,405 18,881 31,777 15% 73% 68% Argentina Confidential Confidential Confidential Confidential - -Brazil 27,671 18,405 18,881 31,777 15% 73% 68% Colombia N/A N/A N/A N/A - -Asia-Oceania 267,667 158,747 140,234 177,657 -34% 12% 27% Malaysia N/A N/A N/A N/A - -Thailand N/A N/A N/A N/A - -Vietnam N/A N/A N/A N/A - -China 140,686 103,355 94,618 89,008 -37% -14% -6% India 98,333 37,018 34,699 73,051 -26% 97% 111% South Korea 14,735 10,445 6,109 8,251 -44% -21% 35% Japan 9,254 4,658 2,201 3,580 -61% -23% 63% Indonesia 3,275 2,076 1,338 2,046 -38% -1% 53% Iran, Yearly Only 660 708 724 862 31% 22% 19% Pakistan 724 487 545 859 19% 76% 58% Australia 0 0 0 0 - -Myanmar 0 0 0 0 - -Philippines 0 0 0 0 - -Taiwan 0 0 0 0 - -Africa 999 739 685 745 -25% 1% 9% Algeria N/A N/A N/A N/A - -South Africa 999 739 685 745 -25% 1% 9% Egypt 0 0 0 0 - -Morocco 0 0 0 0 - -Total 346,220 219,453 198,576 253,199 -27% 15% 28% Industry Focus 123 China Fastener World no.68/2023 惠達雜誌
Estimate
by
/ N/A : Not Available
Gang Hao Chang, Vice Editor-in-Chief of Fastener World 著作權所有:惠達雜誌
2022 年全球電動車銷售與鎖固技術前線
Global EV Sales for 2022 & EV Fastening on the Front Line
Global Sales Growth was Slower in 2022 But Remained High
Electric vehicles mainly include pure electric vehicles and plug-in hybrids. Global EV sales (Figure 1) grew from 2.276 million vehicles in 2019 (up 9%) before the pandemic, went on to 3.244 million vehicles in 2020 (up 43%), then doubled to 6.768 million vehicles in 2021 (up 109%), and jumped to 10.522 million vehicles in 2022 (up 55%) approaching the end of the pandemic.
In terms of EV market share in global vehicle sales, from 2019 to 2022, the EV share went from 2.5% to 4.2%, 8.3% and 13% respectively. Here we can tell that EV sales doubled during the pandemic years. Although the market share growth slowed down to 56% in 2022, it still shows the strength of the demand for electric vehicles.
Astounding EV Demand in China Regardless of Economic Crises
As shown in Figure 2 , European EV sales surged 151% in 2020. Then, the growth began to slow down, dropping to 66% in 2021 and only 15% in 2022, mainly because the war between Russia and Ukraine exacerbated parts shortage at the time. China’s EV sales soared 155% in 2021, then the growth slowed to 82% in 2022. However, China's astounding demand for EVs is evident in the fact that China's sales in 2022 were 2.3 times higher than Europe's and 5.5 times higher than the U.S. and Canada's. The U.S. grew just 11% in 2020, then accelerated to 111% growth in 2021 and slowed to 48% growth in 2022.
Norway and Indonesia Show Strong Potential for EVs

Other regions’ EV sales (Figure 2) grew 161% from the beginning to the end of the pandemic. Notably, Norway's domestic EV market share was high at 78%. It was 27% for China, 20% for Europe, and 7% for the US. In terms of growth rate, Indonesia grew the fastest, up 10 times to 10,000 vehicles; India grew twice as fast to 50,000 vehicles; New Zealand grew 1.5 times as fast to 23,000 vehicles.
Most Global Automakers Achieved Double-Digit Sales Growth
In terms of EV sales by major carmakers in 2022 (Figure 3), BYD was up 211% to 1.85 million vehicles, followed by Tesla with a 40% growth to
Industry Focus 124 China Fastener World no.68/2023 惠達雜誌
1.3 million vehicles, VW Group in the third place with a 10% growth to 850,000 vehicles, GM Wuling in the fourth place with a 13% growth to 600,000 vehicles, and Stellantis in the fifth place with a 34% growth to 500,000 vehicles, followed by Hyundai by a small gap.
The rest of carmakers included BMW, up 32% to 450,000 vehicles, Geely up 251% to 350,000 vehicles, Changan Automobile, up 134% to 250,000 vehicles, Ford up 55% to 200,000 vehicles, and Nio up 33% to 150,000 vehicles. Global EV sales continued to grow throughout 2022, with the exception of Great Wall Motor which dropped 4 percent and Toyota which dropped 13 percent.
BYD Taking up Most of the Top 10 Chart and Eyeing Tesla
In terms of EV models (Figure 4) , Tesla and BYD series are arguably the most sought-after vehicles in the world. Tesla's Model Y and Model 3 are the top two in the 10 most popular EV models. Model Y sales grew from 410,000 vehicles in 2020 to 770,000 vehicles worldwide, while Model 3 sales dropped from 500,000 vehicles to 470,000. Adding these two models together, Tesla's sales increased from 910,000 vehicles in 2020 to 1.24 million vehicles in 2022, a 36% increase.
BYD is Tesla's biggest rival, with as many as six models in the top 10, accounting for more than half of the rankings. Adding up the global sales of the six models in 2022, the total reached 1.28 million vehicles, up 178 percent and exceeded Tesla's total. BYD's growth rate in the past year was nearly 5 times that of Tesla!
Future EV Demand is Still Growing
China rolled out multiple incentive policies in 2022 that stimulated EV sales to grow 82%. Europe, the second largest EV market, has been hit by geopolitics and seen its growth shrink significantly. In the U.S., EV sales were up 48% due to subsidies for vehicle owners and the rollout of consumer-preferred vehicle models.
Based on the data by several market research firms, global EV sales are expected to grow about 30 percent to 14 million vehicles by 2023. Although global EV sales are expected to grow at a slower rate this year than in the past two years, they still make a significant momentum for growth. If political tensions in Europe subside, and if countries make efforts to reduce inflationary pressures, the potential for EV demand is still worth looking forward to.
EV Fastening on the Front Line
The differences between electric and fuel vehicles have changed the design of automotive fasteners. Instead of using traditional transmissions, EVs use motors with electronic controllers, increasing the need for circuit boards. These circuit boards are often set into a light aluminum casting, which require microscrews for fastening. These thread-forming screws must deliver performance in a miniaturized setting to replace welding, gluing and clipping. Some threaded self-forming screws also have the function of heat sinks and are vibration resistant.
Carmakers have adopted boron steel as a core material for lightweighting vehicle bodies, allowing for thinner and stronger materials. It requires corresponding technology to bond alloys to car bodies. Some carmakers have signed confidentiality agreements with fastener suppliers to provide fasteners for the assembly of power electronics systems (including circuit boards, electrical contacts, DC adaptors, HV/LV filters, battery packs, on-board charger circuit boards, sealing covers for internal cooling device and housing covers). It is worth noting that the use of recycled plastics is emerging among carmakers, and the performance design of corresponding fasteners has changed due to the different material combinations from the original ones.
A final point of interest is the charging station for EVs. A home wallmounted EV charging station uses about 50 fastening elements. If the charging station is mounted to a wooden wall, wood screws or drywall anchors are often used. If installed on a concrete wall, expansion anchors, cement screw or chemical anchors would be used. If the station is installed outdoors, stainless steel screws or coated screws are used. The need for fasteners that will come with charging stations should not be overlooked.
by Dean Tseng, Fastener World 著作權所有:惠達雜誌
Industry Focus 125 China Fastener World no.68/2023 惠達雜誌
2022全球汽車銷售統計與分析
Statistics and Analysis on Global Auto Sales in 2022
After last year's global auto market downturn, market research firms are predicting a slight rebound in sales this year, but there is still a lot of difficulty in getting back to pre-pandemic levels. With the release of sales statistics by the International Organization of Motor Vehicle Manufacturers (OICA), what past phenomena does this statistics reflect? Which country is the next with the best potential for car sales this year? Let's explore together in this article.
Sales Volume of all Vehicle Types
According to the latest data released by OICA (see Figure 1), global vehicle sales have been hit hard by factors including the pandemic in the past three years, falling from about 91.24 million units in 2019 to a bottom of 78.78 units in 2020, rebounding to about 82.75 million units in 2021, and falling to about 81.62 million units in 2022, down 1.3% from the previous year. The last two years remain at the low end compared to the pre-pandemic period. Analyzed by continent, Asia Pacific leads the world in vehicle sales, with 44,566,542 units in 2022, followed by the Americas with 20,888,241 units, and Europe in the third place with 15,083,088 units. Europe, America and Asia alone accounted for 98.6% of the world's total sales. 1.09 million units were sold in Africa last year.
The top five car sales regions in Asia Pacific are China, India, Japan, ASEAN and South Korea in order. Although China's sales volume of 26.863 million units accounted for more than half of Asia Pacific sales, the growth rate was only 2% compared to last year, and only 4% compared to the pre-pandemic period, so the post-pandemic rebound was insufficient. India has emerged as "the next world’s factory" since last year, and foreign investors have been setting up factories there, so the Indian sales volume increased significantly by 25% last year to 4.72 million units, with an astounding growth potential. It is worth noting that the Philippines and Vietnam, both in Southeast Asia, are among the countries in the Asia-Pacific region that also saw a 25% increase. Sales in the ASEAN region also increased by 17% to 3.26 million units. Japan's sales fell 5% last year to 4.20 million units.

The top five sales countries are the U.S., Brazil, Canada, Mexico, and Chile, in order. Sales in the U.S. far exceeded those of other countries in the Americas by several times, reaching 15.40 million units. The second place is
Brazil with 2.104 million units, followed by Canada with 1.56 million units, Mexico with 1.04 million units, and Chile with 426 thousand units. Among these five countries, only Mexico and Chile had a slight increase in sales volume, while the others all dropped. It is worth noting that the sales volume in Central and South America has rebounded continuously in the past three years, while the North American region has generally shown a decline.
The top five sales countries in Europe (including UK) are Germany, UK, France, Italy and Spain in order. The sales volume of these five countries fell last year as well as in the past four years consecutively. In fact, from Table 1, we find that nearly 80% of the sales volume in Europe fell last year, with some of the countries experiencing doubledigit declines, which indicates obstruction in European car sales that forms a warning sign.
Overall, in addition to the Asia Pacific region sales growth of 4.3%, all the other regions fell, with only Europe declining by a double-digit 10.7%.
Industry Focus 126 China Fastener World no.68/2023 惠達雜誌
91,244,197 78,787,566 82,755,197 81,628,533 75,000,000 77,000,000 79,000,000 81,000,000 83,000,000 85,000,000 87,000,000 89,000,000 91,000,000 93,000,000 95,000,000 2019 2020 2021 2022
(Unit: Vehicle) Year
Fig. 1. All Vehicle Type Global Sales
Industry Focus 127 China Fastener World no.68/2023 惠達雜誌
Regions/Countries Q1-Q4 2019 Q1-Q4 2020 Q1-Q4 2021 Q1-Q4 2022 2022/2021 2022/ 2019 Europe 20,930,134 16,714,115 16,882,466 15,083,088 -10.7% -27.9% EU 27 Countries + EFTA + UK 18,423,617 14,080,973 14,141,064 13,302,914 -5.9% -27.8% Germany 4,017,059 3,266,759 2,973,319 2,963,748 -0.3% -26.2% United Kingdom 2,736,559 1,964,660 2,049,005 1,943,572 -5.1% -29.0% France 2,755,728 2,100,030 2,142,284 1,929,554 -9.9% -30.0% Italy 2,132,630 1,564,756 1,669,855 1,505,978 -9.8% -29.4% Spain 1,501,244 1,030,792 1,034,064 958,813 -7.3% -36.1% Poland 656,258 510,153 554,619 518,048 -6.6% -21.1% Belgium 642,000 509,994 463,811 431,594 -6.9% -32.8% Netherlands 538,739 427,162 402,823 386,458 -4.1% -28.3% Sweden 418,478 330,215 343,880 329,868 -4.1% -21.2% Switzerland 352,968 269,391 272,087 254,884 -6.3% -27.8% Austria 371,934 301,617 306,176 244,694 -20.1% -34.2% Other Countries 285,560 215,910 237,574 229,770 -3.3% -19.5% Czech Republic 281,423 228,834 236,221 219,198 -7.2% -22.1% Norway 189,722 180,885 217,464 210,007 -3.4% 10.7% Portugal 265,827 173,989 180,287 185,367 2.8% -30.3% Denmark 264,073 233,271 221,916 181,016 -18.4% -31.5% Romania 189,024 146,385 145,400 151,976 4.5% -19.6% Hungary 190,090 153,978 150,387 135,572 -9.9% -28.7% Ireland 145,104 112,122 136,126 131,400 -3.5% -9.4% Greece 122,990 88,710 112,364 115,884 3.1% -5.8% Finland 133,505 112,988 115,291 96,622 -16.2% -27.6% Slovakia 113,863 84,909 87,349 90,074 3.1% -20.9% Slovenia 73,498 49,677 65,698 55,924 -14.9% -23.9% Croatia 73,862 43,800 54,290 51,322 -5.5% -30.5% Bulgaria 44,977 29,663 34,472 37,495 8.8% -16.6% Russia, Turkey & Other Europe 2,506,517 2,633,142 2,741,402 1,780,174 -35.1% -29.0% Turkey 491,947 796,150 772,850 827,163 7.0% 68.1% Russia 1,778,841 1,631,163 1,741,965 808,604 -53.6% -54.5% Other Countries/Regions 133,187 106,843 96,819 90,279 -6.8% -32.2% Ukraine 102,542 98,986 121,772 45,661 -62.5% -55.5% America 25,389,729 20,817,485 22,014,634 20,888,241 -5.1% -17.7% USMCA (Former NAFTA) 20,824,602 17,445,480 18,160,147 16,927,731 -6.8% -18.7% USA 17,488,154 14,881,356 15,408,565 14,230,324 -7.6% -18.6% Canada 1,976,440 1,586,474 1,704,850 1,562,965 -8.3% -20.9% Mexico 1,360,008 977,650 1,046,732 1,134,442 8.4% -16.6% Central & South America 4,565,127 3,372,005 3,854,487 3,960,510 2.8% -13.2% Brazil 2,787,850 2,058,437 2,119,851 2,104,461 -0.7% -24.5% Chile 348,575 258,835 415,582 426,781 2.7% 22.4% Argentina 452,200 334,316 381,436 407,608 6.9% -9.9% Other Countries/Regions 351,181 256,623 340,213 387,244 13.8% 10.3% Colombia 248,689 173,121 229,493 237,249 3.4% -4.6% Peru 155,507 108,999 152,856 162,095 6.0% 4.2% Ecuador 119,197 78,187 109,707 126,050 14.9% 5.7% Puerto Rico 101,928 103,487 105,349 109,022 3.5% 7.0%
Table 1. Registrations or Sales of New Vehicles - All Types (Unit: Vehicle)
Passenger Car
Global passenger car sales have been picking up over the past three years and grew by 1.9% to 57.48 million units in 2022 compared to 2021, but the gap is still large compared to the pre-pandemic level of 64.03 million units, indicating that the market is still at a relatively low level (see Figure 2).
The sales volume in Asia Pacific reached 37.50 million units, among which India, ASEAN, Indonesia, Malaysia, Thailand, Vietnam, Philippines and other Southeast Asian countries achieved double-digit growth in sales volume, which is worth paying attention to in terms of the demand for automotive fasteners.
The top five sales countries in Europe are Germany, UK, France, Italy and Spain. Except for Germany, which only increased by 1%, the other four countries all declined, and so did the sales in the whole European region. The sales in Russia and Ukraine in the state of war fell by as much as about 60%.
The two largest passenger car sales countries in the Americas are the U.S. and Brazil. Sales in the U.S. declined by 14% last year to 2.85 million units, a big difference from the 4.71 million units sold before the pandemic, indicating that local sales were still in decline. Brazil grew only 1.2% last year, and overall there was no significant recovery there.
Fig. 2.Passenger Car Global Sales
Industry Focus 128 China Fastener World no.68/2023 惠達雜誌
Regions/Countries Q1-Q4 2019 Q1-Q4 2020 Q1-Q4 2021 Q1-Q4 2022 2022/2021 2022/ 2019 Asia/Oceania/Middle East 43,724,043 40,330,258 42,724,577 44,566,542 4.3% 1.9% China 25,796,931 25,311,069 26,314,263 26,863,745 2.1% 4.1% India 3,816,858 2,938,575 3,759,398 4,725,472 25.7% 23.8% Japan 5,195,216 4,598,615 4,448,340 4,201,320 -5.6% -19.1% ASEAN 3,474,851 2,457,336 2,779,838 3,269,405 17.6% -5.9% South Korea 1,795,134 1,905,972 1,734,581 1,683,657 -2.9% -6.2% Australia 1,062,867 916,968 1,049,831 1,081,429 3.0% 1.7% Indonesia 1,030,486 532,077 887,205 1,048,040 18.1% 1.7% Thailand 1,007,552 792,146 748,580 849,388 13.5% -15.7% Saudi Arabia 533,904 452,544 556,559 616,491 10.8% 15.5% Malaysia 604,287 529,434 508,911 607,000 19.3% 0.4% Other Countries/Regions 545,054 407,294 446,222 480,585 7.7% -11.8% Taiwan 425,000 444,161 422,000 415,195 -1.6% -2.3% Philippines 410,406 244,178 286,734 359,370 25.3% -12.4% Vietnam 281,262 262,823 260,850 330,280 26.6% 17.4% Israel 268,220 226,338 311,291 288,036 -7.5% 7.4% Pakistan 187,714 124,429 237,424 227,392 -4.2% 21.1% United Arab Emirates 232,305 158,711 188,844 207,539 9.9% -10.7% Uzbekistan 197,103 195,000 184,500 205,145 11.2% 4.1% New Zealand 149,293 115,435 165,287 164,813 -0.3% 10.4% Kuwait 112,633 85,287 100,157 110,118 9.9% -2.2% Kazakhstan 71,818 89,202 113,600 101,527 -10.6% 41.4% Africa 1,200,291 925,708 1,133,520 1,090,662 -3.8% -9.1% South Africa 532,898 372,633 450,674 529,562 17.5% -0.6% Other Countries/Regions 330,909 200,035 229,606 224,566 -2.2% -32.1% Egypt 170,568 219,732 277,805 175,125 -37.0% 2.7% Morocco 165,916 133,308 175,435 161,409 -8.0% -2.7% All Countries/Regions 91,244,197 78,787,566 82,755,197 81,628,533 -1.4% -10.5%
Table 1. Registrations or Sales of New Vehicles - All Types (Unit: Vehicle)
64,033,463 53,915,928 56,437,803 57,485,378 51,000,000 53,000,000 55,000,000 57,000,000 59,000,000 61,000,000 63,000,000 65,000,000 67,000,000 2019 2020 2021 2022 (Unit: Vehicle) Year
Industry Focus 129 China Fastener World no.68/2023 惠達雜誌
Regions/Countries Q1-Q4 2019 Q1-Q4 2020 Q1-Q4 2021 Q1-Q4 2022 2022/2021 2022/ 2019 Europe 17,948,525 14,176,858 14,016,065 12,640,455 -9.8% -29.6% EU 27 Countries + EFTA + UK 15,787,104 11,954,880 11,778,330 11,296,757 -4.1% -28.4% Germany 3,607,258 2,917,678 2,622,132 2,651,357 1.1% -26.5% United Kingdom 2,311,140 1,631,064 1,647,181 1,614,063 -2.0% -30.2% France 2,214,280 1,650,118 1,659,005 1,532,035 -7.7% -30.8% Italy 1,916,949 1,381,753 1,458,030 1,316,919 -9.7% -31.3% Spain 1,258,251 851,222 859,477 813,374 -5.4% -35.4% Poland 555,598 428,347 446,647 419,749 -6.0% -24.5% Belgium 550,008 431,491 383,123 366,333 -4.4% -33.4% Netherlands 446,056 355,598 322,323 313,609 -2.7% -29.7% Sweden 356,036 292,024 301,006 288,087 -4.3% -19.1% Switzerland 310,050 236,828 238,481 226,006 -5.2% -27.1% Austria 320,381 257,721 239,803 215,050 -10.3% -32.9% Czech Republic 249,915 202,971 206,876 192,087 -7.1% -23.1% Other Countries 238,551 182,625 195,040 187,000 Norway 142,381 141,412 176,276 174,329 -1.1% 22.4% Portugal 221,799 142,414 146,637 156,304 6.6% -29.5% Denmark 225,410 198,162 185,324 148,293 -20.0% -34.2% Romania 159,696 125,004 119,817 127,948 6.8% -19.9% Hungary 157,906 128,031 121,920 111,524 -8.5% -29.4% Greece 114,226 80,977 100,916 105,283 4.3% -7.8% Ireland 117,109 88,324 104,669 105,253 0.6% -10.1% Finland 114,188 96,430 98,481 81,674 -17.1% -28.5% Slovakia 101,568 76,305 75,700 78,841 4.1% -22.4% Slovenia 59,862 40,200 53,988 46,339 -14.2% -22.6% Croatia 62,977 36,013 44,929 42,955 -4.4% -31.8% Bulgaria 35,371 22,368 24,537 28,684 16.9% -18.9% Russia, Turkey & Other Europe 2,161,421 2,221,978 2,237,735 1,343,698 -40.0% -37.8% Russia 1,567,743 1,433,956 1,483,444 629,923 -57.5% -59.8% Turkey 387,256 610,109 561,853 592,660 5.5% 53.0% Other Countries/Regions 117,985 92,463 82,252 75,825 -7.8% -35.7% Ukraine 88,437 85,450 103,262 37,891 -63.3% -57.2% America 9,615,068 6,863,607 7,022,931 6,550,719 -6.7% -31.9% USMCA (Former NAFTA) 5,980,349 4,253,021 4,190,767 3,604,020 -14.0% -39.7% USA 4,719,710 3,401,838 3,350,050 2,858,575 -14.7% -39.4% Mexico 763,793 532,433 520,112 486,962 -6.4% -36.2% Canada 496,846 318,750 320,605 258,483 -19.4% -48.0% Central & South America 3,634,719 2,610,586 2,832,164 2,946,699 4.0% -18.9% Brazil 2,262,073 1,615,942 1,558,467 1,576,666 1.2% -30.3% Chile 260,683 194,128 304,045 313,589 3.1% 20.3% Other Countries/Regions 262,755 189,378 244,388 277,513 13.6% 5.6% Argentina 333,226 232,133 240,688 260,876 8.4% -21.7% Colombia 220,564 151,730 200,914 208,160 3.6% -5.6% Peru 115,241 81,496 111,436 118,915 6.7% 3.2% Ecuador 97,572 61,746 86,740 100,069 15.4% 2.6% Puerto Rico 82,605 84,033 85,486 90,911 6.3% 10.1%
Table 2. Registrations or Sales of New Vehicles – Passenger Car (Unit: Vehicle)
Commercial Car
Global commercial vehicle sales have fluctuated sharply over the past four years, showing a jagged line (see Figure 3), and although they rose sharply in 2021, they fell to a much lower level last year, landing at 24.14 million units.
As we can see from Table 3 , the vast majority of the world's commercial vehicles are sold in Europe, but the sales in this region also fell by double digits, with Ukraine, Russia and Austria showing the largest declines. The top five sales countries in this region, including France, UK Germany, Italy and Spain, have all experienced continuous sales declines over the past four years, resulting in a sluggish economy.
Although Asia Pacific also had a doubledigit decline, there were still many countries with significant increases, including India, Thailand, Indonesia, the Philippines, Malaysia, Saudi Arabia and so on, most of which are located in Southeast Asia. Among them, India has the largest increase, up 37%. The largest decline was in China, down 31%.
Industry Focus 130 China Fastener World no.68/2023 惠達雜誌
Regions/Countries Q1-Q4 2019 Q1-Q4 2020 Q1-Q4 2021 Q1-Q4 2022 2022/2021 2022/ 2019 Asia/Oceania/Middle East 35,586,750 32,210,364 34,565,574 37,504,121 8.5% 5.4% China 21,472,091 20,177,731 21,518,324 23,563,287 9.5% 9.7% India 2,962,115 2,433,473 3,082,279 3,792,356 23.0% 28.0% Japan 4,301,091 3,809,981 3,675,698 3,448,297 -6.2% -19.8% ASEAN 2,395,999 1,650,462 1,875,335 2,232,055 19.0% -6.8% South Korea 1,497,035 1,618,333 1,468,873 1,420,486 -3.3% -5.1% Indonesia 785,539 388,925 659,809 783,563 18.8% -0.3% Australia 799,263 676,804 753,256 777,688 3.2% -2.7% Malaysia 550,182 480,965 452,663 544,838 20.4% -1.0% Saudi Arabia 460,373 387,709 475,837 519,485 9.2% 12.8% Taiwan 379,999 408,628 382,000 375,841 -1.6% -1.1% Other Countries/Regions 401,434 294,228 320,408 346,983 8.3% -13.6% Thailand 468,638 343,494 312,200 343,349 10.0% -26.7% Vietnam 233,782 217,193 207,693 283,352 36.4% 21.2% Israel 239,671 202,455 280,042 257,743 -8.0% 7.5% Philippines 258,555 153,833 180,642 226,403 25.3% -12.4% Pakistan 162,689 104,387 198,921 188,318 -5.3% 15.8% United Arab Emirates 198,520 129,901 156,780 171,414 9.3% -13.7% Uzbekistan 147,827 146,250 138,377 153,750 11.1% 4.0% New Zealand 103,610 80,433 112,008 116,334 3.9% 12.3% Kazakhstan 65,882 82,993 106,304 97,169 -8.6% 47.5% Kuwait 98,454 72,648 83,460 93,465 12.0% -5.1% Africa 883,120 665,099 833,233 790,083 -5.2% -10.5% South Africa 355,378 246,541 304,340 363,696 19.5% 2.3% Other Countries/Regions 251,945 133,720 159,537 149,265 -6.4% -40.8% Morocco 148,354 117,046 154,284 143,265 -7.1% -3.4% Egypt 127,443 167,792 215,072 133,857 -37.8% 5.0% All Countries/Regions 64,033,463 53,915,928 56,437,803 57,485,378 1.9% -10.2%
Table 2. Registrations or Sales of New Vehicles – Passenger Car (Unit: Vehicle)
27,210,734 24,871,638 26,317,394 24,143,155 23,500,000 24,000,000 24,500,000 25,000,000 25,500,000 26,000,000 26,500,000 27,000,000 27,500,000 2019 2020 2021 2022 (Unit: Vehicle) Year
Fig. 3. Commercial Car Global Sales
Industry Focus 131 China Fastener World no.68/2023 惠達雜誌
Regions/Countries Q1-Q4 2019 Q1-Q4 2020 Q1-Q4 2021 Q1-Q4 2022 2022/2021 2022/ 2019 EUROPE 2,981,609 2,537,257 2,866,401 2,442,633 -14.8% -18.1% EU 27 Countries + EFTA + UK 2,636,513 2,126,093 2,362,734 2,006,157 -15.1% -23.9% France 541,448 449,912 483,279 397,519 -17.7% -26.6% United Kingdom 425,419 333,596 401,824 329,509 -18.0% -22.5% Germany 409,801 349,081 351,187 312,391 -11.0% -23.8% Italy 215,681 183,003 211,825 189,059 -10.7% -12.3% Spain 242,993 179,570 174,587 145,439 -16.7% -40.1% Poland 100,660 81,806 107,972 98,299 -9.0% -2.3% Netherlands 92,683 71,564 80,500 72,849 -9.5% -21.4% Belgium 91,992 78,503 80,688 65,261 -19.1% -29.1% Other Countries 47,009 33,285 42,534 42,770 0.6% -9.0% Sweden 62,442 38,191 42,874 41,781 -2.5% -33.1% Norway 47,341 39,473 41,188 35,678 -13.4% -24.6% Denmark 38,663 35,109 36,592 32,723 -10.6% -15.4% Austria 51,553 43,896 66,373 29,644 -55.3% -42.5% Portugal 44,028 31,575 33,650 29,063 -13.6% -34.0% Switzerland 42,918 32,563 33,606 28,878 -14.1% -32.7% Czech Republic 31,508 25,863 29,345 27,111 -7.6% -14.0% Ireland 27,995 23,798 31,457 26,147 -16.9% -6.6% Hungary 32,184 25,947 28,467 24,048 -15.5% -25.3% Romania 29,328 21,381 25,583 24,028 -6.1% -18.1% Finland 19,317 16,558 16,810 14,948 -11.1% -22.6% Slovakia 12,295 8,604 11,649 11,233 -3.6% -8.6% Greece 8,764 7,733 11,448 10,601 -7.4% 21.0% Slovenia 13,636 9,477 11,710 9,585 -18.1% -29.7% Bulgaria 9,606 7,295 9,935 8,811 -11.3% -8.3% Croatia 10,885 7,787 9,361 8,367 -10.6% -23.1% Russia, Turkey & Other Europe 345,096 411,164 503,667 436,476 -13.3% 26.5% Turkey 104,691 186,041 210,997 234,503 11.1% 124.0% Russia 211,098 197,207 258,521 178,681 -30.9% -15.4% Other Countries/Regions 15,202 14,380 14,567 14,454 -0.8% -4.9% Ukraine 14,105 13,536 18,510 7,770 -58.0% -44.9% America 15,774,661 13,953,878 14,991,703 14,337,522 -4.4% -9.1% USMCA (Former NAFTA) 14,844,253 13,192,459 13,969,380 13,323,711 -4.6% -10.2% USA 12,768,444 11,479,518 12,058,515 11,371,749 -5.7% -10.9% Canada 1,479,594 1,267,724 1,384,245 1,304,482 -5.8% -11.8% Mexico 596,215 445,217 526,620 647,480 23.0% 8.6% Central & South America 930,408 761,419 1,022,323 1,013,811 -0.8% 9.0% Brazil 525,777 442,495 561,384 527,795 -6.0% 0.4% Argentina 118,974 102,183 140,748 146,732 4.3% 23.3% Chile 87,892 64,707 111,537 113,192 1.5% 28.8% Other Countries/Regions 88,426 67,245 95,825 109,731 14.5% 24.1% Peru 40,266 27,503 41,420 43,180 4.2% 7.2% Colombia 28,125 21,391 28,579 29,089 1.8% 3.4% Ecuador 21,625 16,441 22,967 25,981 13.1% 20.1% Puerto Rico 19,323 19,454 19,863 18,111 -8.8% -6.3%
Table 3. Registrations or Sales of New Vehicles – Commercial Car (Unit: Vehicle)
Past and Future

On the whole, global vehicle sales have been hit hard in the past four years, and the rebound was still weak as of last year. Europe was hit the hardest, and sales volume declined the most. It is worth noting that Asia Pacific has also been hit, but is still showing good resilience, with most countries in this region still experiencing growth.
Several market research companies predict that global auto sales this year are expected to have minor growth despite the concerns that still lingers. What is certain is that India, emerging as the next world factory, had a significant double-digit growth last year regardless of vehicle type; and therefore, India's car sales momentum this year is very promising.
Industry Focus 132 China Fastener World no.68/2023 惠達雜誌
Regions/Countries Q1-Q4 2019 Q1-Q4 2020 Q1-Q4 2021 Q1-Q4 2022 2022/2021 2022/ 2019 Asia/Oceania/Middle East 8,137,293 8,119,894 8,159,003 7,062,421 -13.4% -13.2% China 4,324,840 5,133,338 4,795,939 3,300,458 -31.2% -23.7% ASEAN 1,078,852 806,874 904,503 1,037,350 14.7% -3.8% India 854,743 505,102 677,119 933,116 37.8% 9.2% Japan 894,125 788,634 772,642 753,023 -2.5% -15.8% Thailand 538,914 448,652 436,380 506,039 16.0% -6.1% Australia 263,604 240,164 296,575 303,741 2.4% 15.2% Indonesia 244,947 143,152 227,396 264,477 16.3% 8.0% South Korea 298,099 287,639 265,708 263,171 -1.0% -11.7% Other Countries/Regions 143,620 113,066 125,814 133,602 6.2% -7.0% Philippines 151,851 90,345 106,092 132,967 25.3% -12.4% Saudi Arabia 73,531 64,835 80,722 97,006 20.2% 31.9% Malaysia 54,105 48,469 56,248 62,162 10.5% 14.9% Uzbekistan 49,276 48,750 46,123 51,395 11.4% 4.3% New Zealand 45,683 35,002 53,279 48,479 -9.0% 6.1% Vietnam 47,480 45,630 53,157 46,928 -11.7% -1.2% Taiwan 45,001 35,533 40,000 39,354 -1.6% -12.5% Pakistan 25,025 20,042 38,503 39,074 1.5% 56.1% United Arab Emirates 33,785 28,810 32,064 36,125 12.7% 6.9% Israel 28,549 23,883 31,249 30,293 -3.1% 6.1% Kuwait 14,179 12,639 16,697 16,653 -0.3% 17.4% Kazakhstan 5,936 6,209 7,296 4,358 -40.3% -26.6% Africa 317,171 260,609 300,287 300,579 0.1% -5.2% South Africa 177,520 126,092 146,334 165,866 13.3% -6.6% Other Countries/Regions 78,964 66,315 70,069 75,301 7.5% -4.6% Egypt 43,125 51,940 62,733 41,268 -34.2% -4.3% Morocco 17,562 16,262 21,151 18,144 -14.2% 3.3% All Countries/Regions 27,210,734 24,871,638 26,317,394 24,143,155 -8.3% -11.3%
Table 3. Registrations or Sales of New Vehicles – Commercial Car (Unit: Vehicle)

China Fastener World no.68/2023 133
Questions about THREAD GAGING
螺紋量測問與答
Iwasreviewing the Socket Cap Screw standard ASME B18.3 and came across the note, “For plated or unplated screws, acceptability shall be based upon System 22, ASME B1.3”- what does it mean that we should accept the threads to System 22?
A: Hopefully this does not get too complicated. ASME B1.1 and 1.13M define and describe the dimensions and form of inch and metric screw threads. Essentially, both internal and external threads can be completely defined by 10 different characteristics. ASME B1.2 provides guidance regarding the appropriate gages to verify those characteristics. Finally, ASME B1.3 is the ASME standard that describes the gaging systems that can be used to accept inch and metric threads types UN, UNR,UNJ,M, and MJ. All these standards work together to provide a cohesive set of instructions on what one must do to properly make and then gage (or verify) the threads they just made.
Understanding that these documents work together, let’s go back to the question, “what is System 22”? ASME B1.3 defines different approaches that one can take to verify thread quality. Now remember, there are ten different characteristics we could check. Doing so is possible but usually not feasible, as it takes a lot of time and access to some special, often quite costly, gages. Additionally, not every characteristic is usually necessary to be evaluated, but only those characteristics that are most important to the end use. So, the authors of ASME B1.3 developed three (3) different approaches that can be taken to verify a thread depending on how critical the thread quality is to the application and how deeply one wants to look at it. The three different approaches are identified as “systems”: System 21, System 22, and System 23.
System 21 is easily the most common thread gaging practice employed worldwide. It is simple and quick, which makes it particularly attractive to high volume fastener manufacturing. System 21 is defined as “providing interchangeable assembly with functional size inspection/evaluation at the maximum material limit within the length of standard gauging elements, and also inspection/evaluation of characteristics identified as NOT GO functional diameters.” That is a mouthful and probably confusing to some readers, so let’s unpack it. As the standard says the selection of the gaging is a function of the characteristics important to end use. In this case, it describes a method that evaluates whether the thread should assemble when applied in the field. For this, the method essentially defines the use of attribute gages. These are commonly referred to as GO/ NOT GO gages and simply verify that the characteristic falls within the acceptable specified zone. So, for System 21, external threads are
evaluated with a GO gage for maximum material, NOT GO gage for Functional Diameter, and a caliper or micrometer for Major Diameter. Internal threads are evaluated with a GO gage for maximum material, NOT GO gage for Functional Diameter, and usually a GO/ NOT GO unthreaded pin gage for the Minor Diameter.
System 22 is generally employed when more precision is desired in evaluating the thread. It adds a variable evaluation of the Pitch Diameter. Therefore, to evaluate an external thread, one checks the Pitch Diameter, Functional Diameter, and Major Diameter. This would typically be accomplished with some combination of Indicating gage for Pitch Diameter, indicating gage or NOT GO ring gage for the Functional Diameter, and caliper or micrometer for the Major Diameter. Internal threads are a similar story with evaluation by an indicating gage for the Pitch Diameter, indicating or NOT GO gage for the Functional Diameter, and usually a GO/NOT GO unthreaded pin gage for the Minor Diameter.
System 23 requires evaluation of all characteristics. Since this is such a monumental task, this system is intended to only be employed for experimentation or, perhaps, validation.
IfI don’t have an indicating gage can I just use an attribute gage to validate the Pitch Diameter for System 22?
A: No, as explained above, System 22 requires a variable measurement for the Pitch Diameter over the length of one full thread. This is not possible with either a threaded ring gage or threaded plug gage. If you did not have an indicating gage you could investigate ASME B1.2 for other acceptable gage methods such as measuring over pins. However, other methods may be much more time consuming to execute.
What are the proper gages to use for evaluating a plated Class 2A externally threaded part?
A: Without going into great detail, “Class 2” tells us the intended fit for the part. Class 2 is the most common fit class for inch externally threaded fasteners and contains what is known as the “Accommodation”. This means that before

134 China Fastener World no.68/2023 Technology 惠達雜誌
Thread gaging is one of those subjects that is often misunderstood and misapplied. Following are some common questions and answers related to this subject.

plating the maximum Pitch Diameter tolerance does not come all the way to the Basic Pitch Diameter for whatever size part is being evaluated. This is intentional and, if properly executed, allows the manufacturer to lay down a layer of plating or coating without exceeding the Basic Pitch Diameter. However, the plating or coating does increase the Pitch Diameter so that the GO gage for before plating is no longer valid after plating. As such, when evaluating Class 2A parts to System 21, the proper gaging method is to evaluate using a GO and NOT GO 2A ring gage for before plated parts and a 3A GO ring gage and 2A NOT GO ring gage for after plated parts. Interestingly, several years ago, the former Technical Director of the IFI and fastener expert, Joe Greenslade, shared with me that misunderstanding of this transition between proper gages was the most frequently asked technical question that he had to routinely field.
How far do you have to engage the threaded GO gage?
A: ASME B1.2 instructs that for externally threaded product the GO ring gage must pass over the “entire length of the threaded portion” and that for internally threaded product the GO threaded plug gage must “pass through the full threaded length of the product.”
The standard says that the gages must “freely” pass over or through the length of the part.
What does “freely” mean?
A: This is one of those areas that the standards sort of let us down, for how does one really interpret “freely”? In other words, one person might accept some degree of resistance in the gage as “freely” as long as it is still turning while another person might interpret any resistance as not “freely” turning. I believe this is one of those instances where you must use some common sense. On one hand, the standard does not say “free spinning” which suggests no resistance, while on the other hand, clearly if you have to use all of your might and your face is turning red trying to get the gage to advance, it is not freely turning. But there is probably some middle ground where feeling a little resistance while the gage is still freely advancing is acceptable. If in doubt, perhaps engaging a third party or simply having the conversation with your customer will resolve the issue.
What if I have nicks on the external threads that are preventing
the GO Ring Gage from freely advancing?
A: This is a common problem and one recognized throughout the industry. As a result the standards
organizations have either issued standards specific to this problem or included this in a section of a quality standard allowing the evaluator to apply a low level of torque to the gage. There are specified torque values that follow a defined equation for each diameter size. If the obstruction is a nick, the torque will be enough to advance the gage past it but not enough to compromise the subsequent installation behavior of the screw. Standards that address this issue include ISO 6157-3, Din 276 Part 19, IFI 166/566, and ASTM F788/788M.
What is the rule for using the NOT GO gage?
A:
As the name suggests a NOT GO gage is not supposed to advance through a part. ASME B1.2 instructs that the NOT GO ring gage or threaded plug gage is supposed to advance no more than three full rotations. Anything past that is considered a failure.
What is the difference between W and X tolerances?
A: W tolerances represent the highest grade of accuracy and workmanship and are intended for setting gages. X tolerances are larger than W tolerances and are intended for product inspection gages. Unless the specification or customer specifies things differently, all thread gages that directly check parts use the X tolerance scheme.
How often should we be calibrating Ring Gages?
A: There is no single definitive answer to this question. Calibration frequency is usually a function of a number of variables including how much a gage is used, the environment it is used in, and how prone it is to “wander” from calibration. Some gages are calibrated as frequently as every day while others may go every year or two. If the ring gage is used a lot, a prudent calibration period may be every six months while gages used less frequently can probably be on an annual cycle. Remember that regardless of the specified calibration frequency there are times that warrant immediate attention. Any time a gage is dropped or damaged it should be evaluated to determine if it needs recalibration. Likewise, if there is any question about whether it is working properly, it should be evaluated and recalibrated if necessary.
Is it difficult to calibrate a ring gage?
A: Many organizations choose to send their gages out for calibration to a third-party expert that specializes in gage calibration. Their rational is often that it is simpler to let the experts do it and to not have to stock all the setting plugs. However, other organizations choose to do this in-house and train individuals to become specialists. IFI-301 goes through the procedure for calibrating threaded ring gages.
If my acceptable gage method passes a part and my customer’s accepted gage method fails the part- should the parts be rejected?
A: According to ASME B1.2 if one party uses a gage and method that are acceptable under ASME B1.2 and ASME B1.3 and finds the part acceptable and a second party, also using an acceptable gage and method, find the part unacceptable- the parts are to be accepted.
In conclusion, thread gaging is one of those areas that is often confusing to individuals. Individuals tasked with executing and defending evaluations should become familiar with the thread gaging standards, such as ASME B1.2 and 1.3. These standards are a wealth of information and address the issues covered in the questions above and more.
136 China Fastener World no.68/2023 Technology 惠達雜誌
Article by Laurence Claus/Copyright owned by Fastener World 著作權所有:惠達雜誌


