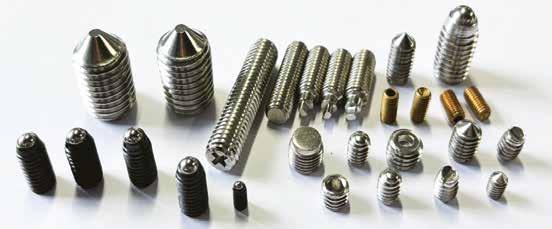


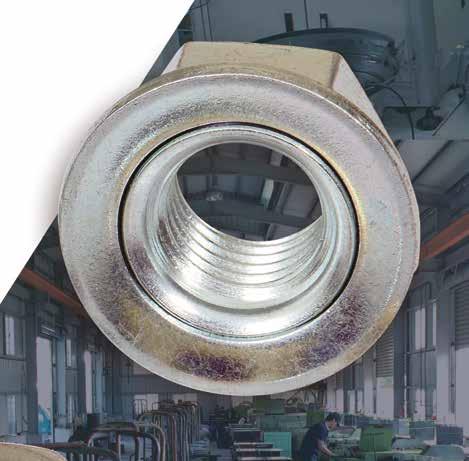
世鎧雙熱水泥螺紋錨栓
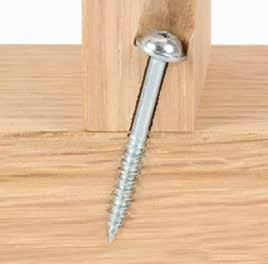
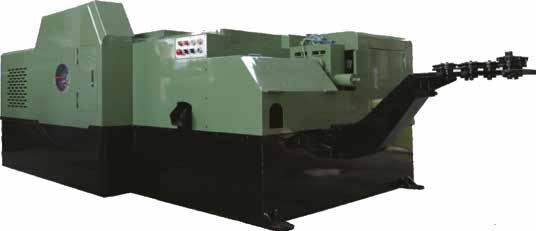
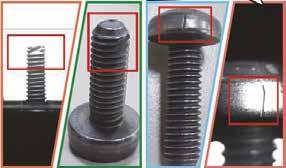
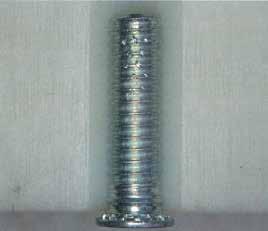
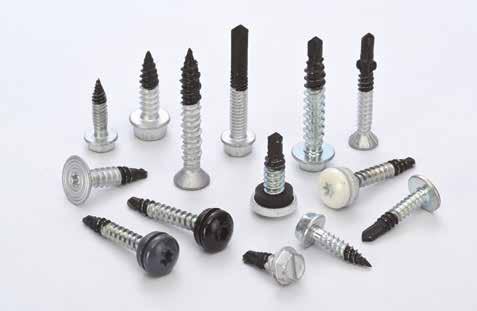
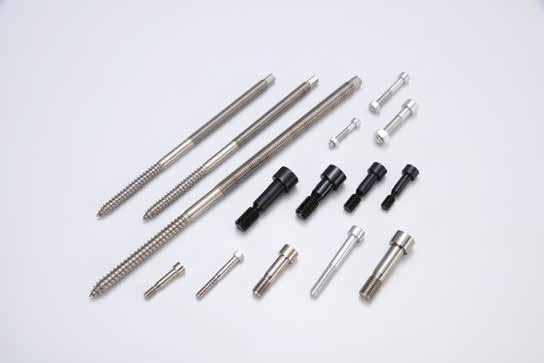
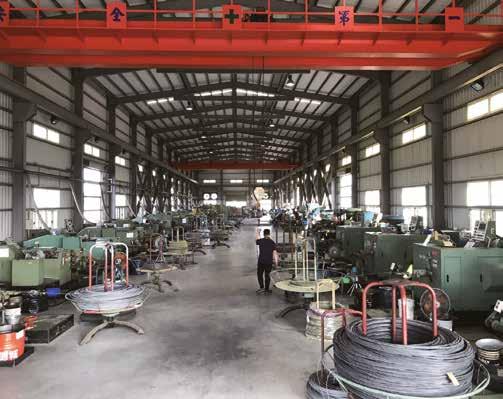
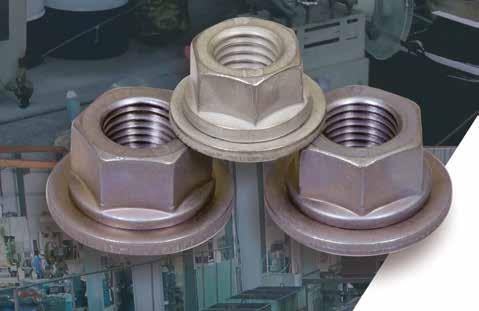
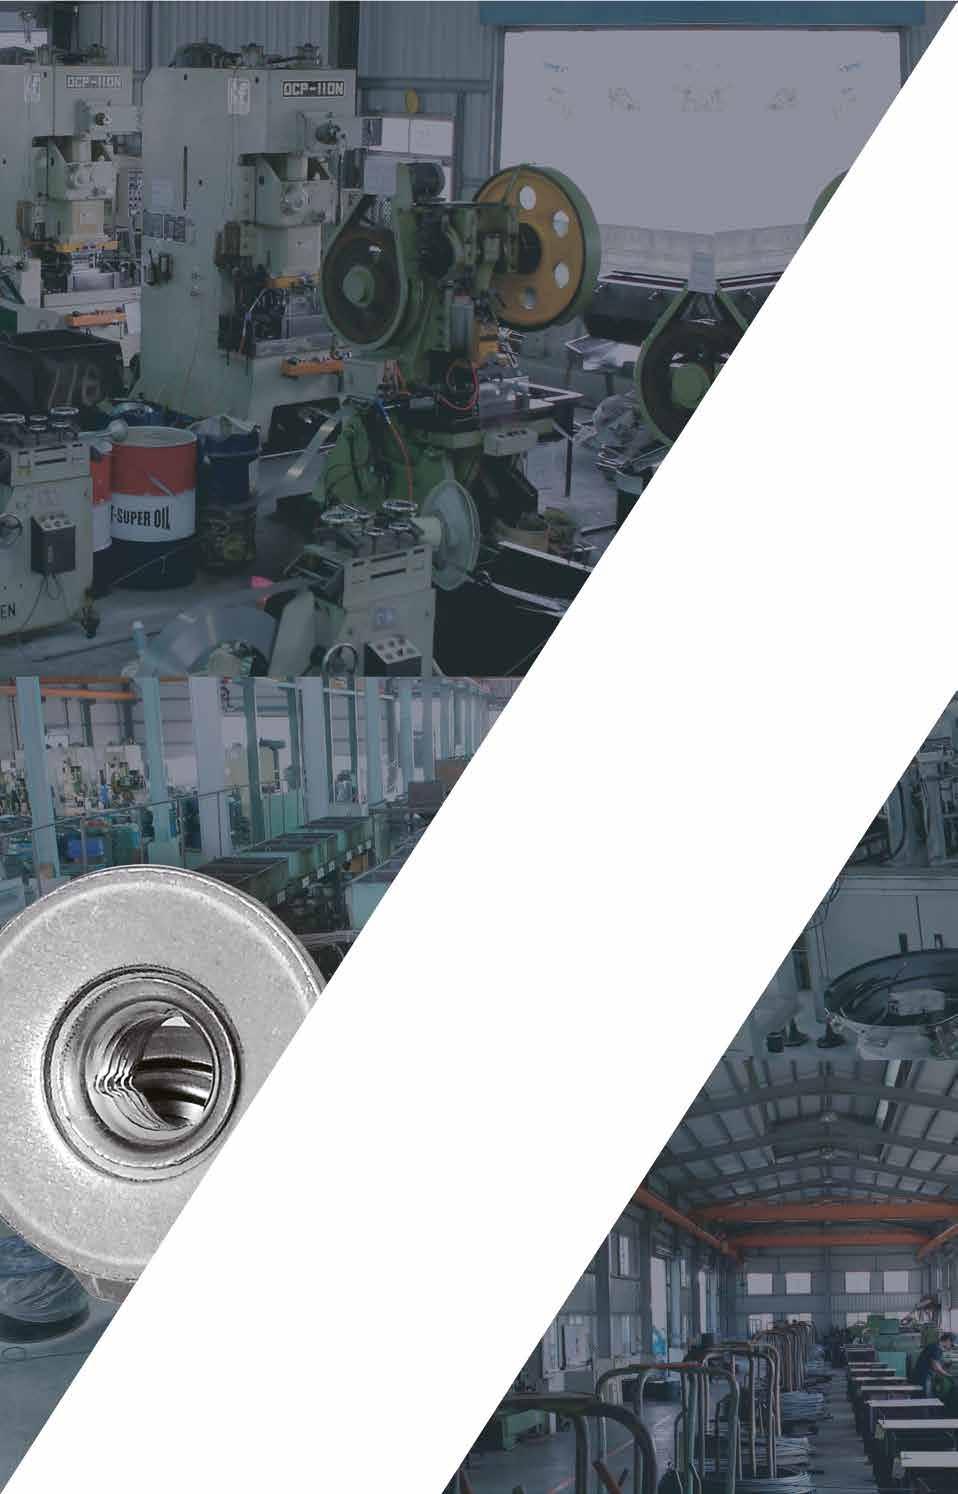
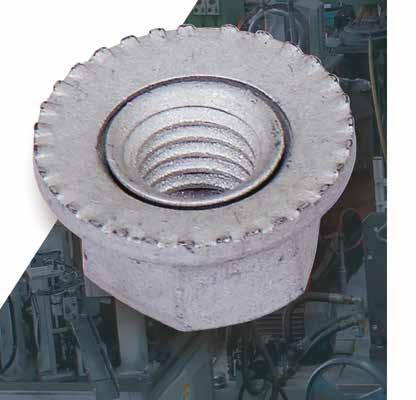
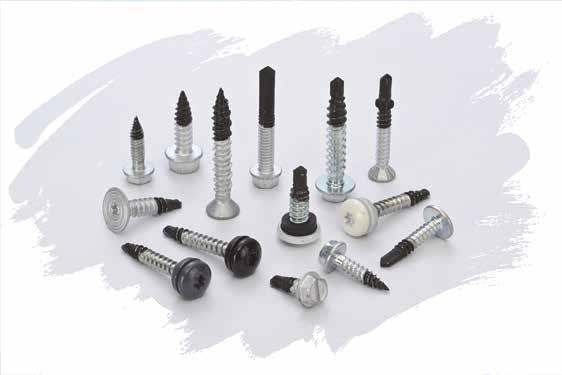
started out with premium bi-metal screws and bi-metal anchors, and then branched out to concrete fastening. It has successively developed large carbon steel concrete anchors and bi-metal stainless steel anchors, as well as the exclusive double heat treatment technology to precisely handle hardness distribution and increase product safety and service life. Now it is announcing that the double heat-treated cement threaded anchors have passed ICC certification. These anchors come with hole-drilling diameters ranging from 1/4" to 3/4", covering all common sizes on the market.
1. High strength: fixed firmly in cement and other hard materials.
2. Easy to install: only needs to use one screwdriver or electric screwdriver in most cases.
3. High tensile strength: withstands external tensile and maintains a stable connection.
4. High seismic performance: remains stable under earthquakes or other vibrations.
5. Versatility: Shallow to deep embedment options to cope with various applications such as fastening building structures, mechanical equipment, pipelines, etc.
6. Reliability: provides reliable fixation. Hard to loosen or fail.
7. Adaptability: Suitable for cement edge and close-range installation.
8. Removability: This product is completely removable.
The double heat-treated cement threaded anchors have made it into the North American market. They are also purchased by many customers in Central and South America. According to customer comments, this product helps save a lot of manpower during installation. Furthermore, the ICC certificate helps Sheh Kai eliminate competition from low-end products and improve the company's market competitiveness.
Cement Bolts
Sheh Kai has completed the ETA C1 seismic test and started writing an evaluation report. Soon, the company will pass this certification. ETA certification already includes seismic tests but these are simulated using non-cracking cement and do not provide safety data for installation to cracked cement. The C1 grade seismic test comes into play to evaluate product safety data when there is a 0.5mm crack. Getting verified by this test will expand product applicability. The company said the reason for applying for the certification is to give customers confidence in the products. Providing certified data allows architects to design buildings based on proof, ensure safety and avoid risks of users’ misuse.
The company has completed the ETA test and assessment report for this product, along with the audit completed in March 2024. The report is on its way to the certification authorities of EU member states for approval. The certification clearly defines the safety data of existing products and systematically provides the data to architects. This strengthens customer confidence and provides correct data to avoid risks of users’ misuse.
The company revealed it has completed carbon inventory and will apply for certification to verify the inventory data. Currently they use energy-efficient air compressors, improve the insulation performance of building structures, and use more energy-efficient equipment

and machines. Sheh Kai is reducing greenhouse gas emissions and energy consumption in the manufacturing sector by improving manufacturing processes, increasing resource utilization efficiency, and using cleaner manufacturing technologies.
The company observed stock level is still high at European customers' locations, but the customers are slowly coming back to purchase from Taiwan. Sheh Kai is using the void to upgrade its ERP system and equipment, focusing on carbon reduction and carbon inventory of the manufacturing process to make full preparations for future full implementation of CBAM and economic recovery.
Contact: Manager Barry Tsai


引進CNC智能製造走向減碳未來
"CNC
"We fulfill what others can't."
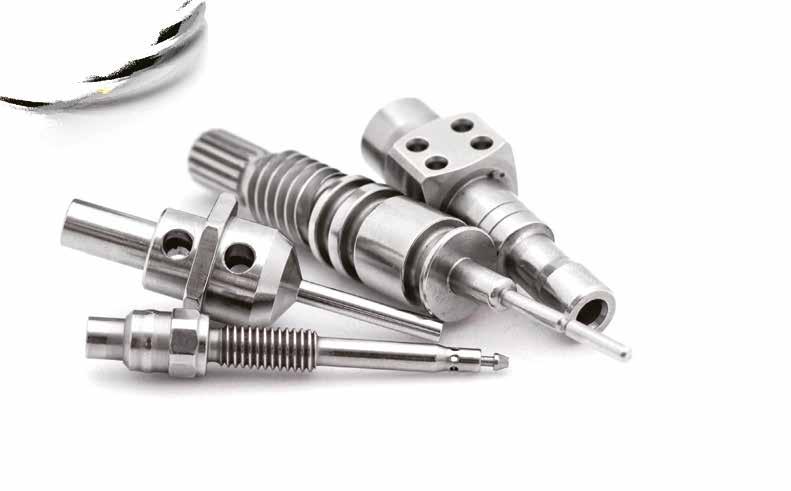
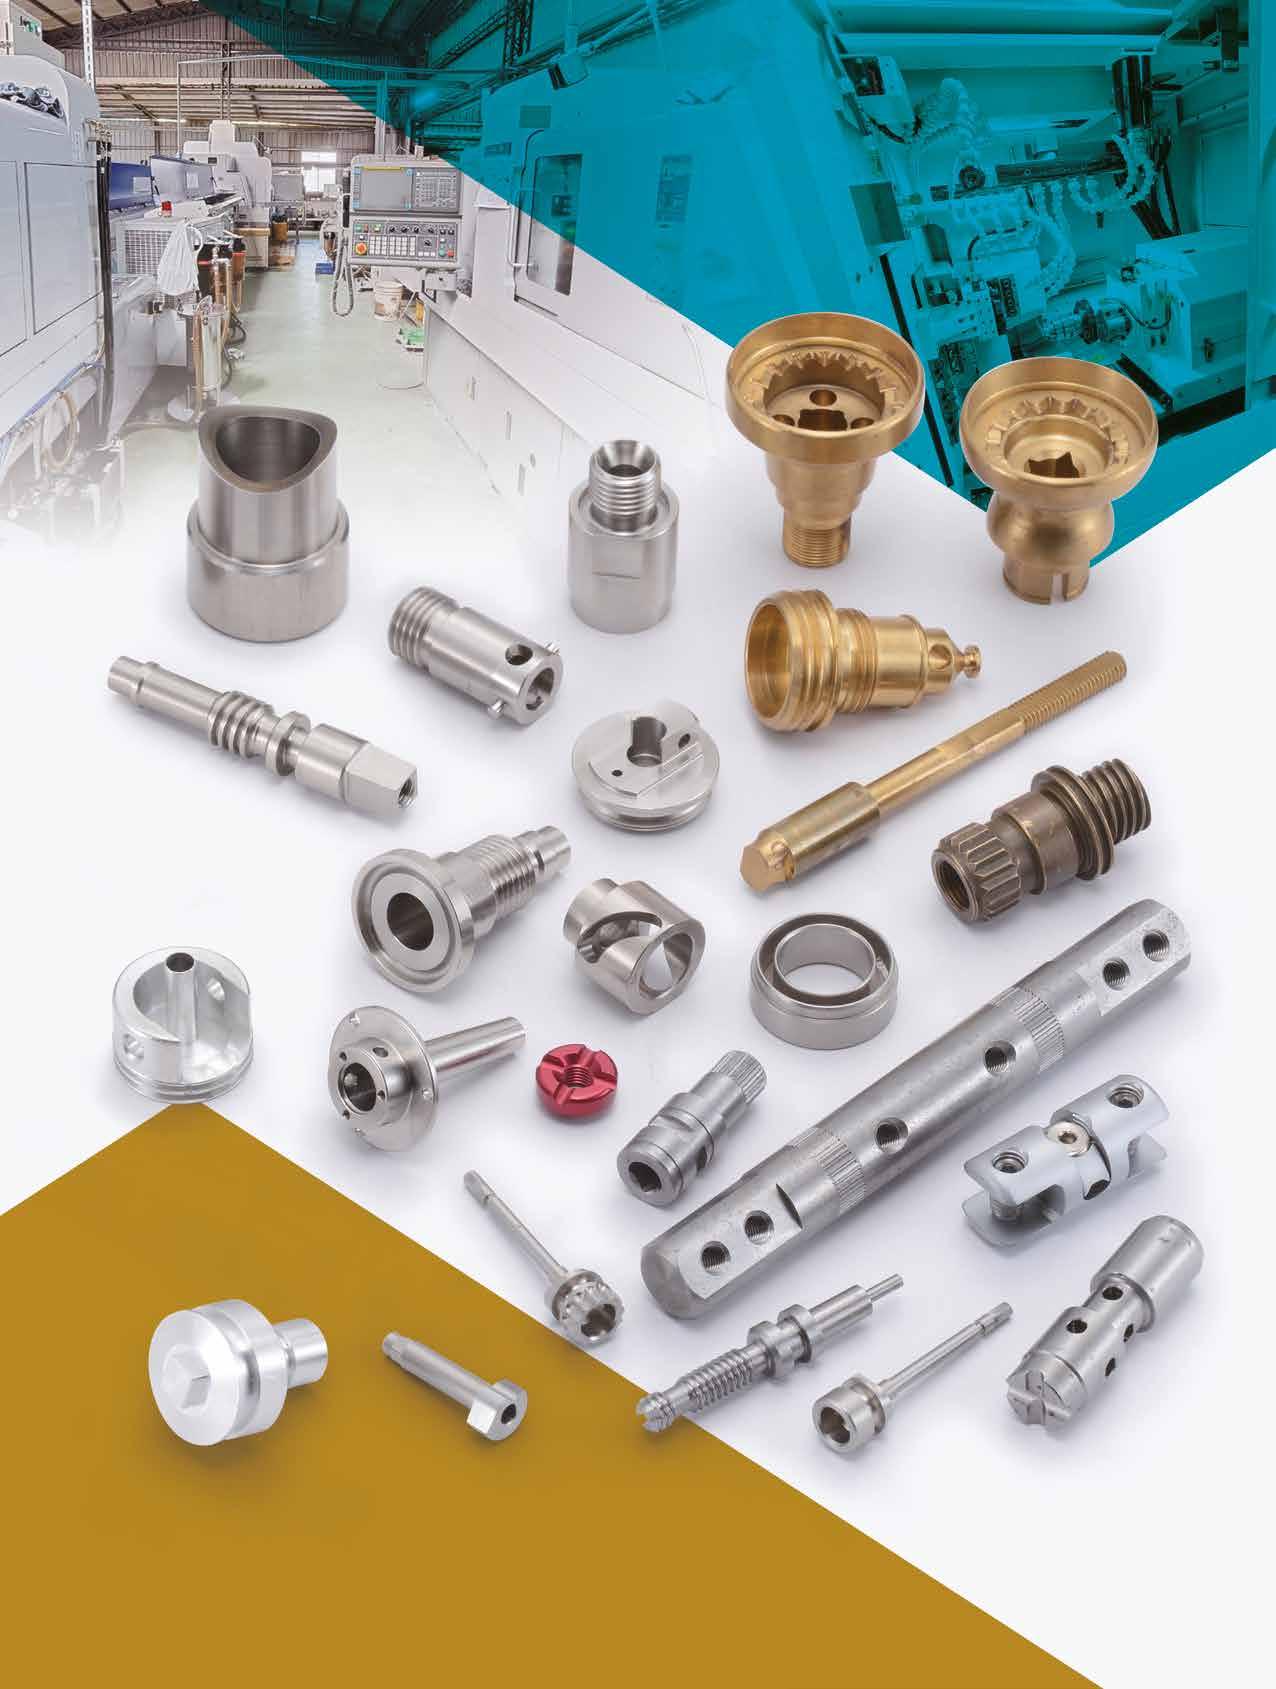
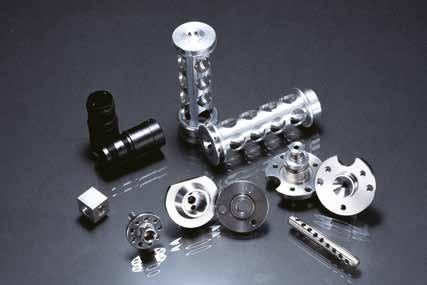
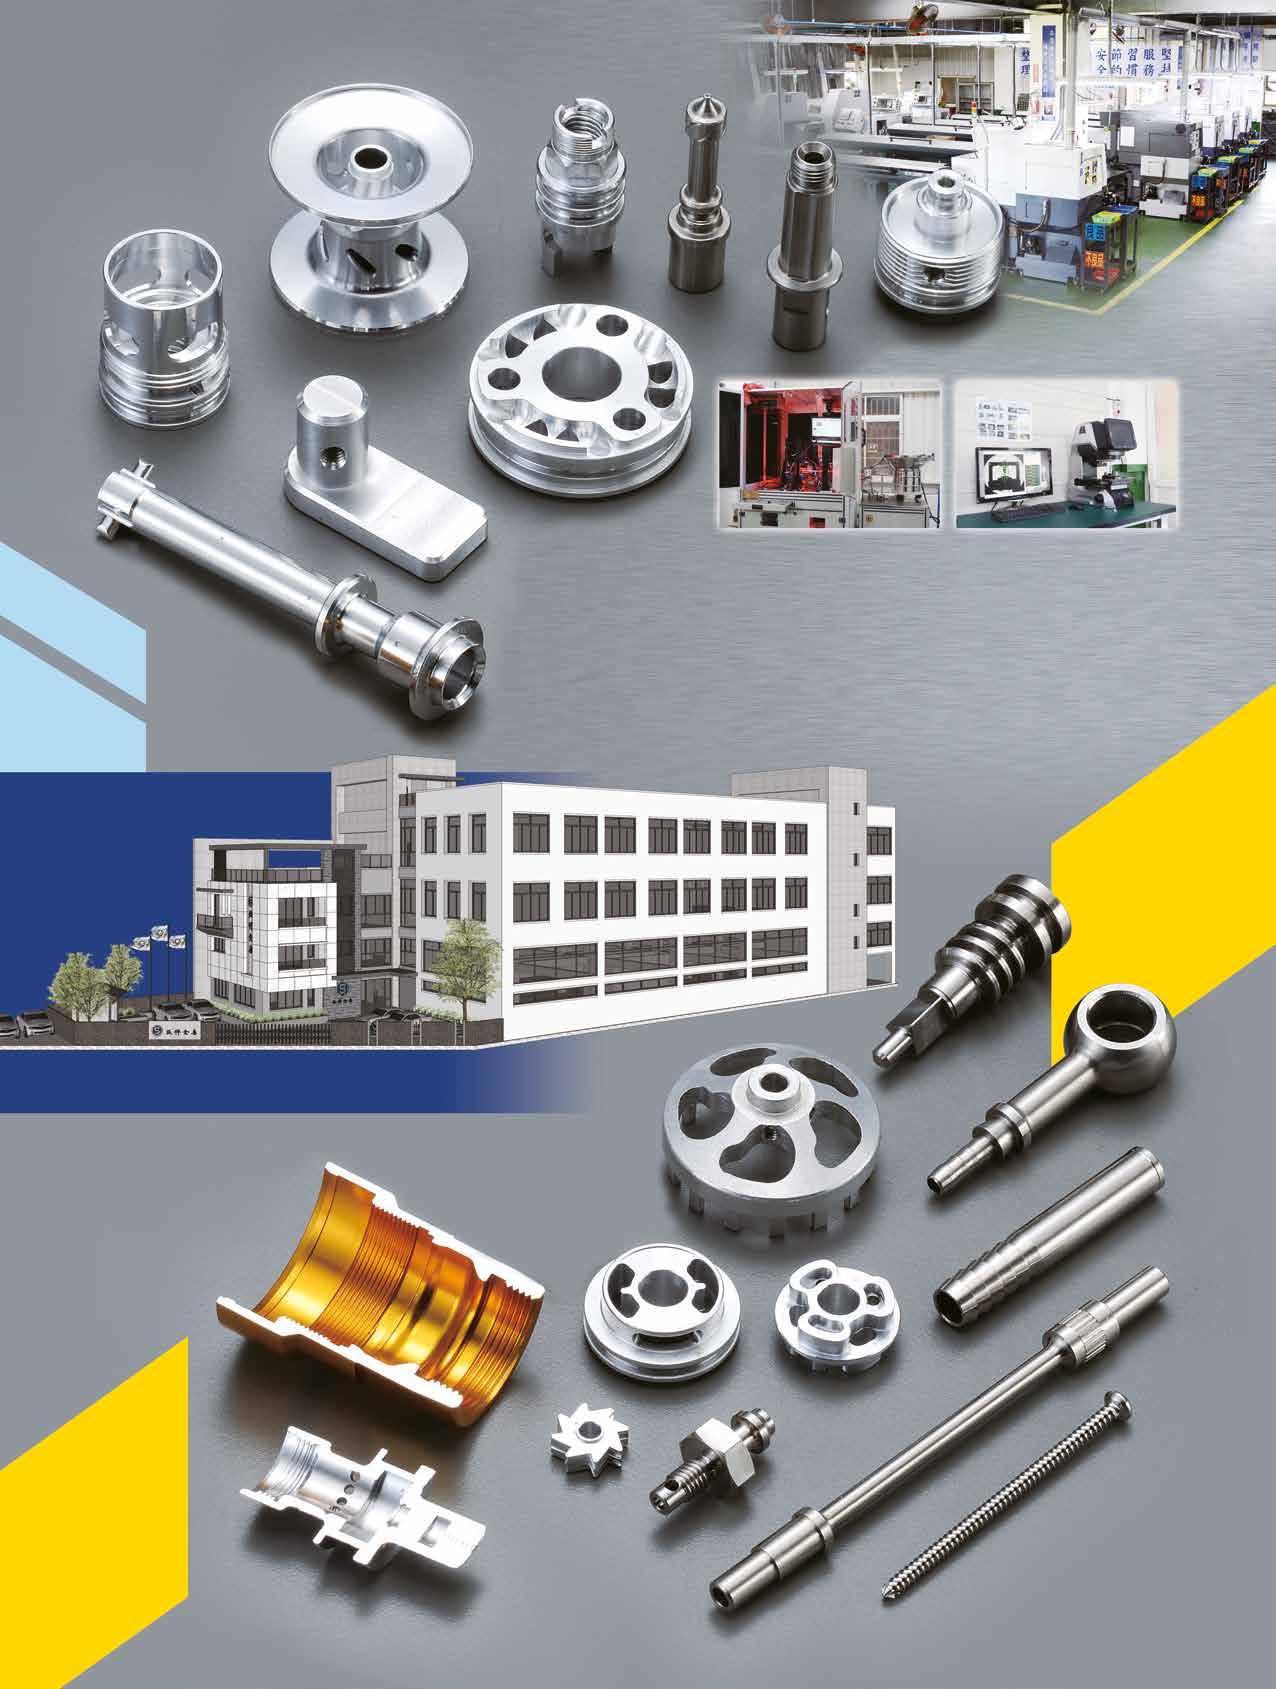
Fast forward back 40 years of corporate history. Iou Good Jyi mainly relied on table lathes and each person was in charge of one machine in the company’s early days. They earned just a meager profit from OEM, and saved every penny from it until it added up to a portion of funds with which they purchased the first automated lathe. The funds kept increasing until there were 10 lathes. That was a time of most intense competition, where they were in an industry in need of high craftsmanship. Everything from cam design to tool grinding and selection were all technical tasks. Back then, most Taiwanese competitors were just focused on processing easy-to-cut materials such as copper, aluminum, and free-cutting steel. In contrast, Iou Good Jyi was dedicated to difficult-tocut materials like alloy steel, tool steel, stainless steel, and titanium alloys that others didn’t want to process, and that is what shaped the company’s manufacturing technique that stands out from the crowd. Now they supply precision hydraulic components as well as automobile, bicycle, optical, aerospace, medical parts and customized special parts. They manage and save costs for clients in the design phase, providing complete solutions on manufacturing methods as well as the most competitive prices.
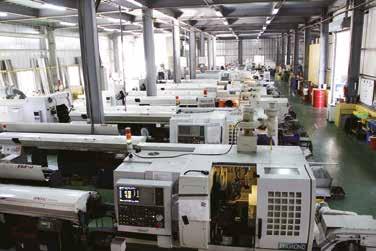
Then came the automation and computerization trends that brought a different change to them. Customers were requiring higher precision which dictated the use of CNC machines. They purchased various machines with different functions, from Swiss Type CNC Lathe models 16, 20, 32 and 42 to CNC Turning Lathe models 25, 42, 52, etc., in order to meet various customers’ needs. Additionally, inspection equipment was added to the line, from horizontal projectors to vertical projectors, CNC 3D image measuring machines, surface roughness testers, roundness gauge, metallographic cutting machines, etc. They also introduced ISO 9001 certification in 2008 and had been widely praised by customers in satisfaction surveys over the years. Their products are sold across the world, such as EU, Japan, the U.S., and the Middle East.
In response to high global awareness of energy conservation and carbon reduction, they have already implemented equipment for recycling and reusing oil, and most of their tools can be reground and reused. They also cooperate with clients to calculate carbon content of the manufacturing process as required in CBAM, and they reduce the carbon footprints from transportation of incoming materials. To contribute to the Earth, they have planted 500 trees since 2000 and continue to plant more.
The company has weathered several economic downturns since the establishment in 1984, each time inspiring their evolution towards better crisis management and preventive measures to ensure zero risk for clients. To efficiently achieve small-volume and diverse production, they introduced a flagship product by DP Technology, a smart manufacturing solution designed for CNC programming, process optimization and physical simulation. Looking ahead, with higher price and lack of materials as well as high personnel costs, the company will continue to transform into a smart green factory to join the future trend of carbon reduction and AI.
Contact: Ms. Lisa Huang
Email: igj.ltd@msa.hinet.net
Copyright owned by Fastener World / Article by Dean Tseng

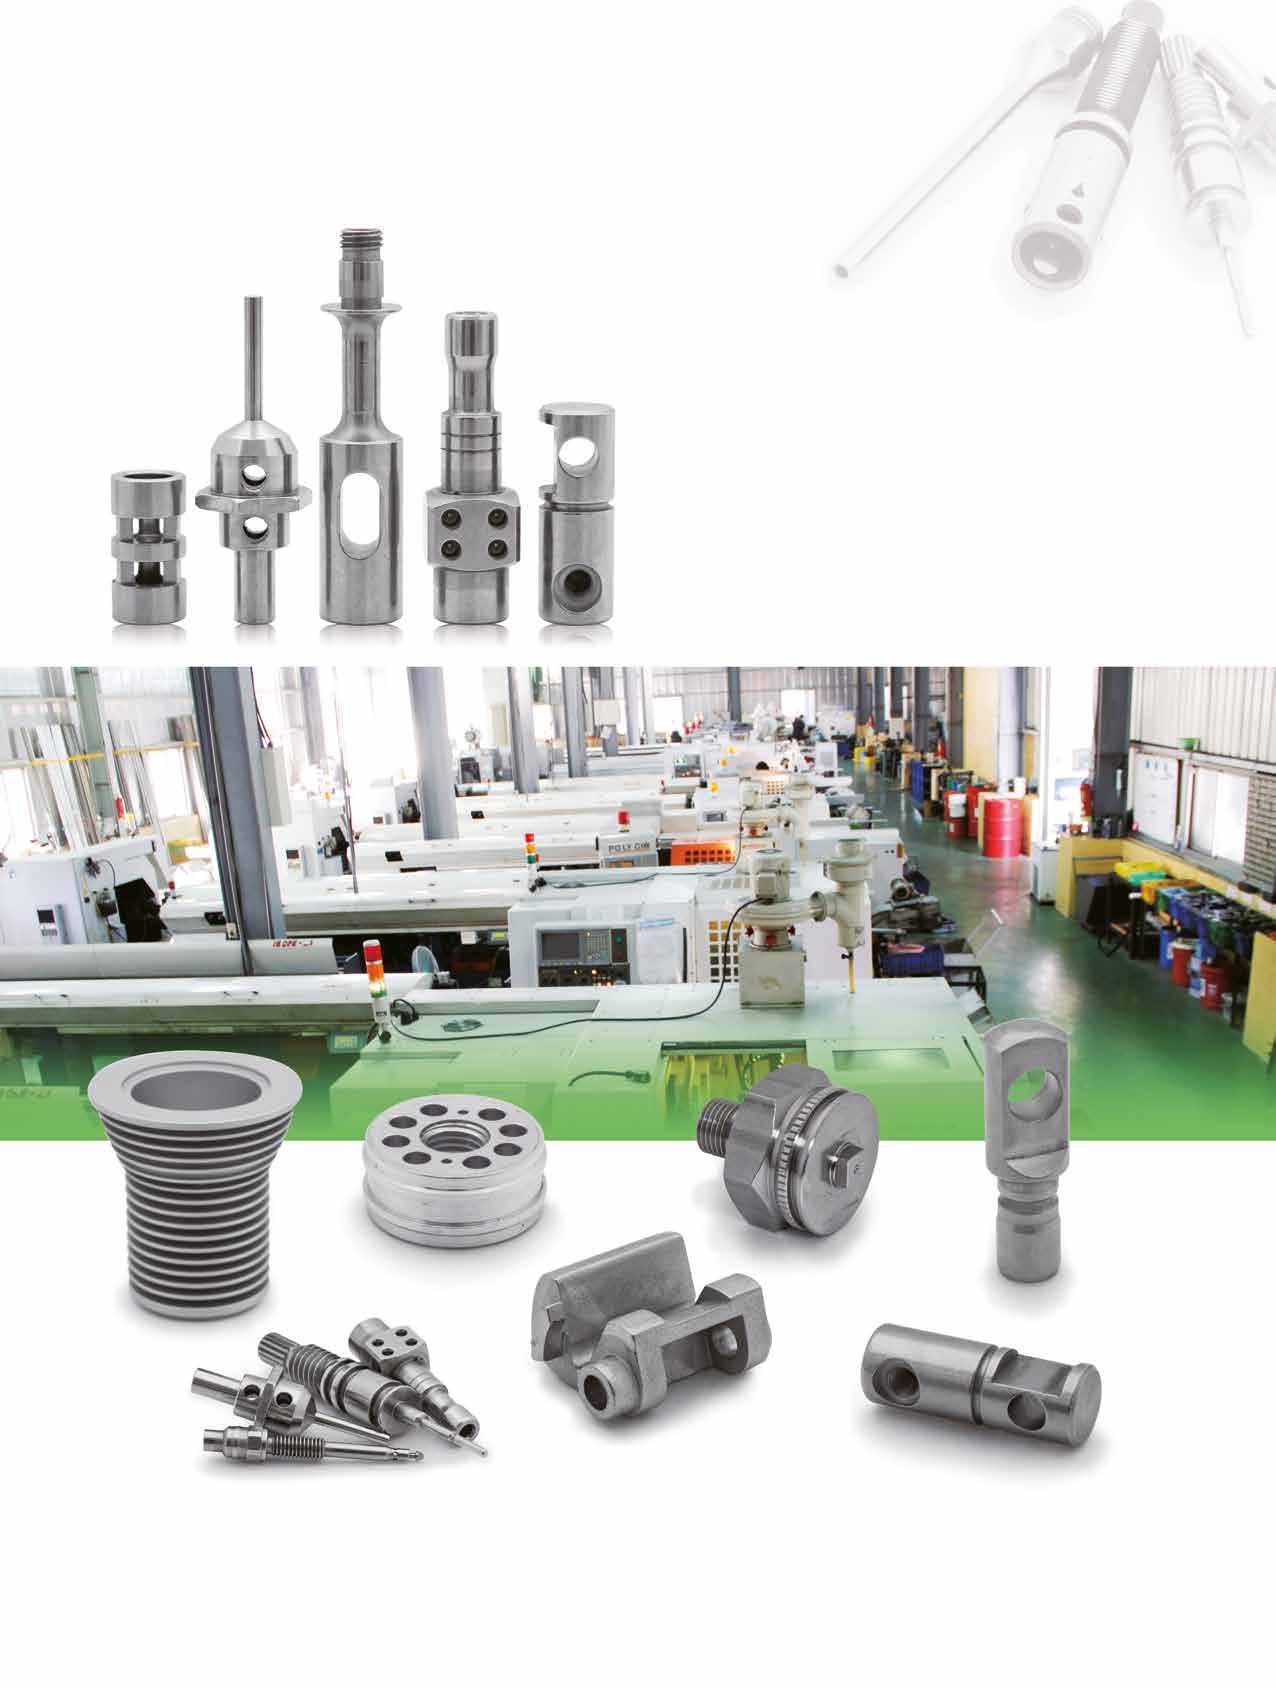




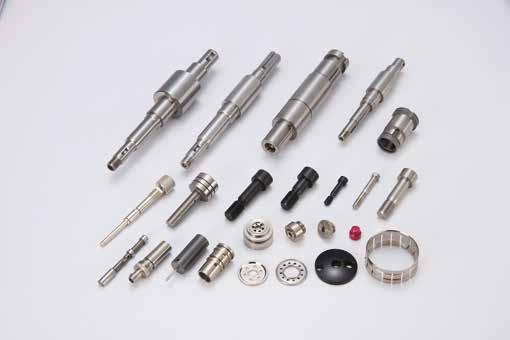
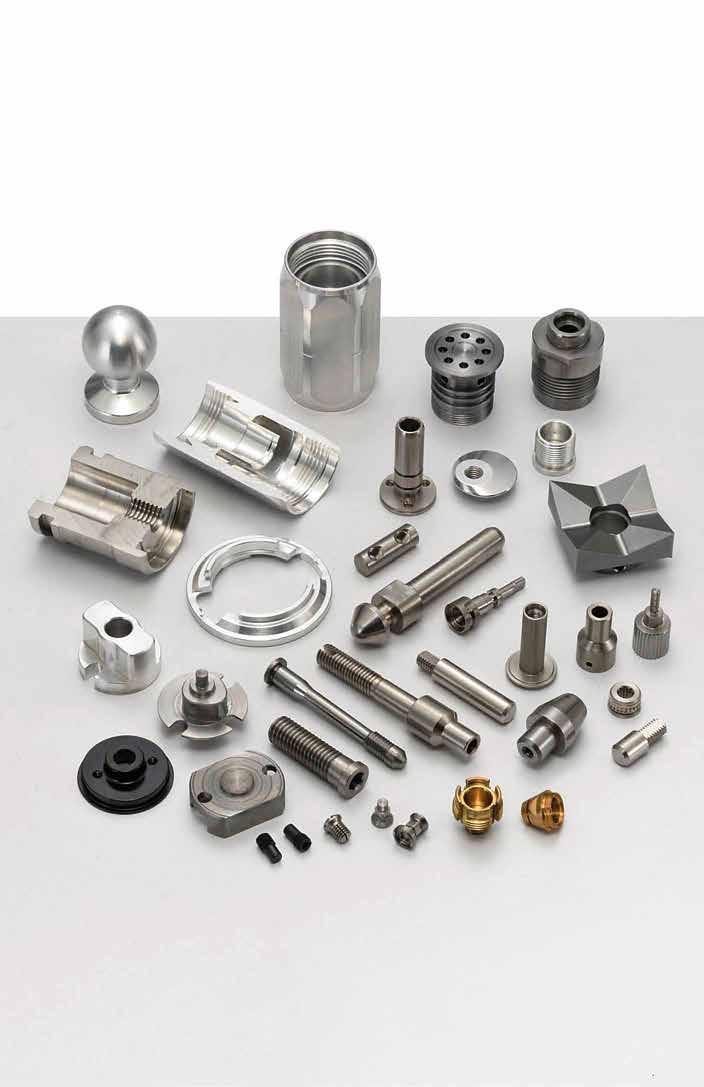
Excellent quality parameters and superior precision performance are the two keys for CNC precision lathe machining companies to gain customers' favor in the industry, which are also the biggest advantages that Kanon Precision Co., Ltd. has been able to stand in the midst of many competitions in the past 30 years. Under the business philosophy of "creating maximum benefits for customers and achieving a win-win situation," Kanon started from developing the domestic market gradually and then moved towards export sales, and simultaneously introduced high-end production equipment and cultivated human resources and technology, thus successfully expanding its market share in the field of CNC precision lathe machining in just a few years. More than two years ago, it even started to focus on the international market in order to provide more customers around the globe having the demand for CNC precision lathe machined products with complete, efficient and reliable one-stop service.
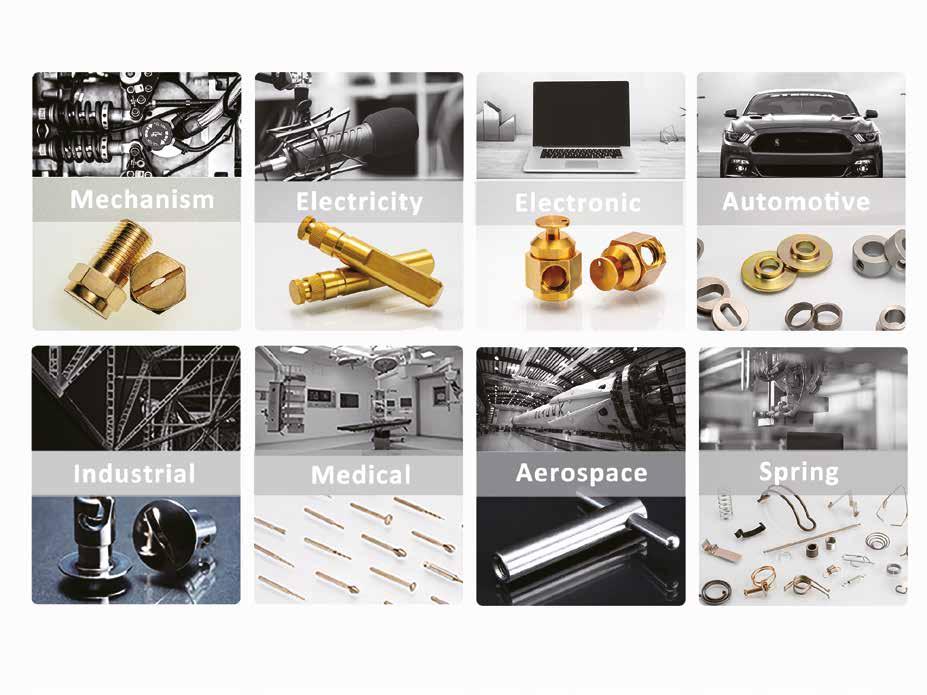
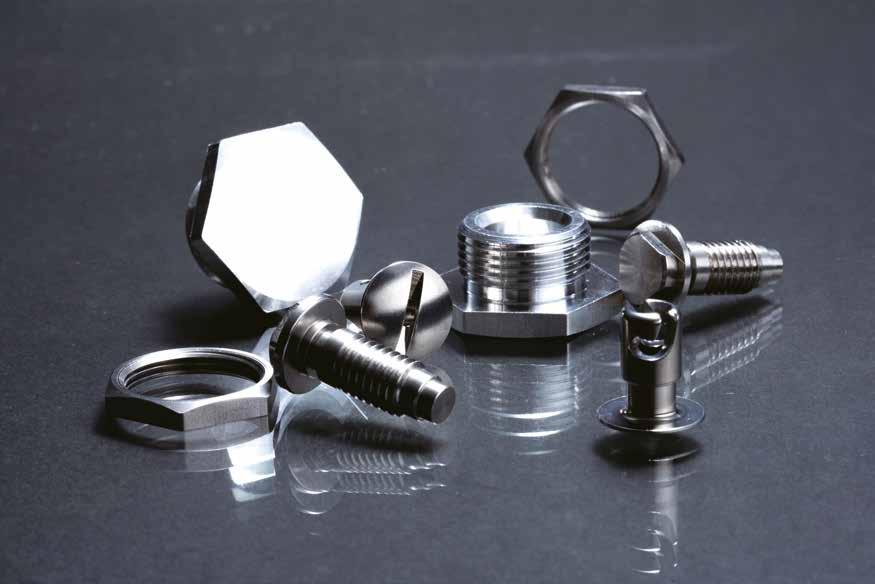
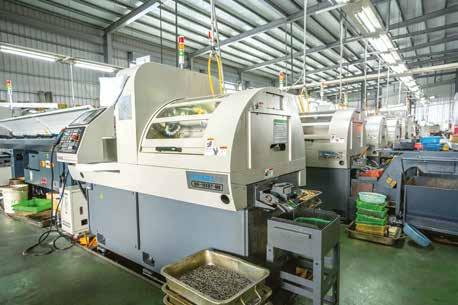
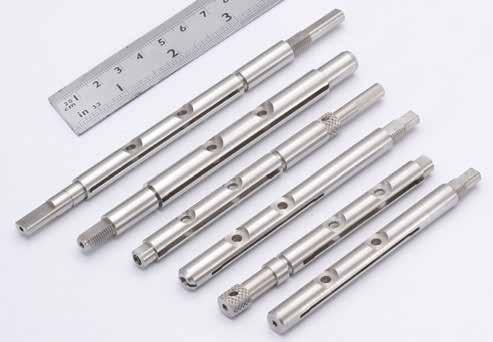
Kanon specializes in the customization of CNC precision lathe machined parts, and many of its customers are from the electronics, medical, mechanical, automotive, and other industrial fields with high requirements for product quality. In addition to installing several CNC sliding/fixed head processing machines to meet different needs, its plant has recently added 6 computerized composite machines and 2 optical sorting machines to improve the process and control the quality, and has also imported Japanese Nomura's full-complex machining equipment, which is capable of completing sophisticated processing like drilling and tapping holes on small-size turning products with precision tolerances. With rich experience, mature technology and advanced equipment, Kanon's precision tolerance can be controlled within +/- 0.005mm. "The introduction of the composite machines allows us to complete the drilling and milling process with a single machine, avoiding the displacement error caused by multiple clamping of workpieces between different machines, and realizing the results of high precision and efficiency," according to Kanon.
With an average monthly capacity of 3 million pieces, Kanon can provide the size ranging from 2mm (min.) to 50mm (max.) and the materials available are turning materials (12L14, 1215), alloy steel (1144, 4140, SCM435, 52100), aluminum (2011, 6061-T6, 6063, 6082), copper alloys (1100, 36000, 3601, 3602, 3603, 3604. 69300), and stainless steel (303, 316, 416, 420 SS).
In order to ensure that the quality of its products meets customers' requirements, Kanon has paid special attention to the APQP process and feasibility assessment, and this year it has arranged internal education and training on the five core tools of PPAP, so that it can do a complete quality management and assessment before accepting orders. Thanks to the focus on communication with customers, Kanon has also succeeded in obtaining many large orders. "We once worked with a customer to develop tooth grinding instruments, and through continuous communication and

discussions, we not only helped to overcome technical difficulties, but also made customers more satisfied with the products, and finally decided to place a large order,” according to Kanon. Recognizing that it is an inevitable trend for factories to go international and communicate directly with customers face to face, Kanon began its transformation to develop the European and American markets from the 2nd half of 2022 in the hope of improving customer service more accurately and efficiently with its 30 years of experience. In 2025, Kanon will also participate in Fastener Fair Global in Germany. In addition to promoting its product technology to increase the company's exposure, the company is also looking forward to cooperating with more customers in developing new products, which will help Kanon win more inquiries and development opportunities. "Please don't hesitate to give us a chance to work with you, we will give you the best quality and service," according to Kanon.
Copyright owned by Fastener World Article by Gang Hao Chang, Vice Editor-in-Chief







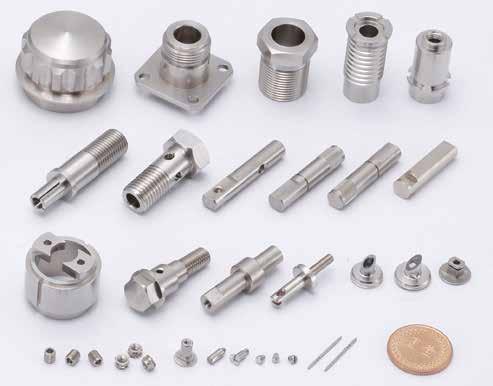
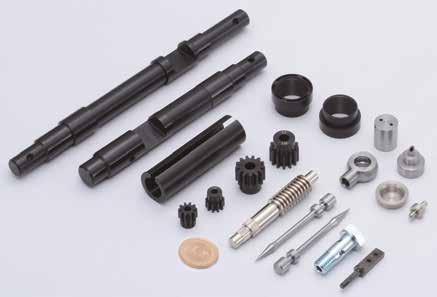

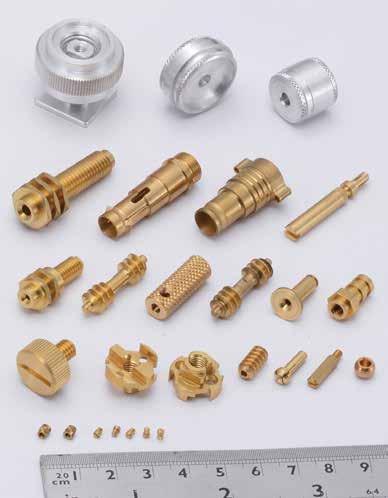


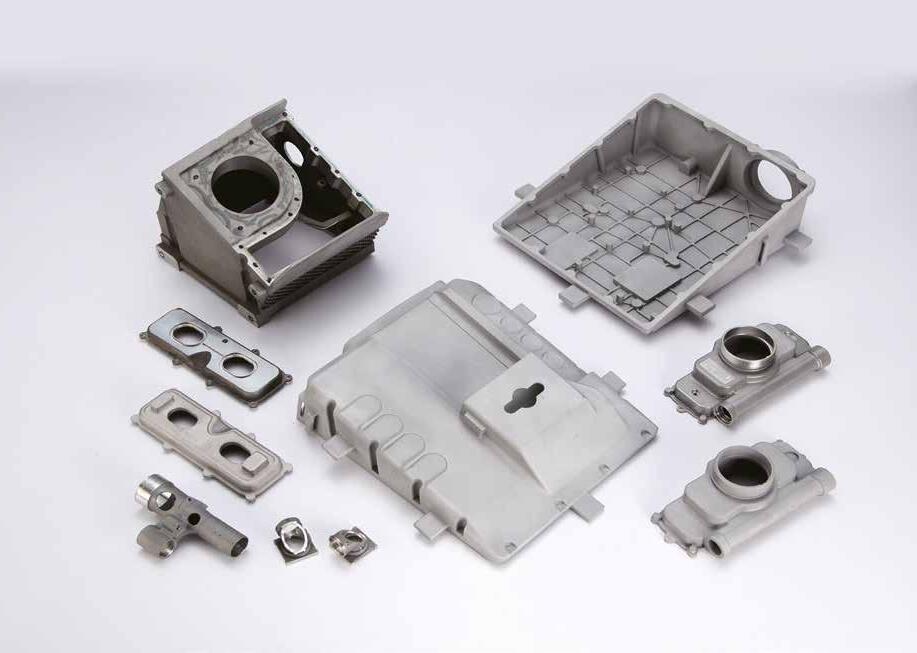
從美國手工具供應鏈危機,
檢視台灣手工具產業發展

Last March, Stanley Black & Decker announced it was closing the highly automated hand tool manufacturing plant in Fort Worth, Texas, which had been established for 3 and a half years and cost 90 million U.S. dollars, mainly producing the "Craftsman" tools which is a brand acquired by Stanley. This move is to save US$2 billion in costs. Before long, this March, Stanley announced the closure of the US$31 million manufacturing plant in Fort Mill, South Carolina (which produces "DeWalt" brand tools), also for cutting costs. Words emerged that Stanley was looking to reduce its bases in Asia. The Wall Street Journal devoted an article to explore why the leading American hand tool company cannot produce hand tools in the United States. It said the company just can't figure out how to make wrenches, and criticized that the Fort Worth factory sought to use unprecedented high automation and efficient production to bring the luster of "Made in America" back to the United States, but that in the end it proved to be a huge failure due to slow production speed and equipment problems.
In fact, Stanley was not the one that fired the first shot. In 2020, Ideal Industries announced the closure of its Western Forge brand (once the largest screwdriver manufacturer in the United States) and its U.S. factory. In 2017, Apex Tool Group announced the closure of the Armstrong brand and South Carolina factory.
Back to the Stanley case. Internal sources pointed out that the Fort Worth factory was originally going to produce high-quality hand tool products that could compete with "Chinese prices" through the development of unique automation technologies new to the industry. These technologies aimed to convert manual manufacturing processes into automated production and at the same time significantly improve product yields, but something went wrong in the process. Wrenches and ratchets become misshapen after passing through the press, resulting in millions of dollars spent on equipment adjustments. There is also the issue of sockets not being fully punched. In other words, the yield target couldn’t be reached. Another problem was losing experienced senior craftsmen with in-depth knowledge of tool making at the time, which added to the predicament. This reveals the problem of technical talent gap at the Fort Worth plant.
Automation technology can solve many problems in this challenging era, but successful technology research and development must be supported by talents with professional manufacturing knowledge. In the manufacturing of hand tools such as wrenches, even with automated machines, "human-owned craftsmanship" is still critical. Developing and tuning automated machines may sound simple to laymen, but in fact, whether it is forging or heat treating, the professional knowledge and flexible thinking of human brains are often something that automated machines cannot easily simulate or match. It is quick and simple to think with a human brain, but it will be very complicated to convert into a computer program. Therefore, experienced talents are indispensable.
Beyond that, there are structural issues. A long time ago, "Made in the U.S." once dominated the manufacturing market, but now manufacturing in places outside the United States has become the norm. For years, U.S. manufacturing has spread production overseas to reduce costs, which comes at the cost of sacrificing an intact domestic supply chain. Just like the fastener industry chain, hand tools also require a specialized industry
chain. The key competitiveness brought by a domestic industrial chain is the rapid acquisition and exchange of technical knowledge, raw materials and tools domestically, the improvement of overall price competitiveness through a mechanism of coexistence and mutual benefits, and the ability to provide complete supporting services. This is the key piece of the puzzle that the U.S. hand tool industry does not possess. Even if U.S. manufacturing has returned in recent years, rebuilding the U.S. hand tool supply chain is not something that can be accomplished in the short term.
In addition, more and more people just want to buy hand tools with lower cost, and there are many imported low-price hand tools in the U.S. market. Amid low-price competition from overseas peers, it is a big challenge for American hand tool companies to find a balance between high labor costs and price reduction.
Taiwan's hand tool manufacturers are in sharp contrast to the Fort Worth factory. There are approximately 2,400 hand tool manufacturers in Taiwan with nearly 50,000 employees. Seventy percent of these manufacturers gather in central Taiwan to form a very special industrial cluster in the world which comes with a complete supply chain, covering dies making, heat treatment, forging, electroplating, assembly, as so on from processing to finished products. This cluster creates an output value exceeding NT$130 billion a year. More than half of the hand tool products supplied by international brands are actually made in Taiwan. For example, Yih Cheng Factory based in Taiwan is the leading OEM manufacturer of American screwdrivers, with an annual output of more than 35 million screwdrivers.
Although Taiwan faces shortages in water, electricity, workforce, land, and funds, its hand tool industry still possesses sufficient "craftsmanship". Even if it does not have the most advanced automated production technology comparable to European and American counterparts, it can respond to various demand from global customers in real time. Coupled with the support of a complete supply chain, finished products in full sets can be provided to overseas buyers. Craftsmanship and supply chain are the keys to the success of Taiwanese hand tools. On another note, the Hannover Messe this year can also give us some inspiration. This exhibition showcased the latest technologies in the fields of automated robotic arms, smart manufacturing, and Industry 4.0. Upon the requirements of unmanned, automated and systematized manufacturing, the manufacturing industry is facing cost pressures for upgrade and transformation. However, the industry can’t afford to stop the pace of transformation, so companies must modify their practices as they go. Strategic alliances for new energy technologies have emerged in Europe, and coupled with the ESG and CBAM trends that have followed, the development of new energy policies will change the design and manufacturing of tools in the future. Should it be regarded as a crisis or a turning point? That is for you to make a judgement upon.
To that, the big players of Taiwan hand tool industry have been upgrading themselves to create high-value products for high-end industries. For example, Proxene Tools continues to delve into technology and has launched adjustable wrenches for the U.S. defense and aerospace industries. In addition, it introduced robotic arms into its factory, redesigned its workstation flow, introduced automated warehousing, and successfully set up a smart production line that increases production capacity by 30%. Today, Proxene Tools is one of the top three industrial adjustable wrench manufacturers in the world, accounting for a quarter of the market.
In recent years, there has been little growth in the production capacity of hand tools in Europe and Japan, and some of the major American factories have closed down, so some orders have been redirected to Proxene Tools. Even so, that doesn’t mean Taiwan hand tool manufacturers have no tough competitors. China's “red supply chain” has caused intense low-price competition with Taiwan. The price of Chinese DIY hand tools is only half the price in Taiwan. Therefore, the big players of Taiwan hand tool industry are transitioning to high-end professional-grade tools and carbon reduction.
Not only that, Taiwan is using its supply chain advantages to build an all-star alliance of hand tools. Machan International will be the leader in forming a strategic alliance with six well-known Taiwanese hand tool manufacturers, including K&W Tools, Kuang Yuang Industrial, Gong Maw Enterprise, Proxene Tools, LuckyBrand Industrial and Yih Cheng Factory. They will be collaborating to provide solutions to global buyers. On another note, these companies are advised to learn from the successful experience of Taiwan fastener industry. The fastener industry in Taiwan has begun to shift from pure manufacturing to marketing, and the overall scale of this industry is larger than that of the hand tool industry. Among all fastener manufacturers in Taiwan, more than 35 companies account for 50% of Taiwan's total fastener export value, including many large companies with a turnover above 100 million US dollars. Only when a company is large in scale can it have enough capital to step out of the box of pure manufacturing and go ahead with mergers and acquisitions, as well as create brands or establish marketing and warehousing bases overseas. If Taiwan hand tool industry can cultivate large-scale enterprises of international scale, they can drive the positive development of small and medium enterprises in the entire hand tool supply chain.
Taiwan and China are actively filling the gap left by American hand tool manufacturing. The lesson to take away from this story is to cultivate a specialized supply chain. U.S. Secretary of Commerce Gina Raimondo was interviewed in the CBS News program "60 Minutes", where she told the host: "We have the most sophisticated semiconductors in the world." The host asked her if 'we' include Taiwan. She replied it's "fair" to include Taiwan in her use of “we.” The same revelation has occurred in the U.S. semiconductor industry, which many readers have already witnessed. The importance for the hand tool industry to maintain its own intact supply chain is self-evident.
Copyright owned by Fastener World / Article by Dean





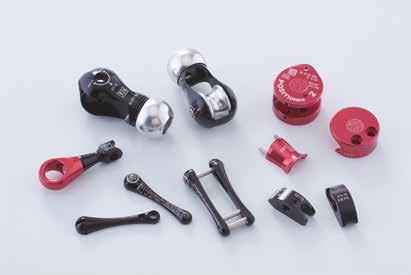
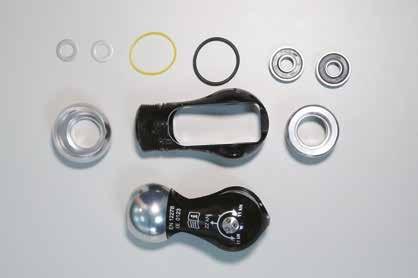
































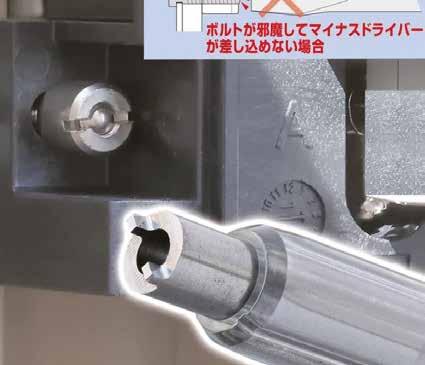
A special tool for attaching and detaching special screws that secure electric meters (smart meters, etc.). The special screw has a shallow fit with a normal flat-blade screwdriver, and was sometimes dropped and lost during work. This product can smoothly perform a series of tasks such as removing screws, catching them, storing them, and reinstalling them, contributing to increased efficiency.
Manufacturer: ANEXTOOL CO., LTD.
Compiled by Fastener World
This product is intended for use in automobile maintenance and machine maintenance. Recently, in the workplace where obstacles are increasing due to auxiliary equipment, products with compact and lightweight heads are required. It is necessary to develop a ratchet handle that will satisfy professional mechanics who do not choose working conditions such as tight spaces and heavy loads.
Manufacturer: KYOTO TOOL CO., LTD.

Obtained JIS standards while thoroughly reducing weight. The same strength as conventional work tools has been achieved. The weight reduction is effective in improving workability, making the tool easier to carry, and reducing fatigue. In addition, the light weight of the handle part is different from existing tools. Name tags and grips can be easily attached, allowing for easy customization.
Manufacturer: ASAHI METAL INDUSTRY CO., LTD.


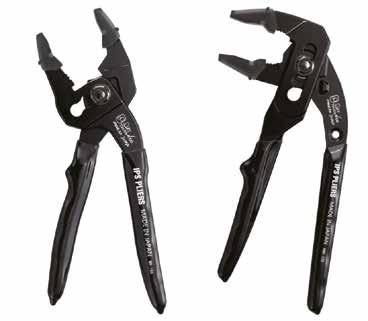
An evolution of the "Soft Touch" series that has been around since 1988. <Sustainable design born for those who build the future and those who support the future.> We have introduced materials, shapes, and mechanisms that are not bound by conventional tool concepts. Tsubame Sanjo founded brand in 1940 created high-quality tools made entirely Japan together with customer feedback.
Manufacturer: IPS PLIERS CO., LTD.
By changing the shape of use and making it lighter, we are able to shorten the working time and save the battery consumption of the electric tools used.
Manufacturer: ALLEANZA JAPAN CO., LTD.
The impact driver that reviews the suitability of power tools and combines high power with ease of use. The brushless motor provides sufficient performance and enables to downsize the housing. The functions are selected to suit userfriendliness, and the components have optimized shapes, designed to draw out the inherent strength and create the appearance standing out from conventional products.
Manufacturer: TAKAGI CO., LTD.

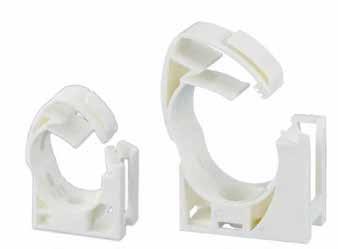
This product is a saddle band for fixing piping. Accommodates multiple pipe sizes.
Manufacturer: ONDA MFG. CO., LTD.
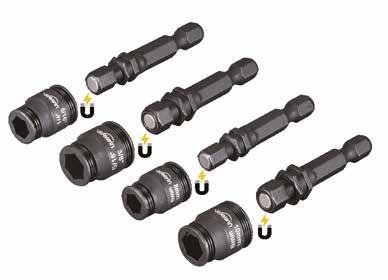
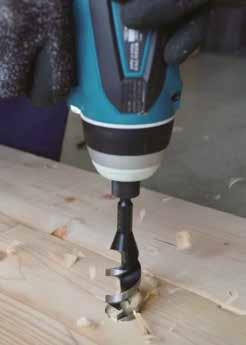
There was a risk of injury when removing the pilot hole awl from the impact driver because it was "a cutting tool" and "heated due to the friction of drilling". This product has a plastic grip so it can be removed safely, and the color of the grip makes it easy to identify the size.
Manufacturer: ANEXTOOL CO., LTD.



































DoC

美國商務部公告對台特定鋼釘反 傾銷稅行政複查結果
The U.S. Department of Commerce (DoC) issued a Federal Register notice on February 1 announcing the final results of its administrative review of the antidumping duties on certain steel nails imported from Taiwan. The anti-dumping review period was from July 1, 2021 to June 30, 2022. Based on the results of the investigation, the U.S. Department of Commerce determined that the weighted-average dumping margin of Your Standing International, Inc. is 26.28 percent, the weighted-average dumping margin of Shang Jeng Nail Co. Ltd. and World Kun Company Limited is 78.17%, and the weighted-average dumping margin of A-Jax Enterprise Limited and 130 other manufacturers is 26.28%.
Please visit http://tinyurl.com/47wyc5w6 to view the original notice.
墨西哥對中國鋼釘課徵臨時反傾銷稅

According to the latest announcement of the Mexican Federal Government, on July 27, 2023, Clavos Nacionales Mexico S.A. de C.V. applied to the Mexican Ministry of Economy for an anti-dumping investigation of steel nails (Mexican tariff number 73170099) imported from China. In September of the same year, the Mexican government formally initiated an anti-dumping investigation on the product (the period of the dumping investigation was from May 1, 2022 to April 30, 2023. The period of the injury investigation was from May 1, 2020 to April 30, 2023).
Based on the results of the investigation, Mexico announced on March 15, 2024 that it has preliminarily determined that
Compiled by Fastener World
the quantity of the products imported into Mexico from China and its market share in the Mexican market are likely to continue to increase in the future, which will have a negative impact on the Mexican industry; and therefore, a temporary anti-dumping duty of 31% will be levied on top of the original 25% tariff, which will take effect on and after the date of the announcement.
According to International Trade Administration (ITA) of Ministry of Economic Affairs (Taiwan)'s newly released "Analysis of Taiwan's Exports from January to December 2023", Taiwan's fastener export from January to December 2023 amounted to approximately US$4.6 billion, down 25% year-on-year from the 2022 figure of US$6.14 billion. Exports of hand tools amounted to US$3.78 billion, down 18% year-on-year from US$4.62 billion in 2022. The margins of the export decline in both product categories deteriorated from the 2022 figures, mainly due to the impact of geopolitical conflicts, inflation, and slowing economic growth, which led to conservative orders from customers and thus affected export performance.
However, according to another "International Economic and Trade Situation Analysis Report for January-December 2023" published by ITA, S&P Global forecasts that the growth of global exports and imports will turn positive in 2024 at 5.4% and 6.7%, respectively, with major Asian countries such as China, S. Korea, Japan and Taiwan showing a more significant growing trend of over 5%. In terms of metal prices, due to the gradual realization of the benefits of production reductions by steel mills in the U.S., Europe and China, coupled with the increasing steel prices in Europe and the U.S., the Asian steel market is warming up, and iron and steel prices are expected to stop declining and rebound from the fourth quarter of 2023 onwards.


中國五金製品協會與德國工具協會於 德國科隆舉行會見活動
On March 5th, China National Hardware Association (CNHA) and Association of German Tool Manufacturers met during the International Hardware Fair Cologne. Chairman Zhang, Vice Chairmen and Secretary General of CNHA and Managing Director Stefan Horst of German Tool Manufacturers Association participated in the meeting.
Both sides respectively talked about the current tool industrial development of China and Germany, as well as changes in their respective market demand, and also discussed the further cooperation between the two sides in the future. The meeting of Chinese and German tool industries this time not only strengthened the communication between both sides and promoted the info exchange and cooperation between the industry and enterprises, but also laid the foundation for resource sharing at international exhibitions and created more opportunities for corporate development in the future.

國際鐵釘工具協會擴大服務涵蓋範疇至 電池驅動扣件鎖固工具
One of ISANTA’s business priorities in 2023 was to review ISANTA’s scope and assess the impact of the emergence of new product lines. Respondents to the 2023 ISANTA membership survey expressed support for expanding scope to be inclusive of battery powered fastener driving tools. During their October 2023 meeting, the ISANTA Board of Directors took action to include Battery Powered Fastener Driving Tools as part of ISANTA’s scope. This was presented to the membership during the 2023 ISANTA annual business meeting in Denver. While pneumatic tools will remain ISANTA’s primary focus, ISANTA will look to provide complementary services that support battery powered tools as well.
Thomas F. Murphy獲粉末冶金產業聯盟頒發Kempton H. Roll冶金終生成就獎
Thomas F. Murphy, FAPMI, Senior Scientist, Research and Development, Hoeganaes Corporation, has been selected to receive the Kempton H. Roll Powder Metallurgy (PM) Lifetime Achievement Award by the Metal Powder Industries Federation (MPIF). The award will be presented during the combined PowderMet2024

(International Conference on Powder Metallurgy & Particulate Materials) and AMPM2024 (Additive Manufacturing with Powder Metallurgy) conferences, in Pittsburgh, Pennsylvania, during the Opening General Session on Monday, June 17.
Murphy is one of the few recognized experts in the field of ferrous PM microscopy throughout the world. He has been instrumental in developing sample preparation, characterization methods, and testing for both metal powders and PM components. He continues to perform a vital role in educating the industry about the effects of microstructure on the entire PM process. More recently, his research efforts have expanded to include the effects of microstructure with the additive manufacturing process.
The Lifetime Achievement Award, named in honor of Kempton H. Roll, founding executive director of MPIF, was established in 2007 to recognize individuals with outstanding accomplishments and achievements who have devoted their careers and a lifetime of involvement in the field of PM and related technologies. This will only be the fifth time the award has been given since its inception.

MPIF installed new presidents at the conclusion of the 2023 PM Management Summit and 79th Annual MPIF Business Meeting.
The new MPIF President is Michael Stucky. MPIF Executive Director/CEO James Adams presented the Crystal Award to Past President Rodney Brennen.
Michael Stucky, Business Unit Director, Norwood Medical, Bellbrook, Ohio, has been elected the 32nd president of the Metal Powder Industries Federation, succeeding Rodney Brennen, Metco Industries, Inc., St. Marys, Pennsylvania. His two-year term began at the conclusion of the Federation’s 79th annual MPIF Business Meeting, October 28–30, in Louisville, Kentucky.
Stucky has worked at Norwood for the past 11 years. Previously, he worked for 11 years at NetShape Technologies and 10 years at PCC Airfoils, Inc. Mike is very active within MPIF and the Metal Injection Molding Association (MIMA), having served on the MPIF Board of Governors as MIMA President. He is Chairman of the MIMA Standards Committee, MIMA representative on the MPIF Technical Board, and was a co-chair of the PowderMet2023, MIM2017, and MIM2018 conferences. Over the years he has served on the PowderMet and AMPM Technical Program Committees. Mike received the Distinguished Service to Powder Metallurgy Award in 2019.
Elemental Connectors成為國際鐵釘工具協會 (ISANTA)新會員

Elemental Connectors specializes in the manufacturing of galvanized wire & collated nails for a broad variety of industrial applications, ranging from infrastructure, fencing to housing construction industry. Established as the result of investors, talented professionals come together to plan, build and operate trustworthy systems for superior customer experience.
With its integrated manufacturing facility in Hyderabad India, Elemental Connectors strives for excellence in wire products, establishing a formidable presence in both domestic and international markets across North America as true partner of choice.
Nord-Lock集團獲Fastenal

Nord-Lock® wedge-locking washers have always been an exceptional choice for manufacturers when looking for the safest, most reliable bolt-securing solution. And to ensure that the washers get to those who need them, Nord-Lock has always put a lot of effort into maintaining and streamlining productive, reciprocal collaborations with its partners and distributors. During the Fastenal’s 2023 Supplier Award, that strive was recognized by honoring the North American team with the prestigious “Supplier of the Year” award.
Based on a thorough scorecard evaluating 25 different metrics, such as order acknowledgment, labeling, and a range of others, Nord-Lock came out on top in a category consisting of 97 suppliers. So, in addition to their superior washers, the award serves to recognize Nord-Lock's simultaneous marketleading position for providing smooth, customer-oriented supply and customer services. A more detailed look at 2023 shows that the Nord-Lock team outperformed the competition in ten of twelve months.
"When you pair a superior product with an incredible team, amazing things happen," says Shea Usher, Head of Sales North America. “So proud of my team and their
accomplishment of being named 2023’s best-in-class supplier at Fastenal’s Supplier Awards".
The award marks a remarkable milestone in the over 20-year-long partnership between Nord-Lock and Fastenal. With the award, NordLock’s North America division heads into 2024 with an energizing tailwind, inspired to improve on its already market-leading position in everything supply-related while continuing to offer the world’s safest bolting solutions.

Sales revenue reached €1,630.4 M (+14.4% compared to 2022), driven by sustained organic growth identical to that of 2022 (+15.5%) and increases in sales prices in the Group's three lines of business;
• At €90.7 M, EBIT is €1.6 M higher than in 2022;
• The operating Free Cash Flow is positive at + €22.2 M, thanks to the strong performances of the LISI AUTOMOTIVE and LISI MEDICAL divisions.
• Future outlook: The Group should benefit from the positive dynamics of the various markets in which it is well positioned; In an environment where inflationary pressure is expected to subside, the Group aims to improve its key financial indicators: EBIT and Free Cash Flow.

The Würth Group, the global market leader in the development, production and sale of assembly and fastening materials reported annual sales of more than EUR 20 billion for the first time in its corporate history according to its preliminary financial statements on the 2023 fiscal year. Despite the tense global economic and political situation, the Group was able to grow again, even though the difficult conditions had an impact on the operating result. Sales grew by 2.4 percent. Adjusted for currencies, sales growth came out at 3.5 percent. The operating result is expected to remain below last year’s result at EUR 1.4 billion (2022: EUR 1.6 billion), the second-best result in the history of the Group.
“Given the cooling global economy, we are satisfied with the past fiscal year. The sales mark of EUR 20 billion is a special milestone for us. We were able to double our sales volume over the past nine years,” said Robert Friedmann, Chairman of the Central Management Board of the Würth Group. “Last year, the Group’s heterogeneous structure across different industries and regions and our business model were once again the basis of our success. The construction sector, an important industry for the Würth Group, showed a slow sales development, which could be compensated for by other strategic
business units such as the Electrical Wholesale unit.”
In addition to the ongoing conflict between China, Taiwan, and the US, the wars in Ukraine and the Middle East, inflation-driven cost increases, especially for energy and raw materials, and high lending rates that hampered demand in the construction industry also had a negative impact on the result.
“Achieving these results in such an environment shows that our more than four million customers greatly appreciate our products and services. They trust us and that is our most important objective. The Würth Group has proven in the past that it can overcome major challenges successfully. The solidarity of our employees and the support of the family, especially by Prof. Reinhold Würth and Bettina Würth, give us the necessary stability,” emphasized Robert Friedmann.
喜利得集團挑戰中依舊表現亮眼

With the sales growth of 9.0 percent in local currencies (2.7 percent in Swiss francs), the Hilti Group closed 2023 with a turnover of more than CHF 6.5 billion. With this result, Hilti clearly outperformed the market and gained market share. Once again, the appreciation of the Swiss franc led to a significantly negative currency impact of 6.3 percentage points on sales. The operating result grew by 5.3 percent and reached CHF 770 million. Despite economic and geopolitical uncertainties, Hilti significantly invested into sales capacity, innovation and long-term strategic projects.
“2023 was a successful year for the Hilti Group. We achieved strong growth in local currencies and increased our operating result, despite the challenging economic environment, the strong Swiss franc
and the continued high level of investment. As we enter 2024, we are confident that we can continue to grow faster than the market”, summarizes CEO Jahangir Doongaji.
At a regional level, Europe managed to close the year with sales growth of 8.7 percent in local currencies, primarily driven by the strong contribution from Southern Europe. The Americas region grew by 9.1 percent, while Asia/Pacific was at 13.8 percent. China recovered slowly from COVID-19 lockdowns, while the rest of the region achieved solid growth rates. The ongoing war in Ukraine had an impact on the entire Eastern Europe / Middle East / Africa region, resulting in a growth of 3.1 percent.
An important growth driver was the completion of the global rollout of the new cordless platform Nuron. In addition to more than 70 tools launched in 2022, 30 new tools were brought to the market. Investment into research and development reached CHF 454 million (+3,9%), equal to 7.0 percent of the Group’s sales and underlining Hilti’s strong focus on innovation. Following the acquisition of Fieldwire Inc. in 2021, Hilti acquired 4PS Group in 2023, a Netherlands-based local market leader in developing and providing business

management solutions for the construction industry. As of the end of the year, Hilti Group had 34,111 team members, an addition of 1,624 (+5.0%) compared to the previous year.
The operating result increased by 5.3 percent to CHF 770 million while net income decreased by 0.9 percent to CHF 560 million. The return on sales (ROS) improved by 0.3 percentage points, reaching 11.8 percent (2022: 11.5%). The return on capital employed (ROCE) increased by 0.1 percentage points to 13.3 percent (2022: 13.2%).
Construction market forecasts point to a further softening with negative real growth in several geographies. The ongoing geopolitical tensions and the volatility in the financial markets will likely lead to a further appreciation of the Swiss franc and hence, another year of significantly negative currency impacts. To live up to the Group’s purpose of “Making Construction Better”, Hilti will continuously invest in driving innovation in both hardware and software solutions and building up its market reach resources. In 2024, the Hilti Group expects mid-single-digit sales growth in local currencies and a similar ROS level in Swiss francs compared to 2023.

印度Sterling Tools與韓國 Yongin Electronics簽署合作 備忘錄
Indian automotive fastener producer, Sterling Tools Limited, has recently signed an MoU for EV components facility with S. Korean key component supplier, Yongin Electronics Co., Ltd., through its subsidiary, Motor Control Units (MCUs) in India.
According to Sterling Tools, the agreement signed by both sides will play an important role in advancing the domestic manufacturing of EV and electronics components in India, and a new facility for EV components will also be set up soon. Yongin’s technological expertise will also benefit the growing EV industry sector in India.
“This MoU demonstrates Sterling’s commitment to developing the EV and Electronics ecosystem and contributing to “Make In India”. We are one step closer to our goal of strengthening our presence and offerings as a provider of green energy solutions in the automotive industry,” said Anish Agarwal, Director from Sterling Tools Limited.
“We recognize the significant potential within the Indian EV market. It brings us great pleasure to announce our partnership with Sterling through the signing of an MoU. We are prepared to embark on a journey of mutual growth and collaboration within the Indian EV industry, contributing positively to its advancement,” said CEO KH Kim of Yongin Electronics.
Stanley Black & Decker完成出售連接工具事業部門給 Epiroc AB

Stanley Black & Decker announced that it has completed the previously announced sale of STANLEY Infrastructure to Epiroc AB for US$760 million in cash. Stanley Black & Decker expects to utilize the cash proceeds, net of modest taxes, to reduce debt.
Headquartered in the USA, Stanley Black & Decker is a worldwide leader in Tools and Outdoor, operating manufacturing facilities globally. The company's more than 50,000 diverse and highperforming employees produce innovative end-user inspired power tools, hand tools, storage, digital jobsite solutions, outdoor and lifestyle products, and engineered fasteners to support the world's builders, tradespeople and DIYers. The company's world class portfolio of trusted brands includes DEWALT ®, CRAFTSMAN ®, STANLEY ® , BLACK+DECKER®, and Cub Cadet®

Martin Supply, one of the nation’s leading providers of customtailored solutions for maintenance, repair, operation, and production supplies, proudly announces its acquisition of Trinity Hardware Headquarters (THHQ) from Agrisolutions (AGS), a leading global manufacturer of wear parts, components, and accessories.
Based in Waukesha, Wisconsin, THHQ specializes in the supply of standard and custom components through catalog distribution, customized inventory management programs and product delivery services. This acquisition marks a significant milestone in Martin Supply’s dedication to bolstering its presence within the fastening market and growing in this geographic region.
Commenting on the acquisition, Douglas Ruggles, Co-CEO of Martin Supply, stated, “We are excited to welcome THHQ to Martin Supply. This acquisition aligns seamlessly with our mission to deliver unparalleled quality and service to our valued customers. We are committed to upholding the legacy of excellence that THHQ has established.”
The transition from AGS to Martin Supply promises continuity and reliability for customers. With meticulous planning and attention to detail, Martin Supply guarantees minimal disruption to the services customers depend on. Utilizing industry leading technology, Martin will drive the flow of products, services and information across the supply chain resulting in excellence in operations.
Reflecting on the acquisition, Demi Mantas, Sales Director, Hardware at AGS, expressed confidence in the transition, stating, “We are confident that Martin Supply will uphold the same level of quality and commitment our customers have come to expect. With Martin’s 90-year history, expertise, and commitment to excellence, we anticipate even greater value and innovation for our customers.”
House-Hasson簽署收購美國中西部五金批發商Bostwick-Braun意向書

House-Hasson Hardware, America's largest independent regional hardware distributor, has signed a letter of intent to acquire BostwickBraun Hardware, a Midwestern U.S. wholesale hardware distributor, officials of both companies have announced. The acquisition will include warehouses and inventory.
Steve Henry, president and CEO of House-Hasson, and Pete Richichi, CEO of Bostwick-Braun, said the letter of intent was signed Tuesday, March 19.
House-Hasson's main warehouse is at its Knoxville, Tenn., corporate headquarters; a second warehouse is in Prichard, W. Va. With the addition of Bostwick-Braun's West Helena, Ark., and Ashley, Ind., warehouses, House-Hasson will have more than 1.1 million square feet of warehouse, receiving and shipping space.
The acquisition described in the letter of intent will be complete after a period of due diligence. The pending acquisition's cost is being privately handled between the two companies.
The 56,000 stock keeping units (SKU) in Bostwick-Braun's warehouses will be incorporated into House-Hasson's system. House-Hasson presently has 55,000 SKUs in its two warehouses.

TFC併購
Supaseal UK
TFC, a leading provider of vendor managed inventory solutions and technical engineering products, has made a further acquisition in the O-Rings and Seals market, acquiring Midlands-based Supaseal UK Ltd.
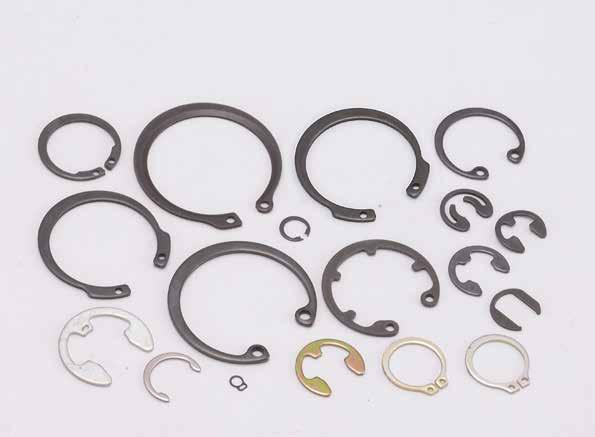
Supaseal is a major player in the rubber seals industry, growing a business which started in 1991 to now supplying a wide range of O-Rings, Rotary Shaft Seals, Bonded Seals, Circlips, and associated products to customers in the UK, Europe, the U.S., Middle and Far East.
TFC, an AFC Industries Company, had already acquired EAP Seals located in Manchester in April 2023 and this move adds to TFC’s market share in rubber sealing products and strengthens the technical components category.
Supaseal currently have more than 50,000 inventory lines and 15,000 live stock lines supplying a varied customer base having developed strong relationships with a variety of manufacturing partners in the UK and overseas. They offer non-stock products as well as off-the-shelf products. Their complementary products include specially moulded parts and bespoke kits to client specification.
The company will continue to be run by its current management team and operate out of its existing premises in Market Harborough, Leicestershire.
8,047.900





2,503.971












2024漢諾威工業展
聚焦能源、工業4.0議題
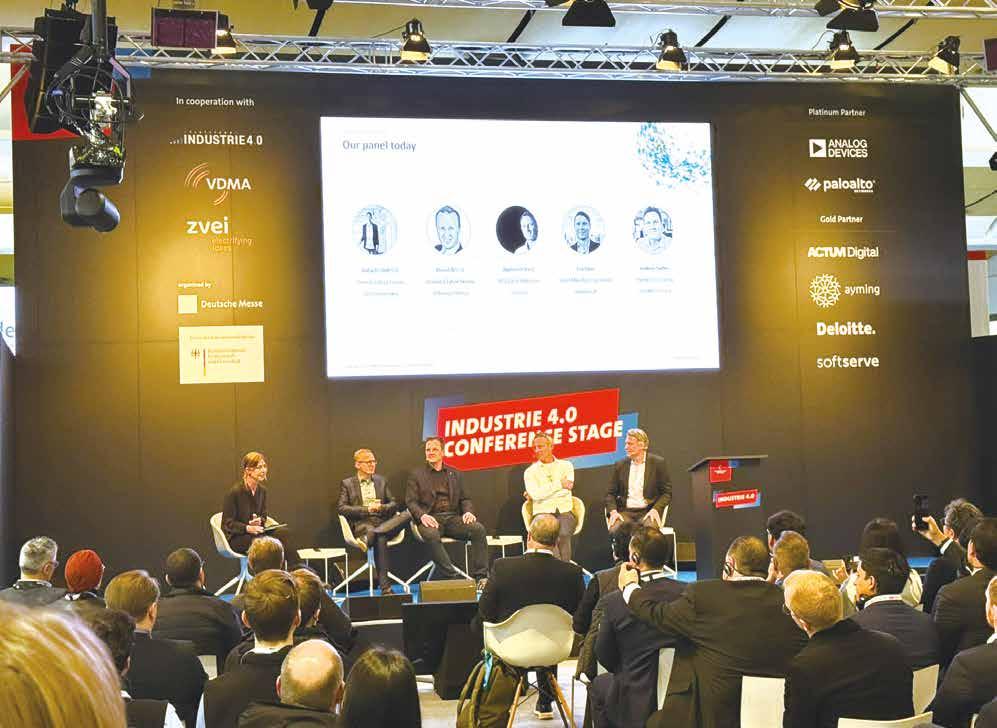
Hannover Messe in Germany, the annual event for all industries, kicked off on April 22, 2024 at Messe Hannover and attracted industry professionals from all over the world to visit the 5-day event. Since it was first organized in 1947, the trade fair has become one of the most important international platforms for the global industries to explore innovative products and observe the latest technologies and trends. This year, 15 exhibition halls were open for the show and attracted more than 4,000 exhibitors from the production and R&D fields of industrial manufacturing, mechanical engineering, automation, electronic engineering, digital industry, innovative materials and components, and energy-related industries, showcasing more than 14,000 products and sustainable solutions for industrial applications with outstanding performance.


The show this year focused on “Energizing a Sustainable Industry”, with special emphases on AI & machine learning, carbon neutral production, energy, Industry 4.0/Manufacturing-X, and hydrogen & fuel cells technology trends and developments. Through this annual event, exhibitors and visitors looked forward to creating further synergy and cooperation, fostering progress and development, stimulating more eco-friendly and innovative production, getting to know more technology trends, increasing industry competitiveness, and establishing successful networking contacts.

The organizer also invited many well-known figures from the industry, government and academia to give speeches. President of the European Commission Ursula von der Leyen and Chancellor of Germany Olaf Scholz were also on the invited guests list, demonstrating the official support of the European Union and German Government for the development of industrial upgrading and other related trends.
Copyright owned by Fastener World Article by Gang Hao Chang, Vice Editor-in-Chief


The housing market in the EU witnessed a blend of challenges and opportunities in 2023, setting the stage for a nuanced outlook in the coming year. This analysis delves into the key trends that shaped the EU housing landscape in 2023 and offers insights into what lies ahead in 2024, with a particular focus on Germany and France, two pivotal markets within the region.
The year commenced with a sense of cautious optimism, notably in Germany, the EU's economic powerhouse. Early indicators suggested a modest uptick in construction permits, hinting at potential growth opportunities. However, this upward trend was not uniformly observed across the EU. A significant factor contributing to the subdued growth was the swift escalation in interest rates. After years of historically low borrowing costs, the European Central Bank (ECB) embarked on a tightening cycle to counter inflationary pressures. This surge in interest rates adversely impacted mortgage affordability, particularly for first-time homebuyers, potentially dampening the demand for new housing units across the EU, including in France, another major market.
Several additional factors compounded the slowdown in new housing starts in the EU:
• Supply Chain Disruptions: Ongoing global supply chain disruptions continued to reverberate across the construction sector, causing shortages of essential building materials and skilled labour. These disruptions led to project delays and escalated construction costs continent-wide.
• Geopolitical Uncertainty: The conflict in Ukraine and broader geopolitical tensions cast a shadow of economic uncertainty, denting investor confidence and prompting developers in Germany and France to adopt a cautious stance.
• Disparities in Housing Demand: Housing needs varied significantly across the EU. While Germany grappled with a shortage of affordable housing, particularly in major urban centres like Berlin and Munich, France contended with an oversupply of vacation homes in rural areas. This disconnection between supply and demand further complicated market dynamics in both countries.

Market Dynamics: Germany's housing market is characterized by a strong demand for affordable housing, particularly apartments. This demand is driven by a growing urban population, with an estimated 87% of Germans living in urban areas1. Additionally, Germany has a large aging population, with over 28% of the population aged 65 or above2. This demographic requires accessible and affordable housing options. However, rising construction costs and a shortage of skilled labour pose challenges for developers. Construction costs in Germany increased by 17.6% year-on-year in the third quarter of 20233
Government Initiatives: The German government has implemented policies to address affordability concerns:
• Rent control: In some cities, rent increases are capped to a specific percentage above the local rent index.
• Tax breaks: First-time buyers can benefit from tax breaks on property purchases, such as a reduced value-added tax (VAT) rate on renovations.
• Focus on energy efficiency: The German government offers subsidies and incentives for developers to construct energyefficient buildings, promoting sustainability in the housing market.
Market Dynamics: The French housing market is more diverse, with a mix of urban and rural properties. While demand remains strong in major cities like Paris, affordability concerns are rising. A 2023 study by the Notaires de France, a national association of notaries, revealed that the average price per square meter in Paris reached a record high of €10,600 (US$11,233).
Additionally, there's an oversupply of vacation homes in some rural areas. According to INSEE, the French National Institute
1. Statista (2023). Share of urban population in Germany from 1950 to 2023. https://www.statista.com/statistics/1056970/ urbanization-in-germany/
2. The World Bank (2023). Population 65 and over, total (% of total population) - Germany. https://data.worldbank.org/ indicator/SP.POP.65UP.TO.ZS?locations=DE
3. Destatis Statistisches Bundesamt (Federal Statistical Office of Germany) (2023). Construction price index - Germany https://www.destatis.de/EN/Themes/Economy/Prices/Producer-Price-Index-For-Industrial-Products/_node.html
of Statistics and Economic Studies, there were over 600,000 vacant second homes in France in 2022.
Government Initiatives: The French government has also introduced measures to address affordability:
• Tax breaks: First-time buyers can benefit from tax breaks on property purchases, similar to Germany.
• Social housing projects: The government invests in the development and maintenance of social housing units, providing affordable options for low-income residents.
• Renovation focus: There's a growing emphasis on renovating existing housing stock to improve energy efficiency. The government offers grants and tax credits to encourage homeowners to undertake energyefficient renovations.
While both Germany and France face challenges in their housing markets, some key differences exist:
• Demand Focus: Germany grapples with a shortage of affordable housing, particularly in urban areas. France, on the other hand, has a more diverse market with both affordability concerns in major cities and an oversupply issue in specific rural segments.
• Policy Focus: Both countries offer tax breaks for firsttime buyers, but Germany additionally utilizes rent control mechanisms in some cities. France places a stronger emphasis on social housing projects to address affordability.
Despite the current challenges, both Germany and France are likely to see a continued focus on:
• Affordable Housing Solutions: Government initiatives and developer strategies catering to specific needs in their respective markets will be crucial for ensuring housing accessibility.
• Sustainable Construction: The emphasis on energyefficient buildings and renovations is likely to continue, driven by rising energy costs and environmental concerns.
By adapting to these trends and addressing affordability concerns, Germany and France can work towards a more balanced and sustainable housing market in the future. Signs of Resilience: Underlying Demand and Policy Initiatives.
Despite the prevailing headwinds, there are glimmers of hope for the EU housing market, including Germany and France, as it transitions into 2024. Here are some notable trends to monitor:
• Demographic Imperatives: Demographic shifts within the EU underscore a sustained, long-term demand for new housing units. Population growth, particularly in urban hubs, coupled with an aging populace necessitating accessible housing solutions, will continue to underpin demand in both Germany and France.
• Policy Support: Several EU member states, including Germany and France, are rolling out measures to address affordability concerns, potentially injecting momentum into the market.
• Emphasis on Sustainability: There is a growing emphasis on sustainable construction practices across the EU. This trend could incentivize developers to prioritize energy-efficient housing solutions, appealing to environmentally conscious buyers and curbing long-term operating expenses for homeowners.
Industry experts offer nuanced perspectives on the EU housing market's trajectory in 2024. While a full-fledged recovery may remain elusive in the near term, certain segments, particularly in Germany and France, could witness renewed stability and growth. Here's a breakdown of key forecasts:
• Segmental Variations: The luxury and high-end housing segments are anticipated to remain relatively resilient, buoyed by sustained demand from discerning buyers in both Germany and France. However, the affordable housing segment might face more pronounced challenges due to escalating costs and financing constraints.
• Continued Emphasis on Renovation: Renovation and refurbishment endeavours targeting existing housing stock are poised to gain prominence in 2024, encompassing both Germany and France. This trend is driven by various factors, including:
Energy Efficiency Imperatives: Escalating energy expenses and mounting environmental concerns have amplified the focus on enhancing the energy efficiency of buildings. Renovation projects aimed at upgrading insulation, windows, and heating systems offer compelling cost-saving opportunities for homeowners.
Sluggish New Construction: A potential deceleration in new construction activities could pivot attention towards renovation initiatives, particularly in locales characterized by aging housing stock in need of modernization.
Regional Dynamics: Market performance is expected to diverge across different EU member states.
The EU housing market, with a spotlight on Germany and France, stands at a crossroads in 2024. While challenges abound, underlying drivers of resilience and adaptability offer grounds for cautious optimism. By zeroing in on bespoke housing solutions, sustainable practices, and fostering an environment conducive to economic stability, stakeholders can play a pivotal role in nurturing a balanced and sustainable housing ecosystem in the years ahead.
Copyright owned by Fastener World / Article by Behrooz Lotfian

The U.S. housing market in 2023 presented a story of resilience amidst challenges. After a period of rapid growth fuelled by historically low mortgage rates, new housing starts experienced a period of fluctuation. This article analyzes the key trends of 2023 and explores the expectations for the housing market in 2024.
The year began with a sense of cautious optimism. While builder confidence, as measured by the National Association of Home Builders (NAHB) Housing Market Index (HMI), had dipped to 44 in December 2022, it rose steadily in the first half of 2023. By June 2023, the HMI reached 55, exceeding pre-pandemic levels observed in September 2020 (at 51) . This significant improvement suggests a cautiously optimistic outlook among builders, despite ongoing market challenges.
Note that: Builder confidence reflects how optimistic home builders are about the housing market. They consider factors like buyer demand, affordability, and construction costs. The NAHB Housing Market Index (HMI) is a survey that gauges this confidence, with a score above 50 indicating a positive outlook. High builder confidence leads to more new construction projects and a stable market. It's important because it influences housing inventory and overall market health.
However, a key indicator, building permits, painted a more complex picture. Though May 2023 saw a 4.8% increase from the previous month, it still represented a 13.2% decline compared to May 2022. This suggested a potential slowdown in new construction activity. The second half of 2023 witnessed a more pronounced slowdown in new housing starts. Data from the U.S. Census Bureau revealed a
significant drop in January 2024, marking the lowest level since August 2020. This 14.8% month-over-month decline surprised analysts and signalled a potential correction in the market.
Several factors contributed to the slowdown in new housing starts in 2023:
• Rising Mortgage Rates: A significant factor was the rise in mortgage rates. After years of historically low rates, the 30-year fixed mortgage rate climbed above 7.79% in 2023, significantly impacting affordability for potential buyers. This squeezed buyer budgets and led to a decrease in demand for new homes.
• Supply Chain Issues: The ongoing global supply chain disruptions continued to affect the housing industry. Shortages of building materials and labour hampered construction activity, causing delays and pushing up construction costs.
• Inflation: Broader inflationary pressures also played a role. The rising costs of materials and labor further squeezed builder margins and contributed to a more cautious approach to new construction projects.
Despite the challenges of 2023, there are reasons for cautious optimism in 2024. Here are some key trends to watch:

• Mortgage Rate Fluctuations: Mortgage rates have shown some signs of stabilization and even a slight decline in recent months. If this trend continues, it could improve affordability and stimulate buyer demand. The Federal Reserve's monetary policy decisions will significantly influence mortgage rates in the coming months.
• Stable Builder Confidence: Though not at pre-pandemic levels, builder confidence has remained relatively stable compared to the lows of 2022. This indicates that builders are not overly pessimistic about the market's long-term prospects.
• Underlying Housing Demand: Demographics continue to point towards a sustained demand for housing. Population growth and millennial generation entering prime homeownership age suggest a long-term need for new housing units.
Industry experts hold a mixed view on the housing market in 2024. The National Association of Realtors (NAR) forecasts a slight increase in total housing starts, with single-family starts reaching 1,020,000 by Q2 2024. However, they also acknowledge the continued impact of affordability challenges. (Single-family starts: This refers to the initiation of construction on new homes designed for single families, meaning they are not attached to other units like condominiums or townhouses.)
While there are reasons for optimism, there are also potential headwinds for the housing market in 2024:
• Economic Uncertainty: The broader economic climate remains uncertain. Geopolitical tensions and potential recessionary fears could dampen consumer confidence and impact housing demand.
• Inventory Levels: Existing home inventory levels are slowly rising, which could put downward pressure on new home sales, especially if mortgage rates remain elevated.
The U.S. housing market in 2024 is likely to be one in transition. The era of supercharged demand and rapid price growth may be over, replaced by a more balanced market with a focus on affordability. Builders will need to adapt to changing consumer preferences and prioritize value for money. Technology and innovation in construction methods could play a role in improving efficiency and reducing costs. Additionally, a focus on sustainable building practices and energy-efficient homes could attract a new generation of buyers.
The U.S. housing market in 2024 is likely to be a story of cautious optimism. While challenges remain, such as rising interest rates and economic uncertainty, there are also underlying factors that suggest a potential rebound. Demographics and a long-term need for housing will continue to drive demand.
Here are some key takeaways for different stakeholders in the market:
• Builders:
o Affordability: In a market with rising interest rates and potentially fewer buyers, builders will need to prioritize affordability. This could involve offering smaller floor plans, utilizing more cost-effective building materials, or streamlining construction processes to reduce costs.
o Value Engineering: The concept of value engineering involves optimizing designs to deliver the most value for the price. Builders can focus on features that are most important to buyers, such as functional layouts and energy efficiency, while minimizing unnecessary frills.
o Niche Markets: Catering to specific buyer groups can be a successful strategy. First-time homebuyers, for example, might be attracted to smaller, starter homes with lower price points. Another growing niche is the market for energyefficient homes. Builders can offer features like improved insulation, high-performance windows, and energyefficient appliances, which can attract environmentally conscious buyers and potentially lead to lower utility bills for homeowners.
• Buyers:
o Competitive Market: The market in 2024 might be more competitive than recent years due to a potential rise in inventory and fewer buyers competing with historically low mortgage rates. Buyers should be prepared to potentially submit multiple offers and be flexible on some aspects of their search.
o Careful Budgeting: Careful budgeting is crucial in any housing market, but especially in a scenario with rising interest rates. Buyers should factor in not just the purchase price, but also closing costs, property taxes, and ongoing maintenance expenses. Having a realistic understanding of these costs will help them determine a comfortable price range.
o Long-Term Perspective: Buying a home is a long-term investment. While affordability is important in the short term, buyers should also consider the long-term value of their purchase. Factors like location, school district, and potential for appreciation can also be important considerations.
• Policymakers:
o Affordability Programs: Down payment assistance programs can help make homeownership more accessible to first-time buyers or those with limited savings. Policymakers can explore implementing or expanding such programs to stimulate demand in the market.
o Economic Stability: A stable economic environment is vital for a healthy housing market. Policies that promote job growth and economic stability can indirectly benefit the housing market by increasing consumer confidence and purchasing power. The coming months will be crucial in determining the trajectory of the U.S. housing market in 2024. With careful planning and adaptation, all stakeholders can navigate the changing landscape and contribute to a more sustainable and balanced housing market.

China's housing market stands as a pivotal barometer of its economic health, with new housing starts serving as a key indicator of growth and development. Against the backdrop of a rapidly evolving economic landscape, the hardware and fastener industries play a crucial role in the construction sector, ensuring structural integrity and safety in building projects. This article briefly explores the nuances of China's housing market in 2023 and provides insightful projections for 2024, which might be helpful for those involved in the fastener and hardware industries, offering valuable perspectives on market trends and potential opportunities for strategic positioning.
China's housing market woes have gained significant attention in recent years, reaching a climax with fresh reports towards the end of the previous year. These reports indicated that more than half of listed property developers had either defaulted on their obligations or restructured their public debts. Sales of new residential properties in 2023 were sluggish, amounting to only half the pace witnessed in 2021. Similarly, new residential construction starts experienced a comparable decline
However, amidst the bleak outlook portrayed by these reports, there were some encouraging developments that went unnoticed. In 2023, completions of residential properties saw a notable uptick, surging by 17 percent; however, housing starts have declined by more than 21% compared to 2022. The total area completed reached nearly 725 million square meters, surpassing
the pace of new residential starts for the first time on record. If this trend persists, it has the potential to instil confidence in the property market, fostering a more sustainable pace of development.
Starts and Completions in China in 2021-2023 (Millions of Square Meters)
The turbulence within China's property sector came into a sharp focus in mid-2021, notably with the emergence of challenges faced by one of the nation's largest property developers. Subsequently, other developers found themselves grappling with similar predicaments.
While these developments posed immediate challenges to China's economic growth, they served to purge risky practices, a crucial step towards fostering a sustainable property market. At the height of the 2021 crisis, a significant portion of the nearly 1.5 billion square meters in residential property purchases were speculative rather than driven by genuine demand.

A key obstacle to the establishment of a sustainable property market lies in the timely completion of pre-sold properties, often paid for in full in advance without a deposit or down payment. Concerns over potential non-delivery of purchased units can deter prospective buyers, thereby undermining property sales.
The preceding year marked a pivotal juncture in addressing this challenge. Despite a halving in new construction starts, and a one-fifth decline in property investment compared to 2021, notable progress was made. A significant factor contributing to this trend is the increasing allocation of property investment towards completing projects initiated in the past, rather than initiating new ones.
These developments represent predominantly positive news for China's economy. Developers have significantly curtailed new construction starts, acknowledging the end of the property boom, and are channelling the bulk of their efforts and resources into completing pre-sold housing units.
In early 2024, China's housing market displayed signs of stabilization, with a moderated decline observed in property investment and sales. Governmental efforts to mitigate the sector's downturn, coupled with strategic interventions, contributed to this tempered decline. Property investment fell by 9% year-onyear in the first two months of 2024, compared to a 24% decline in December 2023. Similarly, property sales witnessed a 20.5% slide in January-February, reflecting a slight improvement from the preceding months.
However, challenges persist, as evidenced by the sector's struggle to stabilize home prices, which declined by 0.3% monthon-month in February. Despite the modest slowdown in investment decline, analysts remain cautious, emphasizing the continued downtrend in the real estate sector. The liquidity crisis facing developers and the ongoing struggle for cash flow underscore the underlying challenges confronting the industry.
In the coming years, China's housing market is expected to face additional obstacles due to underlying changes in its population dynamics. The need for more housing is likely to decrease as population growth slows down and the pace of urbanization also
slows. Although significant government subsidies over the past decade facilitated the migration of millions of people to betterquality homes from older, less equipped ones, this demand is anticipated to dwindle. This decline is attributed to reduced revenues from land sales, which constrain local government budgets, along with a decrease in the number of residents occupying older housing units.
Given these changes in both short-term trends and long-term factors, investment in housing is expected to decrease further, remaining low in the near future. Recent forecasts for real estate investment in the medium term, taking into account different scenarios based on changes in demand and supply-side pressures, suggest a potential decline ranging from 30 percent to 60 percent below the levels seen in 2022. This decline would lead to a gradual recovery similar to what has been seen in other countries experiencing significant slowdowns in housing construction.
Efforts to strengthen spending on affordable housing and urban redevelopment in the current year may partially alleviate the decline in investment. However, these measures are unlikely to adequately address the substantial housing inventory overhang held by financially distressed developers.
A smoother and more expedient transition for the real estate sector can be achieved through market-driven adjustments in home prices and swift restructuring of insolvent developers. Phasing out regulations allowing banks to defer recognition of bad loans to developers is crucial.
Authorities should extend support to viable developers while tightening regulations to mitigate future risk accumulation. Introducing insurance for homebuyers against the risk of developers' failure to complete purchased homes could enhance confidence and alleviate sales pressures. Strengthening escrow rules for presale financing would offer improved legal safeguards for homebuyers. Implementing a nationwide property tax and enhancing pension or alternative saving schemes would reduce households' reliance on housing investment. Fiscal reforms aimed at bridging the structural gap between local government revenues and expenditure obligations are essential to reduce dependence on land sales and property-related activities.
In reaction to challenges faced by the sector, China has ramped up efforts to breathe new life into the property market. These efforts include cutting benchmark mortgage rates and implementing a "whitelist" mechanism. This mechanism allows city governments to recommend residential projects to banks for financial support. Despite these measures, market sentiment remains muted, with trends such as home purchasing, financing, and construction initiations continuing to decline.
As China's housing market faces the challenges brought by economic changes, regulatory shifts, and technological progress, the construction industry stands as a vital component, deeply integrated into the fabric of development projects. Analyzing the trends in new housing starts in 2023 and predictions for 2024 sheds light on the interconnectedness between construction endeavours and the broader economy. As stakeholders navigate this evolving terrain, adaptability, innovation, and strategic planning are essential for seizing emerging opportunities and tackling obstacles within China's dynamic construction sector.
Sources: China’s Housing Report by Peterson Institute for International Economics China's Property Investment Report by Reuters
As we step into 2024, the U.S. cordless power tools market beckons with promises and challenges that have shaped its trajectory through 2022 and 2023. In this exploration, we delve into the intricate tapestry of this dynamic market, from technological advancements and DIY culture to regional dominance, collaborative ventures, and nuanced market insights.
The U.S. cordless power tools market is entrenched in a technological odyssey, primarily driven by the rapid evolution of battery technologies. The market witnessed a paradigm shift with the ascendancy of Lithium-ion (Li-ion) batteries, heralding a new era characterized by enhanced energy density, faster charging speeds, and prolonged cycle durability. These advancements have not only met performance expectations but have also aligned with environmental considerations, resonating well with conscious consumers.
The surge in the Do-It-Yourself (DIY) culture has been a potent force propelling the cordless power tools market. The DIY home improvement market surpassed the US$ 667.9 billion mark in 2019, with North America, especially the United States, playing a pivotal role. Cordless power tools, with their freedom from cords and enhanced portability, have become indispensable for modern DIY enthusiasts. The appeal lies in the ability to undertake projects ranging from simple repairs to complex renovations with ease.
In the dynamic and competitive landscape of cordless power tools, collaborative ventures and strategic acquisitions have emerged as pivotal drivers of growth and innovation. Companies, steering through this landscape, have engaged in partnerships to foster innovation, expand their product portfolios, and gain a competitive edge. As the market evolves, these collaborations position themselves as catalysts, shaping the industry's future and meeting the evolving needs of professionals and DIY enthusiasts in the U.S. market.
As we delve into the intricate dynamics of the cordless power tools market, North America, spearheaded by the United States, emerges as an indomitable force, shaping the industry's narrative. In 2022, the market size within this region reached an impressive US$ 4.7 billion, setting the stage for a trajectory that would solidify its dominance. With a projected market size of US$ 9.2 billion by 2023 , North America continued to fortify its influence, marking a resilient year of growth.
As we step into 2024, reflections on 2023 underscore the industry's resilience and growth, attributing much of this success to factors such as technological advancements, collaborative ventures, and the resounding echo of the DIY culture. The market size of US$ 9.2 billion in 2023 is not merely a numerical milestone; it signifies the robustness of the cordless power tools market in North America, particularly in the United States.
Moving beyond the broader strokes, let's delve into market projections and nuanced insights that define the U.S. cordless power tools landscape. In 2022, the market was valued at USD 24.50 billion, set to reach USD 37.87 billion by 2028, growing at a CAGR of 7.53%. These numbers reflect the convergence of Industry 4.0 practices, IoT integration, and stringent government regulations against noise pollution. As the U.S. witnesses a surge in infrastructure projects and construction endeavours, the demand for cordless power tools becomes a consistent undercurrent, shaping the market's recent past and future.
Within the U.S. cordless power tools market, understanding the dynamics of segmentation and user preferences becomes paramount. Drilling and fastening tools, including drills, impact wrenches, and screwdrivers, hold the lion's share of popularity. The mass category, catering to cleaning and maintaining moderate-sized homes or yards, is set for significant growth. In the motor landscape, brushed motors currently dominate, but the shift towards brushless motors, offering higher operational life and ease of maintenance, hints at a transformative trend.
As we navigate through 2023-2024, these insights into the dominance of drilling and fastening tools, the surge in the mass category, and the motor evolution signify a period of transformative trends. The U.S. cordless power tools market is not just witnessing growth but is undergoing a nuanced shift in user preferences, emphasizing efficiency, versatility, and longevity. Stakeholders and enthusiasts alike need to be attuned to these dynamics to navigate this period successfully, ensuring they are in sync with the pulse of the market as it evolves and shapes the tools of tomorrow.
As we weave through 2023-2024, the story of battery sizes and end-user realms in the U.S. cordless power tools market unravels a tapestry of evolving trends. It's a narrative of 12V dominance meeting the demands of DIY enthusiasts, torque considerations shaping product landscapes, and the symbiotic relationship between cordless power tools and industries driving innovation. Stakeholders need to be attuned to these dimensions, recognizing the intricate interplay of factors that will define the landscape in the coming years. In this period of dynamic evolution, understanding the dimensions of battery sizes and end-user preferences becomes not just a strategy but a necessity for those navigating the U.S. cordless power tools market.
Within the U.S. consumer journey, distribution channels hold a pivotal role in shaping purchasing decisions. As of 2023-2024,
offline channels wield a dominant position, anchored in consumer trust and the tangible experiences they offer. The brick-and-mortar stores provide consumers with the opportunity to physically interact with the tools, fostering a sense of confidence and assurance before making a purchase. This traditional model has been a cornerstone, resonating with consumers who prioritize hands-on experiences and immediate access to products.
However, a transformative tide is sweeping through the market as the online segment experiences significant growth. The advantages presented by online platforms, including heavy discounts, occasional offers, and unmatched convenience, are challenging the established dominance of offline channels. In 2023-2024, the online surge sets the stage for a nuanced competition, prompting stakeholders to reevaluate their strategies in response to evolving consumer preferences.
As e-commerce platforms gain traction, collaborations and strategic partnerships become pivotal for vendors navigating this evolving landscape. The interplay between offline and online dynamics is not a clash but an intricate dance where vendors need to find a harmonious balance. The seamless integration of these channels becomes a strategic imperative. Vendors that successfully navigate this intricate dance will not only meet the demands of a diverse consumer base but also capitalize on the opportunities presented by both offline and online platforms.
Our exploration of the U.S. cordless power tools market in 2023-2024 unveils a narrative that extends beyond statistical figures. It reflects a dynamic ecosystem where technological prowess, cultural shifts in DIY dynamics, and collaborative ventures converge. The relentless pursuit of technological advancement, witnessed through innovations in battery technologies and IoT integrations, defines the industry's commitment to meeting evolving user needs. Simultaneously, a profound cultural shift, driven by the surge in global DIY culture, reshapes how individuals approach home improvement, with cordless power tools becoming integral to this transformative journey. Collaborative ventures, characterized by strategic partnerships and industry collaborations, not only define the present but lay the groundwork for a future marked by innovation and growth.
As we navigate toward 2024, the U.S. cordless power tools market is poised for sustained evolution. Anticipated technological advancements, a continued surge in the DIY culture, and the dynamic landscape of collaborative ventures are set to shape the industry's trajectory. The tools of tomorrow are not mere instruments; they represent a synthesis of innovation, efficiency, and adaptability, empowering both professionals and DIY enthusiasts in a landscape where the workbench becomes a canvas for creativity and precision.
Sources:
Cordless Power Tools Market Outlook (2023 to 2033) by Fact.MR
Cordless Power Tools Market Global Outlook & Forecast 2023-2028 by Arizton
Automobile production and sales have always been one of the indicators for determining whether the related industries are doing well or not. The production of an automobile requires the use of many small parts and fastening components, so the fluctuations of production and sales will have an impact on the orders received in the supply chain of these products. According to the International Organization of Motor Vehicle Manufacturers (OICA), the global automobile production and sales have been on a general growth trend over the past three years, with more significant growth margin between 2022 and 2023. In this article, we will analyze the latest automobile sales and production figures for 2023, and further compare them with those for 2021-2022 to give readers a glimpse of the changes in the automobile industry's outlook.
Global automobile production was about 80 million units in 2021, which grew to nearly 85 million units in 2022, and then expanded to nearly 94 million units in 2023, an increase of about 10% over the 2022 figure; the global sales were in a slight decline from nearly 84 million units in 2021 to nearly 83 million units in 2022, but grew sharply to nearly 93 million units in 2023, with a similar increase of more than 10% over the previous year. The goal of annual production and sales of more than 100 million vehicles seems to be within reach.
Europe's automobile production grew from approximately 16 million units 3 years ago to more than 18 million units in 2023, representing a 13% year-overyear increase. It is the world's 3rd largest automobile production region, with Germany, Spain, France, the Czech Republic and Slovakia being the top 5 automobile producers in 2023. Germany and the Czech Republic in particular showed the most significant year-on-year changes, which were 18% and 15%, respectively. Production in most European countries remained at growth levels, except for Serbia, Finland and Slovenia, which experienced significant production declines of 96%, 59% and 11%, respectively. In addition, Turkey, which is actively seeking to become a member state of the European Union, has also seen its automobile production grow year by year, reaching a level of more than 1.45 million vehicles in 2023, a year-on-year growth of 9%. These figures fully demonstrate that the momentum of the automobile manufacturing industry in Europe and neighboring countries is slowly picking up.
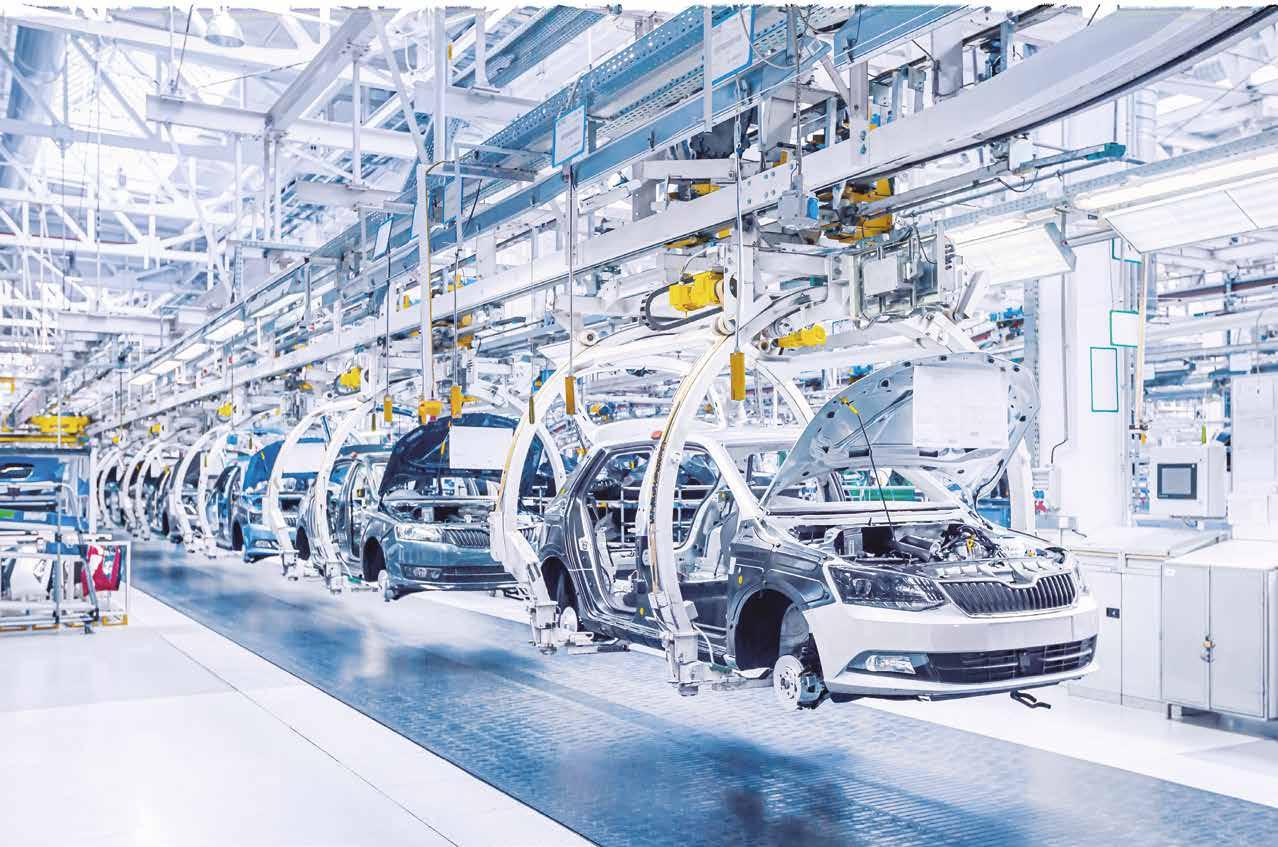
In Russia, Ukraine, and Central Asian countries, Russia's vehicle production in 2023 significantly reduced by more than 50% compared to the 2021 figure, and Ukraine shrank from more than 7,000 to less than 2,000 vehicles. However, Uzbekistan, Kazakhstan and Azerbaijan all showed significant growth over 2021.
The Americas, the world's 2nd largest automobile production region, grew from about 16 million units in 2021 all the way to more than 19 million units in 2023, an 8% increase from 2022. In North America, although Canada had the largest year-onyear increase, however, in terms of volume, more than 90% of production was still concentrated in the U.S. and Mexico. The overall production in South America was below 3 million units, with no significant year-on-year change. Brazil is the largest producer of automobiles in South America, with production of more than 2.3 million vehicles in 2023, which still showed a slight year-on-year decline of 2%. Argentina and Colombia rank 2nd and 3rd respectively.
The Asia-Pacific region is the world's largest automobile production region, with its production volume rising from over 46 million units in 2021 to over 50 million units in 2022, and surpassing the 55 million-unit mark in 2023, representing a 10% year-on-year increase. The top 5 automobile producing countries were China (more than 30 million vehicles), Japan (nearly 9 million vehicles), India (about 5.9 million vehicles), South Korea (more than 4 million vehicles) and Thailand (nearly 1.9 million vehicles). Among the top 5 countries, except for Thailand,

which experienced a slight decline compared to the year before last, the other countries still maintained positive growth. In addition, Indonesia in ASEAN and Iran in the Middle East also showed a production scale of more than one million units of strength. Malaysia's production volume was less than one million, but still had a 10% growth year-on-year.
Africa's production, though small compared to other regions, was still over a million units in size and grew by around 15% year-on-year to 2023. Automobile production in the region was concentrated in South Africa and Morocco, with more than 600,000 and 500,000 vehicles respectively. Egypt, on the other hand, had no published data on vehicle production between 2021 and 2023.
Overall, Europe's automobile production rebounded the most significantly. Except for the Americas, where growth did not reach more than 10%, all other regions saw at least 10% growth, indicating that the outlook for global automobile production remains favorable.
The car sales of Europe (plus the UK) and their production can be said to be very close, which were about 17 million units in 2021, a short decline to about 15 million units in 2022, and a substantial growth of 18.7% to nearly 18 million units in 2023. The top 5 countries in terms of sales were Germany, the UK, France, Italy, and Spain. Except for Germany, the other four countries all had an year-over-year increase of at least 10%. Among all European countries, only Norway showed a 21% decline and Hungary showed less than 1% increase, while all the other European countries showed significant growth. Turkey's sales grew by more than 55% in 2023, dramatically increasing to nearly 1.3 million units. Its sales were just under a million units in 2021 and 2022.
In Russia and Ukraine, the data showed a significant decline in sales in 2022, but a significant growth has already begun since 2023, reaching more than 1.3 million and more than 700,000 units of vehicles, respectively.
The Americas is the world's 2nd largest market for automobile sales, only second to the Asia-Pacific region. Its sales in the past three years all crossed the mark of 20 million units and reached more than 23 million in 2023, a year-on-year increase of 11.4%. In North America, unlike Mexico, which also accounted for a large share of the region’s production data, sales were almost exclusively within the U.S., with less than 2 million units sold in both Mexico and Canada. In the Central and South American region, sales were between 3.8 million and 4.1 million units, a slight increase of about 2.8% over the previous year. Brazil alone accounted for more than half of the region's sales, followed by Argentina and Chile with only about 300,000-400,000 units, respectively. Sales in Chile and Colombia both contracted by almost 30%.
Asia-Pacific/Oceania/the Middle East are the world's most important automotive sales regions. The overall sales grew from around 44 million units in 2021 to more than 50 million units, a year-on-year increase of 10.2%. The region alone accounted for about 55% of the global sales. The top 5 countries with the highest car sales were China (more than 30 million units), India (more than 5 million units), Japan (nearly 4.8 million units), South Korea (about 1.8 million units), and Australia (about 1.2 million units). Among these five countries, the year-on-year ratios of China, Japan and Australia were all over 12%. It is worth noting that the sales of ASEAN countries declined marginally by 0.1%, with only the Philippines, Malaysia and Vietnam showing growth of 16.4%, 9.2% and 2.6% respectively, while the other ASEAN countries were all in a decline. In the Middle East, Saudi Arabia, the UAE and Israel all posted sales growth of more than 20%.
Africa's sales, similar to its production, reached only about 1 million units in size, with a slight decrease of 2.4% year-on-year in 2023. South Africa alone accounted for more than half of the region’s total sales, and its sales in 2023 were up slightly by 3.4% year-on-year. Morocco and Egypt, which rank 2nd and 3rd, had sales of only 160,000 and less than 100,000, respectively, making their market sizes less influential.
Overall, Europe's automobile sales growth was significantly higher than those of the Americas and Asia, but all these three regions showed growth, with only a small contraction in Africa. This shows that in 2023, the automobile sales activities in Europe, America and Asia continued to be active.

Table 2. Registrations or Sales of New Vehicles - All Types
According to the aforementioned data, the current global automobile production and sales still maintain a trend of positive development, and if the general environment does not change and there are no other major external factors to make any impact, the 2024 global automobile production and sales should be very likely to approach or even exceed the 100 million units mark.
In recent years, many Chinese, Japanese, European and American automakers have started to invest more resources in R&D of new vehicle models (such as electric vehicles, hybrid vehicles, new energy vehicles, etc.) in the hope of stimulating consumers' desire to buy and stimulating the market. Coupled with the fact that the average replacement cycle of automobiles is generally around 5-10 years, it is estimated that with the support of these favorable factors, automotive peripheral related components and fastening components suppliers should also be able to get some orders under the trend of growing demand.
Copyright owned by Fastener World / Article by Gang Hao Chang, Vice Editor-in-Chief
Vietnam is located in the eastern part of Indo-China Peninsula, bordered by the Gulf of Tonkin and the South China Sea in the east and south, Yunnan and Guangxi in the north, and neighboring Laos and Cambodia in the west, with an area of 330,000 square kilometers, a coastline of more than 3,200 kilometers, and a population of more than 90 million people. Vietnam had been in a state of prolonged war since the mid- 20th century, and only after the reunification of North and South Vietnam did the country gradually recuperate. Due to the prolonged period of war and communist dictatorship, Vietnam seriously lacks the conditions for the development of the automobile industry, and the technical basis for the R&D of the automobile industry and its production is very weak. Before the reform and opening up, the demand for automobiles in Vietnam mainly relied on the import of complete vehicles from the old Soviet Union or chassis from the former East Germany, which were assembled into medium- and large-sized passenger cars in the factories in Hoa Binh, Ba Dinh, Nam Ha, Hai Phong, Da Nang, and so on. After the dissolution of the Soviet Union and the unification of East and West Germany, Vietnam lost its original source of imports. In order to ensure the supply of the domestic automobile market, the Vietnamese government formulated a policy to allow foreign investors to set up automobile assembly plants in Vietnam, and approved the establishment of two automobile plants, namely, the Korean-Vietnamese joint venture Vietnam Mekong Automobile and the Japanese-Korean-Vietnamese joint venture Vietnam Motors Corporation (VMC), gradually forming the Vietnamese automobile industry.
In 2023, Vietnam reported the ownership of 930,000 vehicles, of which 48% were commercial vehicles & buses and 52% were small and medium-sized passenger cars. As Vietnam's automotive component manufacturing and production capacity is insufficient, most assembly and sales in Vietnam are completed by international brands, and automotive component manufacturers are mostly foreign-invested, so most key components for passenger cars, commercial vehicles, or trucks have to rely on imports.
In recent years, the rapid economic growth, expanding domestic demand, coupled with the signing of tariffs and economic & trade agreements with a number of countries, have made Vietnam the core of the economic development of ASEAN, and the investment in the automotive industry is vibrant. In addition to the local car manufacturers like VinFast and Thaco actively expanding their production, Korean Hyundai and Vietnam's local car manufacturers also launched a joint venture to produce cars. Especially since January 2018 ASEAN have abolished the tariffs on automobiles, imported cars and components from Thailand and other ASEAN countries will lead to the risk of decline in Vietnam's automobile & components industry. The Vietnamese government has actively cultivated the market for strategic vehicle types, developed the peripheral industries and expanded the integration of resources for the OEMs to plan and at the same time, actively plan for the construction of steel mills and large-scale automobile factories.
Vietnam has reduced its import tariffs on automobile components since January 2008. It has reduced the tariff rates on both small passenger cars with 5-7 seats and automobile components with more than 16 seats by 3-5%, making the new rate for the former to be 20-25% and that for the later to be 13-17%. According to the development of Vietnam's automobile industry, Vietnam's automobile tariff will decrease year by year. Vietnam's automobile tariff for ASEAN was 50% in 2014, 35% in 2015, 20% in 2016, 10% in 2017, and down to zero after 2018 onwards. The imported automobiles caused an impact on the automobiles manufactured in Vietnam, and a lot of automobile manufacturers dared not to invest in them hastily. In order to avoid the risks brought about by the tariff decrease year by year and improve Vietnam's automobile assembly & domestic components production, manufacturers suggest that the government should formulate relevant industrial policies.
The Vietnamese government insists on making the automobile industry the focus of industrial development, hoping to increase the proportion of automobile parts production and vehicle assembly & domestic production. In response to the demand of automobile manufacturers, the import tariff rate of complete automobiles has been lowered several times in order to stimulate the production and assembly of automobiles in the country, and at the same time, in order to support the development of the
automobile industry, the automobile industry has been classified as a highly protected industry, and has been protected by high tariffs, including the import tariffs and special consumption tax. In accordance with the ASEAN FTA and Vietnam's commitment to trade liberalization, the government has prepared countermeasures. The Ministry of Industry and Commerce of Vietnam proposes to develop Vietnam's automobile industry with tax policies, pointing out that large-sized enterprises should be encouraged to develop the automobile industry on the basis of equal and non-discriminatory manufacturing between domestic and foreign enterprises, and that automobile production and components manufacturers should develop peripheral industries to deepen their integration into the global value chain of the automobile industry.
Many automobile assemblers & manufacturers continue to ask the government for rental tax incentives. The automobile manufacturing industry is one of the industries that enjoy rental tax incentives and preferential policies on the acquisition of land for the establishment of factories. The Ministry of Finance, in coordination with the Ministry of Commerce and Industry, has reported to the Central Government for approval and formulated preferential policies for automobile investment and production, including the implementation details of the Special Consumption Tax Law on Automobiles.
In 2018, Vietnam was required by the ASEAN Trade in Goods Agreement (ATIGA) to remove import tariffs on ASEAN automobiles and completely open up the domestic automobile market, which, coupled with the implementation of the ASEAN FTA and a considerable amount of local demand, may attract more international automobile manufacturers to move in.
Vietnam encourages leading international automobile manufacturers to set up their presence in the Vietnamese market. In order to prepare the Vietnamese domestic industry for early response, the Ministry of Industry and Trade (MOIT) has proposed a policy to help Vietnam's automobile industry to improve its competitiveness, according to which Vietnam will impose high tariffs on the import of luxury automobiles, encourage local enterprises or joint ventures to engage in the production of automobile parts or complete build unit (CBU) in the country, and reduce import and export tariffs . The Vietnamese government has adjusted its policy on the automobile and component industries in the direction of reform, opening up and internationalization. The Vietnamese government hopes to develop automobiles as an important industry that can meet the country's domestic demand and enter the ASEAN region and international markets.
Vietnam's automotive industry is mainly concentrated in two major economic zones. One is centered on the capital city of Hanoi, Tra Noc 1st Industrial Zone in Can Tho City of southern Vietnam,
including Taiyuan and Hai Phong, etc., and the other is centered on Ho Chi Minh City, including Dong Nai Province, Binh Duong Province, and the Thanh Hoa assembly base, etc. These two economic zones are located near ports with convenient transportation and play as north-south logistics centers. People there have higher income levels and higher spending power, while the two major industrial clusters have many large-scale state-owned traditional machinery manufacturing companies and better resources for skilled labor and technology, so leading automobile manufacturers have chosen them to set up production or sales bases, forming automobile industrial clusters.
In order to encourage automobile manufacturing, assembly and production of automobile parts, the Vietnamese government has integrated resources and allocation of parts in 3 major economic regions and nearby areas, including North Vietnam (Hanoi, the economic delta of Hải Phòng & Ninh Bình provinces), Central Vietnam (Da Nang City, Khánh Hoà), and Southern Vietnam (the automotive cluster consisting of 4 economic regions (including Hồ Chí Minh City, Bà Rịa - Vũng Tàu, Đồng Nai, Binh Duong), and Phố Cần Thơ).
In order to increase the proportion of domestic production of automobiles, the Vietnamese government has implemented a series of measures, including low-interest loans and preferential tax policies for domestic manufacturers, setting import tax rates based on different components to replace the original Complete Knock Down (CKD) import tax, proposing a preferential mechanism for the manufacture of automobile engines, transmissions, and the production of specialized and general automobile projects, etc., and expanding the export of automobile components to neighboring countries and regions. Most key components such as engines, transmissions, chassis and suspension are imported. Figure 1 shows the main automotive industry clusters in Vietnam.

Source: britannica and ITRI IEK (04/2024)
Vietnam's leading automobile-related manufacturers, including Vinamotor, Veam, Vinacoal, and SAMCO, invest in the manufacturing and assembly of automobiles and related components, with Vinamotor focusing on the manufacturing & assembly of passenger cars, small & medium-sized trucks, cars, engines, gears and transmission modules, Veam engaged in the manufacturing and assembly of passenger cars, small
and medium-sized trucks, engines, gears and transmission system components, Vinacoal manufacturing and assembling medium- and large-sized trucks, specialty automobiles and ancillary components; and SAMCO manufacturing and assembling passenger cars and producing automotive components.
According to the statistics of the Ministry of Industry of Vietnam, more than 30 manufacturers (mainly in the north of Vietnam) have been authorized to import automobile components for the production of automobiles, and almost all of the imported automobile components come from China. 11 models of Chinese automobiles are assembled in the region. There are a total of 25 automobile sales agents in North and Southwest Vietnam, representing 9 Chinese branded vehicles (mainly trucks with a load capacity of 700 kilograms to 2.5 tons and medium-sized passenger cars with 8 to 29 seats).
There are more than 200 automobile component manufacturers in Vietnam, many of which are SMEs. The Vietnamese government has proposed a target of having at least 40% of automobile components produced locally in 2005 and 60% in 2010, but the proportion by the end of 2023 only reached 33.1%, showing the supply chain of Vietnam's automotive industry is still not self-sufficient, even for joint-venture manufacturers, as high as 70.5% of passenger cars/large passenger cars or buses produced in Vietnam still rely on imported components.
Many well-known manufacturers have operations in Vietnam that produce automotive components, such as Japanese Denso, GS (batteries supplier), Sanyo, Yokohama, and Korean Kymbo, which mainly manufacture plastics, rubber parts, connector parts, screws, gas pedal or other metal machined parts. The development of Vietnam's automotive and components industry is mainly characterized by several phenomena. The first is its weak research capabilities and the metallurgy, materials, electronics, chemicals, machinery and other industries highly related to the automobile industry are underdeveloped, so most rubber/plastic, body panels and tires and other components, and main key components like engines, transmissions (MT/AT), brake servo systems, etc. still rely on imports, the second is the lack of senior technicians and R&D capabilities, and the third is the lack of after-sales service, market research, study & info collection capabilities, and the transportation infrastructure is incomplete compared to other ASEAN countries (e.g., Thailand, Malaysia, Indonesia, etc.).
Vietnam's automotive and components industry is searching for development strategies. In recent years, Vietnam has been actively expanding export business for some automotive components by virtue of the advantages of cheap labor, etc. Due to the stagnation of Vietnam's domestic demand, the automotive and its related components industry has not been able to develop smoothly. However, with the emergence of the ASEAN countries, Vietnam has been regarded as a production and export base for exporting to ASEAN countries or Japan, and the number of related automotive components manufacturers has
increased significantly, though a higher proportion is engaged in the manufacture of low value-added plastic components.
Vietnam's automotive component manufacturers can only produce simple parts, mainly rear-view mirrors, seat cushions, batteries, etc., whose added value is low and most of them have not reached an economic scale. Vietnam's automotive component manufacturers, due to the fact that the local motorcycle industry is more developed and the market size is larger, are mainly engaged in the manufacturing of motorcycle components, supplemented by automotive components. Under the above development, most key components rely on imports, but due to the impact of the increase in import tariffs, the sales price of automobiles remains high, and the vast majority of foreign-invested manufacturers do not conduct R&D and production in Vietnam, resulting in the slow progress of technology transfer.
According to the statistics of Vietnam Automobile Manufacturers Association (VAMA), due to the weak manufacturing capacity of Vietnam's automobile industry caused by the prolonged civil war, there are 13 automobile joint-venture factories, which mainly import bulk parts in the form of full-knockdown and semi-knockdown (SKD). Most of them import chassis from China, S. Korea, and the Soviet Union.
According to MarkLines statistics, the automobile sales of Vietnam in 2023 reached 276,000 units, the sales of Hyundai Thanh Cong Vietnam (HTCV), a local corporation of Hyundai Motor not included in VAMA, were 20,000 units, and the total sales were 296,000 units (including 61,000 passenger cars of all types, 153,000 MPV and SUV), 20,000 pick-up trucks and vans, 34,000 trucks, and 0.8 million buses & large trucks, etc. Figure 2 is the sales volume of various types of vehicles in 2023 in Vietnam. Figure 3 is a comparison of the market share of passenger cars of Vietnam's leading car manufacturers in 2023, including the sales and share of Toyota (21,000 units, 34.2%), Mazda (12,000 units, 19.2%), Honda (11,000 units, 18.2%), Hyundai Group (0.8 million, 13.5%) and Mitsubishi (0.5 million, 8.2%). These top 5 passenger car manufacturers accounted for 93.3% of the total. Figure 4 shows the forecast for the Vietnamese automobile market. With the car sales in 2023 totaling 276,000 units, it is forecast that in 2024 Vietnam's economic growth will continue to increase the domestic demand and the automobile market will reach 328,000 units.
Figure 4. The Forecast for the Vietnamese Automobile Market
Source: Global Trade Atlas; ITRI IEK(2024/04)
Source: MarkLines; ITRI IEK (2024/04)
Figure 5. The Forecast of Import & Export Value of Vietnam's Automotive Components
Vietnam's automobile sales price is 20% higher than those of other ASEAN countries. In addition to the depreciation of Vietnamese dong in recent years, the main reason for this difference is its low capacity, with most of the assembly lines having a capacity of less than 50%. Coupled with the high taxes (including luxury tax) and other factors, Vietnam's automobile component production and assembly is not very profitable, exports are not competitive, and it is difficult to absorb investments, and the high tax system has also limited the development of Vietnam's automobile industry to a certain extent. Most automotive component manufacturers are lagging behind in terms of technology, hardware and software equipment compared to other ASEAN countries, and because Vietnam's automotive market is relatively small compared to Thailand, Malaysia and other countries, resulting in a low willingness of international component manufacturers to enter Vietnam, and the related manufacturing technologies have not been able to introduce or drive the development of the local automotive and component industries.
Figure 5 is the forecast of import and export value of Vietnam's automotive components (HS8708 category), Vietnam's automotive component import in 2013 was valued at 2.40 billion USD, an increase of 7.1% from 2022, which shows the value of imports is greater than that of exports, and it is predicted that, with Vietnam's political and economic stabilization in 2024 and the increase in the domestic market demand, the value of imports will grow to 2.47 billion USD, an increase of 3.0% from 2023. In 2023, the major import origins of Vietnam's automobile components were S. Korea (28.1%), Japan (25.3%), China (18.5%), Thailand (14.4%) and Germany (5.6%), all of which account for 91.9% of the total, as shown in Figure 6
Figure 6. Vietnam's Main Import Origins and Share of Automobile Components in 2023
Source: Global Trade Atlas; ITRI IEK(2024/04)
In 2023, Vietnam's auto component export was valued at US$1.73 billion, up 8.8% from 2022. The trade war between China and the U.S. has led to some manufacturers actively setting plants in Vietnam. Coupled with Vietnam's signing of trade agreements with many countries, the number of auto components made in Vietnam and exported from Vietnam has increased, and the export value is forecast to be US$1.76 billion in 2024, up 2.1% from 2023. Vietnam's main automotive component export destinations in 2023 were Japan (34.3%), China (13.9%), the U.S. (15.2%), Thailand (7.8%), and S. Korea (5.9%), all of which account for 77.1% as shown in Figure 7
Source: Global Trade Atlas; ITRI IEK (2024/04)
Although Vietnam's domestic automobile demand market is not large, Vietnam's economic growth rate has been maintained at 6.5-7.0% in recent years. It is expected that the purchasing power of Vietnamese people will increase rapidly, and the demand for automobile components will continue to grow. Moreover, according to Vietnam’s policy of encouraging domestic car manufacturing, manufacturers investing in Vietnam may be able to respond to the increasing demand for automobile components and obtain relevant (investment or tax) incentives.
Vietnam is a member of ASEAN and has signed FTA with many countries, so it enjoys zero tariff for exporting automotive components to ASEAN countries, making its components more cost-competitive. As automobile sales in advanced countries in Europe, the U.S., and Japan are nearing saturation and the demand is slowing down, the emerging ASEAN countries are about to become the world's 4th largest automobile market, so there is a promising prospect of the demand for automotive components and the market development. Taiwan has invested in more than 10 automobile and motorcycle component factories in Vietnam, but the scale of investment and production is not large, and most of them mainly produce motorcycle components, supplemented by automobile components. Taiwanese automotive industry is characterized by high precision and cost competitiveness in the manufacturing of stamping parts and fasteners. Its automotive components such as electrical systems, braking system components, aluminum alloy wheels, automotive wiring harnesses, brake pads, and lamps, etc. also have gained an important position in the world, and may be able to fill in the gap in Vietnam's automotive component supply chain. It is recommended that Taiwanese manufacturers deploy in the Vietnamese market ASAP in order to seize business opportunities.
Copyright owned by Fastener World / Article by James Hsiao

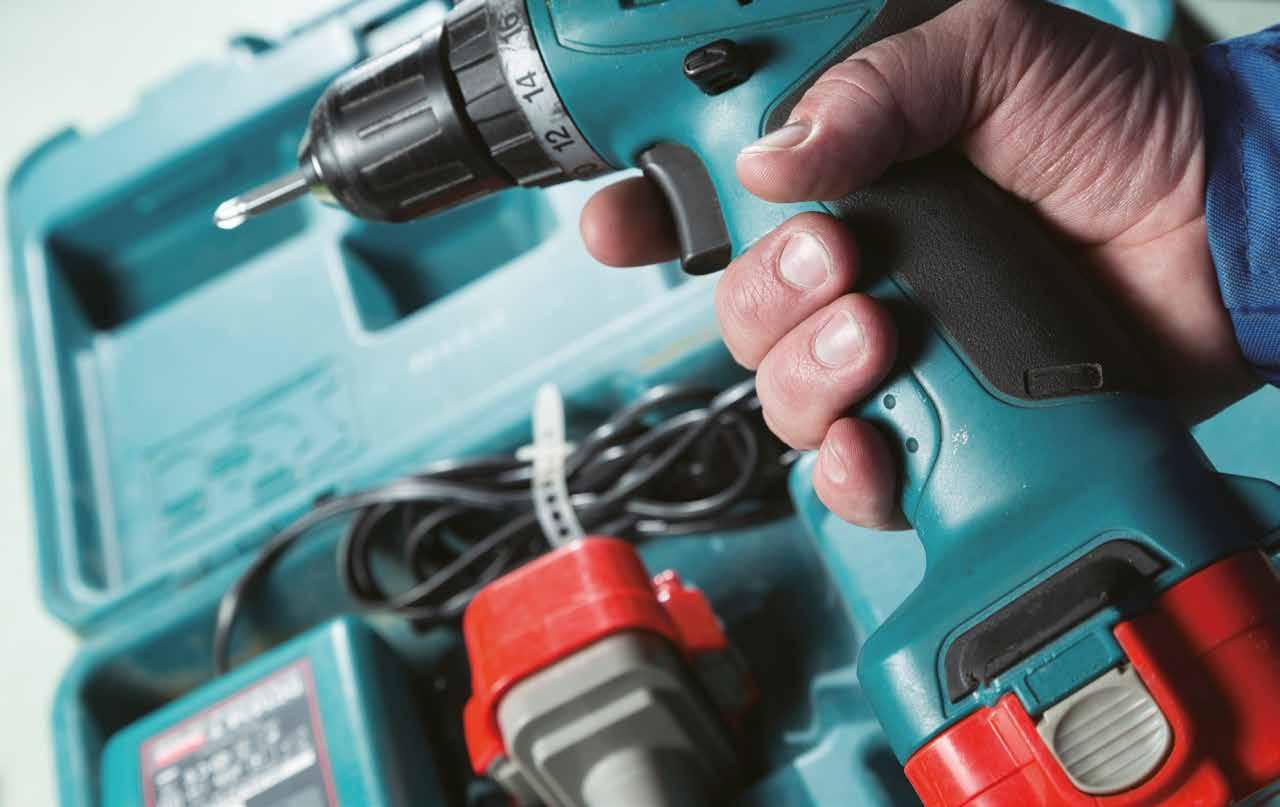
2023美歐台日巴緊固工具進出口統計分析
The amount of fasteners imported and exported often implies the strength of the demand of various industries. The more prosperous the industry is, the greater the demand for fasteners will be, and this will indirectly increase the demand for fastening tools for fasteners. Therefore, by analyzing the latest import and export data from major fastening tool exporting and importing countries, we may be able to see the latest fluctuations in the global demand for fastening tools, and further predict the next changes in the industry's demand. In addition, hardware and tools related exhibitions around the world are ready to welcome professionals from various industries in 2024, showing that the development potential of the tools market is still a major concern for the industry.
In this article, we will analyze the import and export performance of fastening tools (HS codes: 8204, 8205, 8207) from the US, EU, Taiwan, Japan and Brazil in 2023 and the increase/decrease in comparison with the data in 2022, so as to enable readers to understand the trend change of the major categories of fastening tools in certain regions. (Note: The U.S. Department of Commerce only published import and export values, so the weight data are not available).
In 2023, the U.S. imported US$2.956 billion of Interchangeable Tools for Hand Tools Or Machine Tools (HS 8207), US$1.372 billion of Hand Tools, Blow Torches, Anvils (HS 8205), and US$747 million of Hand-Operated Spanners & Wrenches (HS 8204), down 6%, 13.15% and 13.49% respectively from the same period in 2022; the U.S. exported about US$2.047 billion Interchangeable Tools for Hand Tools Or Machine Tools (HS 8207), US$624 million for Hand Tools, Blow Torches, Anvils (HS 8205) and US$316 million for Hand-Operated Spanners & Wrenches (HS 8204), decreasing by 6.7%, increasing by 0.81% and increasing by 12.90%, respectively, from the same period in 2022.
In terms of the import of HS 8204, the top 3 import sources were Taiwan, China and Vietnam. Among the top 10 import sources, the largest decrease was
recorded in India (-19.55%), while the largest increase was recorded in Canada (48.7%); the top 3 export destinations were Canada, Mexico and Japan. Among the top 10 export destinations, the largest decrease was in Australia (-13.58%) and the largest increase was in Saudi Arabia (100%).
In terms of the import of HS 8205, the top 3 import sources were China, Taiwan and Mexico. Among the top 10 import sources, the largest decrease was Japan (-29.01%) and the largest increase was Mexico (11.3%); the top 3 export destinations were Canada, Mexico and the UK. Among the top 10 export destinations, the largest decrease was China (-19.67%) and the largest increase was the Netherlands (36.96%).
In terms of the import of HS 8207, the top 3 import sources were China, Germany and Japan. Among the top 10 import sources, the largest decrease was China (-24%) and the largest increase was S. Korea (23%); the top 3 export destinations were Mexico, Canada and Germany. Among the top 10 export destinations, the largest decrease was the Netherlands (-87.51%) and the largest increase was Mexico (30.06%).
In 2023, the EU imported about 145,000 tons of Hand Tools, Blow Torches, Anvils (HS 8205), 139,000 tons of Interchangeable Tools for Hand Tools Or Machine Tools (HS 8207), and 70,000 tons of Hand-Operated Spanners & Wrenches (HS 8204), down 23%, 5%, and 18%, respectively, from the same period in 2022; the EU exported about 82 thousand tons of Interchangeable Tools for Hand Tools Or Machine Tools (HS 8207), 29 thousand tons of Hand Tools, Blow Torches, Anvils, and other materials (HS 8205), and 10 thousand tons of Hand-Operated Spanners & Wrenches (HS 8204), representing decreases of 10%, 7%, and 7% from the same period in 2022, respectively.
In terms of the import of HS 8204 (by weight), the top 3 import sources were China, Taiwan and India. Among the top 10 import sources, Hong Kong experienced the largest decrease (-49%), while S. Korea experienced the largest increase (22%); the top 3 export destinations were the USA, the UK and Switzerland. Among the top 10 export destinations, the largest decrease was Belarus (-15%) and the largest increase was Ukraine (34%).
In terms of the import of HS 8205 (by weight), the top 3 import sources were China, Taiwan and India. Among the top 10 import sources, the largest decrease was Vietnam (-37%) and the largest increase was Hong Kong (4%); the top 3 export destinations were the UK, the U.S. and Switzerland. Among the top 10 export destinations, the largest decrease was Russia (-25%) and the largest increase was Turkey and Ukraine (36%).
In terms of the import of HS 8207 (by weight), the top 3 import sources were China, S. Korea and Turkey. Among the top 10 import sources, the largest decrease was Taiwan (-36%) and the largest increase was the UK (47%); the top 3 export destinations were the U.S., Switzerland and the UK. Among the top 10 export destinations, the largest decrease was the UK (-25%) and the largest increase was Mexico (13%).
(in EURO), in descending order according to weight of 2023
HS 8204 Hand-Operated Spanners & Wrenches
HS 8204 Hand-Operated Spanners & Wrenches
Source: EU Trade Helpdesk
In 2023, Taiwan imported about 7,699 tons of Fastening Tools (HS 8205), 6,929 tons of Interchangeable Tools for Hand Tools Or Machine Tools (HS 8207) and 5,686 tons of Hand-Operated Spanners & Wrenches (HS 8204), decreasing by 19.88%, increasing by 6.06% and decreasing by 25.59%, respectively, compared with the same period in 2022; Taiwan exported about 79 thousand tons of Hand Tools, Blow Torches, Anvils (HS 8205), 75 thousand tons of Hand-Operated Spanners & Wrenches (HS 8204), and 13,000 tons of Interchangeable Tools for Hand Tools Or Machine Tools (HS 8207), representing decreases of 22.29%, 14.61%, and 12.64% from the same period in 2022, respectively.
In terms of the import of HS 8204 (by weight), the top 3 import sources were China, Vietnam and Japan. Among the top 10 import sources, Germany showed the largest decline (-54.2%), while Taiwan showed the largest increase (94.21%); the top 3 export destinations were the U.S., China and Russia. Among the top 10 export destinations, the largest decrease was China (-40.89%) and the largest increase was Indonesia (37.2%).
In terms of the import of HS 8205 (by weight), the top 3 import sources were China, Vietnam and Japan. Among the top 10 import sources, the largest decrease was Germany (-34.29%) and the largest increase was the Netherlands (140.91%); the top 3 export destinations were the U.S., Japan and Germany. Among the top 10 export destinations, the biggest decline was the Netherlands (-28.11%) and the biggest increase was Russia (20.49%).
In terms of the import of HS 8207 (by weight), the top 3 import sources were China, Japan and Vietnam. Among the top 10 import sources, Germany showed the largest decrease (-40.89%) and Canada showed the largest increase (7,488.56%); the top 3 export destinations were the U.S., China and Japan. Among the top 10 export destinations, Germany showed the largest decline (-37.22%) and Mexico showed the largest increase (367.05%).
in descending order according to weight of 2023
Source:
In 2023, Japan imported about 57,000 tons of hand tools (Japan P.C. Code 61705), a decrease of 14.94% from the same period in 2022. In terms of value, Japan imported about 165.5 billion yens of hand tools, a decrease of 9.37% from the same period in 2022; Japan exported 67,000 tons of hand tools (Japan P.S. Code 61511), a decrease of 0.88% from the same period in 2022. In terms of value, exports amounted to 414.2 billion yens, a decrease of 1.13% from the same period in 2022.
In terms of weight, the top 3 import sources were China, Taiwan and S. Korea. Among the top 10 import sources, the largest decline was Switzerland (-91.08%) and the largest increase was Thailand (13.04%); the top 3 export destinations were the U.S., Mexico and China. Among the top 10 export destinations, the biggest decline was Indonesia (-39.69%) and the biggest increase was Mexico (300.85%)
Japan in descending order according to weight of 2023
Source: Ministry of Finance, Japan
In 2023, Brazil imported about 17,000 tons of Hand Tools, Blow Torches, Anvils (HS 8205), 14,000 tons of Interchangeable Tools for Hand Tools Or Machine Tools (HS 8207), and 11,000 tons of Hand-Operated Spanners & Wrenches (HS 8204), up 11%, 9% and nearly 1% respectively over the same period in 2022; Brazil exported about 5,863 tons of Interchangeable Tools for Hand Tools Or Machine Tools (HS 8207), 2,058 tons of Hand Tools, Blow Torches, Anvils (HS 8205), and 976 tons of Hand-Operated Spanners & Wrenches (HS 8204), down 3%, 23%, and 9%, respectively, from the same period in 2022.
In terms of the import of HS 8204 (by weight), the top 3 import sources were China, India and Taiwan. Among the top 10 import sources, Hong Kong showed the largest decline (-71%) and Japan showed the largest increase (19%); the top 3 export destinations were Bolivia, Paraguay and Argentina. Among the top 10 export destinations, the largest decrease was Bolivia (-24%) and the largest increase was Dominica (115%).
In terms of the import of HS 8205 (by weight), the top 3 import sources were China, India and Hong Kong. Among the top 10 import sources, the largest decline was Colombia (-52%) and the largest increase was China (14%); the top 3 export destinations were Bolivia, Peru and Paraguay. Among the top 10 export destinations, the largest decline was Saudi Arabia (-81%) and the largest increase was Mexico (63%).
In terms of the import of HS 8207 (by weight), the top 3 import sources were China, Sweden and S. Korea. Among the top 10 import sources, the largest decline was Sweden (-26%) and the largest increase was Brazil (2779%); the top 3 export destinations were Mexico, the U.S. and Argentina. Among the top 10 export destinations, the largest decline was Argentina (-70%) and the largest increase was South Africa (3,383%).
in descending order according to weight of 2023
HS 8204 Hand-Operated Spanners & Wrenches
8205 Hand Tools,
Looking at the performance of the top 3 trade partners in each region, we can observe a few trends:
The U.S. : reduced import and increased export
Japan : reduced import and increased export
The EU : reduced import and export
Taiwan : reduced import and export
Brazil : no significant trend of increase or decline
It is worth noting that the U.S. and Japan's fastening tool export growth is clearly concentrated in Mexico.
Affected by the general environment and the impact of relevant external factors, the global import demand for fastening tools generally declined; however, the economy is continuously fluctuating, so it is estimated that in the future, after the bottoming out of various industries and the subsequent rebound, the resulting cascade effect should be able to synchronize the demand for fasteners and fastening tools.
Copyright owned by Fastener World Article by Gang Hao Chang, Vice Editor-in-Chief
屋頂螺絲概要
Although metal has been a material option for roofs for hundreds of years, because of challenges posed by high cost, lousy appearance, and poor longevity, it has only recently become a feasible mainstream choice. In fact, today in the United States metal roofing represents one of the fastest growing areas in the residential roofing segment. It is now possible to choose from a selection of metal roofing solutions that either provide large, continuous panels or metal alternatives to traditional roofing materials such as slate, tiles, shakes, and shingles in attractive designs and at affordable prices. Although some of these solutions are more expensive in the short-term than their traditional roofing options, their superior durability and life expectancy makes them a smarter long-term investment. Of course, like any roofing material they must be securely fixed to the roofing substructure to protect the interior spaces below. Since metal roofing solutions exhibit their own unique qualities and challenges, many of these solutions require special or different fasteners from nails and staples used with traditional roofing solutions. As metal roofing has grown then, so has the need for innovation and engineering in the fasteners for this market space.

Metal roofs can be classified into three distinct categories: Exposed Fastener Panel Type, Standing Seam Type, and Specialty Panel Type.
• Specialty Roofing Panels: These include both small and large metal panels that have been fabricated to reproduce the look of ceramic tile, slate, shakes, and shingles (See Figure 1). Just like the items they are made to mimic, the panels are fastened at their top and the attaching fasteners subsequently hidden by the next panel above. These types of systems normally do not require specialty fasteners and often use the same or similar fasteners to the ones utilized by the traditional products they replace.
• Standing Seam Systems: Standing Seam roofs are connected to the roof substrate by hidden clips. These clips are screwed to the substrate, often with special low profile head screws, but without regard to special sealing because the screws are covered with the roof panel and thus not vulnerable to water intrusion and exposure (See Figure 2). Panels are interlocked together at the seams. Metal roofs undergo considerable expansion and contraction from changing heat and cold conditions. Because a Standing Seam Roof essentially “floats” over the roof substrate there is no limitation in the length of the roof panel, and they often are seamless and uninterrupted. Standing seam roofs cost more to install but have a cleaner look and, more importantly, last longer.
• Exposed Fastener Systems: Exposed Fastener System roof panels are installed directly into the roof understructure and are the most economical of all the metal roofing types (See Figure 3). The fasteners must be able to pierce the metal roofing panel and self-tap into the supporting understructure.
• For this reason, there are different versions for wood and metal connections. Since the fasteners are exposed on the surface of the roof, they must also have the capability to seal the penetration from water intrusion. The screws used in this method normally possess an external hex flange or washer head with a bonded EPDM or Neoprene washer. The heads and washers are usually painted to match the color of the roofing panel. When properly installed the washer is compressed to form a tight seal around the roof penetration. Since the panels are constrained by the fasteners holding them down and the metal panels undergo significant expansion and contraction with temperature changes, roof panels are usually limited to no longer than about twenty-five feet (about eight meters) in length. Therefore, they may be overlapped over long spans.
Figure 1: Metal Roof Made to Look Like a Tile RoofToday there are a variety of material choices. When properly installed some of these materials are known to last a hundred years or more.
• Steel: Steel is the strongest and least expensive metal roofing material. It is usually galvanized or coated with an AluminumZinc alloy called Galvalume and then painted. Steel roofing panels will generally last 30 to 50 years.
• Aluminum: Aluminum is lighter, softer, and more expensive than steel but will withstand the elements better than steel, especially in areas of salt air or acid rain. Aluminum roofing panels are almost always painted and will last 30 to 50 years.
• Copper: Copper is the longest lasting, most expensive, and perhaps most attractive of the metal roofing material choices. Copper forms a natural patina over time and copper roofs have been known to last up to 200 years.
• Terre: Terre used to refer to a roof made of tin with a lead coating. Today it is stainless steel that is sandwiched between layers of tin. It does not hold paint but can last more than one hundred years.
• Zinc: Zinc is often alloyed with Titanium for added strength and corrosion. It will last 80 to 100 years.
Although all three metal roof types exhibit application challenges, the exposed fastener system exhibits the greatest challenge related to the fasteners. Thus, purchasers of these systems must wrestle with the question of whether the added cost for premium longer lasting solutions is justified while installers must be very careful and intentional about how they install the fasteners that are specified. To perform properly, some of the fastener challenges that must be overcome with exposed fastener systems are:


• Condition of the Seal: The screw must be able to cleanly penetrate the metal panel and generate an effective and long-lasting seal. Screws that are installed off-angle, under tightened, or over tightened may upon installation or over time begin to leak. Thus, a successful roof seal is not only a function of how well the installer seats the screw but often also a function of the screw design, quality of manufacture, and type of sealing element.
• Sealing Material: Sealing washers come in two varieties and two different materials, bonded and non-bonded washers and EPDM (Ethylene Propylene Diene Monomer) and Neoprene materials. A bonded washer is one where the rubber gasketing material is bonded (adhered) to the bottom of a slightly beveled metal washer (See Figure 4). The ID and OD of the rubber gasket are slightly smaller than those of the metal washer it is attached to. This provides an overhang at the outer edge protecting the gasket from UV rays and a small amount of interference from the ID to retain the washer to the screw and to guarantee a tight seal around the screw itself. During installation, the bevel in the metal washer flattens providing an even stress distribution across the surface of the rubber washer. This prevents the screw head from embedding into the washer and squeezing out at its periphery. This is particularly advantageous because when overtightened the rubber gasketing material will want to creep away from the ensuing stress concentration which contributes to loss of clamp load and sealing capability. Bonded washers can also be larger in diameter because the metal washer is able to distribute pressure over its entire area. This provides a greater sealing area and makes it harder for water to penetrate the roof panel. Non-bonded washers are limited in diameter by the size of the bearing diameter of the hex flange or washer head or, when utilized, a head cap. Both EPDM and Neoprene are good choices for roof sealing, although EPDM is considered superior since it has better heat, light, and ozone resistance than Neoprene.

• Embrittlement of the Sealing Material: One of the challenges of using Neoprene and EPDM sealing material is vulnerability to environmental exposure. These materials are susceptible to temperature changes and get stiffer in the cold and creep in the heat.
Figure 2: Example of a Standing Seam Roof Figure 3: Installation of Exposed Fastener Metal Roof System• Prolonged exposure to such temperature cycles eventually weakens the gasketing material. Worse than the temperature cycling, however, is the exposure to UV radiation. These materials are embrittled by UV rays so that the unprotected periphery that is exposed ultimately breaks down and potentially opens pathways for water intrusion.
• Damage to Sealing Material: Burrs and debris that are created when the screws pierce the roofing panel can tear the gasketing material creating pathways for water intrusion. It is important, therefore, that the screws be designed with sharp and efficient piercing points that either prevent or minimize the creation of burrs.
• Corrosion and Head Appearance: Exposed screws must be durable so that they do not corrode while in service. Screws that begin to rust will, in the best case, be unsightly against the uncorroded roof panels but, in the worst case, begin to weep and leave streaks or stains of rust from each fastener. Additionally, care must be taken in proper fastener material selection to prevent negative galvanic interactions with some of the roof panel material types. Galvanic corrosion can result not only in corrosion to the fastener, but depending on the metal pairing, to the roof panel. Once again, this could result in unsightly corrosion but also damage to the roof panel around the screw, opening leak pathways (See Figures 5 and 6). Head appearance is also important and usually screws are painted to match the color of the roofing panels. Not all paint is the same, however, with liquid applied paint being far less durable than powder coated paint. Paint type is important because paint methods that provide poorer adhesion may be vulnerable to damage during installation which can lead to premature corrosion.


• For Wood Applications: Screws for wood applications may be made of either hardened carbon steel or stainless steel. Naturally, the stainless steel variety has superior corrosion resistance to those made of carbon steel. However, the austenitic grades of stainless steel make poor choices for self-drilling or self-piercing points. Therefore, many of these roof screws may be made of the stronger but poorer corrosion resistant 410 martensitic stainless steel. Screws for wood to metal applications usually have either a sharp Type #17 point or a small #1 drill point. In either case, the point provides sufficient piercing capability to make it through the thin roofing panel but not enough strength to pilot holes in thicker metal trusses and purlins. These screws are usually Hi-Lo or spaced high-thread styles of threads for easy tapping into wood. Head styles are shared between wood and metal applications with the most common head form being hex flange or washer head varieties.
• For Metal Applications: Screws for metal applications are usually either hardened carbon steel or bi-metallic. Since stainless steel does not perform well in drilling through thicker metal, screws entirely made of stainless steel are seldom used in these applications. Instead drill point screws made of carbon steel are most common. There is a drill screw variant, however, that is bi-metallic with the upper body and head made of stainless steel and the drill point and thread forming zone made of hardened carbon steel. These are produced by friction welding the two materials together. The lower half is hardened carbon steel and houses the drill point and thread forming threads while the upper half is stainless steel and houses the upper threads and head. Screws for metal applications usually come with either a #3 or a #5 drill point. The #3 point is capable of self-drilling thicknesses up to 0.210” and a #5 capable of 0.500” thick material. Like screws for wood applications the heads are usually either a hex flange or hex washer head design.
• Non-Bonded: A Non-bonded sealing washer is simply a washer of EPDM or Neoprene. It can be slipped onto the screw and retained by making the ID of the washer a little smaller than the OD of the screw. These washers perform similarly to an O-ring except that the cross-sectional geometry of these washers is not narrow and round like an O-ring but flat and rectangular like a flat washer. These washers rely on the underhead bearing surface of the screw to distribute load and compress them. With the head of the screw providing the only protection from exposure, they are more prone to potential embrittlement from UV rays.
• Bonded Washers: A bonded washer adheres the EPDM or Neoprene washer to the underside of a flat or slightly beveled metal washer. The metal washer is slightly larger in OD and ID, so that the smaller rubber washer ID retains it to the screw and the slightly larger OD of the metal washer protects the rubber washer underneath from most UV exposure as well as providing more evenly distributed compression. Naturally, bonded washers are more expensive than the non-bonded variety. However, neither is completely effective in protecting the rubber washer from exposure to the elements and, most importantly, from UV radiation.
• Capped Heads: Although technically not a washer, there are some premium roofing screws that have added a zinc-aluminum alloy or stainless-steel cap to the head. These oversize caps serve not only to improve the corrosion resistance of the hardened carbon steel screw below, but they fit over the rubber washer completely encapsulating it from the surrounding environment. In this way it is pretty well protected from the elements and far less prone to embrittlement.
Figure 5: Example of Corrosion to the Roof Panels Around the FastenerIncreasingly solar panel installations are being made on residential and commercial buildings these days. Although the screws associated with mounting these solar voltaic panels are completely independent of the screws used to fix the roofing panels, it is worth a mention here. Like roofing panels, roof mounted solar panels must be firmly fixed to prevent them from being damaged or torn off in a storm or by gusting winds. Therefore, the panels are fixed to a framework of mounting rails. These rails must be rigidly fixed to the structural underbody of the roof. The screw systems that typically make up this mounting hardware are a sophisticated combination of screw, sealing washer, bracket, and mounting nut (See Figure 7). Like the roofing screws described above, the screws in these systems are also designed with self-tapping threads and self-piercing or self-drilling points to effectively work in wood or steel. Although usually much larger in diameter than the screws for fixing roofing panels, these screws often are bi-metallic to provide hardened carbon steel on the portion of the fastener going into the roof substructure and stainless steel for the portion extending above the surface of the roof. Like the exposed fastener screws, these fasteners have a sealing washer to seal the roof penetration from water intrusion.
Exposed metal roofing screws, although simple in concept, must address multiple challenges. Like many similar fastening situations, there are multiple choices for a user to make, and various levels of performance that can be achieved. The user, therefore, must educate themselves on whether it is wiser in the long run to purchase a more premium fastener for the initial installation and avoid potentially costly rework later in the life of the roof or use less costly fasteners to ease the cost of roof installation. In any event though, there are many choices and those producing, purchasing, and installing these fasteners should know a little bit about them to be able to make the most informed choices on how to proceed.





 Copyright owned by Fastener World / Article by Laurence Claus

容克試驗適用性的爭論
Copyright owned by Fastener World / Article by Jozef DominikC. O. Bauer: “There is no universal method for locking bolted joints that would be equally effective against all types of stress”
From the above mentioned facts arises the legitimacy of the quotation from the initial part of this article. Every type of bolt connection loading requires a specific securing method. Therefore, there are various laboratorial test methods (Fig. 1) and that’s why:
There is no universal method of testing bolted joints that would be equally relevant against all types of stress.
1. A - cyclical radial loading (as in Fig. 7); B - cyclical axial loading; C - shaking


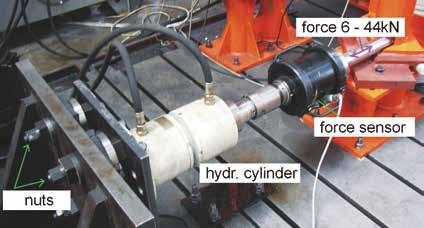
The principle A according to “DIN 65151:2002-08 - Dynamic testing of the locking characteristics of fasteners under transverse loading conditions (vibration test) ”, known as Junker test is based upon cyclical radial loading shifting at specific frequencies and amplitudes. Type B (Fig. 3) is an axial pulsator and type C is clearly a vertically or horizontally oriented vibrational method in accordance with NAS 3350/3354, USA. Illustrative results from method A are shown in Fig. 4a schematically and in Fig. 4b for real.
As mentioned, every kind of loading requires a specific way of securing and it is also proved in Fig. 5, where the evaluation of efficiency of the most commonly used securing elements is introduced.
Fig. 5 shows several typical securing elements to prevent loosening of screw connections during operation which are also used in practice. But as the C. O. Bauer quote at the top of this article, there is no universal way of securing them either. This is clearly illustrated in Fig. 6 for example.
Fig. 6 demonstrates the striking differences in the resistance of the same wedge washers to individual types of test methods. While it shows an excellent insurance effect according to the Junker test (radial stress - Fig. 7), it does not comply with the EDYZ or especially with NASA test. This confirmed that the Junker test cannot be considered as a universal method for testing bolted joints. Logically, it cannot be suitable for the design case in Fig. 8 for example.
Fig. Fig. 2. Junker test - method A Fig. 3. Axial pulsator – method BFig. 4a. Schematic results from method A
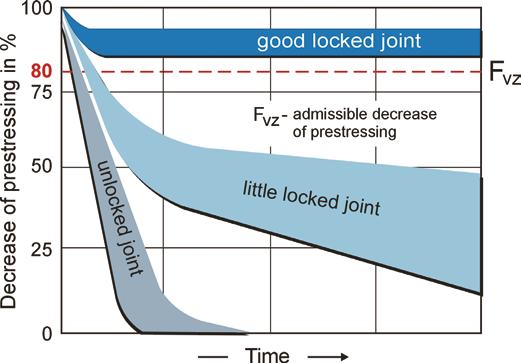
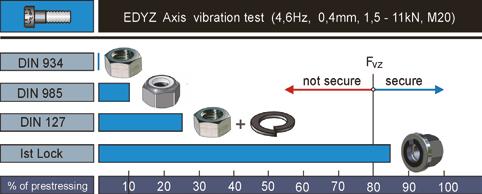
Fig. 4b. Real results from method A

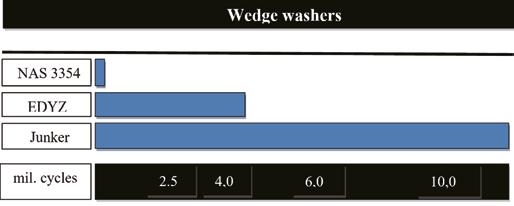
For the final decision it is important to take into account all parameters for characteristics of the individual securing elements and to define their degree of importance to choose the optimal solution. It is important to appoint the correct evaluation criteria. The only correct criterion for choosing a testing method is the matching of the type of stress. After all, it cannot be correct to use the test method based on cyclic radial loading for structural nodes stressed in the axial direction.

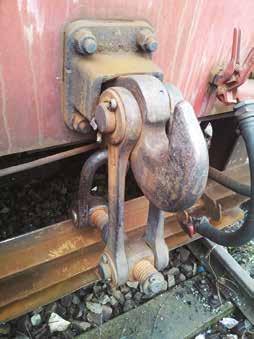
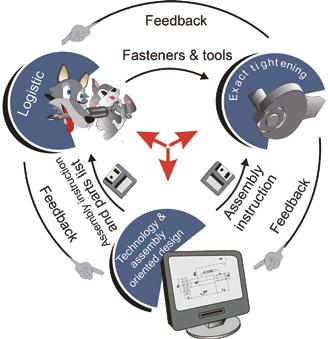
The generally accepted Junker test has been unfortunately uncritically accepted as a universal method of testing bolted joints. Over time, it was even included in the DIN standard. However, as shown, it only applies to specific radial stress cases. In practice there are many other types of stress where the use of Junker test is not appropriate. As shown, there are other testing methods for such cases. It is the designer's job to recognize this and make the right decisions. It is important not to succumb to mindlessly bombastic advertising. Designers should be extremely wary of such commercial advertisements. It is their duty. Logistics must respect the designer's decisions and not the other way around. This is the fundamental principle of the relationship between construction and logistics. The relationship between construction, logistics and assembly, named as fasteners synergisms is clearly shown in Fig. 9.
The present article does not have the ambition to recommend the best solutions, but to give to constructors a guideline of how to achieve it. That's their main mission.
Fig. 5. Several typical securing elements to prevent loosening Fig. 6. There is no universal way of securing Fig. 7 Fig. 8


