ControlChartforFailure-CensoredReliabilityTests underUncertaintyEnvironment
MuhammadAslam 1,* ,NasrullahKhan 2 andMohammedAlbassam 1
1 DepartmentofStatistics,FacultyofScience,KingAbdulazizUniversity,Jeddah21551,SaudiArabia; malbassam@kau.edu.sa
2 DepartmentofStatistics,UVAS,Lahore,JhangCampus,Lahore54000,Pakistani;nas_shan1@hotmail.com
* Correspondence:aslam_ravian@hotmail.comormagmuhammad@kau.edu.sa;Tel.:+966-59-3329841
Received:11November2018;Accepted:21November2018;Published:2December2018
Abstract: Existingcontrolchartsbasedonfailure-censored(Type-II)reliabilitytestsweredesigned usingclassicalstatistics.Classicalstatisticswasappliedforthemonitoringoftheprocesswhen observationsinthesampleorthepopulationweredetermined.Neutrosophicstatistics(NS)are appliedwhenthereisuncertaintyinthesampleorpopulation.Inthispaper,acontrolchartfor failure-censored(Type-II)reliabilitytestswasdesignedusingNS.Thedesignofacontrolchartforthe Weibulldistribution,whichisappliedwhenthereisalackofsymmetryusingneutrosophicstatistics, isgiven.Theproposedcontrolchartwasusedtomonitortheneutrosophicmeanandneutrosophic variance,whicharerelatedtotheneutrosophicscaleparameter.Theadvantagesoftheproposed controlchartovertheexistingcontrolchartarediscussed.

Keywords: neutrosophiclogic;neutrosophicstatistics;classicalstatistics;neutrosophicWeibull distribution;controlchart
1.Introduction
Duringthemanufacturingprocess,themonitoringoftwovariations,whichcanshifttheprocess fromthespecifiedtarget,isanimportanttask.Thepresenceofonlythecommoncauseofvariation doesnotaffectthemanufacturingprocess.Yet,thepresenceofaspecialcauseofvariationmay causemoredefects.Thecontrolchartisaneffectivetool,whichiswidelyusedintheindustryfor monitoringtheproductionprocess.Thecontrolchartgivesanimmediateindicationofwhenthe processisshiftedfromthesettargetinthepresenceofaspecialcaseofvariation.Atimelyindicationis helpfulforengineerstosortouttheproblemsintheproductionprocess.Therefore,themainobjectives ofthecontrolchartaretogiveaquickindicationoftheshiftintheprocess,toreducethenumberof defectiveproducts,andtomaintainthehighqualityoftheproduct.Controlchartsaredesignedunder theassumptionthattheproductiondatafollowthenormaldistributionorcomefromthenormal manufacturingprocess.However,experienceshowthat,inthechemicalindustry,theprocessesof cuttingtoolwearandconcentrateproductionfollowaskeweddistribution[1].Therefore,several researchersdesignedcontrolchartsinthecaseofnon-normalunderlyingdistributions.Reference[2] designedacontrolchartforsignstatistics.Reference[3]designedShewhartcontrolchartsinthecase ofskeweddata.Reference[4]presentedachartforagammadistribution.Reference[5]developeda costmodelchartfornon-normaldata.Reference[6]proposedamediancontrolchart.Reference[7] proposedachartfortheBurrdistribution.Formoredetailsonsuchcontrolcharts,thereadermay referto[8–18].
Inthemodernera,everyreputableindustryandcompanyistryingtoenhancethequalityof theirproduct.Thetargetofcreatinghigh-qualityproductsisachievedonlybyincreasingtheaverage lifetimeoftheproduct.Thereliability,whichistheprobabilitythatanequipmentoraproductperforms
Symmetry 2018, 10,690;doi:10.3390/sym10120690
www.mdpi.com/journal/symmetry
wellforthespecifiedperiod,isusedtomeasurethehighqualityoftheproduct.Forthemonitoringof highlyreliableproducts,itisnotpossibletowaitforaspecifiednumberoffailures.Tosavecostand time,time-truncatedexperimentsareimportant.InType-Icensoring,thetimeoftheexperimentis fixedand,inType-IIcensoring,thenumberoffailuresisfixed.TheapplicationsofType-Icensoring, Type-IIcensoring,andprogressiveandmixedcensoringarefoundin[19–26].
TheWeibulldistributionisverypopularintheareaofqualitycontrolandreliabilitydue toitsflexibilityofparameters.TheWeibulldistribution,duetoitsbathtubcurve,isfitted welltothereliabilityphenomena.References[27–29]discussedtheapplicationsoftheWeibull distribution.Reference[30]designedacontrolchartinwhichtheprocessfollowsaWeibulldistribution. Reference[31]designedabootstrapcontrolchartforthisdistribution.References[32,33]introduced controlchartsusingtime-truncatedlifetests.Recently,Khanetal.[34]designedacontrolchartfora failure-censoredreliabilitytestfortheWeibulldistribution.AdetaileddiscussionofType-IIcensoring controlchartscanbefoundinreferences[19–26].
TheexistingcontrolchartusingType-IIcensoringisdesignedundertheassumptionthatall observationsaredetermined.Accordingtoreference[35],“observationsincludehumanjudgments, andevaluationsanddecisions;acontinuousrandomvariableofaproductionprocessshouldinclude thevariabilitycausedbyhumansubjectivityormeasurementdevices,orenvironmentalconditions. Thesevariabilitycausescreatevaguenessinthemeasurementsystem.”Inthiscase,acontrolchart usingthefuzzyapproachwasusedformonitoringtheprocess.Therefore,fuzzylogicisappliedto thedesignofcontrolchartswhentheexperimentisnotsureaboutsomeparameters.Severalauthors contributedinthisareaanddesignedcontrolchartsusingthefuzzyapproachsuchasreference[36] whointroducedfuzzylogicinstatisticalqualitycontrol(SQC).Reference[37]introducedanalgorithm usingfuzzyapproach.Reference[38]discussedtheapplicationoffuzzycontrolcharts.Reference[35] proposedaShewhartcontrolchartusingthisapproach.Reference[39]presentedaliteraturereview onfuzzycontrolcharts.Reference[40]workedonafuzzyUcontrolchart.Reference[41]designed fuzzyvariablecontrolchartsandReference[42]alsoworkedonafuzzycontrolchart.Moredetails onfuzzycontrolchartscanbefoundinreferences[43–49].Industrialapplicationscanbefoundin references[50–53].
Reference[54]mentionedthattraditionalfuzzylogicisaspecialcaseofneutrosophiclogic(NS). Accordingtoreference[54],neutrosophiclogiccanbeappliedwhenthereexistsindeterminacyinthe observationsortheparameters.Basedonneutrosophiclogic,reference[55]introduceddescriptive neutrosophicstatistics(NS).Reference[55]arguedthatNSisanextensionofclassicalstatistics.NS hasmanyapplicationsinavarietyofareas.References[56,57]appliedNStostudyrockroughness issues.References[58,59]designedsamplingplansusingNS.Recently,reference[60]introduced NSintheareaofcontrolcharts.Theydesignedanattributecontrolchartusingtheneutrosophic statisticalintervalmethod(NSIM).Reference[60]designedavariancecontrolchartusingtheNSIM. TheyshowedtheefficiencyofchartsusingNSoverthosebasedonclassicalstatistics.Uponexploring theliterature,wefoundnoworkonthedesignofcontrolchartsforfailure-censoredreliabilitytests intheuncertaintyenvironment.Inthispaper,wefocusonthedesignofsuchcontrolchartsusing theNSIM.WehypothesizedthattheproposedchartusingtheNSIMwouldbemoreadequateand effectiveintheuncertaintyenvironmentthantheexistingcontrolchartbasedonclassicalstatistics. Thestateoftheartproductisdescribedinthenextsection.Theadvantagesoftheproposedchartand acasestudyaregiveninSections 3 and 4,respectively.Someconclusionsaregiveninthefinalsection. Moredetailsfailurecensoredreliabilitycanbeseeninreference[61].
2.StateoftheArt
Thefailuretimeofthecomplementsismeasuredthroughcomplexsystemsordevices.Therefore, itmaybepossiblethatsomefailuretimesareundeterminedorunclearintermsofmeasurements. Asmentionedearlier,NSisthegeneralizationoftheclassicalstatisticsthatisappliedwhenthe observationsinthesampleareindeterminateorunclear.Supposethatthefailuretimeindeterminacy
interval XNi {XL, XU } = i = 1,2,3, ... , nN ,where XL denotesthedeterminatepartand XU denotes theindeterminatepart,followstheneutrosophicWeibulldistribution.Reference[59]introducedthe followingneutrosophiccumulativedistributionfunction(ncdf)oftheWeibulldistribution. FN (xN ; mN , λN ) = 1 exp (λN xN )mN ; xN ≥ 0, mN {mL, mU }, λN {λL, λU } (1) where mN {mL, mU } istheneutrosophicshapeparameterand λN {λL, λU } istheneutrosophicscale parameter.TheneutrosophicWeibulldistributionreducestoaneutrosophicexponentialdistribution when λN { 1,1}.TheaveragelifetimeoftheneutrosophicWeibulldistributionisshownbelow. µN = ΓN (1/mN ) mN λN ; mN {mL, mU }, λN {λL, λU } (2) where ΓN (x) istheneutrosophicgammafunction.
Wedesignedafailure-censoredcontrolchartinthecaseofthefailuretimefollowingthe neutrosophicWeibulldistributiontomonitortheneutrosophicaverageandneutrosophicvariance, whicharerelatedto λN {λL, λU }.Theproposedcontrolchartisstatedinthefollowingsteps.
1. Choosearandomsampleofthesize nN {nL, nU } andbeginthetest.Continuewiththetestuntil rN arereachedandnotetheithfailuretime,say X(iN) (i =1,..., rN ). 2. ComputethefollowingstatisticunderNSIM:
LCLN ≤ vN ≤ UCLN where LCLN and UCLN denotetheneutrosophiclowercontrollimit(NLCL)andneutrosophicuppercontrollimit (NUCL),respectively.
Theoperationalprocessoftheproposedcontrolchartconsistsoftwoneutrosophiccontrollimits. TheproposedcontrolchartundertheNSIMisanextensionofKhanetal.[34]controlchartunderthe classicalstatistics.TheproposedchartreducestoKhanetal.[34]chartwhennouncertainobservations orparametersareinthesampleorinthepopulation.
Supposethattheprocessisanin-controlstateataneutrosophicscaleparameter λ0N {λ0L, λ0U }. Theneutrosophicaveragelifeisshownintheequationbelow. µ0N = ΓN (1/mN ) mN λN ; mN {mL, mU }, λN {λL, λU }.(4)
NoteherethattheproposedchartunderNISMisindependentof
bytheequationbelow.
Noteherethat2
degreesoffreedomismodeledbyaneutrosophicchi-squared distribution.Theprobabilitythattheprocessisanin-controlstate,say
theNISM,isderivedbyusingtheequationbelow.
where GN2rN (x) with2rN representstheneutrosophicdistributionfunctionofneutrosophicchi-squared distribution.Similarly,theprobabilitythattheprocessisout-of-controlwhenactuallyincontrolat λ0N {λ0L, λ0U } isgivenbytheequationbelow.
P0N out λ0N = P(vN ≥ UCLN |λ0N) + P(vN ≤ LCLN |λ0N) ; λ0N {λ0L, λ0U } (7) or P0N out λ0N = 1 G2rN (2UCLN w0N) + G2rN (2LCLN w0N) ; λ0N {λ0L, λ0U }.(8)
TheaveragerunlengthundertheNISMisknownastheneutrosophicaveragerunlength(NARL), whichisintroducedbyAslametal.[60]andgivenbytheequationbelow.
NARL0N = 1 P0N out λ0N ;NARL0N {NARL0L, NARL0U }.(9)
Severalspecialcausesofvariationsmayshifttheprocessawayfromthegiventarget.Let λ1N = cλ0N ; λ1N {λ0L, λ0U } denotestheshiftedneutrosophicscaleparameterwhere c denotestheshift constant.Theneutrosophicaveragelifeand w1N parameterat λ1N isgivenbyEquations (10)and(11). µ1N = ΓN (1/mN ) mN λ1N ; mN {mL, mU }, λN {λL, λU } (10) w1N = (λ1N µ0)m = cmw0N .(11) Notethat vN {vL, vU } ismodeledbytheneutrosophicgammadistributionhaving rN {rL, rU } and w1N {w1L, w1U }.Theprobabilityofin-controlundertheNISMat λ1N {λ0L, λ0U } isgivenbythe formulabelow. P1N in λ1N = P(LCLN ≤ vN ≤ UCLN |λ1N) = G2rN (2UCLN w1N) G2rN (2LCLN w1N).(12)
Theprobabilityofout-of-controlundertheNISMat λ1N {λ0L, λ0U } isgivenbyEquation(13)or Equation(14)below.
P1N in λ1N = P(vN ≥ UCLN |λ1N) + P(vN ≤ LCLN |λ1N) (13) P1N in λ1N = 1 G2rN (2UCLN w1N) + G2rN (2LCLN w1N).(14)
TheNARLfortheshiftedprocessisgivenbyEquation(15).
NARL1N = 1 P1N out λ0N ;NARL1N {NARL1L, NARL1U }.(15)
Supposethat r0N {rL, rU } denotesthespecifiedvalueof NARL0N {NARL0L, NARL0U }.The valuesof NARL1N {NARL1L, NARL1U } areshowninTables 1–4 forvariousvaluesof mN {mL, mU }, λN {λL, λU } and rN {rL, rU }.FromTables 1–4,wenotethat,forthesamevaluesofotherspecified parameters,thevaluesofNARLdecreaseastheneutrophilparameter mN increases.
Table1. ThevaluesofNARLwhen mN = [0.4,0.6] and λN = [0.45,0.55].
NeutrosophicControlLimits
rN=[2,5]
LCLN [0.0595,0.778][0.0484,0.708][0.0401,0.621]
UCLN [6.1131,11.498][6.6267,11.801][6.0133,11.331]
c NARL1N
0.1[10.28,1.45][13.43,1.49][9.81,1.43]
0.2[28.02,2.91][40.55,3.11][26.63,2.81]
0.3[57.00,6.20][88.45,6.86][55.42,5.87]
0.4[95.77,13.22][155.28,15.12][98.58,12.32]
0.5[137.44,27.61][226.82,32.64][155.05,25.52]
0.6[172.70,55.32][283.97,67.72][218.65,51.63]
0.7[195.74,102.02][316.96,130.22][279.38,100.34] 0.75[202.48,131.52][324.90,172.01][305.64,136.51] 0.8[206.48,161.66][328.31,216.90][328.06,181.27] 0.85[208.20,188.06][328.22,258.76][346.29,233.11] 0.9[208.11,206.64][325.53,290.79][360.32,287.91] 0.92[207.68,211.35][323.91,299.73][364.80,309.24] 0.95[206.66,215.43][321.01,308.62][370.39,339.15] 0.98[205.29,216.16][317.68,312.24][374.70,365.18] 0.99[204.76,215.74][316.49,312.36][375.88,372.78] 1[204.20,215.021][315.26,311.99][376.92,379.77]
1.1[197.40,196.27][301.78,288.42][381.40,413.47]
1.2[189.38,168.95][287.42,248.89][377.72,392.50]
1.3[181.06,142.89][273.34,210.15][369.13,347.01]
1.4[172.94,120.90][260.06,177.26][357.92,298.46]
1.5[165.25,103.03][247.76,150.53][345.55,255.18]
1.6[158.07,88.61][236.47,129.01][332.90,218.90]
1.7[151.42,76.92][226.14,111.61][320.47,189.04]
1.8[145.30,67.36][216.70,97.42][308.54,164.53]
1.9[139.65,59.47][208.06,85.73][297.23,144.29]
2[134.44,52.89][200.13,76.01][286.60,127.46]
2.5[113.69,32.17][168.76,45.55][242.88,75.01]
3[99.01,21.79][146.74,30.45][211.32,49.30]
4[79.63,12.21][117.73,16.65][169.38,26.17]
5[67.30,8.05][99.31,10.76][142.69,16.46]
6[58.70,5.87][86.47,7.69][124.09,11.50]
Table2. ThevaluesofNARLwhen mN = [0.9,1.10] and λN = [0.45,0.55]
NeutrosophicControlLimits
rN=[2,5]
[0.0865,1.08][0.0693,0.961][0.0621,0.933] UCLN [8.7698,16.05][9.1713,16.073][9.2462,17.103] c
LCLN
NARL1N
0.1[1.47,1.01][1.51,1.00][1.52,1.00] 0.2[2.73,1.14][2.92,1.14][2.96,1.12] 0.3[5.42,1.64][6.05,1.64][6.17,1.55] 0.4[11.04,2.96][12.83,2.97][13.21,2.66]
0.5[22.54,6.42][27.35,6.46][28.43,5.44]
0.6[45.01,15.99][57.26,16.15][60.31,12.76]
0.7[84.15,43.51][112.87,44.57][121.43,33.20]
0.75[109.92,71.90][151.64,75.13][165.63,54.94]
0.8[137.49,114.27][195.01,124.35][216.93,91.1923033]
0.85[163.49,165.47][237.85,193.61][270.02,148.57]
0.9[184.36,206.18][273.92,266.89][317.40,228.62]
0.92[190.70,214.58][285.30,289.78][333.15,264.14]
0.95[197.82,217.32][298.53,310.99][352.37,314.84]
NeutrosophicControlLimits
rN=[2,5]
0.98[202.13,210.10][307.11,314.91][365.94,354.61]
0.99[202.98,206.08][308.97,312.77][369.22,364.14]
1[203.55,201.49][310.37,309.19][371.89,371.54]
1.1[197.60,145.94][304.06,235.50][371.27,343.99]
1.2[180.35,101.35][277.91,163.84][342.17,250.67]
1.3[161.00,71.96][247.86,115.38][306.11,177.06]
1.4[143.14,52.65][220.06,83.59][272.03,127.50]
1.5[127.65,39.62][195.98,62.26][242.29,94.23]
1.6[114.45,30.55][175.50,47.53][216.92,71.35]
1.7[103.22,24.08][158.11,37.08][195.36,55.21]
1.8[93.64,19.35][143.28,29.49][176.96,43.55]
1.9[85.40,15.82][130.53,23.86][161.16,34.95]
2[78.26,13.13][119.51,19.60][147.48,28.49]
2.5[53.68,6.21][81.58,8.83][100.47,12.32] 3[39.61,3.67][59.90,4.97][73.63,6.67] 4[24.73,1.92][37.06,2.38][45.38,2.97]
5[17.31,1.37][25.72,1.58][31.38,1.85] 6[13.03,1.15][19.20,1.26][23.33,1.40]
Table3. ThevaluesofNARLwhen mN = [2.4,2.6] and λN = [0.45,0.55].
NeutrosophicControlLimits
rN=[2,5]
LCLN [0.119,1.27][0.106,1.07][0.0882,0.955] UCLN [12.029,18.76][13.87,18.84][13.089,18.984] c NARL1N
0.1[1.00,1.00][1.00,1.00][1.00,1.00] 0.2[1.0,1.00][1.02,1.00][1.01,1.00] 0.3[1.09,1.00][1.12,1.00][1.11,1.00] 0.4[1.35,1.01][1.47,1.01][1.42,1.01]
0.5[2.03,1.09][2.41,1.09][2.24,1.09]
0.6[3.85,1.44][5.19,1.44][4.57,1.45] 0.7[9.45,2.74][15.11,2.77][12.40,2.81] 0.75[16.32,4.52][28.77,4.59][22.75,4.70] 0.8[29.86,8.52][58.00,8.7.00][44.56,8.99] 0.85[56.52,18.41][117.97,18.96][90.98,19.80] 0.9[104.00,45][214.7,47.4][180.79,50.26]
0.92[128.33,65.61][254.10,70.55][229.02,75.59] 0.95[164.80,113.08][295.89,129.5][302.41,142.57]
0.98[191.91,173.85][307.79,226.65][355.84,263.97]
0.99[197.40,191.41][305.72,264.90][366.03,317.43] 1[200.93,204.62][301.36,302.15][372.12,374.36]
1.1[166.99,127.68][214.78,262.21][300.84,411.25]
1.2[114.56,53.35][144.52,106.83][204.15,166.01]
1.3[79.65,24.85][100.14,47.67][141.14,72.39]
1.4[57.02,12.92][71.51,23.63][100.48,34.96]
1.5[41.92,7.41][52.44,12.87][73.43,18.52]
1.6[31.55,4.65][39.36,7.64][54.91,10.67]
1.7[24.26,3.16][30.16,4.91][41.91,6.63]
1.8[19.00,2.31][23.55,3.38][32.59,4.42]
1.9[15.15,1.81][18.70,2.49][25.76,3.14]
2[12.26,1.49][15.08,1.94][20.67,2.37]
2.5[5.18,1.03][6.23,1.08][8.29,1.14]
3[2.82,1.00][3.30,1.00][4.23,1.00]
4[1.40,1.00][1.54,1.00][1.82,1.00]
5[1.08,1.00][1.12,1.00][1.21,1.00]
6[1.01,1.00][1.02,1.00][1.04,1.00]
Table4. ThevaluesofNARLwhen mN = [2.40,2.60] and λN = [1.90,2.10].
NeutrosophicControlLimits
rN=[2,5]
LCLN [0.121,1.36][0.109,0.815][0.0908,1.21]
UCLN [12.3,19.9][15.135,18.198][13.5992,21.39]
c NARL1N
0.1[1.00,1.00][1.00,1.00][1.00,1.00]
0.2[1.01,1.00][1.02,1.00][1.02,1.00]
0.3[1.10,1.00][1.15,1.00][1.12,1.00]
0.4[1.37,1.01][1.55,1.00][1.45,1.02]
0.5[2.08,1.11][2.72,1.07][2.35,1.14]
0.6[4.02,1.53][6.42,1.39][4.97,1.68]
0.7[10.11,3.18][20.95,2.55][14.12,3.89] 0.75[17.71,5.54][42.43,4.10][26.61,7.31] 0.8[32.83,11.15][89.79,7.50][53.45,16.03] 0.85[62.65,25.8][181.82,15.73][110.80,40.93] 0.9[114.54,66.39][294.62,37.93][216.44,117.07] 0.92[140.01,96.61][323.83,56.07][268.18,176.84] 0.95[175.93,156.06][337.46,104.54][337.22,294.34] 0.98[199.53,203.24][322.35,200.44][375.37,375.25] 0.99[203.48,208.65][313.57,248.88][379.59,379.24] 1[205.45,208.09][303.79,307.56][379.96,371.89] 1.1[163.83,98.63][203.67,744.86][286.61,161.48] 1.2[111.83,41.49][136.53,321.09][193.27,65.86] 1.3[77.73,19.68][94.63,136.05][133.63,30.25] 1.4[55.66,10.43][67.61,63.56][95.17,15.48] 1.5[40.93,6.11][49.61,32.46][69.59,8.73] 1.6[30.82,3.92][37.26,17.98][52.07,5.38]
1.7[23.70,2.73][28.58,10.71][39.77,3.59]
1.8[18.58,2.04][22.33,6.83][30.94,2.58] 1.9[14.81,1.63][17.75,4.64][24.47,1.98]
2[12.00,1.38][14.33,3.34][19.65,1.61]
2.5[5.08,1.02][5.95,1.29][7.92,1.04]
3[2.77,1.00][3.17,1.02][4.06,1.00]
4[1.39,1.00][1.51,1.00][1.77,1.00]
5[1.07,1.00][1.11,1.00][1.19,1.00]
6[1.01,1.00][1.01,1.00][1.04,1.00]
3.AdvantagesoftheProposedChart
IntheNS,byfollowingreference[54],wedefinedtheNARLas NARL1N = ARL1L + uI where ARL1L istheaveragerunlength(ARL)forthedeterminedpartundertheclassicalstatistics, uI isan indeterminatepartfor ARL1L,and I {infI, supI} presentstheindeterminacy.Whentherearecertain observationsinthesampleorinthepopulation,theindeterminatepart uI = 0 and NARL1N underthe NSbecomesthesameastheARLundertheclassicalstatistics.Accordingtoreference[57],underthe uncertaintysettings,amethodthatprovidestheindeterminacyintervalofNARLissaidtobeamore efficientandeffectivemethodthanthemethodthatprovidesadeterminedvalueofARL1.Thevalues of NARL1N fromtheproposedcontrolchartunderNISMandARL1 fromAslametal.[34]underthe
classicalstatisticsareinTable 5 atthesamelevelsofallspecifiedcontrolchartparameters.FromTable 5, wenotethattheproposedcontrolcharthasthevaluesof NARL1N intheindeterminacyintervalwhile theexistingcontrolchartundertheclassicalstatisticsprovidesonlythedeterminedvaluesofARL1.For example,when c =0.1,wehave NARL1N = 1.45 + 1.45I; I {0,7.09}.Thus,thedeterminateparisARL1 =1.45andtheindeterminatepartis 1.45I; I {0,7.09}.Therefore,theindeterminacyintervalof NARL1N is NARL1N = [10.287,1.451]; I {0,7.09}.Fromthisexample,itisclearthattheproposedcontrolchart hasdeterminateandindeterminateinformationundertheindeterminatesituation.Therefore,the proposedcontrolchartismoreeffectiveundertheindeterminatesituationthanAslametal.[34]chart, whichisaspecialcaseoftheproposedchart.
Table5. Thecomparisonoftheproposedchartwiththeexistingonewhen mN = [0.4,0.6], λN = [0.45,0.55],and rN = [2,5].
Neutrosophic ControlLimits ProposedControlChartExistingControlChart
LCLN NARL0N∈[200,200]NARL0N∈[300,300]NARL0N∈[370,370] ARL=200ARL=300ARL=370 UCLN c NARL1 ARL1 0.1[10.28,1.45][13.43,1.49][9.81,1.43]1.451.491.43 0.2[28.02,2.91][40.55,3.11][26.63,2.81]2.913.112.81 0.3[57.00,6.20][88.45,6.86][55.42,5.87]6.206.865.87 0.4[95.77,13.22][155.28,15.12][98.58,12.32]13.2215.112.32 0.5[137.44,27.61][226.82,32.64][155.05,25.52]27.6132.625.52 0.6[172.70,55.32][283.97,67.72][218.65,51.63]55.3267.7251.63 0.7[195.74,102.02][316.96,130.22][279.38,100.34]102.02130.22100.34 0.75[202.48,131.52][324.90,172.01][305.64,136.51]131.52172.01136.51 0.8[206.48,161.66][328.31,216.90][328.06,181.27]161.66216.90181.27 0.85[208.20,188.06][328.22,258.76][346.29,233.11]188.06258.76233.11 0.9[208.11,206.64][325.53,290.79][360.32,287.91]206.64290.79287.91 0.92[207.68,211.35][323.91,299.73][364.80,309.24]211.35299.73309.24 0.95[206.66,215.43][321.01,308.62][370.39,339.15]215.43308.62339.15 0.98[205.29,216.16][317.68,312.24][374.70,365.18]216.16312.24365.18 0.99[204.76,215.74][316.49,312.36][375.88,372.78]215.74312.36372.78 1[204.20,215.02][315.26,311.99][376.92,379.77]215.02311.99376.92 1.1[197.40,196.27][301.78,288.42][381.40,413.47]196.27288.42381.40 1.2[189.38,168.95][287.42,248.89][377.72,392.50]168.95248.89377.7 1.3[181.06,142.89][273.34,210.15][369.13,347.01]142.89210.15347.01 1.4[172.94,120.90][260.06,177.26][357.92,298.46]120.90177.26298.46 1.5[165.25,103.03][247.76,150.53][345.55,255.18]103.03150.53255.18 1.6[158.07,88.61][236.47,129.01][332.90,218.90]88.61129.01218.90 1.7[151.42,76.92][226.14,111.61][320.47,189.04]76.92111.61189.04 1.8[145.30,67.36][216.70,97.42][308.54,164.53]67.3697.42164.53 1.9[139.65,59.47][208.06,85.73][297.23,144.29]59.4785.73144.29 2[134.44,52.89][200.13,76.01][286.60,127.46]52.8976.01127.46 2.5[113.69,32.17][168.76,45.55][242.88,75.01]32.1745.5575.01 3[99.01,21.79][146.74,30.45][211.32,49.30]21.7930.4549.30 4[79.63,12.21][117.73,16.65][169.38,26.17]12.2116.6526.17 5[67.30,8.05][99.31,10.76][142.69,16.46]8.0510.7616.46 6[58.70,5.87][86.47,7.69][124.09,11.50]5.877.6911.50
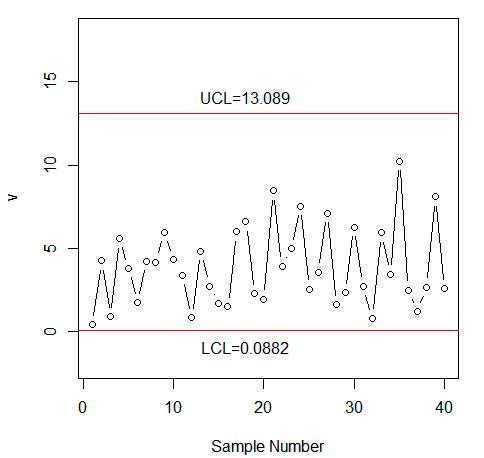
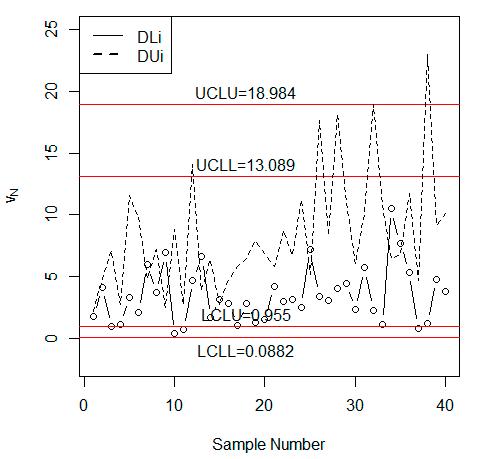
Now,wecomparetheperformanceoftheproposedcontrolchartunderNISMwiththechart undertheclassicalstatisticsusingthesimulateddata.Theneutrosophicdatawasgeneratedfromthe neutrosophicWeibulldistributionwithparameters mN = [2.40,2.60] and λN = [0.45,0.55].Thefirst 20neutrosophicobservationsweregeneratedwhentheprocesswasin-controlat λN = [0.45,0.55] andthenext20neutrosophicobservationsweregeneratedfromtheshiftedprocesswhen c =0.85. FromTable 3,theindeterminacyintervalof NARL1N is NARL1N {90.98,19.80}.Undertheuncertainty environment,itisexpectedthattheprocesswillbeout-of-controlbetweenthe19thand90thsamples when c =0.85.Thevaluesof vN {vL, vU } areplottedonthecontrolchartinFigure 1.FromFigure 1, wenotetheproposedcontrolchartunderNISMdetectedashiftatthe39thsample.Thevaluesof v are alsoplottedontheexistingchartinFigure 2.FromFigure 2,wenotethattheexistingcontrolchart underclassicalstatisticsdidnotdetectanyshiftintheprocess.BycomparingFigures 1 with 2,we
Symmetry 2018, 10,690 9of14
From Table 3, the indeterminacy interval of 90.98,19.80 uncertainty environment, it is expected that the process will be out-of-control between the 19th and 90th samples when �� = 0.85. The values of �� �� �� ,�� are plotted on the control chart in Figure 1. From Figure 1, we note the proposed control chart under NISM detected a shift at the 39th sample. The values of �� are also plotted on the existing chart in Figure 2. From Figure 2, we note that the existing control chart under classical statistics did not detect any shift in the process. By comparing Figure 1 with Figure 2, we conclude that the proposed control chart is more efficient in detecting an early shift in the process than the existing chart under classical statistics.
concludethattheproposedcontrolchartismoreefficientindetectinganearlyshiftintheprocessthan theexistingchartunderclassicalstatistics.
From Table 3, the indeterminacy interval of NARL is NARL �� 90.98,19.80 . Under the uncertainty environment, it is expected that the process will be out-of-control between the 19th and 90th samples when �� = 0.85. The values of �� �� �� ,�� are plotted on the control chart in Figure 1. From Figure 1, we note the proposed control chart under NISM detected a shift at the 39th sample. The values of �� are also plotted on the existing chart in Figure 2. From Figure 2, we note that the existing control chart under classical statistics did not detect any shift in the process. By comparing Figure 1 with Figure 2, we conclude that the proposed control chart is more efficient in detecting an early shift in the process than the existing chart under classical statistics.
4.CaseStudy
Figure 1. The proposed control chart for the simulated data.
Figure1. Theproposedcontrolchartforthesimulateddata.
Figure 1. The proposed control chart for the simulated data.
Figure 2. Aslam et al. [34] control chart for the simulated data. Figure2. Aslametal.[34]controlchartforthesimulateddata.
Figure 2. Aslam et al. [34] control chart for the simulated data.
Thissectionispresentedtoexplaintheapplicationoftheproposedcontrolchartinthevery popularautomobilemanufacturingindustrylocatedinJapan.Forthehighqualityofthesubsystems ofthepassenger’scars,themonitoringoftheprocessisdonethroughthecontrolchart.Thequalityof thesubsystemsofthecarsisbasedontheservicetime.Thedataisindaysuntiltheserviceisrequired forthesubsystems.Theservicetimedataofsubsystemsismeasuredthroughthecomplexequipment. Therefore,someobservationsaboutthetimeuntiltheserviceisrequiredareuncertain.Themonitoring ofsuchdatacannotbedoneusingthecontrolchartproposedbyAslametal.[34]underclassical statistics.Undertheuncertaintyenvironment,thecompanyhasdecidedtoapplytheproposedcontrol chartforthemonitoringofservicetimedata.Suppose,forthisexperiment,thecompanydecidedto
setparametersas rN [2,5] and NARL0N {370,370}.Theservicetimedataofpresentercarsfollows theneutrosophicWeibulldistributionwith mN [2.40,2.60] and λN [1.90,2.10].The vN forthisdatais showninTable 6.
Table6. Thestatisticsfortheservicetimedata.
SampleNo. vN SampleNo. vN
1[3.01,2.76]21[0.36,16.32]
2[2.61,7.57]22[0.39,4.44]
3[7.74,4.57]23[0.98,10.49]
4[0.84,4.25]24[6.06,6.49]
5[1.19,10.66]25[7.31,2.59]
6[2.55,10.25]26[2.54,9.34]
7[3.73,7.66]27[6.18,11.58]
8[3.37,6.82]28[1.78,6.91]
9[6.19,5.43]29[2.61,7.28] 10[6.12,4.31]30[5.05,4.73] 11[3.03,9.71]31[3.67,8.89] 12[0.33,2.64]32[4.74,6.45] 13[3.46,5.18]33[0.36,13.32] 14[3.11,11.91]34[3.00,9.29] 15[1.67,5.78]35[0.67,11.71] 16[1.09,4.59]36[0.61,3.30] 17[2.29,8.98]37[2.01,1.69]
18[2.47,4.16]38[0.29,15.05] 19[1.22,11.02]39[1.00,12.85] 20[3.13,7.45]40[2.55,9.40] Forexample,forsample#1:theservicetimeindaysis XN {0.357262,0.510949;0.077456,0.122034, 0.241257,0.289738,0.369004}.Thestatistic vN forthissampleiscomputedbyusingtheformulabelow.
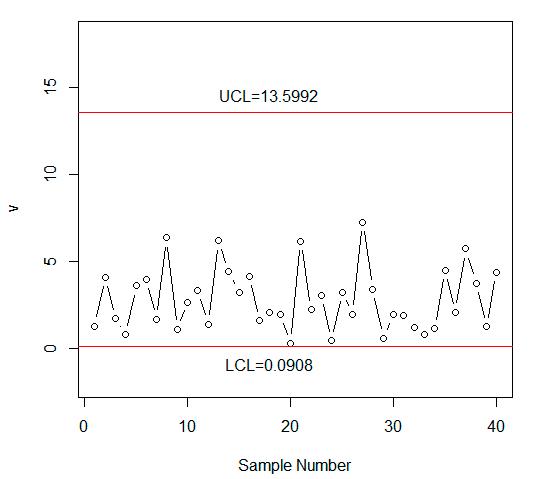
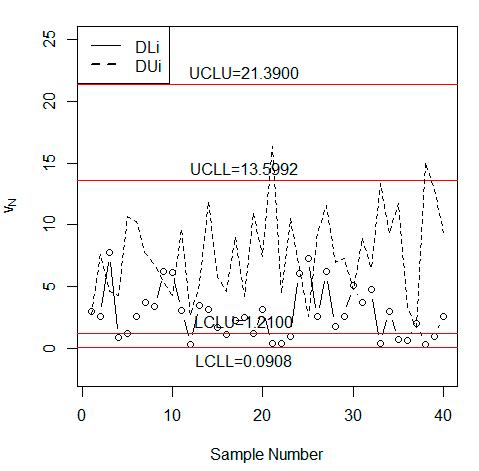
{2.76,3.01}; mN = [2.40,2.60], rN [2,5] and λN = [1.90,2.10].Thevaluesof vN areplottedonthecontrolchartinFigure 3.FromFigure 3,wenotethat severalvaluesofthestatisticlieintheindeterminacyintervalofthecontrollimits.Yet,thecontrolchart proposedbyAslametal.[34]inFigure 4 showsthattheprocessisanin-controlstate.FromFigure 3,it canbenotedthatseveralvaluesofplottingstatisticsareintheindeterminacyinterval.Samples#12, #21,#22,#33,and#37areveryclosetotheLCLL thatneedsspecialattentionbytheindustrialengineers. However,theexistingcontrolchartindicatesthatonlytwovaluesareveryclosetothecontrollimit.By comparingFigures 3 with 4,weconcludethattheproposedcontrolchartisbetter,moreflexible,and moreeffectivethantheexistingchartundertheuncertaintyenvironment.Inaddition,theproposed controlchartismoreefficientforthemonitoringoftheprocessthantheexistingcontrolchart.
Figure 3. The proposed control chart for the automobile data.
Figure3. Theproposedcontrolchartfortheautomobiledata.
Figure 3. The proposed control chart for the automobile data.
5.Conclusions
5. Conclusions
5. Conclusions
Figure 4. Aslam et al. [34] control chart for the automobile data.
Figure4. Aslametal.[34]controlchartfortheautomobiledata.
Figure 4. Aslam et al. [34] control chart for the automobile data.
Acontrolchartforfailure-censored(Type-II)reliabilitytestsundertheNSwaspresentedin thispaper.Thenecessarymeasurestoapplytheproposedcontrolchartweregiveninthepaper. Theproposedcontrolchartwasthegeneralizationofthecontrolchartunderclassicalstatistics. Asimulationstudyandrealdatashowedtheefficiencyoftheproposedcontrolchartunderthe uncertaintyenvironment.Bycomparingtheproposedchartwiththechartundertheclassical statistics,wenotedthattheproposedchartwasmoreeffective,moreflexible,andadequatefor useintheuncertaintyenvironment.Theproposedcontrolchartcanbeappliedinthisindustrywhen therearesomeuncertain,unclear,andfuzzyobservationsinthesampleorinthepopulation.The proposedcontrolchart,whenusingtheothersamplingschemesorthecostmodel,canbestudiedin futureresearch.
A control chart for failure-censored (Type-II) reliability tests under the NS was presented in this paper. The necessary measures to apply the proposed control chart were given in the paper. The proposed control chart was the generalization of the control chart under classical statistics. A simulation study and real data showed the efficiency of the proposed control chart under the uncertainty environment. By comparing the proposed chart with the chart under the classical statistics, we noted that the proposed chart was more effective, more flexible, and adequate for use in the uncertainty environment. The proposed control chart can be applied in this industry when there are some uncertain, unclear, and fuzzy observations in the sample or in the population. The proposed control chart, when using the other sampling schemes or the cost model, can be studied in future research.
A control chart for failure-censored (Type-II) reliability tests under the NS was presented in this paper. The necessary measures to apply the proposed control chart were given in the paper. The proposed control chart was the generalization of the control chart under classical statistics. A simulation study and real data showed the efficiency of the proposed control chart under the uncertainty environment. By comparing the proposed chart with the chart under the classical statistics, we noted that the proposed chart was more effective, more flexible, and adequate for use in the uncertainty environment. The proposed control chart can be applied in this industry when there are some uncertain, unclear, and fuzzy observations in the sample or in the population. The proposed control chart, when using the other sampling schemes or the cost model, can be studied in future research.
AuthorContributions: Conceivedanddesignedtheexperiments,M.A.(MohammedAlbassam),N.K.,andM.A. (MohammedAlbassam)Performedtheexperiments,M.A.(MohammedAlbassam)andN.K.Analyzedthedata, M.A.(MohammedAlbassam)andN.K.Contributedreagents/materials/analysistools,M.A.(MuhammadAslam). Wrotethepaper,M.A.(MuhammadAslam).
Funding: ThisarticlewasfundedbytheDeanshipofScientificResearch(DSR)atKingAbdulazizUniversity, Jeddah.Theauthors,therefore,acknowledgeandthankDSRtechnicalandfinancialsupport.
Acknowledgments: Theauthorsaredeeplythankfultotheeditorandreviewersfortheirvaluablesuggestionsto improvethequalityofthismanuscript.
ConflictsofInterest: Theauthorsdeclarenoconflictofinterestregardingthispaper.
References
1. Aichouni,M.;Al-Ghonamy,A.;Bachioua,L.Controlchartsfornon-normaldata:Illustrativeexamplefrom theconstructionindustrybusiness.Availableonline: https://www.google.com.tw/url?sa=t&rct=j&q= &esrc=s&source=web&cd=1&cad=rja&uact=8&ved=2ahUKEwjgz4mTn_zeAhWOFogKHXjbCXIQFjAAe gQICRAC&url=http%3A%2F%2Fwww.wseas.us%2Fe-library%2Fconferences%2F2014%2FMalaysia%2FM ACMESE%2FMACMESE-10.pdf&usg=AOvVaw1PPU0bV-aBbm7pVZ9wunqY (accessedon11November 2018).
2. Amin,R.W.;Reynolds,M.R.,Jr.;Saad,B.Nonparametricqualitycontrolchartsbasedonthesignstatistic. Commun.Stat.TheoryMethods 1995, 24,1597–1623.[CrossRef]
3. Bai,D.;Choi,I.(x)over-bar-controlandr-controlchartsforskewedpopulations. J.Qual.Technol. 1995, 27, 120–131.[CrossRef]
4. Al-Oraini,H.A.;Rahim,M.Economicstatisticaldesignof x controlchartsforsystemswithgamma(λ,2) in-controltimes. Comput.Ind.Eng. 2002, 43,645–654.[CrossRef]
5. Chen,Y.-K.Economicdesignofxcontrolchartsfornon-normaldatausingvariablesamplingpolicy. Int.J. Prod.Econ. 2004, 92,61–74.[CrossRef]
6. Ahmad,S.;Riaz,M.;Abbasi,S.A.;Lin,Z.Onefficientmediancontrolcharting. J.Chin.Inst.Eng. 2014, 37, 358–375.[CrossRef]
7. Lio,Y.;Tsai,T.-R.;Aslam,M.;Jiang,N.Controlchartsformonitoringburrtype-xpercentiles. Commun.Stat. Simul.Comput. 2014, 43,761–776.[CrossRef]
8. Miller,T.;Balch,B.Statisticalprocesscontrolinfoodprocessing. ISATrans. 1991, 30,35–37.[CrossRef] 9. Kegel,T.Statisticalcontrolofapressureinstrumentcalibrationprocess. ISATrans. 1996, 35,69–77.[CrossRef]
10. Chou,C.-Y.;Chen,C.-H.;Liu,H.-R.Economic-statisticaldesignofx¥ chartsfornon-normaldataby consideringqualityloss. J.Appl.Stat. 2000, 27,939–951.[CrossRef]
11. Wu,Z.;Xie,M.;Tian,Y.Optimizationdesignofthex&schartsformonitoringprocesscapability. J.Manuf. Syst. 2002, 21,83–92.
12. Venkatesan,G.Processcontrolofproductquality. ISATrans. 2003, 42,631–641.[CrossRef] 13. Lin,Y.-C.;Chou,C.-Y.Onthedesignofvariablesamplesizeandsamplingintervalschartsunder non-normality. Int.J.Prod.Econ. 2005, 96,249–261.[CrossRef]
14. Zhang,H.Y.;Shamsuzzaman,M.;Xie,M.;Goh,T.N.Designandapplicationofexponentialchartfor monitoringtime-between-eventsdataunderrandomprocessshift. Int.J.Adv.Manuf.Technol. 2011, 57, 849–857.[CrossRef]
15. McCracken,A.;Chakraborti,S.Controlchartsforjointmonitoringofmeanandvariance:Anoverview. Qual. Technol.Quant.Manag. 2013, 10,17–35.[CrossRef]
16. Addeh,J.;Ebrahimzadeh,A.;Azarbad,M.;Ranaee,V.Statisticalprocesscontrolusingoptimizedneural networks:Acasestudy. ISATrans. 2014, 53,1489–1499.[CrossRef][PubMed]
17. Celano,G.;Castagliola,P.;Fichera,S.;Nenes,G.Performanceoftcontrolchartsinshortrunswithunknown shiftsizes. Comput.Ind.Eng. 2013, 64,56–68.[CrossRef]
18. Aslam,M.;Azam,M.;Khan,N.X-barcontrolchartsfornon-normalcorrelateddataunderrepetitive sampling. J.Test.Eval. 2015, 44,1756–1767.[CrossRef]
19. Pascual,F.;Li,S.Monitoringtheweibullshapeparameterbycontrolchartsforthesamplerangeoftypeii censoreddata. Qual.Reliab.Eng.Int. 2012, 28,233–246.[CrossRef]
20.
21.
22.
23.
24.
25.
Guo,B.;Wang,B.X.Controlchartsformonitoringtheweibullshapeparameterbasedontype-iicensored sample. Qual.Reliab.Eng.Int. 2014, 30,13–24.[CrossRef]
Haghighi,F.;Pascual,F.;Castagliola,P.Conditionalcontrolchartsforweibullquantilesundertypeii censoring. Qual.Reliab.Eng.Int. 2015, 31,1649–1664.[CrossRef]
Chan,Y.;Han,B.;Pascual,F.Monitoringtheweibullshapeparameterwithtypeiicensoreddata. Qual. Reliab.Eng.Int. 2015, 31,741–760.[CrossRef]
Wang,F.K.;Bizuneh,B.;Cheng,X.B.Newcontrolchartsformonitoringtheweibullpercentilesunder completedataandtype-iicensoring. Qual.Reliab.Eng.Int. 2018, 34,403–416.[CrossRef]
Asadzadeh,S.;Kiadaliry,F.Monitoringtype-2censoredreliabilitydatainmultistageprocesses. Qual.Reliab. Eng.Int. 2017, 33,2551–2561.[CrossRef]
Aslam,M.;Arif,O.H.;Jun,C.-H.Anattributecontrolchartforaweibulldistributionunderaccelerated hybridcensoring. PLoSONE 2017, 12,e0173406.[CrossRef][PubMed]
26. Guo,B.;Wang,B.X.;Xie,M.Arl-unbiasedcontrolchartsforthemonitoringofexponentiallydistributed characteristicsbasedontype-iicensoredsamples. J.Stat.Comput.Simul. 2014, 84,2734–2747.[CrossRef]
27. Montgomery,D.C.;Runger,G.C. AppliedStatisticsandProbabilityforEngineers;JohnWiley&Sons:NewYork, NY,USA,2010.
28.
Rausand,M.;Høyland,A. SystemReliabilityTheory:Models,StatisticalMethods,andApplications;JohnWiley& Sons:NewYork,NY,USA,2004;Volume396.
Borror,C.M.;Keats,J.B.;Montgomery,D.C.Robustnessofthetimebetweeneventscusum. Int.J.Prod.Res. 2003, 41,3435–3444.[CrossRef] 30. Nelson,P.R.Controlchartsforweibullprocesseswithstandardsgiven. IEEETrans.Reliab. 1979, 28,283–288. [CrossRef] 31. Nichols,M.D.;Padgett,W.Abootstrapcontrolchartforweibullpercentiles. Qual.Reliab.Eng.Int. 2006, 22, 141–151.[CrossRef]
29.
32. Aslam,M.;Jun,C.-H.Attributecontrolchartsfortheweibulldistributionundertruncatedlifetests. Qual. Eng. 2015, 27,283–288.[CrossRef] 33. Aslam,M.;Khan,N.;Jun,C.-H.Acontrolchartfortimetruncatedlifetestsusingparetodistributionof secondkind. J.Stat.Comput.Simul. 2015, 86,2113–2122.[CrossRef] 34. Khan,N.;Aslam,M.;Raza,S.M.M.;Jun,C.H.Anewvariablecontrolchartunderfailure-censoredreliability testsforWeibulldistribution. Qual.Reliab.Eng.Int. 2018.[CrossRef] 35. Senturk,S.;Erginel,N.Developmentoffuzzy x∼-r∼ and x∼-s∼ controlchartsusing α-cuts. Inf.Sci. 2009, 179,1542–1551.[CrossRef] 36. Rowlands,H.;Wang,L.R.Anapproachoffuzzylogicevaluationandcontrolinspc. Qual.Reliab.Eng.Int. 2000, 16,91–98.[CrossRef] 37. El-Shal,S.M.;Morris,A.S.Afuzzyrule-basedalgorithmtoimprovetheperformanceofstatisticalprocess controlinqualitysystems. J.Intell.FuzzySyst. 2000, 9,207–223. 38. Ertu˘grul,I.;Güne¸s,M.Theusageoffuzzyqualitycontrolchartstoevaluateproductqualityandan application.In AnalysisandDesignofIntelligentSystemsUsingSoftComputingTechniques;Springer: Berlin/Heidelberg,Germany,2007;pp.660–673.
39. Sabegh,M.H.Z.;Mirzazadeh,A.;Salehian,S.;Weber,G.-W.Aliteraturereviewonthefuzzycontrolchart; classifications&analysis. Int.J.SupplyOper.Manag. 2014, 1,167–189.
40. AvakhDarestani,S.;MoradiTadi,A.;Taheri,S.;Raeiszadeh,M.Developmentoffuzzyucontrolchartfor monitoringdefects. Int.J.Qual.Reliab.Manag. 2014, 31,811–821.[CrossRef]
41.
MojtabaZabihinpour,S.;Ariffin,M.;Tang,S.H.;Azfanizam,A.Constructionoffuzzy xscontrolchartswith anunbiasedestimationofstandarddeviationforatriangularfuzzyrandomvariable. J.Intell.FuzzySyst. 2015, 28,2735–2747.[CrossRef]
42. Shu,M.-H.;Dang,D.-C.;Nguyen,T.-L.;Hsu,B.-M.;Phan,N.-S.Fuzzyandcontrolcharts:Adata-adaptability andhuman-acceptanceapproach. Complexity 2017, 2017,4376809.[CrossRef]
43. Gülbay,M.;Kahraman,C.;Ruan,D.A-cutfuzzycontrolchartsforlinguisticdata. Int.J.Intell.Syst. 2004, 19, 1173–1195.[CrossRef]
44. Kaya, I.;Kahraman,C.Processcapabilityanalysesbasedonfuzzymeasurementsandfuzzycontrolcharts. ExpertSyst.Appl. 2011, 38,3172–3184.[CrossRef]
Symmetry 2018, 10,690
45.
Soleymani,P.;Amiri,A.Fuzzycauseselectingcontrolchartformonitoringmultistageprocesses. Int.J.Ind. Syst.Eng. 2017, 25,404–422.[CrossRef]
ErcanTeksen,H.;Anagun,A.S.Differentmethodstofuzzy x-rcontrolchartsusedinproduction:Interval type-2fuzzysetexample. J.Enterp.Inf.Manag. 2018, 31,848–866.[CrossRef] 47.
46.
Alakoc,N.P.;Apaydin,A.Afuzzycontrolchartapproachforattributesandvariables. Eng.Technol.Appl. Sci.Res. 2018, 8,3360–3365. 48.
Mashuri,M.;Ahsan,M.PerfomanceFuzzyMultinomialControlChart. J.Phys.Conf.Ser. 2018, 1028,012120. 49.
50.
Fadaei,S.;Pooya,A.Fuzzyucontrolchartbasedonfuzzyrulesandevaluatingitsperformanceusingfuzzy occurve. TQMJ. 2018, 30,232–247.[CrossRef]
Brunetto,P.;Fortuna,L.;Giannone,P.;Graziani,S.;Strazzeri,S.Staticanddynamiccharacterizationof thetemperatureandhumidityinfluenceonipmcactuators. IEEETrans.Instrum.Meas. 2010, 59,893–908. [CrossRef]
51. Meza,J.;Espitia,H.;Montenegro,C.;Crespo,R.G.Statisticalanalysisofamulti-objectiveoptimization algorithmbasedonamodelofparticleswithvorticitybehavior. SoftComput. 2016, 20,3521–3536.[CrossRef]
52. Arora,S.;Singh,S.Aneffectivehybridbutterflyoptimizationalgorithmwithartificialbeecolonyfor numericaloptimization. Int.J.Interact.MultimediaArtif.Intell. 2017, 4,14–21.[CrossRef]
53. Padilla,V.;Conklin,D.GenerationofTwo-VoiceImitativeCounterpointfromStatisticalModels. Int.J. Interact. Availableonline: https://www.ijimai.org/journal/node/2649 (accessedon10November2018).
54. Smarandache,F.Neutrosophiclogic-ageneralizationoftheintuitionisticfuzzylogic. MultispaceMultistruct. NeutrosophicTransdiscipl. 2010, 4,396.[CrossRef]
55. Smarandache,F. IntroductiontoNeutrosophicStatistics;InfiniteStudy;SitechEducationPublishing:Craiova, Romania,2014.
56. Chen,J.;Ye,J.;Du,S.Scaleeffectandanisotropyanalyzedforneutrosophicnumbersofrockjointroughness coefficientbasedonneutrosophicstatistics. Symmetry 2017, 9,208.[CrossRef]
57. Chen,J.;Ye,J.;Du,S.;Yong,R.Expressionsofrockjointroughnesscoefficientusingneutrosophicinterval statisticalnumbers. Symmetry 2017, 9,123.[CrossRef]
58.
Aslam,M.Anewsamplingplanusingneutrosophicprocesslossconsideration. Symmetry 2018, 10,132. [CrossRef]
59. Aslam,M.;Arif,O.TestingofgroupedproductfortheWeibulldistributionusingneutrosophicstatistics. Symmetry 2018, 10,403.[CrossRef]
60. Aslam,M.;Khan,N.;Khan,M.Monitoringthevariabilityintheprocessusingneutrosophicstatistical intervalmethod. Symmetry 2018, 10,562.[CrossRef]
61. Jun,C.-H.;Lee,H.;Lee,S.-H.;Balamurali,S.Avariablesrepetitivegroupsamplingplanunder failure-censoredreliabilitytestsforWeibulldistribution. J.Appl.Stat. 2010, 37,453–460.[CrossRef]
© 2018bytheauthors.LicenseeMDPI,Basel,Switzerland.Thisarticleisanopenaccess articledistributedunderthetermsandconditionsoftheCreativeCommonsAttribution (CCBY)license(http://creativecommons.org/licenses/by/4.0/).