

Static Mixing Technology with proven benefits
Through experience, innovation and inspiration Statiflo continues to strengthen its reputation as the world leaders in the design and manufacture of static mixers, channel mixers, gas dispersion systems and associated technologies.
Statiflo Motionless Mixers offer many key benefits for chemical dosing applications. They are efficient and economical, delivering precise, predetermined results every time.
Key benefits include:
• Highly efficient mixing meaning a low pressure drop and a short overall length
• Continuous performance over a wide flow range
• Reduced chemical consumption
• Available in all sizes and materials
• Custom designed for each application
• CFD verification is available


Editor’s Office and Advertiser Information:
Florida Water Resources Journal
1402 Emerald Lakes Drive
Clermont, FL 34711
Phone: 352-241-6006
Email: Editorial, editor@fwrj.com
Display and Classified Advertising, ads@fwrj.com
Business Office: 1402 Emerald Lakes Drive, Clermont, FL 34711
Web: http://www.fwrj.com
General Manager: Michael Delaney
Editor: Rick Harmon
Graphic Design Manager: Patrick Delaney
Mailing Coordinator: Buena Vista Publishing
Published by BUENA VISTA PUBLISHING for Florida Water Resources Journal, Inc.
President: Richard Anderson (FSAWWA) Peace River/Manasota Regional Water Supply Authority
Vice President: Joe Paterniti (FWEA) Clay County Utility Authority
Treasurer: Rim Bishop (FWPCOA) Seacoast Utility Authority
Secretary: Mish Clark Mish Agency
Moving?
The Post Office will not forward your magazine. Do not count on getting the Journal unless you notify us directly of address changes by the 15th of the month preceding the month of issue. Please do not telephone address changes. Email changes to changes@fwrj.com or mail to Florida Water Resources Journal, 1402 Emerald Lakes Drive, Clermont, FL 34711
Membership Questions
FSAWWA: Casey Cumiskey – 407-979-4806 or fsawwa.casey@gmail.com
FWEA: Karen Wallace, Executive Manager – 407-574-3318
FWPCOA: Darin Bishop – 561-840-0340
Training Questions
FSAWWA: Donna Metherall – 407-979-4805 or fsawwa.donna@gmail.com
FWPCOA: Shirley Reaves – 321-383-9690
For Other Information
DEP Operator Certification: Ron McCulley – 850-245-7500
FSAWWA: Peggy Guingona – 407-979-4820
Florida Water Resources Conference: 407-363-7751
FWPCOA Operators Helping Operators: John Lang – 772-559-0722, e-mail – oho@fwpcoa.org
FWEA: Karen Wallace, Executive Manager – 407-574-3318
Websites
Florida Water Resources Journal: www.fwrj.com
FWPCOA: www.fwpcoa.org
FSAWWA: www.fsawwa.org
FWEA: www.fwea.org and www.fweauc.org
Florida Water Resources Conference: www.fwrc.org

News and Features
4 Updated DBIA Best Practices Primer Enhances Efficiency in Water and Wastewater Sector
6 Committee Members and Volunteers Made Student Design Competition at FWRC a Success!—Alyssa Massais
20 Technology Spotlight: Smarter Solutions for Water Utilities
22 Hashtag This: Youth Education is Always Trending—and Certainly at #ACE24!—Shea Dunifon
46 AWWA Promotes Source Water Protection Week
54 Heads Up, Water Utilities: Increased Wildfires in Southeast Threaten Water Quality
56 News Beat
Technical Articles
8 Why, When, and How to Do a Free Chlorine Burn in Chloraminated Distribution Systems to Mitigate Nitrification—Michael Bailey, Paul Thompson, Monty Sedlak, Kevin Stone, and Veronica Llaneza
30 Water Quality and Resiliency: Considering the Future of Elevated Storage Tanks— Kristiana S. Dragash, Katherine Gilmore, and Brooke D. Bailey
48 Assessment of Adenosine Triphosphate for Biomonitoring Through a Central Florida Groundwater Treatment Train—Jessica Cormier and Steven J. Duranceau
Education and Training
44 Florida Water Resources Conference Call for Papers 57 FWPCOA Training Calendar
58 Save the Date for the 17th Southwest Florida Water and Wastewater Expo!
Columns
13 Test Yourself—Charles Lee Martin Jr. 14 FWEA Chapter Corner: FWEA Central Florida Chapter: 2023-2024 Update—Tucker Hunter 16 Speaking Out—Marjorie Guillory Craig 24 Let’s Talk Safety: Lockout/Tagout: Water Under Pressure Poses Danger to Utility Workers 26 FWEA Focus—Joe Paterniti 42 C Factor—Athena Tipaldos
Departments 60 Classifieds
Display Advertiser Index


Updated DBIA Best Practices Primer Enhances Efficiency in Water and Wastewater Sector
The Design-Build Institute of America (DBIA) has released its updated water and wastewater best practices primer. This essential guide expands on DBIA’s universal best practices, offering tailored support to professionals in the water and wastewater sector to enhance project efficiency and success. By addressing the unique challenges of this vital industry, these targeted best practices aim to ensure highquality design-build projects that prioritize public health and safety.
A subgroup of the DBIA Water/Wastewater Markets Committee was led by:
S David Hill, DBIA, chair
S Drew Zirkle, P.E., DBIA, cochair
They collaborated with a diverse team of experienced experts and partner organizations to update these best practices.
“The ever-increasing demands of water and wastewater as a must-have infrastructure require continuous improvement and innovation of not only what we build but how we deliver what we build,” said Hill. “The DBIA water and wastewater best practices primer provide a continuous strong foundation to tackle these demands and deliver the highest certainty of outcome.”
Why Water and Wastewater Best Practices Are Necessary
The water and wastewater best practices primer is essential for several reasons:
S It offers a structured approach to managing the unique challenges of water and
wastewater projects, ensuring public health and safety are prioritized.
S The guidance on procurement and contracting helps streamline processes and mitigate risks, leading to successful project outcomes.
S By fostering collaboration among stakeholders and promoting ethical conduct and competence, the primer supports the development of high-performing teams that can deliver exceptional results.
The DBIA is dedicated to continuous improvement and the dissemination of leadingedge information. The water and wastewater best practices primer aligns with DBIA’s universal best practices, with an emphasis on the specific needs of the water and wastewater sector.
Key Highlights of Water and Wastewater Best Practices
Navigating Local Governance
The sector’s local implementation, often managed by cities, counties, or quasigovernmental utilities, requires intricate procurement processes influenced by state statutes, local ordinances, and utility board regulations. The best practices primer provides guidance to navigate these challenges effectively.
Addressing Technical and Logistical Challenges
These projects are inherently demanding due to their impact on public health and safety, the need for public stakeholder engagement,
and stringent regulatory approvals. The primer outlines strategies for addressing these demands, including integrating operations and maintenance staff early to enhance collaboration and project success.
Choosing the Right Delivery Model
The primer emphasizes selecting the appropriate organizational structure and project delivery model, such as progressive design-build (PDB), design-build-operate (DBO) and designbuild-operate-maintain (DBOM). These models offer flexibility and expanded scope, including financing and maintenance services.
Upholding Ethical and Professional Standards
The best practices primer is anchored by ethical conduct, demonstrated competence, sustainable professional development, and support for diversity, equity, and inclusion. These principles ensure projects are executed with integrity and excellence.
Comprehensive Sector-Specific Guidance
Organized into three primary sections— procuring design-build services, contracting for design-build services, and executing designbuild projects—the primer provides detailed best practices and implementation techniques tailored to the water/wastewater sector.
Backed by Industry Data and Trends
The release of the updated water and wastewater best practices primer comes at a time when design-build is increasingly recognized as the fastest-growing and most efficient project delivery method. According to the 2023 Midcycle Update Report from FMI Consulting, designbuild construction spending is anticipated to reach over $405 billion by 2026, with a compound annual growth rate of 5.2 percent from 2022 to 2026. This growth is driven by the advantages of design-build, including faster project delivery, reduced costs, and improved collaboration among project stakeholders. Specifically, the water and wastewater segment is expected to see significant investment, accounting for 7 percent of the total design-build construction spending during this period.

For more information and to download the free water and wastewater best practices primer go to www.dbia.org.

Committee Members and Volunteers Made Student Design Competition at FWRC a Success!
Alyssa Massais
The annual Student Design Competition, held this year at the Florida Water Resources Conference (FWRC) on Saturday, April 6, was a huge success.
The competition brings the brightest minds and their wastewater and environmental designs to the conference. Each team presented its realworld findings to an assigned problem or task in both environmental and wastewater interests. This competition is intended for both undergraduate and graduate students, typically completing a capstone project.
This year, teams representing Florida universities were from:
S University of Florida
S University of South Florida
Information about the winners of the competition, and the poster contest, was published
Thank you to the following committee members and volunteers:
Students and Young Professionals Committee (SYPC) Meeting
Lead - Jissell Muir
Poster Competition
Lead - Alyssa Massais
Judge - Amber Balester
Judge - Alejandro Solanilla
Judge - Connor King
Judge - Andrea Medina
Young Professionals (YPs) Social
S Kamal Taha
S Jissell Muir
S Olga Mikhalchishina
S Emma Johnson
S Tevin Powell
S Emma Johnson
S Elayne Nash
YP Workshop Speakers
S Ivy Drexler
S Erin Mosley
S Marjorie Craig
S Lisa Wilson-Davis
S Suzanne Mechler
S Joe Paterniti
YP Workshop Panelists
S Ernesto Gonzalez
S Cedric Carswell
S Tori Morgan
S Allyson Felsburg
S Jack Stang
Student Design Competition
Lead – Alyssa Massais

Judge - Gabby Squillante
Judge – Madeline Kender
Judge – Zach Loeb
Judge – Amber Balester
Judge – Colten Brickler
Jissell Muir
Senuda Rajapakse
Kamal Taha
Olga Mikhalchishina

I also want to give a special shoutout to all those conference attendees who stayed for the competition. I know the students appreciated all the insight and information they received.
Alyssa Massais is the Student Design Competition

The Wastewater Student Design Competition team winners from the University of South Florida.
The Environmental Student Design Competition team winners from the University of Florida.

Grow your septage, FOG, and sludge receiving business with a Raptor Septage Acceptance or Complete Plant.
REPRESENTED LOCALLY BY:
Trippensee Shaw, Inc. Eustis, Sebring, & Boca Raton, FL T: 407-222-0575 www.TrippenseeShaw.com

Florida Panhandle Only T: 205.424.7570 www.eshelmancompany.com

NOT YOUR ORDINARY RECEIVING SYSTEM
Raptor Septage Acceptance Plant
Removes debris and inorganic solids from municipal and industrial septage, FOG, and sludge. This heavy-duty machine incorporates the Raptor Fine Screen for screening, dewatering and compaction. Accessories include security access and automated accounting systems.
Raptor Septage Complete Plant
With the addition of aerated grit removal, the Septage Acceptance Plant is offered as the Raptor Septage Complete Plant.

Speak to one of our experts at 630.837.5640, email us at
Why, When, and How to Do a Free Chlorine Burn in Chloraminated Distribution Systems to Mitigate Nitrification
Michael Bailey, Paul Thompson, Monty Sedlak, Kevin Stone, and Veronica Llaneza
The City of Pembroke Pines (city), like many utilities in south Florida, utilizes chloramine to minimize microbial activity in the distribution system, since it provides longer-lasting disinfection as the water moves through pipes to consumers. As chloramine breaks down over time, however, free ammonia is produced as a byproduct. Free ammonia acts as a source of food for bacteria, now ammoniaoxidizing bacteria (AOB), which convert the free ammonia into nitrite. Nitrite also serves as a food source for additional bacteria known as nitrite oxidizing bacteria or nitrifying bacteria. As the
within the distribution mains and chlorine demand increases, which in turn depletes the residual chloramine concentration and increases the release of free ammonia. As a result, the cycle repeats itself at a faster rate, leading to nitrification issues and reduction of water quality in the distribution system.
To address this issue, the temporary conversion to free chlorine (chlorine burn), which is a stronger disinfectant compared to chloramine, allows the Pembroke Pines Water Treatment Plant (WTP) to “cleanse” and maintain its entire distribution system. The chlorine burn is a common practice by many public water


Michael Bailey, P.E., is utilities director, and Paul Thompson is assistant utility director, with City of Pembroke Pines. Monty Sedlak, PMP, is project director, and Kevin Stone is water plant chief operator, with Jacobs. Veronica Llaneza, Ph.D., is regional technical specialist with Jacobs in Hollywood.
systems throughout the United States to reduce the number of the bacteria so that a satisfactory disinfectant residual can be maintained throughout the distribution system. Chlorine conversions can be used as a preventative strategy or to stop nitrification, which may diminish water quality.
The city conducts a routine annual switch from chloramine to free chlorine disinfectant, which is an industry best practice operational strategy and a preventative and proactive maintenance measure to mitigate bacteria growth buildup; this, however, can make the preservation of disinfection residual challenging.
In order to switch to free chlorine disinfection, operations changes were done at the WTP, and at the two remote storage tanks and booster stations: Holly Lake Booster Station and Academic Village Booster Station. One month prior to the start of the disinfection event, extensive public outreach was conducted to inform residents of the upcoming free chlorine switch in the drinking water. Information is posted on the city’s website and included with water billing documents send out to residents. Neighboring utilities with interconnections, medical centers, and aquariums are also made aware of the temporary disinfection change, as it could impact their operations.
The WTP, located in south Florida, operates an 18-mil-gal-per-day (mgd) rated lime softening plant with an average demand of 13 mgd. The water is softened via solid-contact clarifiers, recarbonated with carbon dioxide, filtered with dual-media gravity filters, disinfected with sodium hypochlorite, and post-treated with anhydrous ammonia and fluoride prior to flowing into the distribution system. A portion of
Continued on page 10
Figure 2. Flushing and sampling locations in the Pembroke Pines distribution system.
Figure 1. Pembroke Pines Water Treatment Plant.


1. POLYMER REDUCTION: P6 PolyMix® Systems reduce polymer consumption by providing complete polymer/sludge mixing in a shear-sensitive manner. This patented mixing process allows long-strand polymer chains to remain intact and unbroken and wastewater floc to remain intact and unsheared. Typical applications result in a 25-50% REDUCTION IN POLYMER CONSUMPTION, thus saving the customer thousands of dollars in polymer expenses. By not breaking up the polymer chains, the dewatering equipment will experience less fouling, providing more reliability and reducing equipment cleaning costs.
2. DRIER CAKE SOLIDS: P6 PolyMix® technology optimizes the polymer and sludge mixing process, allowing INCREASE DEWATERED SOLIDS CONCENTRATION and INCREASED PERCENT SOLIDS CAPTURED. This unique mixing process results in more efficient sludge hauling, allowing customers to transport less water and more dewatered cake off-site.
3. ELIMINATION OF PUMP MAINTENANCE: P6 PolyMix® technology reduces pump parts and maintenance by utilizing the abrasion-resistant Discflo pumping principles of Boundary Layer/Viscous Drag. This principle can save the customer thousands of dollars in parts and maintenance over the lifetime of the equipment. All P6 PolyMix® systems in the municipal market include a 10-YEAR (extendable to 20 years) 100% WET END WEAR WARRANTY, No other pump manufacturer in the industry provides a wear warranty, let alone a 20-year wear warranty!
4. PUMPS & MIXES: P6 PolyMix® technology uses the unique principles of Boundary Layer/Viscous Drag for mixing polymer versus a mixer/check valve; this, paired with its unique InjeX™ polymer injection mixing chamber, is designed for MINIMAL POLYMER DEGRIDATION, allowing for maximum polymer savings. The hydraulic shear forces within the mixing pump provide a complete homogeneous wastewater polymer slurry fed to the dewatering equipment without breaking the long chain polymers or reducing floc size.
5. LOWER OPERATING PRESSURE AND INSTALLED HORESPOWER: P6 PolyMix® technology dramatically reduces the operating pressure by reducing back pressure within the piping system due to eliminating mixer/check valves. In some applications, customers have had a 75% REDUCTION IN PRESSURE Lower pressure allows the feed pump to operate at lower horsepower. HORSEPOWER SAVINGS OF UP TO 50% OR MORE are possible by installing a P6 PolyMix® system. Customers can see substantial long-term energy savings and reduced upfront capital costs associated with lower installed horsepower.
6. HOW IS IT APPLIED: P6 PolyMix® systems entirely replace bulky, expensive, outdated traditional sludge feed pumps. You can now replace thousands of dollars in equipment and regain valuable real estate space by switching to P6 PolyMix® and utilizing its unique compact design, patented process for eliminating mixer/check valves, and ultra-efficient polymer mixing process. Contact us to learn how P6 PolyMix® can revolutionize the efficiency of your BELT FILTER PRESSES, GRAVITY BELT THICKENERS, ROTARY THICKENERS, SCREW PRESSES, AND CRENTIFUGES.
the softened-filtered water is also treated by ion exchange (IX) trains for additional color removal before being mixed with postchloraminated and filtered water in the clearwell. Figure 1 illustrates Pembroke Pines WTP, with the IX unit on the left and the accelerators and solid-contact clarifiers on the right.
When a free chlorine conversion is conducted, the ammonia gas feed shuts down, along with the ion exchange unit, to prevent fouling from free chlorine on the resins. Sodium hypochlorite levels are monitored at the finished water continuously and adjusted until a 3.5 mg/L total and free chlorine residual target is reached. Additionally, the pH of the lime softening accelerators is increased from a normal operation target point of 10.3 to 10.8 to mitigate organic
compounds that may cause color issues, normally removed via ion exchange.
The remote storage site of the Holly Lake Booster Station, located on the western border of the distribution system, includes two 2.5-milgal tanks that are connected in parallel. An existing ammonia feed system is shut down 24 hours prior to the switch to free chlorine. There’s no ammonia feeding into the remote storage, and sodium hypochlorite feed systems are also adjusted until a 3.5 mg/L total and free chlorine residual is reached in both booster stations.
During the free chlorine burn event, continuous flushing at six specific locations is performed at a low flow of approximately 20 gal per minute (gpm) to draw free chlorinated water into these areas at a faster rate. Figure 2 illustrates the flushing locations (green icons) that represent areas with historically higher water
age compared to other areas in the distribution system. High-velocity flushing is also performed at the same locations for physical scouring of the distribution main, along with free chlorine disinfection for increased biofilm removal. Highvelocity flushing commences the second week of the free chlorine disinfectant event and is done daily for 20 minutes at a 500-gpm flowrate, or until turbidity levels of below 0.5 nephelometric turbidity units are reached at the hydrants. Water quality parameters, such as free and total chlorine residual, nitrite, pH, and monochloramine, were measured and logged daily at 10 locations displayed in Figure 2 (both green and blue icons) to track progress of free chlorine and monochloramine concentrations throughout the free chlorine disinfectant event and confirm conversion of disinfectant.
Results and Discussion
Daily water quality parameters were measured at the specific locations for an overall representation of chlorine residual within the distribution system. Throughout the system, the median total chlorine residual during the length of the burn in 2024 was 2.22 mg/L. Residual levels were higher compared to previous years, with levels of 2.09 mg/L in 2023, 1.40 mg/L in 2022, and 1.75 mg/L in 2021, indicating a yearly improvement in the main with reduced biofilm and nitrification.
Figure 3 illustrates chlorine residual and total free and monochloramines, with total and free chlorine levels having almost identical trends and no monochloramines detected during the free chlorine event, confirming that a free chlorine disinfection burn was achieved in the entire distribution system. The highlighted
Continued on page 12
Table 1. Weekly Historical Water Parameters
Figure 3. Median chlorine residual levels in the distribution system for the 2024 disinfection event.
Figure 4. Median nitrite and free ammonia levels in the distribution system for the 2024 disinfection event.
At Jacobs, we think differently about water. We view all water as a valuable resource and work with clients to tackle the issues that impact communities: climate, safety, reliability, flooding and scarcity.
By looking at water through a OneWater lens we move beyond traditional silos, bringing an inclusive approach to developing a sustainable and equitable water future for all.
We integrate planning, implementation, and operations to develop local solutions that optimize the global water cycle and maximize synergies across markets.
Let us show you how our OneWater approach provides our clients and communities the foundations they need to flourish and grow.

sections illustrate when the conversion from and to chloramines occurred. As viewed, it took one day to fully convert the entire distribution system to free chlorine (no monochloramine [NH2Cl]), with flushing efforts accelerating this process.
Figure 4 shows the nitrite levels from the 10 locations in the distribution system as described. As viewed, nitrite concentrations were low, with median nitrite residuals of 0.002 mg/L. One day after the start of the disinfection event, nitrite levels were way below the primary maximum contaminant levels at the entry to the distribution system of 1 mg/L and below recommended levels of < 0.2 mg/L in the distribution system. Free ammonia concentrations were undetected in the distribution system and below the recommended levels of < 0.1 mg/L. Concentration levels confirm that chlorine has been effective in removing nitrite, a food source for bacteria, from the distribution system early on during the disinfection event.
Table 1 provides historical weekly average levels of water quality parameters measured
Historical Nitrification Levels Nitrite Target NO2
during the last four disinfection events. Monochloramine levels during all events were undetectable, while total and free chlorine levels in the 2024 disinfection event were higher than previous years and nitrites almost undetectable. The elevated levels of chlorine can be due to the distribution flushing efforts that occurred this year, and the annual maintenance of the system, which reduced biofilm buildup in mains, thus increasing chlorine residual. Flushing helps draw free chlorine out into the distribution system and to low water usage points in the distribution system, while high velocity helps scour the mains of debris and biofilm and improves the reduction of nitrification.
As viewed, nitrite levels are significantly reduced during the first week and continue to be minimal and/or plateau for the remainder of the disinfection event. This trend is noticed in all past disinfection efforts.
Figure 5 illustrates historical nitrite concentrations in the distribution system. As shown, the nitrite levels within the system are
at the lowest levels after a free chlorine switch, performed typically before the summer, when temperature increases and nitrification is more prone to occur. This cyclical trend is clear, as nitrite levels gradually increase throughout the year; however, the rise of nitrite levels was slightly delayed this year compared to previous years. The delay in nitrite concentrations above the 0.2 mg/l recommended target limit, prior to initiating a free chlorine disinfection event, can be attributed to increased routine efforts of flushing the distribution system on a routine basis, along with water quality within the system and reduced biofilm buildup due to best maintenance practices.
As previously mentioned, free ammonia is a byproduct of chloramine when it breaks down over time. Free ammonia acts as a source of food for the AOB. The AOB convert free ammonia into nitrite, which then become a food source for additional bacteria known as nitrite oxidizing bacteria (NOB). As the biological activity increases, chlorine demand and biofilm increases, which in turn depletes the residual chloramine concentration and increases the release of free ammonia. Figure 6 illustrates the nitrification cycle.
When the water system stops adding ammonia, as in the case of chloramine production, the bacteria starve. A periodic conversion to free chlorine is then effective in inactivating these types of bacteria in piping with biofilm by interrupting the supply of ammonia and preventing subsequent issues from occurring. In some cases, prolonged or insufficient maintenance of the system can gradually build up an excessive amount of ammonia over long periods of time. The AOB (using ammonia as a food source) can bloom and cause a loss of disinfectant residual. As a result, the water system may not be able to maintain the minimum required disinfectant residual in the distribution system, creating a regulatory compliance issue that may result in customer complaints regarding taste and odor. The conversion to free chlorine, in conjunction with physical scouring of the mains achieved by high-velocity flushing activities, assists in removing excess film from the distribution system and starves these bacteria. The chlorine conversion helps the system return to an environment where the disinfectant residual can be maintained, thus leading to an overall improved water quality to customers.
Once the two-week period of free chlorine disinfection was concluded and water quality results demonstrated complete conversion of the system, with significant or undetectable levels of nitrification parameters, normal operations were resumed, with the ammonia feed and ion exchange unit back in operation.
Figure 6. Nitrification cycle resulting from the addition of chloramine.
Figure 5. Monthly average distribution nitrite concentrations.
Conclusions and Recommendations
Overall, the free chlorine disinfection event annually performed demonstrates a continuous improvement and maintenance on the distribution mains, as reflected in the data collected during and after the event, as well as compared to previous years. After the free chlorine disinfection event, nitrite and free available ammonia levels were reduced or undetected throughout the distribution system. Chlorine residuals, both free and total, remained at the target levels during and after the free chlorine conversion was completed.
Since nitrite levels rapidly reduced at the beginning of the disinfection event, it’s recommended that the duration of the chlorine burn event remain at approximately two weeks instead of the three weeks done in previous years. The time reduction of free chlorine in the system better aligns with recommended American Water Works Association guidelines of a maximum chlorine burn duration of 21 days. It’s anticipated that the same results and effects will be accomplished if free chlorine levels are distributed throughout the system during the first few days and flushing efforts continue. Furthermore, unidirectional highvelocity flushing evaluation is suggested to further clean out the mains, in addition to reducing water loss volume.
Efforts to continue improving water quality include an overview of the water age in the distribution system as it pertains to storage tanks levels, and turnovers at the Holly Lake Booster Station and Academic Village Booster Station. An evaluation of storage volume capacity to meet maximum daily demands, plus fire protection flow requirements, while further reducing water age within the distribution system, is underway.
The temporary conversion to free chlorine, which is a stronger disinfectant compared to chloramine, allowed the city’s WTP to maintain the integrity of its entire distribution system by mitigating biofilm buildup and scouring the main of debris. The routine annual temporary switch to free chlorine is proven to reduce water quality issues that can occur throughout the year, but especially during the summer months, when nitrification issues tend to be prevalent. To mitigate nitrification levels, routine distribution flushing at specific areas is ongoing after the free chlorine burn event to provide adequate disinfectant to dead ends and maintain low water age in the system.
The efforts describe herein ensure reliable high water quality is provided to the city’s residents. S
What Do You Know About Wastewater Lagoons? Test Yourself

Charlie Lee Martin Jr., Ph.D.
1. One of the key features of aerated lagoon treatment is
a. a deep depth and a small plan view surface area.
b. diffused aeration.
c. a short liquid detention time.
d. a large liquid detention time.
2. The depths of most aerated lagoons range from
a. 4 to 7 meters (13 to 23 feet).
b. 5 to 9 meters (16 to 29.5 feet).
c. 1 to 3 meters (3 to 10 feet).
d. None of the above.
3. The required liquid detention times for nitrification within aerated lagoons range from
a. one to three days.
b. two to four days.
c. three to five days.
d. five to 25 days.
4. Stabilization lagoons are lagoons that utilize the actions of
a. phototrophic and heterotrophic microorganisms.
b. autotrophic and nitrifying microorganisms.
c. nitrifying and heterotrophic microorganisms.
d. None of the above.
5. Which is true concerning stabilization lagoons?
a. They rely on algae.
b. They rely on cyanobacteria.
c. They have an aerobic environment in the upper zones of the lagoon.
d. All of the above.
6. The characteristic mode of operation of stabilization lagoons can be subdivided as
a. aerobic.
b. facultative.
c. anaerobic.
d. All of the above.
7. Typical depths of aerobic stabilization lagoons are
a. 0.3 to 1.2 meters (1 to 4 feet).
b. 2 to 4 meters (7 to 13 feet).
c. 3 to 5 meters (10 to 16 feet).
d. 6 to 7 meters (20 to 23 feet).
8. The upper portion within facultative stabilization lagoons is kept
a. anerobic.
b. anoxic.
c. aerobic.
d. None of the above.
9. The bottom portion within facultative stabilization lagoons is kept
a. anerobic.
b. anoxic.
c. aerobic.
d. None of the above.
10. Biochemical oxygen demand reduction within anaerobic stabilization lagoons occurs through
a. nitrification.
b. denitrification.
c. methanogenesis.
d. None of the above.
Answers on page 62
References used for this quiz:
• Environmental Biotechnology: Principles and Applications First Edition
FWEA CHAPTER CORNER
Welcome to the FWEA Chapter Corner! The Member Relations Committee of the Florida Water EnvironmentvAssociation hosts this column to celebrate the success of recent association chapter activities and inform members of upcoming events. To have information included for your chapter, send details to Melody Gonzalez at gonzalezm@bv.com.

FWEA Central Florida Chapter: 2023-2024 Update
Tucker Hunter
Six years ago, I was invited to a FWEA Central Florida Chapter meeting by my supervisor as a way to be involved with a professional organization. Little did I know that from going to that one meeting I would have the opportunity to serve as the 2023-2024 chair for the chapter. Having the opportunity to serve as chair over this last year has been one of growth and truly one to remember. Our success this year started with having 26 sponsors that have continued to trust in us to be able to give back to the local water/wastewater community. Next, our amazing volunteers have put in countless hours to make sure events are planned and successfully happen. This organization cannot run without these two things, and I am extremely grateful to have served alongside our sponsors and volunteers. Thanks to our team, we were able to host the following events:
S 2nd Annual Fishing Tournament
S 23rd Annual Golf Tournament
Florida and Florida Institute of Technology students
S Multiple happy hours and joint events with our local FSAWWA partners
Additionally, this year we tried new ventures and partnerships that we believe will lead to future events for our chapter, which included the Operations Challenge with the BioWizards and a happy hour that was cohosted with local utilities.
Thanks to our generous sponsors, we were able to donate funds from the annual golf tournament and general funds to student scholarships and provide funding to support the FWEA general fund as a way to pay it forward to the next generation of water/wastewater leaders.
I want to personally shout out about our chapter’s success over these last few years, which have led to multiple committee members receiving various positions and recognitions: S Colten Brickler, P.E., Young Professional of the Year

Megan Nelson, P.E., Executive Committee
Thank you all for your hard work and continuation with leading the future success of FWEA.
Again, we would not be able to make all of these events happen without the support of our 2023-2024 sponsors and volunteers. If you would like to know more about the FWEA Central Florida Chapter or are interested in joining, please reach out to the committee members below:
S Meera McKie, P.E., chair; MMcKie@Carollo. com
S Colten Brickler, P.E., vice-chair; Colten. Brickler@Kimley-Horn.com
S Mike Demko, P.E., director at large; mdemko@wadetrim.com
S Tucker Hunter, P.E., past chair; Tucker. Hunter@Kimley-Horn.com
Tucker Hunter, P.E., was the 2023-2024 FWEA Central Florida Chapter Chair. S


Melody Gonzalez
Operators: Take the CEU Challenge!
Members of the Florida Water and Pollution Control Operators Association (FWPCOA) may earn continuing education units through the CEU Challenge! Answer the questions published on this page, based on the technical articles in this month’s issue. Circle the letter of each correct answer. There is only one correct answer to each question! Answer 80 percent of the questions on any article correctly to earn 0.1 CEU for your license. Retests are available.
This month’s editorial theme is Disinfection and Water Quality Look above each set of questions to see if it is for water operators (DW), distribution system operators (DS), or wastewater operators (WW). Mail the completed page (or a photocopy) to: Florida Environmental Professionals Training, P.O. Box 33119, Palm Beach Gardens, Fla. 33420-3119, or scan and email a copy to memfwpcoa@gmail.com. Enclose $15 for each set of questions you choose to answer (make checks payable to FWPCOA). You MUST be an FWPCOA member before you can submit your answers!
EARN CEUS BY ANSWERING QUESTIONS FROM PREVIOUS JOURNAL ISSUES! Contact FWPCOA at membership@fwpcoa.org or at 561-840-0340. Articles from past issues can be viewed on the Journal website, www.fwrj.com.
Water Quality and Resiliency: Considering the Future of Elevated Storage Tanks
Kristiana S. Dragash, Katherine Gilmore, and Brooke D. Bailey (Article 1: CEU = 0.1 DW/DS02015439)
1. What is the primary function of elevated storage tanks (ESTs)?
a. Community identification
b. To mitigate drops in water pressure
c. To increase water pressure
d. To meet peak water demand
2. Why do many ESTs now face challenges?
a. They are too small
b. They are too old
c. They remain full during various operating and demand conditions
d. They are too expensive to maintain
3. What has increased to serve the growing demand in distribution systems?
a. Water quality
b. Operating pressures
c. Number of storage tanks
d. Water temperature
4. What tool did the City of Punta Gorda use to optimize system operations?
a. Hydraulic modeling
b. Geographic information systems
c. Water quality testing
d. Pressure sensors
5. During which condition was high water age experienced in Punta Gorda’s distribution system?
a. Peak demand b. Average day demand
c. Low demand d. Emergency conditions
Why, When, and How to do a Free Chlorine Burn in Chloraminated Distribution Systems to Mitigate Nitrification
Michael Bailey, Paul Thompson, Monty Sedlak, Michael Cepeda, Jason Cardenas, and Veronica Llaneza (Article 2: CEU = 0.1 DW/DS02015440)
1. What byproduct is produced when chloramine breaks down?
a. Nitrite
b. Free ammonia
c. Nitrate
d. Hydrogen peroxide
2. Why is a free chlorine burn conducted in the distribution system?
a. To increase water pressure
b. To reduce nitrification and improve water quality
c. To add fluoride to the water
d. To remove heavy metals
3. How often does the City of Pembroke Pines switch from chloramine to free chlorine?
a. Monthly
c. Biannually
b. Annually
d. Every five years
4. What is the target total and free chlorine residual during the conversion?
a. 1.5 mg/L
c. 3.5 mg/L
b. 2.5 mg/L
d. 4.5 mg/L
5. What is the purpose of increasing the pH during the free chlorine conversion?
a. To enhance color removal
b. To reduce chlorine demand
c. To increase microbial activity
d. To lower water hardness
FSAWWA Took Active Role at ACE24, Showcasing Dedication and Contributions to the Water Industry!

IMarjorie Guillory Craig, P.E. Chair, FSAWWA
n June, the AWWA Annual Conference and Exposition (ACE 24) was held in Anaheim, Calif., and the Florida Section AWWA had remarkable representation!
Our section staff secured prime seating and displayed signs at the opening general session, where our section attendees enthusiastically cheered louder than any other section (based on what I could tell). The FSAWWA staff also organized a wonderful luncheon on Tuesday for Florida attendees, which was both enjoyable and well-attended.
Throughout ACE24, Florida’s strong presence was evident. One of the most moving and meaningful moments for me was AWWA’s recognition of our executive director, Peggy Guingona, who plans on retiring at the end of the year and passing the reigns to our deputy executive director, Kim Kowalski. It was very clear how immensely well-respected and loved Peggy is among the AWWA community, including staff members from other sections. There wasn’t a dry eye in the house during her recognition.
Another moving and incredible moment was witnessing Kim Kowalski receiving the prestigious AWWA George Warren Fuller Award, an honor given annually to a distinguished member from each AWWA section. What an incredible honor for her, and seeing Kim receive this award was profoundly meaningful to me.
Our section’s contributions didn’t stop there. The AWWA’s Water Equation program hosts an annual fundraiser called We Walk! and we won several awards related to this event.
S Most Money Raised by a Section: Peggy Guingona and Ken Broome (section trustee) accepted the award on behalf of the section.
S Top Individual Fundraiser: Received by Terri Holcomb, director of engineering, at Peace River Manasota Regional Water Supply Authority.
Florida also shone brightly in ACE24 contests.
S Best Tasting Drinking Water Contest: Zephyr Hills and Citrus County utilities sent water samples. We had two because last year the samples got lost on the way to ACE23 in Toronto!
S Best Tasting Drinking Water Judging Panel: Ari Copeland from Black and Veatch, an AWWA vice president and one of our own, served as a judge.


S Top Ops Competition: Bonita Springs Utilities competed in the contest.
S Hydrant Hysteria: JEA (formerly Jacksonville Electric Authority) competed in the men’s and women’s categories.
S Pipe Tapping Contest: JEA competed this year.
Numerous Florida section members presented papers and conducted training sessions. Highlights included Dr. Fred Bloetscher, from Florida Atlantic University, who delivered his annual training to water industry officials, and Shea Dunifon, with JEA, who provided training to AWWA association section staff and participated in a panel on AWWA’s Project WET initiative, which provides water industry education programs for youth.
Whoo-hoo—I’m so proud to be from Florida and our Florida section! I’ve included a number of photos of section attendees and events from the ACE24 conference.
AWWA and the Safe Drinking Water Act: Pillars for Safe Drinking Water and Improved Water Quality in the U.S.
The theme of the magazine this month is disinfection and water quality and my column delves into the history, roles, and impacts of AWWA and the Safe Drinking Water Act (SDWA) in maintaining and improving water quality across the United States. To that end, many AWWA members were actively involved in the passage of, and amendments to, the SDWA and made significant contributions in shaping this landmark legislation.
Access to safe drinking water is a fundamental public health goal. In the U.S., AWWA and the SDWA have played pivotal roles in ensuring the quality and safety of drinking water.
A Better World Through Better Water
The AWWA offers education to water professionals, advocates for safe and sustainable
Revolutionize Water Management with Grundfos' Demand Driven Distribution
25% Energy Savings: Reduces unwanted energy consumption efficiently.
15% Leakage Reduction: Fewer leaks and bursts mean less water wastage.
35% Decrease in Pipe Bursts: Enhanced network durability and reduced repair costs.
Optimal Pressure Management: Maintains ideal pressure, minimizing wear and extending system lifespan.
Low Maintenance: Battery-driven sensors and once-daily data transmission ensure a cost-effective solution.
Improved Operational Comfort: Guarantees optimal pressure at critical network points, prioritizing service optimization.


Continued from page 16
water, collects and shares knowledge, and creates volunteer opportunities. I have also found that it fosters a collaborative professional community and family, both at the state and association level.
We’ve Been Around a Long Time
Founded in 1881, AWWA is an international, nonprofit, scientific, and educational association dedicated to improving water quality and supply. With over 50,000 members, including utilities, engineers, scientists, contractors, consultants, manufacturers, industry support members, and policymakers, AWWA is the world’s largest organization of water supply professionals. This membership includes over 4300 utilities that supply about 80 percent of the nation’s drinking water.
Our mission is: “A better world through better water.” I think that’s simple, elegant, and profound. The tagline for AWWA is, “Dedicated to the World’s Most Vital Resource,” which ties in with our mission of “providing solutions to effectively manage water, the world’s most vital resource.” Our
AWWA attendees at the George Warren Fuller Breakfast are (left to right) Donna Metherall, Jenny
Arguello, Richard Anderson, Kim
Kowalski, Greg Taylor, Peggy Guingona, Terri Holcomb, and Marjorie Craig.
core principles include protecting public health and the environment, strengthening public trust, and shaping water’s future. These all help enhance the quality of life by ensuring safe and reliable drinking water.
The AWWA board of directors recently approved the 2030 strategic plan to help lead us into the future. Richard Anderson, of Peace River Manasota Regional Water Supply Authority, is an AWWA director, and Ari Copeland, of Black and Veatch, is an AWWA vice-president, and both serve as our Florida Section board of governor members of AWWA. They do a fantastic job of representing our section!
The AWWA strives to be the association of choice in the water community for member experience and professional growth. We help achieve our vision, mission, and goals through:
S Standards Development. Creating and updating over 180 consensus standards for water treatment, storage, and distribution.
S Education and Training. Offering a wide range of educational resources, including conferences, workshops, and publications, to keep water professionals informed about

the latest research, technologies, and best practices.
S Advocacy. Working with government agencies, legislators, and other stakeholders to shape water policy and regulations.
S Research. Conducting and supporting research to advance the science and technology of water management and treatment through the Water Research Foundation.
Key Contributions
The main contributions of AWWA to the water industry include:
S Technical Standards. The AWWA standards are widely recognized and used globally to ensure water treatment and distribution systems meet rigorous quality and safety criteria.
S Operator Certification. The association plays a crucial role in certifying water treatment operators, ensuring they have the necessary skills and knowledge to manage water systems effectively.
S Publications and Resources. The AWWA publishes numerous manuals, journals, and books that serve as authoritative references for water professionals.
The Safe Drinking Water Act: Background and Objectives
The SDWA, enacted in 1974, is the principal federal law in the U.S. that ensures the quality of drinking water for all Americans. The act authorizes the U.S. Environmental Protection Agency (EPA) to set national health-based standards for drinking water to protect against both naturally occurring and manmade contaminants.
The main objectives of the SDWA are to:
S Protect Public Health. Establish standards to prevent health problems related to contaminants in drinking water.


Attendees from Florida Section AWWA enjoy the section luncheon.
From left to right, Shea Dunifon, David O’Connor, and John Etgen, make presentations about Project WET at the children’s water industry education panel.
Florida Section
S Regulate Public Water Systems. Ensure that water suppliers meet these standards and provide safe water to consumers.
S Ensure Source Water Protection. Implement measures to protect water sources from contamination.
Key Provisions
The main provisions of the SDWA include:
S National Primary Drinking Water Regulations
• The EPA sets enforceable health standards for contaminants that may be found in drinking water.
• These standards include maximum contaminant levels and treatment techniques.
S Monitoring and Reporting
• Public water systems must regularly monitor their water for contaminants and report the results to state agencies and EPA.
• Consumers must be informed about the quality of their drinking water through annual Consumer Confidence Reports— soon to be twice annual or biannual, in response to a newly passed law.
S Enforcement and Compliance
• The EPA, along with state and local agencies, enforces compliance with the standards.
• Noncompliance can result in penalties and mandatory corrective actions.
S Funding and Assistance
• The SDWA provides financial assistance to states and water systems through the Drinking Water State Revolving Fund, which supports infrastructure improvements and other projects to ensure safe drinking water.
Impact and Achievements
The SDWA has significantly improved the quality of drinking water in the U.S. Since its enactment, it has led to the development and implementation of more-stringent standards and regulations and reducing the prevalence of waterborne diseases and contaminants, which helps reduce illness and save lives, thereby improving the quality of life.
Success Stories
S Reduction in Lead Contamination. Regulations under the SDWA, such as the Lead and Copper Rule, have significantly reduced lead levels in drinking water, protecting public health, particularly for vulnerable populations, like children and older adults.


S Control of Disinfection Byproducts. The SDWA has led to stricter controls on byproducts of water disinfection processes, which can pose health risks if not properly managed.
AWWA and SDWA: Partners in Water Quality
The AWWA and the SDWA are cornerstones of the commitment of the U.S. to providing safe, high-quality drinking water.
Through AWWA’s efforts in setting standards and educating professionals, and the SDWA’s regulatory framework, the U.S. has made significant strides in protecting public health and ensuring reliable access to clean water. As challenges to water quality continue to evolve, the collaborative efforts of these entities remain crucial in safeguarding this vital resource for future generations.
I am so proud to serve the public and our section and help in any way to promote quality water.
Peggy Guingona, FSAWWA executive director, is honored at the conference.
Florida Section AWWA Water Equation We Walk! award winners and attendees.
Dr. Fred Bloetscher (at podium) teaching the water officials class.
TECHNOLOGY SPOTLIGHT

Smarter Solutions for Water Utilities
Advances in cellular technology have led to morerobust solutions for utility operations. Water utilities and municipalities that adopt cellularbased advanced metering infrastructure (AMI) are experiencing enhanced reliability and costeffective solutions for many common challenges.
Four Benefits of Cellular Metering
Modern cellular water devices, like Itron’s Cellular 500W ERT, can run for 20 years uninterrupted, transmit data multiple times daily, and capture granular data for you and your customers.
The benefits of cellular AMI outweigh the total cost, but let’s focus on four key advantages:
S Less Upfront Costs. Cellular AMI typically requires less capital investment since the utility doesn’t need to build or maintain infrastructure. You won’t have to wait around for network deployment or installation. Plus, you benefit from quicker payback by utilizing existing cellular infrastructure and not waiting on delayed benefits.
S Flexibility. Current networks are now backward compatible, ensuring longer product compatibility for 4G LTE devices on 5G networks and beyond. Also, your transition can be as gradual as needed. For example, Itron’s cellular communications modules support radio frequency communications, so you can augment your existing automated meter reading (AMR) service and then easily migrate from mobile AMR to cellular AMI as budgets allow, your current endpoints reach their end of life, etc.


You can also deploy Itron’s AMI network in hybrid configurations to ensure maximum efficiency and reliability in high- and lowdensity meter populations.
S Resiliency. Today’s cellular networks are more resilient and reliable than ever, even in extreme weather. Cellular AMI systems use fewer network devices that could be damaged or missing following a disaster, and cellular providers conduct year-round disaster preparedness checks and utilize backup systems, like batteries, generators, and even satellite-based network assets.
S Improved Service. Real-time usage data enables accurate billing and enhanced communication. Itron’s Temetra™ customer portal allows customers to monitor usage and receive notifications of outages, maintenance, emergencies, potential leaks, high bills, and more. Real-time Temetra notifications help your utility identify field issues and

anomalies, manage water resources effectively during storms and floods, and maintain a healthy overall network.
From Smart Water to Smart Networks
You can also transform your distribution systems beyond metering. Cellular-enabled sensors, such as leak detectors and remote shutoff valves, create a water-oriented smart network.
Analytics software, like Temetra, can pull data from these sensors, providing a real-time view of distribution and enabling proactive responses to issues. Predictive analysis can also anticipate problems, like main breaks, helping reduce nonrevenue water.
Cellular technology is employed in various applications, from utility metering to intelligent streetlights, sewer overflows, and environmental sensors. This gradual digitalization of public assets helps cut long-term costs, expand awareness, reduce carbon footprints, and make communities safer and healthier.
Future-Proof Your Operations
The digital transformation of water utilities, driven by cellular technology and smart devices, is accelerating. Stay ahead of the curve by partnering with United Systems and Itron to create a more efficient, sustainable, and customer-focused water utility.
Our advanced solutions are designed to future-proof your operations. Visit www. united-systems.com/contact to schedule a consultation today. S


Hashtag This: Youth Education is Always Trending —and Certainly at #ACE24!
Shea Dunifon
#ICYMI, the 143rd AWWA Annual Conference and Exposition (ACE24) happened the week of June 9-13 in Anaheim, Calif. Over 10,000 attendees participated in everything from workshops, technical sessions, facility tours, and committee meetings, to walking the expansive floor of the exhibit hall. The Florida Section of AWWA (FSAWWA) was recognized with our own Technical and Education Council chair, Dr. Bina Nayak, receiving an award for one of her many publications, and Terri Holcomb, FSAWWA board secretary, for raising $8,000 for We Walk! With so much to do (and celebrate), I knew I couldn’t risk the #FOMO!
While you might be thinking, “What does FOMO mean?” (fear of missing out; and ICYMI in the first paragraph is “in case you missed it”), when used on social media, hashtags can help increase visibility and allow you to search for content by a keyword or hashtag. And while this isn’t social media, youth education in the water industry always deserves more visibility because we need to better engage the next generation. With phones in hand, those in the next generation aren’t
influence through social media, consumer trends, and even politics. That means our industry’s ability to educate and communicate with the younger generations must also evolve. After all, #NoWaterNoPhone.

In a postpandemic world, traditional classroom settings are still the norm. For anyone seeking lesson plans on water-related topics, Project WET, a 401(c) that creates K-12 student content on the natural water cycle, as well as the human-engineered one, offers a portfolio of resources. John Etgen, chief executive officer of Project WET, and I had an opportunity to present some of the materials available to several AWWA section staff. Using hands-on activities and demonstrations, Project WET is designed to promote water literacy—that is, knowing where your water comes from and

information, to donate, or to browse the Project WET catalog, please visit www.projectwet.org.
Inside the exhibit hall, ACE featured an area, the Innovation Hub, for smaller panel discussions on emerging topics. At one of the panels held there, Veronica Cavera, education and workforce manager for AWWA , led a panel discussion titled, “Empowering Futures: Nurturing the Stewards of Tomorrow Through Water Education.” The panel featured David O’Connor, business development leader at HDR; John Etgen; and me. While the issue of youth education isn’t an innovative topic itself, how we as an industry are engaging with youth does require some innovative and outof-the-box approaches. That includes how we communicate with #GenXers, as well as how we communicate about them. (It wasn’t irony that we held a panel inside the exhibit hall as opposed to a traditional session.)
Kicking off the panel with an example lesson plan from Project WET’s “Foundations of Water Education” John performed a visual demonstration of the activity “A Drop in the Bucket” where we heard the audience try to guess the percentages of fresh water on Earth, beginning with what percentage is in the ocean versus freshwater. From a 1000-milliliter (mL) graduated cylinder, John poured 30 mL (or 3 percent to


From left to right, Veronica Cavera, AWWA; David O’Connor, HDR; John Etgen, Project WET; and Shea Dunifon, JEA, presenting at the Innovation Hub.
Shea (left) with Terri Holcomb, FSAWWA board secretary.
represent freshwater) into a cup. The audience then tried to guess what percentage was frozen in glaciers and unavailable. The activity culminated with a literal drop in the bucket representing the available fresh water on our planet. In addition to books with lesson plans, Project WET’s portfolio also includes a 15-page student booklet on water reuse that I highly recommend (after all, I am #ReclaimShea with purple hair).
David, who has been instrumental in helping Pinellas County’s Seminole High School (SHS), which is one of four FSAWWAapproved high school academies that allows high school students to test for their D or C wastewater license exam during their senior year, played a video that highlighted the use of bathymetric drones, which acquire data from coastal and inland waters, at SHS. Not only does technology help get students excited about careers in water, but it allows students a hands-on approach to learning. For many students, the hands-on component of learning is important because it not only helps them make connections, but research shows it leads to better student engagement and longer information retention. And how cool is it that high school students can learn to operate bathymetric or underwater drones before graduating high school? #ImJelly.
And then of course there’s the practicality
of how we as utilities communicate with our students to get them excited and wanting to join the water workforce. My key takeaway message to everyone is simple: be relatable. It can be daunting to keep up with all the trends on social media, but there are also some trends that will never be acceptable to a utility’s social media team. That shouldn’t stop us posting on social media or using it as a tool to share our narrative, like profiling the many employees that serve our communities.
So, how else can we as an industry be relatable to the next generation? For one, by having honest interactions with our local schools, like giving facility tours, visiting schools as guest speakers and mentors, and most importantly, putting out marketing collateral, such as videos and flyers, that represent our real workforce— not stock photos. If your employees are welcome to show up to work with tattoos, piercings, and purple hair, your collateral should embrace that personal expression as it reflects a more diverse, equitable, and inclusive workforce.
Regardless of the resources we create to engage and educate the next generation, one thing is clear: The schools of today are not the same as the ones in the past. One of the challenges our panel discussed was not just interactions with local schools, but also creating relationships with them. For example,
many utilities offer tours of their facilities, but face challenges with schools not being able to afford the transportation or a substitute teacher. And for many utilities, the lowest-performing schools in their communities aren’t the ones taking field trips because they are too focused on improving student performance, test scores, or attendance, which limits their ability to physically leave campus. How we can combat these challenges requires some innovation, resource sharing, and dedicated volunteers.
Youth education should always be #trending in the water industry. If you’re looking for more ideas or inspiration, consider checking out the FSAWWA’s Public Affairs Council or ask your local FSAWWA region representatives if they can maybe host (or are looking for volunteers for) youth education events. More importantly, if you are doing innovative stuff involving youth education, help share what you’re doing on social media by using hashtags or tagging people, professional associations, or your employer. Together we can keep youth education trending long after #ACE24.
Shea Dunifon is a program manager at JEA in Jacksonville. She is the chair of the FSAWWA Public Affairs Council and a board member for Project WET. S


LET’S TALK SAFETY
Lockout/Tagout: Water Under Pressure Poses Danger to Utility Workers
Fire hydrants are not just for fire protection. Water utilities use them to flush water mains, control pressure when working on mains, and supply potable water service in bypass situations. But when is it necessary to tag an open fire hydrant or other equipment as being out of service?
Lockout/tagout is a protection system against unintentional exposure to hazardous energy from equipment and machinery. A lockout device, such as a padlock, secures the energy-isolating device, while a tagout device (i.e., a tag) warns employees not to use the equipment.
Hazardous energy means any type of energy that can be released and might cause harm. This could include energy of the following types:
S Chemical
S Electrical
S Hydraulic
S Mechanical
S Pneumatic
S Thermal
Without the use of proper safety procedures, the serviced equipment can unexpectedly start up or otherwise release these forms of energy. This can lead to serious (even potentially fatal) injuries to the people working on the machine and to others working in the area or living in the community.
Protecting Employees
Lockout/tagout is one of the most important safety procedures that water operators and other workers need to know. Needless injuries and deaths happen year after year, either because lockout/tagout was improperly performed, or because it was not communicated to all parties who should have been notified. Seemingly obvious processes

can go a long way to protect workers if performed consistently and consciously, and observing the practice of lockout/tagout is a concrete way of making the workplace safer. A hydrant requires a visible notice when it’s broken, or when open and unattended. Verbal notifications are never sufficient and here’s an example of why.
Several water utility employees were hurt recently—two seriously—when a firefighter unknowingly closed an untagged hydrant. The hydrant had been left open to relieve pressure while work was done on some valves in a nearby excavation pit. Two valves had been closed to isolate a section of the main so water department employees could cut and plug a 4-inch service branch. They opened a hydrant to prevent pressure buildup in the isolated main. By telephone, they notified the fire department that the hydrant would be out of service until further notice—but they failed to attach an out-of-service tag to the hydrant.


At about the same time, a nearby homeowner noticed water running from a hydrant and reported the leak to the fire department. A firefighter went to the site and saw a small stream of water running from the hydrant—so he closed it! He did not see the water department crews working in the nearby pit.
The water department employees working in the pit had just replaced the fittings on the end of the pipe and were collecting their tools when the increasing water pressure blew off the push-on fittings with a high-velocity blast of water. One worker escaped with only minor injuries, but two others suffered broken bones, lacerations, and multiple head, neck, back, and leg injuries.
The Occupational Safety and Health Administration (OSHA) cited and fined the water department for violating the standard for controlling hazardous energy through lockout/tagout. Subsequently, the department was required to create a job-hazard analysis for cutting and capping pipes and to develop an effective method of lockout/tagout to warn when a hydrant is out of service.
The water department’s solution was to purchase orange out-of-service bags that cover hydrants whenever a main is being isolated and a hydrant is opened to release pressure. The utility also met with local fire agencies to demonstrate the bags and explain their purpose to the fire crews.
Tools for Lockout/Tagout
Physical tools required to perform lockout/tagout procedures can be classified as generally two types:

Lockout Devices
Physical restraints that ensure that a particular equipment is inaccessible or isolated; a basic example is in the form of a lock and key.
Tagout Devices
Prominent warning devices that visibly identify equipment to be potentially hazardous; these can be in the form of signs or symbols attached securely to equipment. More recently, nonphysical tools, such as specialized software, are being utilized to make lockout/tagout processes perform more efficiently. Tracking lockout/tagout activities through maintenance management software is an advantageous functionality to ensure accurate compliance to standards.
Lockout/Tagout Procedures
Utilities need to establish programs to teach employees about the dangers of water under pressure and to explain when a lockout/ tagout device must be used. Employers are also required to train all workers to ensure that they know, understand, and are able to follow the applicable provisions of the hazardous energy control procedures. The procedures are as follows:
S Proper lockout/tagout practices must be used to safeguard workers and the community from the release of hazardous energy. The OSHA standard, The Control of Hazardous Energy: Lockout/Tagout, used for the general industry, outlines specific actions and procedures for addressing and controlling hazardous energy during servicing and maintenance of machines and equipment. Workers
must be trained in the purpose and function of the energy control program and have the knowledge and skills required for the safe application, usage, and removal of the energy control devices.
S All employees who work in an area where energy control procedures are utilized need to be instructed in the purpose and use of the procedures, especially prohibition against attempting to restart or reenergize machines or other equipment that are locked or tagged out.
S All employees who are authorized to run lockout machines or equipment and perform the necessary service and maintenance operations need to be trained in recognition of applicable hazardous energy sources in the workplace, the type and magnitude of energy found in the workplace, and the means and methods of isolating and/or controlling the energy.
S Specific procedures and limitations relating to tagout systems, where they are allowed, need to be provided.
S When necessary, all employees should be retrained to maintain proficiency or learn new or changed control methods.
Performing lockout/tagout procedures is a way to ensure the safety of workers and others. Failure to comply with lockout/ tagout standards not only results in fines, but also potentially causes injuries and even fatalities. Tools, such as lockout and tagout devices, as well as available software, should be maximized to make the workplace safer. For more information go to the OSHA website at www.osha.gov. S
FWEA FOCUS

Florida Hosts Latest WEFMAX

NJoe Paterniti, P.E. President, FWEA
ow that I’ve served as president for a few months, I have come to have a deeper appreciation for all the servant leaders in the Florida Water Environment Association (FWEA) who unselfishly give of themselves to benefit our water industry in Florida and throughout the United States. Our committees and regional chapters continue to provide unmatched technical content and networking opportunities. Our fundraisers generate revenue used to provide scholarships to develop our future leaders and enhance our member services.
This column will summarize a recent event that was held by FWEA.
Water Environment Federation Member Association Exchange
I recently attended a Water Environment Federation Member Association Exchange (WEFMAX) event hosted by FWEA (www. fwea.org) in St. Petersburg.
An annual program, WEFMAX offers Member Association (MA) leaders an opportunity to attend one of four meetings each year that offer a forum to learn what is new from WEF (www.wef.org) and provide sessions for ongoing exchange of MA information.
The theme of the two-day event, held May 29-31, was “Future Leaders.” I’d like to recognize the FWEA event planning team:
S Kristiana Dragash
S Tim Ware
S Mike Sweeney
S Karen Wallace
S WEFMAX Committee

There were close to 70 industry leaders in attendance. Many MA representatives from WEF traveled from around the U.S., including Hawaii, and there were also representatives from Canada. Each attendee placed a pin on a map showing where they were from.
Twelve FWEA members participated and provided presentations at the workshop. Our Megan Nelson got the audience ramped up with a few yoga moves. She also engaged the audience by developing a cheer (WhoopWhoop!) that all could recognize when a great idea was presented. She captured the great Ideas, or “Mantras Matter,“ on flip charts.
The WEFMAX event was full of activities and presentations and we at FWEA had the opportunity to share our approach to engaging and developing industry leaders. Members of FWEA in attendance shared how we bring our chapter and committee
Continued on page 28


Continued from page 26
leaders together at our annual Leadership Development Workshop/Retreat. This event is usually held in early February at a resort located at the beach or a golf course. The event spans a day and a half (Sunday afternoon through Monday). Typically we invite 40 to 50 chapter and committee leaders, and Executive Committee members also attend.


During the meeting, we focus on the following topics:
S Drafting chapter and committee business plans for the upcoming fiscal year and how chapter and committee budgets are included in the overall budget
S Review of FWEA procedures
S FWEA organizational structure and key roles
S Utility Council legislative update


S Annual Conference update
S Leader panel discussions centered on the WEF/FWEA strategic plan
S WEF updates/initiatives
S Team building exercise
S Evening dinner and social
This annual retreat unites our servant leaders, helps grow their professional network, and gives a holistic view of the organization. Results include crosspollination of ideas, while uniting our chapter and committee leaders to FWEA’s initiatives and goals.
Members from the Kansas, Chesapeake, and Pennsylvania MAs also shared their leadership training activities
Two young professionals (YPs), both active in leadership roles at WEF, provided a discussion to the WEFMAX group on their water stories, giving insight into their motivation and experiences with FWEA and WEF. One MA leader from the audience indicated they renamed their committee for YPs the Emerging Leaders Committee. This title certainly applies to the two YP presenters, Olga and Ama, who are making their voices heard and having a positive impact.
Olga and Ama shared a few of the personal and professional benefits of their volunteer experience.
S Personal development includes friendships, self-confidence, time management, and a broader perspective
S Professional development includes public speaking, networking, leadership skills, and a well-rounded knowledge of the industry
They also shared how MAs can attract and engage YPs:
S Communicate opportunities to students and YP members
S Encourage WEF and FWEA YPs to share national updates with their MAs
Opening remarks at WEFMAX.
FWEA leadership team at the 2024 annual workshop/retreat.
Olga (left) and Ama. Both are young professionals and emerging leaders.
Kristiana Dragash (left) moderates a session.
S Reward active volunteers by providing scholarships to help them attend national events
S Invite YP leaders to attend MA events with their WEF delegates
S Continuously share information about volunteer opportunities and engagement events, which is crucial for driving interest and participation
S Encourage idea sharing and active listening
S Provide support to implement new and feasible ideas
S Mentor your student and YP leaders
Representatives from the WEF House of Delegates (HOD) also provided presentations on various subjects, including:
S WEF’s organizational structure and the various roles and committees/ communities within the HOD
S WEF’s vision: “ A Life Free of Water Challenges”
S WEF’s core values: Collaborate for collective impact, focus on customers through empathy and service, and lead boldly with purpose and agility
S HOD budget; diversity, equity, and inclusion; and water advocacy committee updates
There was also an opportunity for FWEA to conduct a panel of its board members who fielded questions, such as:
S How have you as an MA leader grown and adapted to the demands of volunteer leadership over time?
S What are the current significant challenges you face that ensure the viability of your MA?
It was a great two days and FWEA ejoyed hosting the event.
Executive Director Retirement
I would like to close this column with an announcement. I know he won’t like that I mentioned this, but I think it is worth everyone knowing that, after over 30 years of service with FWEA, Kart Veith is retiring from his position as the FWEA executive director.

During his time, he moved our association forward in a positive direction and he served as FWEA president on more than one occasion. He established our state’s nine regional chapters to serve our membership better.
We are deeply gratful and celebrate Kart’s exceptional leadership, dedication, and countless contributions to FWEA over the years. His vision and unwavering commitment have profoundly shaped our association. We honor his legacy and thank him for inspiring us all.
S

Kart Veith
Water Quality and Resiliency: Considering the Future of Elevated Storage Tanks

Kristiana S. Dragash, Katherine Gilmore, and Brooke D. Bailey
Kristiana S. Dragash, P.E., is associate vice president with Carollo Engineers Inc. in Sarasota. Katherine Gilmore is deputy director with Manatee County Utilities in Bradenton. Brooke D. Bailey, MBA, is utility director with Sarasota County Utilities.
Elevated storage tanks (ESTs) provide a reminder on the skyline of the essential nature of water. Many of these structures were built decades ago at elevations that would help to mitigate drops in pressure that may occur as demand fluctuates throughout the day. As operating pressures of distribution systems have increased to serve the growing demand, many ESTs now have challenges turning over, contributing to high water age as they remain full during various operating and demand conditions. Furthermore, the threat of more-intense and frequent storm events has caused some to consider demolishing these assets and ask the following:
S How are utilities currently operating their water towers?
S How are they overcoming the challenges with water quality and maintaining these structures during hurricanes?
This article demonstrates innovative concepts for resolving issues, realizing renewed value from these iconic structures. Several case studies are presented, with regard to how various size distribution systems have developed operational- and infrastructure-related strategies to better leverage the benefits of these historic landmark structures.
Case Study 1: The City of Punta Gorda
The first of several case studies is the City of Punta Gorda (city), which operates a distribution system that serves approximately 40,000 residents. The city recently used
Figure 1. Estimated existing water age for City of Punta Gorda.
Figure 2. Average day demand and proposed operating strategy for City of Punta Gorda.
hydraulic modeling to optimize system operations for different demand conditions. High water age in the distribution system during the average day demand (ADD) condition was experienced in the western portion of the system, as shown in Figure 1.
Through hydraulic modeling and analysis of the supervisory control and data acquisition (SCADA) information, the team was able to determine that the city’s Burnt Store EST could not empty or turn over due to the high operating pressure of the distribution system, which is necessary to serve the city’s growing population. To get the Burnt Store EST to empty, a booster pump station (BPS) was modeled to pump water out of the EST under ADD conditions. Under this demand condition, the proposed BPS was set to operate during the times when the city’s only other remote pump station (PS), the Bal Harbor PS on Punta Gorda Isles, is off and the Bal Harbor Ground Storage Tank (GST) is filling. Figure 2 shows the tank levels of the Burnt Store EST and the Bal Harbor GST once the proposed BPS is installed and operating as discussed to empty the Burnt Store EST. As shown in Figure 2, using the proposed BPS at the Burnt Store EST allows the EST to empty.

Figure 3 shows the estimated water age during ADD conditions, once the proposed BPS is installed at the Burnt Store EST and operated as indicated in Figure 2. As shown in Figure 3, water age improves significantly in the western portion of the distribution system once the proposed infrastructure and operational strategies are implemented.
During peak hours of demand, the city was concerned about meeting pressure requirements and firm capacity at the Bal Harbor PS. To satisfy system pressure requirements and assist the Bal Harbor PS in meeting firm capacity (pumping capacity with the largest pump out of service), the model was used to develop a new operational strategy for peak demand times. This strategy involves operating the proposed Burnt Store EST BPS simultaneously with the Bal Harbor PS during hours of peak demand, which occur in the early morning due to irrigation using potable water. Model results indicated that operating the proposed BPS during peak hours allowed the existing Bal Harbor PS to meet firm capacity. Figure 4 shows the tank levels under the proposed peak demand operational strategy.
Case Study 2: Manatee County
Manatee County Utilities (county) serves a functional population of approximately
408,000 people and is served by one water treatment plant (WTP) and a complex distribution system of over 1,800 mi of pipeline. Though the size of this distribution system is several times larger than the one in City of Punta Gorda, the two utilities have similar challenges of some ESTs not being able to turn over. The operational variables in this system are significantly more complex than the City of Punta Gorda’s; however, the
county has completed hydraulic modeling and has identified two of its six ESTs that will be retrofitted with booster pumps in the future. Figure 5 shows the county’s distribution system. The county plans to install a BPS at two of its six ESTs: 59th Street and Palmetto.
Continued on page 32
Figure 3. Estimated water age with infrastructure and operational modifications for City of Punta Gorda.
Figure 4. Peak demand and proposed operating strategy for City of Punta Gorda.


Continued from page 31
Case Study 3: Sarasota County
Sarasota County (Sarasota) provides drinking water to nearly 300,000 residents, with an ADD of approximately 25 mil gal per day (mgd). In a sprawling distribution system of over 1,500 mi of distribution system piping, Sarasota operates and maintains three WTPs, two elevated storage tanks, and six remote pumping and storage facilities; it also has active interconnects with Manatee County, City of Sarasota, Englewood Water District, City of North Port, City of Venice, and Peace River Manasota Regional Water Supply Authority.
Sarasota completed a free chlorine conversion in the spring of 2023. During this conversion, it modified its operational strategy and, amid other changes, took both of its ESTs offline. Sarasota observed improvements in water quality, mainly due to the free chlorine conversion; however, it is currently conducting hydraulic modeling to help determine the most effective combination of existing infrastructure to serve the growing demand in the area under different demand conditions. Currently, Sarasota plans to install a Monoclor® system in elevated tank 1, which is located in its northeast area. This system will provide mixing and maintenance of disinfectant residual. Figure 6 shows Sarasota’s distribution system.
Conclusions
Several utilities in Florida are experiencing challenges with operation of their ESTs due to the high distribution system operating pressures required to serve the growing population and various infrastructure changes throughout the years.
The City of Punta Gorda, Manatee County, and Sarasota County have all used hydraulic modeling to identify infrastructure and operational strategies to assist their respective tanks in turning over. Both the City of Punta Gorda and Manatee County are installing booster pump stations, and Sarasota County is installing a Monoclor system and PAX mixer at one of its ESTs.
These changes will have a positive effect on water age and quality, so that the tanks can continue to be used for storage in the future. S
Figure 5. Manatee County Utilities distribution system.
Figure 6. Sarasota County distribution system.


> Exhibitor Registration Starts 8/1/24
Premium Booth Space: $1,250
Includes:
■ Prime location within the Exhibit Hall
■ 8 x 1 0 Booth space
■ 1 - Draped table
■ 2-Chairs
■ Backdrop
■ Side draping
■ Company sign
■ Wastebasket
■ 3 - Exhibit staff registrations
Standard Booth Space: $990
Includes:
■ 8 x 1 O Booth space
■ 1 - Draped table
■ 2-Chairs
■ Backdrop
■ Side draping
■ Company sign
■ Wastebasket
■ 2- Exhibit staff registrations
Exhibit booth spaces can include heavy equipment on a case-by-case basis and with an additional fee, workshops, portable equipment and showrooms. Flammable materials are prohibited. No modifications will be made to the backdrops or sidewalls without prior approval from FSAWWA. All other services related to the trade show booth are the responsibility of each exhibitor. This includes but is not limited to costs such as: electricity, shipping, storage and handling. Once an exhibitor is registered and has provided payment, an exhibitor packet of information will be provided with the details and instructions on ordering and payment for additional services.
Online Registration is strongly recommended!
Online Exhibitor registration at: www.fsawwa.org/2024exhibits
No Refunds after September 1st.
For more information: fsawwa.org/2024fallconference
Sponsorship opportunities will be available on the FSAWWA Conference website.
Hotel Accommodations: fsawwa.org/2024hotel
Host hotel is Omni Orlando Resort ChampionsGate


Please Note:
All promotional activity other than product demonstrations must be approved by FSAWWA prior to the conference.


AWWA Florida
FSAWWA Water Use
Efficiency Division
2024 Water Conservation Awards for Excellence
This annual awards program of the FSAWWA Water Use Efficiency Division (WUED) recognizes successful water efficiency progra s and projects throughout Florida.
Award Categories:
Comprehensive Water Conservation Pro a Program Element- Single Program Hig light
Agencies will be awarded one of the folio Best in Class or Show of Excellence
For online application and information, visit : fsawwa.org/wcawards

Entries must be submitted b Friday, October 18, 2024 ----

For additional information, please contact: Cassidy Hampton, Water Use Efficiency Division (WUED) Chair cassidy.hampton@swfwmd.state.fl.us December 8 -11, 2024
Omni Orlando Resort at Championsgate fsawwa.org

WWhy You Need Certification
Athena Tipaldos President, FWPCOA
hether you’ve secured a new job, or have been in our industry for a while, certification plays a crucial role in your professional development and success. Here’s why:
S Skills Verification
• Certifications help verify and validate the skills you have in the workplace, ensuring you meet industry standards.
S Career Advancement
• Certifications are a powerful tool for career growth, making you more eligible for promotions and salary increases within the industry.
S Recognition and Current Practices
• Earning certifications keeps you up to date with current industry practices and trends, maintaining your relevancy and expertise.
S Personal Development
• Pursuing certifications fosters personal growth, enhancing the knowledge and skills in your field.
S Quality of Work
• Certified employees often produce higher-quality work due to the advanced knowledge and skills gained through certification programs.
FWPCOA Certifications
The Florida Water and Pollution Control Operators Association (FWPCOA) offers several certifications across various disciplines, including:
S Water
S Stormwater
S Wastewater
S Reclaimed water distribution
Other certifications classes address the following:
S Customer relations
S Industrial pretreatment
S Backflow
S Utility maintenance
These certifications have different levels, each providing a deeper understanding of the respective discipline.

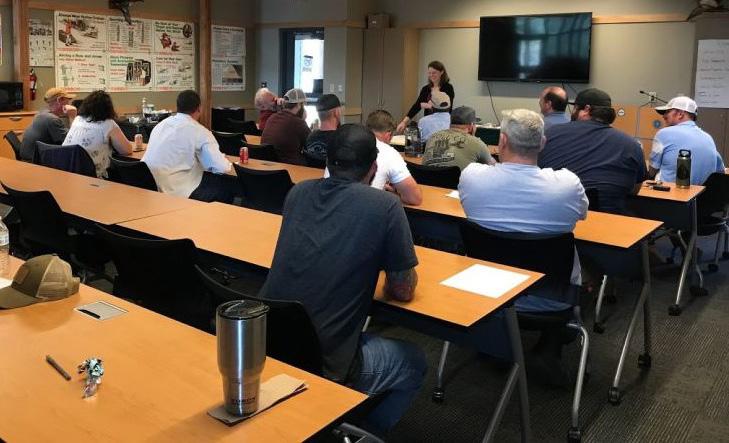
Advantages of Different Levels
Each level of certification has its own advantages:
S In-Depth Knowledge
• Each level of certification offers a morecomprehensive understanding of the discipline, enhancing your expertise and proficiency.
S Continuing Education Units (CEUs)
• The certification programs provide CEUs that are essential for licensing renewal.
Flexible Learning Opportunities
The FWPCOA offers multiple avenues to earn certifications:
S State Short Schools
S Regional Training
S On-the-Road Instructors
S Online Institute
Additionally, I am actively collaborating with our Education Committee to introduce virtual training options, expanding access to these valuable programs. With so many opportunities to earn certifications, I encourage everyone to take advantage of these programs to further their professional development.
S


Simple, Compact Tertiary Treatment
Veolia’s Hydrotech Discfilter contributes to the global Ecological Transformation, reducing backwash waste, reducing solids discharge and minimizing footprint.
The Hydrotech Discfilter technology is a proven method to meet stringent effluent requirements while being cost effective and simple to operate.
With over 350 Hydrotech Discfilter installations in the United States, over 60 in Florida, pilot testing and site visits are available in your area. www.veoliawatertech.com

Hydrotech Discfilter is exclusively represented in Florida by MTS Environmental. Visit us at mts-florida.com
Bob Bierhorst

Wesley Chapel, FL 813-760-5508
Wade Wood P.E. Tampa, FL 321-299-2395
Eric Peters P.E.
Lakewood Ranch, FL 941-773-5051

AWWA Promotes Source Water Protection Week

The American Water Works Association (AWWA) invites water utilities, its sections, and other partners to join in recognizing Source Water Protection Week, to be held this year from September 29 to October 5. Throughout the week, AWWA will be raising awareness about the importance of caring for drinking water sources in the Unites States.
Why Source Water Protection Week?
The best way to assure there is high-quality drinking water at the tap is to protect all water sources. If rivers, lakes, and underground wells are free from pollution, it's easier and less expensive to keep water safe and healthy.
Source Water Protection Week Materials
The association has a reservoir of information to help utilities, consumers, and others advance
source water protection during Source Water Protection Week.
What You Can Do
Whether you’re a water utility professional, a business leader, or a drinking water consumer, there are easy ways to protect water sources.
Ideas for Utilities
S Prepare an official proclamation declaring September 29 to October 5 as Source Water Protection Week in your community.
S Share a copy or link to your local source water assessment and/or protection plan, along with guidance on how to ask questions or provide feedback.
S Post information to social media related to drinking water sources and source water protection. Encourage viewer engagement through comments and interactive content.
S Take part in the #ShowYourSource social media contest.
S Share educational materials about source water protection. Examples could include training courses, webinars, workshops, and K-12 school programs. The Source Water Collaborative Learning Exchange is a great place to start.
S Issue a newsletter or press release that focuses on the importance of source water protection, how your utility approaches it, and actions everyone can take to protect drinking water supplies.

S Hold a poster, photo, or essay contest for kids to show what source water protection means to them.
S Host a live or virtual watershed tour to help people connect land use activities to the quantity and quality of water for drinking water supplies.
S Connect with local watershed and conservation organizations to discuss ways to partner on source water protection efforts.
S Host and/or participate in community volunteer activities that protect the environment, such as watershed cleanups, stenciling stormwater drains, and planting trees or riparian buffers.
S Consider applying for the AWWA Exemplary Source Water Protection Award.
S Get your operational guide to AWWA Standard G300, Source Water Protection
Ideas for Customers
S Manage household hazardous waste properly (cleaners, paints, vehicle fluids, fertilizers, pesticides, etc.). Only purchase what you need. Donate unused portions to friends or community organizations. Recycle leftovers when possible. To find recycling/disposal locations visit www. earth911.com or call 1-800-CLEANUP.
S Avoid dumping. Never put anything down the sink, toilet, or storm drain, as it can end up in drinking water sources. Dispose of cleaners, medicines, oil/grease, etc. properly.
S Pick up after yourself and your pets. Use trash receptacles and recycle whenever possible. Pet waste can enter storm drains and spread bacteria.
S Use alternative products. Avoid using products that may contain harmful materials, such as per- and polyfluoroalkyl substances (PFAS). Use cast iron or stainless steel pots and pans instead of nonstick ones.
S Identify your source of water and check where you live and work relative to source water areas. An example tool that can be used to find this information in the U.S. is the Drinking Water Mapping Application to Protect Source Waters (DWMAPS), which can be found at the U.S. Environmental Protection Agency website at www.epa.gov.

S Conserve water. Use water efficiently to ease the burden on water sources and save money. Repair leaks, use a rain barrel, install low-flow devices in toilets and showers, wash full loads of laundry and dishes, etc. For more steps to save water visit WaterSense at www.epa.gov.
S Limit use of fertilizers and pesticides. Reduce the amount of materials used on your lawn or consider natural alternatives.
S Service your septic system. Have a professional inspect your septic system every three years and have it pumped every three to five years.
S Participate in volunteer activities. Attend events, such as removing invasive plants and replanting native ones, stormwater drain stenciling, rain barrel workshops, litter cleanups, etc. Watershed groups are often familiar with upcoming local events.
S If you see something, say something. Report any spills, illegal dumping, or suspicious activity to authorities.
Ideas for Nongovernmental Organizations and Other Groups
S Prepare an official proclamation declaring Sept. 29 – Oct. 5, 2024, as Source Water Protection Week in your community.


S Partner with your local water utility on Source Water Protection Week plans and actions.
S Post information to social media related to drinking water sources and source water protection and how your organization works to protect water quality and drinking water sources.
S Encourage viewer engagement through comments and interactive content.
S Recognize a person or organization in your community who is a source water protection champion (#SourceWaterChampions).
S Host and/or participate in community volunteer activities that protect the environment, such as watershed cleanups, stenciling stormwater drains, and planting trees or riparian buffers.
Ideas for Businesses
S Report spills immediately to proper authorities.
S Follow regulations and permit requirements applicable to your business.
S Demonstrate your business’s commitment to environmental stewardship by following industry environmental best practices.
S Join your local emergency planning committee to form partnerships and
increase resources for hazardous materials preparedness.
S Develop plans and procedures to respond to emergency event, such as spills, extreme weather, etc.
S Train employees on emergency response plans and procedures, spill prevention, and environmental best practices.
S Properly store and secure chemicals, cleaners, oils/fuels, and other potentially hazardous materials. Inspect the systems regularly, including secondary containment, and cap or reroute floor drains where needed.
S Employ conservation measures to ease the burden on water supplies and reduce water waste.
S Identify your local water utility and check your location(s) relative to source water areas.
S Host a company volunteer day and/or encourage employees to participate in volunteer opportunities for watershed protection.
More Information
To download Source Water Protection Week materials, go to www.awwa.org. S


Assessment of Adenosine Triphosphate for Biomonitoring Through a Central Florida Groundwater Treatment Train
Jessica Cormier and Steven J. Duranceau

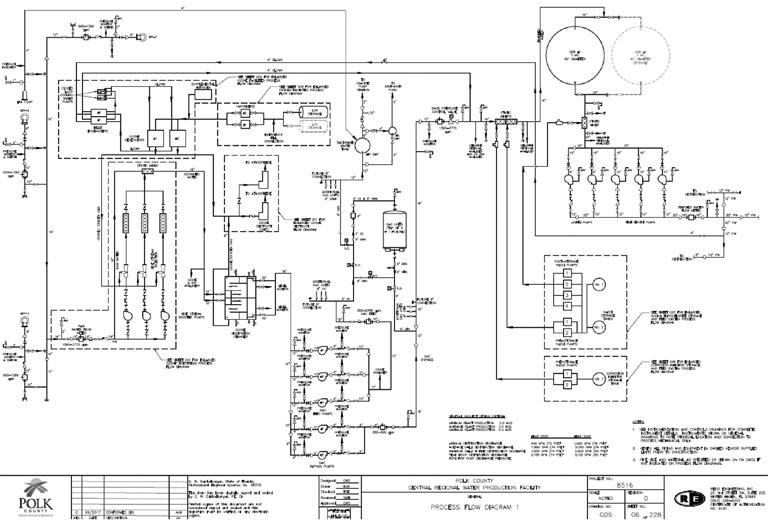
Adenosine triphosphate (ATP) is a natural organic chemical compound that provides energy to drive and support many processes in living cells. The chemical ATP is classified as a nucleoside because it consists of three components: a nitrogenous base (adenine), the sugar ribose, and the triphosphate. The nucleoside is stable in buffered water solution between pH 6.8 and 7.4 when no catalyst is present (Akola et al., 2003; Berg et al., 2002; Ferguson et al., 2002). At higher and lower pH, ATP can degrade readily to phosphate and adenosine diphosphate (ADP), due to hydrolysis. Bioluminescence technology was developed for rapid assessment of ATP to determine microbiological contamination of surfaces.
In 1929 ATP was discovered as an assay method for phosphorous detection (Vaughan et al., 2002). The bioluminescence technique has been investigated since the 1960s (Hammes et al., 2010); more recently, several researchers have focused on developing rapid, accurate biomonitoring devices (Delahaye et al., 2003; Berney et al., 2008; Vital et al., 2012). The majority of ATP bioluminescence research has been conducted outside of the United States in water systems that do not employ secondary disinfection (Van der Wielen and van der Kooij, 2010).
The ATP bioluminescence technology relies on the firefly reagent luciferase to produce light via a chemical reaction (Thore et al., 1975; Davidson et al., 1999). The intensity of the light emitted by the reaction is proportional to the amount of ATP in the sample and can be collected using handheld devices. Bioluminescence analysis allows for real-time data collection and interpretation that provide results in minutes (Lee and Deininger, 1999). Various studies have attempted to define bioluminescence limitations, such as the inability to distinguish between active and inactive ATP (Larson et al., 2003) and weak correlations between relative light units (RLUs) and microbial numbers (Poulis et al., 1993; Shama and Makick, 2013). Although the technology has various limitations, recent studies on the reliability of ATP bioluminescence as a microbiological indicator within the municipal water sector (drinking water industry) have shown favorable results (Vrouwenvelder et al., 2008; Vang et al., 2014; Van Nevel et al., 2017). Furthermore, intracellular ATP
Jessica Cormier, Ph.D., postdoctoral scholar, and Steven J. Duranceau, Ph.D., P.E., professor of environmental engineering, are in the department of civil, environmental, and construction engineering at the University of Central Florida in Orlando.
Figure 1. Central Water Treatment Facility granular activated carbon process vessels. (photo: Jessica Cormier)
Figure 2. Process flow diagram. (source: Polk County Utilities Division, Winter Haven)
has been shown to decrease with the increase of a disinfectant, such as chlorine (Nescerecka et al., 2016). Consequently, an abundance of intracellular ATP would indicate elevated microbiological activity, while the absence of the nucleoside would infer a lower level of active biomass.
Materials and Methods
Water Treatment Processes Description
The research reported herein was performed with the assistance of the staff located at the Polk County Utilities Division (county) Central Water Production Facility (WPF). The county owns and operates a 4-mil-gal-per-day (mgd) WPF that treats groundwater through ozonation and granular activated carbon (GAC) treatment, followed by free chlorination to provide primary and secondary disinfection to meet regulatory requirements. This facility was designed to remove hydrogen sulfide and lower the total organic carbon (TOC) content of the water for disinfection byproducts control. During normal operation, approximately 21 percent of the ozonated flow is bypassed around the GAC system to extend the beds’ useful life. This facility operates in a batch mode, producing water for approximately eight hours a day. The plant was first placed online in November 2019. A photograph of the GAC process vessels is provided in Figure 1 and a process flow diagram is presented in Figure 2. The source water (raw, groundwater), entering the process train, comes from three onsite wells, operated in tandem, so that two are producing during a run. The water quality from each well is displayed in Table 1. The three wells are very similar, with slight differences in dissolved organic carbon (DOC) and larger differences in hydrogen sulfide, ranging from less than 1.0 to 2.3 mg/L as total sulfide present in the groundwater.
Sample Locations
Microbial activity was measured throughout the water treatment facility across key unit operations. The unit operations assessed for microbiological activity by ATP included:
S Raw water supply (mixture of three wells in set rotations)
S Ozone contact basin
S GAC feed line
S GAC (sample ports A-C on the vessel and out)
S Blended GAC and bypass flow
S Ground storage tank (GST); and before and after the tank (pre-GST and post-GST)
S Point of entry
Example sample locations are shown in Figure 3: (a) raw water, (b) ozone contact chamber, (c) GAC feed, (d) GAC bypass, (e) GAC vessel port
A, (f) GAC vessel outlet, (g) GAC blend, (h) GST, (i) point of entry.
Table 1. Well Water Quality (Typical)


Figure 3. Examples of process sampling locations: (a) raw water, (b) ozone contact chamber, (c) GAC feed, (d) GAC bypass, (e) GAC vessel port A, (f) GAC vessel outlet, (g) GAC blend, (h) GST, (i) point of entry. (photos: Jessica Cormier)
Equipment, Reagents, and Sample Preparation
Intracellular ATP (microbial ATP) monitoring was performed with a Promega WaterGlo™ System and kit AM1001 (2800 Woods Hollow Rd., Madison, Wis. 53711-5399) that is designed to measure ATP from viable cells in complex aqueous systems. The system relies on a luciferase enzyme that generates a luminescence signal upon reaction with the nucleoside, measured as RLUs. The luminescent signal provides a direct correlation to the ATP content in the sample, representing the amount of active biomass in the water analyzed.
According to Promega, in the Water-Glo System filters are used to concentrate viable biomass from large volume samples by capturing that biomass on a filter surface. Small aqueous contaminants may pass through the filter, but cellular matter (biomass) will remain. For samples that contain oil and water mixtures, an additional organic wash step is used to remove inhibitory organic compounds from the filter. In this study, an organic wash was not necessary. The captured biomass is extracted using the Water-Glo Lysis
Continued on page 50
Reagent to release cellular ATP. The Water-Glo Lysis Reagent is designed to extract cellular components from hard-to-lyse samples, such as biofilms. The extracted ATP is then detected using the Water-Glo Detection Reagent. The resulting luminescent signal is proportional to the amount of ATP present in the sample and can be measured using a luminometer, as shown in Figure 4. The Water-Glo System complies with ASTM D4012, Standard Test Method for ATP Content of Microorganisms in Water. Quality assurance and
www.promega.com/-/media/files/resources/ protcards/fb222-water-glo-system-quick-protocol. pdf?rev=3ec1824368a242cabf083af977bd9bb0 &sc_lang=en). Since the samples were collected onsite (outdoors) and not under laboratory conditions, additional protocols were followed. Aliquots were collected in a glass beaker or sterile plastic bag and immediately filtered onsite via a sterile syringe and 0.2 micrometer filter. The filters attached to the syringe were stored in the sterile syringe bag and either held on ice for half an hour or within 10 minutes brought to the lab for addition of

Data collected from GAC process during the last year of operation before replacement; total operating period was four years.
Data collected for the first five months of use after process was replaced with new carbon.
sampled throughout the WPF at different locations representing each unit operation (i.e., process location). Initial ATP sampling occurred after the process had been online for two and a half years and the GAC had processed over 180 mil gal (MG), with approximately 18,000 bed volumes per vessel; note that the plant was first placed into service in September 2019. The ATP concentration relative to each WPF unit operation was collected over a period of one year where the carbon vessels were nearing exhaustion for TOC removal, approximately 2.5 to 3.5 years from startup. The results indicate that the ATP content can vary across unit process treatment components, as demonstrated in Figure 5(a). For example, there was a significant difference in ATP content after the source groundwater wells were treated with ozone. A variable increase in ATP (at times by a factor of 100 or more) was observed in the ozone contact chamber; however, a decline to less than 25 pg/L ATP occurred by the time ozonated water flowed to the GAC feed and bypass lines, with little variation in sample duplicates. The ATP content increased across each of the GAC biological filters, as would be expected, demonstrated in Figure 5(a and b) and further confirmed in Figure 6. Because the WPF relies on chlorine (bleach) for both primary and secondary disinfection, there is a significant lowering of the ATP content of the water. The raw well waters, GST, post-GST, and point of entry have minimal values of less than 10 pg/mL of ATP. These data demonstrate that chlorinated water is effective in arresting (if not reducing) microbiological “growth” at the point of entry as measured using ATP bioluminescence. Data collection continued to occur after the GAC media was replaced in early September 2023 with Calgon Filtrasorb® 400 carbon. Sampling for ATP continued through January 2024, which represented about five months with new carbon installed. The recently replaced carbon media released an averaged 150 to 300 pg/mL of ATP at sustained levels higher than the other processes in the facility. The new GAC media was observed to have produced higher ATP concentrations in the initial start-up period, as demonstrated in Figure 5(b) and Figure 6 (“New Carbon”). Figure 7 reveals that although the feed water to the GAC vessels is below 10 pg/ mL ATP, the nucleoside content tends to increase more than tenfold as the water flows through the carbon column. The higher ATP values coming off the new GAC appear to decline readily, after a few months of daily operation, to a “steadystate” condition that is similar to the prior “old” expended carbon trends observed in Figure 6. The ATP decline for the new carbon is displayed in Figure 8 as a wave plot, where the area under the curve is a summation of the ATP values for the GAC process (feed, GAC sample ports A-C,
Continued on page 52
+ AMP + PPi + CO2
Figure 4. Schematic chemical representation of the Water-Glo technology using recombinant firefly luciferase (i.e., Ultra-Glo by Promega). (source: Promega; Madison, Wis.)
(a)
(b)
Figure 5. Average ATP by unit operation (source to point of entry).


Continued from page 50
effluent, bypass, and blend lines). The ATP from the new carbon reached levels similar to the prior carbon (steady-state), at about 17 MG of water treated and 1,700 bed volumes per vessel or less, only two months after start-up (November 2023). The decline of ATP from the GAC process over time is believed to represent the transition of the carbon from a purely adsorptive state to more of a biological mode of operation based on prior research (Cormier, 2022). For purposes of this study, the GAC process would be considered to have achieved “steady-state” microbiological operations at the time the ATP has stabilized within the process.
Ozone Process Observations
The treatment process that was found to be the most variable in ATP was the ozone contact and destruct chamber. Peak ATP values were found within the ozone contact chambers, which ranged from 7 pg/mL to greater than
550 pg/mL. Ongoing analysis demonstrated that this chamber displays higher ATP before reintroducing flow to the process (111 to 164 pg/mL, with up to 5 percent difference in duplicates) and within a few hours from start-up (29 to 65 pg/mL, with 26 to 27 percent difference in duplicates), as this facility produces water in a batch mode daily. Additionally, the sample ports require longer flushing times than the others, to reach a consistent and low relative percent difference value for ATP after a lengthy period where no samples were collected. An initial value of 47 pg/mL ATP after five minutes of flushing decreased 147 percent to 7 pg/mL ATP, collected in a slower flow at 10 minutes of flushing. This lower ATP concentration is similar to the ozonated GAC feed and bypass waters. On occasion the water sampled from the ozone chamber contained suspended solids, with tan colloids observed intermittently. The ATP assessments performed at the WPF
4-Mar-224-Apr-222-May-2221-Jun-2230-Aug-2218-Oct-228-Nov-2216-Feb-2324-Feb-2312-Sep-2319-Sep-2317-Oct-2314-Nov-2330-Jan-24
evaluating the impact of stagnation between plant shutdown and start-up operation indicated that the greatest quantity of ATP was found prior to start-up after an extended shut-down; no flow, no production period. Further investigation remains ongoing to explain this intermittent phenomenon.
Findings
This study explored the use of microbial ATP as a real-time biomonitoring tool within an ozone-GAC water treatment facility for groundwater in central Florida. Observations combined with data analysis yielded the following main takeaways: Newly replaced, virgin GAC media produced higher intracellular ATP concentrations as compared to a “spent,” near-exhaustion GAC media operated in a steady-state biological mode (mixed GAC-BAC) system treating the same groundwater supply. In this study, the GAC process appeared to have achieved “steady-state” microbiological operations at the time the ATP stabilized after a media changeout occurred.
S Since flow velocity can significantly impact microbial ATP values, implementation of this technology as a biomonitoring tool would likely require the development of a baseline for the system to be able to detect actual anomalies or spikes in microbial activity. The ability to detect real-time microbial ATP spikes within a unit operation may provide opportunities to provide a tool that could be used to better control overall microbiological treatment performance.
S Chlorinated water is effective in arresting (if not reducing) microbiological “growth” at the point of entry as measured using ATP bioluminescence. Intracellular ATP is consistently low at the point of entry due to presence of the primary disinfectant, in agreement with Nescerecka and colleagues (2016) findings.
Figure 7. Average ATP (pg/mL) values across four GAC vessels (pg/mL) with standard errors during the first few months of start-up with new carbon.

S The results from this study indicate that ATP bioluminescence technology shows promise for the water industry; specifically, this study demonstrates the usefulness of a microbial activity screening tool to evaluate specific unit operations that are integrated into a treatment process train (in this study it was the WPF, Polk County Utilities, Winter Haven).
Acknowledgments
This research would not have been possible without the support and commitment of the dedicated individuals and organizations involved.
We would like to express our sincere gratitude to the Polk County Utilities Division
GAC
Figure 6. Adenosine triphosphate concentration by unit operation at the WPF.
for supporting the University of Central Florida (UCF) in this work [Reference: 1620 8A44 (GR105515)]. We would also like to gratefully acknowledge the assistance and efforts of UCF’s Water Quality Engineering Research (WQER) Group and the county’s water treatment plant operations staff.
Any opinion, findings, and conclusions or recommendations expressed in this material are those of the authors(s) and do not necessarily reflect the views of UCF or its board of trustees; nor serve as an endorsement of any company, product, equipment, or material identified herein; nor of the funding agency supporting this research.
References
• Akola, J. & Jones, R.O.. (2003). ATP Hydrolysis in Water – A Density Functionl Study. J. Phys. Chem. B, 107, 11774-11783.
• Baird, R. B., Eaton, A. D., & Rice, E. W. (Eds.). (2017). Standard Methods for the Examination of Water and Wastewater. American Public Health Association; American Water Works Association; Water Environment Federation.
• Berg, J. M., Tymoczko, J. L, & Stryer, L. (2002). Biochemistry. New York: W.H. Freema. ISBN 978-0-7167-4684-3.
• Berney, M., Vital, M., Hulshoff, I., Weilenmann, H.-U., Egli, T., & Hammes, F. (2008). Rapid, cultivation-independent assessment of microbial viability in drinking water. Water Research, 42, 4010-4018. 10.1016/j.watres.2008.07.017.
• Cormier, J. C. (2022). Application of Biologically Activated Carbon for Treatment of SulfideLaden Groundwater. Orlando, FL: University of Central Florida (Dissertation).
• Davidson, C., Griffith, C., Peters, A., & Fielding, L. (1999). Evaluation of two methods for monitoring surface cleanliness - ATP bioluminescence and traditional hygiene swabbing. Luminescence, 14, 33-38. 10.1002/ (SICI)1522-7243(199901/02)14:1<33:AIDBIO514>3.0CO;2-1.
• Delahaye, E., Welte, B., Levi, Y., Leblon, G., & Montiel, A. (2003). An ATP-based method for monitoring the microbiological drinking water quality in a distribution network. Water Research, 37, 3689-3696. 10.1016/S0043-1354(03)00288-4.
• Ferguson, S. J.; Nicholls, David; & Ferguson, Stuart. (2002). Bioenergetics 3 (3rd ed.). San Diego, CA: Academic. ISBN 978-0-12-518121-1.
• Hammes, F., Goldschmidt, F., Vital, M., Wang, Y., & Egli, T. (2010). Measurement and interpretation of microbial adenosine triphosphate (ATP) in aquatic environments. Water Research, 44, 39153923. 10.1016/j.watres.2010.04.015.
• Larson, E. L., Aiello, A. E., Gomez-Duarte, C., Lin, S. X., Lee, L., Della-Latta, P., & Lindhardt, C. (2003). Bioluminescence ATP monitoring as

a surrogate marker for microbial load on hands and surfaces in the home. Food Microbiology, 20, 735-739.
• Lee, J., & Deininger, R. A. (1999). A rapid method for detecting bacteria in drinking water. Journal of Rapid Methods and Automation in Microbiology, 7, 135-145. 10.1111/j.17454581.1999.tb00382.x.
• Nescerecka, A., Juhna, T., & Hammes, F. (2016). Behavior and stability of adenosine triphosphate (ATP) during chlorine disinfection. Water Research, 101, 490-497. 10.1016/j. watres.2016.05.087.
• Poulis, J., de Pijper, M., Mossel, D., & Dekkers, P. (1993). Assessment of cleaning and disinfection in the food industry with the rapid ATPbioluminescence technique combined with the tissue fluid contamination test and a conventional microbiological method. International Journal of Food Microbiology, 20, 109-116.
• Shama, G., & Malik, D. (2013). The uses and abuses of rapid bioluminescence-based ATP assays. International Journal of Hygiene and Environmental Health, 216, 115-125.
• Thore, A., Ansehn, Lundin, A., & Bergman, S. (1975). Detection of bacteriuria by luciferase assay of adenosine triphosphate. Journal of Clinical Microbiology, 1, 1-8. 10.1128/jcm.1.1.18.1975.
• U.S. Patent Nos. 7,083,911, 7,452,663 and 7,732,128. ENLITEN and GloMax are registered trademarks of Promega Corporation. BacTiterGlo and Water-Glo are trademarks of Promega Corporation.
• Van der Wielen, P. W., & van der Kooij, D. (2010). Effect of water composition, distance and season on the adenosine triphosphate concentration in
2023.
unchlorinated drinking water in the Netherlands. Water Research, 44, 4860-4867. 10.1016/j. watres.2010.07.016.
• Van Nevel, S., Koetzsch, S., Proctor, C., Besmer, M., Prest, E., Vrouwenvelder, J., . . . Hammes, F. (2017). Flow cytometric bacterial cell counts challenge conventional heterotrophic plate counts for routine microbiological drinking water monitoring. Water Research, 113, 191-206. 10.1016/j.watres.2017.01.065.
• Vang, O. K., Corfitzen, C. B., Smith, C., & Albrechtsen, H.-J. (2014). Evaluation of ATP measurements to detect microbial ingress by wastewater and surface water in drinking water. Water Research, 64, 309-320. 10.1016/j. watres.2014.07.015.
• Vaughan, Martha; Hill, Robert L.; & Simoni, Robert D. (2002). “The Determination of Phosphorus and the Discovery of Phosphocreatine and ATP: the Work of Fiske and SubbaRow”. Journal of Biological Chemistry. 277 (32): e21. PMID 12161449.
• Vital, M., Dignum, M., Magic-Knezev, A., Ross, P., Rietveld, L., & Hammes, F. (2012). Flow cytometry and adenosine tri-phosphate analysis: alternative possibilities to evaluate major bacteriological changes in drinking water treatment and distribution systems. Water Research, 46, 4665-4676. 10.1016/j. watres.2012.06.010.
• Vrouwenvelder, J., Manolarakis, S., van der Hoek, J., van Paassen, J., van der Meer, W., van Agtmaal, J., & van Loosdrecht, M. (2008). Quantitative biofouling diagnosis in full scale nanofiltration and reverse osmosis installations. Water Research, 42, 4856-4868. 10.1016/j. watres.2008.09.002. S
Figure 8. New GAC media from start-up during the first three months: September - November
Heads Up, Water Utilities: Increased Wildfires in Southeast Threaten Water Quality
Miles Menyhert

Wildfires are no longer a weather phenomenon relegated to the western region of the United States; the occurrence and size of wildfires in the Southeast is growing. Compared to wildfires in the West, those in the Southeast put more people and property at risk due to population density. A region of the U.S. that includes Maryland, Delaware, Virginia, West Virginia, North Carolina, South Carolina, Oklahoma, Arkansas, Kentucky, Texas, Louisiana, Mississippi, Alabama, Georgia, Florida, Washington, D.C., accounts for close to 39 percent of the U.S. populationi, with more people moving to this region every year.
Water professionals should take notice. One adverse outcome of wildfires is the toxic effect on drinking water sources.
A Problem for Water Treatment Plants: Southeast Wildfires are Growing in Size and Frequency
A recent studyii from the University of Florida looked at 36 years of wildfire data (1984-2020) in the eastern U.S. In examining large wildfires during this time frame, data showed an increase
in wildfire size and frequency as compared to the previous two decades, with the biggest increasesiii seen in the southern coastal plains of Florida, portions of coastal Georgia, and South Carolina. While periodic wildfires are beneficial to natural ecosystems, the increased frequency and severity of them in certain regions is cause for concern as it relates to water quality. Large wildfires can impact a water supply’s temperature, contamination levels, acid-alkaline balance (pH), and turbidity, all of which can create issues for water treatment facilities. Another profound way in which wildfire affects the water supply is the creation of cyanotoxins.
Wildfires Stimulate the Production of Cyanotoxins in Surface Water
The increase of wildfires is linked to higher air temperatures, which increase water evaporation and dry out the soil and flora, thereby creating a large source of wildfire fuel. When a wildfire sweeps through an ecosystem, there are shortand long-term cascading consequences for source wateriv :
S The incineration of plant and animal life causes a mass release of nutrients that make their way into surface water through runoff and aerosol transport.
S The same higher air temperatures that increase the chance of wildfires also increase

water temperatures, and when combined with nutrient release and sunlight, can cause cyanobacteria efflorescences (also called “algal blooms”) in surface water near the fire (and miles away) due to aerosol transport.
S Cyanobacteria efflorescences inhibit water flow and cause stagnation, further increasing water temperatures and more cyanobacterial growth.
S A forest canopy reduced by wildfire allows greater photosynthesis and additional stimulation of cyanobacterial growth. A primary metabolite of cyanobacteria is cyanotoxins, which are stored in cells and released during death and decay, chemical oxidation, and friction.
To complicate the scenario for water treatment professionals in the Southeast, wildfire season typically collides with the growing season, during which agricultural operations increase applications of fertilizer, further increasing nutrient loading in runoff.
Powdered Activated Carbon: A Tool for Water Quality
Cyanobacteria and cyanotoxins have become a high-profile drinking water quality concern. As part of the Safe Drinking Water Act, the U.S. Environmental Protection Agency (EPA), included cyanotoxins on the fourth Contaminant Candidate List and the fourth Unregulated Contaminant Monitoring Rule. Their effects on human health include liver disease (hepatotoxins), nervous system disorders (neurotoxins), and skin/ mucosa irritation (dermatotoxins).
An effective technology for removing cyanotoxin compounds is powdered activated carbon (PAC). Through its ease of application, PAC is well-suited for accidental, sudden, or seasonal water issues, such as the appearance of cyanotoxins. Additionally, PAC can taper back pollution peaks, extending the life expectancy of granular activated carbon placed downstream in the same treatment chain.
The PAC is often and effectively used to treat geosmin, a common cause of bad-smelling water. As geosmin is produced by cyanobacteria, wildfire can originate a spike of this substance in source water.
The PAC is also highly accessible and rapidly deployable. It doesn’t require major infrastructure or physical space to deploy and Continued on page 56

can therefore be implemented quickly with lower capital and operating expenses. Spent carbon is easily removed from the water using mechanical filtration techniques. If stored properly, PAC has a nearly indefinite shelf life.
In the context of wildfires, PAC is a highly suitable treatment for cyanotoxins. Exactly when and where a wildfire will erupt is unpredictable, so having a supply of PAC in inventory is an excellent risk management strategy.
Matching Powdered Activated Carbon to Specific Cyanotoxins
Choosing the right PAC depends on the kind of cyanotoxins present in the water. The most common kind of cyanotoxins found in freshwater are microcystins, which are known to cause liver damage. Microcystin-LR is especially studied and followed, as it serves as an indicator of the presence of other toxins. The large molecular size of these compounds tends to favor a macroporous PAC for treatment, and favorable results can be achieved with carbons having a significant pore volume in the target range, such as Jacobi’s AquaSorbTM CB1-MW.
Other compounds targeted by EPA include cylindrospermopsin, which also causes liver damage, and anatoxin-a and saxitoxin, both of which are neurotoxins.
The Florida Keys Aqueduct Authority (FKAA) has taken a significant leap forward in its proactive efforts to meet the U.S. Environmental Protection Agency (EPA) newly established National Primary Drinking Water Regulation (NPDWR) for per- and polyfluoroalkyl substances (PFAS). The finalized regulation, announced on April 10, 2024, mandates maximum contaminant levels (MCLs) for these substances in public water systems, with a compliance deadline set for 2029.
Having consistently adhered to all water quality regulations, Greg Veliz, FKAA executive director, expressed confidence in the authority’s proactive measures. “We have been anticipating these new requirements and have already developed a course of action. Our team is prioritizing this by tackling it head on and we are going to continue to communicate openly with our customers every step of the way.”
To tackle PFAS levels in its water distribution system, FKAA has allocated $100 million from its capital improvement plan specifically for PFAS mitigation initiatives. A key component of FKAA’s strategy involves significant upgrades to the J. Robert Dean Water Treatment Plant (WTP) to reduce PFAS levels in accordance with NPDWR. To achieve this, FKAA enlisted Carollo Engineers to lead the project’s first phase,
While historically, cylindrospermopsin has been found mostly in tropical areas, climate change is causing this toxin to appear in other places. Cylindrospermopsin’s molecular size favors carbons with high mesopore and macropore volume.
Anatoxin-a and saxitoxin are not as common as microcystins, but they have both been detected in U.S. surface waters and Anatoxin-a responds to PAC similarly to microcystins. Saxitoxins are better suited to a microporous activated carbon, such as coconut shell-based carbons like AquaSorb CP1.
Powdered Activated Carbon Mitigates Other Contaminants Resulting From Wildfires
Wildfires burn everything in their paths. When this includes buildings, cars, and other complex manmade materials, a variety of organic and inorganic pollutants can enter the water supply. Regarding organic pollutants, PAC is effective in the mitigation of many toxins, such as petroleum distillates, like plastics and fuels; per- and polyfluoroalkyl substances (PFAS), used in firefighting foams, consumer products, and insulation; and many other manmade materials.
Managing Risk: Track Wildfires and Keep A Supply of Powdered Activated Carbon
Utilities now must take wildfires into account, even those happening hundreds of miles away. Water treatment plants can prepare for the adverse effects on water quality by incorporating PAC into their treatment arsenal, keeping an eye on wildfire reports in their region and making sure their testing protocol aligns with potential effects of wildfires in their watersheds. These effects can happen immediately or over several years.
An easy and inexpensive solution, PAC can be used for spikes in a wide range of water contaminants that threaten the quality of drinking water. Water treatment facilities can manage the risk of contaminant s due to wildfire by having a supply of PAC at the ready.
Miles Menyhert is a chemical engineer with Jacobi Group in Cincinnati. S
i https://www.census.gov/popclock/data_tables.php?component=growth
ii https://www.flchamber.com/wildfires-increasing-across-eastern-us-new-study-reveals/
iii https://www.nationalgeographic.com/environment/article/wildfires-east-cities-climate-change?
iv https://www.nps.gov/articles/000/wildland-fires-could-be-putting-your-drinking-water-at-risk.htm
NEWS BEAT
a comprehensive study exploring alternative, cost-effective treatment methods to meet PFAS and future regulatory requirements. The study focused on integrating one or more of three treatment technologies—granular activated carbon (GAC), ion exchange, and membrane treatment—into the existing 20-million-gallonper-day WTP. With phase two of the project recently underway, Carollo is designing a stateof-the-art nanofiltration facility at the WTP. This facility will feature advanced treatment methods, including sidestream ion exchange and GAC treatment. The design also includes a new injection well for the disposal of byproduct water from the treatment process.
In addition to designing the advanced treatment system, Carollo will provide construction management services to support the project. Following a 12-month design phase, construction of the new nanofiltration facility is anticipated to take 30 to 36 months. This timeline positions FKAA ahead of EPA’s 2029 compliance deadline.
R
InfoSense Inc., manufacturer of the Sewer Line Rapid Assessment Tool, or SL-RAT®, has appointed LR Infrastructure Evaluation LLC
(LRIE) as its sole factory-authorized service provider for performing acoustic inspections in northern Florida.
Alex Churchill, InfoSense chief executive officer, said, “We are excited to partner with LRIE. Its team has built great relationships and has a great track record of excellence working in Florida. We look forward to partnering with them to expand acoustic inspection service offerings in the state.”
Founded in 2014, LRIE specializes in comprehensive wastewater system evaluations, including manhole and pipeline inspections, air control valve maintenance, valve exercising, and smoke testing. It focuses on ensuring capacity, management, operations and maintenance compliance, risk assessment, and strategic planning, along with inflow and infiltration investigations. Its partnership with InfoSense allows LRIE to offer added value, reliability, and productivity, making the company a true business partner to the municipalities. The owner, Karoline Headrick, noted that, “We are grateful for the opportunity to work with InfoSense to provide this proven and cost-effective solution for the industry. Our highly trained team will work hard to give timely and accurate feedback using this incredible tool.” S


Save the Date for the 17th Southwest Florida Water and Wastewater Expo!

Join FWPCOA for the 17th Southwest Florida Water and Wastewater Expo, a premier event connecting industry suppliers with professionals in the drinking water and wastewater industry. Originating from a vision in 2008 by FWPCOA Region 8, this expo has grown into a vital educational and networking platform for engineers, treatment plant operators, and industry
Since its inception, the expo has expanded significantly, now incorporating the Southwest Chapter of FWEA and FSAWWA Region 5, fostering a stronger community among local professional organizations. Last year’s event was a sold-out success, featuring 68 vendors, 21 food sponsors, and over 200 attendees exploring innovative products and educational sessions.
This year’s event, scheduled once again at the Charlotte Harbor Event and Conference Center in Punta Gorda, will be held on August 22. Stay tuned for more details on educational programs, networking opportunities, and how you can get involved.
More information is on the facing page. To stay updated on the latest developments, visit the websites of FWPCOA (Region 8), FWEA (Southwest Chapter), and FSAWWA (Region 5). Don’t miss out on the premier training opportunity for local drinking water and wastewater professionals!
We look forward to seeing you at the 17th Southwest Florida Water and Wastewater Expo! S

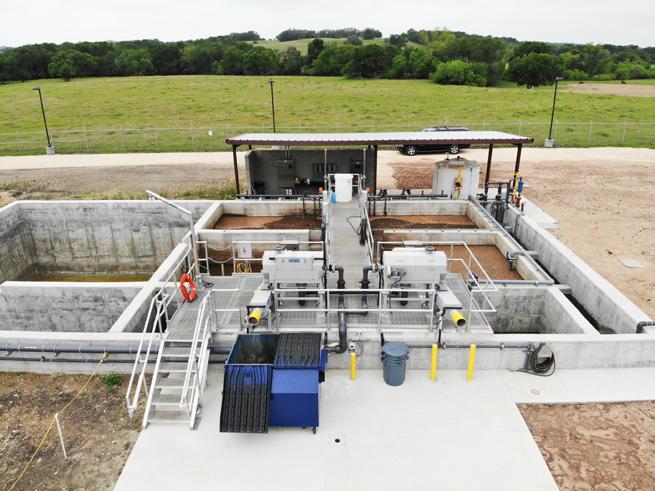

17th Annual Southwest Florida Water & Wastewater Exposition
Charlotte Harbor Event and Conference Center-Punta Gorda, FL Thursday, August 22, 2024 9 am to 4 pm
Track A: Planning

Showcasing Polk County Bio-Wizards Pipe cutting competition: Winners of the 2024 FWRC Ops Challenge!
Session 9:00 AM – 11:00 AM
• We didn’t start the fire: Benefits of Taking a Rearview Mirror Approach to Utility Master Planning Sarasota County’s Utility Planning Journey
Presented By: Kelly Smith, PE Kimley-Horn and Associates
• The Secret to Success: Go WIFIA, Go Fast; Accelerating a $82M Gravity Sewer Rehabilitation Program
Presented By: Timothy Vanderwalker, PE, MBA Tetra Tech
• Leveraging Technology To Enhance Asset Management for Water and Wastewater Treatment Facilities
Presented By: Robert Krallinger, PE Bowman Consulting Group
• Assess All Conditions: Advantages of a Holistic Wastewater Collection System Condition Assessment Approach
Presented By: Vaughan Harshman, PE, MBA V&A Consulting Engineers, Inc.
Track B: Resiliency/Sustainability
• The Caloosahatchee Connect: Award winning collaboration for supplying beneficial reuse
Presented By: Jason Sciandra, PE City of Ft Myers Public Utilities
• Enhancing Florida’s Natural Resources Through Understanding 2023 House Bill 1379
Presented By: Samantha Graybill, PE Wade Trim
• Unlocking the Potential of Your POTW: Generating Renewable Energy & Maximizing Its Value. Adding Digesters in Florida for Biosolids Reduction
Presented By: Jeff VanVoorhis Mead & Hunt
• Updating City of Miami Beach’s Stormwater Master Plan: Proactive and Adaptive Planning in the Face of Climate Change
Presented By: Erik M. Alcantara, PE, PMP, ENV SP / AECOM Cristina Ortega-Castineiras, PE, ENV SP/City of Miami Beach
Afternoon Session 1:00 PM – 3:00 PM
Track A: Wastewater Process/New Technologies
• Pop Quiz: When is the Best Time to Grab MLSS and WAS Samples?
Presented By: Bob Dabkowski Process Optimization, LLC
• Immokalee Water & Sewer District Transforming into a Super Smart Utility
Presented By: Eric Corey / Core & Main Armando Reyes / Immokalee Water & Sewer District
• Chemical Dosing Optimization using Machine Learning
Presented By: Elizabeth Chaffin Xylem
• Lift Station Operations Soars to New Heights with 24/7 Remote Monitoring Technology and Data Analysis
Presented By: Dalton Glover City of Winter Haven, FL, Water Department, Wastewater Division

Track B: PFAS/Lead and Copper
• Getting Past PFAS: How Florida Utilities Can Remove Forever Chemicals From Their Drinking Water
Presented By: Viraj deSilva, PhD, PE, BCEE Freese and Nichols
• Separate to Destroy? Considerations for Handling Emerging Contaminants in RO Concentrate
Presented By: Cory Johnson, PE HDR, Inc
• PFAS in Wastewater: From Crisis to Control; Exploring Solutions, Regulations, and Treatment Innovations
Presented By: Swaroop C Puchalapalli, PE STV
• The Countdown: Readying Utilities for Lead and Copper Deadlines
Presented By: Kimberly Lawrence, EI McKim & Creed

CLASSIFIED ADVERTISING RATES
- Classified ads are $22 per line for a 60 character line (including spaces and punctuation), $60 minimum. The price includes publication in both the magazine and our Web site. Short positions wanted ads are run one time for no charge and are subject to editing. ads@fwrj.com
POSITIONS AVAILABLE
Water Reclamation Facility Operator III
This is skilled technical work, with supervisory responsibilities, in the inspection and operation of a water reclamation plant. The person in this position fills the role as the shift leader. Work involves responsibility for the safe and efficient operation of a water reclamation facility, routine adjustments to equipment and machinery operating controls, inspection of equipment inside and outside the plant site. An employee in this class exercises considerable independent judgment in adjusting machinery, equipment, and related control apparatus in accordance with established procedures and standards to produce a high-quality reclaimed water product. An employee in this class must be able to report to work outside of normally scheduled work hours at the discretion of management.
Required Qualifications:
♦ Possess a valid high school diploma or GED equivalency.
♦ Possess and maintain a valid Driver License.
♦ Possess and maintain a State of Florida Wastewater Operator “B” License.
♦ Must be able to perform shift work.
♦ Acknowledge this position is designated as Emergency Critical (EC) and if hired into the position, you must be immediately available to the department before, during, and after a declared emergency and/or disaster.
Salary: $31.02 - $41.30 hourly
http://www.stpete.org/jobs
REGULATORY COMPLIANCE ANALYST
Ensures the City’s water, sewer, and reuse systems comply with applicable State and Federal laws, rules, and regulations. Analyzes, interprets, and manipulates regulatory compliance data and GIS data and develops databases. Supports the automation of GIS tasks with programming skills. Prepares technical drawings and maps. Also, performs related duties as assigned. Requires graduation from an accredited college or university with a Bachelor’s degree in Civil Engineering, Chemistry, Biology, Marine Biology, or a related field and four (4) years of full-time professional-level water, wastewater, industrial pretreatment, or closely related experience; or an equivalent combination of training and experience. APPLY: Online at https://www.governmentjobs.com/careers/covb and review the complete job description. City of Vero Beach, FL 772 978-4900

Citrus County BOCC – Engineer I
Performs routine professional and technical engineering work reviewing and evaluating plans for the design of new water/ wastewater infrastructure and provides general professional engineering services for departmental capital improvement projects.
Bachelor’s Degree in Engineering or recent college graduate with internship experience in general civil engineering design, site development, residential development, transportation projects, and water and wastewater related projects. Must be a Registered Professional Engineer (P.E.) in the State of Florida.
To learn more about the position and to apply please visit: https://www.governmentjobs.com/careers/citrusfl
Industrial Pretreatment Inspector
The purpose of this class is to assist the Plant Manager/IPP Coordinator in the management and organization of the Oil and Grease Management Program and corresponding FDEP components of the Industrial Pretreatment Program.
Minimum Requirements:
Requires a high school diploma, or GED and formal training, special courses or self-education equivalent to satisfactory completion of one year of college education or specialized advanced training in industrial pretreatment field. Plumbing experience required. Experience in installation, use, and proper operation of grease removal systems and oil/water separators is preferred. At least 5 years of experience in Florida Building and Plumbing Codes preferred. Experience in conducting construction/installation inspections and Industrial Pretreatment Programs preferred. Laboratory experience is preferred. ** All interested applicants must complete an employment application to be considered for the position. You may apply online at https://www.governmentjobs.com/careers/leesburgflorida **

GROW WITH US!
Regional Sales Manager position available Trippensee Shaw, Inc. is a leading manufacturers’ representative company specializing in value added solutions.
This role involves 3 to 4 days per week of mostly day travel in a Florida territory and offers exceptional earning potential. The ideal candidate will:
Have an advanced understanding of water and wastewater processes.
Enjoy problem solving, collaborating, developing, and maintaining relationships.
Be innovative, self-motivated, organized, detail oriented, and have good time-management skills.
L. Todd Shaw, PE LTS@TrippenseeShaw.com 407.222.0575 www.TrippenseeShaw.com
Wastewater Operations Supervisor
Skilled position & candidates should have 7 years of wastewater plant operations experience. Hold a FL Class A Wastewater Plant Operator license & have experience in supervision. Salary $68,683 - $109,892. Apply online at https://www.governmentjobs.com/careers/venicegov
Water Plant Operator
The City of Florida City is seeking qualified candidates for the position of Water Plant Operator.
MINIMUM REQUIREMENTS:
~ Possess a valid high school diploma or GED equivalency.
~ Possess and maintain a valid Driver License.
~ Possess and maintain a State of Florida Wastewater Operator “B” License.
~ Must be able to perform shift work.
~ Acknowledge this position is designated as Emergency Critical (EC)
Must pass background and physical requirements. Excellent benefits package!
Salary DOQ- starting at $35/hour
More Information on our website: https://www.floridacityfl.gov/wp-content/uploads/2024/06/ Water-Plant-Operator-6-27-2024.pdf

Utilities Electrician
$61,234 - $86,163/yr.
Utilities Electrician Apprentice
$55.542 - $78,152/yr.
Utilities Plans Examiner Coordinator
$68,199 - $105,558/yr.
Utilities Treatment Plant Operator I or Trainee
$55,542 - $78,152/yr. or $50,378 - $70,885/yr.
Utilities System Trainee or Operators II & III
$41,446, $45,693 - $64,297, $50,378 - $70,885/yr.
Apply Online At: http://pompanobeachfl.gov Open until filled.

Januar y 2016 Januar 2016
Editorial Calendar
January
February
March
April
May
June
July
August
September...
October
November
December
Technical articles are usually scheduled several months in advance and are due 60 days before the issue month (for example, January 1 for the March issue).
The closing date for display ad and directory card reservations, notices, announcements, upcoming events, and everything else including classified ads, is 30 days before the issue month (for example, September 1 for the October issue).
For further information on submittal requirements, guidelines for writers, advertising rates and conditions, and ad dimensions, as well as the most recent notices, announcements, and classified advertisements, go to www.fwrj.com or call 352-241-6006.
Advertiser Index
Continued from page 13
1. D) a large liquid detention time. One of the key features of aerated lagoon treatment is a large liquid detention time.
2. C) 1 to 3 meters (3 to 10 feet). The depths of most aerated lagoons range from 1 to 3 meters (3 to 10 feet).
3. D) five to 25 days. The required liquid detention times for nitrification within aerated lagoons range from five to 25 days.
4. A) phototrophic and heterotrophic microorganisms. Stabilization lagoons are lagoons that utilize the actions of phototrophic and heterotrophic microorganisms.
5. D) All of the above. True concerning stabilization lagoons rely on algae and cyanobacteria and they have an aerobic environment in the upper zones of the lagoon.
6. D) All of the above. The characteristic mode of operation of stabilization lagoons can be subdivided as aerobic, facultative, and anaerobic.
7. A) 0.3 to 1.2 meters (1 to 4 feet). Typical depths of aerobic stabilization lagoons are 0.3 to 1.2 meters (1 to 4 feet).
8. C) aerobic. The upper portion within facultative stabilization lagoons is kept aerobic.
9. A) anerobic. The bottom portion within
stabilization lagoons is kept anerobic.
10. C) methanogenesis. Biochemical oxygen demand
within anaerobic

