Bathymetric
THE GLOBAL MAGAZINE FOR HYDROGRAPHY WWW.HYDRO-INTERNATIONAL.COM VOLUME 26 | ISSUE 4 | 2022 Enhanced Solutions for Seagrass Monitoring Discovering the WWII Secrets of the Black Sea
Surveys: Improvements and Barriers Advancements in Mapping the Underwater World


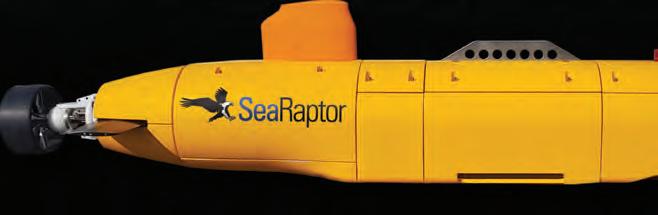

Teledyne Marine AUVs www.teledynemarine.com Exploration and Mapping up to 6000 Meters The SeaRaptor is a survey grade deep water autonomous underwater vehicle (AUV) designed to operate at abyssal depths. The high performance SeaRaptor can carry the most advanced marine sensors available on the market, allowing SeaRaptor to handle a wide range of deep sea operations including: • Broad Area Search and Recovery • Renewables • Exploration • Marine Minerals • Marine Archaeology • Oceanography
Hydro International is an independent international magazine published six times a year by Geomares.The magazine and related e-newsletter inform worldwide professional,industrial and governmental readers of the latest news and developments in the hydrographic,surveying,marine cartographic and geomatics world.Hydro International encompasses all aspects,activities and equipment related to the acquisition,processing,presentation,control and management of hydrographic and surveying-related activities.
P. 9 MBES Feature Detection Using Machine Learning
Manually examining the seafloor for objects such as wrecks requires a great deal of time and labour, both at sea and in the office. As time is a limited and costly factor, the industry is constantly seeking ways to achieve results of a similar or higher degree and in a shorter timespan. In this article, we focus on a Bachelor’s research project on the use of machine learning to produce an autonomous feature detection chain.
P. 15 Marine Habitat Maps from Hydrography and Machine Learning
Aside from being able to monitor water depths, the most recent multibeam echosounder sonar (MBES) systems can also simultaneously record the reflected intensities from different seafloor surfaces. With this capability, it is feasible to explore the variety of seabed types and afterwards build a map of marine habitats. This case study illustrates how hydrographic data can be used to create a map of the marine ecosystem in Malaysia’s Redang Marine Park.
Geomares P.O. Box 112, 8530 AC Lemmer, The Netherlands Phone: +31 (0) 514 56 18 54 E-mail: info@geomares.nl Website: www.geomares-marketing.com
No material may be reproduced in whole or in part without written permission from Geomares. Copyright © 2022, Geomares, The Netherlands All rights reserved. ISSN 1385-4569
Director Strategy & Business Development: Durk Haarsma Financial Director: Meine van der Bijl Editorial Board: Huibert-Jan Lekkerkerk, Mark Pronk, BSc, Marck Smit, Auke van der Werf Head of Content: Wim van Wegen Copy Editors: Serena Lyon Marketing Advisor: Myrthe van der Schuit Circulation Manager: Adrian Holland Design: ZeeDesign, Witmarsum, www.zeedesign.nl Business Development Manager: Jurjen Visser
Advertisements

Information about advertising and deadlines are available in the Media Planner. For more information please contact our business development manager (jurjen.visser@geomares.nl) or go to www.geomares-marketing.com.
Subscription
Hydro International is available on a subscription basis. You can subscribe at any time via https://www.hydro-international.com/subscribe. Subscriptions will be automatically renewed upon expiry, unless Geomares receives written notification of cancellation at least 60 days before the expiry date.
Editorial Contributions
All material submitted to the publisher (Geomares) and relating to Hydro International will be treated as unconditionally assigned for publication under copyright subject to the Editor’s unrestricted right to edit and offer editorial comment. Geomares assumes no responsibility for unsolicited material or for the accuracy of information thus received. In addition, Geomares assumes no obligation for return postage of material if not explicitly requested. Contributions must be sent to the head of content wim.van.wegen@geomares.nl.
P. 19 Discovering the WWII Secrets of the Black Sea
The mysterious Black Sea has many secrets yet to be discovered. This research presents the results of the biggest UXO survey project performed on the Romanian Black Sea coast after World War II, using towed sidescan sonar technology and oceanographic observations. Most of the objects discovered were found to be sinkers, wreck debris or parts of chains, which do not represent a danger to navigation.
P. 22 Bathymetric Surveys: Improvements and Barriers
Since the 1970s, remote sensing has increasingly been used to conduct underwater surveys. Several methodologies are employed in hydrographic surveying, from direct techniques such as probing rods to more sophisticated techniques such as satellite-derived bathymetry and altimetric radar. The growing need for data that is increasingly accurate and available with a quick turnaround has recently led to a worldwide effort to develop sensors and alternative techniques for measuring depth.
P. 31 Landing on the Abyssal Plain Electrification and the transition to a green economy are rapidly accelerating the demand for metals and rare earth minerals. As this demand cannot be met by recycling existing metals, a number of land-based mines are depleting their reserves with an ever increasing environmental and societal impact. Space mining is not a reality for the near future, and so governments and companies are looking into obtaining these crucial metals from the bottom of the world’s oceans. This is the story of Global Sea Mineral Resources’ (GSR’s) efforts to develop a new, responsible mining industry.
Editorial
6 Headlines
Cover Story
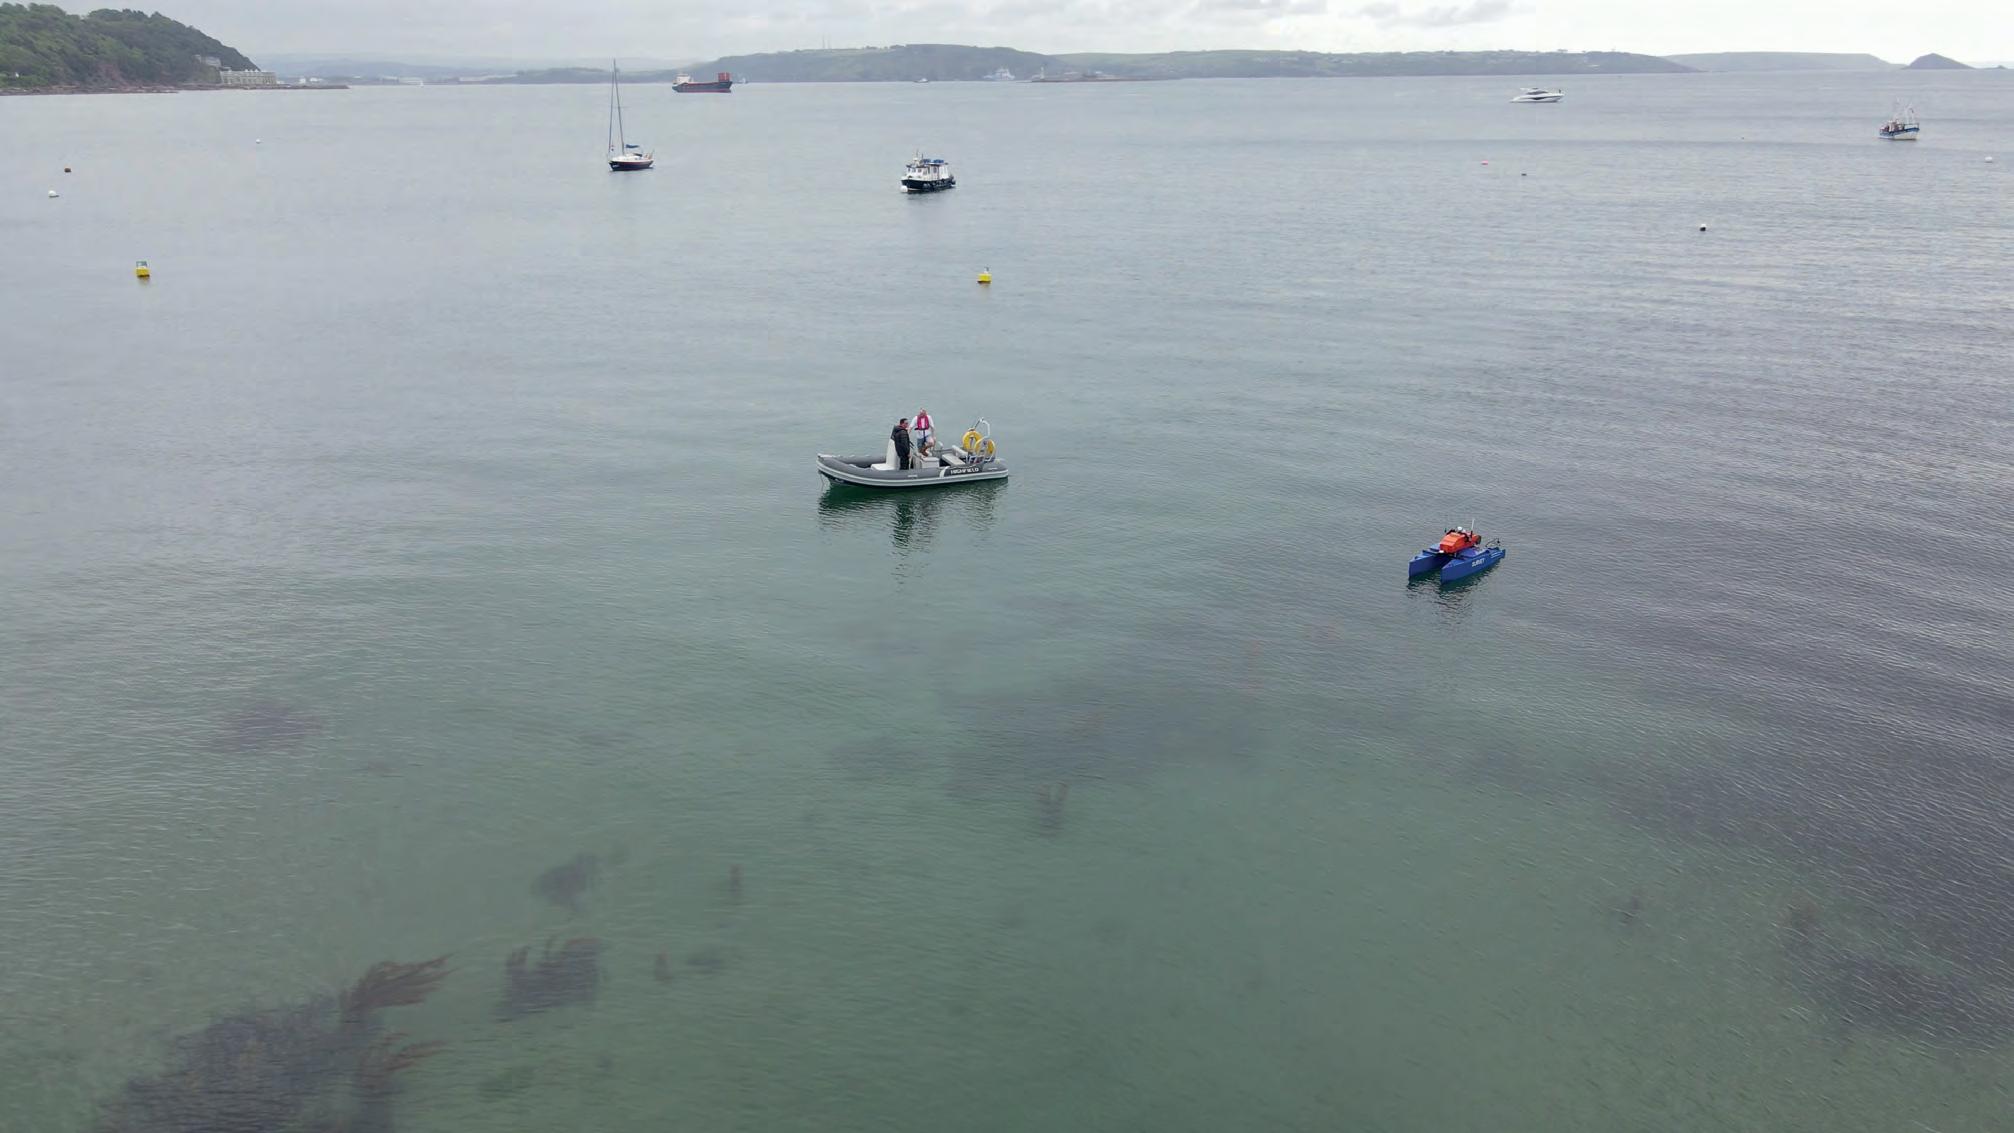
The front cover of this issue of Hydro International shows the HydroSurv REAV-28 USV in action, surveying seagrass meadows. The USV was employed to measure and monitor seagrass biomass on the seabed around England’s southwest coast. (Courtesy: Valeport)
Hydro INTERNATIONAL | ISSUE 4 2022 | 3 CONTENTS P. 5
P.
VOLUME ISSUE 2022 Enhanced Solutions for Seagrass Monitoring Discovering the WWII Secrets of the Black Sea Bathymetric Surveys: Improvements and Barriers Advancements in Mapping the Underwater World
P. 27 Enhanced Solutions for Seagrass Monitoring P. 37 Hydrography in Korea
Please look down!
NASA has successfully pushed the asteroid Dimorphos out of its original orbit in the universe, as the U.S. space agency announced earlier this month. The space rock was hit 11 million kilometres from Earth, and it is the first time that humans have changed the course of an extraterrestrial object. Scientists are ecstatic about the successful experiment, and rightly so, with the mission labelled a huge breakthrough and a new era for humanity by several experts.
It is a scenario reminiscent of the film Don’t Look Up, about the discovery of a comet orbiting the solar system on a direct collision course with Earth. The problem that shapes the main part of the plot is that it doesn’t seem to interest anyone at all, and the film contains a very topical message, about how we communicate, our priorities, and the climate crisis. It is a very funny but above all a very important film.
Problems that we face from outside our own planet is both what NASA deals with and what the film is about. However, there are of course enough pressing issues on Earth, to put it mildly. However, the purpose of this editorial is not to focus on all kinds of doomsday scenarios, but to consider the solutions to our problems. And, if we zoom in on our own area of expertise, it is great to see the solutions coming from the hydrographic sector. How can our industry contribute to the challenges we face?
Perhaps the most obvious way in which the hydrographic profession can contribute to problems that threaten our future is by mapping the ocean floor. Technological breakthroughs have accelerated the process of making this happen. For a number of reasons, mapping the oceans provides us with all kinds of extremely useful insights. For example, bathymetric data can alert scientists to environmental changes and allow researchers to better analyse sea-level rise, land erosion and land subsidence. It is also a crucial tool for understanding life in the ocean, as the shape of the seabed has a significant influence on a whole range of ocean processes. A good example of this is currents: if you can predict ocean current patterns, you can consider the movement of water bodies, which in turn can be used by scientists to model sea-level rise. Such understandings will prove crucial to how we protect our coasts.
The article by Italo Oliveira Ferreira and Laura Coelho de Andrade on page 22 in this issue of Hydro International takes you on a journey
through how remote sensing has increasingly been used to conduct underwater surveys, highlighting several key methodologies that are employed in hydrographic surveying. As the article reveals, the rise of acoustics, optics and radar techniques has catapulted our knowledge of bathymetry over the past decades. On top of this, methodologies have been developed that are capable of providing a better quality control of the acquired hydrospatial information. Now, in the era of machine learning and artificial intelligence, classifying the seafloor with unprecedented accuracy is becoming reality.
There is another reason why people might find the seabed interesting. Some areas of the deep seafloor contain minerals that are commonly used in modern technology, known as rare earth metals. Would a more complete picture of the ocean floor open the way for greater exploitation of these resources? And, to what extent is that something we should find desirable?
Maybe it is a good suggestion to study the impact of a new industry before the industry starts. This is exactly what Hendrik De Beuf describes in his article ‘Landing on the Abyssal Plain’ (see page 31), which focuses on how thorough environmental data has been collected to assess the impact of collecting polymetallic nodules. Some of these nodules are rich in the metals needed for the transition to a green economy, such as manganese, copper, cobalt and nickel: metals that are crucial for the production of batteries, solar panels and wind turbines. It should be clear that the large-scale extraction of these rare earth materials must be done with the utmost care, and I sincerely hope that everyone is interested in handling our ocean bottom with such care. So, don’t just look up, but please also look down!
Wim van Wegen,Head of content, Hydro International wim.van.wegen@geomares.nl
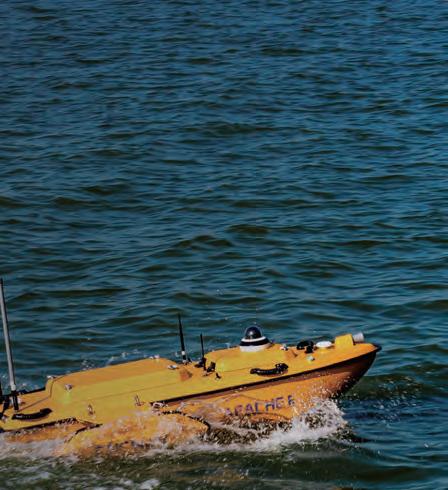
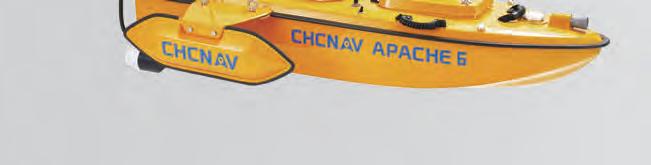
Hydro INTERNATIONAL | ISSUE 4 2022 | 5 EDITORIAL CHCNav 18 Evologics 40 iXblue 4, 34 MacArtney 39 OceanAlpha 26 Saab Seaeye 11 SBG Systems 26 Seaber 12 Teledyne Marine 2 Valeport 18
ADVERTISERS
Wim van Wegen.
Boaty McBoatface to Monitor Marine Environment in the North Sea
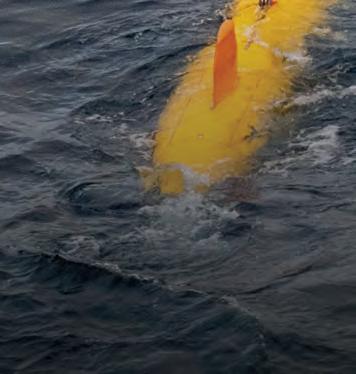
The National Oceanography Centre (NOC) has begun conducting research with robot submarine Boaty McBoatface on end-of-life oil fields off the coast of the Shetland Islands to help monitor and protect the marine environment in the North Sea and to support the industry transition towards its net-zero targets.

The underwater robot will explore several oil and gas structures, including NW Hutton and Miller as well as the Braemar Pockmarks Marine Protected Area, revolutionizing the way in which marine surveys are undertaken.

The Autonomous Techniques for infraStructure Ecological Assessment (AT-SEA) project, led by the NOC, will trial the concept of using submarines such as Boaty McBoatface for high-tech, low-impact monitoring to pick up any potential environmental impacts at these industrial sites. This may eventually replace the current approach to environmental monitoring for decommissioning that requires dedicated ships and teams of people offshore.
UNESCO Shipwreck Mission in Mediterranean Successfully Completed
An archaeological mission under the auspices of UNESCO has concluded its 14-day exploration of the Skerki Bank (Tunisia) and the Sicilian Channel (Italy) in the Mediterranean. For the first time, international scientists from eight Member States have modelled the shipwrecks and improved the mapping of the area in order to protect important underwater cultural heritage in the long term.
Researchers from Algeria, Croatia, Egypt, France, Italy, Morocco, Spain and Tunisia collaborated for this mission. It took place over 14 days aboard the French scientific vessel the Alfred Merlin in international waters, first on the Italian continental shelf under the coordination of Italy, then on the Tunisian continental shelf under the coordination of Tunisia.
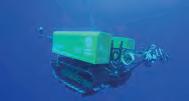
The archaeologists led a survey using two different robots, or remotely operated vehicles (ROVs), which adapted to the


Prominent Role for Geo Focus Vessel in Irish Geophysical Survey Campaign

North Irish Sea Array (NISA) Offshore Wind Farm is undertaking a geophysical survey campaign on the proposed NISA Export Cable Route Area, off the coast of north County Dublin and County Meath, Ireland. The campaign started on 3 September and was set to finish on 3 October, weather permitting.
The NISA Export Cable Route Area forms an irregular shape spanning 11km north-south and 18km east-west at its widest point. The survey area has two landfall areas close to Balbriggan and surveys will proceed as shallow as approximately 3m water depth. The NISA is an offshore wind energy project covering around 226.9 square kilometres in the Irish Sea between seven and 17 kilometres off the coast of the Dublin, Meath and Louth counties. Once operational, it will have the capacity to provide renewable energy for up to 500,000 Irish homes.
The survey will be conducted by the Geo Focus survey vessel, surveying in excess of 10m water depth, and the Ros Aine vessel, surveying in water depths of less than 10m. As the survey vessels will be restricted in their ability to manoeuvre when surveying due to the deployment of the towed survey equipment from the vessel for the duration of the survey activities, all vessels operating within the area are requested to keep a wide berth and pass at minimum speed to reduce vessel wash. The vessels will also display appropriate lights and signals.
geographical and morphological submerged areas. The robot Arthur, designed especially for archaeological surveys in deep waters, was used to document shipwrecks on the Italian continental shelf.
| ISSUE 4 2022 | Hydro INTERNATIONAL6 HEADLINES
MarineroboticsexpertVincentCreuzewiththeArthurROV.(Courtesy:AngelFitor)
GeoFocussurveyvessel.(Courtesy:N-Sea)
TheBoatyMcBoatfaceAUV.
Investigation of a Possible High-risk Shipwreck in Finnish Waters

The marine research vessel Aranda recently surveyed the southeast side of the Finnish island of Utö. A preliminary investigation of the tugboat Simson, which sank in 1978, is underway for a possible oil removal operation.
The Finnish Environment Institute was responsible for the investigation of this possibly high-risk shipwreck southeast of Utö, close to the Archipelago National Park. The Simson was built in 1915 and still in use in the 1970s. The vessel was overhauled in 1971 and sank in 1978, and the wreck is estimated to contain 25,000 litres of light fuel oil.
The aim of the investigation is to 3D model the wreck for further operations and to find out how it could be drained of oil. The tugboat Simson lies partially sunk in the mud at a depth of about 60 metres, and working at this depth poses some challenges. The modelling will be carried out using the hydroacoustic equipment of the marine research vessel Aranda and imaging obtained using an ROV diving robot.
Gaining High-speed Results from Surveying with a Smart Maritime Data Platform

Maritime surveying is one of the most difficult and time-consuming steps in offshore wind energy projects. TrueOcean radically shortens the process of processing data into information with its cloud-based maritime data platform (MDP). Underwater sensor data can be accessed in near real time. In addition, automated analytics accelerate the process for better quality results with standardized parameters. After three years of development, the company is now announcing its official product launch.
The Kiel-based team is bringing the speed of cloud technology, which users know from other industries, to the maritime industry. Data is stored according to the highest security standards in a platform specifically optimized for sensor data. “We will successively integrate further automation and industry-specific services,” emphasizes co-founder and CEO Frithjof Hennemann.
However, the platform is already massively supporting the data value stream of wind energy operators: “Collected data can be directly transmitted to our platform,” Hennemann continues. “Data is safely stored in one maintained and secured data space and ready to be managed and processed. It is accessible to all project stakeholders according to their permission given.”


Veripos Releases Quantum Software with Added Interference Resilience
Veripos has introduced version 7 of its Quantum software incorporating GNSS Resilience and Integrity Technology (GRIT) firmware from Hexagon’s Autonomy & Positioning division to enhance resistance to interference, jamming and spoofing threats. Quantum software optimizes positioning for marine oil and gas applications, dynamic positioning, offshore construction, hydrographic surveying and more.

With the added situational awareness capabilities of GRIT, Quantum ensures users’ positioning, navigation and timing (PNT) are reliable, robust and protected against GNSS outages to keep operations safe and working.
As the radio frequency (RF) spectrum continues to become crowded and vessels rely on multiple RF-based systems, the risk of unintentional interference increases. Further, intentional interference such as jamming and spoofing where false GNSS signals are provided lead to an unreliable and untrustworthy position. With GRIT firmware, Quantum empowers users to visualize, monitor and quantify interference sources affecting GNSS receiver performance in real time, including tools that alert the user to when spoofing may be occurring. geographical and morphological submerged areas.
GRITensurestrustworthypositioning,navigation and timing measurements through proven situationalawarenessandinterferencemitigation foroperationalsafetyofusers’applications,vessel andcrew.(Courtesy:Veripos)
Hydro INTERNATIONAL | ISSUE 4 2022 | 7 MORE HEADLINES WWW.HYDRO-INTERNATIONAL.COM
ScreenshotofTrueOcean’smaritimedataplatform.
Lowering research instruments into the sea.
(Courtesy:
FinnishEnvironmentInstitute)
Uni-Pact USV Completes Bathymetry Survey in Australia

Unique Group has successfully supported the Australian Institute of Marine Science in completing a carbon-conscious bathymetric survey at Cape Ferguson by performing seabed modelling for their upcoming project, using its proprietary unmanned survey vessel, Uni-Pact.
The Australian Institute of Marine Science (AIMS) was looking for an autonomous survey vessel to acquire bathymetry data to perform seabed modelling for their jetty extension plans. In line with this, they reached out to Unique Group, who executed the project to showcase Uni-Pact’s capabilities and effectiveness for the project.
One of the challenges faced in the project was tidal swings – during the very low tides the USV had to be launched very early and recovered late – and, associated with this, recharging of the USV battery, which had to be scheduled with the tide to maintain the vessel’s endurance. 4G coverage was also patchy, which was addressed by collaborating with METOCEAN and setting up a satellite communication system to control Uni-Pact.
Multibeam Sonar Reveals Ship That Warned Titanic of Icebergs
The ship that sent an iceberg warning to the RMS Titanic before the ocean liner sank has been identified lying in the Irish Sea. Using state-of-the art multibeam sonar, researchers at Bangor University have finally been able to positively identify the wreck and reveal its position for the first time.

havefinallybeenabletopositivelyidentifytheSSMesabawreckandhave revealedherpositionforthefirsttime.(Source:BangorUniversity)
In 1912, the merchant steamship SS Mesaba was crossing the Atlantic and sent a warning radio message to the RMS Titanic. The message was received, but never reached the bridge. Later that night, the supposedly unsinkable Titanic hit an iceberg and sank on her maiden voyage, taking 1,500 lives and becoming the world’s most infamous shipwreck. The steamship continued as a merchant ship over the next six years before being torpedoed while in convoy in 1918.
Multibeam sonar proved to be the solution to identify the wreck. For marine archaeologists, this technology has the potential to be as impactful as the use of aerial photography was for landscape archaeology. Multibeam sonar enables seabed mapping of such detail that superstructure details can be revealed on the sonar images.
UKHO Conducts Seabed Mapping Data Survey around Montserrat
TheUKHOdatasurveyteamspentfourweeksgatheringinformation fromMontserrat’snearbywaters.


The UK Hydrographic Office (UKHO) has conducted a seabed mapping data survey in Montserrat to improve the safety of navigation around the island and to help understand, manage and protect its marine life.

For this project, funded by the UK’s Conflict, Security and Stability Fund (CSSF), the UKHO worked alongside the Montserrat Hydrographic Survey Team to collect data from the waters around the island. This information can be used to assist with inundation mapping, which supports disaster resilience and planning, as well as by environmental departments to update habitat maps and the Royal Navy for relief efforts.
The UKHO data survey team returned to the UK in early September after spending four weeks gathering information from Montserrat’s nearby waters. The team will now validate the data, before updating any of its navigational products that cover the waters around Montserrat.
The seabed mapping data survey is the latest in a series of projects where the UKHO, through its Overseas Territories Seabed Mapping Programme (OTSMP), has collaborated with authorities in Montserrat, a British Overseas Territory. During the past six years, the OTSMP supported local authorities to improve their compliance with international maritime obligations and provided equipment and expertise to undertake seabed mapping surveys.
| ISSUE 4 2022 | Hydro INTERNATIONAL8 HEADLINES
USVtotheprojectsite.
MBES Feature Detection Using Machine Learning
Automated Feature Detection
Manually examining the seafloor for objects such as wrecks requires a great deal of time and labour, both at sea and in the office. As time is a limited and costly factor, the industry is constantly seeking ways to achieve results of a similar or higher degree and in a shorter timespan. In this article, we focus on a Bachelor’s research project on the use of machine learning to produce an autonomous feature detection chain. Machine learning for MBES data is still in the first stages of research and has much potential for feature detection. The objective of the research was to create a proof-of-concept machine learning tool, which was called the Multibeam Object Detection Inferencer (MODI). MODI had to be capable of detecting wrecks on the seabed, with the North Sea as the area of interest. The research project was commissioned by the Royal Netherlands Navy and facilitated by QPS.
Artificial intelligence (AI) is the collective term for algorithms that are able to apply human-like reasoning to a specific problem and is one of the methods of data science. Machine learning is a subset of AI and describes the process of understanding, interpreting and processing data. The machine learning algorithm for feature detection uses a convolutional neural network (CNN). In a CNN, the algorithm makes a prediction based on two labels; in this situation, the MBES data points were labelled ‘seabed’ and ‘feature’. The CNN uses filters to recognize patterns in the data sets, and these filters consist of weights and biases that are adjusted during the training phase (Figure 1).
DATA SET LABELLING
During training, a CNN is ‘taught’ to recognize seabed and features based on training data sets created by the AI developer. At the beginning of training, the neural network is not able to give definite results and requires this pre-processed
data to determine the optimal filters. Training a neural network is an extensive process and requires a careful approach. During the training phase, the neural network is sensitive to underfitting and overfitting, which can only be observed after the completion of a training session. An underfit model cannot model the training data or is unable to generalize to new data, whereas an overfit model models the training data too well, to the point that it adversely affects the model’s performance on new data. The training data must be prepared in such a way that as many different objects as possible are used. It is also important to label the coordinates as correctly as possible within the training data sets, as the filters are optimized based on the label definition from the training data set. One sequence of going forward through the network with an estimation of where the seabed and features are and subsequently going backwards (called ‘back propagation’) to adjust the weights and biases is called an

epoch. A training session consists of multiple epochs. After each epoch, training results are presented in the form of three parameters generated for both the training and validation part of the training session: ‘Loss’, ‘Accuracy’ and ‘Intersection over Union (IoU)’. Signs of underfit or overfit can be observed by producing a plot of the loss values.
The labels are binary, so a ‘0’ or a ‘1’. A human processor would probably assign ‘0’ to ‘seabed’ and ‘1’ to ‘feature’, as the feature is the item of interest. However, an inverse distribution was assigned during the research, as the seabed is present in a more consistent manner compared to a feature. Every feature on the seabed is unique in its own way, as different types of vessels sink in different ways and therefore end up on the seafloor in a variety of orientations and potentially different parts. If the algorithm was trained for wrecks, matching filters would have to be created for every situation and
Hydro INTERNATIONAL | ISSUE 4 2022 | 9
Figure 1: Example of a CNN producing a heat map of an image (Robson, Bolch, MacDonell, & Hölbling, 2020).
FEATURE | BY RICHARD SNIJDER, HYDROGRAPHIC SURVEYOR AT VAN OORD AND HUIBERT-JAN LEKKERKERK, SENIOR LECTURER AT THE MARITIME INSTITUTE
WILLEM BARENTSZ, THE NETHERLANDS
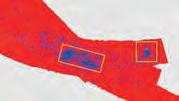
Figure 2: a) Results of MODI on the Walsum 10 data set; b) zoomed in on feature, aft section inside yellow box, bow section inside green box. Blue is predicted as ‘feature’ and red is predicted as ‘seabed’.

category of object. The hypothesis in this research is that this inverted training approach will benefit the creation of the filters and that the remaining data points (not defined as ‘seabed’) will form a cluster of points representing a feature. Even if the feature is not a wreck, it may still warrant an investigation and possibly a human classification after the AI detection. The differences between the normal and the used inverse distribution were not examined during this research.

CNN TRAINING
Processed MBES grid data for eight different wrecks in the North Sea was provided by the Royal Netherlands Navy and used in this research. Six wrecks were used to train the CNN while the remaining two were used to validate the CNN. Using the two validation data sets, the weights and biases were once more
updated using a process called back propagation, which is based on the differences between the prediction and the actual label assignation.
In the training phase, a total of six training sessions were initiated and equally divided into two groups, A and B. Each training session was a follow-up to the preliminary training session, to enhance the CNN parameters. The first three training sessions were considered failures due to the model focusing on undesired parts of the training data set. After adjusting the training, the first two training sessions in group B showed promising results. The final training session showed signs of overfitting and was therefore also considered a failure. Therefore, only the fifth training session (the second from group B) was used for further testing against manual detection.
As mentioned earlier, training the machine learning algorithm is a difficult and timeconsuming process, since insight into the training results can only be accessed after completion of the training session. In other words: the algorithm may be trained incorrectly, but this can only be understood in retrospect, thereby forcing the user to start the training session all over again with different training settings.
Not only is this repeated reinitiation of the training session a time-consuming process, but the computers’ hardware specification is also a bottleneck in the training process. Not having access to high-end hardware specs significantly increased the time required for a full training session. The arrival of AI has introduced a new approach to the utilization of a computer’s graphics processing unit (GPU). Originally,
| ISSUE 4 2022 | Hydro INTERNATIONAL10
Figure 3: a) Results of MODI on the Boetak data set; b) zoomed in on feature. Blue is predicted as ‘feature’ and red is predicted as ‘seabed’.
GPUs were designed to specifically handle rendering and other graphics applications, but in AI the GPU is used for small computations in large quantities. It is suited for this task due to its relatively higher number of cores compared to a central processing unit (CPU). Using a high-end GPU results in a significant decrease in training time.
MODI
The MODI proof of concept was built using the Python programming language and the open source Open3D-ML (machine learning) library. This MIT licensed library is specialized in handling 3D data and has the possibility of developing a machine learning tool. To circumvent GPU issues in the library at the time, MODI was created in Linux. Open3D-ML provides the user with several preset CNNs that can be used and adjusted to suit the application. MODI uses the Kernel Point CNN, which can manage 3D data to make predictions on it. MODI is however more than just the CNN kernel: it is a complete machine learning programme from which the machine learning kernel can be trained and the resulting 3D data can be visualized.
DETECTION RELIABILITY

To produce unbiased statistical values, a data set was required that was completely unfamiliar to MODI, meaning that the data set must neither be used as a training or a validation data set.
Two wrecks, Boetak and Walsum 10, located to the southeast of the island of Terschelling, were used as these foreign data sets (Figure 2, Figure
3). Both wrecks were surveyed in detail using an MBES by third year students on the Ocean Technology programme. A visual analysis showed that MODI was able to detect both wrecks, by representing the location of the wrecks with a large cluster of points correctly labelled as ‘feature’. Although Walsum 10 sank due to an explosion, causing the bow section to separate from the rest of the vessel, MODI was able to detect both of the sections by representing both sections as a large cluster of points correctly labelled as ‘feature’ (Figure 3).
In order to produce statistical results on the predictions made by MODI compared to a manual selection, a confusion matrix was created. A confusion matrix consists of a 2*2 matrix with the true positive (TP), false positive (FP), true negative (TN) and false negative (FN) results. In this case, a true positive is a point correctly labelled as ‘seabed’ and a true negative is a point correctly labelled as ‘feature’. False positives and negatives are incorrectly labelled points. Using the confusion matrix, further statistical values were produced. The reliability for the two wrecks combined scored on average around 50%, as calculated from the weighted summation of the accuracy, precision and recall values. The accuracy is the ratio between the number of correct predictions (seabed and feature) and the total number of points. The precision is the ratio between the points correctly labelled as ‘feature’ and the total number of points correctly and incorrectly labelled as ‘feature’. The recall is the ratio between the points correctly labelled as ‘feature’
and the total number of points predicted as ‘feature’.

CONCLUSION
It is possible to create a machine learning tool to separate features from seabed in an MBES data set. From the statistical analysis, it can be established that MODI’s reliability is currently at approximately 50%. However, from a visual analysis, a human can distinguish with the unaided eye that a feature is present, based on the large cluster of points marked as ‘feature’ at the location of the wreck and the relatively low amount of noise present. Based on these findings, an initial conclusion is drawn that a machine learning tool offers much potential to speed up the process of object detection. However, more research and training with different wrecks is required to increase the reliability of the tool.
Richard Snijder graduated as a hydrographic surveyor from the Ocean Technology course Cat. at the Maritime Institute Willem Barentsz, where he was highly valued for his services as a student assistant. His first internship was at Van Oord, where he worked on the Aberdeen Harbour Expansion Project, and his final thesis was conducted at and commissioned by the Royal Netherlands Navy and facilitated by QPS. Richard Snijder is currently working for Van Oord as a junior surveyor on the IMPACT technical traineeship programme for young talents.
Huibert-Jan Lekkerkerk is a senior lecturer in Cat. Ocean Technology at the Maritime Institute Willem Barentsz and a senior lecturer on the Skilltrade Cat. course. He is also a hydrographic consultant on a variety of projects.


Hydro INTERNATIONAL | ISSUE 4 2022 | 11
Results of the algorithm on Walsum 10 and Boetak.
EMPOWERING
Revolutionizing Commercial Oceanography
YUCO is a Highly Reliable, Affordable and Easy-to-use Micro-AUV
With its neon pink YUCO micro-AUV (autonomous underwater vehicle), Seaber, a France-based company, is spearheading a new revolution in technology for underwater exploration. Bucking a general industry trend towards larger and heavier AUVs capable of carrying complex sensor payloads to perform a range of imaging and measurement functions, Seaber has focused instead on optimization, ease of use and affordability.
Its vision is a readily accessible, relatively low cost and easy-to-programme device that a single operator can deploy, without the need for even a computer in the field. Thanks to its efficient design, the YUCO micro-AUV weighs just 6–9kg fully loaded. Preloaded with the desired scanning programme, the device can be launched by anyone: simply go to the launch site and toss the YUCO into the water, either from shore or from a vessel. The operator is then free to carry out other measurements or tasks while the YUCO performs its mission. When the mission is complete, the YUCO rises to the surface thanks to its designed-in buoyancy. The operator then
activates the ‘come back to me’ function via the handheld remote (called SEACOMM) and retrieves the device. The remote also displays the YUCO’s GPS location upon surfacing. The YUCO offers up to 10 hours of autonomous operational time and can cover 2km2 on a single charge. It travels at speeds of up to 6 knots and can work at depths of up to 300m.
REMOVE THE CABLE, REMOVE THE ISSUES
The YUCO was conceived in part as an answer to the limitations imposed by the towed systems currently in use for much bathymetric survey work, such as seabed

mapping, marine habitat monitoring and underwater search operations related to shipwrecks and equipment lost at sea. These require attachment of a mapping or sensor device to a towing vessel using a cable. Because the towed device can easily get hung up or the cable tangled, their range of operations is restricted. They cannot be used, for example, in shallow waters or around structures. The human and equipment investment for such missions is also high. The sensor devices alone start in the US$50,000 to $80,000 range, to which the price of the cable and vessel has to be added. Once those issues are resolved, the actual towing has to be done at very low speeds (0.1–0.5 knots). This extends the time and resources required to carry out a mission, particularly if multiple scanning passes are necessary. The crew requirements are substantial too, since someone has to keep a constant eye on the cable while others monitor the data and operate the boat.
“The YUCO is an AUV and can fly above the area or object of interest,” says Luc Simon, Seaber business development manager. “It removes the cable. When you don’t have the cable, you don’t have all the issues.” The nose, or front third of the device, is reserved for the sensor payload, which can weigh up to 2kg and be 45cm in length. The rear two thirds, or base, is the same for all YUCO configurations: a sealed, watertight carrier capsule with a thruster and fins. The capsule contains everything needed for motion and
| ISSUE 4 2022 | Hydro INTERNATIONAL12 sponsored article
Getting familiar with the YUCO micro-AUV dockside. Photo courtesy of Nautilus Marine Service.
sponsored article

navigation. This is where the rechargeable batteries are embedded, a Doppler velocity logger (DVL) (to compensate for drift and current), depth sensors and other electronics. Seaber equips the YUCO with its own INX navigation system, offering navigation accuracy better than +/-1%, without expensive external elements.
Two transducers are available, which can be switched out by the user. With the 200kHz transducer, the device can fly 50m from the bottom, providing a large range, for example, to search for something underwater like a shipwreck or lost equipment. With the higher frequency, 680kHz transducer, the YUCO can fly 8m from the bottom, bringing the user close to the object or area of interest. In addition to maintaining a steady distance from the bottom, the YUCO, equipped with a light and camera, can capture photographs and video, as well as detailed acoustic imagery. This opens the door to new uses in photogrammetry and bathymetric surveying.
SINGLE-PURPOSE OFF-THE-SHELF CONFIGURATIONS


The YUCO’s four off-the-shelf sensor configurations are ready for deployment right out of the box. Each is optimized for a single task, such as flow measurement (the YUCO-CTD), water quality parameters (the YUCO-PHYSICO) and acoustic monitoring (the YUCO-PAM). Its sidescan sonar system, the YUCO-SCAN, has wide application in bathymetry. The advent of these affordable, easy to launch, purposebuilt systems is expected to precipitate new
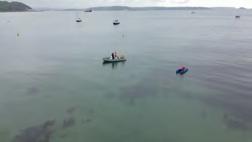
Nautilus Team Uses the YUCO Micro-AUV to Bring Reef Nienhagen Into Sharp Focus

In September, a team from Nautilus Marine Service, a marine technology company based in Buxtehude, Germany, deployed the YUCO in five repetitive, similar missions at Reef Nienhagen.
This is an artificial reef created in the Baltic Sea to provide an underwater landscape for agriculture and marine research. Underwater operations with a tow system here would have been very complex, due to the diversity of structures at varying depths.
The YUCO micro-AUV can fly 50m or 8m above the object or area of interest, for wide search capacity or detailed imaging. As it carries out its mission, the field operator is free to do other tasks. During, for example, a three-hour mission, the YUCO pops up to the surface and transmits its GPS position every 30 minutes, to assure the operator that everything is going as planned.
Sidescan image of seafloor at Reef Nienhagen. A variety of structures has been placed here to provide a landscape for agriculture and marine research.
operational approaches in bathymetric survey work. Particularly, fleets of small, agile YUCOs, each preprogrammed to autonomously carry out its own mission, can be launched by a single operator or small team for a variety of measurements in coastal waters – replacing considerably more expensive deployments of complex AUVs or remotely operated vehicles (ROVs)

weighing hundreds of kilograms and requiring a large ship, crane and crew to launch and operate.
“The key concept is really about keeping it simple, and not trying to do everything in a single system,” says Simon. “We have one device for one application, and that device is simple enough for anyone to deploy.”
INTEGRATED SIDESCAN SONAR FROM DEEPVISION


For the YUCO-SCAN, the company invested considerable effort in the choice and implementation of the sidescan sonar. The selected system, by DeepVision in Sweden, is shaped to the hull of the AUV.
The SEAPLAN software dashboard. A key asset of the YUCO micro-AUV is its ability to accurately repeat the same mission over and over, for example, for monitoring purposes.
In the process, Seaber undertook a step-bystep removal of any perturbation, whether electromagnetic, magnetic, noise or acoustic. Anything that could impact the quality of the data was eliminated to ensure exceptional data quality. The stability of the AUV is another asset for data quality. There is no roll, no pitching or bumping. This is in addition to the fact that the YUCO is an AUV, so it is unaffected by
Hydro INTERNATIONAL | ISSUE 4 2022 | 13
sponsored article
surface-dependent elements such as a cable, waves and wind.

EXPANDED APPLICABILITY AND
With the YUCO, Seaber is expanding the applicability and capability of the AUV platform. After all, some 90% of its customers have never used an AUV before. Agencies issuing new tenders are increasingly cognisant of the possibilities such new technology brings, indicating openness to innovative approaches. Reduced cost, increased ease and safety are just a few potential advantages of using one or a small fleet of micro-AUVs for coastal measurements and monitoring, for search and rescue operations, and for applications such as site mapping, cable inspections and underwater archaeology.
Seaber is specialized in mobile robotics and ocean engineering. The company’s vision is to reshape current approaches to oceanographic exploration. www.seaber.fr

| ISSUE 4 2022 | Hydro INTERNATIONAL14
FEATURE
BY ROZAIMI CHE
Benefitting from the Advancement of Multibeam Echosounder Technology
Marine Habitat Maps from Hydrography and Machine Learning
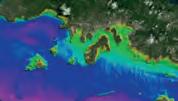
Aside from being able to monitor water depths, the most recent multibeam echosounder sonar (MBES) systems can also simultaneously record the reflected intensities from different seafloor surfaces. With this capability, it is feasible to explore the variety of seabed types and afterwards build a map of marine habitats. This case study illustrates how hydrographic data can be used to create a map of the marine ecosystem in Malaysia’s Redang Marine Park.
A map of any marine ecosystem can be created utilizing data about the habitat that has been acquired in the field, such as by grab sampling, underwater video observations or diving activities. These maps, however, are pointbased and have little value when only sampling data is used. High-resolution spatial data such as an MBES survey bathymetry map, can be used to get around this. The advantage of the hydroacoustic data from hydrographic surveys is that it is gathered remotely from the survey vessel, offering nearly 100% coverage and better spatial resolution. However, marine habitats cannot be inferred based solely on the hydrographic data. Previous studies discovered a considerable correlation between marine ecosystems and the topography of the seafloor, including its complexity or ruggedness as well as the many types of seafloor sediments and their textures. By further analysing the bathymetry and backscatter from MBES to represent habitat variabilities, these variabilities are explained. Deriving seascape derivatives from bathymetry, such as bathymetry slope, rugosity, complexity and benthic position index, as well as sediment textures and attributes from the backscatter data, are examples of this (i.e. grey level textures, grain size and sediment class). These datasets, along with sample data, are combined with machine learning techniques to provide a map of the marine ecosystem that
is spatially explicit and can be used to develop a specialized model for prediction (Figure 1).
HYDROGRAPHIC SURVEY AND SAMPLING DATA
To gather hydroacoustic data for this study, a partnership between Universiti Teknologi Malaysia (UTM) and the National Hydrographic Centre (NHC) was established. This survey could be utilized for regular NHC tasks such as charting and adding to their bathymetry databases in addition to providing data for mapping marine habitats. A Kongsberg EM2040C MBES system was used to accomplish the MBES survey. The survey was conducted in accordance with International Hydrographic Organization (IHO) specifications, which include patch test calibration, tracking tidal fluctuations and recording changes in sound velocity during the survey. The final bathymetry map was created at one metre resolution after raw depth data was processed using Caris Hips and Sips software. Additional factors, such as seascape derivatives, were created from the bathymetry to explain the variance in seafloor topography, which is crucial for relating to marine habitats. The backscatter mosaic (or image) and backscatter intensity as a function of incidence angle (angular dependence of backscatter) were produced using Fledermaus Geocoder Toolbox (FMGT)
software after the raw intensity data was processed. Using the grey level co-occurrence matrices (image texture analysis) and the image enhancement approach (hue, saturation and intensity), a variety of backscatter textures were created from the backscatter mosaic. The angular range analysis (ARA) method was utilized to generate (1) sediment types and (2) sediment grain size (phi) information.
Figure 1: The process used to produce the marine habitat map is depicted in a flowchart and incorporates ground truth sampling, hydrographic information and machine learning.

Hydro INTERNATIONAL | ISSUE 4 2022 | 15
|
HASAN, NAJHAN MD SAID AND MUHAMMAD ABDUL HAKIM MUHAMAD
ground truth and a machine learning approach for the main habitats such as coral, seagrass and sediment types.
MARINE HABITAT MAPPING USING MACHINE LEARNING
To produce full coverage habitat information, sampling data alone might not be practical. Machine learning is one method for accomplishing the goal of predicting habitat class when direct ground truth is not available. The link between the hydroacoustic dataset and the ground truth is first employed in machine learning to develop a model (including the seascape derivatives). The model must have enough data to differentiate between different classes of maritime ecosystems; in other words, each kind of maritime ecosystem has its own acoustic signature. The machine learning algorithm then identifies habitat categories based on hydroacoustic data in the absence of direct ground truth by applying this relationship (model). Depending on the survey data
generated by the MBES mapping, the outcome is a spatially explicit habitat map covering the

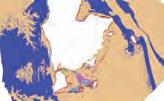
Figure 3: An illustration of a detailed comparison between the generated marine habitat map and the primary hydroacoustic dataset (bathymetry and backscatter).
marine habitats, in particular the spatial distribution of coral and seagrass beds in the region, are depicted on the map (Figure 3). For such a maritime park authority, estimating the size of the coral area is crucial since it will be used as a baseline for future planning of conservation efforts or for studying habitat changes. Seagrass beds are another important marine habitat in this region, as they provide food and shelter for marine creatures such as fish, dugongs and sea turtles. The distribution of seagrass has been spatially explained by the marine habitat map, and this knowledge is crucial for determining how human activities may affect the ecosystem’s deterioration. The map also shows the different types of sediment present in the area, particularly the distribution of fine and coarse sand. Instead of detailed
entire region. Some ground truths were reserved for map evaluation in order to validate this map.
RESULTS OF MARINE HABITAT MAP
The Redang Marine Park’s final marine habitat map is depicted in Figure 2 with a spatial resolution of one metre. The distribution of
information on individual species (e.g. different types of corals), the map provides a broad class of maritime habitats, and is therefore useful for providing a comprehensive overview of the overall habitat in the area. The Department of Fisheries can use this information to create a conservation strategy, and it also serves as one

| ISSUE 4 2022 | Hydro INTERNATIONAL16
Depending on the survey data generated by the MBES mapping, the outcome is a spatially explicit habitat map covering the entire region
of the main inputs for the Marine Spatial Planning of the biodiversity region in Malaysian coastal waters.
CONCLUSION


Hydroacoustic data from hydrographic surveying is not only useful for standard mapping purposes but can be analysed and extended to serve other purposes, in alignment with the philosophy ‘collect once, use many times’. For marine habitat mapping, hydroacoustic data alone might not be sufficient, and integration with sampling data and machine learning techniques was found to be useful. The method demonstrated in this study overcomes difficulties associated with acquiring too much sampling data over large areas. In order to ensure the dependability of the marine habitat maps created, the accuracy and requirements of the hydrography survey must be as high as possible, to ensure that all the marine habitat maps produced are free of artefacts and errors. With the current technological advancements taking place, such as the use
of unmanned survey vehicles and autonomous systems, marine habitat mapping projects can be completed at a lower cost and in less time and provide more
detailed information. We anticipate that, in the future, marine habitat maps will be just as crucial to hydrographic authorities as navigational charts and bathymetry data.
Rozaimi Che Hasan (PhD) is a senior lecturer at the Razak Faculty of Technology and Informatics, Universiti Teknologi Malaysia (UTM), Kuala Lumpur, Malaysia. His current research deals with the processing and enhancement of multibeam backscatter data to facilitate marine habitat mapping processes.


Najhan Md Said (PhD) is a professional hydrographic surveyor. He is currently serving the Royal Malaysian Navy as First Admiral. He is actively involved in national and international level engagements as a subject matter expert in technical aspects of the law of the sea, maritime boundary delimitation affairs and hydrography field research.
Muhammad Abdul Hakim Muhamad is a researcher at the Razak Faculty of Technology and Informatics, Universiti Teknologi Malaysia (UTM), Kuala Lumpur, Malaysia. He received his PhD from UTM in 2022. His current research interests include the use of hydroacoustic data for habitat suitability model development.
Hydro INTERNATIONAL | ISSUE 4 2022 | 17
WWW.GEOMARES-MARKETING.COM


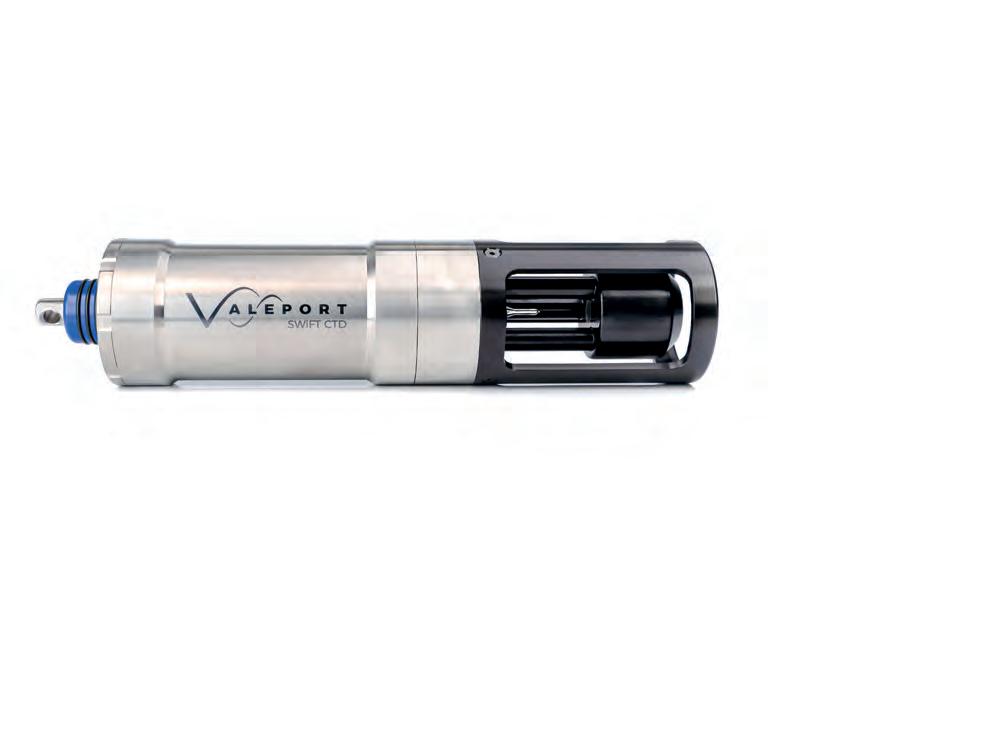
To find out more contact sales@valeport.co.uk +44 1803 869292 | www.valeport.co.uk Measured CTD, with all the benefits of the SWiFT SWiFT CTD • Bathymetry • CTD & Environmental • Current • Sound Velocity • Tide • AUV, ROV & ASV • HYDROGRAPHY • HYDROMETRY • METROLOGY & POSITIONING • OCEANOGRAPHY • PORTS, HARBOURS & DREDGING • RENEWABLE ENERGY
Sidescan Sonar for Underwater Object Detection
Discovering the WWII Secrets of the Black Sea
The mysterious Black Sea has many secrets yet to be discovered. This research presents the results of the biggest UXO survey project performed on the Romanian Black Sea coast after World War II, using towed sidescan sonar technology and oceanographic observations. The survey was carried out between 2015 and 2018 by the Romanian Navy’s hydrographic ship Commander Alexandru Cãtuneanu and the Romanian Maritime Hydrographic Directorate. Most of the objects discovered were found to be sinkers, wreck debris or parts of chains, which do not represent a danger to navigation.
WWII AND THE BLACK SEA
The assessment was based on the archival research carried out by the Romanian Mine Warfare Data Centre (MWDC) at the Historical Service of the Army in Bucharest. As many as 112 files from the Romanian Royal Navy Command archive, the Sea Division and the Modern Romanian Navy Command were studied, related to mining/demining activities, naval combat actions and anti-submarine combat in the western Black Sea during World War II. Moreover, the Notices for Navigators from 1952 to 2011 were examined, extracting data referring to submarine obstacles, wrecks, pipelines and other contacts.
More than 20 minefields were installed during World War II along the current Romanian coast, totalling approximately 3,000 sea mines of various types (UMA, UMB, VICKERS, EMC I, EMC II, FMB, UC, etc.), plus more than 3,000 protection mines and anti-sweep devices, generally known as unexploded ordnance (UXO). The Romanian and German forces launched these minefields using specialized ships. During the same period, an unknown number of magnetic minefields were launched along the Romanian coast by Soviet forces. Between 1946 and 1948, Soviet forces also carried out the first dredging operations, and a considerable number of mines were neutralized by dredging or shooting. Between 1946 and 1960, the documents studied so far show that
approximately 600 mines and 300 protection buoys were destroyed by dredging, shooting or blasting.
A significant number of contacts and debris from the historical minefields still lie on the Romanian Black Sea seafloor, posing a potential environmental threat and a danger to the fishery sector.
UXO SURVEY IN THE BLACK SEA
The sidescan sonar is known to be a valuable tool in Maritime Mine Counter Measures (MMCM) surveys, due to its ability to provide an accurate acoustic image of the seafloor and contacts above it. For this survey, an EdgeTech 4200 multi-pulse (MP) sidescan sonar was used.

Hydro INTERNATIONAL | ISSUE 4 2022 | 19
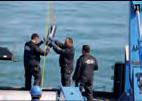
Figure 1: Sidescan survey operations.
| FEATURELAURENTIU-FLORIN
CONSTANTINOIU, EUGEN RUSU, MARIA-EMANUELA MIHAILOV
To achieve a higher swath width, the sonar’s lower frequency (300kHz), in MP configuration, was chosen for this UXO survey. The higher 900kHz frequency provides a higher pixel resolution, and therefore greater detail of the acoustic picture, and was used for wreck investigation. The positioning information (latitude, longitude, heading, speed) from the DGNSS sensor was combined with the attitude sensor of the tow fish (pitch, roll) for an accurate location of the sonar echoes on the seabed.

The sonar’s acoustic signals were calibrated at least twice a day using a Valeport sound velocity profiler (SVP) that provided in situ sound velocity profile observations. In the northern part of the surveyed area, more oceanographic stations were needed due to the rapid change in the halocline, a result of the Danube River outflow. Additionally, the ship’s single-beam or multibeam hydrographic sonars were used to complement the survey and detect underwater obstacles that could damage the towed sonar. A comprehensive contact analysis was performed for every survey line to identify and classify the mine-like echoes from the sonar into a mine-like contact. Mine-like contacts are selected by assessing their sonar echo intensity, shape, size and shadow.
RESULTS AND DISCUSSION
The survey results and analysis allowed the detection and classification of more than 2,000 contacts using the sidescan sonar processed images.
Most of the contacts are mine sinkers (anchors of naval moored mines, debris from the naval mines or parts from the wrecks near these locations). However, a few contacts were observed and classified as real naval mines from World War II. Once a submerged object is identified as a sea mine, the district is closed to navigation by the Maritime Hydrographic
The topography and nature of the seabed can create false echoes/contacts, therefore considerably increasing the detection and classification time of objects; a seabed with rock formations can easily hide metallic objects in their shadow. Moreover, the type of seabed influences the acoustic impulse sent by the sidescan sonar: higher-frequency sound is reflected more efficiently by a rocky seabed, while fine silt and clay absorb lower-frequency sound. However, it was observed that muddy areas with shells embedded reflected more sound energy than pure sandy regions. The type of seabed therefore significantly influences the process of marking and
Directorate issuing a navigator’s notice, and the Romanian Navy’s Explosives Ordnance Disposal (EOD) divers begin neutralization operations. During this survey mission, the positions of some known wrecks were reconfirmed, but new wrecks and wreck debris were also discovered.
The northwestern part of the Black Sea has many particularities that impact any survey activities using sound energy: different types of seabed features, a distinctive water column structure and rapidly changing surface water parameters. The unique water column characteristics of the northwestern Black Sea area (the low salinity and the low presence of oxygen (an anoxic layer)) mean that the metallic contacts have been well preserved. They are therefore in a good state, considering the marine environmental conditions in the area and the time elapsed since their launch in the water.
classifying targets, especially in the case of small and partially buried contacts. A comparison of the images using two different sonar frequencies showed the advantages and disadvantages of each frequency: the low frequency can provide a broader range, in deeper waters, and faster surveys, while the higher frequency provides more resolution in shallower areas, but with less area coverage. It is therefore recommended to conduct the initial survey using the low frequency of the sidescan sonar, and after that to perform a high detail survey on contacts of interest (wrecks, mine-like contacts, etc.).
Historical documents revealed that not all naval mines were deployed correctly. Thus, some UXOs had drifted with the underwater and surface currents, following the thermohaline circulation process of the Black Sea generated by density gradients. Mathematical models of

| ISSUE 4 2022 | Hydro INTERNATIONAL20
Figure 3: Contacts discovered on a historical minefield.
Figure 2: UMA mine discovered during the survey.
The survey results and analysis allowed the detection and classification of more than 2,000 contacts using the sidescan sonar processed images
the waves and surface currents in the Black Sea may bring operational value to the Romanian Navy by providing circulation predictions that have a considerable impact on the Romanian Navy operations.
CONCLUSIONS
A significant number of underwater contacts were discovered on the seafloor along the Romanian Black Sea coast using sidescan sonar technology: naval mine anchors, metallic fragments of naval mines, wrecks and debris and UXO. While historical UXO presents a threat to navigation due to the explosive charge, the risk of a naval incident caused by hitting a UXO is low. The WWII wrecks and UXO identified during this survey can however pose an environmental threat if chemical substances leak from the munitions. More research is required, such as an extensive biochemical sampling campaign and a solid policy framework needs to be developed.


Following this study, the next step in target classification is identification based on intrinsic physical features of the objects rather than external features such as location and orientation. Furthermore, library matching techniques to determine the similarity between the existing database and unknown sources will become a powerful tool for classifying UXO vs. non-hazardous objects and, in some instances, identifying the UXO type. The project is still undergoing, as a considerable number of underwater contacts still need to be identified with the help of divers, ROVs (remotely operated vehicles) or AUVs (autonomous underwater vehicles), and contacts identified as real sea mines need to be neutralized by the Romanian Navy EOD divers.
Acknowledgements
The authors would like to thank Navy Captain (ret.) Sorin Grecu, former head of the Romanian Mine Warfare Data Centre and Lieutenant Commander Radian Trufașu, head of the Nautical Cartography branch, from the Romanian Maritime Hydrographic Directorate, for their efforts to gather information from the National Military Archive regarding mine warfare actions along the Romanian Black Sea coast during and after World War II.
The authors would also like to thank Lieutenant Commander Valentin Demente, Lieutenant Nina Camelia Sandu, Lieutenant Fabian Ciubotariu, Lieutenant Leonard Jianu and Petty Officer Marian Simion for their contributions to the collection and processing of the sidescan sonar and oceanographic data. We also thank Navy Captain (ret.) Rogers Casian, former Commanding Officer of the Romanian Hydrographic Ship Commander Alexandru Cãtuneanu and all the crew that was present for the long days and nights of surveying.
Laurentiu-Florin Constantinoiu obtained his Cat. A hydrographic surveying diploma from the University of Plymouth, UK and is currently a PhD student at the Department of Mechanical Engineering, Dunãrea de Jos University of Galati, Romania. He has conducted hydrographic and oceanographic research at the Maritime Hydrographic Directorate – Constanta, Romania since 2011 and is the Romanian delegate at the NATO Maritime Geospatial Meteorological and Oceanographic Centre of Excellence in Portugal. His main scientific interests include underwater research and maritime unmanned systems development.
Eugen Rusu is a professor in the Department of Mechanical Engineering, Dunãrea de Jos University of Galati, Romania, and a PhD coordinator. He has a degree in naval architecture (1982) and a PhD in mechanical engineering (1997). He completed his education as a post-doc fellow at the Hydrographic Institute of the Portuguese Navy, where he was responsible for wave modelling. As of 2006, he is a professor collaborator at CENTEC (Centre for Marine Technology and Ocean Engineering), University of Lisbon, Portugal. His main scientific interests are ocean energy, marine engineering, coastal hazards, wave and current modelling, wind energy and related fields.

Maria-Emanuela Mihailov is a senior researcher in physical oceanography at the Maritime Hydrographic Directorate – Constanta, Romania in the Research and Innovation Laboratory. She received her PhD from the Faculty of Physics in the Department of Meteorology and Earth Physics at the University of Bucharest in 2012 with the thesis: ‘Black Sea water masses dynamics in the North-Western Black Sea shelf’. She is currently working on hydrographic and oceanographic phenomena research, combining these scientific realms to investigate, analyse, evaluate and model the main physical processes in the Black Sea and to apply deep learning/AI as a tool for climate change analysis.

Hydro INTERNATIONAL | ISSUE 4 2022 | 21
Figure 4: Sciuka class Soviet submarine wreck.
Figure 5: Russian destroyer Moskva wreck.
Developments and Points for Improvement
Bathymetric Surveys: Improvements and Barriers
Since the 1970s, remote sensing has increasingly been used to conduct underwater surveys. Several methodologies are employed in hydrographic surveying, from direct techniques such as probing rods to more sophisticated techniques such as satellite-derived bathymetry and altimetric radar. The growing need for data that is increasingly accurate and available with a quick turnaround has recently led to a worldwide effort to develop sensors and alternative techniques for measuring depth.
SURVEY PLATFORMS
Bathymetric survey platforms include surface vessels, submersible platforms, aircraft and satellites (see Figure 1). Vessels range from large ships, used in offshore surveys, to uncrewed vessels, either remotely controlled or autonomous. The most commonly used submersible platforms are autonomous underwater vehicles (AUVs) and remotely operated vehicles (ROVs), both of which are used for high-resolution mapping in deep water and which can be controlled from a surface vessel. Acoustic sensors are preferred
on these platforms, although AUVs and ROVs now also carry light detection and ranging (Lidar) systems and high-resolution photographic cameras.
The Ship Fairweather of the National Oceanic and Atmospheric Administration (NOAA) is mainly used in offshore hydrographic surveys and port surveys and is equipped with a Reson Seabat 8160 echosounder, which surveys depths of up to three kilometres. EchoBoat is a small autonomous surface vehicle (ASV) used in bathymetric surveys of inland waters and
sheltered areas that are performed using acoustic sensors. The Hugin AUV from Kongsberg has, in addition to the EM2040 multibeam echosounder, a laser profiler, a coupled photographic camera and a HISAS 1032 synthetic aperture sonar, among other systems and sensors.

Crewed and uncrewed aircraft are also used in bathymetric mapping. These platforms are equipped with passive sensors, which allow depth estimates to be made through the spectral response of the submerged bottom, and active sensors, such as bathymetric Lidar. Similarly, satellites also function as bathymetric survey platforms, either through the use of orbital images (bathymetry by spectral response) or through the use of altimetric radars (active sensors), as in the Seabed 2030 project. There are also hybrid solutions that enable the acquisition of bathymetry using an echosounder towed by a low-flying unmanned aerial vehicle (UAV; Figure 2) or an integrated ground penetrating radar (GPR). Unmanned surface vehicle (USV)-based platforms are also increasingly used.
BATHYMETRIC SURVEY METHODS
Modern bathymetric surveys are carried out in various media, depending on the method used. Sound waves are used in the aquatic environment, visible light is used in the air and in the aquatic environment, and bathymetry derived from information from altimetric radars is used in the air.
| ISSUE 4 2022 | Hydro INTERNATIONAL22
Figure 1: Platforms used in hydrographic surveys: (a) NOAA Ship Fairweather for offshore surveys,
(b)
EchoBoat-ASV from Seafloor Systems, (c) Hugin AUV from Kongsberg.
FEATURE
| BY ITALO OLIVEIRA FERREIRA AND LAURA COELHO DE ANDRADE, UNIVERSITY OF VIÇOSA, BRAZIL b)a) c)
Acoustic systems are used both in shallow water of around one metre deep and in deep water of many kilometres of depth. Such systems are preferred as they provide more accurate data than other methods. The high attenuation of visible light in the aquatic environment means that depth measurement by optical remote sensing (active and passive) is limited to shallow depths. While aerophotogrammetric (short distance) and orbital images are employed for bathymetry at depths of up to ten metres, Lidar systems operating in the green wavelength can reach up to 50 metres in clear waters. Finally, altimetric radars can be used to obtain depths in deep waters, especially where bathymetric information is scarce or non-existent.
ACOUSTIC SENSORS
The first record of the use of an echosounder, or sonar as it is popularly called, is when Leonardo da Vinci placed a tube in water to detect big ships, by positioning his ear in the tube. There are both passive and active sonar systems, but active sonar is used in depth measurement.
Between 1920 and 1930, the world saw the development and implementation of singlebeam echosounders (SBESs), which use sound to measure the depth directly below the sounding platform. By running a series of lines at a specified spacing, SBES greatly increased the speed of the survey process, allowing more data to be collected compared to direct methods. However, this method still left gaps in quantitative depth information between the survey lines. Between the 1950s and the 1980s, technological developments resulted in
the emergence of sidescan sonars (SSSs) and multibeam echosounder (MBES) systems (beam-formers). Lateral scanning sonar technology offered a qualitative means of obtaining the sonic equivalent of an aerial photograph and improved the ability to identify submerged shipwrecks and obstructions. This proved to be an excellent aid for SBES surveys, since it enabled the search for submerged objects between the navigated lines. Beamforming MBES made it possible to obtain quantitative depth information for almost 100% of the submerged bottom.
SBES is ideal for shallow water surveys and is very cost-effective. The planning, operation, processing and analysis are simple, and there is a huge range of equipment operating at low frequencies (12kHz–50kHz), high frequencies (100kHz–700kHz) and even dual frequencies (24kHz/200kHz, 33kHz/200kHz, 50kHz/200kHz, etc.).

MBES traditionally obtains depth measurements through the process of electronic beam-forming (Demoustier, 1996). Alternatively, some equipment employs interferometry to measure depth. Such systems are popularly known as interferometric sonar, interferometric multibeam, interferometric sidescan, bathymetric sidescan or phase-differencing bathymetric sonar (PDBS). The latter term is theoretically the most correct, since only the first systems actually employed the process of interferometry.
There are several advantages to using PDBS, the main one being the background coverage, which in some cases is up to 12 times the nadir
depth. This means that, at 4m depth, PDBS should be able to cover a range close to 50m, while a standard multibeam (120° swath) would cover about 12–16 metres at this depth. PDBS technology has in fact existed for many decades, but several operational and technical problems were only recently solved. It can be concluded that the main advantage of this type of system is the wider sweeps, which result in a significant increase in productivity in shallow water. A problem still to be resolved is the theoretical uncertainty model (a priori) of the
Improvements in synthetic aperture sonar have also take place in the last few years. Kongsberg recently launched HISAS 1032, a system capable of generating approximately 1,000 metres swath at 2.5 knots and images with a resolution of 5cm. For bathymetry, HISAS 1032 demonstrated a significant improvement over its previous version in which a resolution of 50cm was obtained, now producing a resolution of 20cm. The system is able to generate coverage of approximately 4.5 km2/h, which is also high compared to previous versions.
Finally, in all cases, the primary disadvantage of surveys with acoustic systems lies in the high costs associated with vessels and their crew. In shallow waters, a higher level of detail is always required, which is reflected in a higher number of survey lines. In deep water, on the other hand, the problem is the high costs due to the large ships and their crew. Even when using autonomous vehicles, vessels are needed to control the uncrewed platform and provide acoustic positioning when using AUVs.
AIR- AND SPACEBORNE REMOTE SENSING
Despite the high attenuation suffered by electromagnetic waves in water, the visible portion of the spectrum can be employed in bathymetric mapping, especially where acoustic methods have limitations. In this context, depths can be measured either employing passive methods, which measure only the natural light reflected from the submerged bottom (spectral response bathymetry), or active methods, which use lasers to measure the distance to the seabed.
The great advantage of these methods lies in the productivity that can be achieved (Figure 3).
SPECTRAL RESPONSE BATHYMETRY
The method using sensors embedded in crewed or uncrewed aircrafts or satellites is
Hydro INTERNATIONAL | ISSUE 4 2022 | 23
based on the principle that part of the sunlight that reaches the submerged bottom is reflected and can be detected by these sensors, which use this radiation to measure depth and obtain bathymetric maps.
The principle of using orbital and aerial images for bathymetric mapping is not the same as that adopted by active sensors. Satellitederived bathymetry is based on three techniques: empirical approaches, empirically tuned physics-based approaches and optimization-tuned physics inversion approaches.

Empirically tuned physics-based approaches follow the principle that the intensity of the radiant energy that is reflected by a water column and received by the sensor is a function of the water depth; that is, the portion of solar radiation that penetrated the water column. In most cases, the Normalized Difference Water Index (NDWI) is used.
The empirical approaches are the newest method (machine learning techniques) and not widely used. In the optimization-tuned physics inversion approaches, the application of the model requires the specification of a range of optical properties of the water and the seafloor, but no in situ data is needed for calibration.
Spectral response bathymetry makes it possible to quickly collect data over large areas at a low
cost, but the maximum depth is approximately 30 metres in clear waters and much less in turbid waters. In addition, the information is obtained at accuracies that are incompatible
mid-1960s, originally as a tool for topographic mapping. During flights over lakes and coastal regions, the researchers noticed a double return, from which they concluded that the laser penetrated the water and could be used to map the bathymetry.
The basic working principle is the emission of two laser pulses, the first in the infrared wavelength (~1064nm), which allows the detection of the surface since penetration into the water is effectively zero, and the second in the green-blue wavelength (~532nm), which – despite a high level of dispersion – can reach the submerged bottom. As with an echosounder, a time series of light intensity (instead of acoustic intensity) is recorded. The typical scan interval is 1ns (10-9 seconds), as opposed to ~1ms to 10µs (10-3 to 10-5 seconds) for acoustic signals. The echo envelope, or waveform, is then used to estimate the depth.
The penetration is generally three times the depth observed with the Secchi disc and is determined in situ. Another method, which is technically more effective, would be to determine
with current requirements, restricting its use for planning, recognition and environmental modelling purposes. Aerophotogrammetric and orbital images are therefore mainly used as a recognition and planning tool in areas where bathymetric information is non-existent or insufficient. However, images from orbital and airborne sensors are very useful for the delineation of coastlines and the mapping of port structures and as a navigation aid.
LIDAR
Bathymetric Lidar is the most productive method for bathymetric mapping in shallow water (< 50m), as it usually surveys at 180 knots and the covered range is higher than most modern MBES and PDBS. Similar to acoustic systems, Lidar measures depth indirectly using the travel time of a laser pulse. These systems were first introduced in the
the attenuation coefficient for the wavelength used, which describes the exponential decay of light with depth. More modern systems are able to obtain a vertical and horizontal accuracy of about 20cm, with a spacing of 1m.
ALTIMETRIC RADAR
In the 1970s, the main purpose of radar altimetry was to measure the ocean’s surface that most closely approximates to the geoid. Thus, over the years, several altimetric missions were carried out to meet demands in the areas of geodesy, oceanography and continental hydrology. Examples of this were the Geosat missions in 1985 and ERS-1 in 1991, which obtained as results good-quality surface models of ocean topography. It is known that there are small depressions on the surface of the ocean that mimic the topography below water. This is due to the extra
| ISSUE 4 2022 | Hydro INTERNATIONAL24
Figure 3: Different methodologies for extraction of bathymetry, exemplifying the high productivity of optical remote sensing.
Our knowledge of bathymetry has advanced rapidly over the last century, due to the rise of acoustics, optics and radar techniques
gravitational pull of seabed features such as seamounts, producing variations in gravity which in turn produce small variations in the height of the ocean surface. These depressions can be mapped by an altimetric radar mounted on a satellite. In deep ocean basins, where sediments are thin and the morphology simple, altimetric radar data can even be used to predict current bathymetry.
On continental platforms (where sediments are thicker and conventional bathymetric surveys are in abundance), the gravimetric methodologies used to estimate depth are of limited value. However, much bathymetric data has been obtained together with gravimetric information derived from satellites, allowing an optimal interpolation of the depths.

It is therefore evident that information derived from altimetric radars is not sufficiently accurate for verifying risks to navigation and also not functional in shallow water, where other techniques (such as Lidar) produce more reliable and better results. In addition, the data obtained with radar alone is unable to provide the true depth and correlation with bathymetric data is necessary, as is performed in the methodology for measuring bathymetry through the spectral response.
CONCLUSIONS
Our knowledge of bathymetry has advanced rapidly over the last century, due to the rise of acoustics, optics and radar techniques. Methodologies have been developed that are capable of providing a better quality control of the information acquired, together with the use of more robust and rigorous interpolators that have led to forms of representation of the seafloor in a more realistic way.
Despite such progress, however, there are still numerous technologies that can be studied and some issues to be resolved. Further improvements should include motion sensors, positioning systems and speed sensors, lifting platforms and sophisticated software, including algorithms that dynamically compensate and allow narrower beam widths at short distances; in other words, with a higher spatial resolution. Another trend is the use of point density with robust techniques for cleaning spurious data, as well as more accurate tide models and methods based on unsupervised machine learning. Deep learning can also be used to predict and classify the seafloor with orbital images with more accuracy and speed and no reliance on in situ data, which will also help in related areas, such as biological, climatological and sedimentological studies.
References
Ferreira, I. O., Andrade, L. C. D., Teixeira, V. G., & Santos, F. C. M. (2022). State of art of bathymetric surveys. Boletim de Ciências Geodésicas, 28.
Italo Oliveira Ferreira is a professor in Geomatic Engineering at the Federal University of Viçosa (UFV). He is a geomatic engineer with a Master’s and Doctorate in Spatial Information (Geodesy and Hydrography). He has experience in the geosciences, working mainly on the following topics: hydrography, geodesy, Lidar, observation adjustment, geostatistics and quality control. He is also the coordinator and founder of the Study and Research Group on Hydrographic Surveys (GEPLH-UFV).

Laura Coelho de Andrade is a geomatic engineer. She is a Master’s student in Spatial Information (Geodesy and Hydrography) at the Federal University of Viçosa (UFV). She is also a member of the Study and Research Group on Hydrographic Surveys (GEPLH-UFV) and has experience in the areas of spectral response bathymetry, 3D modelling and machine learning.

Hydro INTERNATIONAL | ISSUE 4 2022 | 25
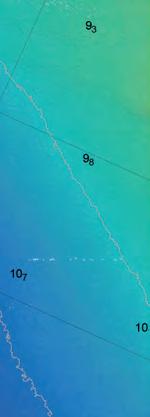
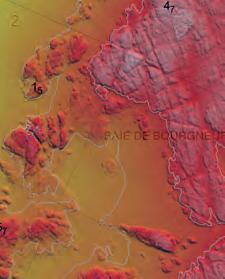
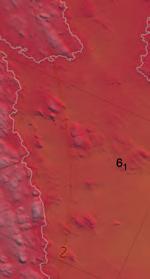
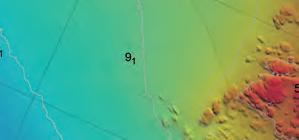
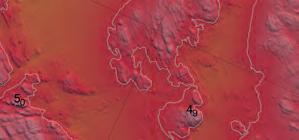


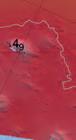
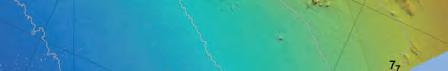
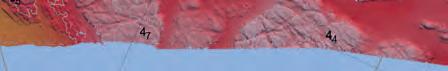


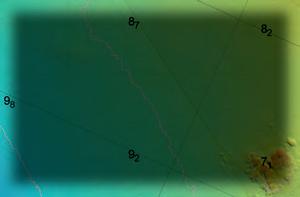
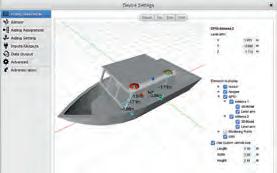


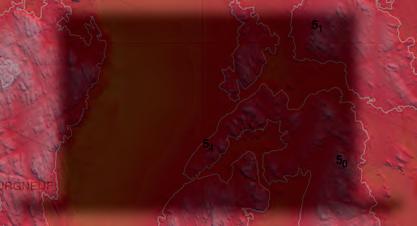


State-of-the-art Motion & Navigation Solution Navsight Marine Solution Qinertia The Next Generation INS/GNSS Post-processing Software
Courtesy of Cadden
Making Hydrographers’ Tasks Easier www.sbg-systems.com OceanAlpha L25 USV is designed as a force multiplier to bring higher eeciency to hydrographic and geophysical surveying in coastal and offshore environments. Its catamaran and big platform ensure great stability and flexibility for instrument integration.
Advanced Underwater Surveying Combined with Deep Learning
Enhanced Solutions for Seagrass Monitoring
A new, non-invasive method to measure and monitor seagrass biomass on the seabed around England’s southwest coast has been successfully demonstrated this year as part of a collaborative project supported by Innovate UK’s Smart Grants programme. The approach made use of an altimeter installed on a USV that was specifically developed for this purpose, and the hydrospatial data was processed and visualized through an advanced cloud-based solution.
The innovative new technique builds on the concept of the acoustic reflectivity of seagrass providing valuable information to characterize submerged aquatic vegetation. It was trialled during two phases in May and September 2022 by the southwest England-based companies HydroSurv and Valeport, working with the University of Plymouth and Natural England.
The full-stack solution comprised a Valeport VA500 altimeter installed on a HydroSurv REAV-28 uncrewed surface vessel (USV) specifically developed for the project. A large, validated signal library and deep learning algorithm, developed by the University of Plymouth, deciphered the survey data to predict seagrass distribution. The data was visualized and interpreted in a cloud application created by HydroSurv.
ACCURATE, COST-EFFECTIVE REPEAT ABLE SURVEYS
Seagrass meadows are a crucial part of the marine ecosystem and are increasingly recognized for their essential carbon capture abilities. As well as being as effective at storing carbon as woodland, seagrass also provides a vital habitat for young fish, seahorses and jellyfish. It additionally cleans surrounding seawater and helps to stabilize the seabed, thereby reducing coastal erosion.

A USV provides a non-invasive, cost-effective platform to facilitate accurate repeat surveys that can be compared to monitor temporal changes in seagrass coverage for the planning
of protection and regeneration projects at biodiversity-rich worksites. The solution is set to change the way in which seagrass meadows are monitored in the future, complementing traditional diver surveys to cover much larger areas and enable rapid resurvey work as required.
The work carried out in the collaborative project directly translates into impact, addressing UN Sustainable Development Goal 14 ‘Life below water’. Rapid data acquisition, processing and visualization of seagrass meadow density is critical for coastal practitioners in developing
their current understanding of seagrass meadows as vital ecosystems. New technologies, such as USVs equipped with innovative sensors and instrumentation, are enabling cost-effective and repeatable surveys that support effective conservation and restoration projects.
CUSTOMIZED TOOLS FOR DEEPER ANALYSIS
Valeport’s VA500 altimeter, which uses state-of-the-art signal processing, was customized specifically for this project. It is an underwater positioning instrument that is
Hydro INTERNATIONAL | ISSUE 4 2022 | 27
Seagrass. (Courtesy: Fiona Crouch)
FEATURE
|
BY DAVID HULL
,
TIM SCOTT AND MATT
QUARTLEY, UNITED
KINGDOM
underwater, to give an accurate measurement of height above the seabed. The VA500 uses advanced digital signal processing to hone-in and track the seabed, ignoring spurious echoes.

For this project, the sensor was simplified. A standard VA500 receives multiple signal echoes and must decide which one represents the seabed. The customized version of the altimeter used on HydroSurv’s USV didn’t have to make that decision. Instead, it output all measured echoes, together with an indication of how strong and how sharp each signal is, for the University of Plymouth to analyse with their software. The project partners worked together to develop custom firmware that delivers low noise, high-quality, correlated acoustic profiles at up to 10Hz, enabling deeper analysis, exploration, mapping and classification of the acoustic information gathered.
The customization presented one main challenge, namely ensuring that the sensor was able to output much larger quantities of data than usual while maintaining a sensible sampling rate. The absolute accuracy of data from any altimeter generally depends on knowledge of the sound speed in the local environment. However, more important for this application was the resolution of the data and its ability to distinguish multiple echoes from
distant surfaces to return; given the speed of sound in water, the sensor can then calculate a distance from the measured time.
customized the performance of the altimeter for a client, although other mechanical adaptations to fit specific vehicle requirements have been made in the past. The company hopes to realize more opportunities for this version and is also considering other applications that could be
IMPROVED EFFICIENCIES WITH DEEP
The application of deep learning algorithms for the acoustic detection and characterization of
accuracy and efficiency over more traditional techniques. Combined with the advantages of lightweight autonomous survey platforms, it introduces a step change in accurate and

The algorithm developed for this project, named SeagrassNet, uses a machine learning algorithm (recurrent neural network, or RNN) to detect the echosounder data. The developed algorithm ingests raw echosounder data from the Valeport VA500 and uses the RNN to classify whether seagrass is present or absent and where within each echosounder ping the most likely location

| ISSUE 4 2022 | Hydro INTERNATIONAL28
HydroSurv REAV-28 USV surveying seagrass meadow. (Courtesy: Valeport)
(elevation) of the seabed and seagrass canopy is, enabling the height and density of any seagrass present to be detected. When tested against a large database of labelled echosounder data, SeagrassNet successfully labelled 95% of the validation data points.


The benefits of using a machine learning algorithm for detecting and measuring seagrass, rather than a more traditional rules-based approach, is that the algorithm is trained to differentiate the seabed and seagrass from any other subaqueous features, therefore requiring less manual effort during quality control than traditional seagrass detection methods. With enough labelled echosounder data, the algorithm could also be trained to label other subaqueous features such as frond weed, kelp and bladderwrack.
UNCREWED VESSEL DEVELOPED TO PROJECT SPECIFICS
To develop the REAV-28 USV hull form for this project, HydroSurv subjected over 42 candidate hull designs to motion analysis using simulation in line with the sea conditions expected at the UK worksites. Mass and drag properties were optimized relative to overall hull length and the
resulting design performed well in a range of sea conditions throughout trials.
The aluminium USV is propelled by two Torqeedo 1,100W outboard motors, powered from four 915Wh propulsion batteries located inside the hulls, while general service power is provided from a separate 1,280Wh battery inside the cross-deck compartment. The vessel can operate at service speeds up to 5 knots, with good line-keeping performance and cornering at all speeds. The USV also incorporates a cast winch system that is fully integrated into the vessel control systems. As a fully electric, non-invasive survey platform, it is readily portable to inland and coastal worksites and can be rapidly deployed, operated and recovered with a small survey team.
The UK has lost around half of its seagrass since the mid-1930s, due to factors ranging from seagrass wasting disease (SWD) and pollution to physical disturbance from the anchoring, launching and mooring of leisure boats. The £2.5 million LIFE Recreation ReMEDIES partnership ‘Save Our Seabed’ is a five-year marine conservation project that was launched in July 2019 to protect and restore
these sensitive habitats. Valeport sponsors the initiative, which is funded by the EU LIFE programme and led by Natural England in partnership with Marine Conservation Society, Ocean Conservation Trust, Plymouth City Council/Tamar Estuaries Consultative Forum and The Royal Yachting Association.
Acknowledgements
Sonardyne International for loan of a Mini Ranger 2 acoustic positioning system with Nano beacons for the accurate positioning of diver observations during field trials (as part of their long-standing partnership with the University of Plymouth).
GEOSIGHT Limited for loan of their REAV-28 USV, a 2.8m catamaran hulled vessel with fully electric propulsion built by HydroSurv, suitable for deployment and recovery from foreshores and beaches for a range of hydrographic and environmental survey applications.
David Hull, CEO, HydroSurv
Following his early career in the shipbuilding and repair and commercial marine sectors, David Hull went on to work in marine installation, operations and maintenance. In 2019, he founded HydroSurv, an impact-focused marine robotics company which has since developed a range of electric and hybrid USVs for hydrographic and environmental data acquisition for inland, nearshore and offshore applications.
Tim Scott, Associate Professor in Ocean Exploration, University of Plymouth
Tim Scott is an Associate Professor in Ocean Exploration at the University of Plymouth. Working within the Coastal Processes Research Group, he has more than 20 years of experience in the collection and analysis of coastal morphological, hydrodynamic and hydrographic data. Recent research has focused on the use of autonomous platforms for coastal/ marine environmental sensing.
Matt Quartley, Managing Director,


Example of seagrass data collected over the Great Ganinick seagrass meadow in the Isles of Scilly in 2020, showing the seagrass canopy (red), seabed (black) and first return (where seagrass is absent, cyan), as detected by the developed SeagrassNet algorithm. The intensity of the VA500 acoustic data across elevation (y-axis) and surveyed distance (x-axis) is shown in yellow (strong, coherent acoustic returns) to blue (absence of acoustically reflective objects) colours in the background.
environmental monitoring instrument company Valeport since 2005. With a background in defining and specifying new products for development, he leads the strategic and operational decision-making and processes at the Valeport group, which serves both marine and inland water sectors.
Hydro INTERNATIONAL | ISSUE 4 2022 | 29
Surveying in all waters

Stay informed with Hydro International


The worldwide information source with insights and developments on hydrographic and oceanographic surveying in the industry.


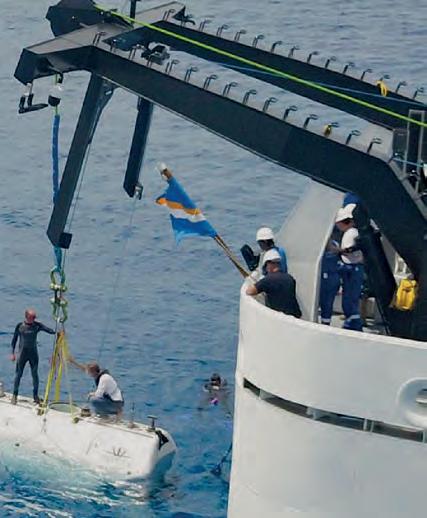
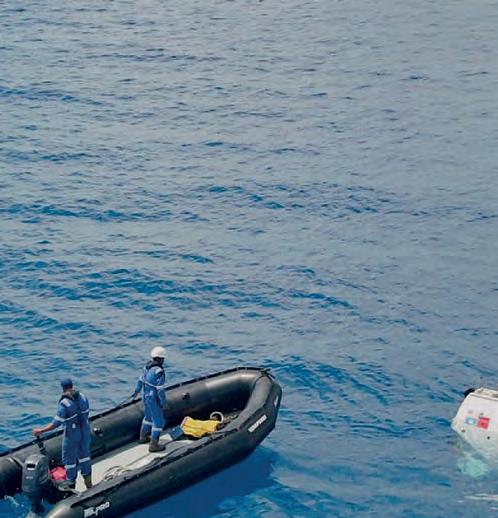

www.hydro-international.com Sign up for your free subscription to the online magazine and weekly newsletter today!
Positioning a Deep-sea Crawler for Polymetallic Nodule Mining
Landing on the Abyssal Plain
Electrification and the transition to a green economy are rapidly accelerating the demand for metals and rare earth minerals. As this demand cannot be met by recycling existing metals, a number of land-based mines are depleting their reserves with an ever increasing environmental and societal impact. Space mining is not a reality for the near future, and so governments and companies are looking into obtaining these crucial metals from the bottom of the world’s oceans.
This is the story of Global Sea Mineral Resources’ (GSR’s) efforts to develop a new, responsible mining industry.
POLYMETALLIC NODULES


Polymetallic nodules are rock concretions that form on the abyssal plane and that contain a wide variety of metals and other rare earth minerals. These nodules can be found in all of the world’s oceans, but their metal content and appearance can differ, depending on their location. The size can vary from a few millimetres in diameter to over ten centimetres. The exact way in which they form is still under debate, but it is widely believed that they start out from a hard substrate around which metals in the water column or sediment gather to slowly form a polymetallic nodule. This hard substrate can be a piece of rock or it may be something more interesting, such as dolphin
ear bones or even teeth from prehistoric megalodon sharks.
The nodules that garner the most interest are those with the highest content of the metals needed for the transition to a green economy. In one area, called the Clarion-Clipperton fracture zone (CCFZ), the nodules are particularly rich in manganese, copper, cobalt and nickel: metals that are crucial for the production of batteries, solar panels and wind turbines. The CCFZ is an area of about 4.5 million km² in the Pacific Ocean, situated roughly between Mexico and Hawaii. The International Seabed Authority, which has jurisdiction over this area, has so far only signed contracts for exploration, and GSR
was awarded one licence area in 2014 with a total surface area of about 75,000km².
Hydro INTERNATIONAL | ISSUE 4 2022 | 31
Figure 1: Polymetallic nodule.
Figure 2: Nodule field.
| FEATUREBY HENDRIK DE BEUF, DEME, BELGIUM
RESOURCE DEFINITION
Quantifying the polymetallic nodules is the first crucial step in estimating the viability of deep-sea mining. Knowing where the nodules can be found and in what numbers has a significant effect on the procedure and operational schedule of the collection system. In 2014, GSR organized a first research campaign to the CCFZ with a hull-mounted Kongsberg EM120 multibeam echosounder (MBES), to get a full low-resolution overview of the licence area. During this campaign, 75,000km² of Pacific seabed was mapped and all of the data collected was shared publicly. As a result, this multibeam data is now part of the GEBCO Chart to contribute to Seabed 2030. Based on this data set, GSR drafted a preliminary resource model and defined several areas of interest. These were visited one year later, in 2015, using an autonomous underwater vehicle (AUV) that combined MBES measurements with sidescan sonar data and high-resolution pictures of the seabed. Other samples were also gathered, such as boxcores, multicores and water samples. With this data, advanced models were made to estimate the nodule abundance.
PATANIA I
Using the data gathered in this survey, GSR started to develop a tracked soil testing device. The focus was on testing the performance of a tracked vehicle on the seabed of the Pacific Ocean, while also gaining practical experience

in the development of vehicles that can go 5,000m deep and drive around on the seabed. The device was named ‘Patania I’, after the world’s fastest caterpillar.

With the development of Patania I, a reliable positioning system was required. Many options were considered, but because of the limited requirements for these first trafficability tests, a simple setup was chosen with an ultra-short baseline (USBL) system on the vessel and an inertial navigation system (INS) with coupled Doppler velocity log (DVL) on the crawler. A Sonardyne Ranger 2 was used for the USBL system and Phins was selected from iXblue for the INS. It was clear that the raw position of the USBL would not be accurate enough at these depths, so it was suggested that the INS would
filter out the jumps and give a smooth position in combination with the DVL. In the field, however, the inaccuracy of the USBL was found to be too great at depth for the INS to filter it properly. This resulted in small fluctuations in the position of the Patania. If it were an ROV, this would not have been a big issue, but as the vehicle was known to be standing still on the seabed, every movement that the navigation screen showed was one too many. It also made it very difficult for the operators and the automatic driving system to control it properly. To resolve this issue, it was decided to disable the USBL input in the INS and continue in pure INS/DVL mode. This gave a very stable, usable position, but with a long-term drift. As the Patania drove an average of five kilometres each dive, the
| ISSUE 4 2022 | Hydro INTERNATIONAL32
Figure 3: Deep-seabed mining robot Patania I.
Figure 4: Patania II team.
positioning error of five metres at the end was however considered to be acceptable.
PATANIA II
After the success of the Patania I, GSR developed a bigger vehicle that, while still a pre-prototype, not only drove around but also tested a harvesting system. Tests had already been performed in a lab, but the system had to
As the INS/DVL setup performed well with Patania I, the same equipment was used for this new positioning setup, although with an input to correct the long-term drift. The obvious way to do this would have been with a long baseline (LBL) array of half a dozen transponders on the seabed, but this solution was disregarded as it would take too long to deploy and calibrate such an array at such depths, so far offshore, for trials
pressures at this depth, the subsea cable towards the Phins shorted for a second, resulting in a restart of the INS. This caused a bad initial position and a discrepancy between the USBL and sparse LBL data. There was only one opportunity to fully test the positioning system during the entire campaign, and unfortunately this did not work out as intended. However, the data that was collected showed in postprocessing how the system could have performed without these issues, and that looked very promising.
MINING IMPACT STUDIES
prove itself in situ. While Patania I was about the size of a small car, Patania II was more the size of a truck with a length of ten metres and a height and width of about four metres. It had four hydraulic collectors in front that used the Coanda effect to lift the nodules without touching the seabed.
Beside technical trials, Patania II was also built with the purpose of carrying out pilot mining impact studies. In collaboration with universities and research institutes from all over the world, it was agreed to clear an area of about 20,000m² of nodules and to study the impact of this on the environment. For this, a more robust positioning system was clearly required with an accuracy that did not deteriorate over time, as the aim was to achieve a constant relative position accuracy of about 25cm. This ensured that an entire surface could be cleared efficiently by driving a lawnmower pattern.
that would last just a few days. The solution therefore was to use sparse LBL, which provides near-LBL accuracies using just one or two transponders by combining the ranges with the information that is already in the INS. This provided the required accuracies without the vessel time that the deployment of a full LBL array would need.

The Ramses from iXblue was selected for this task with two transponders on the seabed. A box-in was done on one of the transponders, and the second transponder was to receive an accurate position through SLAM calibration. This would fix the position of the transponder by driving alongside it. Unfortunately, this did not work out in practice as the angle between the vehicle and the transponders on the seabed did not vary enough for it to calibrate properly. A second issue arose just before the crawler arrived at the seabed when, due to the immense
These positioning issues had a very limited effect on the mining impact studies, as the pure INS/DVL positioning was accurate enough to provide full coverage of the mining area. In Figure 5, the live position can be compared with a sidescan survey that was performed afterwards. The darker zone in the centre is the area that was cleared of nodules, and the heaps at the top and bottom are the nodules that were deposited by Patania II.
CONCLUSION
Both the team from GSR and the teams of scientists that joined the campaign were thrilled with the results. After all, this is the first time in history that thorough environmental data has been collected to study the impact of a new industry before the industry starts. All of the environmental data gathered is publicly available and has been shared with universities, research institutes, governments and international organizations all over the world. This data will be used to assess the impact of collecting these nodules and as a basis for international legislation for this new emerging industry.
References
Metal-rich nodules collected from seabed during important technology trial | DEME Group (deme-group.com)
Hendrik De Beuf has worked in DEME’s survey department since 2014 and became involved with GSR in 2017 for the development of the prototype deep-sea harvesting vehicles. Since then, he has been responsible for the development and commissioning of the monitoring and positioning systems used during the offshore campaigns.

INTERNATIONAL | ISSUE 4 2022 | 33
Figure 5: Post survey trail area.
All of the environmental data gathered is publicly available and has been shared with universities, research institutes and governments all over the world
article
Deploying Uncrewed Vessels in the Search for Lost Shipwrecks
In the summers of 2021 and 2022, an iXblue DriX USV was deployed to try and locate the missing wreck of the sunken French fishing trawler Ravenel. The vessel disappeared in January 1962 with 15 people on board and was never found, despite extensive research campaigns.
In April 2021, the French Minister for the Sea announced the launch of a major research campaign, requesting that the DriX uncrewed surface vessel (USV) be used to map the seafloor off the coast of the Saint-Pierre and Miquelon islands. A dedicated crew was first sent by iXblue to operate the DriX and perform the survey in the summer of 2021, and then again in 2022. A Kongsberg EM2040-04 multibeam echosounder (MBES) system was installed in the DriX gondola for seabed mapping.
Conducted in coordination with local authorities, the survey mission also included archaeologists from the DRASSM (Departement des Recherches Archéologiques Subaquatiques et Sous-Marines), whose aim was to analyse the data collected by the DriX USV and inspect potential targets using ROVs.
During the two campaigns, DriX was used in autonomous mode under the supervision of a remote operator. The USV was monitored either from iXblue’s remote control centre in La Ciotat (south France) using 4G or Satcom or from a support vessel for operations conducted close to the shore.
EXTENSIVE AREA COVERAGE DESPITE CHALLENGING SURVEY CONDITIONS
The uncertainty surrounding the exact time of the sinking led to the definition of a large research area: from outside the port of Saint Pierre to the Newfoundland coast for the 2021 campaign (450km2), and

south of the islands of Saint-Pierre and Langlade for 2022 (400km2).
The environmental conditions in the area are known to be very challenging, even during the summer. Typically, sea conditions with a tidal current up to 2kn, wind gust up to 50kn, waves of 2.5m and an Atlantic swell up to 3.5m are to be expected. The presence of dense fog is another challenge in terms of situational awareness and obstacle management.
Statistics for wind (average wind speed in knots and gusts) per month for Saint-Pierre and Miquelon are presented in Figure 2.
These difficult conditions did not prevent DriX from completing the full planned survey area within the allocated time frame. The maps in Figure 4 show the navigation lines performed by DriX during the 2021 (left) and 2022 (right) missions. This represents more than 11,000km.
The over-the-horizon operational mode and the complex environment required a high level of situational awareness. Navigation could be managed safely and efficiently owing to the DriX advanced obstacle detection and avoidance system that combines multispectral / multidistance perception means (camera, Lidar, radar,
| ISSUE 4 2022 | Hydro INTERNATIONAL34 sponsored
Figure 1: DriX performing a bathymetric survey off the coast of Saint-Pierre and Miquelon. (Credit: Raphaël Chantelot)
sponsored article
AIS) to detect, locate and track obstacles and provide a single unified georeferenced representation.
OPTIMIZED ACQUISITION AND DELIVERY

Despite the rough weather conditions, the unparalleled stability of the DriX and the data acquisition performance of the EM2040 resulted in high-quality multibeam data and a survey resolution up to five times better than previous surveys in the same area. The optimized data gathering environment made it possible to record very clean data. Over the 11,000km of survey line acquired, the post-processing
bathymetric automatic data filter or manual despiking, which vastly increased the processing time and fast tracked the

Therefore, the 400kHz MBES frequency was used from 5m to 250m depths, the deepest section of the survey area.
The survey was conducted between 7 and 8 knots, which provides the best compromise between sounding density versus area coverage efficiency for a given time objective.
In 2022, DriX’s new ‘auto-line’ feature was used for the first time. Auto-line is the ability of the DriX to decode the bathymetry provided by the Kongsberg multibeam system and to perform navigation autonomously based on the swath width. This new development allowed around a 50% gain in time for line planning and a 30% increase in operations, thanks to the swath optimization and overlap management.

This new software development allowed for tremendous gains to be achieved in the 2022 campaign, resulting in covering an area close in size to the one surveyed in

data delivery to the DRASSM archaeology team.
Finally, the very low noise acoustic signature of the DriX gondola made it possible to maintain high-frequency recording and an
2021 but in much less time. The teams could therefore cover an additional survey area in the remaining time frame of the mission.
Another challenge was the operational coordination between the organizations
Hydro INTERNATIONAL | ISSUE 4 2022 | 35
Figure 2: Wind statistics for Saint-Pierre and Miquelon.
Figure 3: iXblue Phins C7 real-time heave recording.
Average wind speed and gusts per month (kn)
The unparalleled stability of the DriX and the data acquisition performance of the EM2040 resulted in high-quality multibeam data
sponsored article
involved. iXblue was conducting the survey in Saint-Pierre and Miquelon while the DRASSM was performing target identification and the ROV inspections. The DRASSM operation was fully dependent on the bathymetry interpreted from the DriX measurement. As the ROV inspection started before the end of the survey project, the bathymetric results needed to be delivered for review within two days after acquisition.
The data was therefore downloaded directly from the DriX computer to the control centre, where it was checked, processed and delivered to the DRASSM so that analysis and target picking could be performed.
This highly detailed bathymetric mapping of the area allowed the DRASSM to identify two high-potential targets, both in French waters. The identification confirmed that the two targets were indeed shipwrecks, although visual inspection confirmed that they were not the Ravenel Both wrecks were lying on the seabed at around 110m depth. The first one, around 40m long, the second one (see Figure 7), approximately 24m long. Both were made of wood.


CONCLUSION
With over 11,000km covered, completing the full scope of work, the operations showed that using a USV such as the DriX represents a very efficient means of surveying, providing a highly reliable and high-quality survey in very challenging survey conditions.
Unfortunately for the 2021 mission, the completion of the search area inspection did not provide any further information regarding the sinking of the Ravenel
For the 2022 search campaign, analyses are still ongoing, and so the mystery continues.
| ISSUE 4 2022 | Hydro INTERNATIONAL36
Figure 6: 3D data view of DriX MBES survey data using Kongsberg EM2040-04 MBES.
Figure 5: DriX HMI view showing autonomous navigation based on the bathymetry, overlayed as coloured grid and multibeam swath edges (dotted lines).
Figure 7: Identified shipwreck located at 110m depth, seen from the EM2040 data and extracted from the visual inspection.
A Journey of Awareness and Practices in Hydrography in Korea
As Korea officially commemorates Hydrography Day, the Hydrographic Society of Korea (HySK) has acted as a link between industry, academia and research for the past ten years. The Republic of Korea has moved from a technology beneficiary country to become a technology leader through intensive national investment, industry efforts, and legal and institutional improvement. As a member of the International Hydrographic Organization (IHO), Korea generously shares information and communication technology capabilities and supports the education and activities of domestic and foreign experts.
HYDROGRAPHIC SOCIETY OF KOREA OFFICIALLY COMMEMORATES HYDROGRAPHY DAY


Besides the professional journal the International Hydrographic Review, published by the IHO, magazines and journals dealing with hydrographic surveys are highly limited in Korea, although partly addressed in publications on oceanography, civil engineering and geospatial sciences. There is also no specialized hydrography department in Korea, but HySK celebrated its tenth anniversary on 21 and 22 June 2022. With about 250 members, this society has been publishing journals twice a year for the past ten years with the participation of professors and research institutes and industry experts in hydrography and has offered various international seminars and exchanges in technical information. HySK has provided a platform for industry-university-research cooperation, has served as a channel to develop a legal and institutional basis and acts as a think tank. Another association, the Korean Hydrography and Research Association (KHRA), also intends to publish an article once a year to communicate with and cultivate the goodwill of the International Hydrographic Review’s subscribers around the world.
In 2005, the United Nations designated 21 June as World Hydrography Day to promote the importance of ocean surveys. The Republic of Korea commemorates this as of 2021 by officially designating the same date as ‘Hydrography Day’. However, while information obtained through marine surveys is important for safety at sea and ensuring maritime
Hydro INTERNATIONAL | ISSUE 4 2022 | 37
Figure
1: The first Hydrography Day (2021).
Figure
2: The second Hydrography Day (2022).
REPORT
|
BY EUNMI CHANG, HWANG JUN, BYUNGMOON PARK AND HYUNNUK LEE
sovereignty, it is less well-known among the general public. In other words, even though it is celebrated as an important day at the national level, it is not generally recognized as such.
HYDROGRAPHIC SURVEYING IMPORTANT TO THE KOREAN GOVERNMENT

Hydrographic surveying is important to the Korean government for several reasons. First, while Korea is a peninsular in terms of physical geography, it is in fact an island for political and economic purposes. It is an export-based economy, making maritime safety a high priority in its harbours and along its navigation routes. As the country with the largest number of orders in the shipbuilding industry in 2022 and ranking tenth in world trade, leaders in Korea believe that maritime surveys are critical. Second, hydrographic survey data is also critical for national defence. Third, Korea has experience in exporting artificial satellite technologies, and its ocean surveying as marine information goes beyond the level of charting. For example, the Ministry of Oceans and Fisheries systematically manages various forms of information generated in the ocean and applies AI technologies to achieve a digital twin of the ocean.
FROM TECHNOLOGY RECIPIENT TO LEADER IN HYDROGRAPHIC TECHNOLOGIES


The Korea Hydrographic and Oceanographic Agency (KHOA), which oversees hydrographic surveys, celebrated its 70th anniversary in 2019. Despite the devastating economic environment after the Korean War, the government actively applied innovative technologies in the field of hydrographic surveying. The agency started the National Base Map Project in the mid-1990s and adopted multibeam technologies, and Korea recently launched the world’s first geostationary orbit satellite dedicated to the ocean and operates the GeoKompsat-2B satellite. The Republic of Korea has transformed from a beneficiary nation to a leader in knowledge transfer, based on its experience in developing an industry without any background and aggressive investment in innovative technology. This can serve as a good example for other developing countries, whether IHO members or not, who will be able to go through the same process with less trial and error.
Like Malaysia (2011) and Turkey (2016), in 2021 Korea revised its act on hydrographic surveying that had been in place since 1970. This new act enabled the KHOA to respond to
Korea’s ocean surveying as marine information goes beyond the level of charting


requests for national R&D projects, such as the installation and operation of three-dimensional seawater flow observation equipment, including real-time observation of the ocean and the establishment of a mobile observation platform, and technology development based on S-100.


CONCLUSION


In the field of hydrographic technology, Korea has developed industry-university-research cooperation with a legal and institutional basis to meet internal and external political and economic demands. It has also passed the period of receiving assistance from developed countries, as shown by the overall picture on hydrographic technologies, from the far sky to the seabed, and cooperation with the IHO.
Bibliography


https://leap.unep.org/countries/tr/ national-legislation/regulationhydrographic-survey-sea-and-inlandwaters http://extwprlegs1.fao.org/docs/pdf/ tur165685.pdf


https://pejuta.com.my/wp-content/ uploads/2013/01/Hydrography%20 Act%202011.pdf


Eunmi Chang, CEO Ziinconsulting, adjunct professor at the University of Seoul, PhD in Geography from the University of Kansas in 1997, GEBCO SCOPE vice chair, Hysk vice chair.


Jun Hwang, Board President of KHRA since 2021, after working at KHOA for 38 years.
Byungmoon Park, Director of KHRA Hydro Technology Lab since 2021, after working at KHOA for 33 years, PhD in Geomatics from the University of Seoul in 2019.

Hyunuk Lee, Senior Researcher at KHRA Hydro Technology Lab since 2021, research professor at Ewha Women’s University, PhD in Geography from the University of Tokyo in 2009.
This article was translated from an article published in Korean in August 2022 for The Trends in Hydrographic Technology by KHRA.

| ISSUE 4 2022 | Hydro INTERNATIONAL38
KHOA
Latest generation FOCUS survey solution


Powerful,
winch system
Cost-effective, high-speed survey platform
Modular design
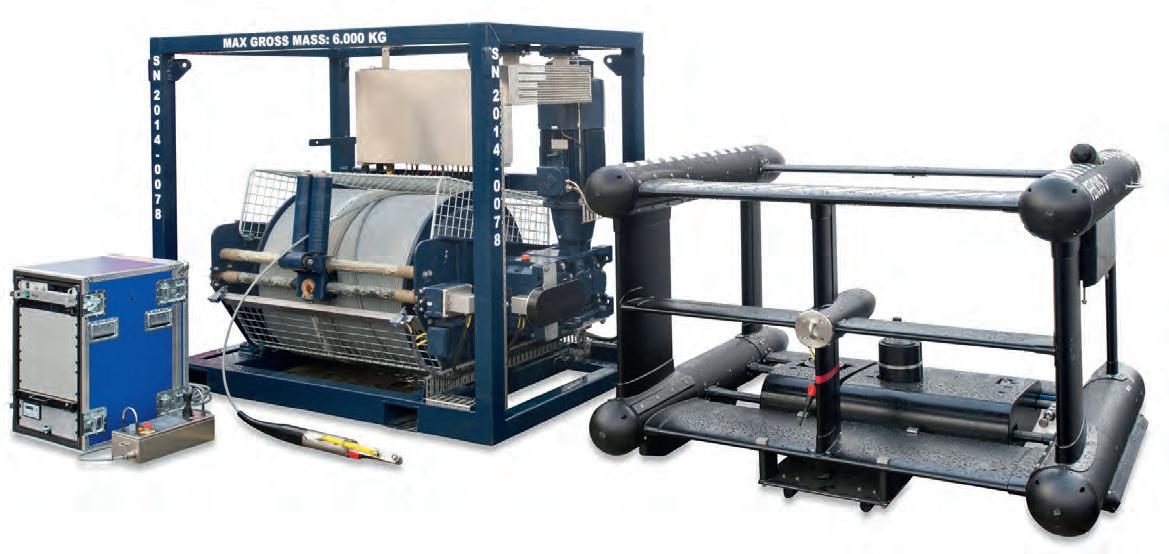
low-maintenance electric
1,000 m depth rating
Flexible and high payload capacity
Denmark Norway Sweden United Kingdom France Italy Germany Netherlands USA Canada Brazil India Singapore China Australia MacArtney global solutions
SMART SUBSEA SOLUTIONS


Delivering data in most adverse conditions: underwater acoustic modems with advanced communication technology and networking Accurate USBL and LBL positioning of underwater assets Modem emulator and other cost-saving developer tools Autonomous surface vehicle for bathymetry, monitoring, search & rescue, and AUV support sales@evologics.de EvoLogics.de THE USBL BUOY AVAILABLE NOW Accurate USBL positioning and data transfers, just unfold and deploy: the all-in-one device features a modem with USBL antenna, AHRS, GNSS and on-board PC with positioning software, all ready go in minutes.
