IN VITRO TESTING AS A TOOL FOR EVALUATING THE EFFICACY OF MYCOTOXIN BINDERS
A systematic review
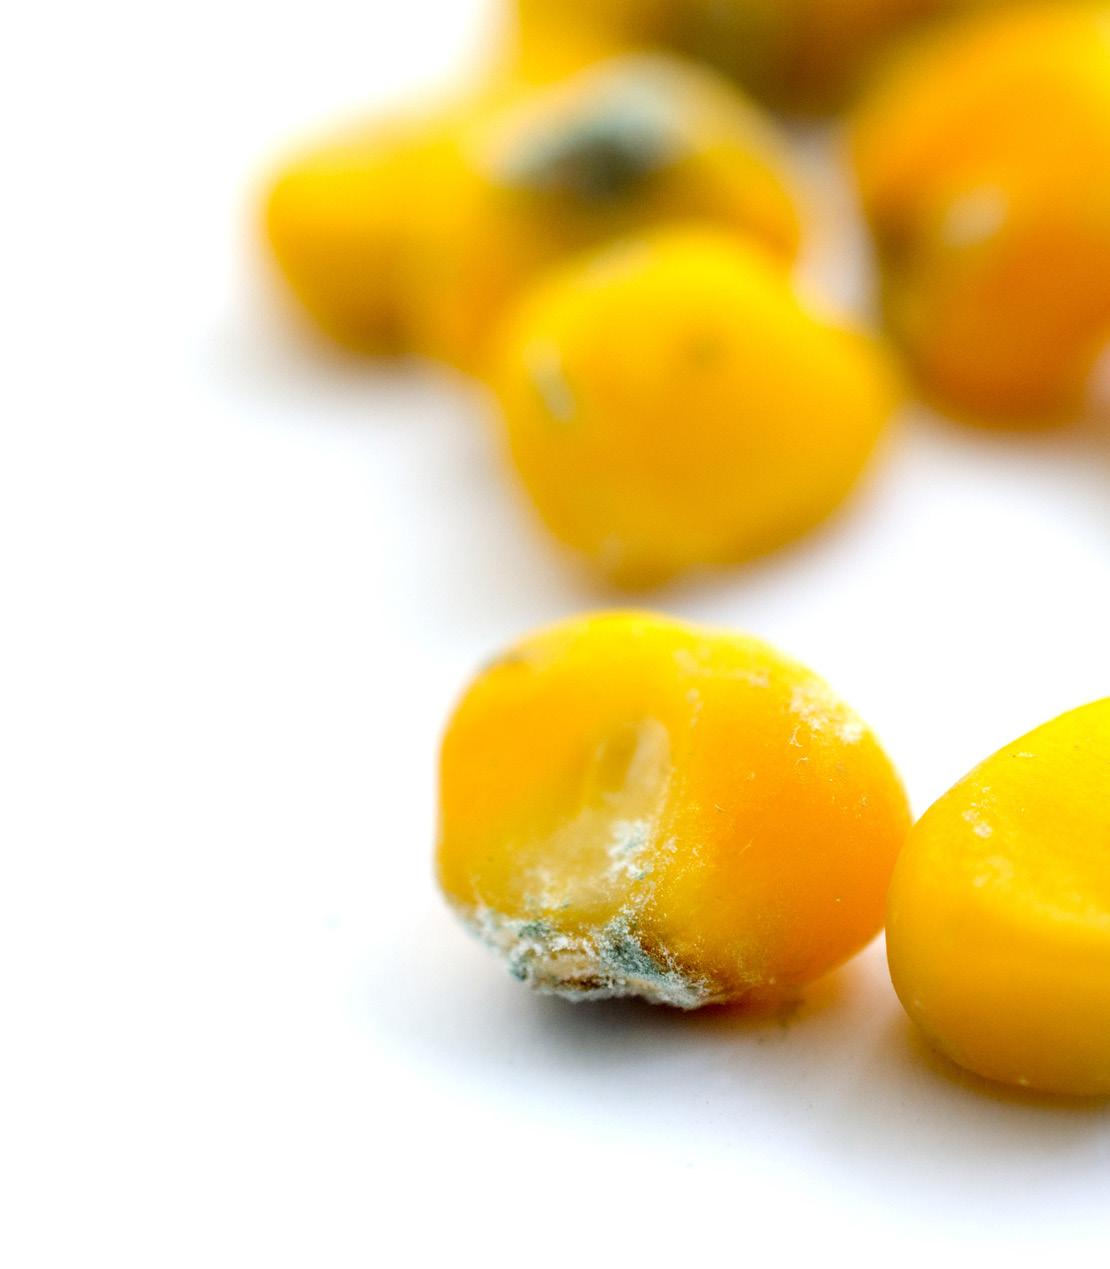
The presence of mycotoxins in feed is a major problem in the animal feed industry.
Among the more than 400 types of mycotoxins, a group of six mycotoxins represent a high risk to animal health and production gains, with three main species of molds responsible for their production:
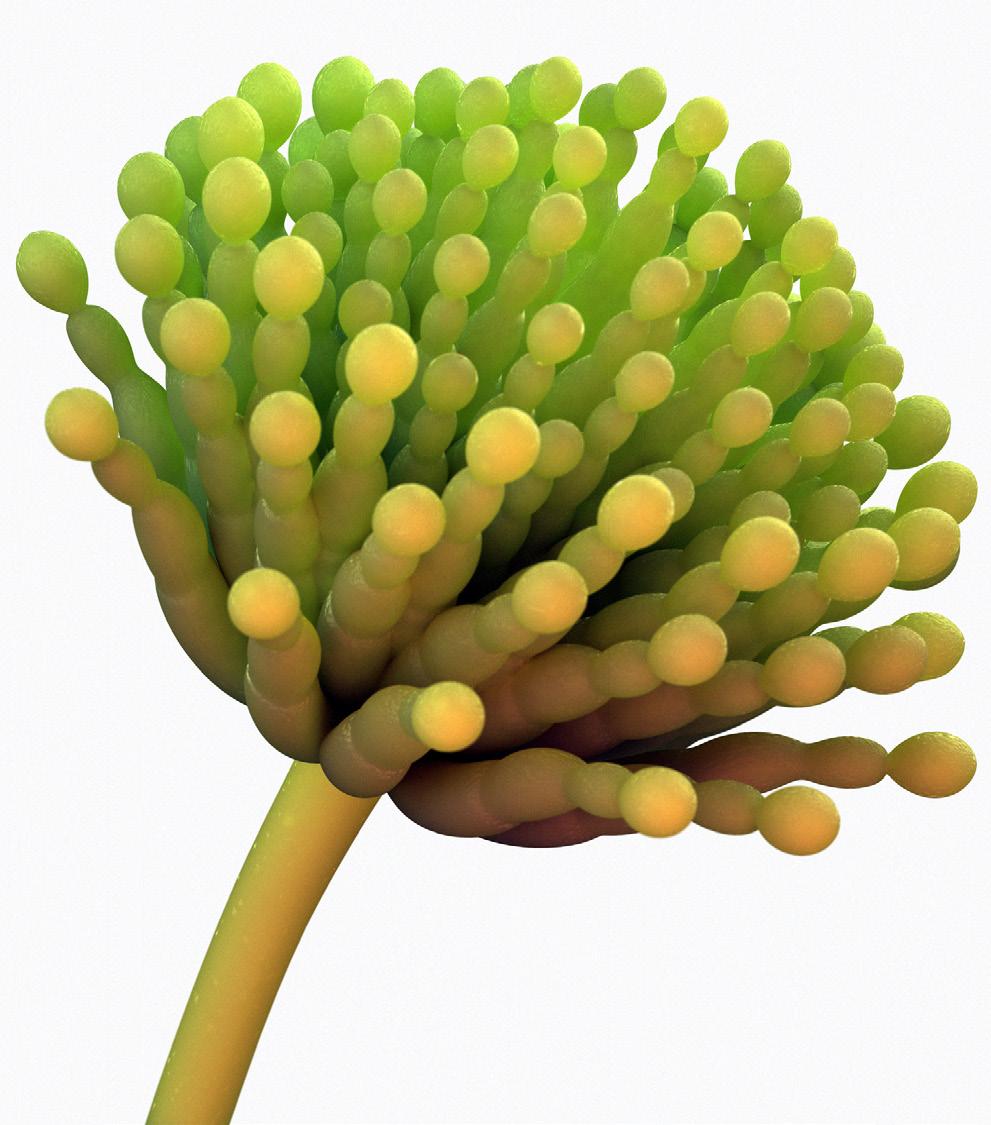
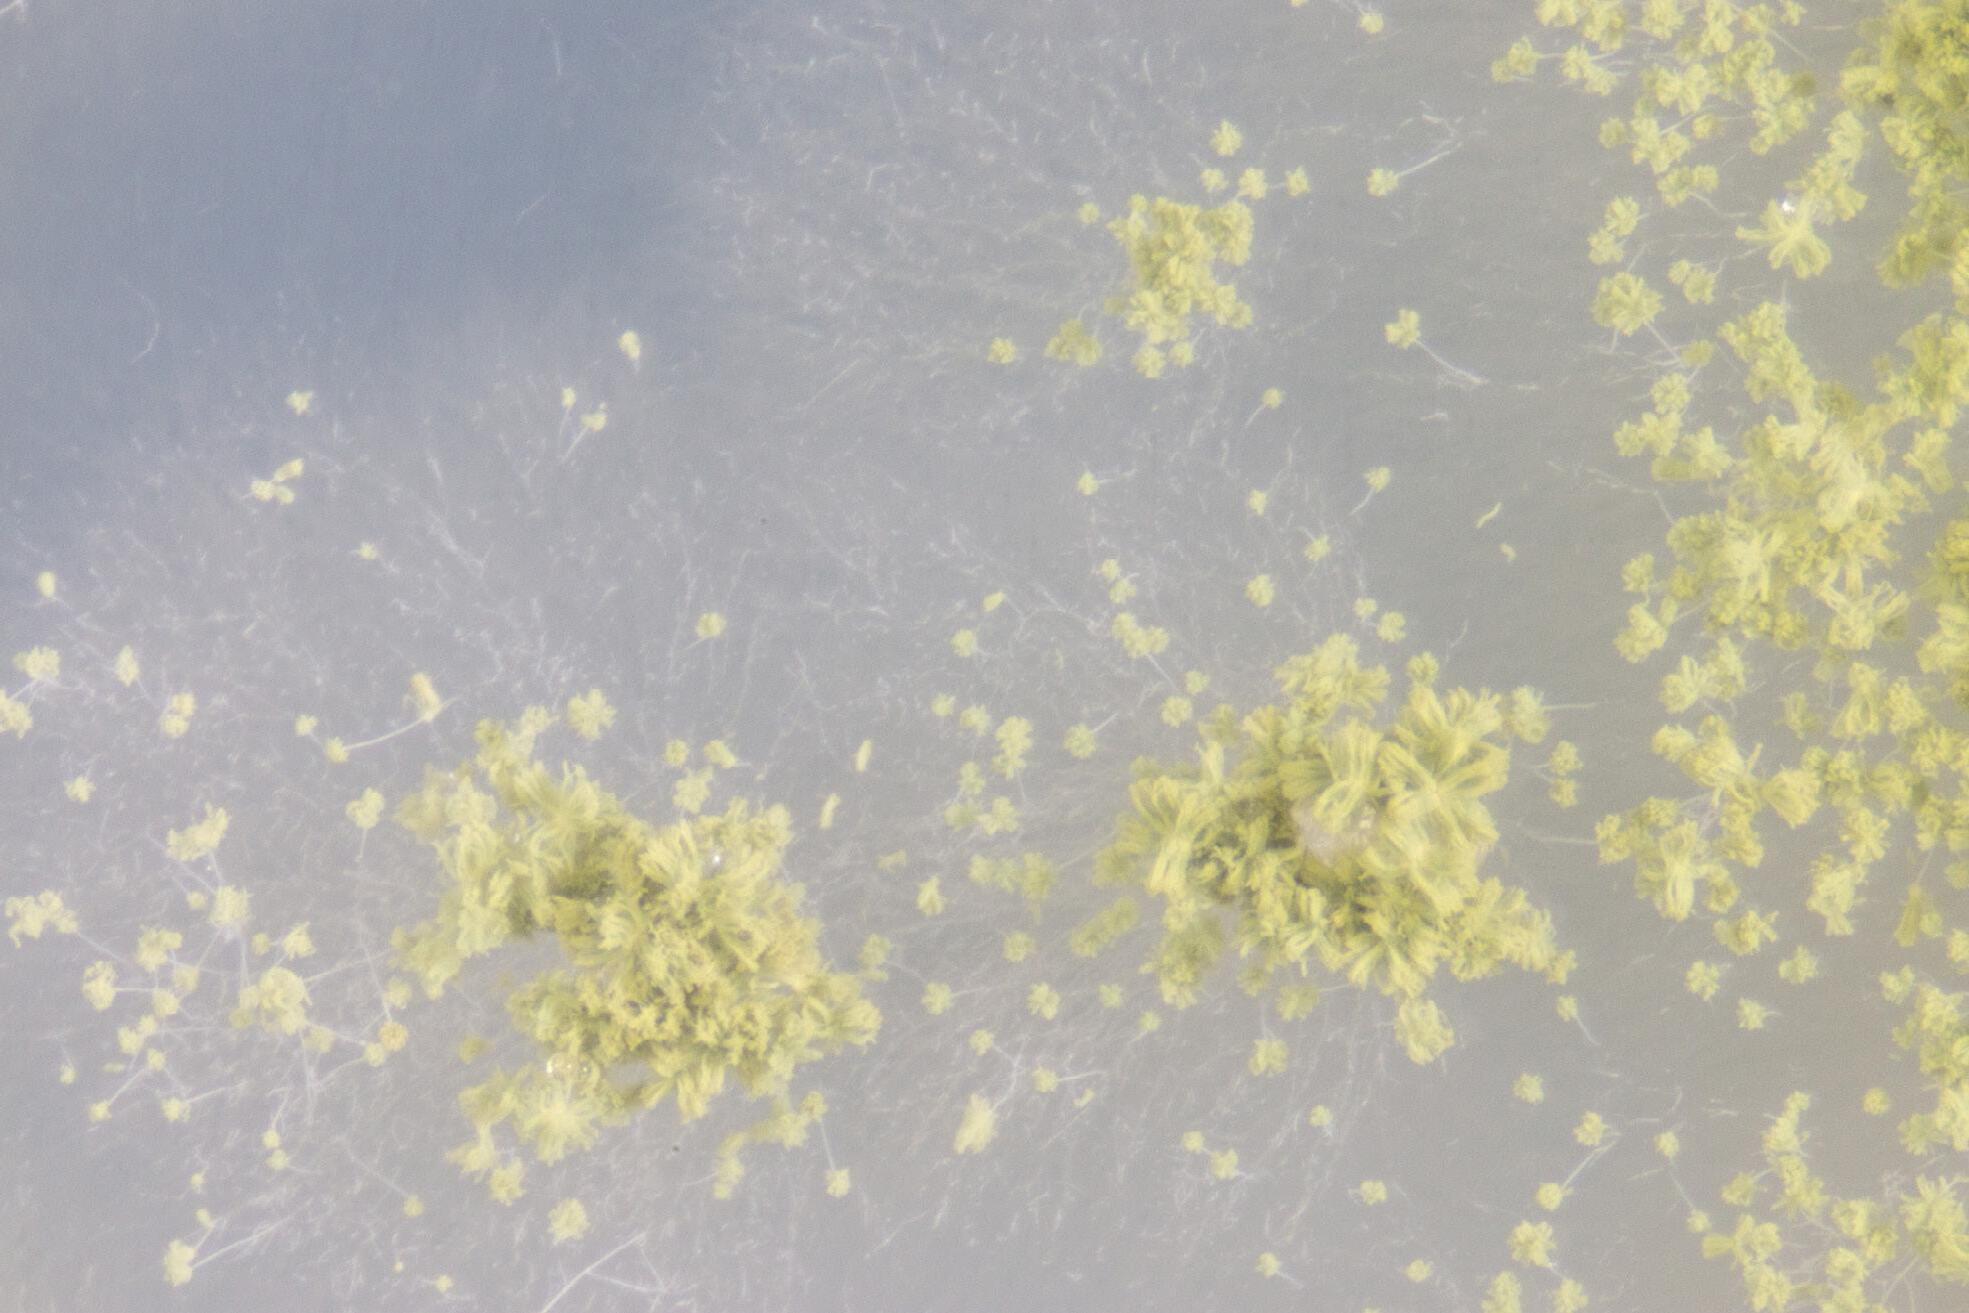
Fusarium
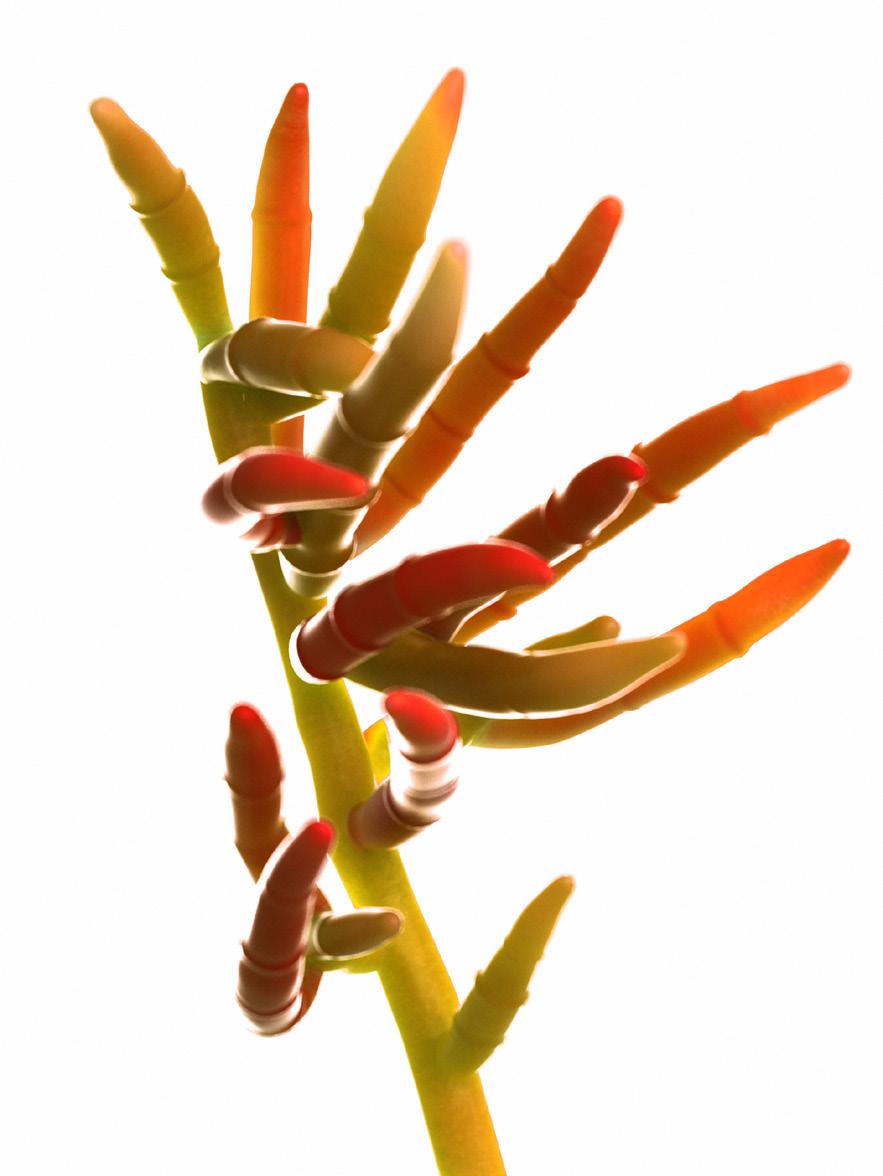
Aspergillus
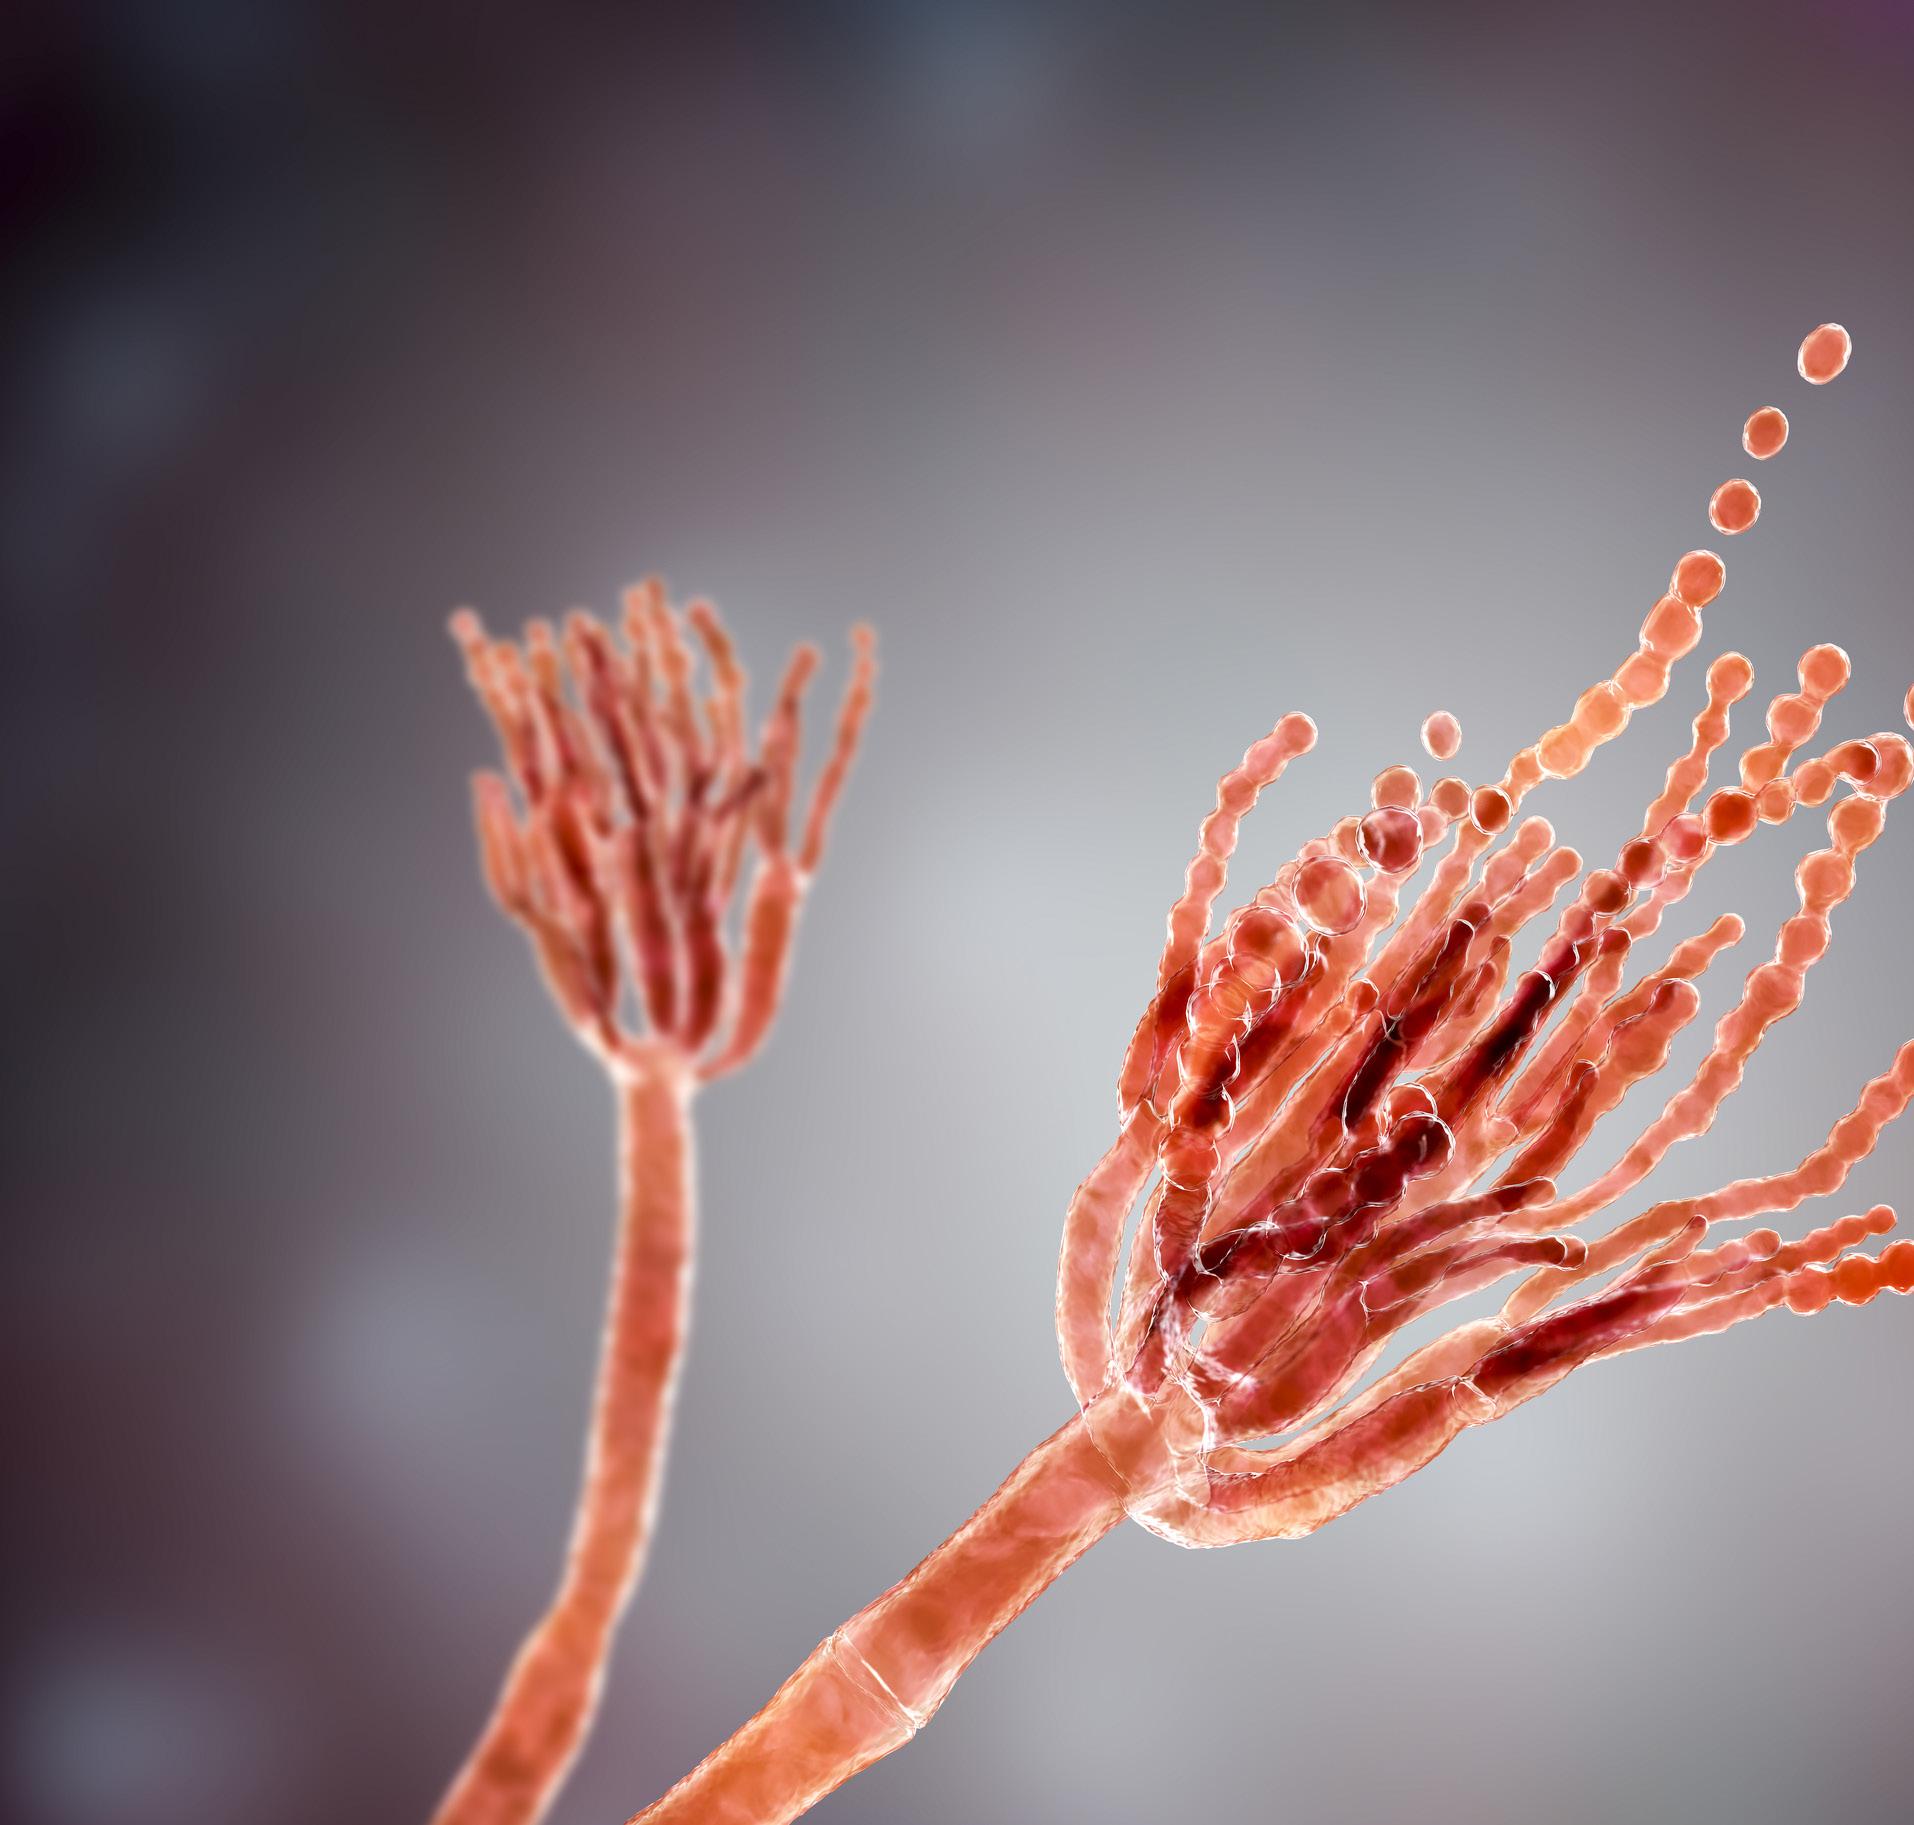
Penicillium
Fungal development depends on climatic conditions where temperature, humidity, and drought influence the type of mold and, therefore, the type of mycotoxins produced (Schatzmayr and Streit, 2013; Moretti et al., 2019).
For example, Gruber- Dorninger et al. (2019) noted that the main contaminant in corn samples was fumonisin (FUM, 80%), followed by deoxynivalenol (DON, 67%) and zearalenone (ZEN, 44%).
Mycotoxin adsorbents (ADS) can reduce the mycotoxin load in the gastrointestinal tract of the animal, and can be classified as follows: ⮚
Inorganic, such as clays and activated carbon
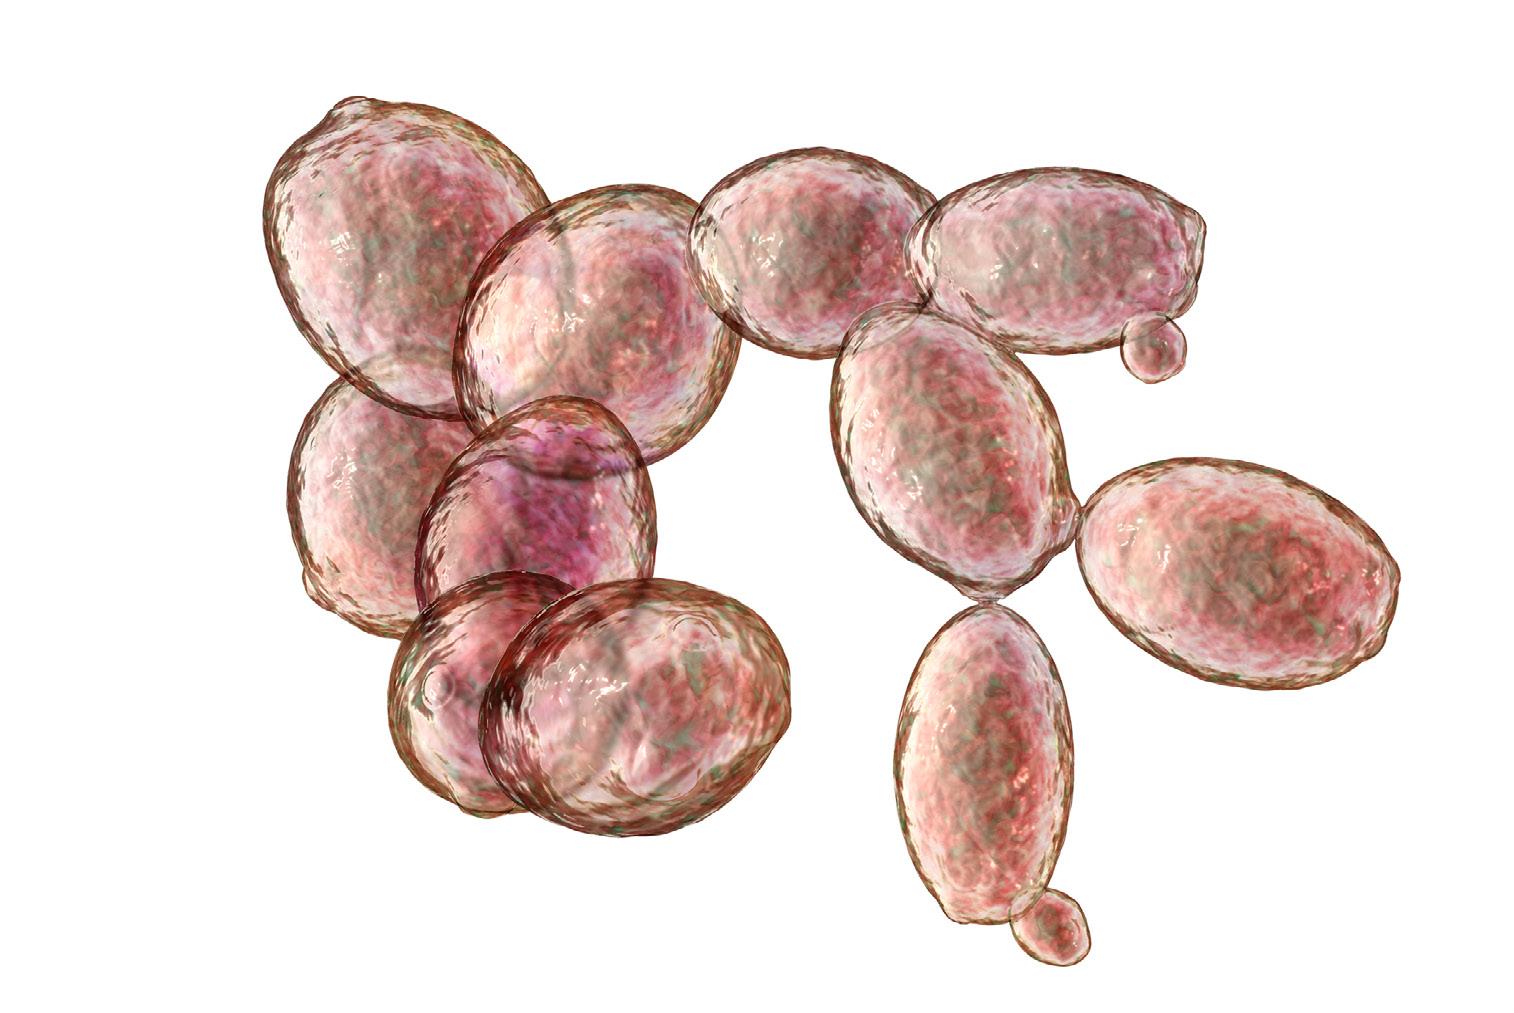
Organic, such as yeast cell walls
Binding of mycotoxins to adsorbents is mainly due to: Cation exchange capacity involves different types of bonds such as:
Chemical interactions
Ion-dipole
Van der Walls forces
Hydrogen bonds
MYCOTOXIN ADSORPTION
These properties are not specific to adsorb only mycotoxins, organic molecules like amino acids or vitamins can be absorbed too.
For example, Kihaletal.(2020)and BarrientosVelázquez,(2016)reported that bentonite has the capacity to adsorb amino acids at 44% and vitamins at 49%.
Physical characteristics
Adsorbent pore size
Structure and form of the mycotoxin
The adsorption capacity of mycotoxin binders is determined through different in vitro tests that simulate the gastrointestinal tract of animals.
These tests serve as a screening tool to evaluate the mycotoxin adsorption percentage of a type of binder before moving on to in vivo testing of the best-performing products.
With the advantage of being simple, fast and, inexpensive, these tests have been widely used, but under certain conditions, they generate variability between studies, making it necessary for the method to be standardized and validated with in vivo tests.
The objective of this study was to review different in vitro studies published in the literature to evaluate the mycotoxin adsorption capacity of different binders.
Materials and methods
An exhaustive literature search was conducted to identify studies that evaluated the in vitro mycotoxin adsorption capacity of different adsorbents.

The search used as keywords:
Six mycotoxins: aflatoxin (AF), deoxynivalenol (DON), fumonisin (FUM), ochratoxin A (OTA), T-2 toxin, and zearalenone (ZEN).
Eight adsorbents: activated carbon (AC), bentonite, zeolite, clinoptilolite, sepiolite, montmorillonite, hydrated calcium sodium aluminosilicate (HSCAS), and yeast cell wall (YCW).
In vitro adsorption capacity.
Studies were retained if:
A. The type of adsorbent was described.
B. The adsorbent was evaluated individually.
C. The incubation medium of the experiment was described.
The final analysis included 68 articles with 1,843 mycotoxin adsorption percentage data.
The data collected included predictor variables:
The mycotoxin and the adsorbent
The pH of the medium and the type of incubation medium used
In general, the selected articles used the single concentration model with incubation at a single pH value or with the change from low pH to high pH:
When only one pH value the incubation mediums were: methanol:water or hydrochloric acid:water.
When a pH change was used (two-step method), incubation mediums were used to mimic the pH of the gastrointestinal tract using or citrate medium. Other mediums were also identified to simulate gastrointestinal digestion using a medium with digestive enzymes salts, and pancreatin), rumen fluid, or gastric juice.
The response variable adsorption percentage was analyzed using PROC MIXED of SAS (version 9.4; SAS Institute Inc., Cary, NC).
Results and discussion
Effect of incubation medium on adsorption capacity of adsorbents
In vitro studies are used to evaluate the adsorption capacity of adsorbents, but the results can be affected by incubation conditions that can influence the interaction between adsorbents and mycotoxins.
The distribution of adsorption data included in the analysis is classified according to 6 different incubation media, Figure1represents the percentage of data for each incubation medium.
The two-step method accounted for 69% of the total data (Figure 1).
Water and simulated GI tract medium accounted for 10% of the data, gastric juice medium for 6%, hydrochloric acid:water for 3%, and methanol:water for 2%.
CAF: citrate acetate phosphate medium; SGI: gastrointestinal simulation medium; LG: gastric juice; HCl: hydrochloric acid.
Analysis of the effect of the mediums on the adsorption capacity showed that gastric juice was the only method that differed from the other two-step methods (P < 0.05) and, because the results were affected by this method and accounted for only 6% of the data, they were removed from the data set.
General adsorption capacity of different mycotoxin adsorbents
Figure 2 shows the distribution of data withinthe studies included in this analysis. The graph on the left shows the average adsorption capacity for each of the 8 mycotoxin adsorbents for the 6 mycotoxins represented in the graph on the right.
Among the adsorbents analyzed, LEV and bentonite had the highest number of observations (36% and 29% of the total data, respectively) and clinoptilolite and sepiolite had the lowest number of observations (2% and 1% of the data, respectively).
AC: activated carbon; HSCAS: calcium and sodium aluminosilicate hydrate, YCW: yeast cell wall
Table 1 shows the adsorption results of each adsorbent for each mycotoxin.
a, b, c Different letters in the same column indicate a significant effect between adsorbents (P < 0.05). x, y, z Different letters in the same row indicate significant effect between mycotoxins (P < 0.05). 1AC: Activated carbon; HSCAS: hydrated sodium and calcium aluminosilicates; YCW: yeast cell wall. 2AFB1: aflatoxin B1; DON: deoxynivalenol; FUM: fumonisin; OTA: ochratoxin A; ZEN: zearalenone
Table 1. Percentage adsorption of each mycotoxin adsorbent for each mycotoxin (Mean ± SEM; adapted from Kihal et al., 2022).
Adsorption capacity was highest for AC (mean 81%) and did not differ between mycotoxins (range between 53% with T-2 toxin and 93% with AFB1).
The remaining adsorbents had lower adsorption compared to CA, but were similar to each other, ranging from 32% for zeolite to 48% for HSCAS.
The average adsorption of HSCAS (48%) was high for AFB1 and ZEN, and low for DON.
The average adsorption of montmorillonite (48%) and bentonite (45%) was high for AFB1 and low for the other mycotoxins.
The mean adsorption of sepiolite (46%) and YCW (34%) was similar among the mycotoxins, ranging from 13-20% for DON and 49% for AF. However, there were no data in the studies included in the analysis to evaluate the adsorption capacity of sepiolite for fumonisins, OTA and T-2 toxin.
The average adsorption of clinoptilolite (32%) was high for AFB1 and low for ZEN, and like sepiolite, no data were available for DON, fumonisins and OTA.
Zeolite adsorption (32%) was high for AFB1 and low for DON.
The average adsorption of bentonite (45%) was high for AFB1 and low for the other mycotoxins.
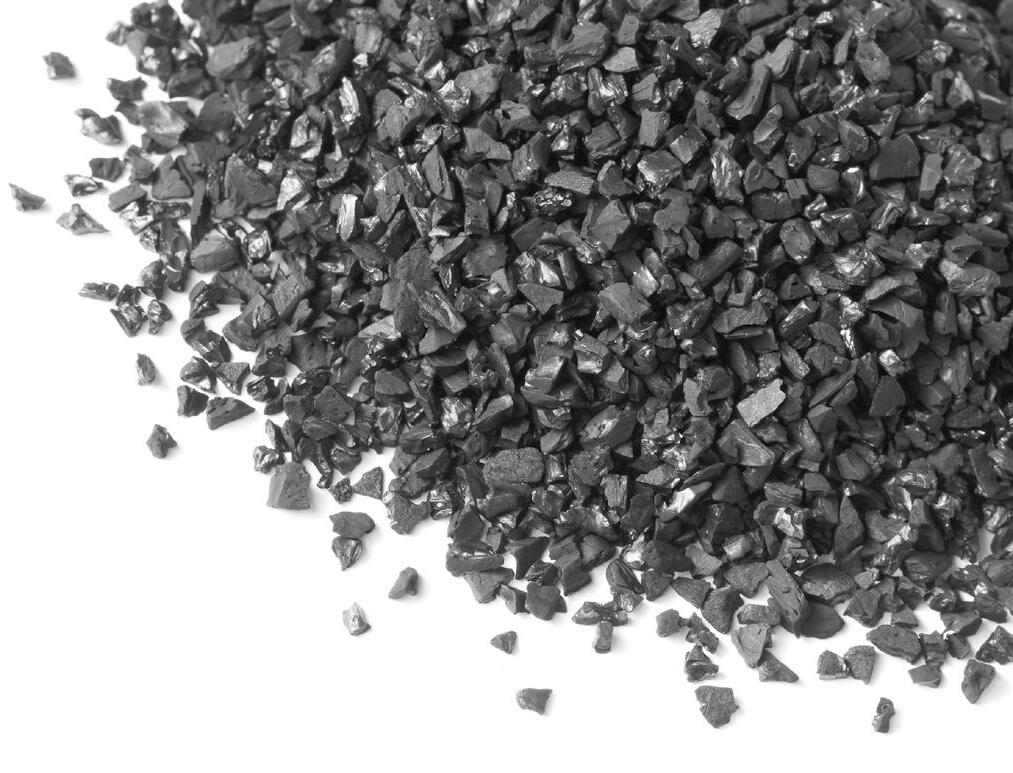
The higher adsorption capacity of AC could be related to its adsorption mechanism.
The size of the pores on AC (nanometers, nm) is larger than the interlaminar space in clays (angstrom, Å). Therefore, mycotoxins with complex chemical structures can enter the pores on AC more easily. Furthermore, activation of AC enhances the binding capacity of polar and non-polar mycotoxins, which makes it less selective and adsorbs different types of mycotoxins.
In the studies included in this review, clays were less effective, with similar adsorption capacity among the different types.
The adsorption mechanism of clays is based on their cation exchange capacity including different weak ionic interactions. Variations among mycotoxins may be associated with cation exchange capacity and interlaminar space, which varies among different types of clays depending on their origin (Nuryono et al., 2012; De Mil et al., 2015).
The average adsorption capacity of YCW was similar to that of clays, although the adsorption mechanism is different and is based on the combination of β-glucan and mycotoxin structures (Jouany, 2007, Yiannikouris et. al, 2013).
The graph to the right in Figure 2 shows the average of each mycotoxin adsorption by different adsorbents. the results from the point of view of mycotoxin AFB1, OTA and ZEN had the highest number 38%, 24% and 21% of the total data, respectively, and DON, fumonisins and T-2 toxin had the lowest observations with 9%, 6% and 1% of the total data, respectively
AFLATOXINS
The average adsorption was the highest for AFB all mycotoxins, being the highest for AC (93%), bentonite (86%), and montmorillonite (88%), and the lowest for YCW (49%).
Two main characteristics allow high adsorption of AFB1 to inorganic adsorbents:
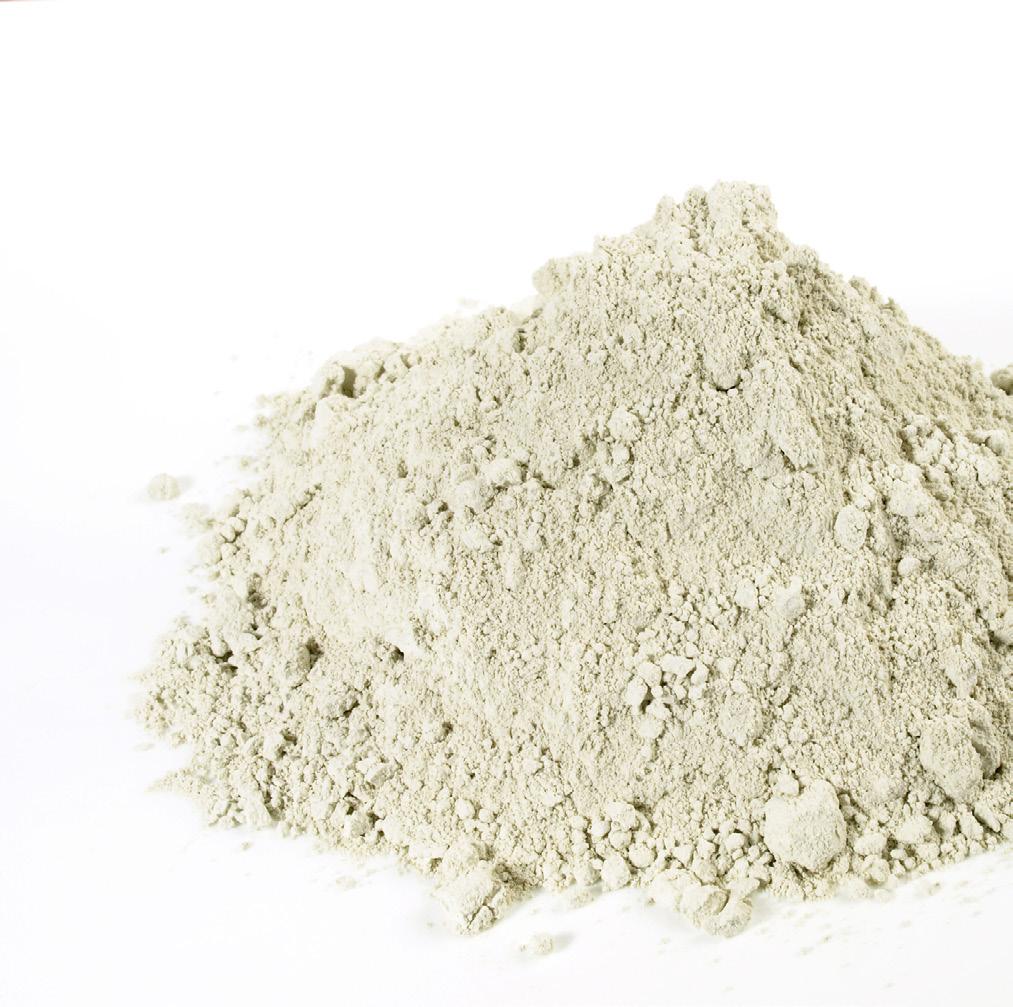
The small and flat chemical structure into the interlaminar space of clays and CA pores.
The high polarity facilitates ionic interaction with the adsorbents.
On the other hand, these properties do not facilitate their adsorption to LEV.
The properties of aflatoxins are different from those of other types of mycotoxins such as fumonisin (molecular weight = 721 g/mol) and T-2 toxin (molecular weight = 466 g/mol), whose chemical structures are larger than that of aflatoxins (molecular weight = 312 g/mol) and with many ramifications.
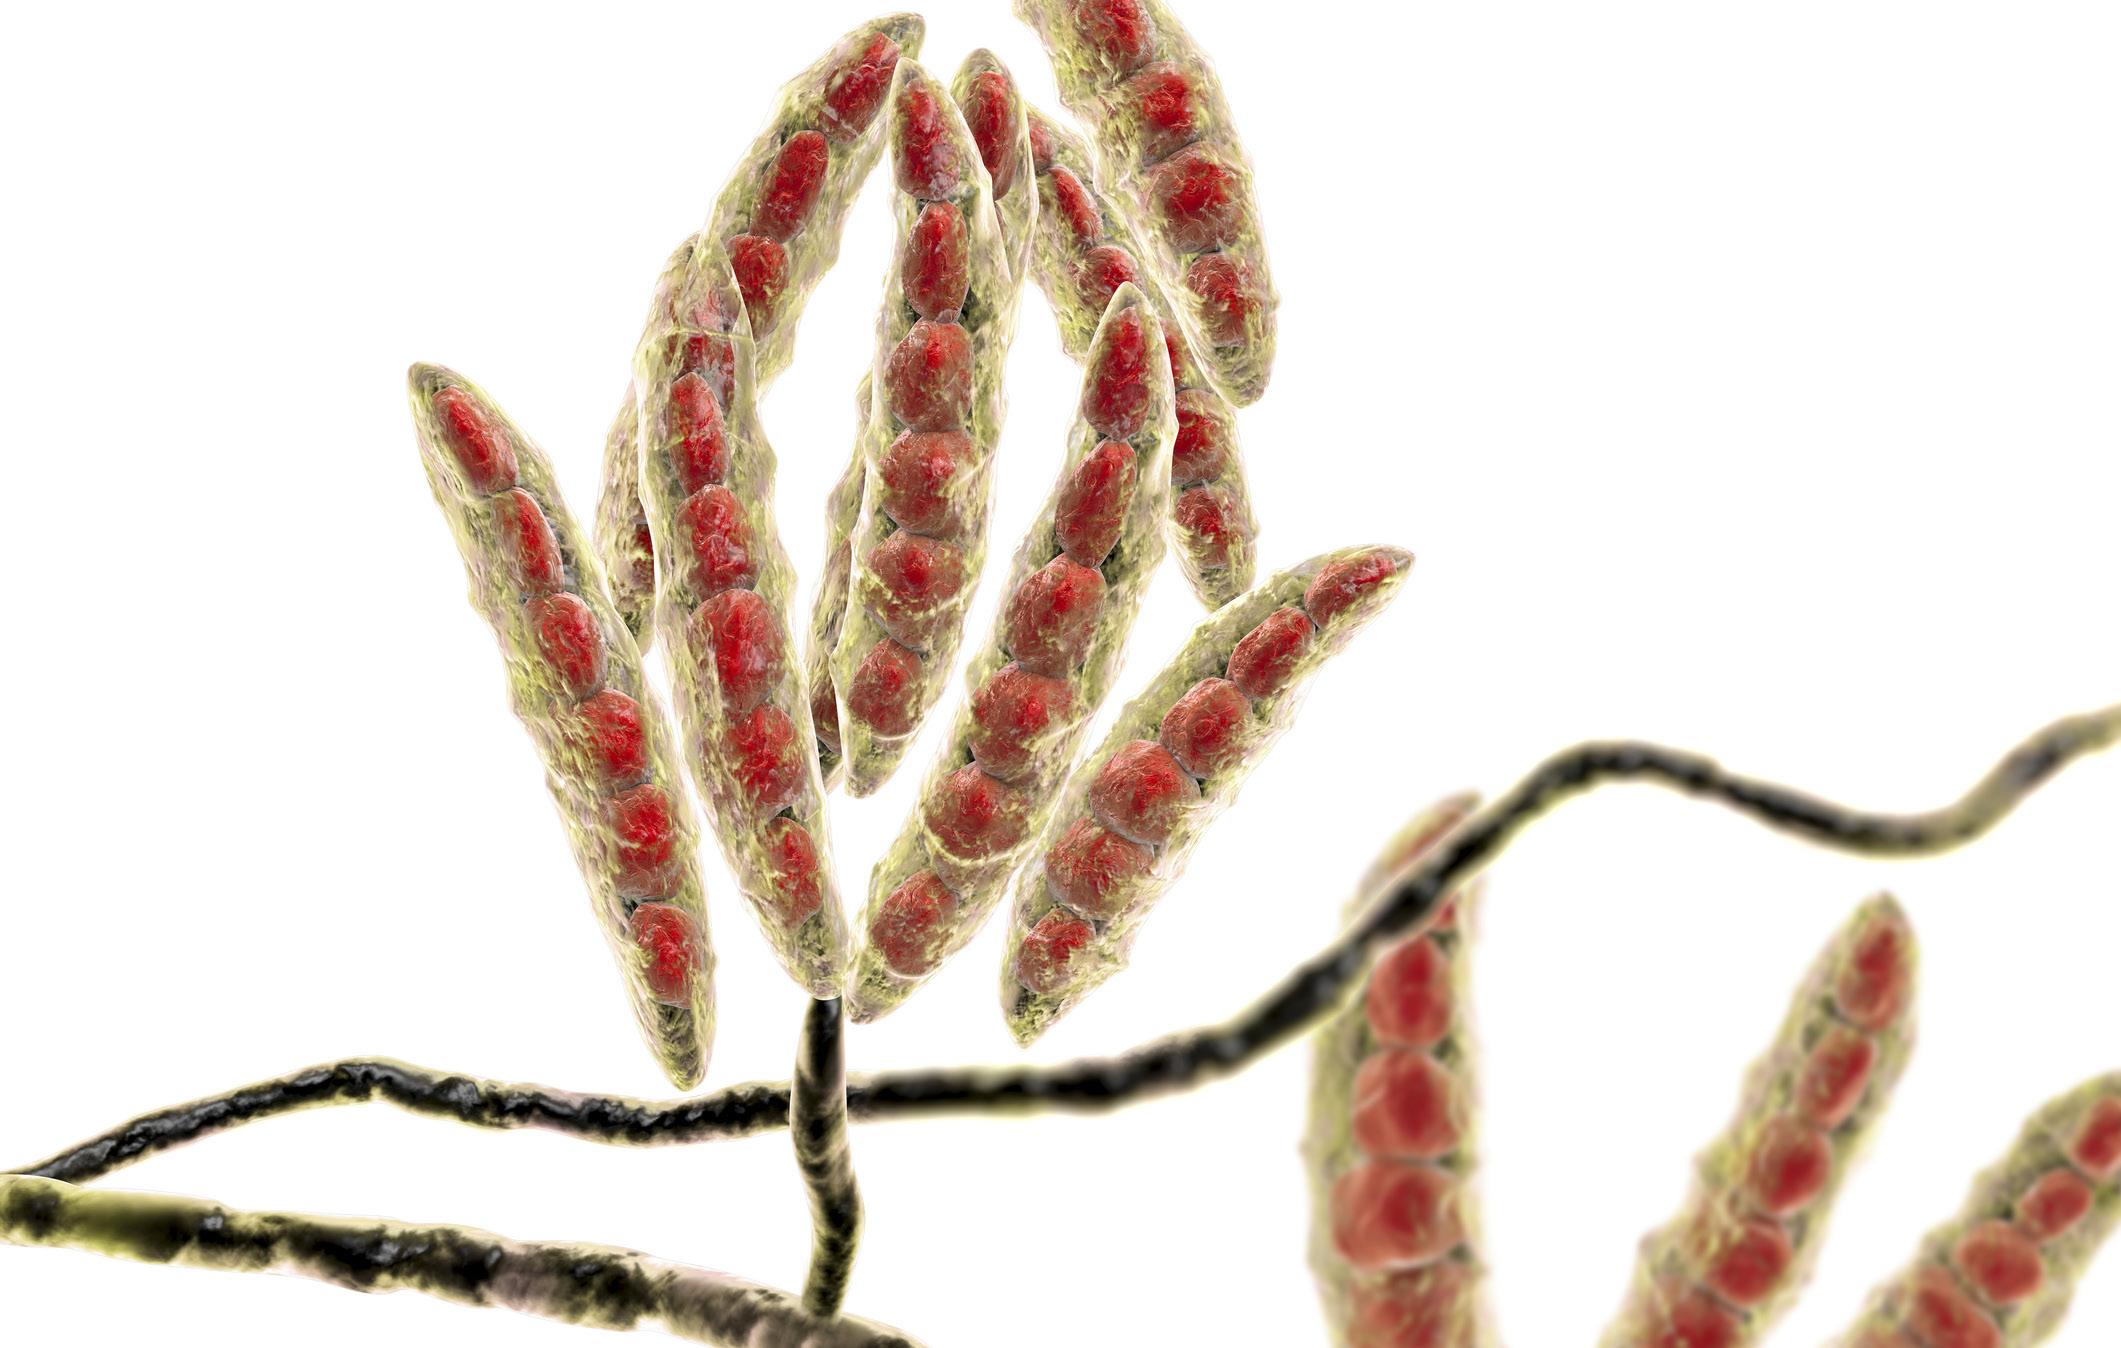
This structural conformation can limit the entry of these mycotoxins into the interlaminar space of clay-based adsorbents and consequently decrease their adsorption capacity.
Although the molecular weight of DON (296 g/mol) is lower than that of AFB1, its adsorption was lower than that of AFB1 (77% vs. 23%).
In this case, it could be suggested that the low adsorption capacity of DON is not related to its molecular weight or structural size, but to its chemical properties, such as the low polarity or the high number of stereocentric atoms (2 vs 7 for AFB1 and DON, respectively) that represent the double bonds included in the chemical structure of the mycotoxin and may affect the interactions of the bonds with the cations of the adsorbent.
DON had the lowest mean adsorption (23%), with the highest adsorption to AC (69%) and the lowest to YCW (20%), bentonite (18%), HSCAS (11%), zeolite (10%), and montmorillonite (9%), but the adsorption of sepiolite (13%) was not different due to the low number of observations (n = 2).
The low adsorption of DON could be due to its hydrophobicity attributed to aromatic cycles that limit its binding to adsorbents with hydrophilic characteristics.
In addition to AFB1, ZEN (50%) and OTA (47%) had similar mean adsorptions.
For ZEN, adsorption to AC was higher (93%) and lower for the rest of the adsorbents (mean 38%), except for sepiolite which was not different (39%), probably due to the small number of treatments reported (n = 3). Similarly, OTA adsorption to CA was highest (88%) and lowest for LEVs (43%) and bentonite (22%).
Joannis-Cassan et al. (2011) indicated that the high potential of LEVs to adsorb OTA is due to the high mannoprotein correlation in YCW which represents the key factor in OTA adsorption. In contrast, for other mycotoxins, β-glucans are the main adsorption factor.
Fumonisins and T-2 toxin were the mycotoxins with the fewest observations (6% and 1%, respectively).
For fumonisins (mean adsorption of 45%), adsorption capacity was highest for AC (83%) and lowest for bentonite (32%), LEV (30%) and zeolite (26%).
For T-2 (mean 31%) adsorption was not different between adsorbents (ranging from 5.3% with zeolite to 53% with AC).
Limited research is available on the adsorption capacity of T-2 toxin. Carson and Smith (1983) and Bratich et al. (1990) pointed out that T-2 adsorption depends on the adsorbent dosage and suggested that its dosage should be 10 times higher than the usual dosage used for aflatoxin adsorption.
While aflatoxins have been the most prevalent mycotoxins in foods, their prevalence in raw materials in recent years has changed due to comprehensive control strategies and climate change affecting mold growth patterns in certain regions (Moretti et al., 2019).
Several studies have reported the prevalence of different types of mycotoxins worldwide (Streit et al., 2013; Eloska et al., 2019; Gruber-Dorninger et al., 2019) and the results of sample analysis were consistent across studies.
Streit et al. (2013) reported data on mycotoxin prevalence between 2004 and 2011 and showed that DON (64%) and fumonisins (63%) were the main food contaminants. However, the occurrence of aflatoxins was only significant in Southeast Asia, where it increased from 33% in 2004 to 70% in 2011. The authors attributed the high incidence of aflatoxins in this region to the warm climate of the southern regions.
Later, Gruber- Dorninger et al. (2019) reported data on mycotoxin occurrence between 2008 and 2017, and the results also showed a high occurrence of DON (64%) and fumonisins (60%) and a lower occurrence of aflatoxins (23%).
Eskola et al. (2019) compared the prevalence of mycotoxins from the EFSA (EFSA Ref. 17238686; PAD 2017 017) and Biomin (Kovalsky et al., 2016) datasets, and the results showed similar incidences between the two datasets with the highest incidence for ZEN (80%) and DON (60%).
Effect of pH on the adsorption capacity of mycotoxin binders
The pH values of the incubation media were grouped into 4 ranges:
Low: pH 1-4 (42% of the data)
Intermediate: pH 5-6 (17% of the data)
High: pH 7-9 (33% of the data)
Two-step methods (from low to high pH) recording only the final adsorption values of the incubation procedure.
Analysis of the data showed that pH tends to affect the adsorption of OTA and ZEN (P < 0.08):
OTA adsorption was highest at two-step pH (58%) and lowest at low (53%) and intermediate pH (32%).
ZEN adsorption was highest at two-step pH (58%) and lowest at low (47%), intermediate (49%) and high pH (45%).
Surprisingly, the data collected in this study were much lower for T-2 toxin (n = 26) and fumonisins (n = 105) than for aflatoxins (n = 669), highlighting the importance given to aflatoxins to the detriment of other mycotoxins that are also highly prevalent in crops.
It is reasonable to think that pH affects the adsorption of polar molecules more (Thieu and Pettersson, 2008).
However, fumonisins and aflatoxins are the most polar mycotoxins and their adsorption was not affected by pH. In contrast, ZEN is the least polar mycotoxin and was affected by pH. In this sense, other factors could influence mycotoxin adsorption such as molecular size and structure or solubility.
Data analysis also revealed the effect of pH on the adsorption capacity of the adsorbents (Figure 3).
Low pH
Intermediate pH
High pH
Two steps
Mycotoxin binders
AC: activated carbon; HSCAS: hydrated sodium and calcium aluminosilicates; YCW: yeast cell wall.
Specifically, the adsorption capacity of YCW was affected by pH (P < 0.05) and was higher at low pH (43%) and lower at high pH (35%).
These results are consistent with those of Faucet-Marquis et al. (2014) who reported that the adsorption capacity of YCW is higher at low or neutral pH by enhancing the stability of β-glucans, responsible for the adsorption capacity of YCW.

