


While low inventory continues to be disappointing, the local real estate market remains strong, with consistent demand for unique, well priced properties in Santa Barbara, Montecito and Hope Ranch. Regardless of market conditions, we sell investment grade properties that hold their value regardless of what is happening with Real Estate in the rest of the country. Read on for summary by area and check out
• Local Trends + Highlights
• National Real Estate Insights by Compass
• New You Can Use | Article of Interest That Stood Out (at the end)
• Available Properties we Feel are Good Investments (click below + read on)
Well qualified buyers are moving here at a pace we have not previously seen and we only have a limited amount of available homes for sale. If you are thinking of selling in the next 5 years, it has proven to be an ideal time to take advantage of this high demand, Why not capitalize on your home equity with these historically high sold prices and a potential phenomenal return on your home investment. The limited inventory for buyers to choose from may make your property stand out! This market can be a challenge for the many buyers but there are still good values out there and we can help you sort through the hype and find the ideal property that will be a good long term investment.
In this highly competitive market—experience matters. We offer concierge level professional service to our clients with world-class marketing, a proven track record of success, the skills necessary to put complicated deals together then negotiate the price and terms that will get your offer accepted amongst multiple offers. Our goal is to get you the best price for your existing home and find you the right replacement property with minimal stress. Let’s explore your property’s current valuation and discuss a strategy. Experience matters!
Looking for professional + creative results-oriented representation — Let’s Talk! click for
Randy and Molly

The autumn selling season began after Labor Day and generally runs until early-mid November, when the market typically begins its big, mid-winter, holiday slowdown. In many regions of the country, the fall market, though relatively short, is the second busiest after spring.
This report will review national trends in home prices, listing supply and buyer demand, and selected economic and demographic indicators. A national report is a huge generalization of broad trends across an enormous range of regional submarkets, whose values and market dynamics vary. National data on September sales should become available in the third week of October.
“The surprisingly quick recovery of the housing market] suggests that the residential real-estate downturn is turning out to be shorter and shallower than many housing economists expected after mortgage rates soared last year... There still aren’t enough homes for sale to meet demand.”
The Wall Street Journal, “The Fall in Home Prices May Already Be Over” 9/8/23

As a result of the remarkably high median sales prices and our low inventory, we are seeing well priced homes selling quickly (30 CDOM) for premium prices of 96% of original list price in August—often with multiple offers to choose from. We feel it is the ideal time to take advantage of an incredible sellers market.
MEDIAN SALES PRICE | Despite low inventory, prices remain steady in Santa Barbara County, but are slowly trending down. Median sales price for single family home YTD is $1,910,000 ($2,100,000 YTD July). In August, the median sales price was $3,275,000 in Montecito (includes condos) and $4,930,000 in Hope Ranch.

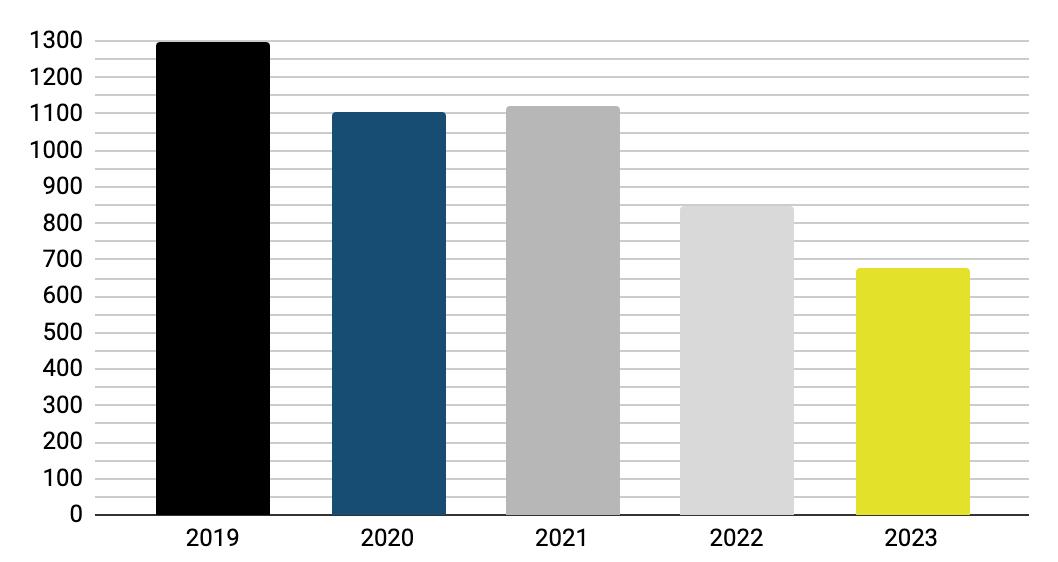
INVENTORY + DOWNWARD SALES TREND | The historically low inventory is resulting in far fewer sales. We can report total transactions of 106 in August (down 20% over August 2022) and 771 YTD which is down by 29% YTD 2022 and less than half of the 1580 transaction YTD 2021. The decreased sales trend is directly correlated to the lack of inventory available to purchase over the past couple years—rather than the demand to live here.
LUXURY MARKET | Montecito remains active with 112 transaction YTD and 14 transactions in August, 5 of them trading over $5M. YTD sales included 60% All Cash and 25% Off Market. Hope Ranch has 15 transactions YTD with 2 transactions in August and all but 4 of the 15 YTD sales traded above $6M. YTD sales included 67% All Cash and 7% Off Market. As a reminder . . . these stats are remarkable and this did not happen previously in our little undiscovered south coast enclave.
ALL CASH ENTIRE AREA | With high and rising mortgage rates, many buyers are opting for all cash transactions as illustrated by a remarkable 60% of the total YTD transactions being All Cash in the entire Santa Barbara area and 25% Off Market. Our market has proven to be less interest rate sensitive and offers opportunities for those who are not financing their purchase.
DAYS ON MARKET | The cumulative/total number days a property is listed for sale before it is sold raised to 30 days (up from 25 days in July) which is down from the year high in May of 45 days.
Single Family Residences + Condominiums
-29% change over 2022
761
SINGLE FAMILY RESIDENCES
TOTAL YTD SALES
-29% change over 2022
530
AVERAGE SALES PRICE
-8% change over 2022
$3,157,422
MEDIAN SALES PRICE
-7% change over 2022
$2,060,000
CONDOMINIUM HOMES
TOTAL YTD SALES
-28% change over 2022
231
AVERAGE SALES PRICE
+2% change over 2022
$1,219,330
MEDIAN SALES PRICE
0% change over 2022
$950,000

MEDIAN

Year-to-Date
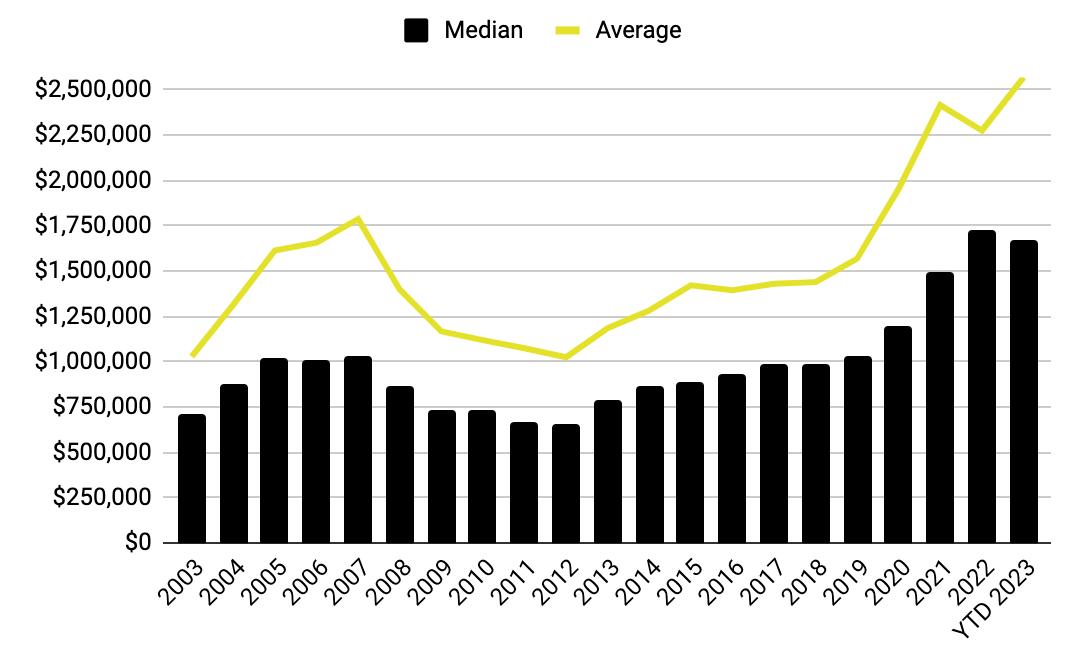
- homes | estates | puds | condosSOLD PRICE/MEDIAN+AVERAGE 20 YEAR COMPARISON | 2003—2023 (YTD)
If you are thinking of OR thought of selling within the next few years—as you can see above, we have historically never seen a better time to capitalize on the equity you may have in your home. Contact us to explore the current value of your property.

AUGUST 2023 | In Review
Single Family Residences + Condominiums (combined sales)
TOTAL AUGUST SALES
14
AVERAGE SALES PRICE
-33% change from 2022 $5,003,107
MEDIAN SALES PRICE
-29% change from 2022 $3,275,000
HIGHEST SALES PRICE
256 Las Entradas Drive Montecito CA 93108
$15,585,000
LOWEST SALES PRICE
251 Cloydon Circle Montecito CA 93108
$2,100,000
Click for Real Time Market Data
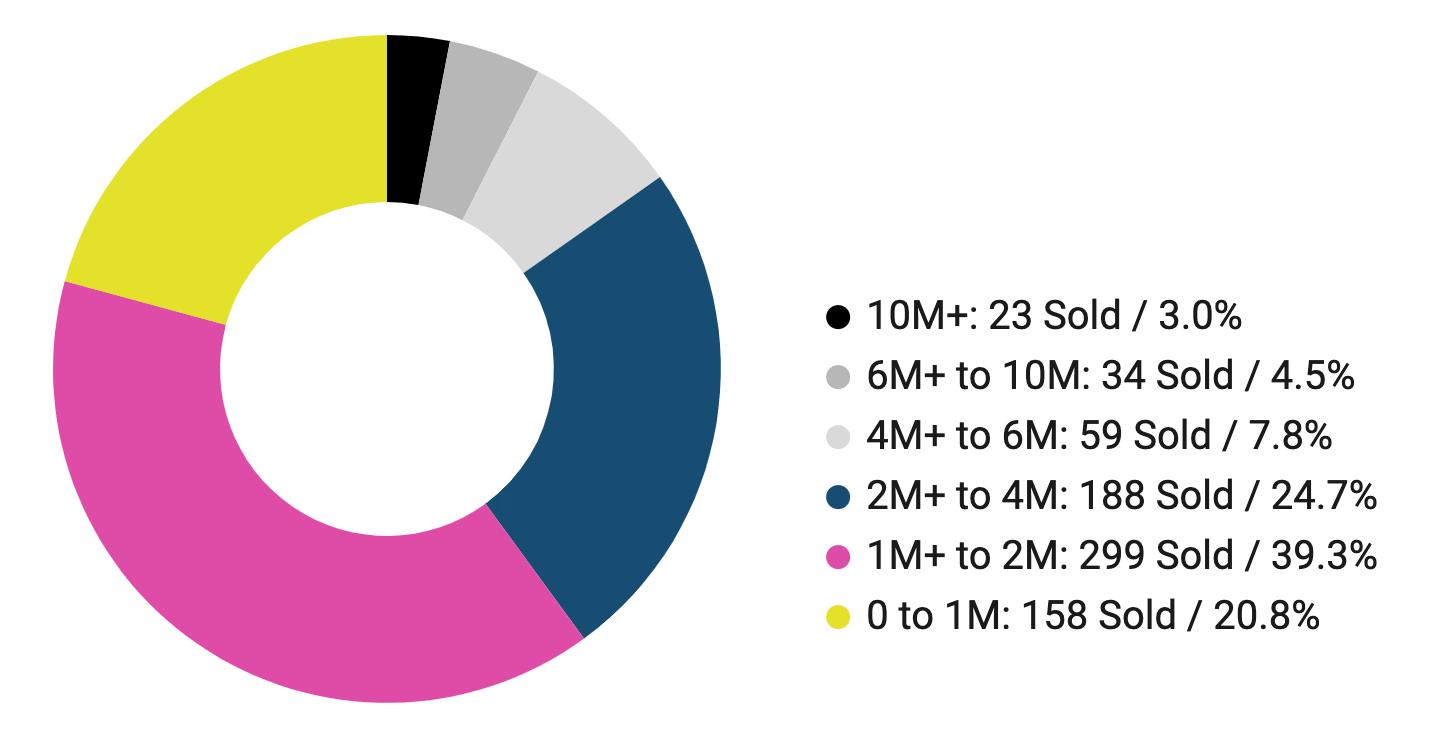
SALES DISTRIBUTED BY PRICE RANGE | YTD 2023
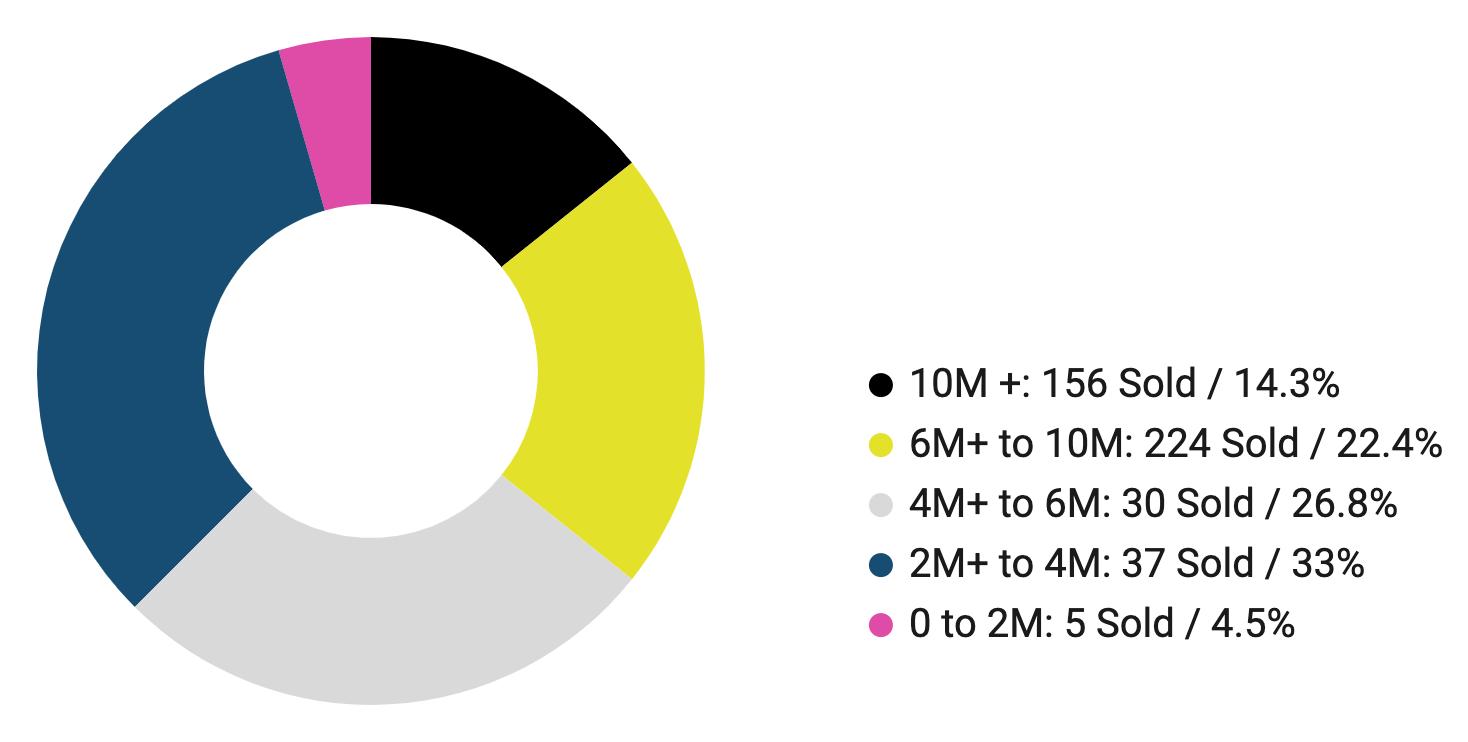
Year-to-Date Sold 2023 Montecito
112 Total Transaction YTD Sales In Millions
67 of the 112 Total Sales
60% YTD ALL CASH TRANSACTIONS
25% YTD OFF MARKET TRANSACTIONS
28 of the 112 Total Sales
AUGUST 2023 | In Review
Single Family Residences + Condominiums (combined sales)
TOTAL AUGUST SALES
2
AVERAGE SALES PRICE
+18% change from 2022 $4,930,000
MEDIAN SALES PRICE
+18% change from 2022 $4,930,000
HIGHEST SALES PRICE
700 Via Hierba
Hope Ranch CA 93110
$5,200,000
LOWEST SALES PRICE
948 Las Palmas Drive
Hope Ranch CA 93110
$4,700,000
Click for Real Time Market Data

SALES STATS BY PRICE RANGE
SALES DISTRIBUTED BY PRICE RANGE | YTD 2023
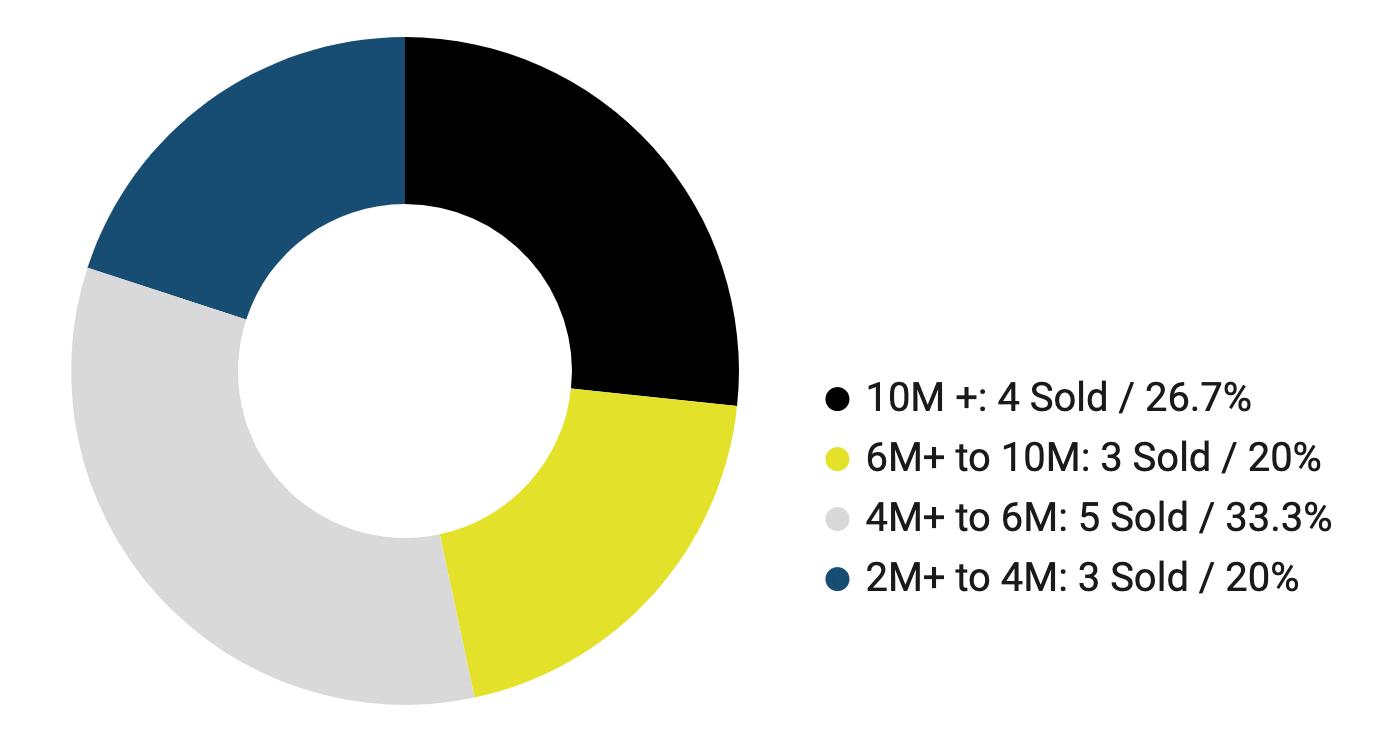
Year-to-Date Sold 2023
Hope Ranch
15 Total Transaction YTD
Sales In Millions
67% YTD ALL CASH TRANSACTIONS
10 of the 15 Total Sales
7% YTD OFF MARKET TRANSACTIONS
1 of the 15 Total Sale
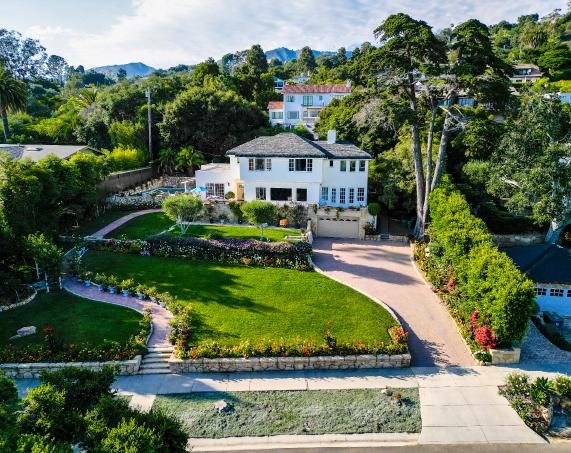
Single Family Residences + Condominiums (combined sales)
TOTAL AUGUST SALES
50
AVERAGE SALES PRICE
+16% change from 2022 $2,317,456
MEDIAN SALES PRICE
+16% change from 2022 $1,847,500
HIGHEST SALES PRICE
1177 Las Alturas Road
Santa Barbara CA 93103
$6,250,000
LOWEST SALES PRICE
3435 Richland Drive, Unit 17
Santa Barbara CA 93105
$565,000 Condominium Home
Click for Real Time Market Data
Undeniable
Exclusive Offering by Randy Haden/Molly Haden
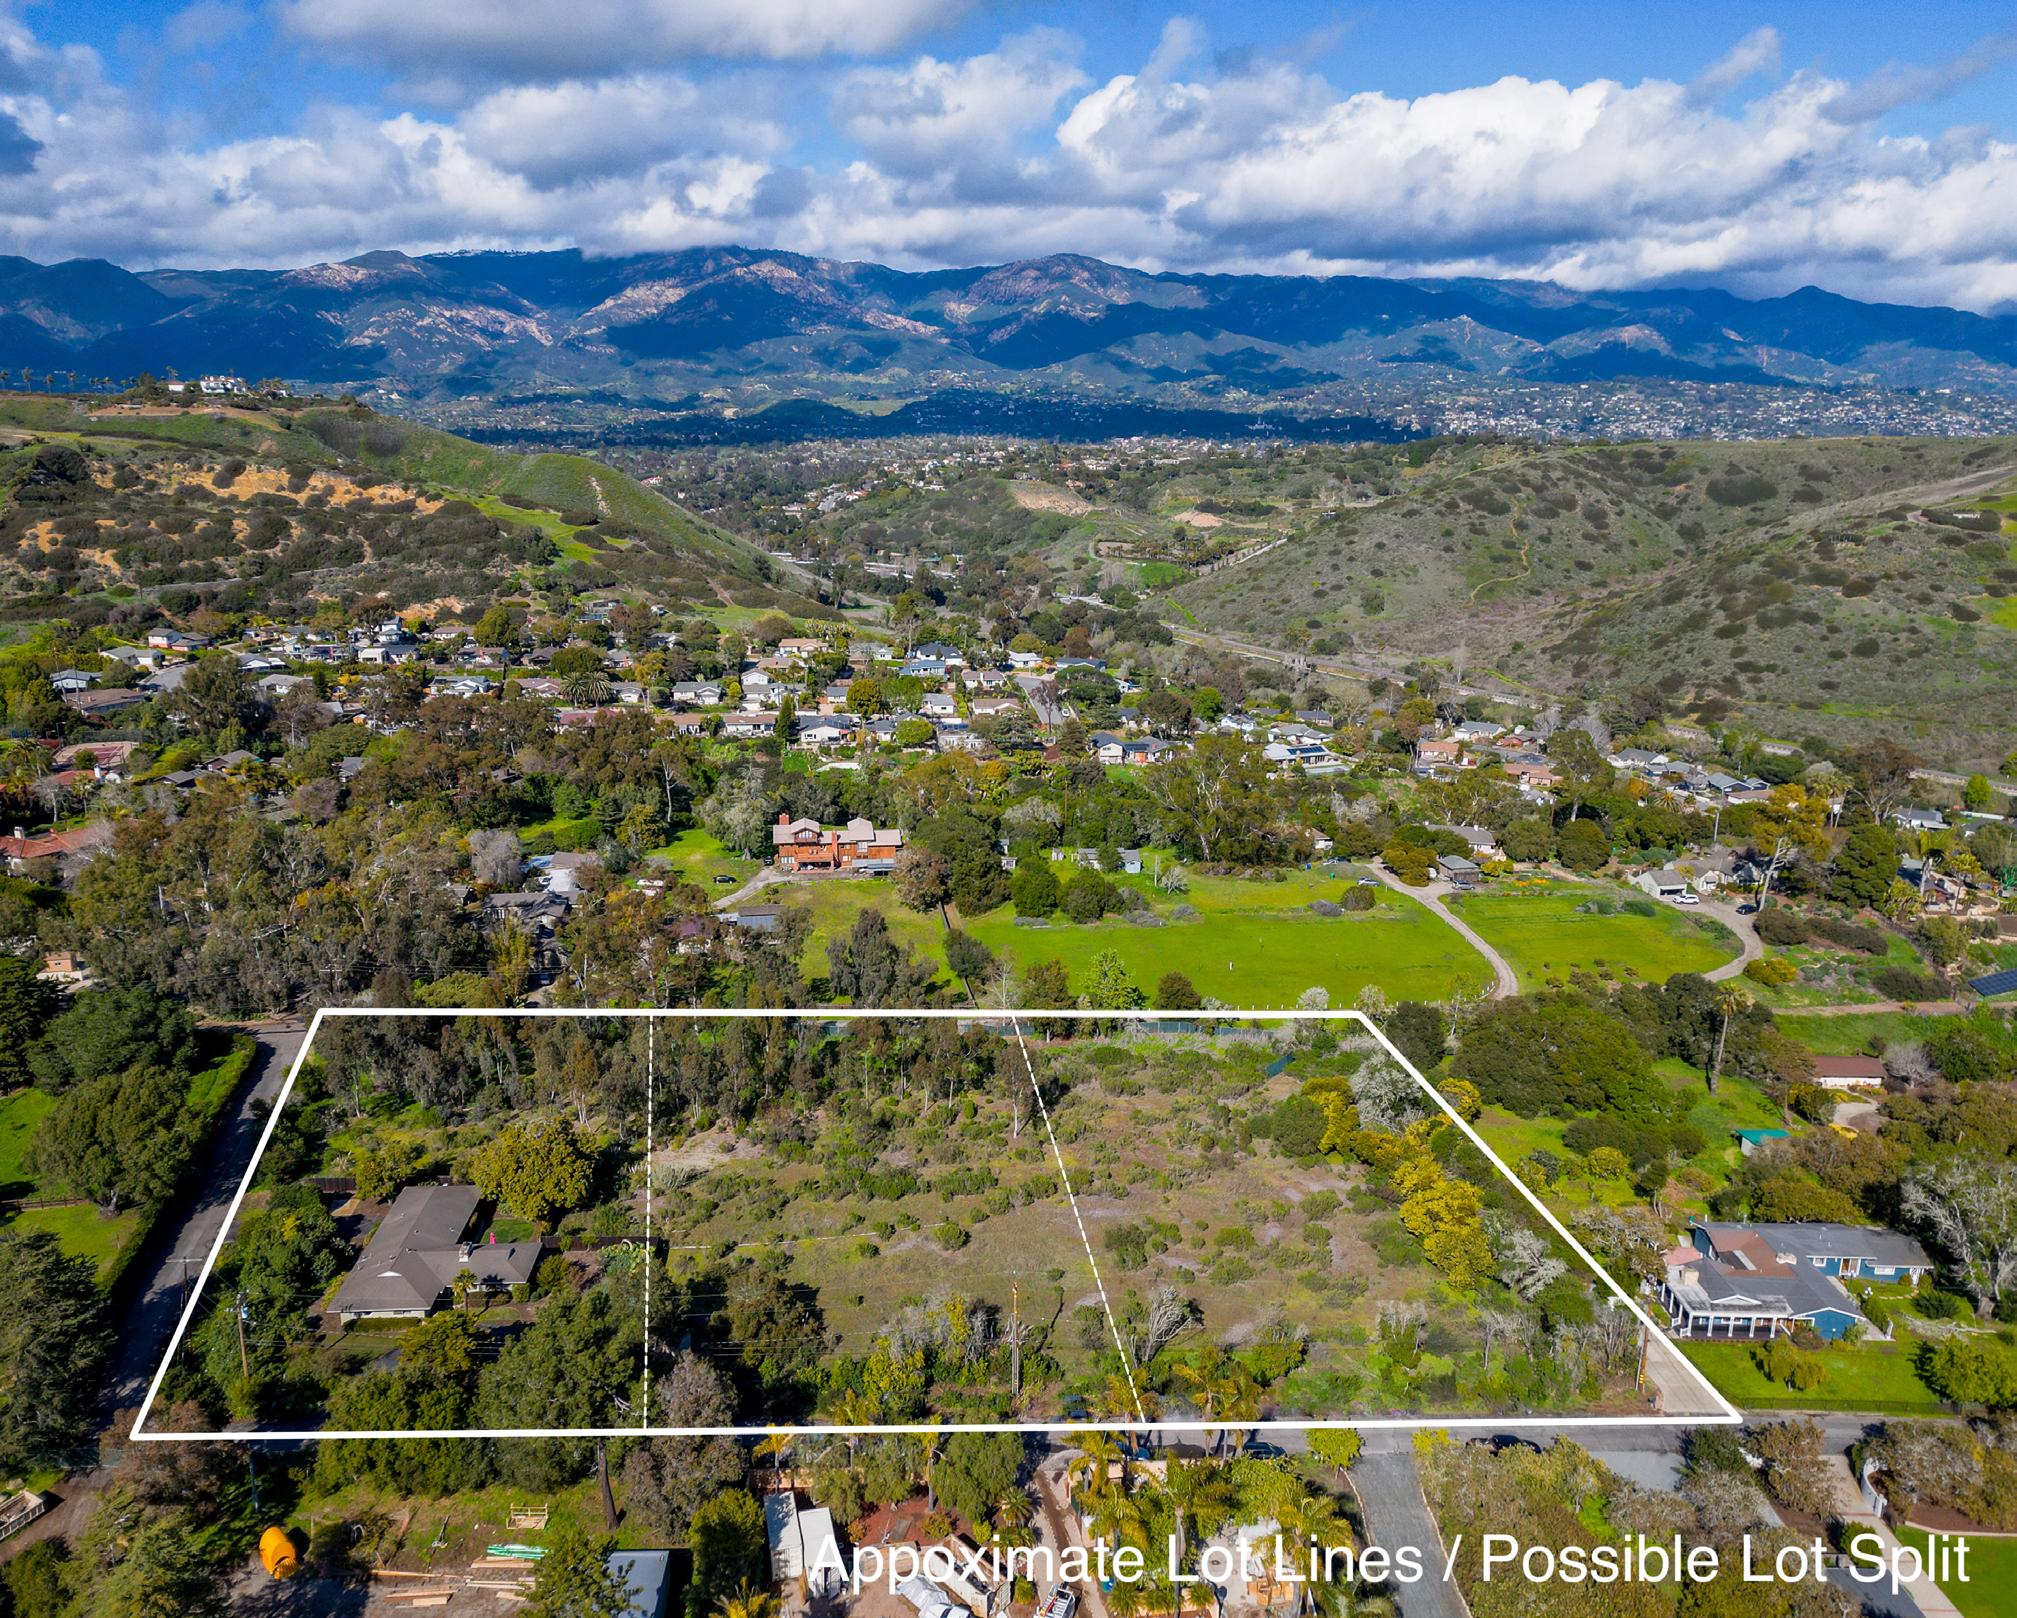
Highly Desirable Upper Riviera | Sweeping Ocean View Parcel
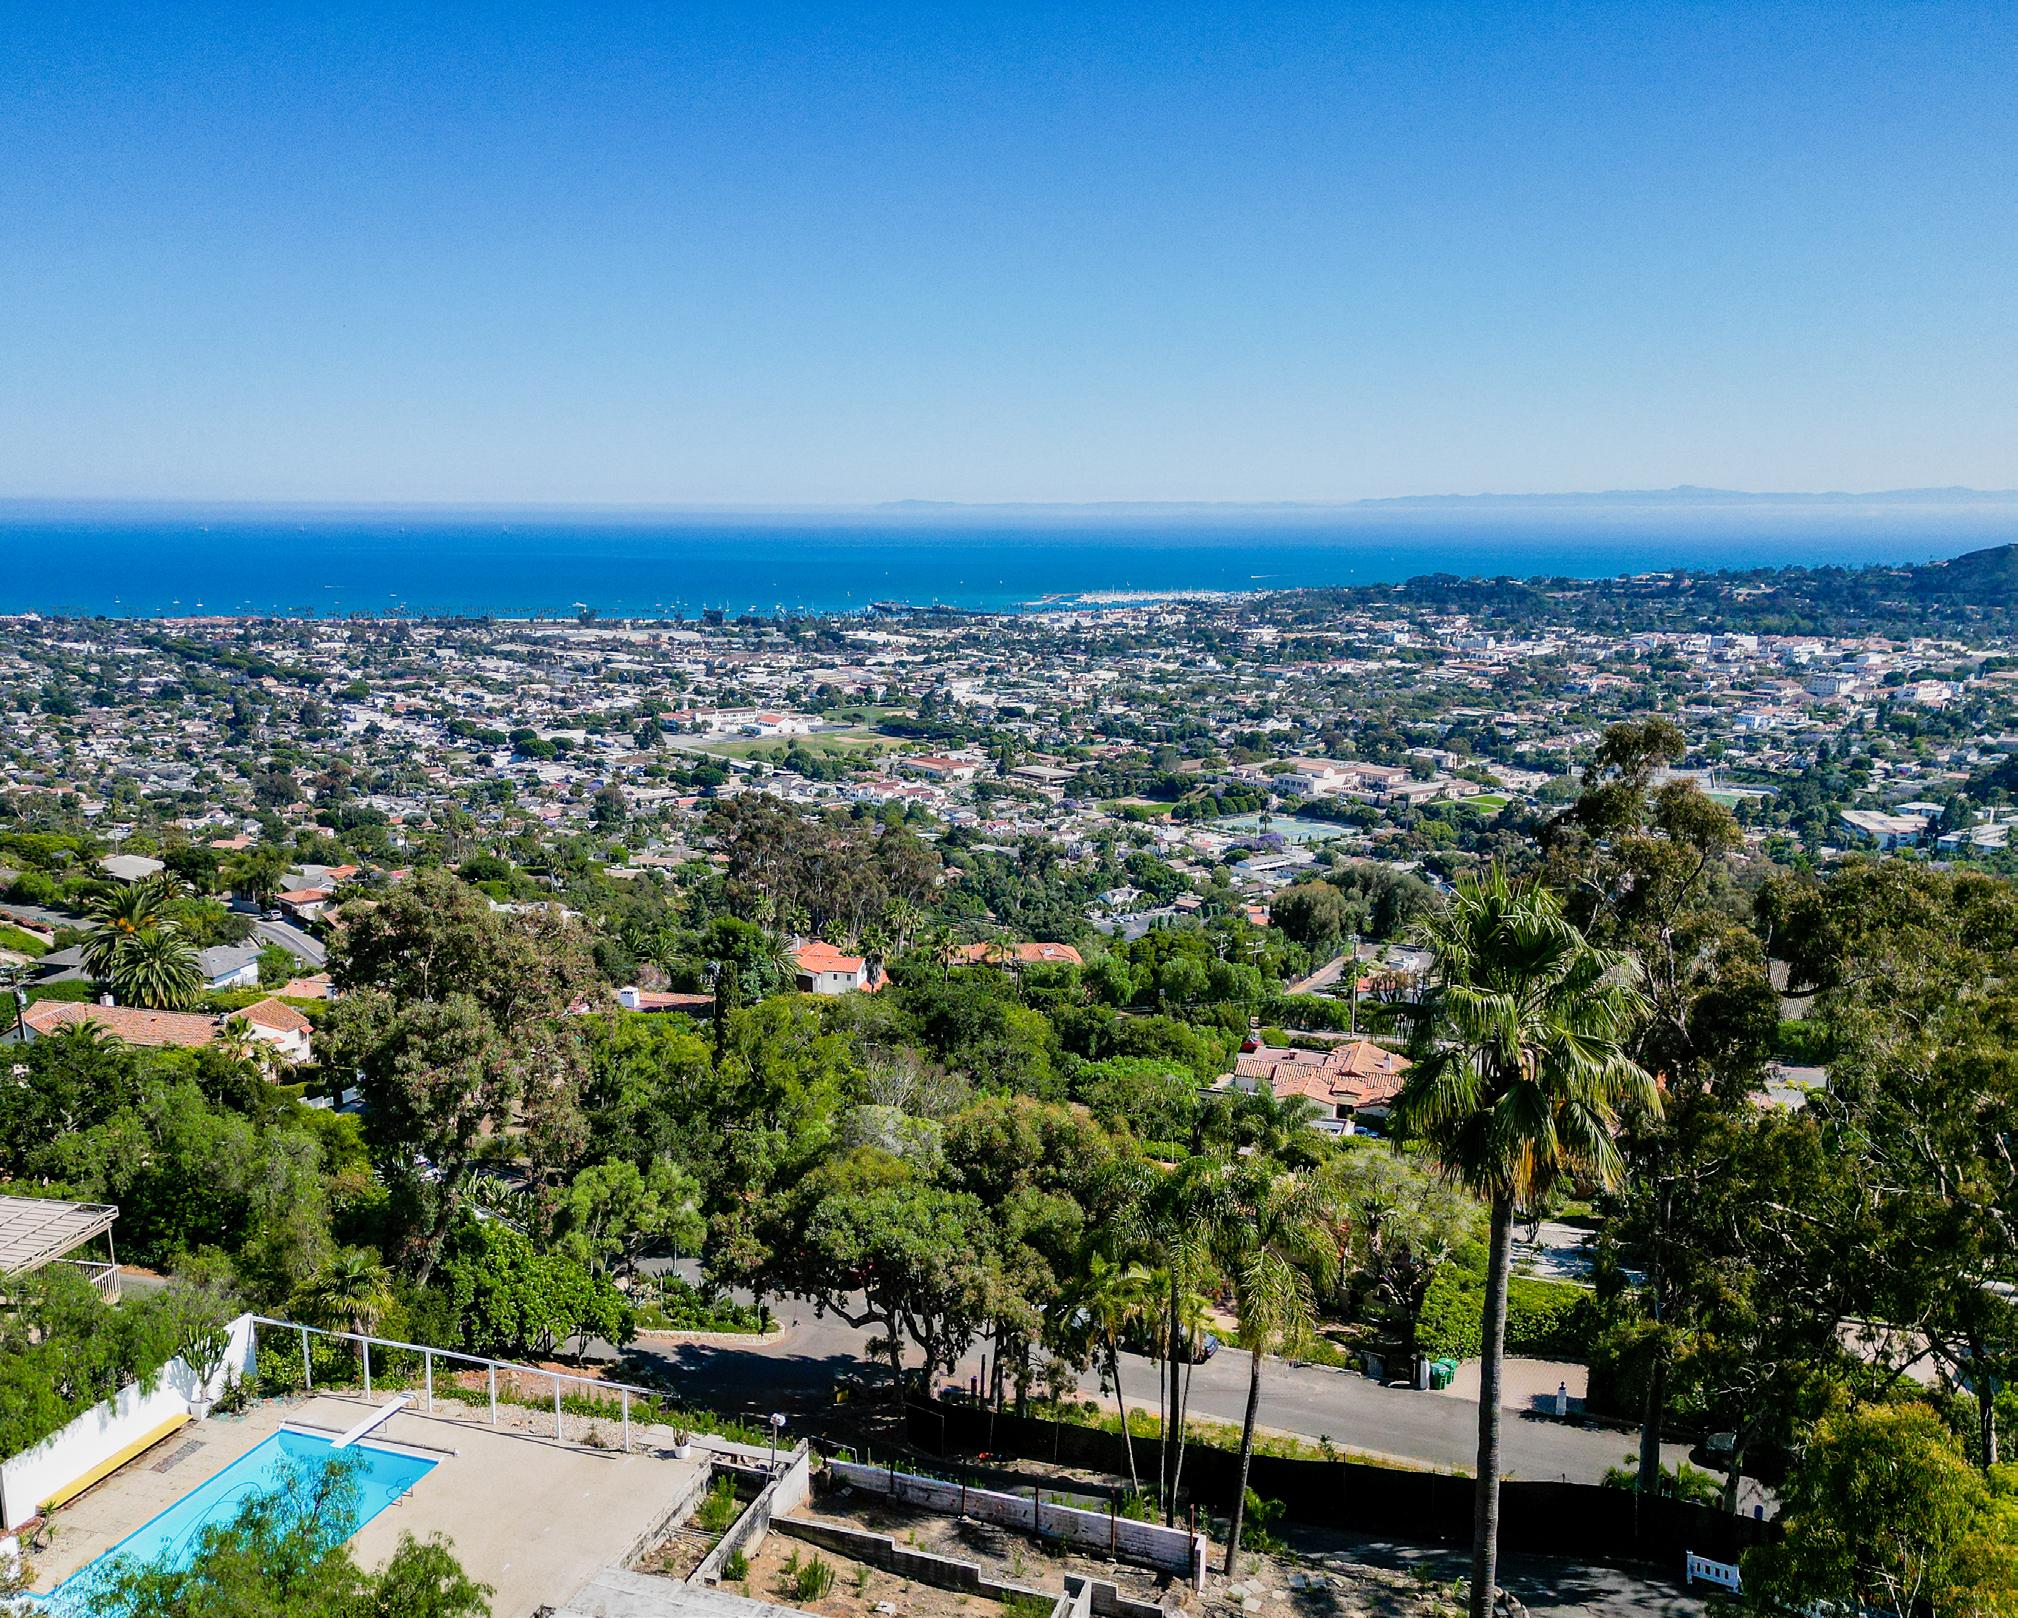
0.82± Acre Lot | Existing Pool | Building Plans Available Offered at $3,297,000
Exclusive Offering by Randy Haden/Molly Haden
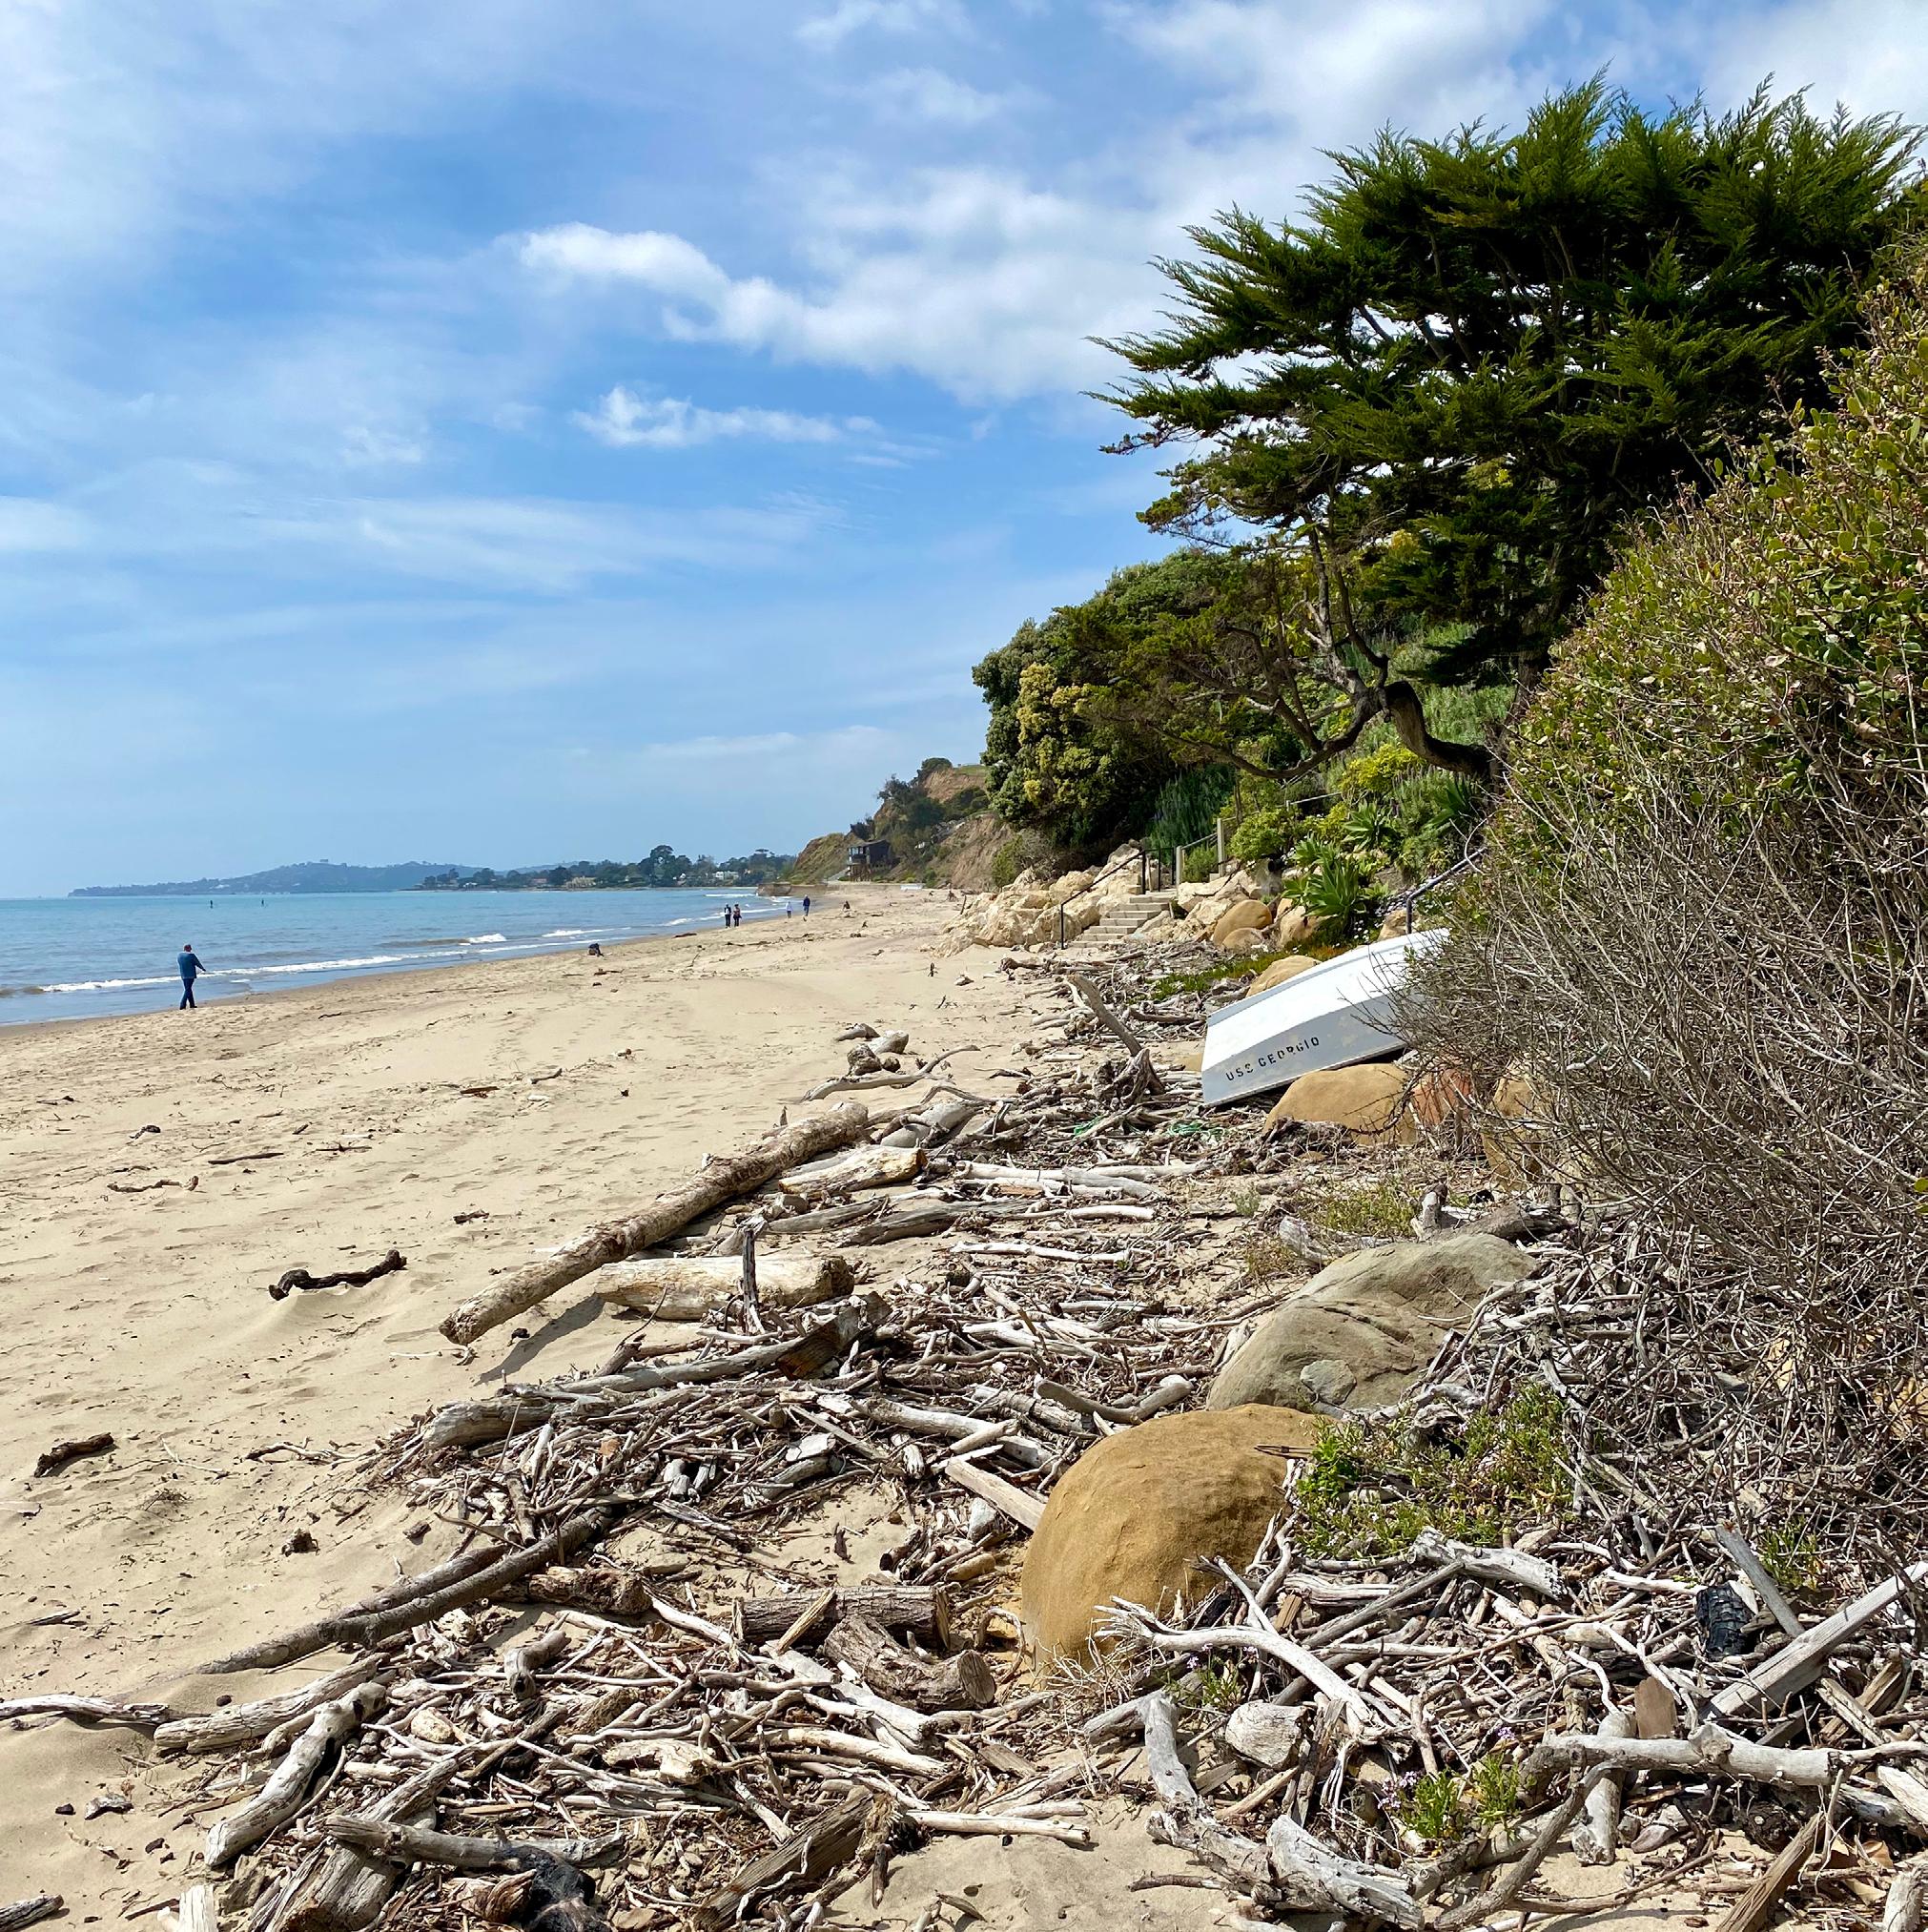
Single Family Residences + Condominiums (combined sales)
TOTAL AUGUST SALES
0
AVERAGE SALES PRICE
0% change from 2022 n/a
MEDIAN SALES PRICE
0% change from 2022 n/a
HIGHEST SALES PRICE n/a
LOWEST SALES PRICE n/a
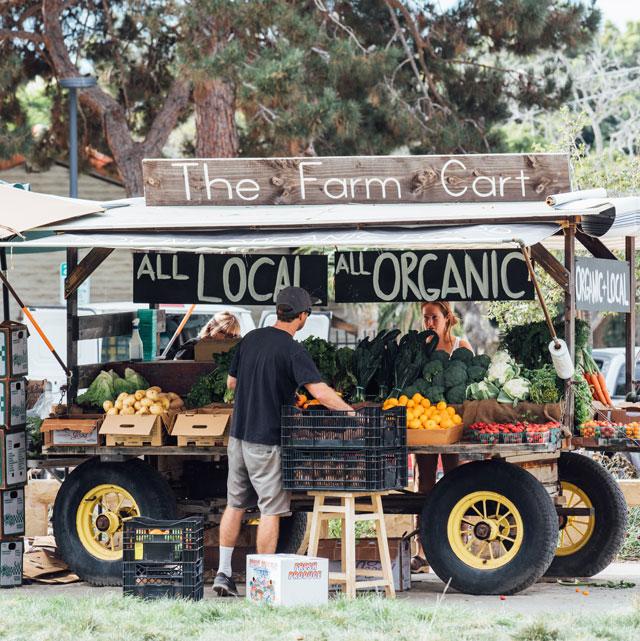
AUGUST 2023 | In Review
Single Family Residences + Condominiums (combined sales)
TOTAL AUGUST SALES
17
AVERAGE SALES PRICE
-17% change from 2022
$1,082,753
MEDIAN SALES PRICE
-24% change from 2022 $915,000
HIGHEST SALES PRICE
5002 Foothill Road Carpinteria CA 93013
$2,050,000
LOWEST SALES PRICE
4700 Sandyland Road, #27 Carpinteria CA 93013
$450,000 Condominium Home
Click for Real Time Market Data
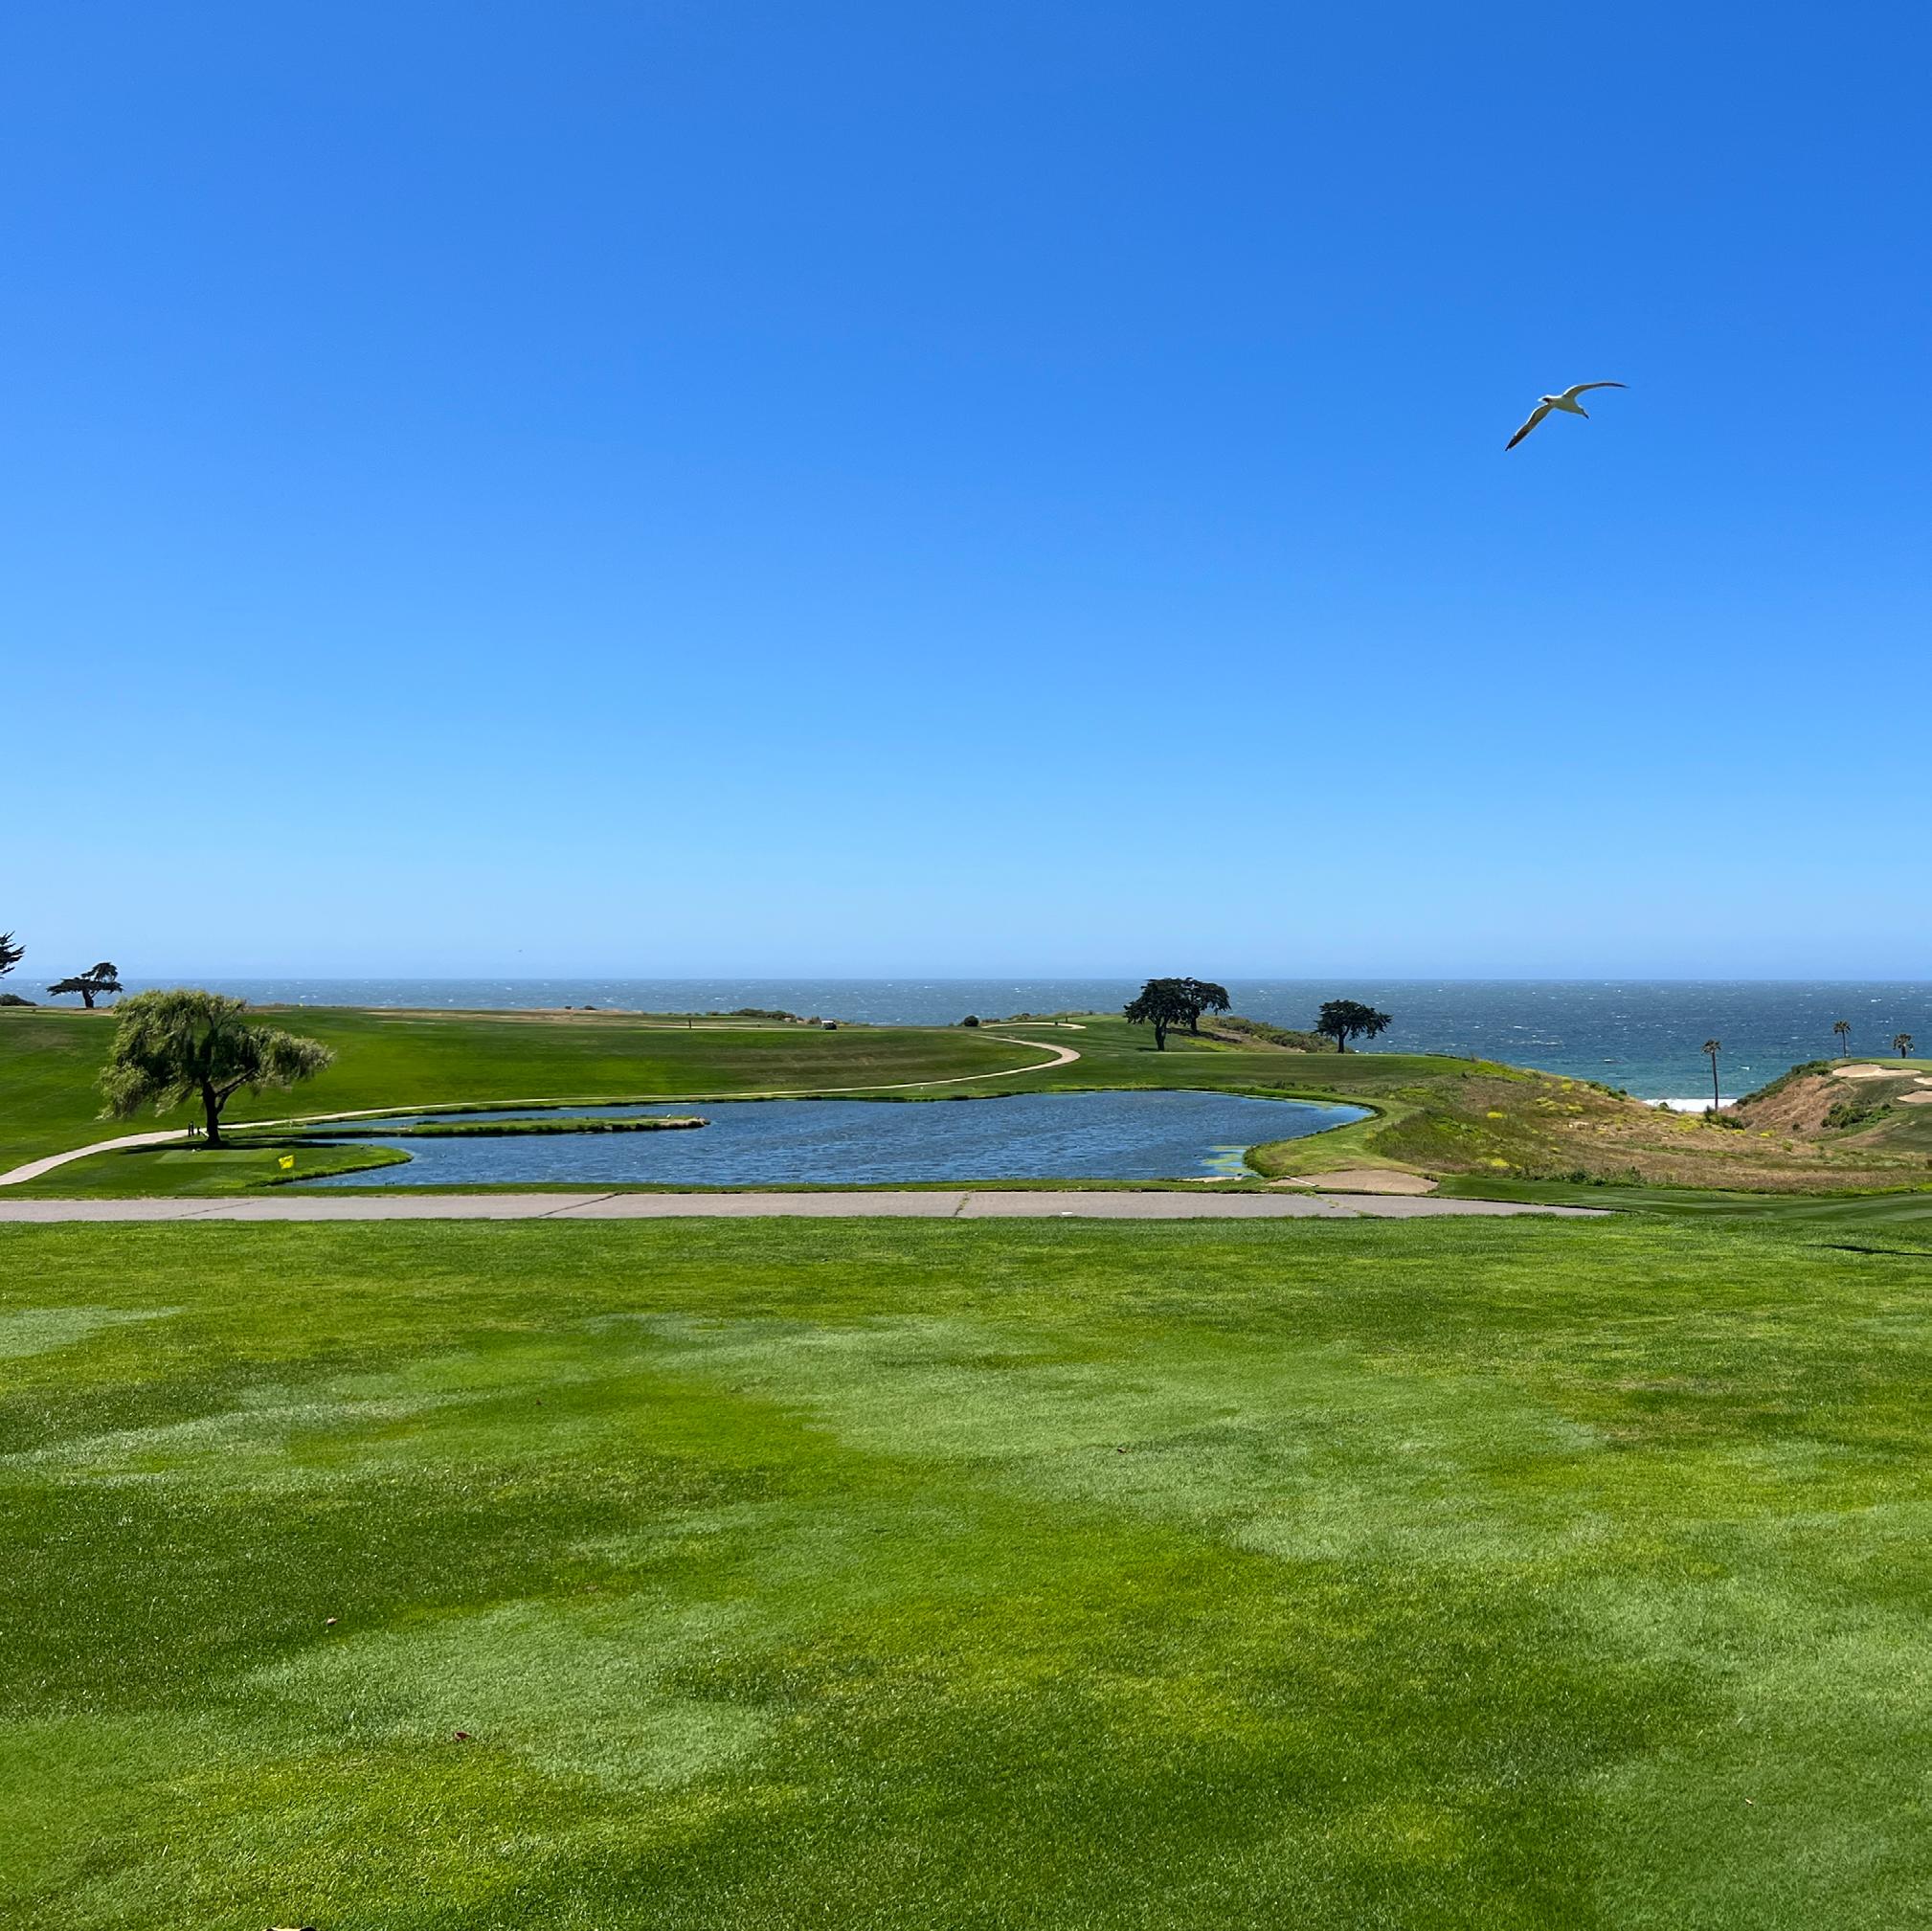
AUGUST 2023 | In Review
Single Family Residences + Condominiums (combined sales)
TOTAL AUGUST SALES 23
AVERAGE SALES PRICE
+8% change from 2022 $1,416,605
MEDIAN SALES PRICE
+2% change from 2022 $1,225,000
HIGHEST SALES PRICE
4690 La Espada Drive Goleta CA 93110
$2,843,000
LOWEST SALES PRICE
5290 Overpass Road, #32 Goleta CA 93111
$800,000
Click for Real Time Market Data
DISCRETION
Privacy is the Ultimate Commodity And the Decision to Sell Your Home Is a Personal One.

FLEXIBILITY
Decide When to Share Details About Your Home - Including PriceMore Expansively On Your Own Timing.
QUALITY
Exclusive Exposure To Compass Agents, Including Premium Placements On Agent Facing Platform.

VALUE
Get the Best Offer by Testing The Market
Privately to Gather Key Insights Without Your Listing Getting Stale or Overexposed.

Ask Us About Our Exciting Private Exclusive Listings | Contact Us Live For details!
A Compass Private Exclusive listing is an off-market home that can be shared by a Compass agent directly with their colleagues and their buyers. Property details are not disseminated widely and won’t appear on public home search websites.
Listing your home as a private exclusive allows you to control what information is shared about you and your home while still getting exposure to top agents at Compass.
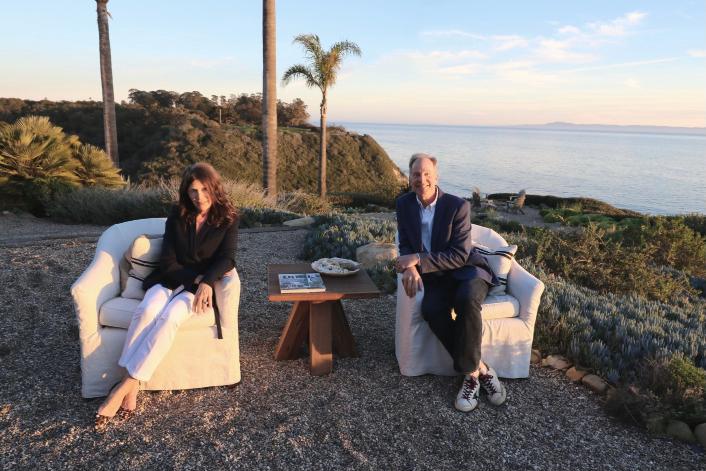




Now more than ever you need an expert advisor on your side who can provide comprehensive analysis and exclusive insights into today’s fast-paced housing market. We see every luxury property available and know the market. Our commitment to staying educated on what’s happening with economic news, the real estate market, local sales and listings is essential to your success when buying or selling properties.
We strive to deliver a high level of personalized service—personally! We provide our clients with cutting-edge strategies that produce ideal results. Our exceptional service is driven by efficient communication, understanding your needs and having expansive industry resources— combined with expert knowledge of the extensive contracts and required forms to protect your best interests. The process comes together as a result of our years of successful negotiating which leads to a winning deal. We listen carefully, anticipate your needs, execute the deal and handle all the details. The hard work starts when a contract is in place so you will be happy you chose representation experienced in closing the deal smoothly.
Sell a Home | Build a Home initiative. We are deeply connected and committed to the communities in which we live and work. Haden Homes Luxury Property Group has made a pledge to help individuals with housing needs by partnering with Habitat for Humanity. For every home that our clients buy or sell, Haden Homes makes a donation to Santa Barbara’s Habitat for Humanity.



All information provided is deemed from sources reliable but has not been verified and may contain errors and is subject to revision. We do not guarantee it and all numbers should be considered approximate, good-faith estimates.
We recommend that buyers make their own inquiries. Data source Fidelity National Title, Chicago Title and Santa Barbara MLS. INdata Real Estate Market Reporting through August 2023.
Properties featured are courtesy of the Santa Barbara MLS and are available for sale at time of publication. They may be listed by brokers and/or agents other than Compass or Haden Homes Group. Contact us for details or to set up a private showing at 805.880.6530.
