
market report december 2021 | haden homes luxury property group | compass montecito south SANTA BARBARA COUNTY Residential Real Estate Market Report December
YEAR END REPORT and
2021
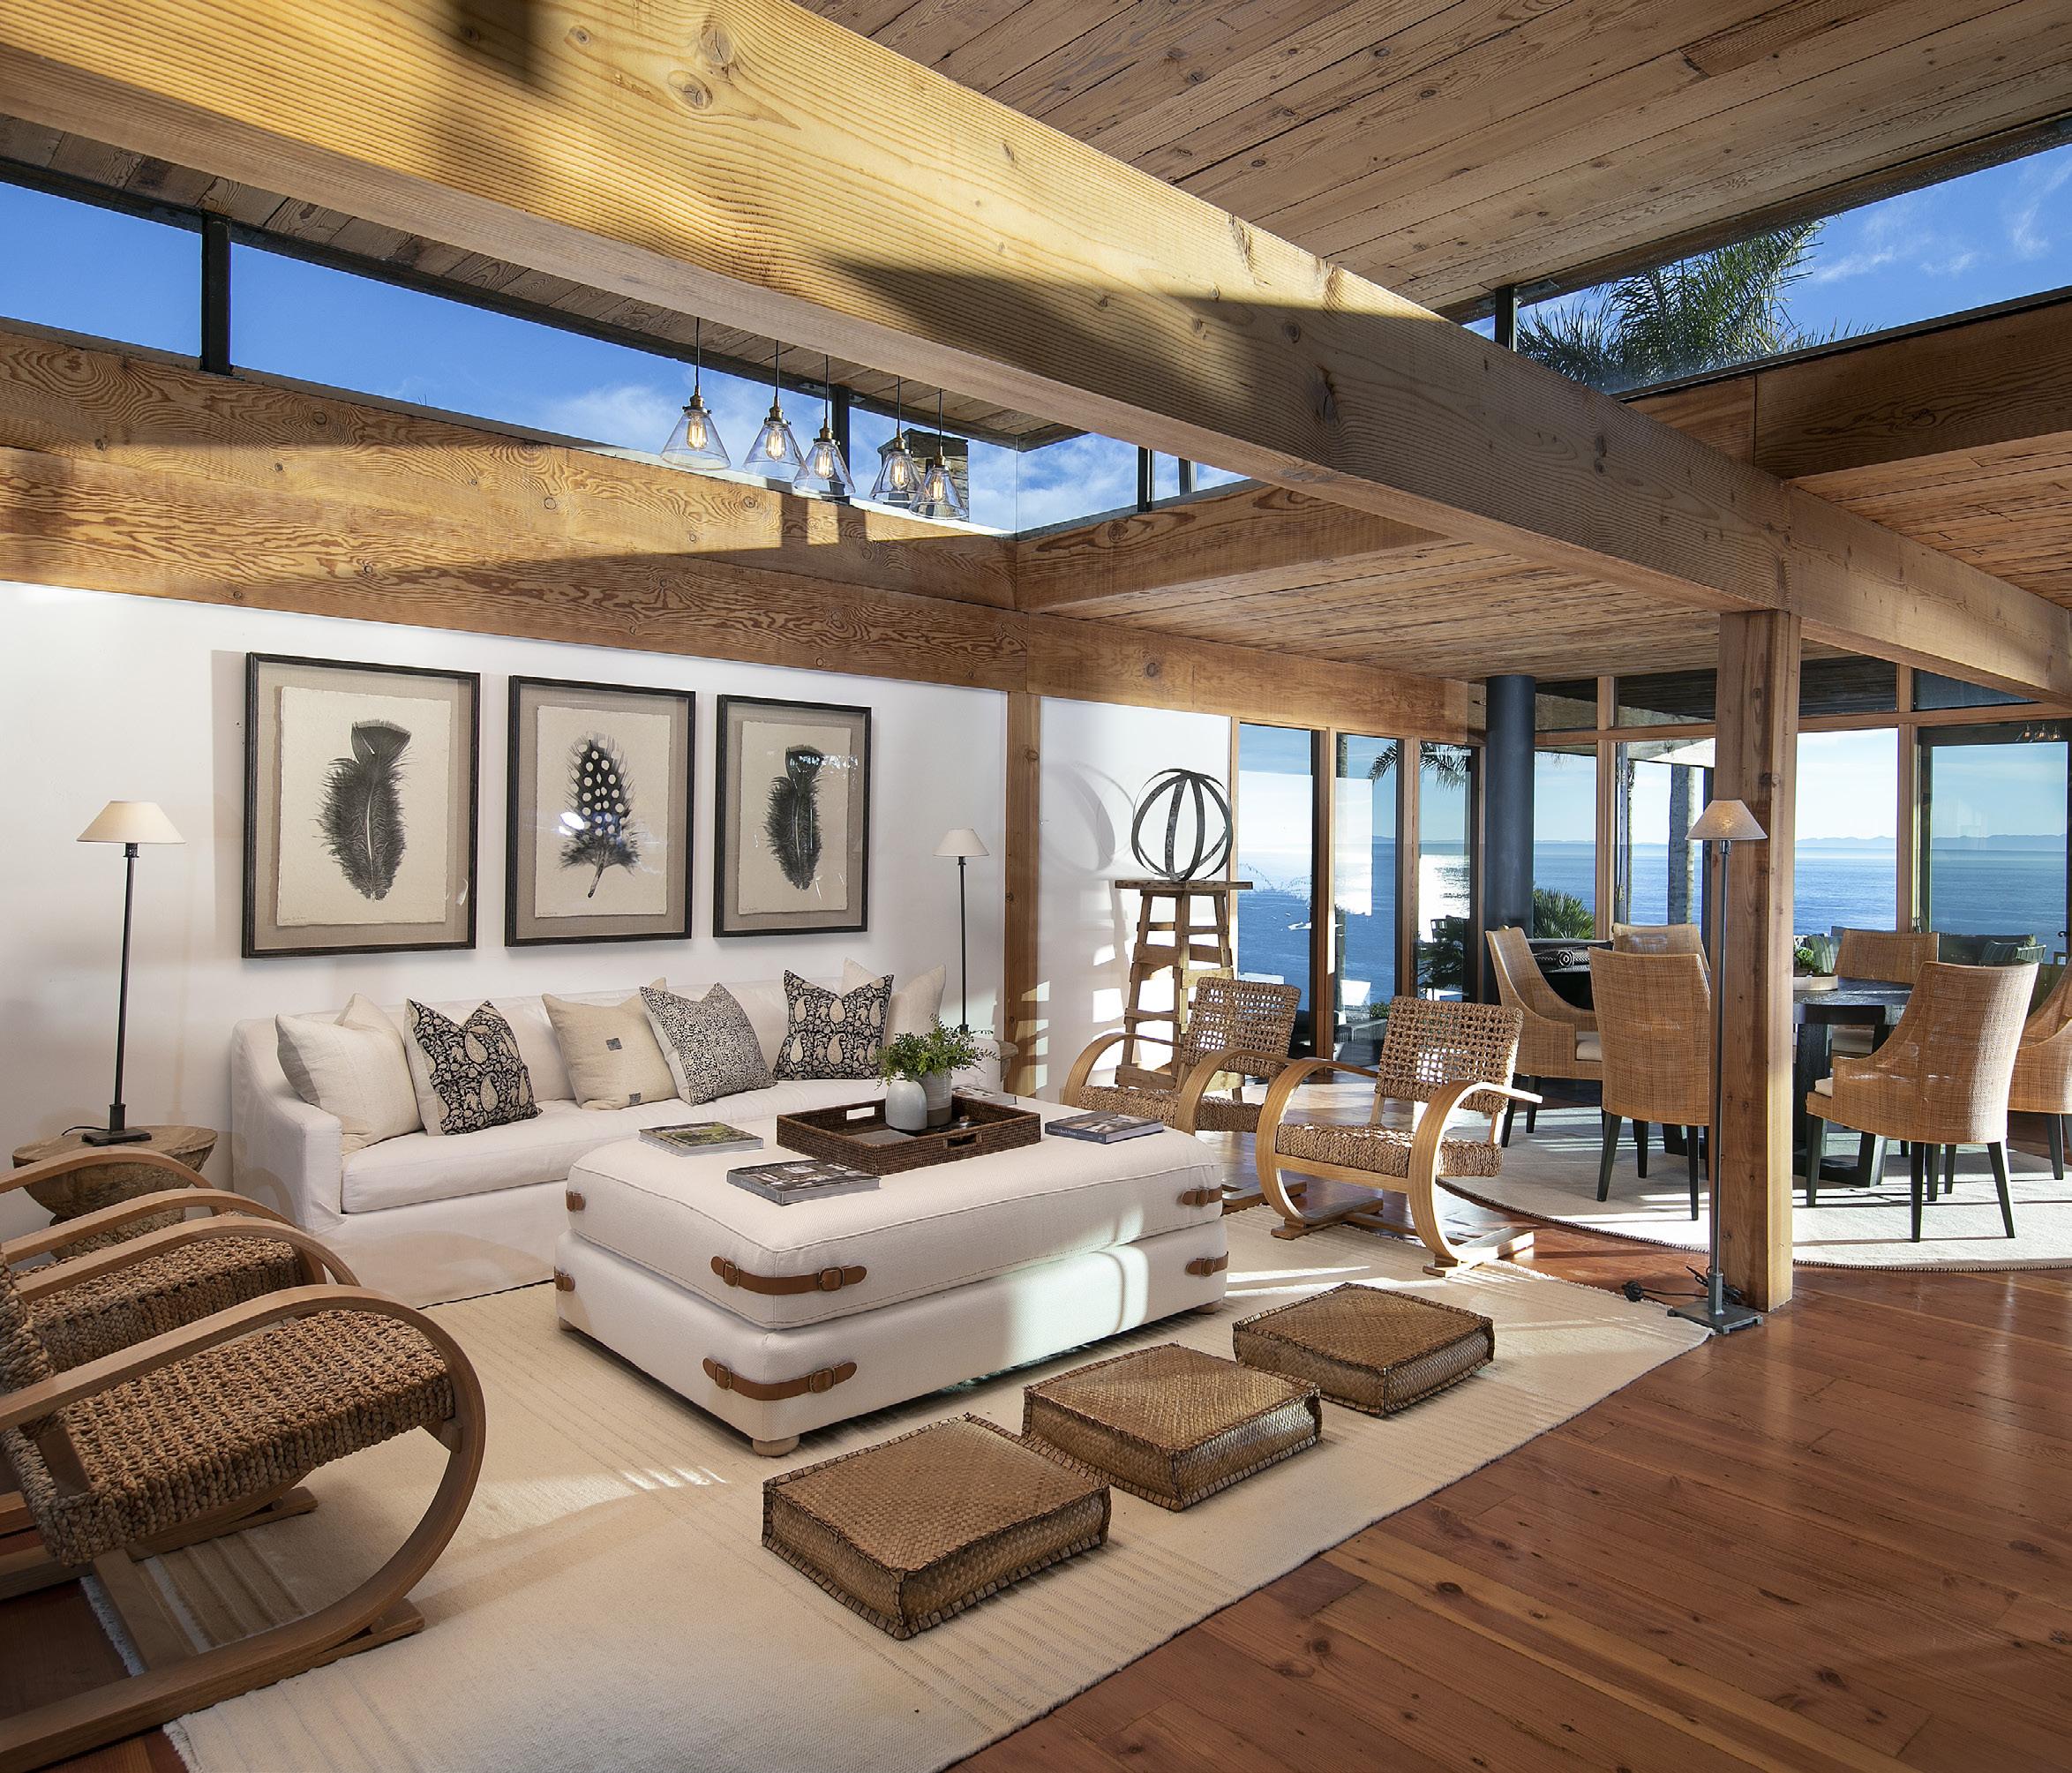
2 SOUTH SANTA BARBARA COUNTY MARKET REPORT | YEAR END REPORT 2021 3030 SEA CLIFF | SANTA BARBARA | OFFERED AT $11,995,000 happy 2022 YEAR END REPORT
Happy New Year! The real estate market was on a wild ride this past year and here are the highlights! Below is a 2021 YEAR END review of our Santa Barbara South County Real Estate Market which often brought frustration to buyers and opportunity to sellers. Read on for the numbers or zoom ahead for the stats and some properties that are currently available that we feel are good long term values.
Nationwide, home sales in 2021 reached the highest level in 15 years with an estimated 6 million homes changing hands. Homeowners/sellers saw average home prices skyrocket nearly 20% over 2020 according to the Federal Housing Finance Agency. The largest annual home price increase in the history of the agency’s House Price Index. And, in some hot markets, the price increase was DOUBLE that. That brings us back to our white hot market here in Santa Barbara/Montecito where we experienced an unprecedented level of home and condo sales last year. The lack of inventory combined with enthusiastic buyers created a frenzy that drove prices UP UP UP. Worth noting is the Median Sold price climbed to a remarkable $1,900,000 this year - 23% over 2020 and more than double from 10 years ago. The Average Sold price climbed 32% to $3,046,060 and the total dollar volume ended up at $4.4± billion in homes sold. This number is 43% higher than 2020. We are delighted to say that Compass contributed approximately 30% to that final number and we are personally grateful to all of you who have trusted us with this very important decision.
Other 2021 Trends + Highlights:
• Inventory of properties shrank while demand increased
• Lack of inventory could not keep up with demand and prices rose even higher
• Multiple offers were expected with many properties getting 10 or more offers
• Record number of properties sold over the asking price
• 58 homes sold for over $10 million which topped the current 2020 record of 28 sales, Normally, we see fewer than 10 properties selling for over $10 million
• Buyers were pulling out all the stops by offering a quick close, shortened or no contingencies, free rent backs and more to beat out their competition
• Mortgages rates were historically low (but predicted to rise this year)
• Inflation hit a 40 year-high
So what’s next . . . there are many predictions out there but so far we can tell you that if the current low inventory continues, home prices will keep rising and sellers will be able to continue to demand premium prices. This does not mean you buyers should sit this one out - buyers who like to “watch and wait” will miss out on these historically low interest rates. Not listing means you won’t sell at these historic prices and not making an offer means you won’t get the house! Some of our buyers say they don’t want to get in a bidding war. Well that makes sense if you want to buy a house that nobody else wants!
As we wait to see what 2022 brings - email us back and let us know what your predictions are!
Choose Experience . . .
3
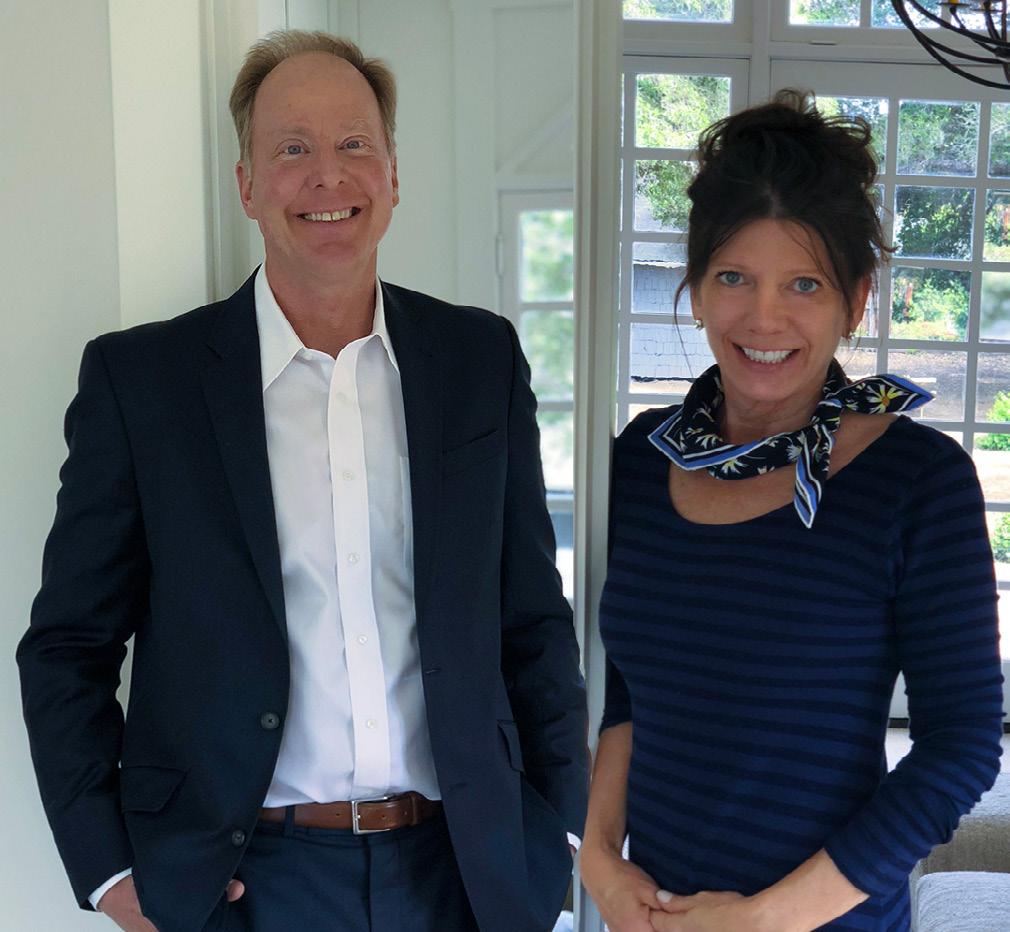
Randy and Molly
4 SOUTH SANTA BARBARA COUNTY MARKET REPORT | YEAR END REPORT 2021 BANDIT | SATISFYING SUNSET SCENES | 3030 SEA CLIFF
5 - southSANTA BARBARA COUNTY DECEMBER 2021 | IN REVIEW Single Family Residences (SFR) + Condominiums (combined sales) TOTAL SALES 2216 5% increase over 2020 AVERAGE SALES PRICE 24% increase over 2020 $2,415,863 MEDIAN SALES PRICE 24% increase over 2020 $1,492,500
6 SOUTH SANTA BARBARA COUNTY MARKET REPORT | YEAR END REPORT 2021
JANUARY OUTDOOR LIVING | SANTA BARBARA STYLE
7 - southSANTA BARBARA COUNTY SINGLE FAMILY RESIDENCES YTD TOTAL SALES 3% increase over 2020 1541 AVERAGE SALES PRICE 28% increase over 2020 $3,020,316 MEDIAN SALES PRICE 24% increase over 2020 $1,875,000 CONDOMINIUM HOMES YTD TOTAL SALES 8% increase over 2020 675 AVERAGE SALES PRICE 16% increase over 2020 $1,035,918 MEDIAN SALES PRICE 11% increase over 2020 $840,000 YEAR END REPORT 2021 | IN REVIEW Single Family Residences + Condominiums (separated sales)
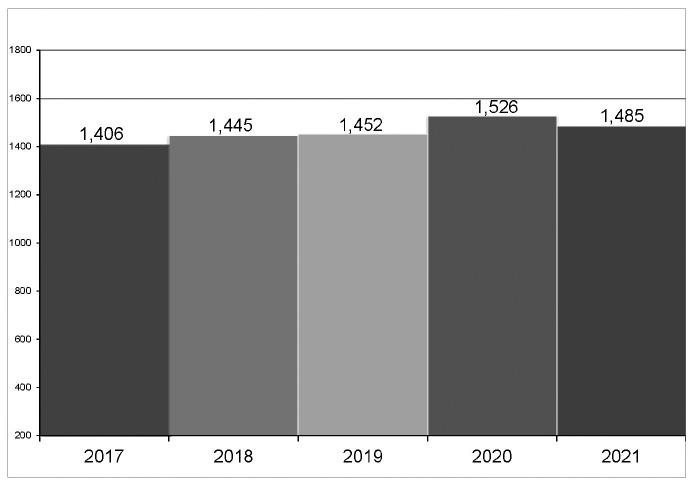
8 SOUTH SANTA BARBARA COUNTY MARKET REPORT | YEAR END REPORT 2021 - homes | estates | pudsTOTAL UNITS SOLD YTD 2017—2021
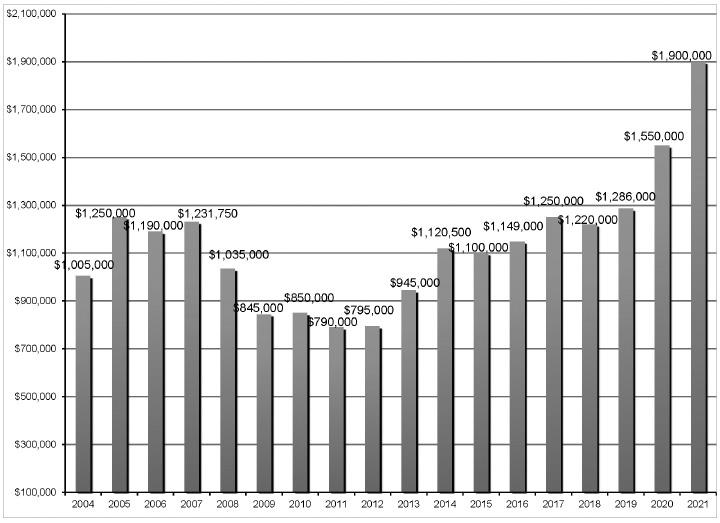
9 - homes | estates | pudsMEDIAN SALES PRICE YTD 2004—2021
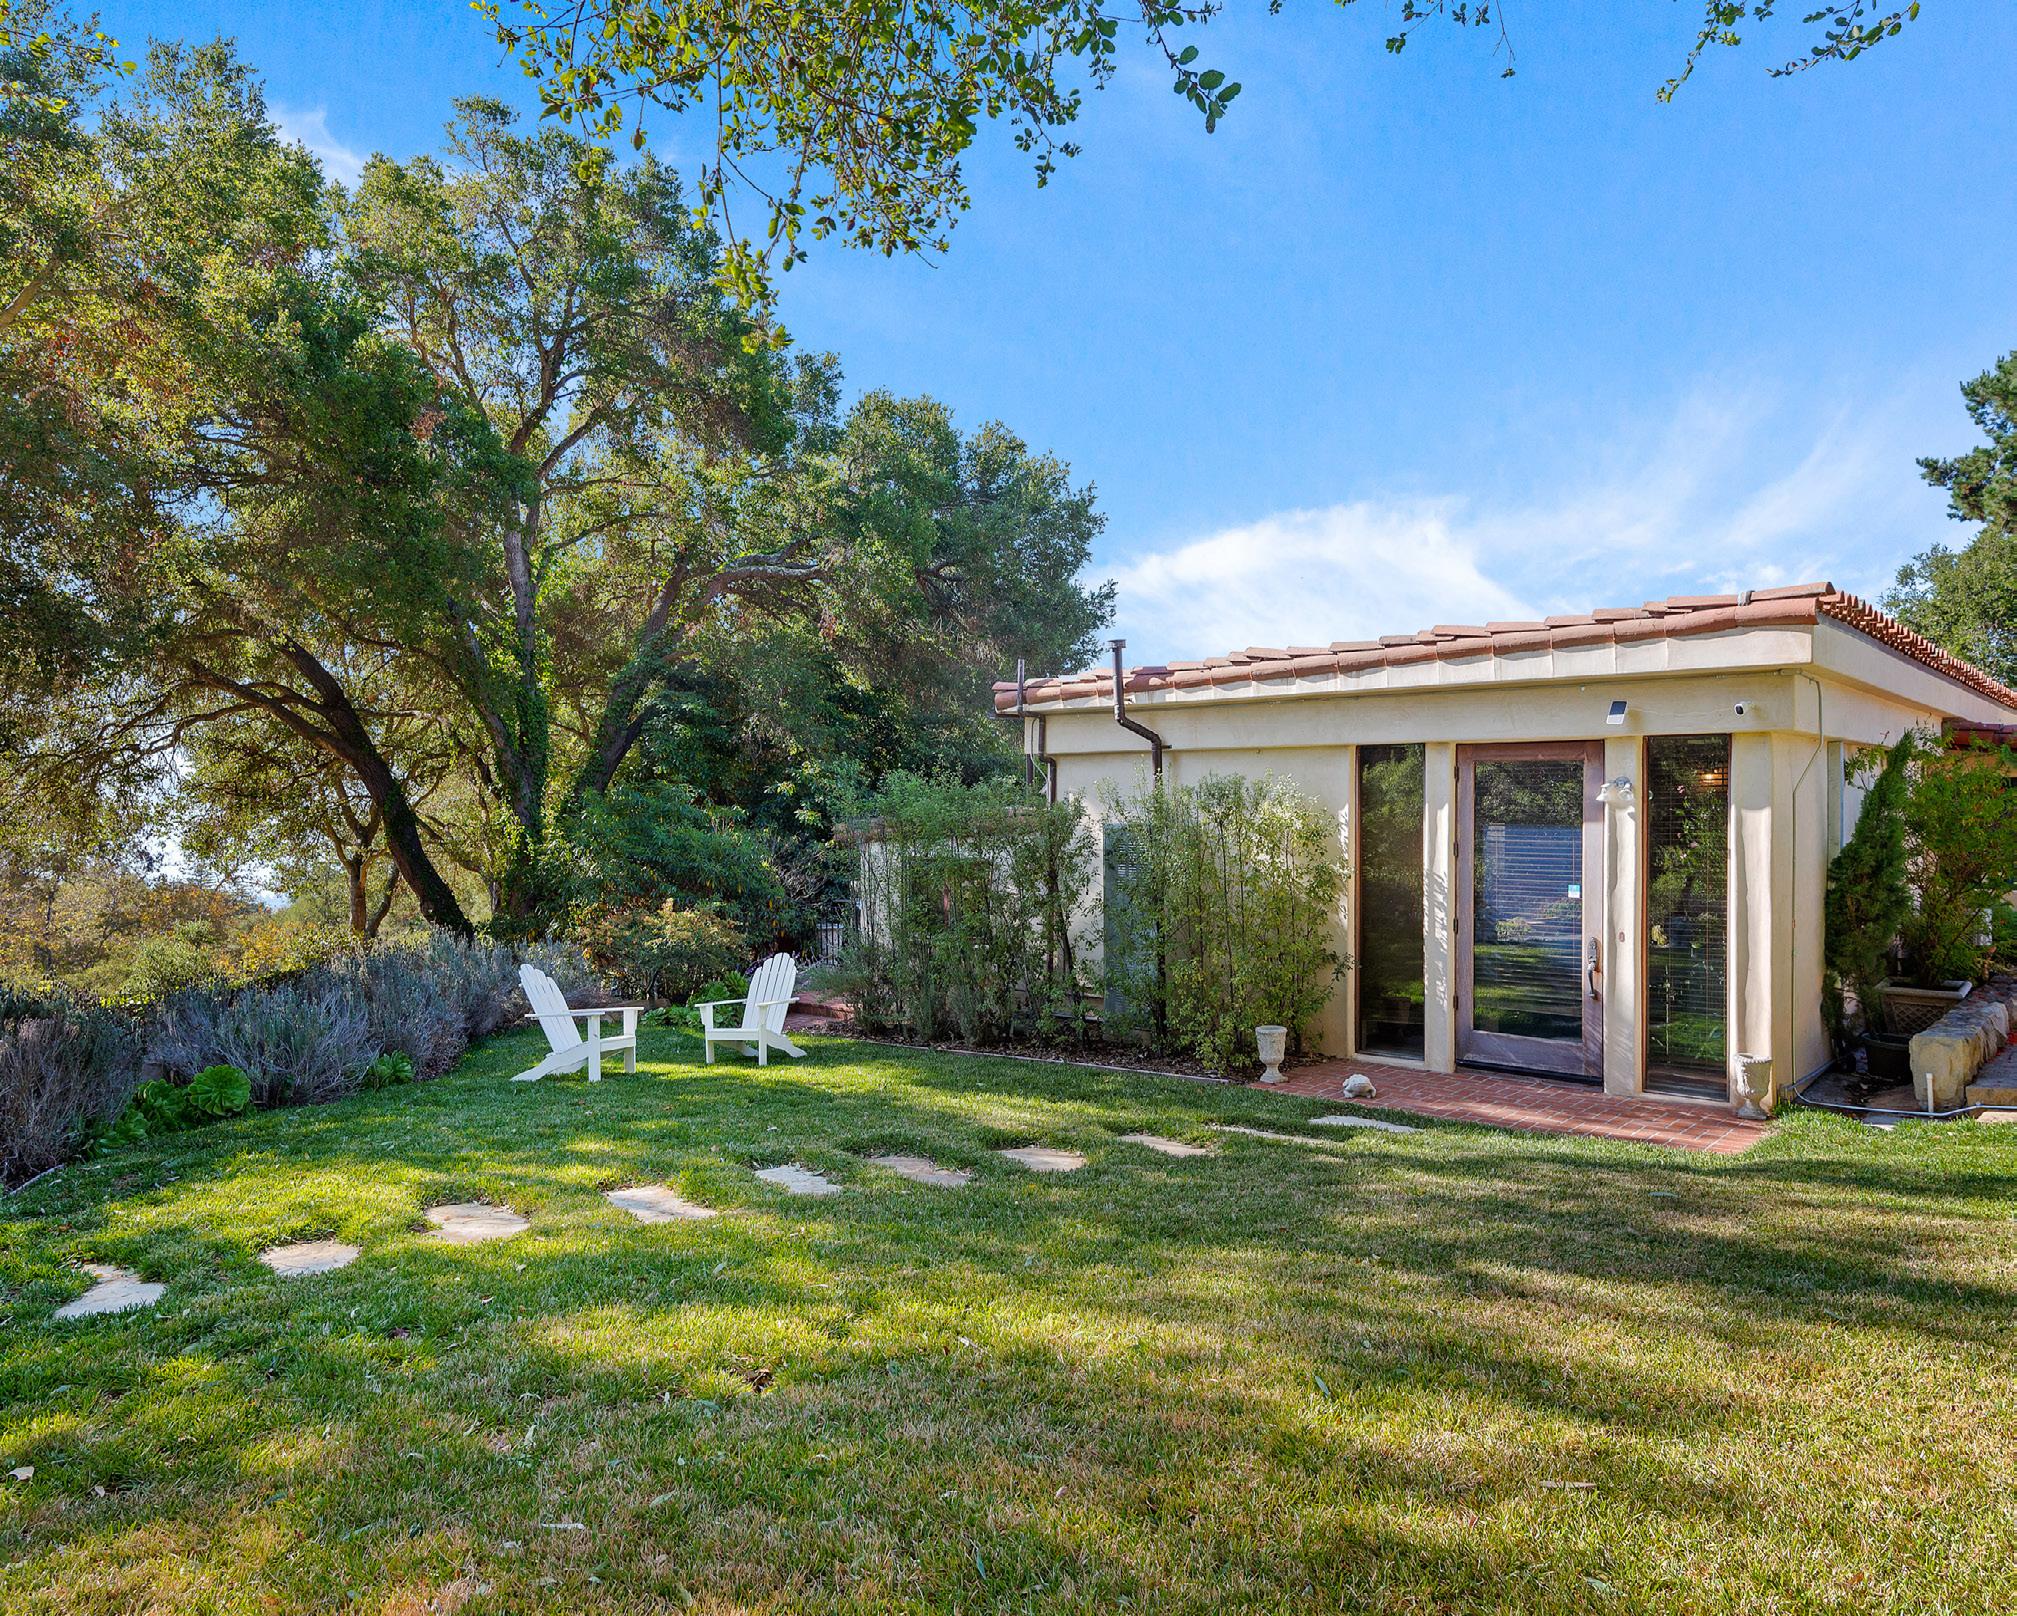
10 SOUTH SANTA BARBARA COUNTY MARKET REPORT | YEAR END REPORT 2021 2825 HIDDEN VALLEY LANE | MONTECITO CA 93108 Two Separate Gated and Walled Building Sites | 1.12± Acres One: 900±SF 1BD/1BA Casita | Two: Flat Building Pad Offered at $2,999,000 Haden Homes Group Exclusive Listing
11 MONTECITO DECEMBER 2021 | IN REVIEW Single Family Residences (SFR) + Condominiums (combined sales) TOTAL SALES 18 AVERAGE SALES PRICE 38% increase from 2020 $6,464,722 MEDIAN SALES PRICE 38% increase from 2020 $4,112,500 HIGHEST SALES PRICE 1453 Bonnymede Drive Montecito CA 93108 $26,500,000 LOWEST SALES PRICE 1018 Fairway Rd Montecito CA 93108 $1,519,000 condo CLICK FOR REAL TIME MARKET DATA
— Robert Reffkin, Compass Founder/CEO

12 SOUTH SANTA BARBARA COUNTY MARKET REPORT | YEAR END REPORT 2021
BOATING OFF THE SANTA BARBARA COAST | SANTA BARBARA
We all know that Home Values have risen a HUGE amount during this time. But I believe that the VALUE of our home in our lives has risen even MORE .
13 SINGLE FAMILY RESIDENCES YTD TOTAL SALES -1% increase over 2020 329 AVERAGE SALES PRICE 25% increase over 2020 $6,265,675 MEDIAN SALES PRICE 27% increase over 2020 $4,589,000 CONDOMINIUM HOMES YTD TOTAL SALES 4% increase over 2020 54 AVERAGE SALES PRICE 33% increase over 2020 $1,035,918 MEDIAN SALES PRICE 22% increase over 2020 $1,912,500 YEAR END REPORT 2021 | IN REVIEW Single Family Residences + Condominiums (separated sales) MONTECITO
14 SOUTH SANTA BARBARA COUNTY MARKET REPORT | YEAR END REPORT 2021
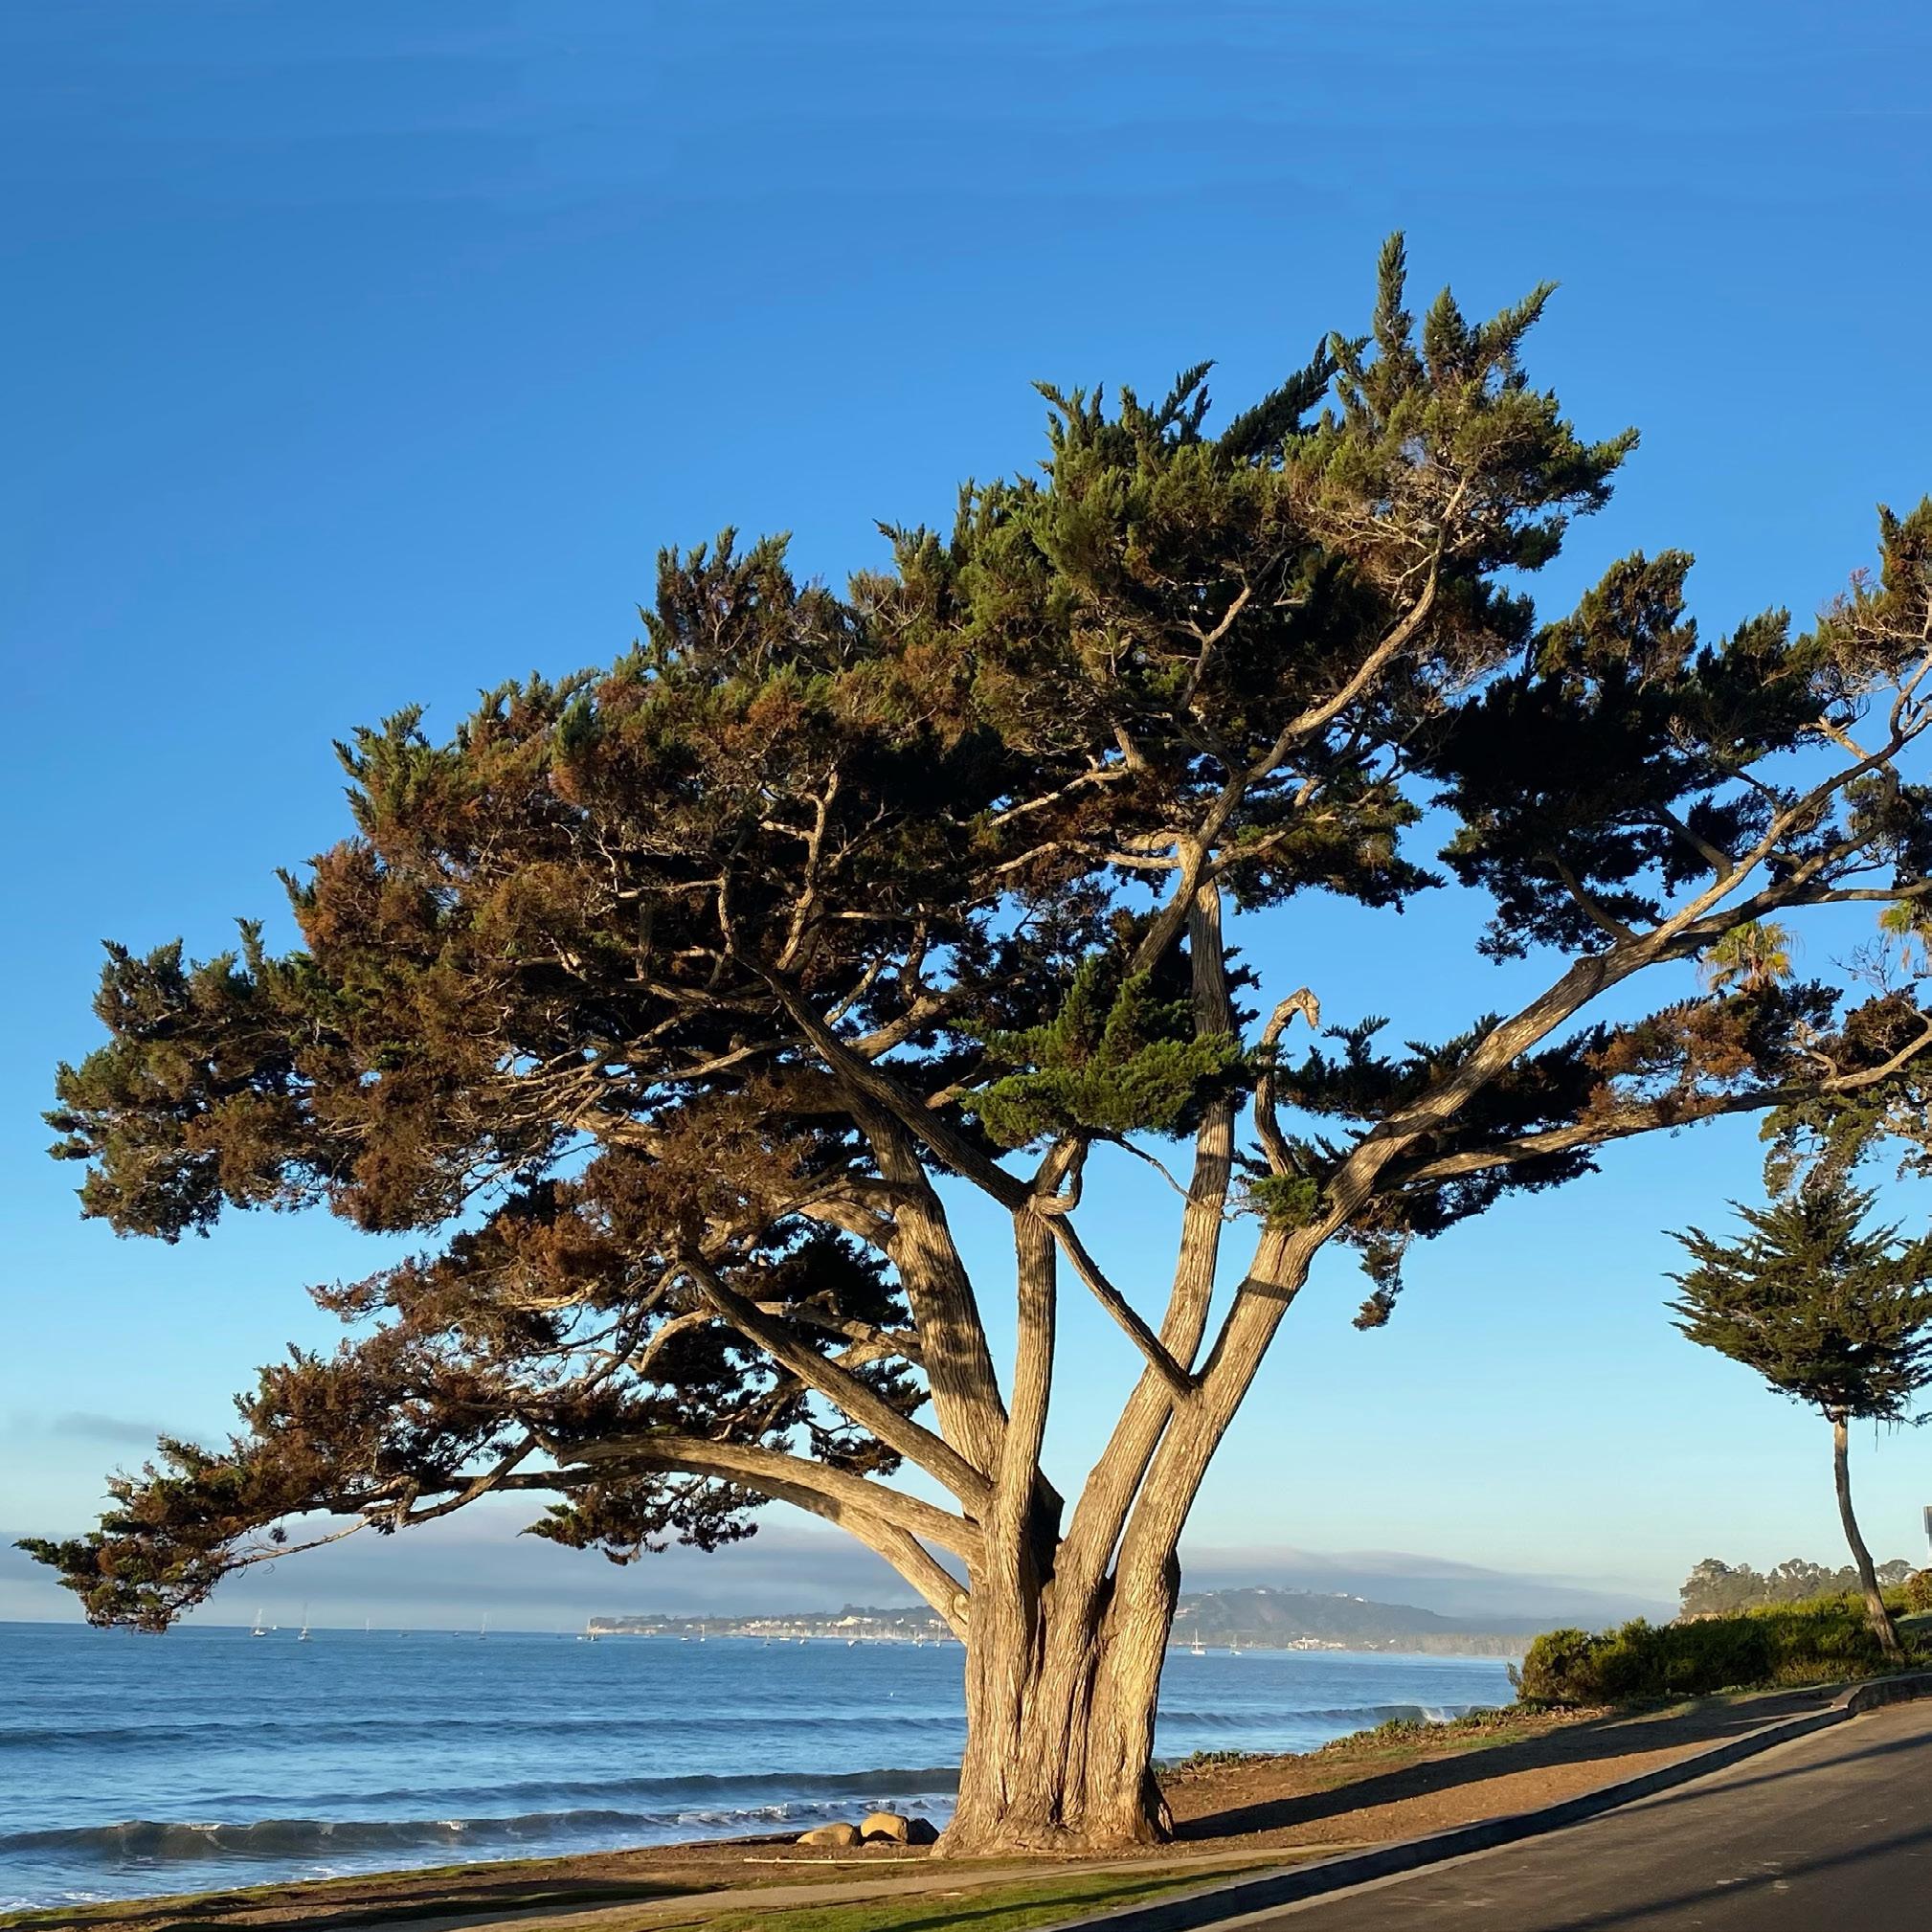
BUTTERFLY BEACH / CHANNEL DRIVE | MONTECITO
MONTECITO SALES | DECEMBER
Address List Price Sold Price % to List DOM
1453 Bonnymede Drive $28,000,000 $26,500,000 95% 9 370 Ortega Ridge Road $16,750,000 $16,000,000 95% 46 1188 East Mountain Drive $13,995,000 $11,800,000 84% 494 1460 Bonnymede Drive $10,695,000 $11,000,000 103% 1
1780 Glen Oaks Drive $6,295,000 $6,200,000 98% 62 1097 Golf Road $6,100,000 $5,800,000 95% 183 2150 10Acre Road $3,950,000 $4,200,000 106% 1 1177 Mesa Road $4,600,000 $4,140,000 90% 8 94 Humphrey Road $3,595,000 $4,125,000 115% 16 780 Ladera Lane $3,595,000 $4,100,000 114% 5 223 Rametto Road Off Market $4,050,000 100% 1 350 San Ysidro Road $3,775,000 $3,775,000 100% 1
792 Chelham Way $3,499,000 $2,900,000 83% 86 2795 East Valley Road $2,750,000 $2,750,000 100% 11 186 Coronada Circle $2,490,000 $2,750,000 110% 9 2775 East Valley Road $2,550,000 $2,550,000 100% 1 1370 Plaza De Sonadores Off Market $1,800,000 100% 1 1018 Fairway Road $1,519,000 $1,750,000 115% 5
* DOM = Days on Market
15
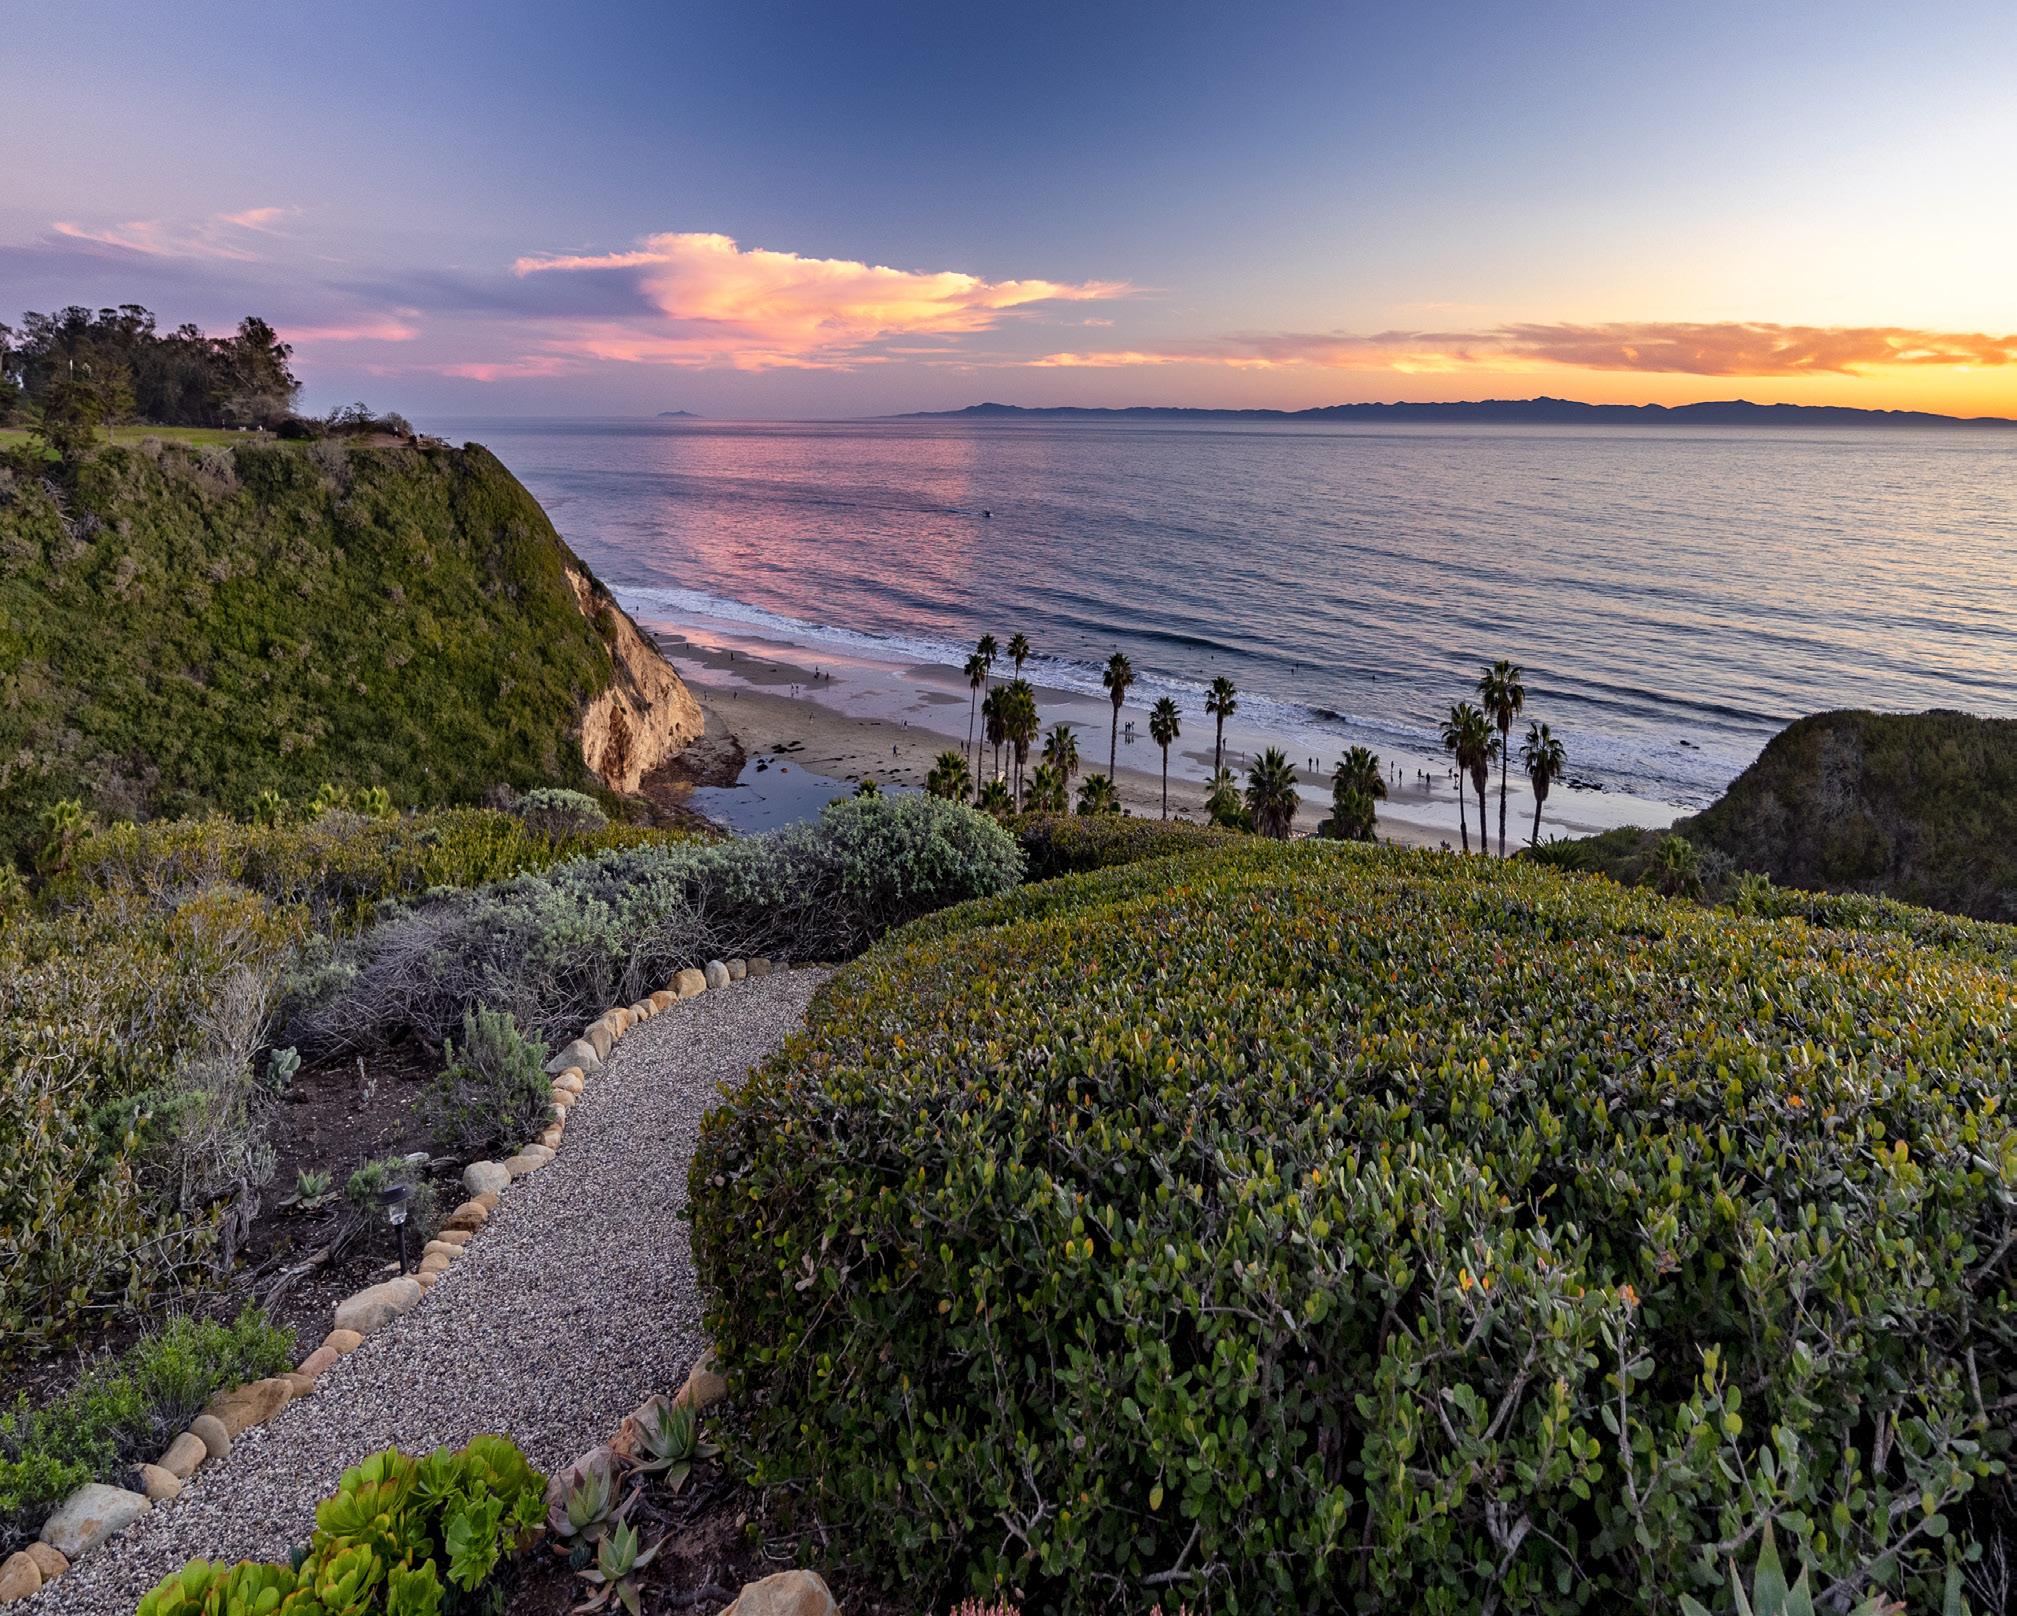
16 SOUTH SANTA BARBARA COUNTY MARKET REPORT | YEAR END REPORT 2021 3030 SEA CLIFF | SANTA BARBARA CA 93109 Unriveled Ocean + Coastline Views | Rex Lotery Designed Modern Home 32 BD | 2.5 BA | 2487± SF | 1.82± AC Offered at $11,995,000 Haden Homes Group Exclusive Listing
17 SANTA BARBARA DECEMBER 2021 | IN REVIEW Single Family Residences (SFR) + Condominiums (combined sales) TOTAL SALES 61 AVERAGE SALES PRICE 13% increase from 2020 $1,630,013 MEDIAN SALES PRICE 20% increase from 2020 $1,474,000 HIGHEST SALES PRICE 460 El Cielito Road Santa Barbara CA 93105 $7,000,000 LOWEST SALES PRICE 15 Fremont Lane Santa Barbara CA 93105 $299,000 CLICK FOR REAL TIME MARKET DATA
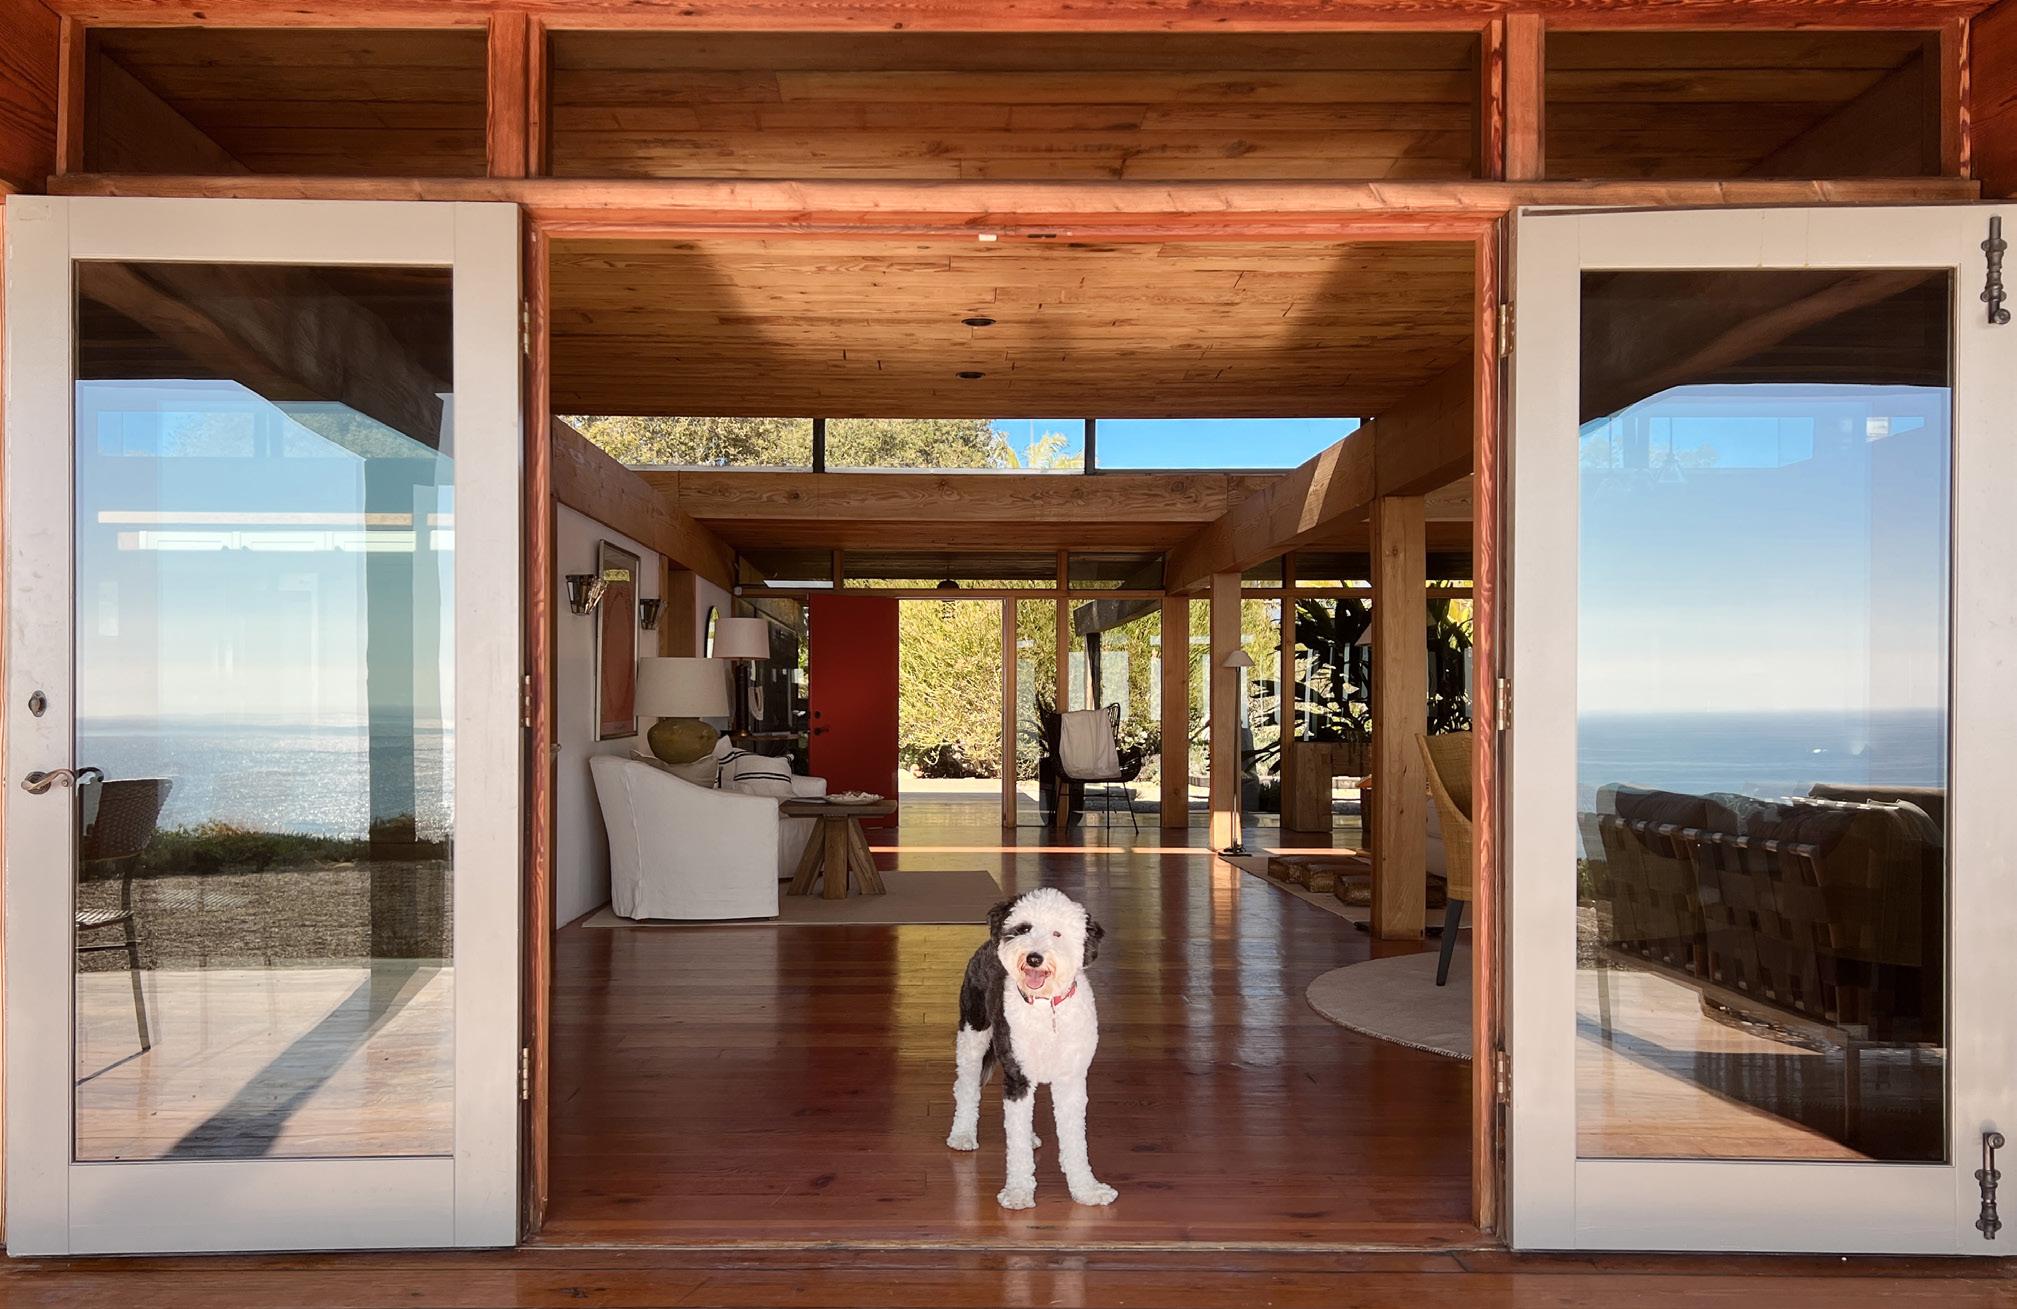
18 SOUTH SANTA BARBARA COUNTY MARKET REPORT | YEAR END REPORT 2021 BANDIT LOVES AN OPEN FLOOR PLAN | 3030 SEA CLIFF DID YOU KNOW | All Cash Sales Accounted For 28% Of The Transactions In December and 33% For All Of 2021 —Fidelity National Title Group-Santa Barbara
19 SINGLE FAMILY RESIDENCES YTD TOTAL SALES 2% increase over 2020 680 AVERAGE SALES PRICE 24% increase over 2020 $1,989,064 MEDIAN SALES PRICE 22% increase over 2020 $1,696,000 CONDOMINIUM HOMES YTD TOTAL SALES 1% increase over 2020 277 AVERAGE SALES PRICE 16% increase over 2020 $1,086,233 MEDIAN SALES PRICE 18% increase over 2020 $920,100 YEAR END REPORT 2021 | IN REVIEW Single Family Residences + Condominiums (separated sales) SANTA BARBARA

20 SOUTH SANTA BARBARA COUNTY MARKET REPORT | YEAR END REPORT 2021
ONE OF THE FEW PROPERTIES WITH STEPS TO THE SAND | HOPE RANCH
21 HOPE RANCH DECEMBER 2021 | IN REVIEW Single Family Residences (SFR) + Condominiums (combined sales) TOTAL SALES 2 AVERAGE SALES PRICE 8% increase from 2020 $4,100,000 MEDIAN SALES PRICE 48% increase from 2020 $4,100,000 HIGHEST SALES PRICE 4580 Via Huerto, Hope Ranch CA 93110 $5,500,000 LOWEST SALES PRICE 4004 Via Laguna Hope Ranch CA 93110 $3,395,000 CLICK FOR REAL TIME MARKET DATA
22 SOUTH SANTA BARBARA COUNTY MARKET REPORT | YEAR END REPORT 2021
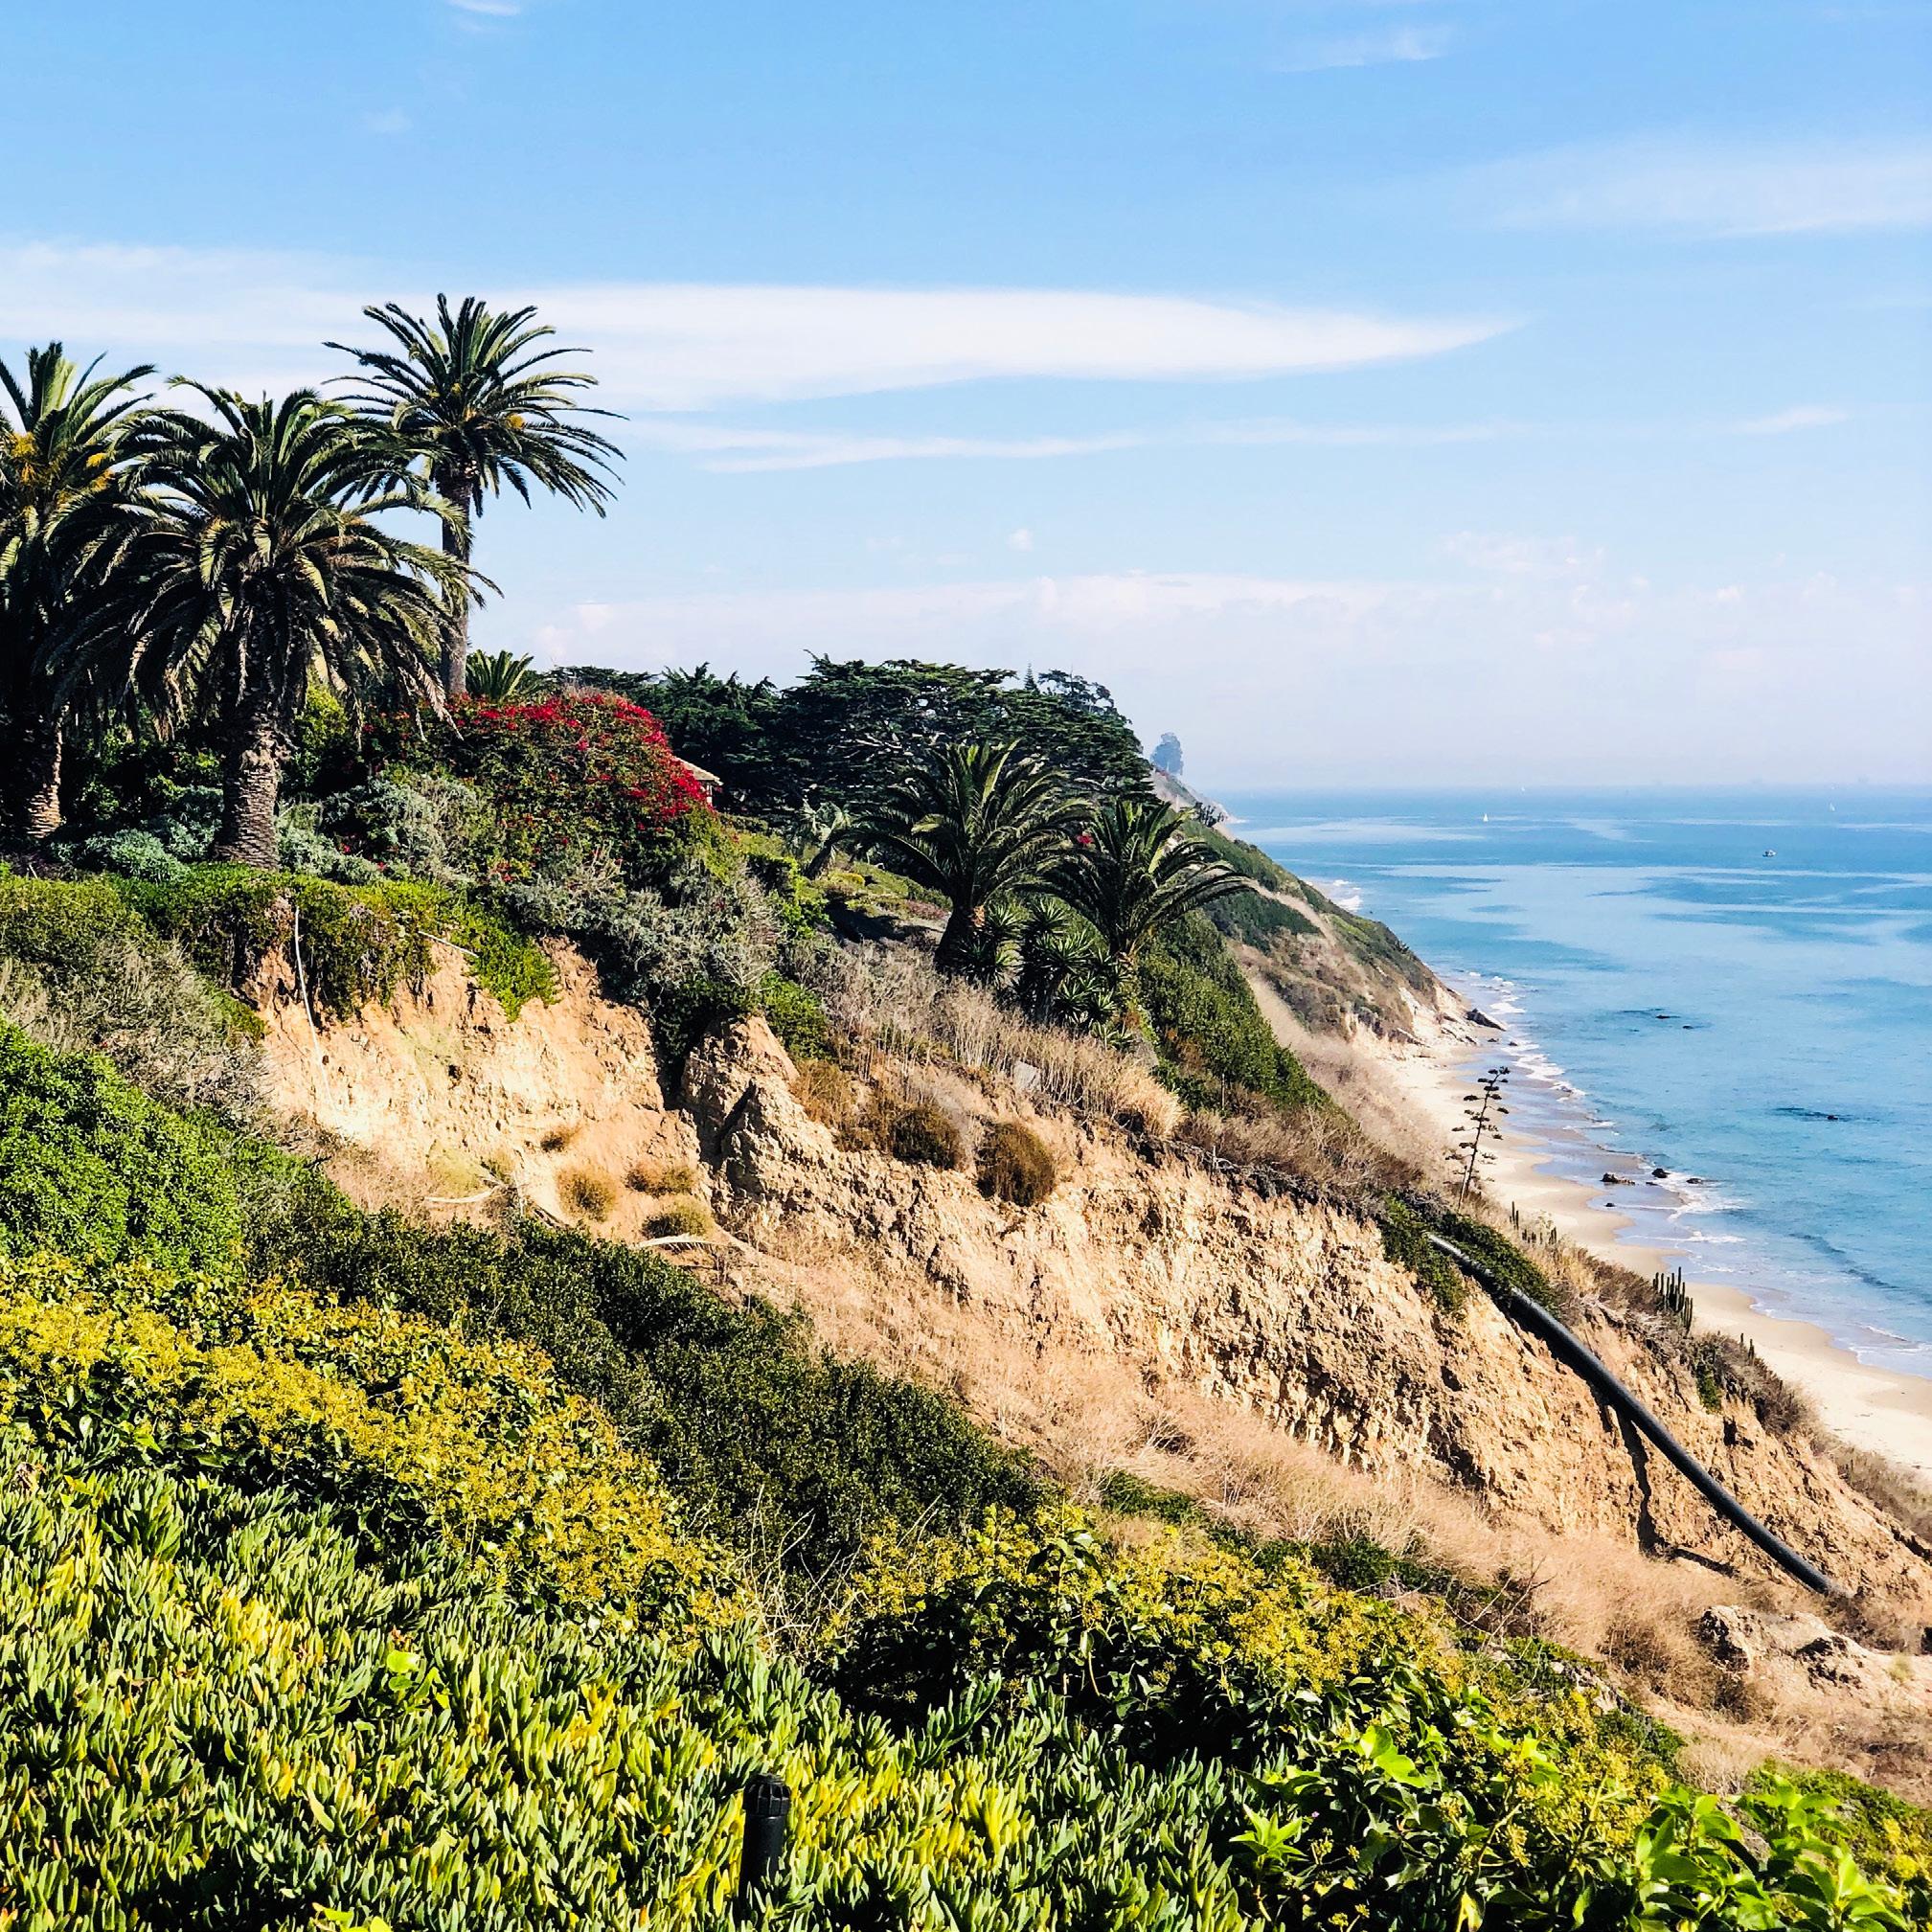
CLIFF TOP PROPERTY | HOPE RANCH
23 SINGLE FAMILY RESIDENCES YTD TOTAL SALES 44% increase over 2020 65 AVERAGE SALES PRICE 39% increase over 2020 $5,846,738 MEDIAN SALES PRICE 40% increase over 2020 $4,750,000 CONDOMINIUM HOMES YTD TOTAL SALES n/a% increase over 2020 n/a AVERAGE SALES PRICE n/a% increase over 2020 n/a MEDIAN SALES PRICE n/a% increase over 2020 n/a YEAR END REPORT 2021 | IN REVIEW Single Family Residences + Condominiums (separated sales) HOPE RANCH

24 SOUTH SANTA BARBARA COUNTY MARKET REPORT | YEAR END REPORT 2021
SUMMERLAND BEACH | DRIFTWOOD ABUNDANCE | SUMMERLAND
25
DECEMBER 2021 | IN REVIEW Single Family Residences (SFR) + Condominiums (combined sales) TOTAL SALES 0 AVERAGE SALES PRICE n/a% increase from 2020 n/a MEDIAN SALES PRICE n/a% increase from 2020 n/a HIGHEST SALES PRICE n/a LOWEST SALES PRICE n/a CLICK FOR REAL TIME MARKET DATA
SUMMERLAND
26 SOUTH SANTA BARBARA COUNTY MARKET REPORT | YEAR END REPORT 2021
SUMMERLAND BEACH | SUMMERLAND
27 SINGLE FAMILY RESIDENCES YTD TOTAL SALES -56% increase over 2020 17 AVERAGE SALES PRICE 71% increase over 2020 $4,686,804 MEDIAN SALES PRICE 39% increase over 2020 $2,999,000 CONDOMINIUM HOMES YTD TOTAL SALES 0% increase over 2020 2 AVERAGE SALES PRICE 27% increase over 2020 $1,225,000 MEDIAN SALES PRICE 27% increase over 2020 $1,225,000 YEAR END REPORT 2021 | IN REVIEW Single Family Residences + Condominiums (separated sales) SUMMERLAND
28 SOUTH SANTA BARBARA COUNTY MARKET REPORT | YEAR END REPORT 2021
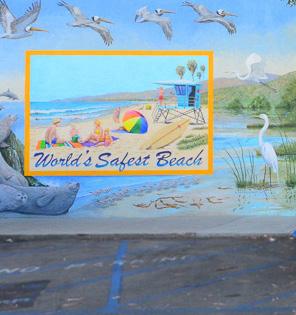
THE WORLD’S SAFEST BEACH | CARPINTERIA
29 CARPINTERIA DECEMBER 2021 | IN REVIEW Single Family Residences (SFR) + Condominiums (combined sales) TOTAL SALES 13 AVERAGE SALES PRICE -33% decrease from 2020 $911,462 MEDIAN SALES PRICE -19% decrease from 2020 $710,000 HIGHEST SALES PRICE 4177 Venice Lane Carpinteria CA 93013 $2,495,000 LOWEST SALES PRICE 3950 Via Real, #163 Santa Barbara CA 93013 $439,000 manufactured home CLICK FOR REAL TIME MARKET DATA
30 SOUTH SANTA BARBARA COUNTY MARKET REPORT | YEAR END REPORT 2021
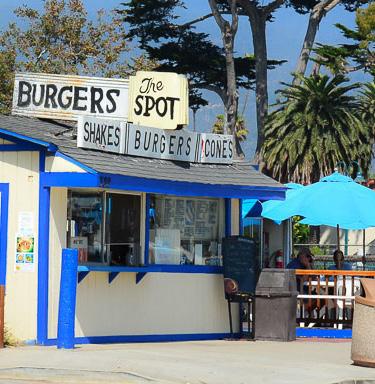
THE SPOT | BEST BURGERS + ONION RINGS | CARPINTERIA
31 SINGLE FAMILY RESIDENCES YTD TOTAL SALES -4% increase over 2020 82 AVERAGE SALES PRICE 33% increase over 2020 $2,462,573 MEDIAN SALES PRICE 30% increase over 2020 $1,400,000 CONDOMINIUM HOMES YTD TOTAL SALES 8% increase over 2020 137 AVERAGE SALES PRICE 11% increase over 2020 $814,164 MEDIAN SALES PRICE 13% increase over 2020 $700,000 YEAR END REPORT 2021 | IN REVIEW Single Family Residences + Condominiums (separated sales) CARPINTERIA
32 SOUTH SANTA BARBARA COUNTY MARKET REPORT | YEAR END REPORT 2021
MONARCH BUTTERFLY HABITAT | GOLETA
33 GOLETA DECEMBER 2021 | IN REVIEW Single Family Residences (SFR) + Condominiums (combined sales) TOTAL SALES 44 AVERAGE SALES PRICE 39% increase from 2020 $1,355,511 MEDIAN SALES PRICE 31% increase from 2020 $1,212,500 HIGHEST SALES PRICE 1121 Via Del Rey Goleta CA 93117 $4,495,000 LOWEST SALES PRICE 5516 Armitos Avenue, Unit 69 Goleta CA 93117 $379,000 condo CLICK FOR REAL TIME MARKET DATA

34 SOUTH SANTA BARBARA COUNTY MARKET REPORT | YEAR END REPORT 2021
SANTA BARBARA SHORES COUNTY PARK | GOLETA
35 SINGLE FAMILY RESIDENCES YTD TOTAL SALES 13% increase over 2020 368 AVERAGE SALES PRICE 28% increase over 2020 $1,572,534 MEDIAN SALES PRICE 24% increase over 2020 $1,300,000 CONDOMINIUM HOMES YTD TOTAL SALES -4% increase over 2020 205 AVERAGE SALES PRICE 13% increase over 2020 $786,549 MEDIAN SALES PRICE 2% increase over 2020 $751,000 YEAR END REPORT 2021 | IN REVIEW Single Family Residences + Condominiums (separated sales) GOLETA

36 SOUTH SANTA BARBARA COUNTY MARKET REPORT | YEAR END REPORT 2021 1990 TULAROSA ROAD | LOMPOC CA 93436 Prestigious Santa Ynez Valley AVA | Sweeping Mountain + Valley Views Rare Opportunity |40± Acres | Zoned RR-10 | Possible 4 Parcels Existing Home | 1529± SF | 5000± SF Warehouse Offered at $2,499,000 Haden Homes Group Exclusive Listing
37 SANTA YNEZ VALLEY DECEMBER 2021 | IN REVIEW Single Family Residences (SFR) + Condominiums (combined sales) TOTAL SALES 31 - SINGLE FAMILY HOMESAVERAGE SALES PRICE -1% decrease from 2020 $1,972,182 MEDIAN SALES PRICE 24% increase from 2020 $1,182,500 CLICK FOR REAL TIME MARKET DATA
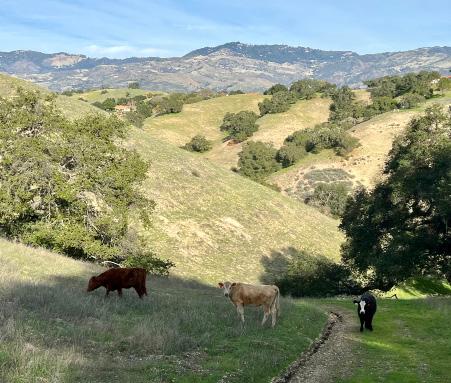
38 SOUTH SANTA BARBARA COUNTY MARKET REPORT | YEAR END REPORT 2021 0000 LONG VALLEY ROAD | SANTA YNEZ CA 93460 Prestigious Woodstock Ranch | Sweeping Vista Views 18.53± AC | Endless Possibilities for Ranch/Vineyard/Family Estate Offered at 999,000 Haden Homes Group Exclusive Listing
39 SINGLE FAMILY RESIDENCES YTD TOTAL SALES -4% increase over 2020 266 AVERAGE SALES PRICE 2% increase over 2020 $1,607,364 MEDIAN SALES PRICE 25% increase over 2020 $1,236,000 CONDOMINIUM HOMES YTD TOTAL SALES 15% increase over 2020 45 AVERAGE SALES PRICE 15% increase over 2020 $582,244 MEDIAN SALES PRICE 22% increase over 2020 $610,000 YEAR END REPORT 2021 | IN REVIEW Single Family Residences + Condominiums (separated sales) SANTA YNEZ VALLEY
DISCRETION
Privacy is the Ultimate Commodity andthe Decision to Sell Your Home is a Personal One.
FLEXIBILITY
Decide When to Share Details About Your Home - Including PriceMore Expansively On Your Own Timing.
QUALITY
Exclusive Exposure To Compass Agents, Including Premium Placements On Agent Facing Platform.

VALUE
Get the Best Offer Testing The Market Privately to Gather Insights Without Your Listing Getting Stale Overexposed.
40 SOUTH SANTA BARBARA COUNTY MARKET REPORT | YEAR END REPORT 2021


by Market Key Your Stale or COMPASS PRIVATE EXCLUSIVE LISTINGS Ask Us About Our Exciting Private Exclusive Listings | Contact Us Live For details! ONE | Unmatched Ocean Views in a Fantastic Santa Barbara Location. Enjoy the Existing Contemporary home or Create Your Own Legacy Estate. Privately Offered at $11,995,000 TWO | 40 Prime Acres in the Santa Rita Hills AVA. Vineyard/Ranch/Family Compound. Zoned RR10 and sub-dividable into four 10 acres parcels. Privately Offered at $2,495,000 A Compass Private Exclusive listing is an off-market home that can be shared by a Compass agent directly with their colleagues and their buyers. Property details are not disseminated widely and won’t appear on public home search websites. Listing your home as a private exclusive allows you to control what information is shared about you and your home while still getting exposure to top agents at Compass.


42 SOUTH SANTA BARBARA COUNTY MARKET REPORT | YEAR END REPORT 2021 RANDY HADEN | MOLLY HADEN DRE 01988499 | DRE 02020380 805.880.6530 | 805.880.6540 randy.haden@compass.com molly@hadenhomes.com LET’S CONNECT www.hadenhomes.com @hadenhomesrealtors 1% Top 1% of Agents CHOOSE experience


