

December 2023 and YEAR END REPORT
market report december 2023 | haden homes luxury property group/compass | montecito
south SANTA BARBARA COUNTY Residential Real Estate Market Report

December 2023 and YEAR END REPORT
2 SOUTH SANTA BARBARA COUNTY MARKET REPORT | DECEMBER 2023
Happy New Year
Hello Family and Friends -
Will home sellers and buyers cheer in the New Year? Time will tell but we anticipate a very interesting 2024! Here‘s a look at what happened in anticipation for what’s ahead . . . let‘s review the key highlights from the Montecito and South Santa Barbara County 2023 real estate market and explore the outlook for the year ahead.
Throughout 2023, there were still more buyers than sellers here in Montecito and Santa Barbara. Many buyers came from Los Angeles, the Bay Area and other densely populated areas looking to find their forever home and often a second home sanctuary. While the market has cooled nationwide, the demand to live in our special coastal enclave remains strong and we can confidently say that people who can afford to live anywhere choose to make our community home.
Overall, the persistent challenging lack of inventory, rising mortgage rates and market uncertainty; partly driven by broader economic conditions; have been a significant part of what drove the market last year, leading to a more hesitant approach to real estate transactions. We ended the year with only 1105 properties trading in South Santa Barbara County (-25% over 2022) and 167 trading in Montecito (-20% over 2022). This decline in sales is significant when considering the 35% decline in 2022 over the previous year. Total sales in 2023 was the lowest historically reported, matching 2008 sales during the housing market collapse.
This doesn’t tell the entire story for our area because strong buyer demand for the limited available properties is keeping asking prices ambitious and closing prices high—evidenced by the “sold to original list price” at 98% for the entire area and nearly 100% for Montecito when including off market sales. The median sales price in all areas remained level with literally 0% change over 2022. If the low inventory continues, we expect to see a similar trend moving forward.
Sellers | We still have many qualified and enthusiastic buyers looking for quality homes who are ready to make a buying decision. If you are thinking of selling within the next few months, we have never seen a better time to capitalize on the potential equity in your property. Although we are seeing that the “panic buying” during the pandemic is over, homes priced correctly are still receiving multiple offers and often at or over the asking price. Reach out to discuss what this means for your property in this market.
Buyers | Many economists agree that real estate is the best hedge against inflation and a home is an incredible investment that you can also live in. There are still good values out there and we focus on properties that hold their value regardless of what is happening with real estate and the economy. It would be our privilege to help you make a good long term investment decision.
In this highly competitive market—experience matters. We offer extensive market knowledge, world-class marketing and concierge level professional service with complete confidentiality to our clients. Our proven track record of success includes skills necessary to put complicated deals together and negotiate the price and terms that will get your home sold for a premium price and offer accepted on your replacement property—even amongst multiple offers.
Looking for professional + creative results-oriented representation - Let’s Talk!
3
and Molly
Randy
Year!
2023 YEAR END REAL ESTATE INSIGHTS
one

two
CASH BUYERS | The number of cash buyers is remarkable and continues to amaze even the most seasoned real estate professionals. During 2023, cash buyers in the entire Santa Barbara area made up 41% of the total 1105 sales with 12% of them trading off market. In Montecito, an unprecedented 59% of the 167 sales were cash transactions with 20% of them trading off market. We see buyers armed with cash and ready to buy. We also continue to receive multiple bids on properties that are priced correctly. Buyers now are making thoughtful decisions so it is even more important than ever to price your home to attract the most buyers and get the best possible price.
OFF MARKET | Up to 20% of sales traded off market in 2023. We network extensively with other top agents and have been successful in putting many deals together privately. Regardless if you are buying or selling, we encourage you to reach out to discuss your real estate goals and learn about our Compass Private Exclusive program which are offerings we can share directly with our clients BUT these homes will not appear on public search sites (Zillow/Redfin, etc,). This provides the opportunity for homeowners to sell discreetly and buyers to purchase a property before it is offered publicly and avoid competition.
three
WHAT’S AHEAD IN 2024 | If the trend of dramatically low inventory continues, we can expect similar remarkable sales prices given the elevated demand to live in our area For buyers looking for financing, many eyes are optimistically on interest rates which could unlock pent-up demand.. With the Fed signaling rate reductions in 2024, we expect this market to respond favorably and sales activity rebounding. If sales volume increases, prices may adjust accordingly.
click for 2023
Year End Report
4 SOUTH SANTA BARBARA COUNTY MARKET REPORT | DECEMBER 2023

Some Agents Know The Market
Good Agents Understand The Market
Exceptional Agents Can Explain The Market
- read on . . .
5
RANDY/MOLLY
- bio -
TOTAL SALES 2023 | In Review
Single Family Homes + Condominiums
-23% change over 2022 (1443 total sales)
1105
SINGLE FAMILY HOMES
TOTAL YTD SALES
-24% change over 2022
773
AVERAGE SALES PRICE
-5% change over 2022
$3,196,512
MEDIAN SALES PRICE
0% change over 2022
$2,100,000
CONDOMINIUM HOMES
TOTAL YTD SALES
-22% change over 2022
332
AVERAGE SALES PRICE
+3% change over 2022
$1,237,909
MEDIAN SALES PRICE
-1% change over 2022
$94,000
6 SOUTH SANTA BARBARA COUNTY MARKET REPORT | DECEMBER 2023 - south -
SANTA BARBARA COUNTY
SANTA BARBARA COUNTY
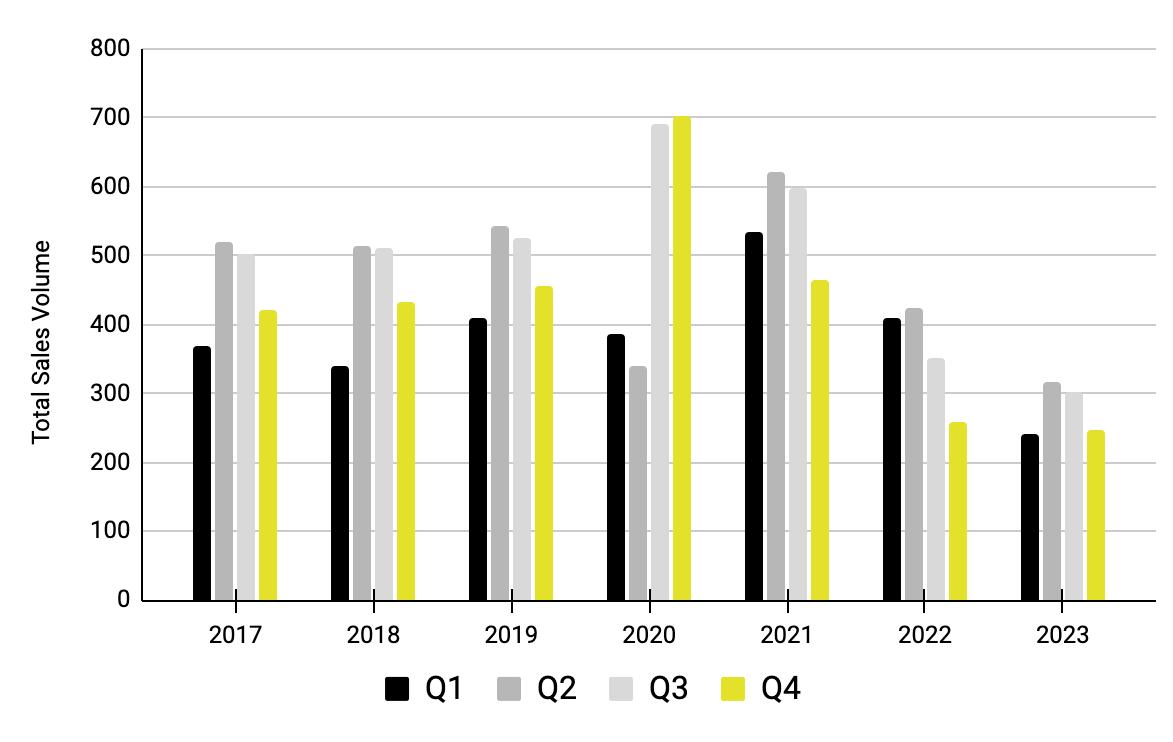
- homes | estates | puds | condosQUARTERLY SALES VOLUME COMPARISON
7 Year Trend | 2017 — 2023
7
south
-
-

8 SOUTH SANTA BARBARA COUNTY MARKET REPORT | DECEMBER 2023 BANDIT MADE THE “NICE LIST” AGAIN THIS YEAR | MONTECITO COUNTRY MART
DECEMBER 2023 | In Review
Single Family Homes + Condominiums +1% change over 2022
77
SINGLE
TOTAL
AVERAGE
51
-47% increase over 2022
$2,638,197
MEDIAN SALES PRICE
-10% increase over 2022
$1,895,000
CONDOMINIUM HOMES
TOTAL SALES
change over 2022
26
AVERAGE SALES PRICE -2% change over 2022
$1,106,085
MEDIAN SALES PRICE
change over 2022
$875,000
9 - south -
AVERAGE DAY ON MARKET 24 SOLD TO ORIGINAL LIST PRICE 98%
SANTA BARBARA COUNTY
+44%
-8%
AVERAGE DAY ON MARKET 30 SOLD TO ORIGINAL LIST PRICE 95%
FAMILY
HOMES
SALES
change
-12%
over 2022
SALES PRICE
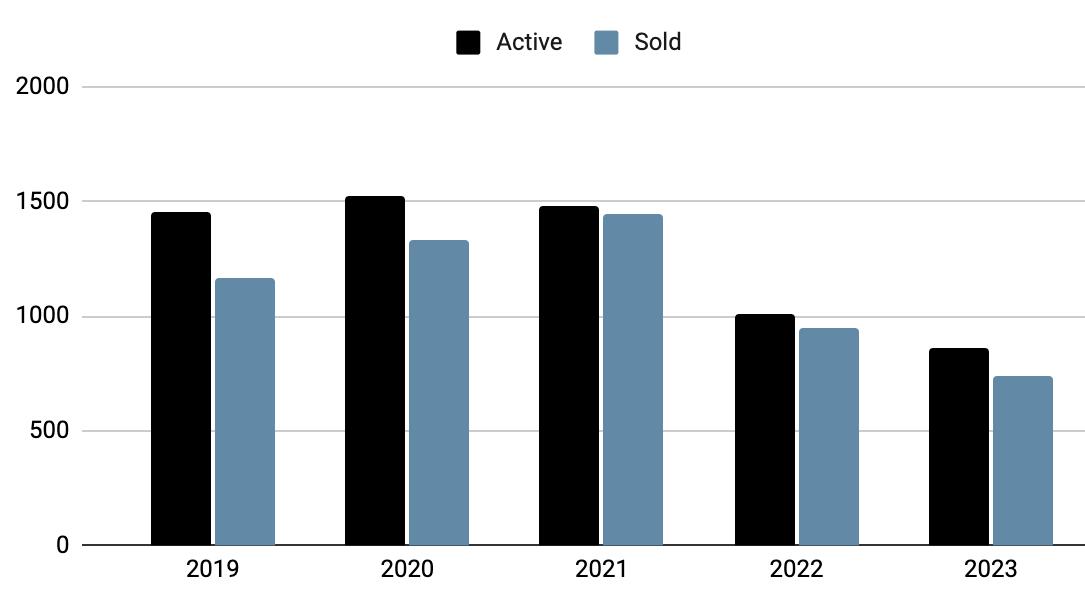
INSIGHT | 2023 Sales of 857 is the Lowest Reported and at the Same Level as 2008
10 SOUTH SANTA BARBARA COUNTY MARKET REPORT | DECEMBER 2023 - southSANTA BARBARA COUNTY - homes | estates | puds (excludes condos)SOLDS + ACTIVE LISTINGS/INVENTORY YEAR END REPORT 2023 | 2019-2023 Information Deemed Reliable But Not Guaranteed. Data Provided by SBAOR.
Current Limited Inventory Is Keeping Sold Prices Elevated 1526 1485 857 1170 1336 1444 945 735 1011 1452
The
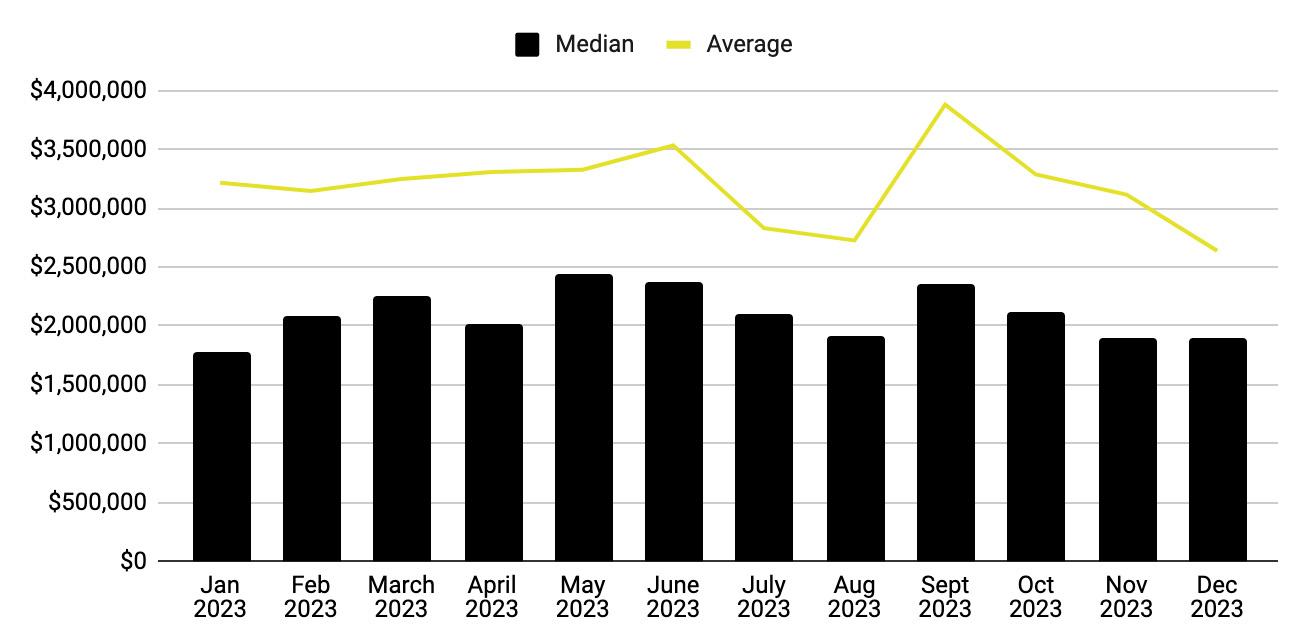
11 Information Deemed Reliable But Not Guaranteed. Data Provided by Fidelity National Title/Santa Barbara, CORT or SBAOR. - southSANTA BARBARA COUNTY - homes | estates | puds (excludes condos)SOLD PRICE/MEDIAN+AVERAGE 2023 Monthly Comparison $1,895,000 $2,638,197 12% 2023 | OFF MARKET TRANSACTIONS 138 of the 1105 Total Sale 41% 2023 | ALL CASH TRANSACTIONS 453 of the 1105 Total Sales

12 SOUTH SANTA BARBARA COUNTY MARKET REPORT | DECEMBER 2023 - southSANTA BARBARA COUNTY - homes | estates | puds | condosSOLD PRICE/MEDIAN + AVERAGE 20 Year Trend | 2003—2023 $1,700,000 $2,608,045 Information Deemed Reliable But Not Guaranteed. Data Provided by Fidelity National Title/Santa Barbara, CORT or SBAOR.

13 - southSANTA BARBARA COUNTY - homes | estates | puds | condosSALES VOLUME/INTEREST RATE ANALYSIS 20 Year Trend | 2003—2023 Information Deemed Reliable But Not Guaranteed. Data Provided by Fidelity National Title/Santa Barbara, CORT or SBAOR.
Single
14 SOUTH SANTA BARBARA COUNTY MARKET REPORT | DECEMBER 2023
YEAR END + DECEMBER 2023 | In Review
Family Homes + Condominiums MONTECITO
15
MONTECITO
TOTAL SALES 2023 | In Review
Single Family Homes + Condominiums (combined sales)
-20% change over 2022 (210 total sales)
167
SINGLE FAMILY HOMES
TOTAL YTD SALES
-18% change over 2022
145
AVERAGE SALES PRICE
-9% change over 2022
$6,547,476
MEDIAN SALES PRICE
-3% change over 2022
$5,295,000
CONDOMINIUM HOMES
TOTAL YTD SALES
-33% change over 2022
22
AVERAGE SALES PRICE
+11% change over 2022
$3,139,977
MEDIAN SALES PRICE
-5% change over 2022
$2,897,500
16 SOUTH SANTA BARBARA COUNTY MARKET REPORT | DECEMBER 2023
Single
AVERAGE SALES PRICE
-31% change from 2022
$5,047,127
MEDIAN SALES PRICE
-23% change from 2022
$4,485,000
HIGHEST SALES PRICE
930 Knollwood Drive
Montecito CA 93108
$11,500,000
LOWEST SALES PRICE
1301 Plaza De Sonadores
Montecito CA 93108
$2,300,000
17
MONTECITO DECEMBER 2023 | In Review
Family Homes + Condominiums (combined sales) 10
Click for Real Time Market Data
TOTAL
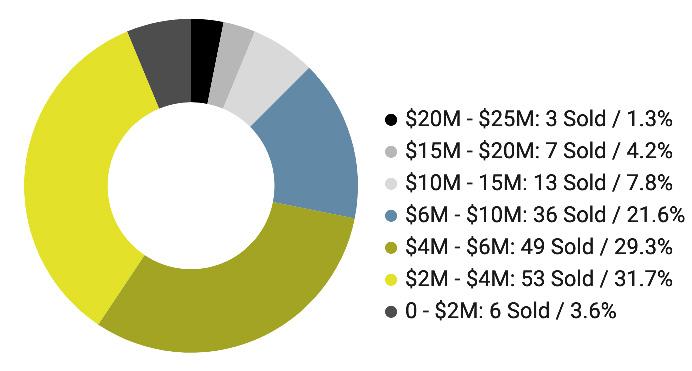
18 SOUTH SANTA BARBARA COUNTY MARKET REPORT | DECEMBER 2023 - homes | estates | puds | condosMONTECITO TOTAL SALES 2023 DISTRIBUTED BY PRICE RANGE
2023 SALES
Dollars In
167 sales Information Deemed Reliable But Not Guaranteed. Data Provided by Fidelity National Title/Santa Barbara, CORT or SBAOR. 20% 2023 | OFF MARKET TRANSACTIONS 33 of the 167 Total Sales 59% 2023 | ALL CASH TRANSACTIONS 99 of the 167 Total Sales
167 Total Transactions
Millions
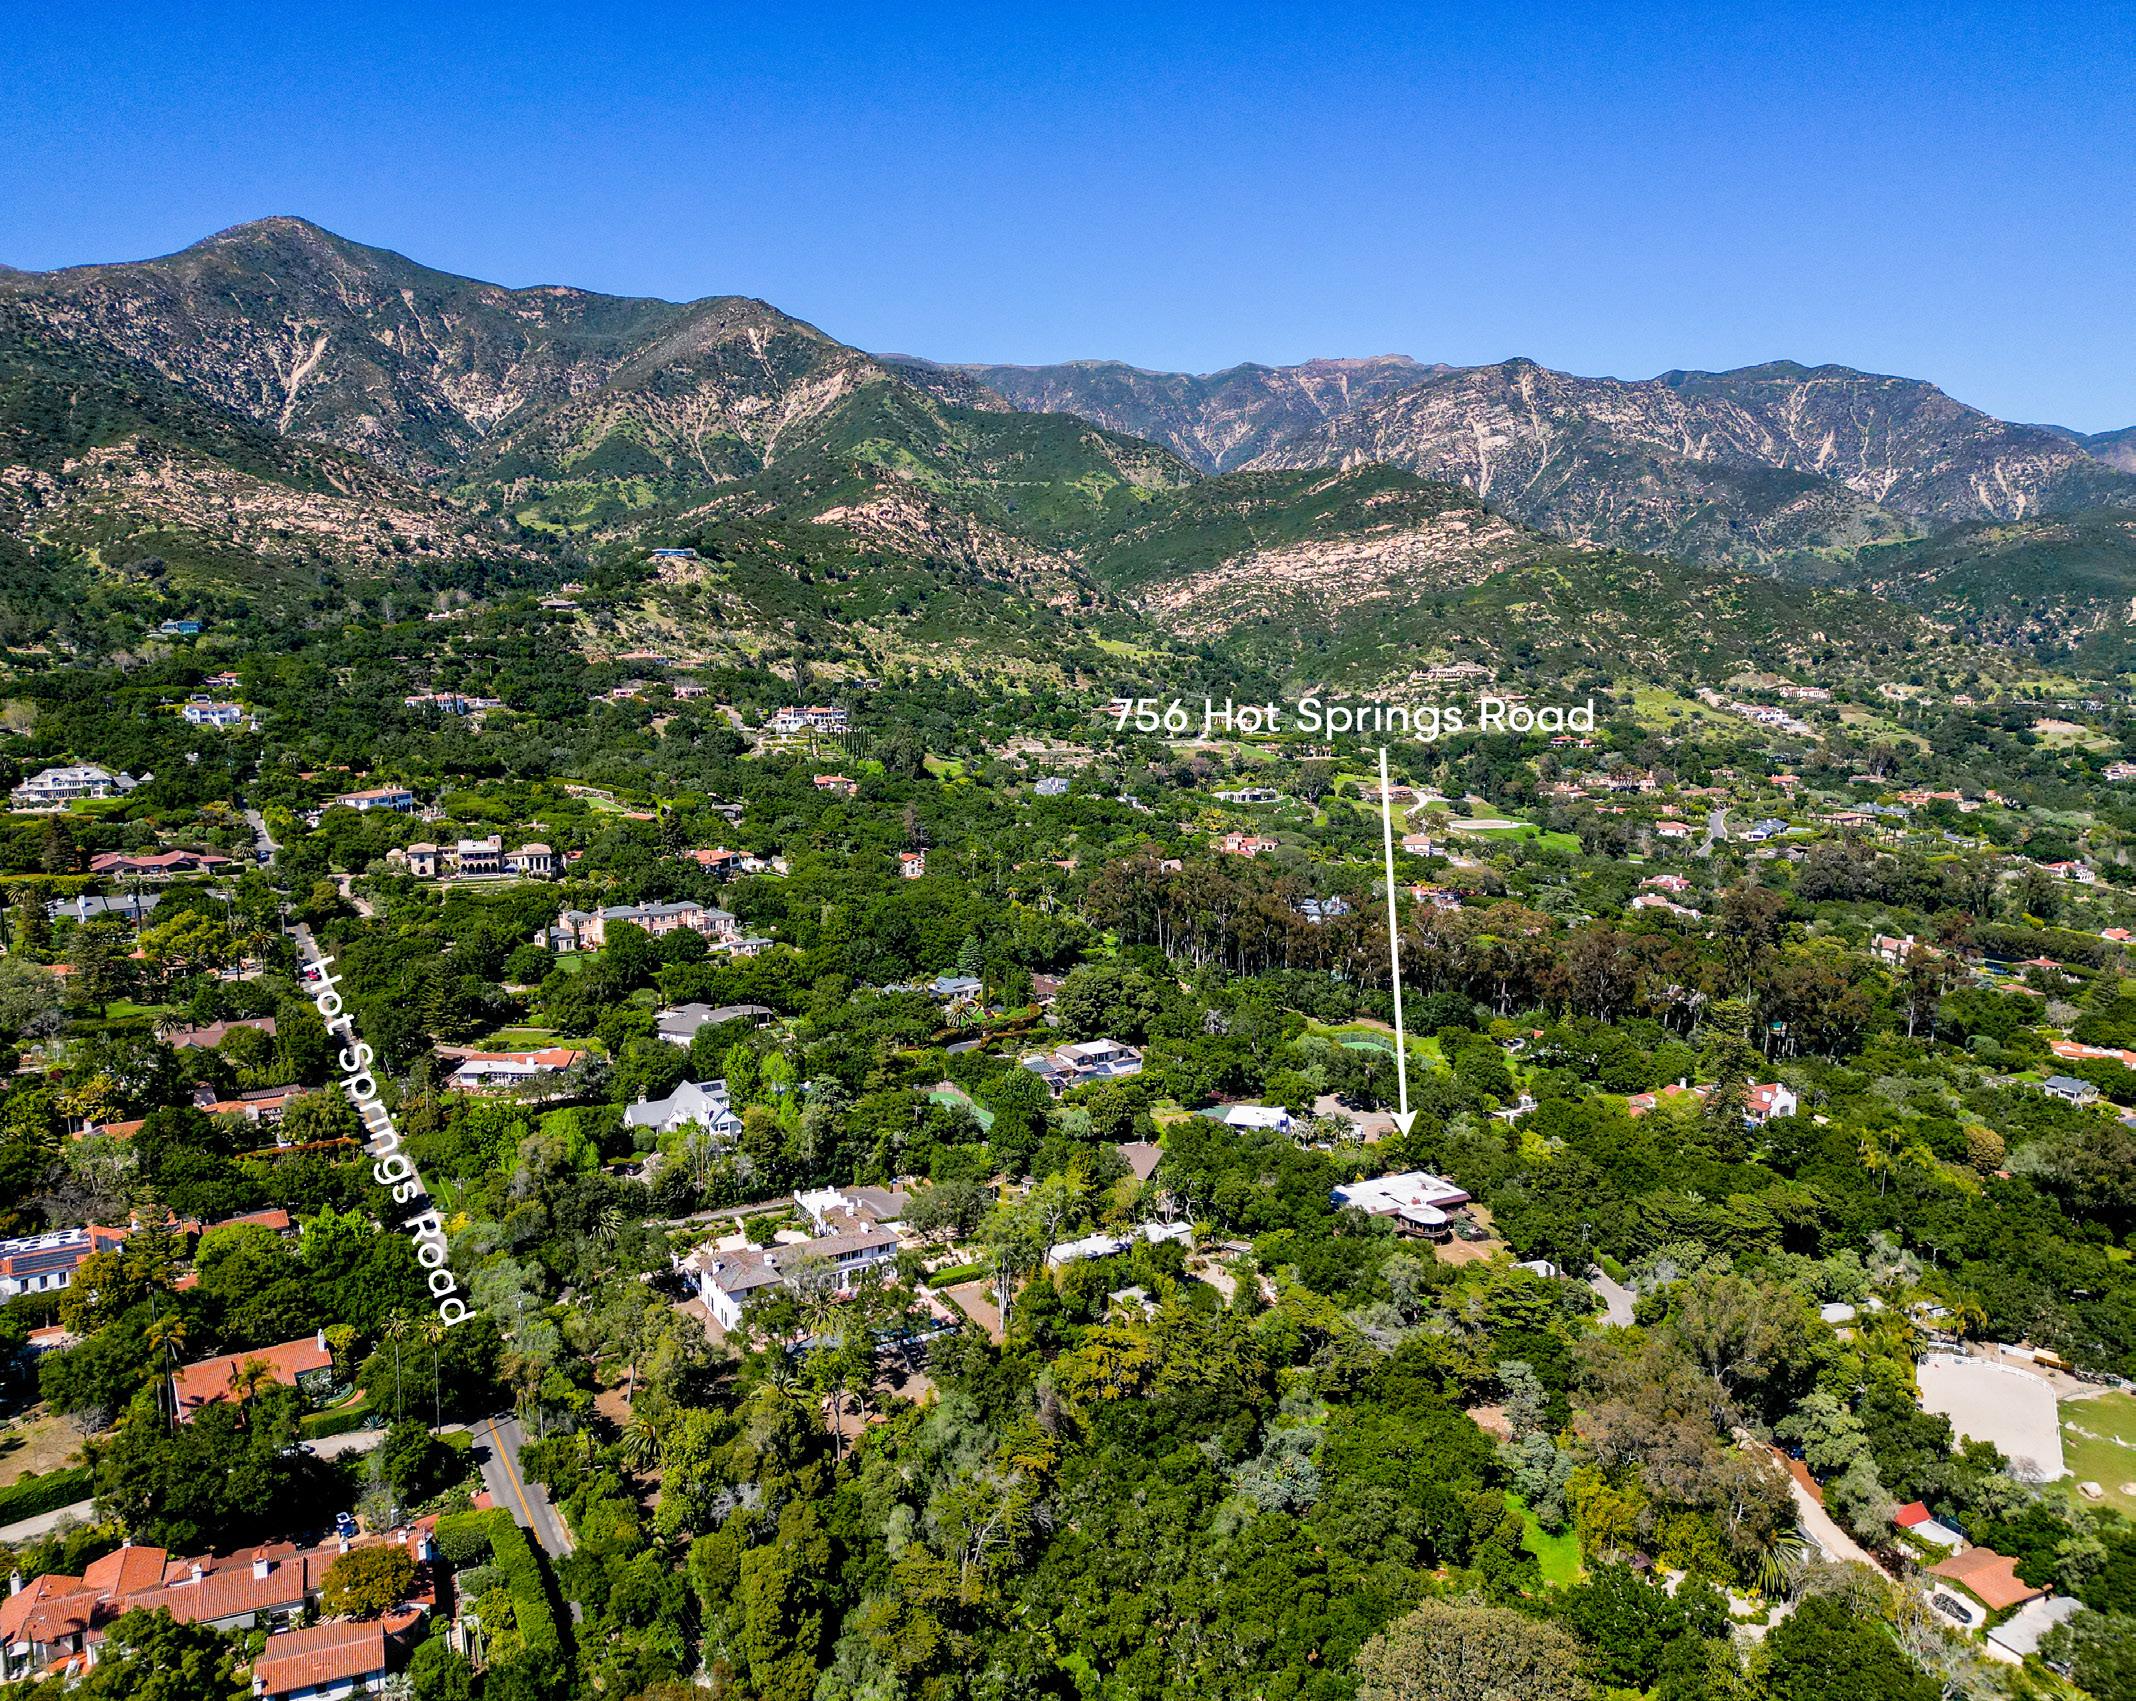
19 756 HOT SPRINGS ROAD | MONTECITO CA 93108 Golden Opportunity in the Quadrangle | Make it Your Own 4034± SF | 4 BD | 3 BA | 1.08± AC | 860 Lower Extra SF | Guest Cottage Offered at $4,797,000 / Pending/Accepting Backups Exclusive Offering by Randy Haden/Molly Haden
MONTECITO SALES | 2023 SALES
167 Total Transactions
8
265 Rametto Road $4,750,000 $4,750,000 100% 7
434 Nicholas Lane $4,750,000 $4,650,000 98% 15
25 Seaview Drive $4,475,000 $4,350,000 97% 8
1530 Miramar Lane $4,295,000 $4,327,500 101% 9
673 Cold Spring Road $3,395,000 $3,736,000 110% 13
625 Parra Grande Lane $4,115,000 $3,700,000 90% 1
231-229 E Mountain Dr $4,495,000 $3,512,000 78% 167
1006 Fairway Road $2,750,000 $2,550,000 93% 18
1308 Danielson Road $2,500,000 $2,500,000 100% 1
1231 East Valley Road $2,900,000 $2,400,000 83% 125
390 Mira Monte Avenue $1,595,000 $1,900,000 119% 3
251 Cloydon Circle $1,615,000 $1,615,000 100% 1
JUNE
319 San Ysidro Road $22,500,000 $22,500,000 100% 1
2035 Creekside Road 10,250,000 10,250,000 100% 171
901 Picacho Lane $10,000,000 $10,000,000 100% 1
420 Toro Canyon Road $8,950,000 8,950,000 100% 1
1496 San Leandro Pk Ln 8,950,000 8,950,000 100% 1
327 San Ysidro Road $8,000,000 7,950,000 99% 1
120 Summit Lane $7,385,000 $7,385,000
20 SOUTH SANTA BARBARA COUNTY MARKET REPORT | DECEMBER 2023
• DOM = Days on Market ADDRESS LIST PRICE SOLD PRICE % LIST DOM JANUARY 308 Ennisbrook Drive Off Market $21,000,000 100% 1 618 Hot Springs Road Off Market $8,925,000 100% 1 1855 San Leandro Lane $6,800,000 $5,550,000 82% 81 472 Santa Rosa Lane $4,495,000 $5,000,000 111% 6 231 Butterfly Lane $4,800,000 $4,800,000 100% 1 674 Oak Grove Drive Off Market $3,300,000 100% 1 260 Cloydon Circle $2,695,000 $2,710,000 101% 5 2070 East Valley Road $2,650,000 $2,650,000 100% 1 438 Seaview Road $2,850,000 $2,450,000 86% 9 FEBRUARY 751 Buena Vista Drive $18,900,000 $17,500,000 93% 45 445 Pimiento Lane $6,395,000 $6,505,000 102% 3 160 Miramar Avenue $5,175,000 $4,823,000 93% 15 MARCH 377 Santa Rosa Lane Off Market $14,230,000 100% 1 1027 Cima Linda Lane $12,500,000 $12,100,000 97% 317 1564 Ramona Lane $9,500,000 $8,752,000 92% 139 491 Pimiento Lane $9,450,000 $8,200,000 87% 127 206 Middle Road Off Market $5,650,000 100% 1 1530 Willina Lane $5,850,000 $5,100,000 87% 105 590 Freehaven Drive Off Market $5,100,000 100% 1 425 Nicholas Lane Off Market $5,100,000 100% 1 142 Coronada Circle Off Market $4,300,000 100% 1 302 Alston Road $4,495,000 $3,655,000 81% 137 130 Via Alicia $3,432,500 $3,432,500 100% 2 47 Seaview Drive $3,395,000 $3,395,000 100% 4 1524 East Valley Road Off Market $2,950,000 100% 1 118 Coronada Circle $2,495,000 $2,435,000 98% 158 544 San Ysidro Road B $2,195,000 $2,150,000 98% 29 1022 Fairway Road $1,550,000 $2,150,000 92% 18 1220 Coast Vllg Rd, 303 $1,495,000 $1,345,000 90% 70 APRIL 1850 Jelinda Drive $22,750,000 $18,000,000 79% 158 900 Park Lane $16,900,000 $15,790,000 93% 36 692 Sycamore Cyn Rd $15,500,000 $14,350,000 93% 60 1930 Jelinda Drive $10,000,000 $10,375,000 104% 30 935 Arcady Road $6,275,000 $6,262,500 100% 20 740 Santecito Drive $4,679,000 $4,390,000 94% 18 750 Hot Springs Road $3,400,000 $3,400,00 100% 1 231 Rametto Road $2,950,000 $3,315,000 112% 13 909 Chelham Way $2,650,000 $2,400,000 91% 40 41 Ridge View Road $2,200,000 $2,200,000 100% 1 ADDRESS LIST PRICE SOLD PRICE % LIST DOM MAY 1045 Cold Springs Rd $16,900,000 $15,900,000 94% 18 909 Lilac Drive $11,500,000 $13,300,000 116% 16 1435 East Mountain Dr $11,750,000 $11,406,000 97% 1 274 Middle Road $8,300,000 $8,300,000 100% 1 129 Rametto Road $9,975,000 $7,680,000 77% 300 549 Hodges Lane $6,850,000 $6,975,000 102% 9 790 Ayala Lane $6,200,000 $6,100,000 98% 57
Butterfly Lane $6,195,000 $5,700,000 92% 47 1381 Plaza Pacifica $4,995,000 $5,700,000 114% 9 279 Santa Rosa Lane $5,575,000 $5,295,000 95% 43 900 Toro Canyon Road $5,995,000 $5,050,000 84% 134 723 Via Manana $7,000,000 $5,000,000 71% 242
School House Road $4,995,000 $4,995,000 100%
166
1410
100% 1 2005 Birnam Wood Dr $7,950,000 $6,500,000 82% 104 1212 East Valley Road $6,500,000 $6,100,000 94% 11 1181 Glenview Road $5,995,000 $5,500,000 92% 37 231 Middle Road $5,300,000 $5,300,000 100% 1 1662 East Valley Road $5,000,000 $5,000,000 100% 1 1190 Dulzura Drive $5,200,000 $4,625,000 89% 44 715 Oak Grove Lane $4,000,000 $4,000,000 100% 1 802 Oak Grove Drive $3,950,000 $3,695,750 94% 50 317 Calle Hermoso $3,199,000 $3,515,000 110% 18 533 Hodges Lane $2,980,000 $2,498,000 84% 87 20 Abigail Lane $1,995,000 $2,275,000 114% 8 665 Orchard Avenue $750,000 $750,000 100% 1
MONTECITO SALES | 2023 SALES
167 Total Transactions
1492
$4,995,000 $5,300,000 106% 13
607 Cowles Road $4,750,000 $4,750,000 100% 1
621 Cowles Road $4,250,000 $4,250,000 100% 1
41 Ridge View Road $4,150,000 $4,150,000 100% 1
123 Via Alicia $3,475,000 $3,475,000 100% 1
43 Seaview Drive $2,695,000 $2,695,000 100% 1
2135 Sycamore Cny Rd $2,495,000
21
Information Deemed Reliable But Not Guaranteed. Data Provided by Fidelity National Title/Santa Barbara, CORT or SBAOR. ADDRESS LIST PRICE SOLD PRICE % LIST DOM JULY 808 San Ysidro Lane $18,500,000 $14,000,000 76% 75 747 Via Manana $9,995,000 $10,750,000 108% 19 1556 Miramar Beach $9,995,000 $8,740,000 87% 191 1597 East Valley Road $6,500,000 $6,500,000 100% 1 1385 Plaza Pacifica $6,300,000 $6,300,000 100% 1 1800 East Mountain Dr $6,450,000 $6,125,000 95% 15 1386 East Valley Road $4,695,000 $4,550,000 97% 17 311 San Ysidro Road $4,100,000 $4,100,000 100% 1 269 Oak Road $3,500,000 $3,240,000 93% 150 136 La Vuelta Road $3,895,000 $3,200,000 82% 40 1394 Danielson Road $2,936,000 $2,936,000 92% 63 AUGUST 256 Las Entradas Drive $16,950,000 $15,585,000 92% 36 1970 Lemon Ranch Rd $8,848,000 $8,848,000 100% 42 141 Rametto Road $9,500,000 $8,200,000 86% 52 1988 Inverness Lane $5,850,000 $5,850,000 100% 1 871 Deerpath Road $5,295,000 $5,153,000 97% 145 127 Loureyro Road $5,385,000 $4,850,000 90% 38 81 Depot Road $3,250,000 $3,350,000 103% 21 256 Butterfly Lane $4,150,000 $3,200,000 77% 106 43 Seaview Drive $2,995,000 $2,845,000 95% 151 49 Seaview Drive $2,845,000 $2,845,000 100% 1 48 Olive Mill Road $2,995,000 $2,597,500 87% 41 66 Olive Mill Road $2,340,000 $2,340,000 100% 1 8 Cedar Lane $2,350,000 $2,280,000 97% 88 251 Cloydon Circle $2,295,000 $2,100,000 92% 26 SEPTEMBER 1741 Glen Oaks Drive $22,750,000 $18,500,000 81% 40 2957 E Valley Road $17,600,000 $16,000,000 91% 49 412 Crocker Sperry Dr $12,300,000 $9,995,000 81% 73 161 La Vereda Road $6,850,000 $7,000,000 102% 9 487 Monarch Lane $5,300,000 $6,000,000 113% 10 231 Butterfly Lane $5,950,000 $5,400,000 91% 81 1777 San Leandro Lane $5,390,000 $5,390,000 100% 1 2946 Hidden Valley Ln $5,700,000 $5,297,000 93% 116 940 Channel Drive $5,495,000 $5,250,000 96% 46 667 Oak Grove Drive $4,250,000 $4,425,000 104% 18 32070 E Valley Road $4,400,000 $4,300,000 98% 15 925 El Rancho Road $4,500,000 $4,200,000 93% 52 1029 Alston Road $3,500,000 $3,500,000 100% 1 85 Depot Road $3,350,000 $3,350,000 100% 10 504 Hodges Lane $3,495,000 $3,250,000 93% 59 67 Olive Mill Road $2,800,000 $2,840,000 101% 3 712 Ladera Lane $2,395,000 $2,395,000 100% 37 ADDRESS LIST PRICE SOLD PRICE % LIST DOM OCTOBER 550 Freehaven Drive $21,750,000 $20,350,000 94% 136 2170 Ortega Ranch Ln $16,250,000 $14,100,000 87% 33 1439 Irvine Lane $11,250,000 $8,992,400 80% 143 719 Lilac Drive $9,500,000 $8,697,000 92% 109 1074 Cold Spring Road $12,300,000 $7,695,000 63% 117 551 Crocker Sperry Drive $7,500,829 $7,500,829 100% 1 1274 Eleven Oaks Lane $6,700,000 $6,500,000 97% 56 1141 Glenview Road $6,750,000 $6,300,000 93% 16 2850 Torito Road $4,395,000 $4,400,000 100% 29 21 Via Alicia $5,400,000 $4,350,000 81% 186 1330 Plaza Pacifica $3,999,000 $3,695,000 92% 181 242 Ortega Ridge Road $3,495,000 $3,495,000 100% 9 61 Seaview Drive $3,150,000 $3,150,000 100% 6 460 Barker Pass Road $2,400,000 $2,250,000 94% 7 NOVEMBER
E Mountain Drive $18,000,000 $12,000,000 67% 94 NOVEMBER 530 Eastgate Lane $8,200,000 $8,100,000 99% 1 306 Meadowbrook Dr $8,500,000 $7,100,000 84% 107 1180 High Road $6,495,000 $6,212,500 96% 77 2097 Stratford Place $6,750,000 $5,960,000 88% 18 1641 East Valley Road $5,500,000 $5,460,000 99% 7 400 Hot Springs Road
$2,500,000 100% 7 484 Barker Pass Road $2,200,000 $1,900,000 86% 54 DECEMBER 930 Knollwood Drive $12,850,000 $11,500,000 89% 27 1975 Inverness Lane $7,995,000 $7,550,000 94% 86 2870 E Valley Road $7,200,000 $6,300,000 88% 190 160 Butterfly Lane $5,495,000 $5,535,000 101% 7 243 Rametto Road $4,250,000 $4,540,000 107% 1 41493 Sycamore Cyn Rd $4,995,000 $4,430,000 89% 503 653 Romero Canyon Rd $2,895,000 $3,000,000 104% 5 1404 School House Rd $3,444,000 $3,000,000 87% 33 30 Augusta Lane $2,495,000 $2,316,272 93% 21 1301 Plaza De Sonadores $2,500,000 $2,300,000 92% 15
DOM = Days on Market
•
YEAR END + DECEMBER 2023 | In Review
Single Family Homes
22 SOUTH SANTA BARBARA COUNTY MARKET REPORT | DECEMBER 2023
HOPE RANCH

23
HOPE RANCH
TOTAL SALES 2023 | In Review
Single Family Homes (no condominiums in hope ranch)
-29% change over 2022
20
SINGLE FAMILY HOMES
TOTAL YTD SALES
-29% change over 2022
20 AVERAGE SALES PRICE
-12% change over 2022
$7,035,000
MEDIAN SALES PRICE
2% change over 2022
$5,737,500
CONDOMINIUM HOMES
TOTAL YTD SALES
n/a change over 2022
N/A
AVERAGE SALES PRICE
n/a change over 2022
N/A
MEDIAN SALES PRICE
n/a change over 2022
N/A
24 SOUTH SANTA BARBARA COUNTY MARKET REPORT | DECEMBER 2023
HOPE RANCH
DECEMBER 2023 | In Review
Single Family Homes
(no condominiums in hope ranch)
TOTAL DECEMBER SALES 0
AVERAGE SALES PRICE
0% change from 2022 n/a
MEDIAN SALES PRICE
0% change from 2022 n/a
HIGHEST SALES PRICE n/a
LOWEST SALES PRICE n/a
25
Click for Real
Market
Time
Data
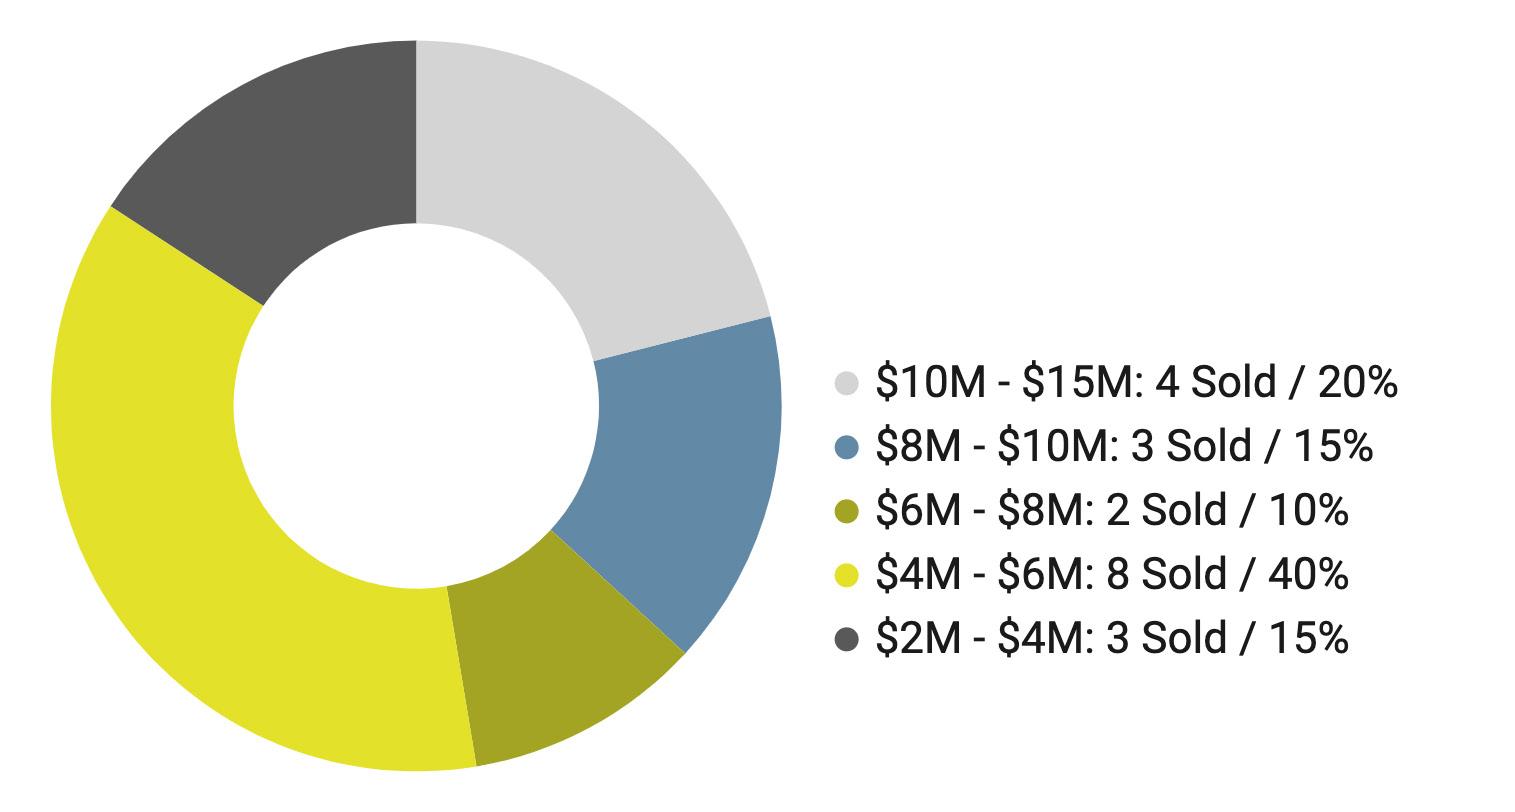
TOTAL 2023 SALES
20 Total Transaction YTD
Sales In Millions
26 SOUTH SANTA BARBARA COUNTY MARKET REPORT | DECEMBER 2023 - homes | estates | puds | condosHOPE RANCH TOTAL SALES 2023 DISTRIBUTED BY PRICE RANGE
20 sales Information Deemed Reliable But Not Guaranteed. Data Provided by Fidelity National Title/Santa Barbara, CORT or SBAOR. 5% 2023 | OFF MARKET TRANSACTIONS 1 of the 20 Total Sale 70% 2023 | ALL CASH TRANSACTIONS 14 of the 20 Total Sales
27 HOPE RANCH SALES
2023 SALES 20 Total Transactions • DOM = Days on Market Address List Price Sold Price % to List DOM Month 4345 Via Glorieta $9,495,000 $8,150,000 86% 279 January 13 Via Airosa $3,995,000 $3,995,000 100% 62 January 4680 Via Roblada $11,250,000 $10,400,000 92% 76 February 4520 Via Esperanza $9,250,000 $7,250,000 78% 180 February 965 Via Fruteria $5,475,000 $5,325,000 97% 29 February 3923 Laguna Blanca Dr $9,200,000 $8,700,000 95% 0 March 710 Monte Drive $5,495,000 $3,730,000 66% 219 March 4689 Via Roblada $14,500,000 $13,495,000 93% 136 April 4630 Via Huerto $12,750,000 $12,800,000 100% 9 April 695 Via Hierba $12,000,000 $11,764,060 98% 23 April 4662 Via Roblada $6,450,000 $5,500,000 98% 32 June 4025 Lago Drive $3,650,000 $3650,000 100% off mkt June 1126 Estrella Drive $4,930,000 $4,930,000 100% 1 July 700 Via Hierba $5,795,000 $5,200,000 90% 90 August 948 Las Palmas Drive $4,994,900 $4,700,000 94% 97 August 1435 Estrella Drive $7,900,000 $7,450,000 94% 78 September 4305 Via Presada $6,895,000 $5,975,000 87% 83 September 4178 Cresta Avenue $9,350,000 $v8,111,000 87% 134 October 411 Las Palmas Drive $5,495,000 $4,960,000 90% 31 October 942 Via Fruteria $4,200,000 $4,615,000 110% 1 November Information Deemed Reliable But Not Guaranteed. Data Provided by Fidelity National Title/Santa Barbara, CORT or SBAOR.
|
SANTA BARBARA
YEAR END + DECEMBER 2023 | In Review
Single Family Homes + Condominiums
28 SOUTH SANTA BARBARA COUNTY MARKET REPORT | DECEMBER 2023
29
SANTA BARBARA
TOTAL SALES 2023 | In Review
Single Family Homes + Condominiums (combined sales)
-21% change over 2022 (632 total sales)
502
SINGLE FAMILY HOMES
TOTAL YTD SALES
-22% change over 2022
354 AVERAGE SALES PRICE
-5% change over 2022
$2,314,133
MEDIAN SALES PRICE
-6% change over 2022
$2,000,000
CONDOMINIUM HOMES
TOTAL YTD SALES
-16% change over 2022
148 AVERAGE SALES PRICE
+4% change over 2022
$1,308,379
MEDIAN SALES PRICE
+7% change over 2022
$1,117,500
30 SOUTH SANTA BARBARA COUNTY MARKET REPORT | DECEMBER 2023
SANTA BARBARA
DECEMBER 2023 | IN REVIEW
Single Family Homes + Condominiums (combined sales)
TOTAL DECEMBER SALES
35
AVERAGE SALES PRICE
-3% change from 2022
$1,956,107
MEDIAN SALES PRICE
-2% change from 2022
$1,506,000
HIGHEST SALES PRICE
3105 Las Gaviotas
Santa Barbara CA 93109
$8,750,000
LOWEST SALES PRICE
968 Miramonte Drive 7
Santa Barbara CA 93109
$627,500
Condominium Home
31
Click for Real Time Market Data
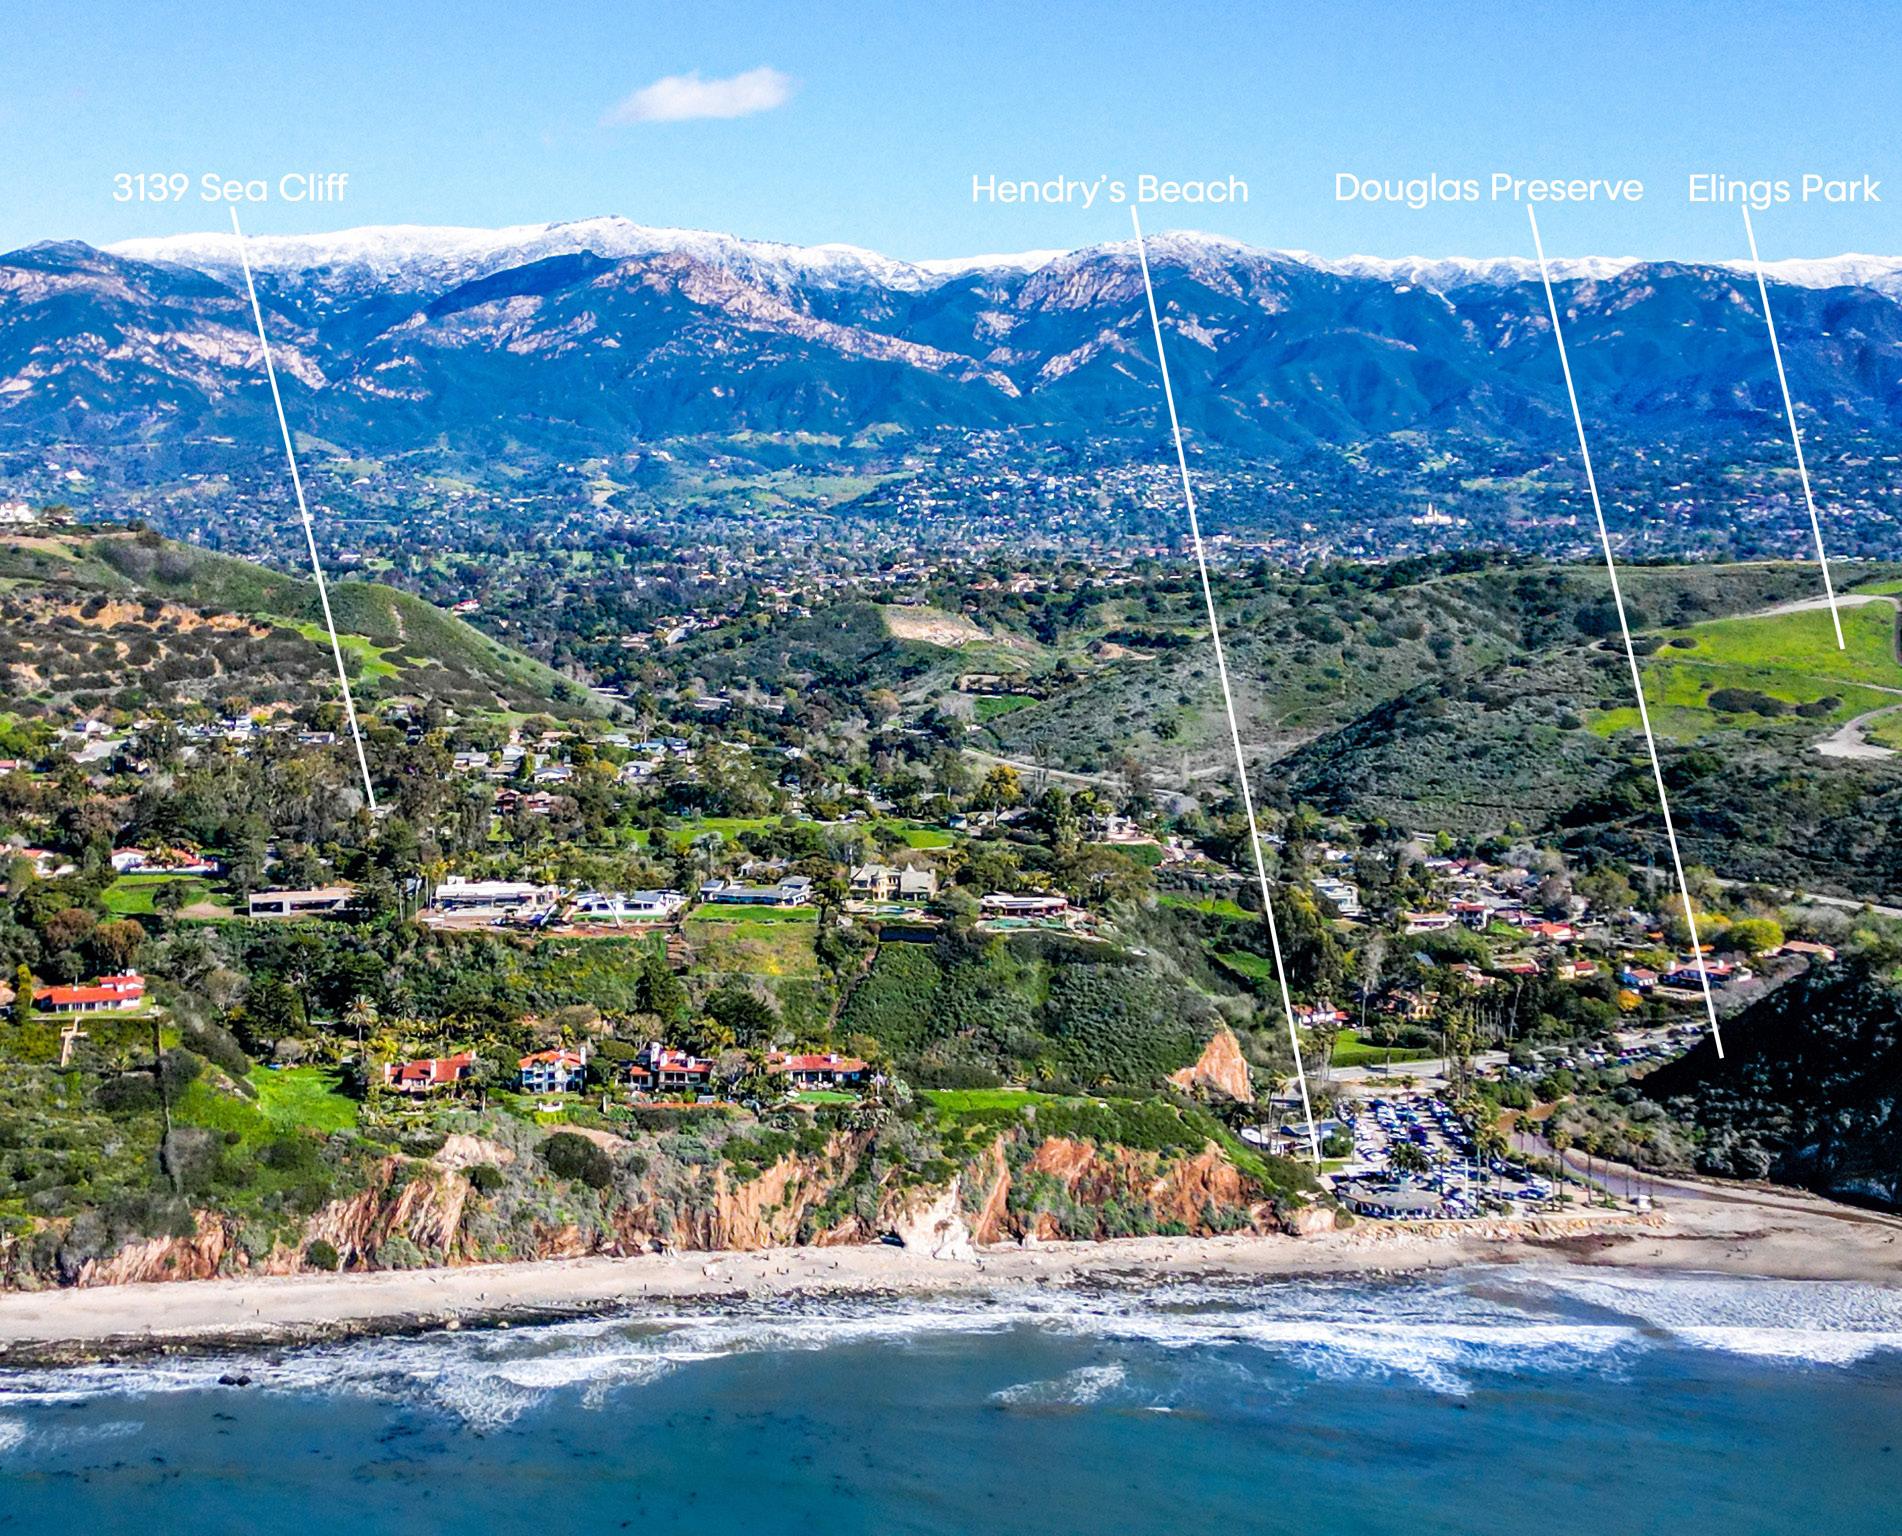
32 SOUTH SANTA BARBARA COUNTY MARKET REPORT | DECEMBER 2023 3139 SEA CLIFF | SANTA BARBARA CA 93109 Undeniable Momentum on Sea Cliff | Plans for Lot Split | Existing Home 3 BD | 3 BA | 3045± SF | 1.46± AC Offered at $7,497,000 / Pending Accepting Backups Exclusive Offering by Randy Haden/Molly Haden

33 1322 DOVER ROAD | SANTA BARBARA CA 93103 Dramatic Upper Riviera Ocean View Parcel | Plans Available 0.82± Acres Parcel | Double Wide Vacant Lot | Existing Pool Offered at $3,299,000 Exclusive Offering by Randy Haden/Molly Haden
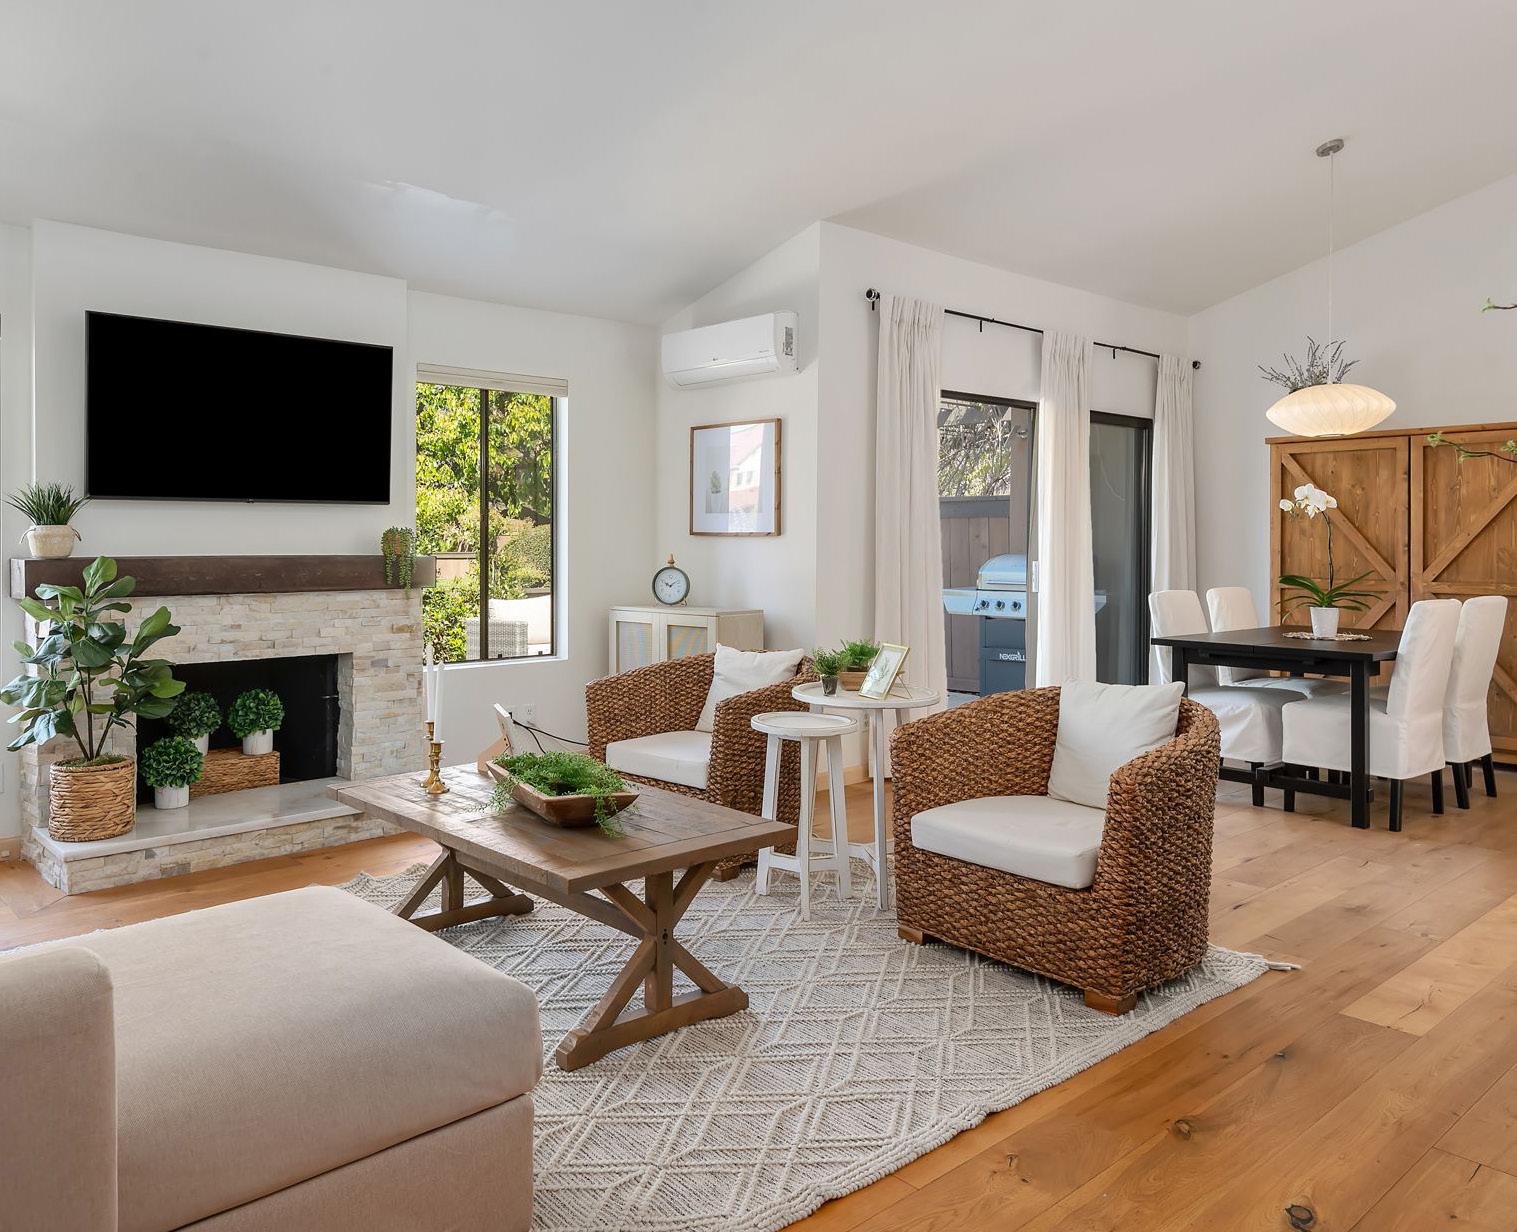
34 SOUTH SANTA BARBARA COUNTY MARKET REPORT | DECEMBER 2023 695 AVENIDA PEQUENA | SANTA BARBARA CA 93111 Cathedral Oaks Village | High End Finishes | Landscaped Patios 3 BD | 2.5 BA | 2029± SF | Condo/Townhome Offered at $1,795,000 Exclusive Offering by Randy Haden/Molly Haden
35
SUMMERLAND
YEAR END + DECEMBER 2023 | In Review
Single Family Homes + Condominiums
36 SOUTH SANTA BARBARA COUNTY MARKET REPORT | DECEMBER 2023
37
SUMMERLAND
TOTAL SALES 2023 | In Review
Single Family Homes + Condominiums (combined sales)
-25% change over 2022 (19 total sales)
13
SINGLE FAMILY HOMES
TOTAL YTD SALES
-44% change over 2022
9 AVERAGE SALES PRICE
+83% change over 2022
$5,208,794
MEDIAN SALES PRICE
+41% change over 2022
$3,500,000
CONDOMINIUM HOMES
TOTAL YTD SALES
+33% change over 2022
4 AVERAGE SALES PRICE
+14% change over 2022
$1,491,163
MEDIAN SALES PRICE
+39% change over 2022
$1,489,325
38 SOUTH SANTA BARBARA COUNTY MARKET REPORT | DECEMBER 2023
SUMMERLAND
DECEMBER 2023 | In Review
Single Family Homes + Condominiums (combined sales)
TOTAL DECEMBER SALES
AVERAGE SALES PRICE
0% change from 2022
MEDIAN SALES PRICE
0% change from 2022
HIGHEST SALES PRICE
LOWEST SALES PRICE
39
n/a
n/a
n/a
n/a Click for Real Time Market Data
40
END + DECEMBER 2023 | In Review Single Family Homes + Condominiums
YEAR
CARPINTERIA
41
CARPINTERIA
TOTAL SALES 2023 | In Review
Single Family Homes + Condominiums (combined sales)
-18% change over 2022 (138 total sales)
113
SINGLE FAMILY HOMES
TOTAL YTD SALES
-11% change over 2022
62
AVERAGE SALES PRICE
-34% change over 2022
$2,990,051
MEDIAN SALES PRICE
-15% change over 2022
$1,602,500
CONDOMINIUM HOMES
TOTAL YTD SALES
-25% change over 2022
51
AVERAGE SALES PRICE
-4% change over 2022
$835,824
MEDIAN SALES PRICE
-3% change over 2022
$782,000
42 SOUTH SANTA BARBARA COUNTY MARKET REPORT | DECEMBER 2023
DECEMBER 2023 | In Review
Single Family Homes + Condominiums (combined sales)
TOTAL DECEMBER SALES
8
AVERAGE SALES PRICE -89% change from 2022
$1,438,125
MEDIAN SALES PRICE
0% change from 2022
$1,302,500
HIGHEST SALES PRICE
7030 Shepard Mesa Road
Carpinteria CA 93013
$4,000,000
LOWEST SALES PRICE
5446 Eighth Street, 30 Carpinteria CA 93013
$560,000
Condominium Home
43
CARPINTERIA
Click for Real Time Market Data

44 SOUTH SANTA BARBARA COUNTY MARKET REPORT | DECEMBER 2023
YEAR END + DECEMBER 2023 | In Review
+ Condominiums
Single Family Homes
GOLETA

45
GOLETA
TOTAL SALES 2023 | In Review
Single Family Homes + Condominiums (combined sales)
-30% change over 2022 (414 total sales)
290
SINGLE FAMILY HOMES
TOTAL YTD SALES
-31% change over 2022
183
AVERAGE SALES PRICE
+7% change over 2022
$1,799,749
MEDIAN SALES PRICE
-4% change over 2022
$1,492,450
CONDOMINIUM HOMES
TOTAL YTD SALES
-28% change over 2022
107
AVERAGE SALES PRICE
+2% change over 2022
$931,538
MEDIAN SALES PRICE
-1% change over 2022
$825,000
46 SOUTH SANTA BARBARA COUNTY MARKET REPORT | DECEMBER 2023
MEDIAN
47 GOLETA DECEMBER 2023 | In Review
Family Homes + Condominiums (combined sales)
DECEMBER SALES 24
SALES PRICE +10% change
Single
TOTAL
AVERAGE
from 2022 $1,369,425
SALES PRICE +13% change
SALES PRICE 1164 Camino Del Rio Goleta
SALES PRICE 5510 Armitos Avenue 14 Goleta CA 93117
Condominium Home Click for Real Time Market Data
from 2022 $1,240,500 HIGHEST
CA 93110 $4,915,000 LOWEST
$550,000

DISCRETION
Privacy is the Ultimate Commodity And the Decision to Sell Your Home Is a Personal One.
FLEXIBILITY
Decide When to Share Details About Your Home - Including PriceMore Expansively On Your Own Timing.
Exclusive Exposure To Compass Agents, Including Premium Placements On Agent Facing Platform.
48 SOUTH SANTA BARBARA COUNTY MARKET REPORT | DECEMBER 2023
VALUE Get the Best Offer by Testing The Market Privately to Gather Key Insights Without Your
QUALITY
Listing Getting Stale or Overexposed.

COMPASS PRIVATE EXCLUSIVE LISTINGS
Ask Us About Our Exciting Private Exclusive Listings | Contact Us Live For details!
A Compass Private Exclusive listing is an off-market home that can be shared by a Compass agent directly with their colleagues and their buyers. Property details are not disseminated widely and won’t appear on public home search websites.
Listing your home as a private exclusive allows you to control what information is shared about you and your home while still getting exposure to top agents at Compass.

MOLLY HADEN
Realtor / Marketing Director DRE 02020380
805.880.6540
molly@hadenhomes.com

RANDY HADEN
Broker Associate / Realtor DRE 01988499
805.880.6530
randy@hadenhomes.com


50 SOUTH SANTA BARBARA COUNTY MARKET REPORT | DECEMBER 2023
LET’S CONNECT www.hadenhomes.com @hadenhomesrealtors
experience
1% Top 1% of Local Agents CHOOSE


CONCIERGE Real Estate Service
EXPERT PERSPECTIVE
Now more than ever you need an expert advisor on your side who can provide comprehensive analysis and exclusive insights into today’s fast-paced housing market. We see every luxury property available and know the market. Our commitment to staying educated on what’s happening with economic news, the real estate market, local sales and listings is essential to your success when buying or selling properties.
CONCIERGE SERVICE
We strive to deliver a high level of personalized service—personally! We provide our clients with cutting-edge strategies that produce ideal results. Our exceptional service is driven by efficient communication, understanding your needs and having expansive industry resources— combined with expert knowledge of the extensive contracts and required forms to protect your best interests. The process comes together as a result of our years of successful negotiating which leads to a winning deal. We listen carefully, anticipate your needs, execute the deal and handle all the details. The hard work starts when a contract is in place so you will be happy you chose representation experienced in closing the deal smoothly.
COMMUNITY INVESTMENT
Sell a Home | Build a Home initiative. We are deeply connected and committed to the communities in which we live and work. Haden Homes Luxury Property Group has made a pledge to help individuals with housing needs by partnering with Habitat for Humanity. For every home that our clients buy or sell, Haden Homes makes a donation to Santa Barbara’s Habitat for Humanity.
51

THE TALK IS RECORD SALES, 2024, INTEREST RATES + MORE
- click link for full article -
A Wave of Change Is Headed For Montecito
The 10 Most Expensive Homes That Sold In 2023, From Jay-Z’s Malibu Manse To Jeff Bezos’s Miami Getaway
Four Questions You Should Answer Before Buying a Second Home. Before Investing In A Vacation Property There Are Important Considerations Beyond Location
Mortgage Rates Dip To 6.6% To Mark The Lowest Level Since May 2023. The Decline Is Welcome News For The Housing Market But Will Create Pressure On Inventory
Mortgage Applications Hit 9-Month High—Up by 8%
Pandemic Migration Boom May Be Over

CHICAGO TITLE FIDELITY NATIONAL TITLE SANTA BARBARA MLS
DATA SOURCES | LISTING DISCLOSURE
All information provided is deemed reliable but has not been verified and we do not guarantee it. We recommend that buyers make their own inquiries. Data source Fidelity National Title of Santa Barbara, CORT and Santa Barbara MLS. INdata Real Estate Market Reporting through December 2023.
Properties featured are courtesy of the Santa Barbara MLS and are available for sale at time of publication. They may be listed by brokers and/or agents other than Compass or Haden Homes Luxury Property Group. Contact us for details or to set up a private showing at 805.880.6530.

53


