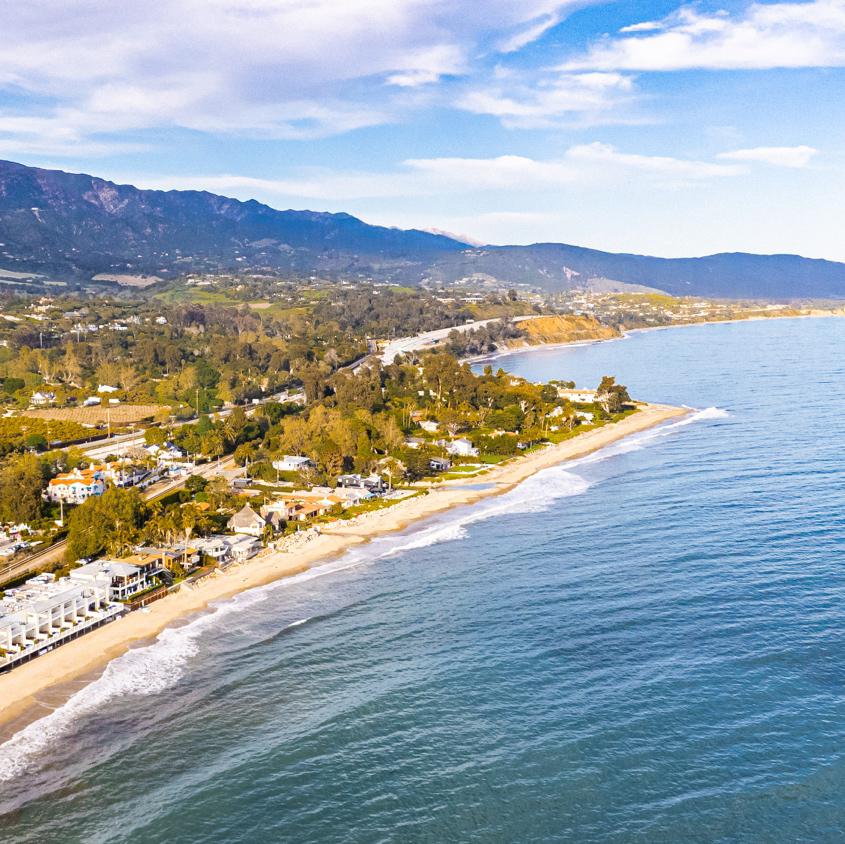


Q1 + March 2024 | Residential Real Estate | South Santa Barbara County | No.0324 THE LUXURY REPORT
MONTECITO | HOPE RANCH | SANTA BARBARA
Q1 + MARCH 20 24

Hello Colleagues and Friends -
Real estate is dynamic and changes all the time! Our area has remained unapologetically resilient through the first quarter of 2024 with continued demand to live in our beautiful coastal community. We still see more buyers than sellers here in Montecito and Santa Barbara with many coming from Los Angeles, the Bay Area and other densely populated areas. Most buyers are looking to find their forever home and often a second home sanctuary.
Many experts rely on previous market performance as indicators of what’s to come so we will dive into market statistics. While we also like to peek in the rearview mirror—we are always looking ahead to combine the past insights with current local market performance to ensure our clients have the best information to make a solid real estate investment decision.
Moving into 2024, we are still seeking our ”new normal” as evidenced by many key indicators. Let’s see what happened!
Sold Price | We continue to be amazed how the median sales price has climbed dramatically during 2021 then remained relatively level through Q1 2024. We see the median sales price bumping against the top at $2,100,000 (SFH) for the entire area, $5,015,000 in Montecito and $6,618,000 in Hope Ranch. Strong buyer demand for the limited available properties is keeping asking prices ambitious and closing prices at a premium—evidenced by the “sold to original list price” at 97%.
Inventory | The persistent lack of inventory continues to keep the prices elevated, resulting in far fewer sales compared to the 2021 pandemic peak. However, we are enjoying a marked improvement of 27% more homes (331) to choose from compared to Q1 2023 (261) showing sellers are more willing to put their properties on the market. As we move in the right direction, inventory is still 36% lower than the more “normalized” Q1 2020. (560). See Active/Sold Listings graph.
Transactions | The number of sales for Q1 2024 has improved with a total of 274 properties trading hands which is notably 14% more homes selling than Q1 2023 (241 sales). While encouraging, this is still far below Q1 2020 sales of 385 (-29%). Of the 274 sold, 41 properties traded in Montecito and only 3 in Hope Ranch.
Luxury Market | Montecito had a total of 41 transactions, a 24% increase over the 33 sales in Q1 2023 with the median sold price holding steady at around $5M since 2022. What is notable, seven of the 41 properties traded for over $13M and a remarkable three over $25M, while only 3 over $14M in 2023.
Numbers don‘t tell the entire story—we remain optimistic with many qualified and enthusiastic buyers looking for quality homes who are ready to make a buying decision. If you are thinking of selling in the near future, we have never seen a better time to capitalize on the potential equity in your property. Although we are seeing that the “panic buying” during the pandemic is over, homes priced correctly and marketed professionally at all price points are still receiving multiple offers and often at or over the asking price. Reach out to discuss what this means for your property in this market.
In this highly competitive market—experience matters. We offer extensive market knowledge, worldclass marketing and concierge level professional service with complete confidentiality to our clients. Our proven track record of success includes skills necessary to put complicated deals together and negotiate the price and terms that will get your home sold for a premium price and offer accepted on your replacement property—even amongst multiple offers.
Randy
20 24
and Molly
Looking for professional + creative results-oriented representation - Let’s Talk!

Some Agents Know The Market
Good Agents Understand The Market Exceptional Agents
- bioRANDY/MOLLY
4 SOUTH SANTA BARBARA COUNTY MARKET REPORT | Q1 + MARCH 2024
Can Explain The Market - read on . . .
-
southSANTA BARBARA COUNTY
Q1 REPORT 2024 | In Review
Single Family Homes + Condominiums
+14% change over 2023
274
SINGLE FAMILY HOMES
TOTAL YTD SALES
+15% change over 2023
193
AVERAGE SALES PRICE
+5% increase over 2023
$3,369,358
MEDIAN SALES PRICE
+10% increase over 2023
$2,200,000
CONDOMINIUM HOMES
TOTAL YTD SALES
+11% change over 2023
81
AVERAGE SALES PRICE -11% change over 2023
$1,055,893
MEDIAN SALES PRICE
-8% change over 2023
$910,000
5

BANDIT
THE PROTEA FLOWERS ABLOOM IN SANTA BARBARA 6 SOUTH SANTA BARBARA COUNTY MARKET REPORT | Q1 + MARCH 2024
ENJOYS
MARCH 2024 | In Review
Single Family Homes + Condominiums
+1% change over 2023
100
SINGLE FAMILY HOMES
TOTAL SALES
+15% change over 2023
77
AVERAGE SALES PRICE
-12% increase over 2023
$ 2,864,342
MEDIAN SALES PRICE
-7% increase over 2023
$2,100,000
TOTAL AVERAGE DAY ON MARKET
29 SOLD TO ORIGINAL LIST PRICE
CONDOMINIUM HOMES
TOTAL SALES
-28% change over 2023
23
AVERAGE SALES PRICE -9% change over 2023
$1,220,491
MEDIAN SALES PRICE
-15% change over 2023
$1,039,000
TOTAL AVERAGE DAY ON MARKET
42 SOLD TO ORIGINAL LIST PRICE 100%
7
- southSANTA BARBARA COUNTY
95%
- south -
SANTA BARBARA COUNTY
- homes | estates | puds (excludes condos) -
PRICE | MEDIAN+AVERAGE ANALYSIS
Month over Month Comparison

$3,369,358 $2,200,000
SOLD
13% Q1 2024 OFF MARKET 36 of the 274 Total Sales 44% Q1 2024 ALL CASH 121 of the 274 Total Sales
8 SOUTH SANTA BARBARA COUNTY MARKET REPORT | Q1 + MARCH 2024
SANTA BARBARA COUNTY

$2,685,450
$1,675,000
9 Information Deemed Reliable But Not Guaranteed. Data Provided by Fidelity National Title/Santa Barbara, CORT or SBAOR.
SOLD PRICE | MEDIAN+AVERAGE ANALSIS
2024
- south -
- homes | estates | puds | condos -
22 Year Trend | 2003— Q1
- south -
SANTA BARBARA COUNTY
- homes | estates | puds | condos -
22 Year Trend | 2003— Q1 2024

SALES VOLUME
ANALYSIS
Information Deemed Reliable But Not Guaranteed. Data Provided by Fidelity National Title/Santa Barbara, CORT or SBAOR. 10 SOUTH SANTA BARBARA COUNTY MARKET REPORT | Q1 + MARCH 2024
| INTEREST RATE
-
south
-
SANTA BARBARA COUNTY
- homes | estates | puds (excludes condos)INVENTORY | SOLD+ACTIVE BY QUARTER
Q1 Totals | 2018-2024

INSIGHT | 2023 Total SFH Sales of 857 is the Lowest Reported. At the Same Level as 2008
The Current Limited Inventory Is Keeping Sold Prices Elevated
11
Information Deemed Reliable But Not Guaranteed. Data Provided by SBAOR.

NATIONAL REAL ESTATE INSIGHTS
Prices, Listings & Sales Rise, But Economic Indicators Turn Cloudier
• Year over year, the median single-family-home sales price in March 2024 was up 4.7%, and the median condo/co-op price rose 5.8%. Median sales prices usually peak for the year in late spring.
• The number of new listings was up 16.5% from February, and up 15.5% yearover-year, while active listings rose 14.4% y-o-y. The increase in inventory is excellent news for buyers, but the supply of homes for sale remains very low compared to 2017-2019.
• Monthly home sales jumped 19.6% from February but were down 9.7% yearover-year. New listing activity and closed sales normally continue to climb through May or June.
• In March, approximately 60% of sales sold in less than 1 month, 29% closed over list price, 28% purchased all-cash, 32% bought by first-time homebuyers and 6% by buyers who hadn't seen the home in person. Only 2% were distressed sales. The average number of offers for homes that sold increased to 3.1. In the first quarter, approximately 10% of transactions saw delays in scheduled closed of escrow, and 5% of negotiated contracts were terminated for one reason or another.
Economic indicators shifted somewhat in the 1st half of April: The general inflation reading for March unexpectedly ticked up to 3.5% from 3.2%, with the "core" inflation reading unchanged at 3.8%, both significantly higher than the Fed's goal of 2% - which put in doubt reductions in the Fed's benchmark rate commonly expected for 2024. This caused mortgage interest rates to rise above 7% - though still well below rates seen last fall - and, as of April 18th, triggered declines in stock markets, which remain much higher year-todate. The unemployment rate remains close to historic lows.
click
COMPASS National Report
for
12 SOUTH SANTA BARBARA COUNTY MARKET REPORT | Q1 + MARCH 2024
AVAILABLE PROPERTIES
Check out our carefully curated Compass Collection which includes properties we consider to be exceptional, excellent investments and/or good values - call/text/email for details or a private showing at 805.880.6530.
These properties are available at time of publication, but the market is still moving fast due to historically low inventory. Stay ahead of the market by getting in touch for a list of the most up to inventory—including Compass Private Exclusives (off market) and Coming Soon homes that are not available below or on public search sites.

13
Properties featured are courtesy of the Santa Barbara MLS. They may be listed by brokers and/or agents other than Compass or Haden Homes Luxury Property Group. MARCH COMPASS COLLECTION

MONTECITO
Update
Q1+MARCH 2024 | In Review Residential Real Estate

THE LUXURY MARKET IS BUZZING IN MONTECITO
The luxury buyers have been undeterred by interest rates evidenced by 59% of homes in Montecito trading for all cash in Q1 2024 and throughout 2023.
During Q1 2024, Montecito had a total of 41 transactions, a 24% increase over the 33 sales in Q1 2023 with the median sold price holding steady at around $5M since 2022. What is notable, six of the 41 properties traded for over $14M and a remarkable three over $25M, while only 3 sold over $14M in 2023. These high sales include:
875/885 Park Lane | $36,800,000 | February
319 San Ysidro Road | $32,000,000 | February
777 Romero Canyon Road | $25,124,500 | February
Off-market deals are still thriving amid inventory scarcity and we network extensively with other top agents so have been successful in putting many deals together privately. Maximum exposure is still the best way to attract the most qualified buyers along with the highest possible price. Homes in Montecito are still selling at premium prices when priced correctly and marketed publicly.
Please reach out for a confidential conversation and strategic marketing plan. We have many qualified affluent clients looking for their own slice of paradise in our beautiful coastal community -


Q1 2024 REPORT | In Review
Single Family Homes + Condominiums
+24% change over 2023
41
SINGLE FAMILY HOMES
TOTAL YTD SALES
+44% change over 2023
39
AVERAGE SALES PRICE
+18% increase over 2023
$7,831,782
MEDIAN SALES PRICE
+7% increase over 2023
$5,400,000
TOTAL AVERAGE DAY ON MARKET
CONDOMINIUM HOMES
TOTAL YTD SALES -67% change over 2023
2
AVERAGE SALES PRICE +27% change over 2023
$3,100,000
MEDIAN SALES PRICE
+22% change over 2023
$3,100,000
64 SOLD TO ORIGINAL LIST PRICE 91%
MONTECITO
18 SOUTH SANTA BARBARA COUNTY MARKET REPORT | Q1 + MARCH 2024
MARCH 2024 | In Review
Single Family Homes + Condominiums (combined sales)
12
AVERAGE SALES PRICE
+19% change from 2023
$6,557,083
MEDIAN SALES PRICE
+11% change from 2023
$5,150,000
HIGHEST SALES PRICE
1530 Mimosa Lane
Montecito CA 93108
$16,500,000
LOWEST SALES PRICE
1050 Fairway Road
Montecito CA 93108
$1,700,000 Condominium Home
19 REAL
TIME MARKET DATA - clickMONTECITO
TOTAL AVERAGE DAY ON MARKET
30 SOLD TO ORIGINAL LIST PRICE 96%
MONTECITO Q1 2024 | 41 TRANSACTIONS
ADDRESS LIST PRICE SOLD PRICE % LIST DOM JANUARY
1035 Alston Road
515 Santa Angela Lane
608 Stone Meadow Ln
900 West Park Lane
839 Summit
301 San Ysidro Road
674 Oak Grove Drive
$16,850,000 $14,500,000 86% 150
$8,450,000 $7,825,000 93% 59
$7,950,000 $7,950,000 100% 1
$7,950,000 $6,780,000 85% 176
$5,900,000 $5,900,000 100% 1
$6,850,000 $5,700,000 83% 227
$5,825,000 $5,015,000 86% 85 1365 Virginia Road
830 Summit Road
547 Owen Road
919 Aleeda Lane
1557 Miramar Lane
$4,795,000 $4,675,000 97% 53
$4,795,000 $4,500,000 94% 11
$5,150,000 $4,500,000 87% 310
$3,950,000 $3,900,000 99% 17
$3,595,000 $3,620,000 101% 10 11 Cedar Lane
621 Barker Pass Road
195 Canon View Road
633 Circle Drive
875/885 Park Lane
FEBRUARY
$2,675,000 $2,675,000 100% 5
$2,500,000 $2,400,000 96% 22
$2,700,000 $2,700,000 100% 1
$1,950,000 $1,950,000 100% 1
$43,500,000 $36,800,000 85% 99
319 San Ysidro Road $39,950,000 $32,000,000 80% 1
777 Romero Cyn Rd $25,000,000 $25,124,500 100% 48
303 Meadowbrook Dr $13,000,000 $9,650,000 74% 455 ADDRESS
172 Santa Elena Lane $8,495,000 $8,470,000 100% 19 865 Romero Canyon Rd $7,100,000 $7,100,000
Arcady Road $5,295,000 $5,400,000 102% 27 285 Bonnie Lane $5,095,000 $4,900,000
MARCH
• DOM = Days on Market

LIST PRICE SOLD PRICE % LIST
DOM
454
740
3035
161
87% 100 988 Coyote Road $3,499,000 $2,500,000 71% 160 1530 Mimosa Lane $16,500,000 $16,500,000 100% 26
100% 220
Meadowbrook Dr $5,750,000 $5,950,000 103% 10 937
96% 1
Hot Springs Road $4,000,000 $4,000,000 100% 1
Hidden Valley Ln $3,595,000 $3,595,000 100% 1
Loureyro Road $3,495,000 $3,025,000
812 Buena Vista Ave $14,750,000 $14,750,000 100% 1 1580 Ramona Lane $8,450,000 $8,450,000 100% 1 1564 Ramona Lane $9,500,000 $8,200,000 86% 159 433 Alcala Lane $6,950,000 $6,550,000 94% 15 602 Parra Grande Ln $6,200,000 $5,800,000 94% 42 1320 Plaza Pacifica $4,500,000 $4,500,000 100% 13 227 Hot Springs Road $3,300,000 $3,300,000 100% 1 734 El Rancho Road $3,595,000 $3,210,000 89% 16 845 Woodland Drive $3,595,000 $3,075,000 86% 77 847 Deerpath Road $2,795,000 $2,650,000 95% 11 1050 Fairway Road $1,750,000 $1,700,000 97% 1 20 SOUTH SANTA BARBARA COUNTY MARKET REPORT | Q1 + MARCH 2024
- homes | estates | puds | condosSOLD VOLUME | Q1 2024 Distributed by Price Range Q1 TOTAL TOTAL SALES 41 Total Transactions Dollars In Millions

Q1 TOTAL SALES ALL CASH 24 of the 41 Total Sales
7% Q1 TOTAL SALES OFF MARKET 3 of the 41 Total Sales
21
MONTECITO
Information Deemed Reliable But Not Guaranteed. Data Provided by Fidelity National Title/Santa Barbara, CORT or SBAOR.
59%
41 sales
MONTECITO
homes | estates | puds | condos -
10 Year Trend | 2015—2024

SOLD VOLUME
BY
22 SOUTH SANTA BARBARA COUNTY MARKET REPORT | Q1 + MARCH 2024
-
|
QUARTER

$7,600,000
$5,015,000
23 MONTECITO - homes
estates
puds
condosSOLD PRICE | MEDIAN+AVERAGE ANALYSIS
Information Deemed Reliable But Not Guaranteed. Data Provided by Fidelity National Title/Santa Barbara, CORT or SBAOR.
|
|
|
21 Year Trend | 2019—Q1 2024

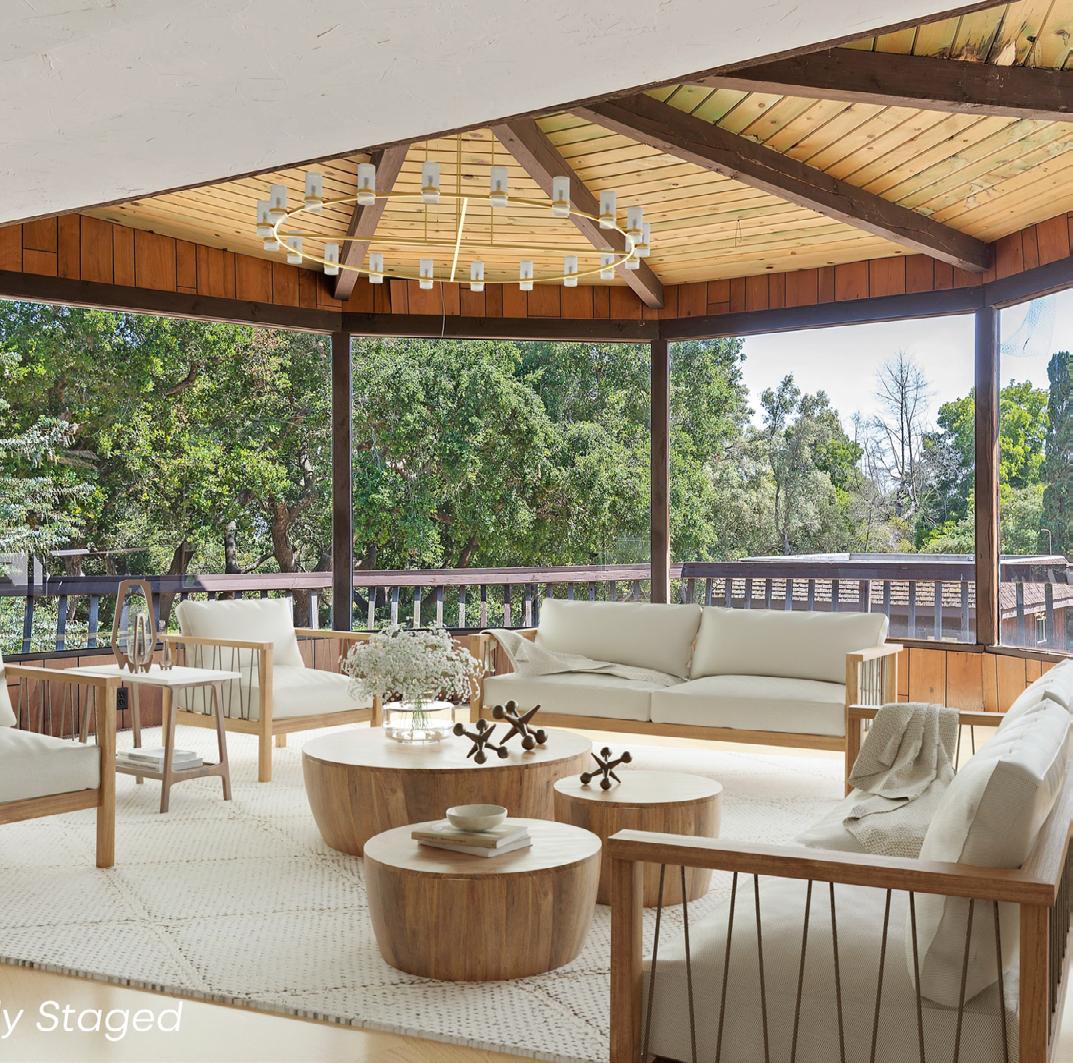
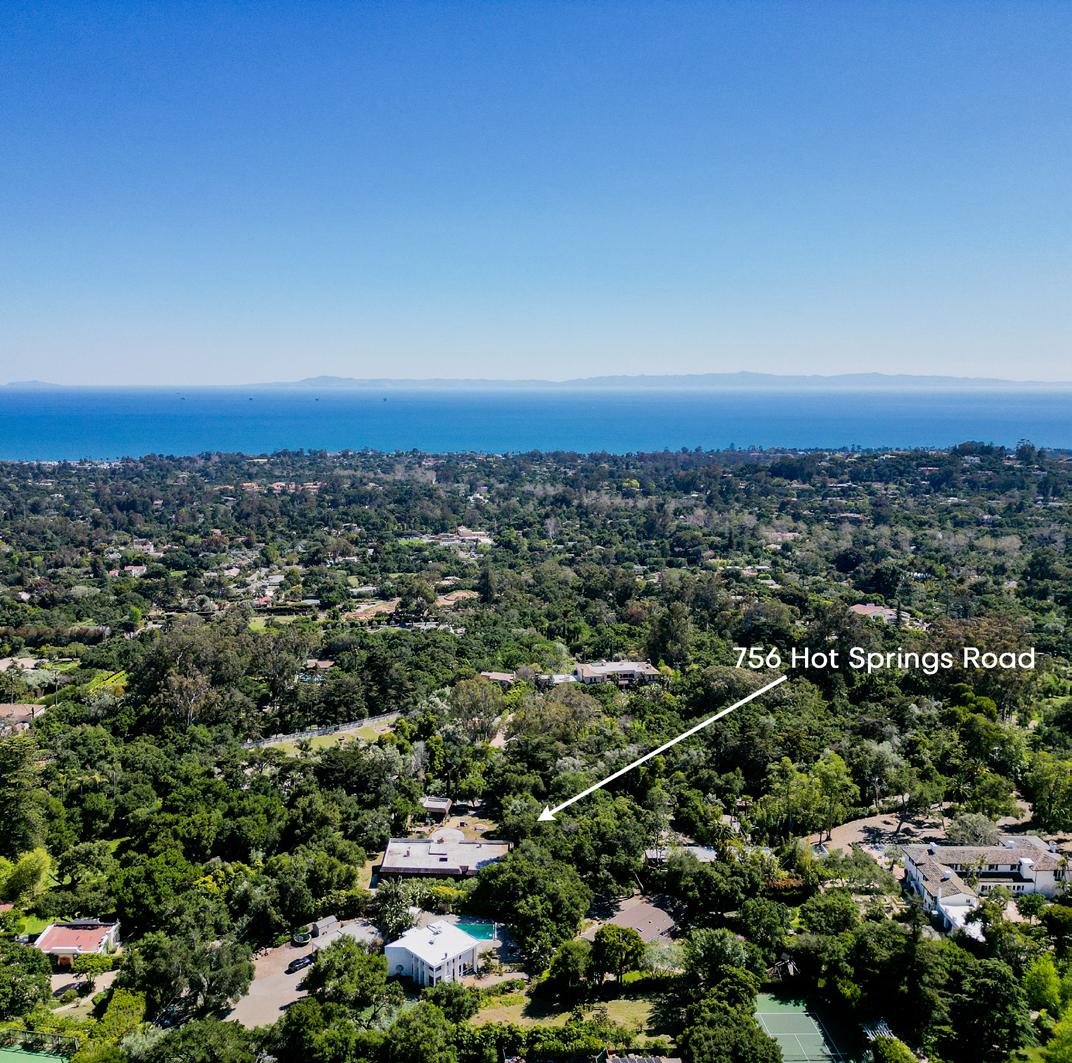
756 HOT SPRINGS ROAD | MONTECITO CA 93108 Golden Opportunity in the Quadrangle | Make it Your Own 4 BD | 3 BA | 4034± SF | 1.08± AC | 860 Lower Extra SF | Guest Cottage SOLD for the Exceptional Price of $4,600,000 Exclusive Offering by Randy Haden/Molly Haden 24 SOUTH SANTA BARBARA COUNTY MARKET REPORT | Q1 + MARCH 2024
SOLD
We were delighted to negotiate the Ultra Premium Price of $4,600,000 for our Seller—Despite Numerous Issues with the Existing Home and Multiple MUCH Lower Offers, We Succeeded in Selling the Vision and Value of the Opportunity. Our Commitment to Maximizing the Value of your Property Results in the Absolute Best Possible Terms and Price.
Let's Discuss How We Can Do The Same For You—Experience Matters!

25

HOPE RANCH
Q1+MARCH 2024 | In Review Residential Real Estate Update

HOPE RANCH
Q1 2024 REPORT | In Review
Single Family Homes (no condos in Hope Ranch) -57% change over 2023
SINGLE FAMILY HOMES
TOTAL YTD SALES
-57% change over 2023
3
AVERAGE SALES PRICE
-9% increase over 2023
$6,162,900
MEDIAN SALES PRICE
-9% increase over 2023
$6,618,000
TOTAL AVERAGE DAY ON MARKET
3 CONDOMINIUM HOMES No Condos in Hope Ranch N/A
AVERAGE SALES PRICE N/A
MEDIAN SALES PRICE N/A
46 SOLD TO ORIGINAL LIST PRICE 89%
28 SOUTH SANTA BARBARA COUNTY MARKET REPORT | Q1 + MARCH 2024
HOPE RANCH
MARCH 2024 | In Review
Single Family Homes (no condos in Hope Ranch) -57% change over 2023 1
AVERAGE SALES PRICE
+19% change from 2023
$6,618,000
MEDIAN SALES PRICE
+11% change from 2023
$6,618,000
HIGHEST SALES PRICE
710 Monte Drive
Hope Ranch CA 93110
$6,618,000
LOWEST SALES PRICE
710 Monte Drive Hope Ranch CA 93110
$6,618,000
TOTAL AVERAGE DAY ON MARKET 13 SOLD TO ORIGINAL LIST PRICE 100.3%
REAL TIME MARKET DATA - click -
29
HOPE RANCH Q1 2024 | 3 TRANSACTIONS

• DOM = Days on Market Information Deemed Reliable But Not Guaranteed. Data Provided by Fidelity National Title/Santa Barbara, CORT or SBAOR. Address List Price Sold Price % to List DOM Month 4161 Creciente Drive $9,750,000 $7,500,700 77% 138 January 4157 Lago Drive $4,370,000 $4,370,000 100% 1 January 710 Monte Drive $6,595,000 $6,618,000 100.3% 13 March
30 SOUTH SANTA BARBARA COUNTY MARKET REPORT | Q1 + MARCH 2024
HOPE RANCH
- homes | estates | puds -
Distributed by Price Range

3 sales
Q1 2024 TOTAL SALES 3 Total Transactions Dollars In Millions
31
Q1 2024 TOTAL SALES
Information Deemed Reliable But Not Guaranteed. Data Provided by Fidelity National Title/Santa Barbara, CORT or SBAOR.
33% Q1 TOTAL SALES OFF MARKET 1 of the 3 Total Sales 66% Q1 TOTAL SALES ALL CASH 2 of the 3 Total Sales
32 SOUTH SANTA BARBARA COUNTY MARKET REPORT | Q1 + MARCH 2024
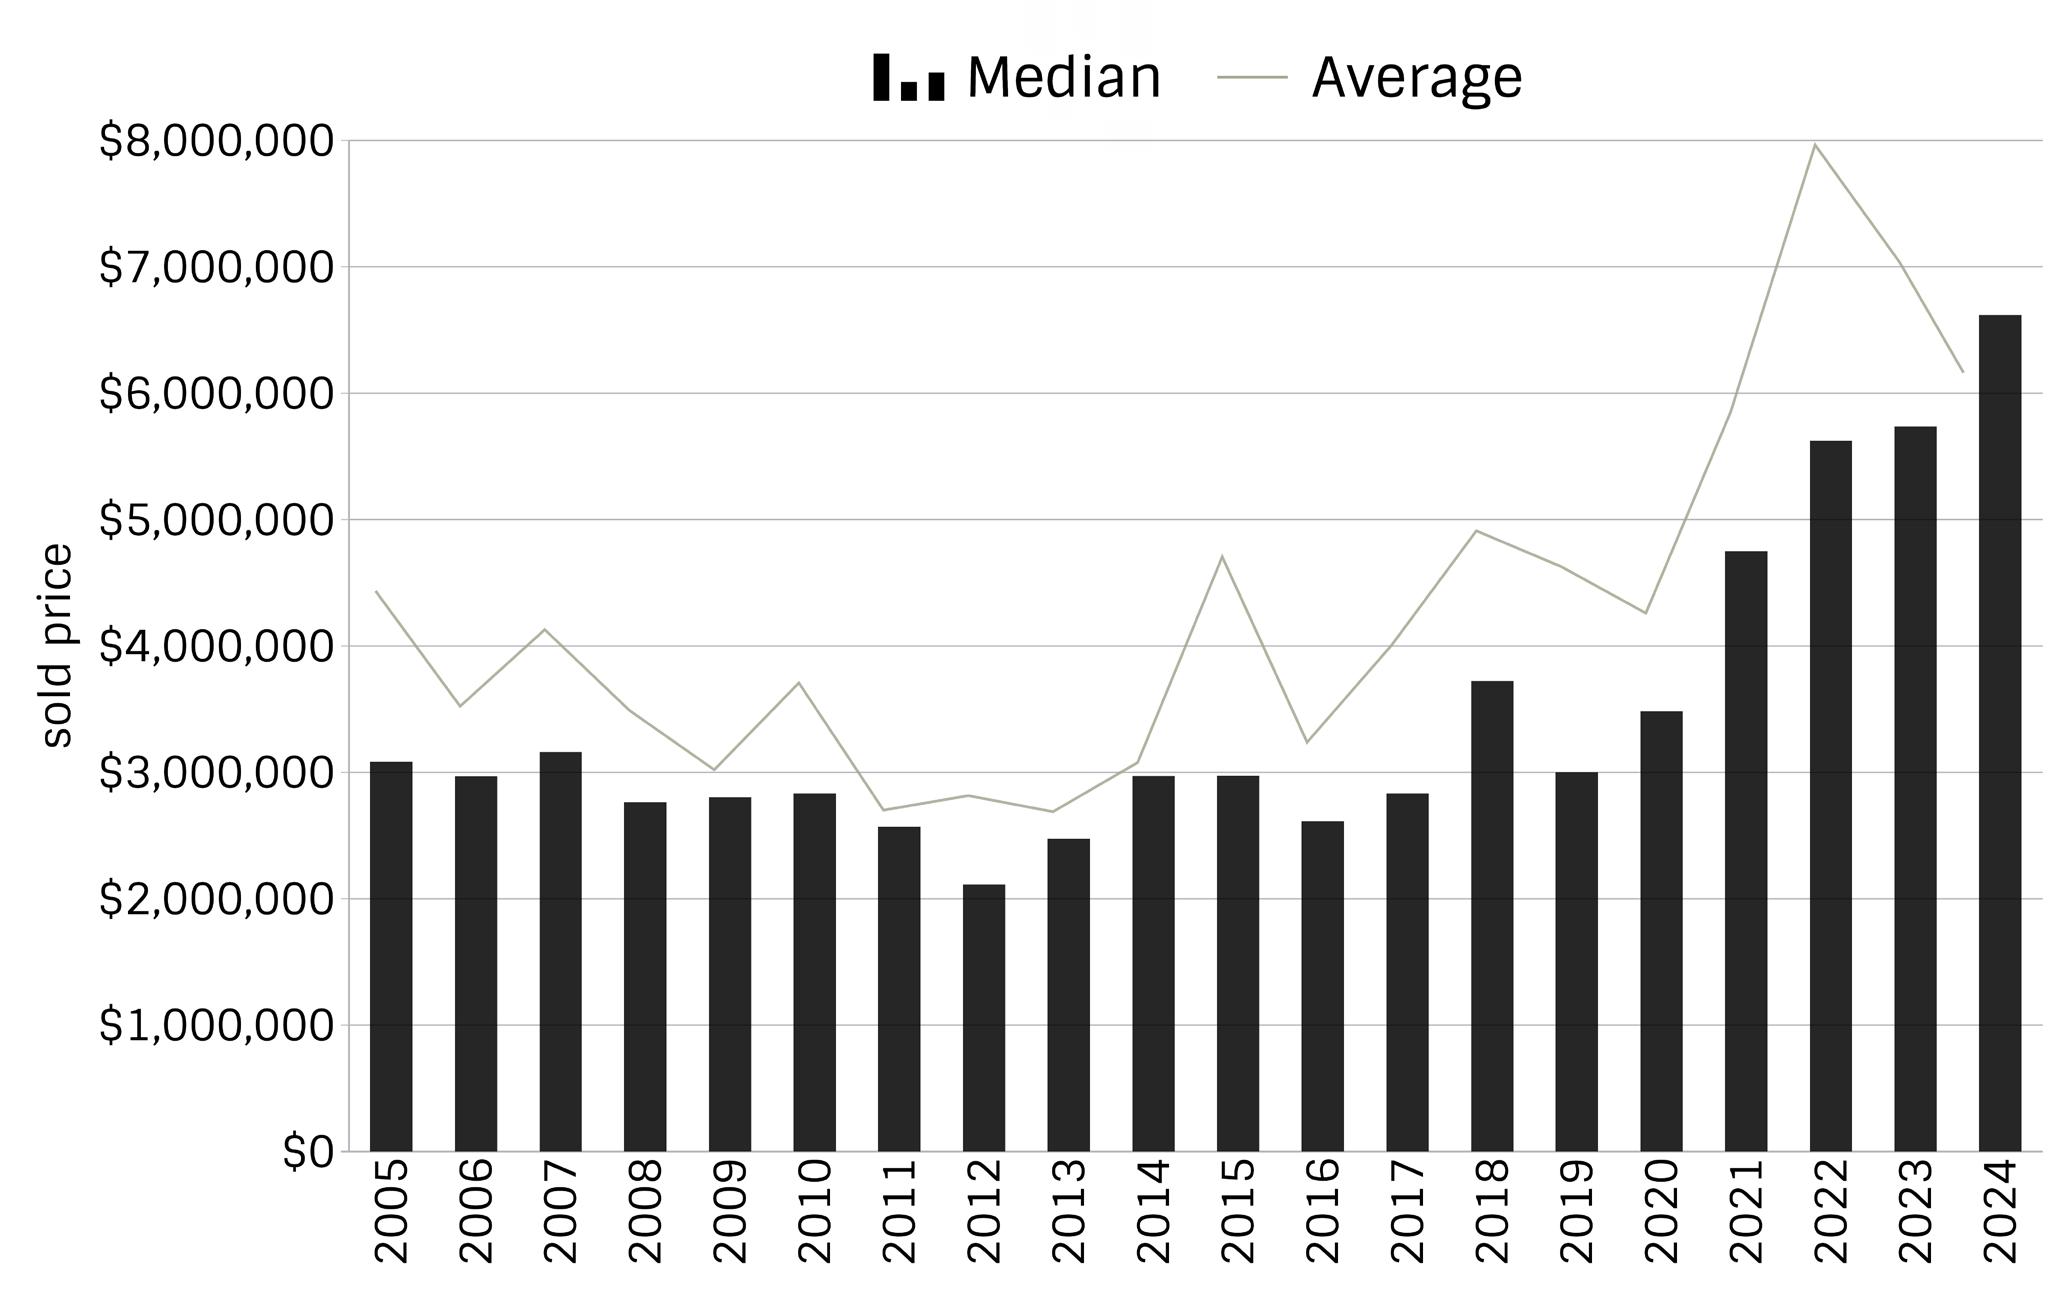
$6,618,000
33 HOPE
- homes | estates | puds SOLD PRICE | MEDIAN+AVERAGE ANALYSIS 20
Information Deemed Reliable But Not Guaranteed. Data Provided by Fidelity National Title/Santa Barbara, CORT or SBAOR.
RANCH
Year Trend | 2005—Q1 2024
SANTA BARBARA

Q1+MARCH 2024 | In Review Residential Real Estate Update
BARBARA

SANTA BARBARA
Q1 2024 REPORT | In Review
Single Family Homes + Condominiums +14% change over 2023
125
SINGLE FAMILY HOMES
TOTAL YTD SALES
+31% change over 2023
94
AVERAGE SALES PRICE -1% increase over 2023
$2,390,693
MEDIAN SALES PRICE +8% increase over 2023
$2,100,000
CONDOMINIUM HOMES
TOTAL YTD SALES 0% change over 2023
31
AVERAGE SALES PRICE -15% change over 2023
$1,130,872
MEDIAN SALES PRICE -22% change over 2023
$1,010,000
36 SOUTH SANTA BARBARA COUNTY MARKET REPORT | Q1 + MARCH 2024
SANTA BARBARA
MARCH 2024 | IN REVIEW
Single Family Homes + Condominiums (combined sales)
AVERAGE SALES PRICE
+1% change from 2023
$2,187,204
MEDIAN SALES PRICE
-3% change from 2023
$1,900,000
HIGHEST SALES PRICE
810 Largura Place Santa Barbara CA 93103
$4,950,000
LOWEST SALES PRICE
211 West Gutierrez Street, #2 Santa Barbara CA 93101
$417,000 Condominium Home
37
48
REAL TIME MARKET DATA - click -

3139 SEA CLIFF | SANTA
BARBARA
Undeniable
Sea Cliff
Opportunity
Lot Split
Home 3 BD | 3 BA | 3045± SF | 1.46± AC Court Overbid / Opening Bid $4.330,000 / Offered at $5,999,000 Exclusive Offering by Randy Haden/Molly Haden -
Randy Haden at 805-880-6530 for overbid process court date, rules and logistics38 SOUTH SANTA BARBARA COUNTY MARKET REPORT | Q1 + MARCH 2024
Momentum on
|
for
| Existing
contact
COURT OVERBID
This property will be sold by way of a public confirmation and overbid hearing. The opening bid will be $4,330,000, with successive bid increments of $10,000.
Hearing will be on Thursday May 16, 2024 at 9:00 am. Prequalified bidders may appear in person or remotely via zoom. Contact us directly for a private tour, property details, disclosures/repots, process logistics and prequalification.
Randy Haden | 805-880-6530
— MORE DETAILS


SANTA BARBARA
93103
40 SOUTH SANTA BARBARA COUNTY MARKET REPORT | Q1 + MARCH 2024
1322 DOVER ROAD |
CA
Dramatic Upper Riviera Ocean View Parcel | Plans Available 0.82± Acres Parcel | Double Wide Vacant Lot | Existing Pool Pending / Offered at $3,100,000 Exclusive Offering by Randy Haden/Molly Haden

Q1+MARCH 2024 | In Review Residential Real Estate Update SUMMERLAND
SUMMERLAND
SUMMERLAND
Q1 2024 REPORT | In Review
Single Family Homes + Condominiums -75% change over 2023 1
SINGLE FAMILY HOMES
TOTAL YTD SALES
-75% change over 2023
1
AVERAGE SALES PRICE
-29% increase over 2023
$3,700,000
MEDIAN SALES PRICE
-6% increase over 2023
$3,700,000
CONDOMINIUM HOMES
TOTAL YTD SALES n/a change over 2023
0
AVERAGE SALES PRICE N/A
MEDIAN SALES PRICE N/A
44 SOUTH SANTA BARBARA COUNTY MARKET REPORT | Q1 + MARCH 2024
SUMMERLAND
MARCH 2024 | IN REVIEW
Single Family Homes + Condominiums (combined sales)
AVERAGE SALES PRICE N/A
HIGHEST SALES PRICE N/A
MEDIAN SALES PRICE N/A
LOWEST SALES PRICE N/A REAL TIME MARKET DATA - click -
45
0

CARPINTERIA
Update
Q1+MARCH 2024 | In Review Residential Real Estate
CARPINTERIA
Q1 2024 REPORT | In Review
Single Family Homes + Condominiums
23
SINGLE FAMILY HOMES
TOTAL YTD SALES
-57% change over 2023
6
AVERAGE SALES PRICE -54% increase over 2023
$1,687,029
MEDIAN SALES PRICE -64% increase over 2023
$1,289,588
CONDOMINIUM HOMES
TOTAL YTD SALES +70% change over 2023
17
AVERAGE SALES PRICE +11% change over 2023
$802,824
MEDIAN SALES PRICE +6% change over 2023
$800,000
48 SOUTH SANTA BARBARA COUNTY MARKET REPORT | Q1 + MARCH 2024
CARPINTERIA
MARCH 2024 | IN REVIEW
Single Family Homes + Condominiums (combined sales)
AVERAGE SALES PRICE
-47% change from 2023
$1,104,279
MEDIAN SALES PRICE
+11% change from 2023
$1,126,088
HIGHEST SALES PRICE
6379 Lagunitas Court Carpinteria CA 93013
$1,675,000
LOWEST SALES PRICE
5966 Hickory Street, Unit 3 Carpinteria CA 93013
$587,000 Condominium Home
49
6
REAL TIME MARKET DATA - click -

GOLETA
Q1+MARCH 2024 | In Review Residential Real Estate Update

GOLETA
Q1 2024 REPORT | In Review
Single Family Homes + Condominiums
+38% change over 2023
81
SINGLE FAMILY HOMES
TOTAL YTD SALES
+15% change over 2023
51
AVERAGE SALES PRICE
+15% increase over 2023
1,756,211
MEDIAN SALES PRICE
+2% increase over 2023
$1,585,000
CONDOMINIUM HOMES
TOTAL YTD SALES
+41% change over 2023
31
AVERAGE SALES PRICE +8% change over 2023
$987,816
MEDIAN SALES PRICE -1% change over 2023
$900,000
52 SOUTH SANTA BARBARA COUNTY MARKET REPORT | Q1 + MARCH 2024
MARCH 2024 | IN REVIEW
Single Family Homes + Condominiums (combined sales)
AVERAGE SALES PRICE
$1,567,006
MEDIAN SALES PRICE
$1,520,000
HIGHEST SALES PRICE
1225 Franklin Ranch Road Goleta CA 93117
$2,695,000
LOWEST SALES PRICE
5518 Armitos Avenue, Unit 81 Goleta CA 93117
$525,000 Condominium Home REAL TIME MARKET DATA - click -
53
33 GOLETA
SANTA YNEZ VALLEY

Q1+MARCH 2024 | In Review Residential Real Estate Update
VALLEY

56 SOUTH SANTA BARBARA COUNTY MARKET REPORT | Q1 + MARCH 2024
SANTA YNEZ VALLEY
Single Family Homes + Condominiums
SINGLE FAMILY HOMES
TOTAL YTD SALES
-10% change over 2023
26
AVERAGE SALES PRICE
+26% increase over 2023
$2,387,173
MEDIAN SALES PRICE
+11% increase over 2023
$1,537,500
36 CONDOMINIUM HOMES
TOTAL YTD SALES
+233% change over 2023
10
AVERAGE SALES PRICE
+26% change over 2023
$738,950
MEDIAN SALES PRICE
+12% change over 2023
$682,500
REAL TIME MARKET DATA - click -
57 Q1
Review
2024 REPORT | In


RANDY HADEN Broker Associate / Realtor DRE 01988499 805.880.6530 randy@hadenhomes.com LET’S CONNECT www.hadenhomes.com @hadenhomesrealtors 1% Top 1% of Local Agents CHOOSE experience MOLLY HADEN
/ Marketing Director DRE 02020380
58 SOUTH SANTA BARBARA COUNTY MARKET REPORT | Q1 + MARCH 2024
Realtor
805.880.6540 molly@hadenhomes.com


CONCIERGE Real Estate Service
EXPERT PERSPECTIVE
Now more than ever you need an expert advisor on your side who can provide comprehensive analysis and exclusive insights into today’s fast-paced housing market. We see every luxury property available and know the market. Our commitment to staying educated on what’s happening with economic news, the real estate market, local sales and listings is essential to your success when buying or selling properties.
CONCIERGE SERVICE
We strive to deliver a high level of personalized service—personally! We provide our clients with cutting-edge strategies that produce ideal results. Our exceptional service is driven by efficient communication, understanding your needs and having expansive industry resources— combined with expert knowledge of the extensive contracts and required forms to protect your best interests. The process comes together as a result of our years of successful negotiating which leads to a winning deal. We listen carefully, anticipate your needs, execute the deal and handle all the details. The hard work starts when a contract is in place so you will be happy you chose representation experienced in closing the deal smoothly.
COMMUNITY INVESTMENT
Sell a Home | Build a Home initiative. We are deeply connected and committed to the communities in which we live and work. Haden Homes Luxury Property Group has made a pledge to help individuals with housing needs by partnering with Habitat for Humanity. For every home that our clients buy or sell, Haden Homes makes a donation to Santa Barbara’s Habitat for Humanity.
59

DISCRETION
Privacy is the Ultimate Commodity And the Decision to Sell Your Home Is a Personal One.
FLEXIBILITY
Decide When to Share Details About Your Home - Including PriceMore Expansively On Your Own Timing.
QUALITY
Exclusive Exposure To Compass Agents, Including Premium Placements On Agent Facing Platform.
VALUE
Get the Best Offer by Testing The Market Privately to Gather Key Insights Without Your Listing Getting Stale or Overexposed.

60 SOUTH SANTA BARBARA COUNTY MARKET REPORT | Q1 + MARCH 2024


COMPASS PRIVATE EXCLUSIVE LISTINGS
Ask Us About Our Exciting Private Exclusive Listings | Contact Us Live For details!
A Compass Private Exclusive listing is an off-market home that can be shared by a Compass agent directly with their colleagues and their buyers. Property details are not disseminated widely and won’t appear on public home search websites.
Listing your home as a private exclusive allows you to control what information is shared about you and your home while still getting exposure to top agents at Compass.

THE TALK IS BUYERS AGENTS ZESTIMATES, STAGING + MORE
- click link for full articleThe Best Week to Put Your Home on the Market Is Fast Approaching
90% of Homebuyers Have Historically Opted to Work with a Real Estate Agent or Broker. Here’s Why That's Unlikely to Change, According to NAR
US Home Price Growth Is Back to Where It Was Pre-Pandemic
These Home Improvement Projects Are Tax Deductible Don't Be Fooled By The Inaccuracy Of Zillow Zestimates Is Home Staging Worth the Hype?
Why Sign A Buyer Representation Agreement | Robert Reffkin
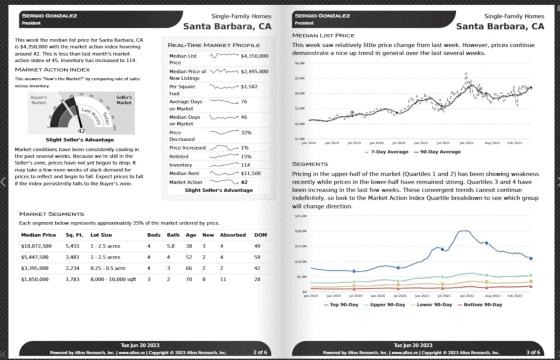

63 REAL TIME DATA ACTIVE STATS AND TRENDS FOR SOUTH
- Click Below for the Latest Active Stats + TrendsReal Time Data Courtesy of: Chartwell Escrow MONTECITO SUMMERLAND SANTA BARBARA 93103 CARPINTERIA HOPE RANCH SANTA BARBARA 93105 SANTA BARBARA 93101 SANTA BARBARA 93109 HOW TO READ THIS REPORT
SANTA BARBARA COUNTY

DATA SOURCES | LISTING DISCLOSURE
All information provided is deemed reliable but has not been verified. We do not guarantee it and recommend buyers make their own inquiries. Data source Fidelity National Title of Santa Barbara, CORT and Santa Barbara MLS. INdata Real Estate Market Reporting through March 2024.
Properties featured are courtesy of the Santa Barbara MLS and are available for sale at time of publication. They may be listed by brokers and/or agents other than Compass or Haden Homes Luxury Property Group. Contact us for details or to set up a private showing at 805.880.6530.

CHICAGO TITLE FIDELITY NATIONAL TITLE
SANTA BARBARA MLS

65


RANDY HADEN Broker Associate / Realtor randy@hadenhomes.com 805.880.6530 MOLLY HADEN Realtor / Marketing Director molly@hadenhomes.com 805.880.6540 @hadenhomesrealtors


