
market report november 2022 | haden homes luxury property group / compass | montecito south SANTA BARBARA COUNTY Residential Real Estate Market Report November 2022

SOUTH
COUNTY MARKET REPORT | NOVEMBER 2022 REAL ESTATEIT’S LOCAL we know the market—let’s talk! STEARNS WHARF CHRISTMAS TREE | SANTA BARBARA | NOVEMBER 2022
2
SANTA BARBARA
Hello Family and Friends -

As we move quickly into the New Year we are enjoying spending time with family and friends and hope you are all doing the same!
The real estate market in the Santa Barbara/Montecito area has been noticeably quieter all year, but we can say for sure that there are many buyers looking for properties in our beautiful community. With the national headlines about economic uncertainty and downward market shifts, Montecito has defied the national trends and continued to increase in value with many affluent individuals buying here. Santa Barbara and Hope Ranch homes continue to sell and sell at high price points as well.
The inventory remains historically low which has been keeping prices up since there are not enough homes to meet demand. In fact, with only 57 Single Family Homes (SFH) sold during November - this has been the lowest level all year. Homeowners are still seeing positive YOY appreciation so we are optimistically expecting inventory to increase in 2023 with the busy holiday season behind us. Home ownership is still a solid hedge against inflation and an investment in your future!
Let’s have a quick look of some highlights and review of the stats. Full report to follow including properties currently available that we feel are good values.
- Highest November Sale at 465 Hot Springs Road Montecito $11,5000,000
- 40% All-Cash Sales
- 7 Homes Traded “Off Market”
- 6 Homes Traded Over $5M
- Closed Price is 95% to Final List Price
Market Statistic Overview November 2022 vs 2021 | Price is UP ↑ and Supply is DOWN ↓
- Total Active Listings Down -29%
- Told Sold Properties -34%
- Median Sales Price +14%
- New Listings Down -25%
- Sold Dollar Volume -28%
In this market, experience matters. If you’re thinking about making a move—don’t delay. Let us help you accomplish your goals in 2023. Working with an experienced team like us who understands how to position and market your home will give you the best chance to realize the highest price with the most favorable terms. Contact us to get ahead of your competition!
We offer concierge level professional service to our clients with world-class marketing, a proven track record of success, the skills necessary to put complicated deals together and negotiate the price and terms that will get your home sold and your offer accepted on your next property. Our goal is to get you the best price for your existing home and find you the right replacement property with minimal stress. Let’s explore your property’s current valuation and discuss a strategy.
Looking for professional + creative results-oriented representation - Let’s Talk!
3
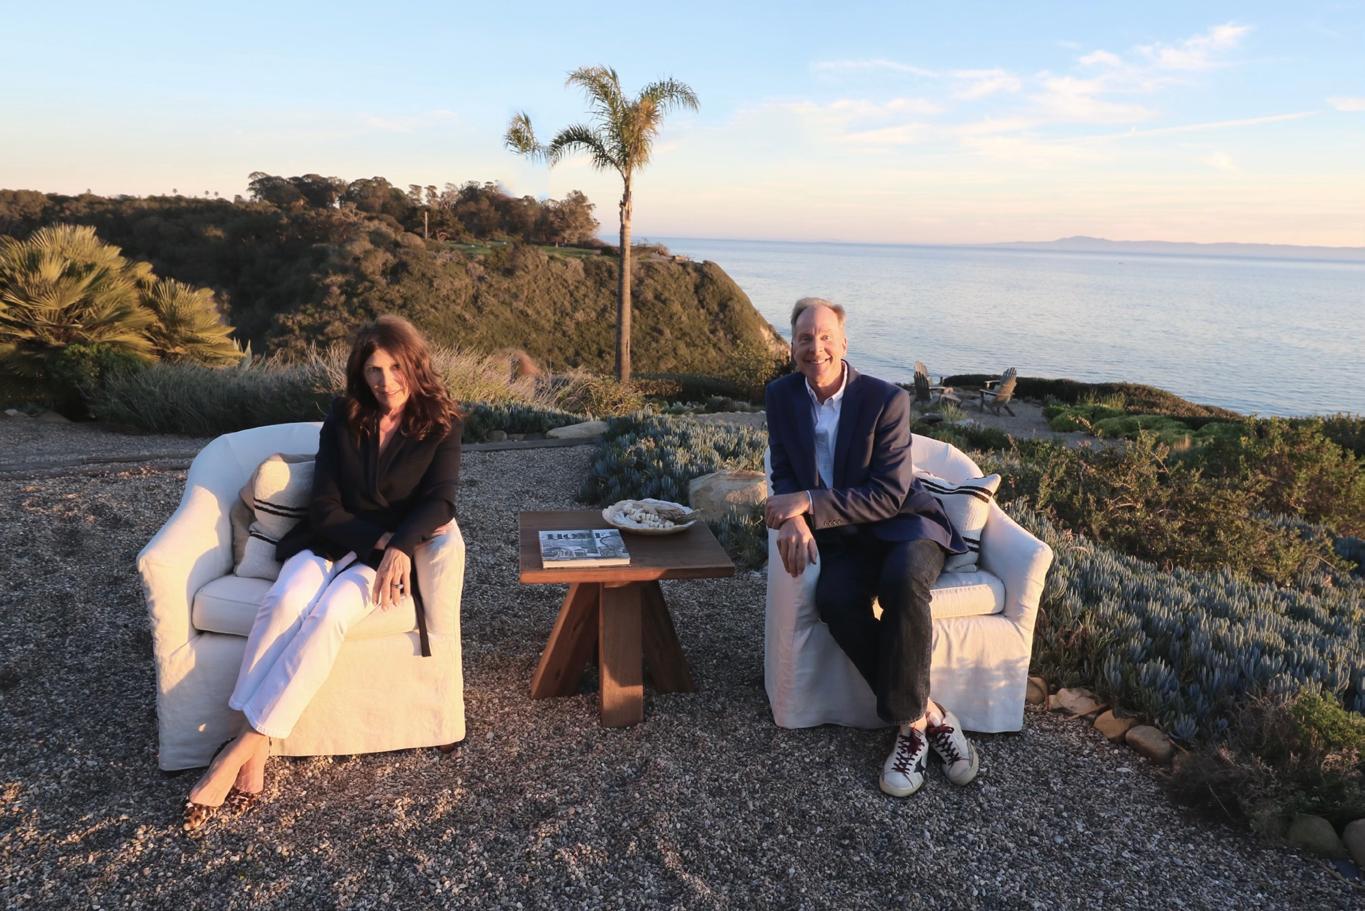
Randy and Molly
4 SOUTH SANTA BARBARA COUNTY MARKET REPORT | NOVEMBER 2022
DAY | THIS
WE DO IT
FEATURED PROPERTIES CLICK for inventory
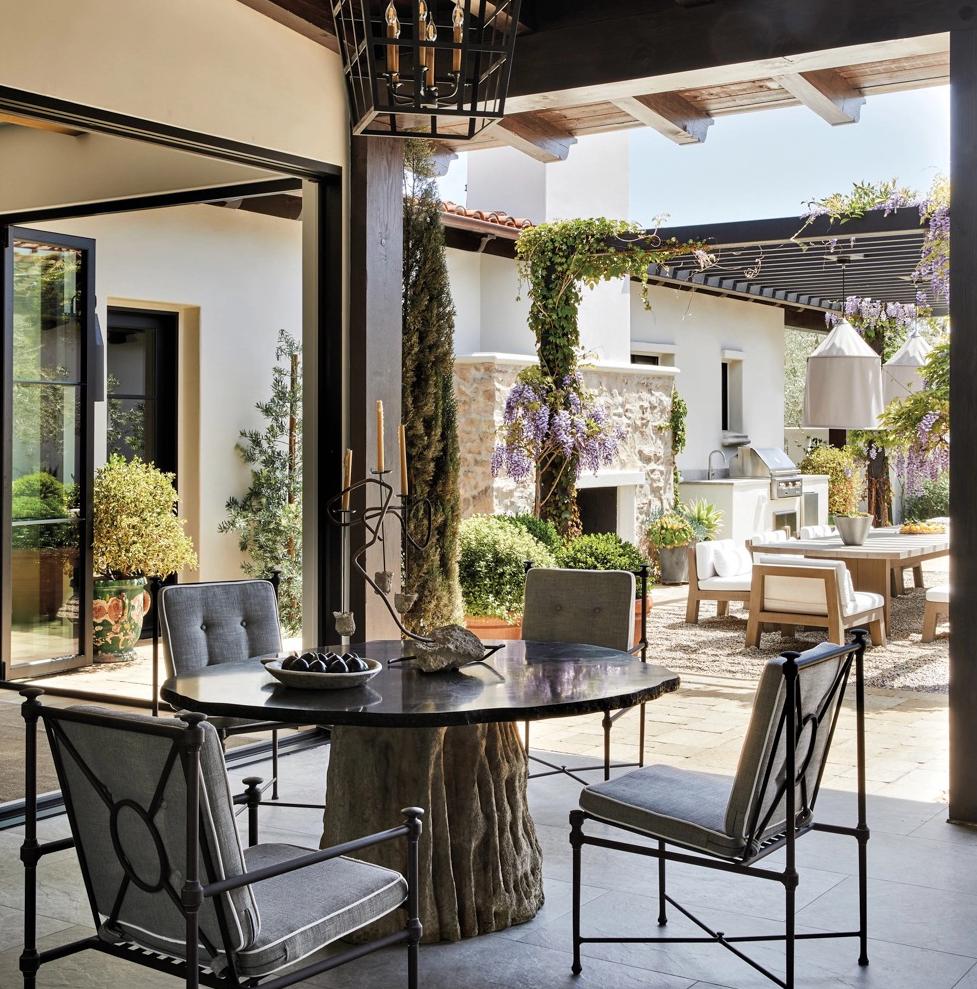
AL FRESCO EVERY
IS HOW
HERE IN SANTA BARBARA
5 - southSANTA BARBARA COUNTY SINGLE FAMILY RESIDENCES YTD TOTAL SALES -34% change over 2021 957 AVERAGE SALES PRICE +8% increase over 2021 $3,276,242 MEDIAN SALES PRICE +11% increase over 2021 $2,104,000 CONDOMINIUM HOMES YTD TOTAL SALES -35% change over 2020 410 AVERAGE SALES PRICE +15% change over 2021 $1,199,090 MEDIAN SALES PRICE +14% change over 2021 $958,000 YTD THROUGH NOVEMBER 2022 | In Review Single Family Residences + Condominiums -34% change over 2021 1367

6 SOUTH
SANTA BARBARA
COUNTY MARKET REPORT | NOVEMBER 2022
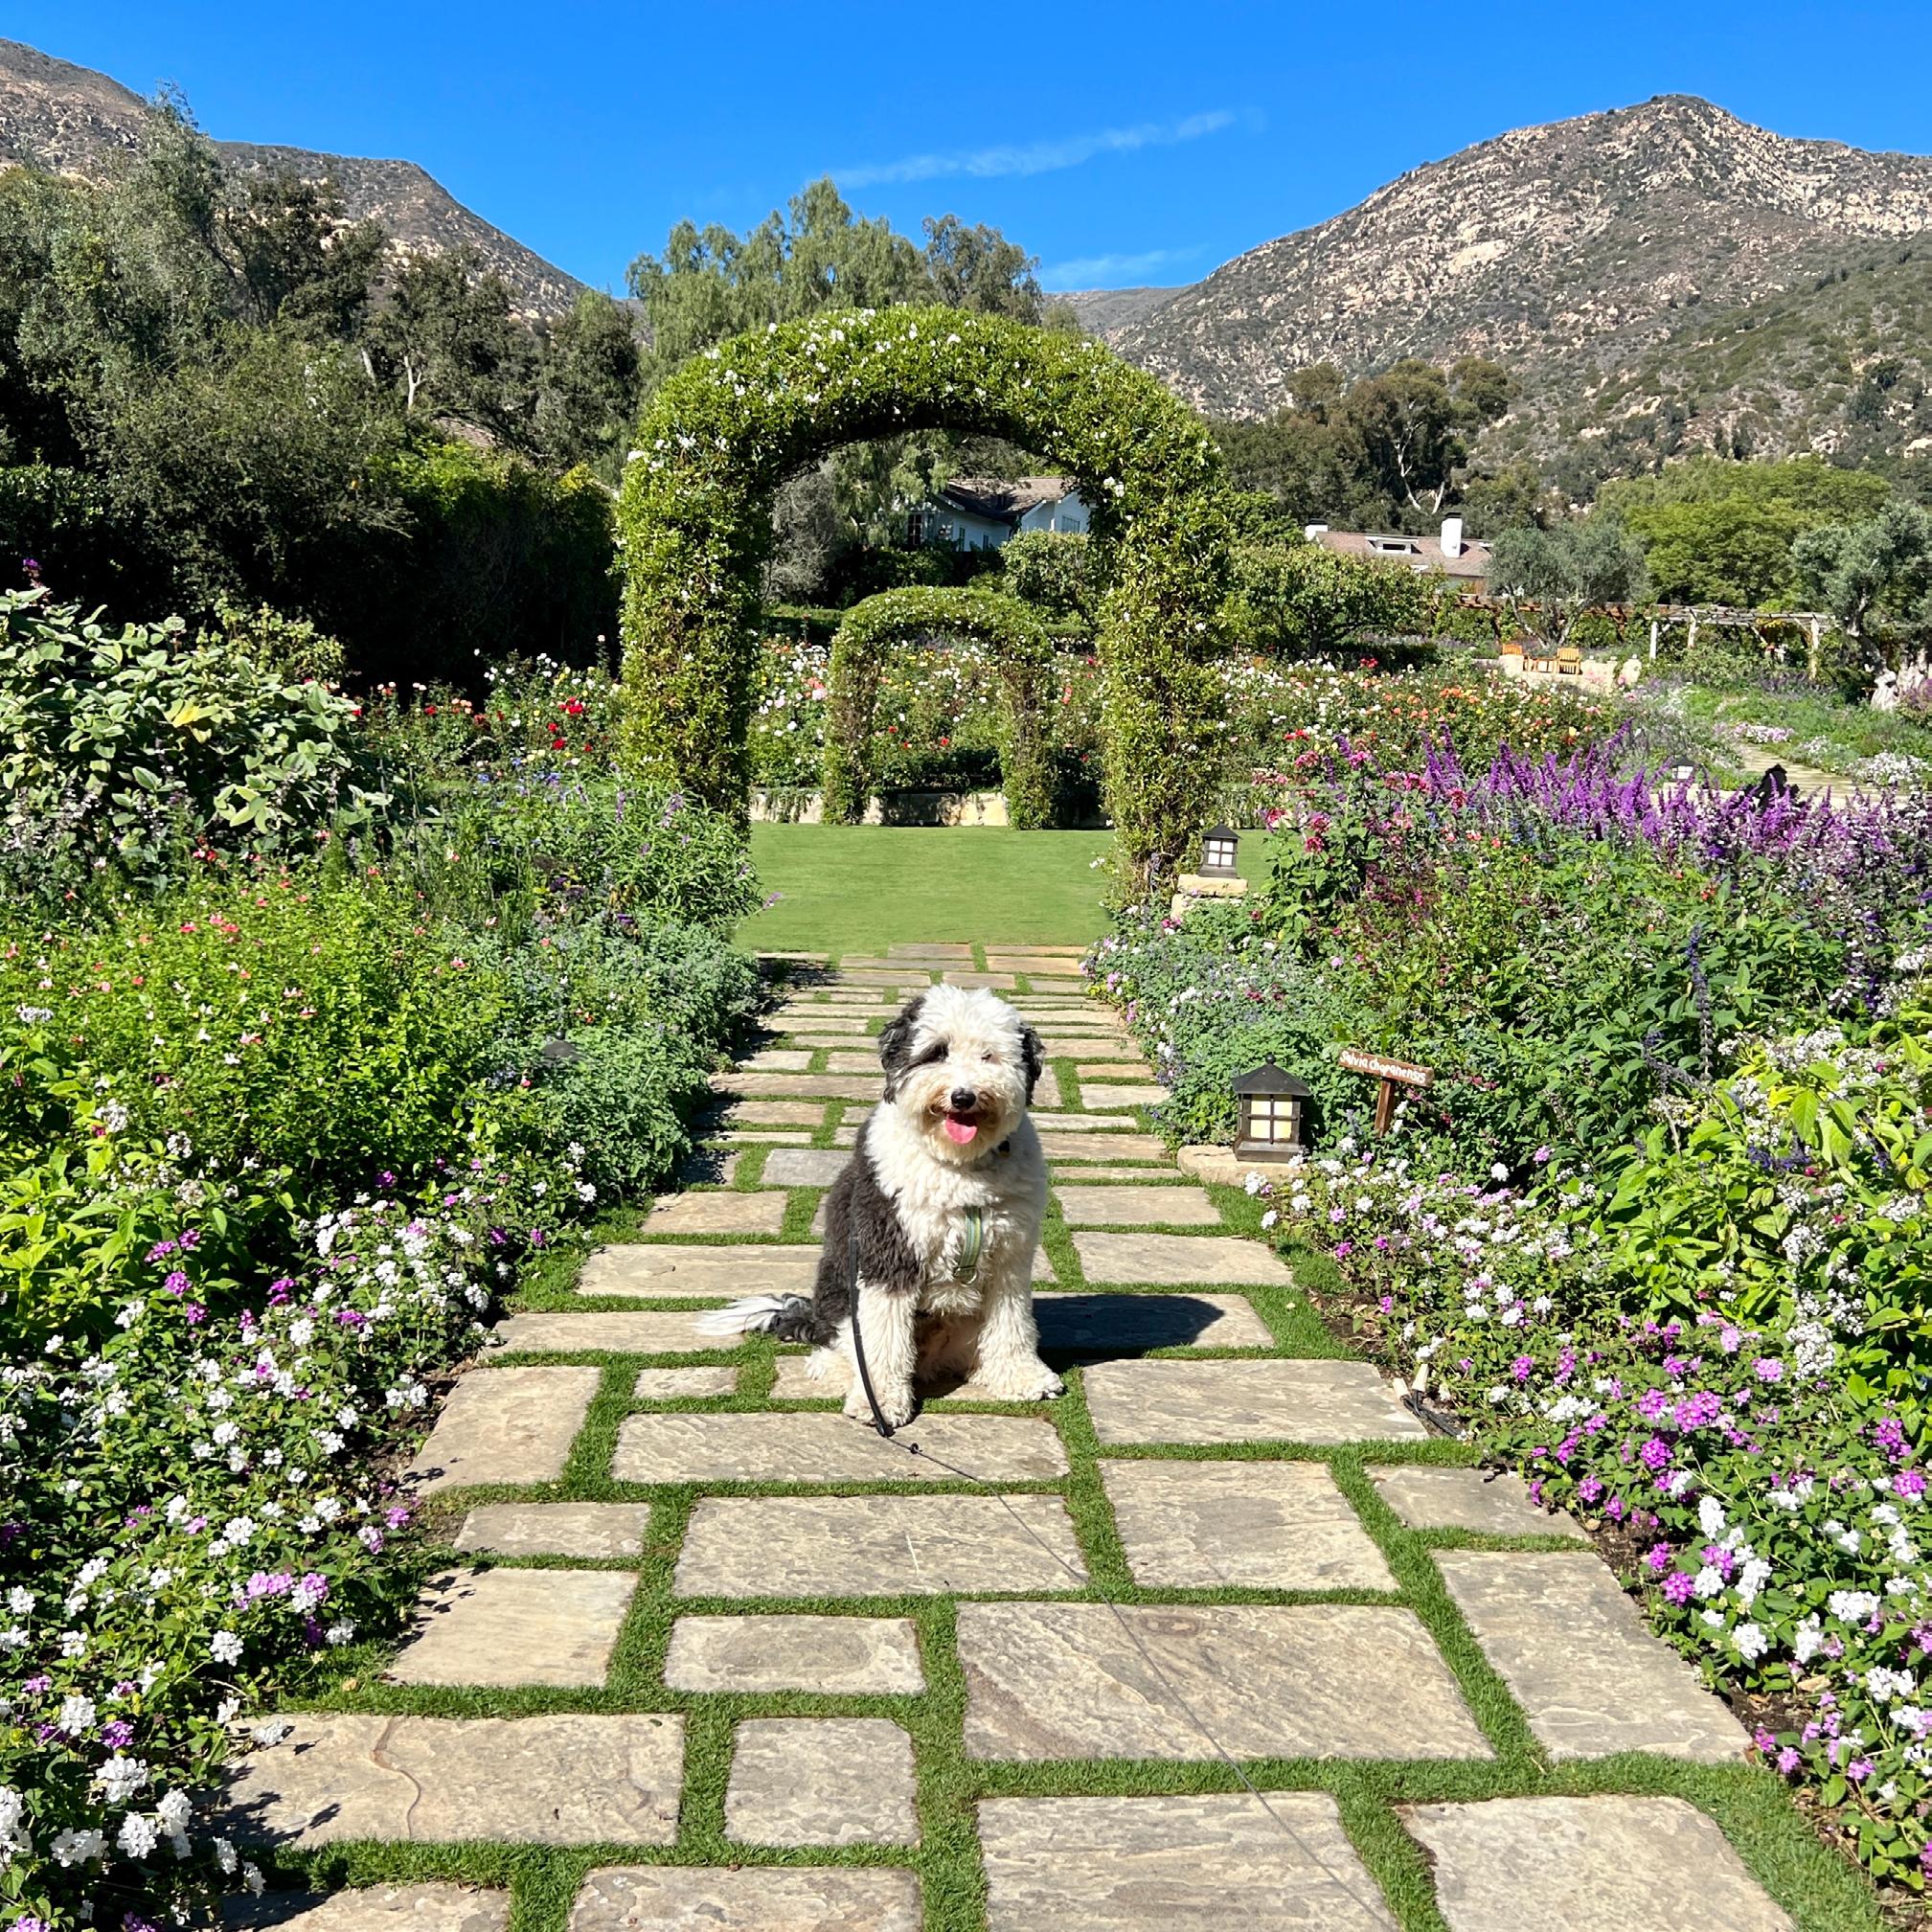
BANDIT ENJOYING THE OUTSTANDING GARDENS AT THE SAN YSIDRO RANCH
7 - southSANTA BARBARA COUNTY SINGLE FAMILY RESIDENCES TOTAL SALES -41% change over 2021 57 AVERAGE SALES PRICE -20% increase over 2021 $2,293,720 MEDIAN SALES PRICE -18% increase over 2021 $1,725,000 CONDOMINIUM HOMES TOTAL SALES -48% change over 2020 28 AVERAGE SALES PRICE +20% change over 2021 $1,282,286 MEDIAN SALES PRICE +25% change over 2021 $1,055,000 NOVEMBER 2022 | In Review Single Family Residences + Condominiums -43% change over 2021 85
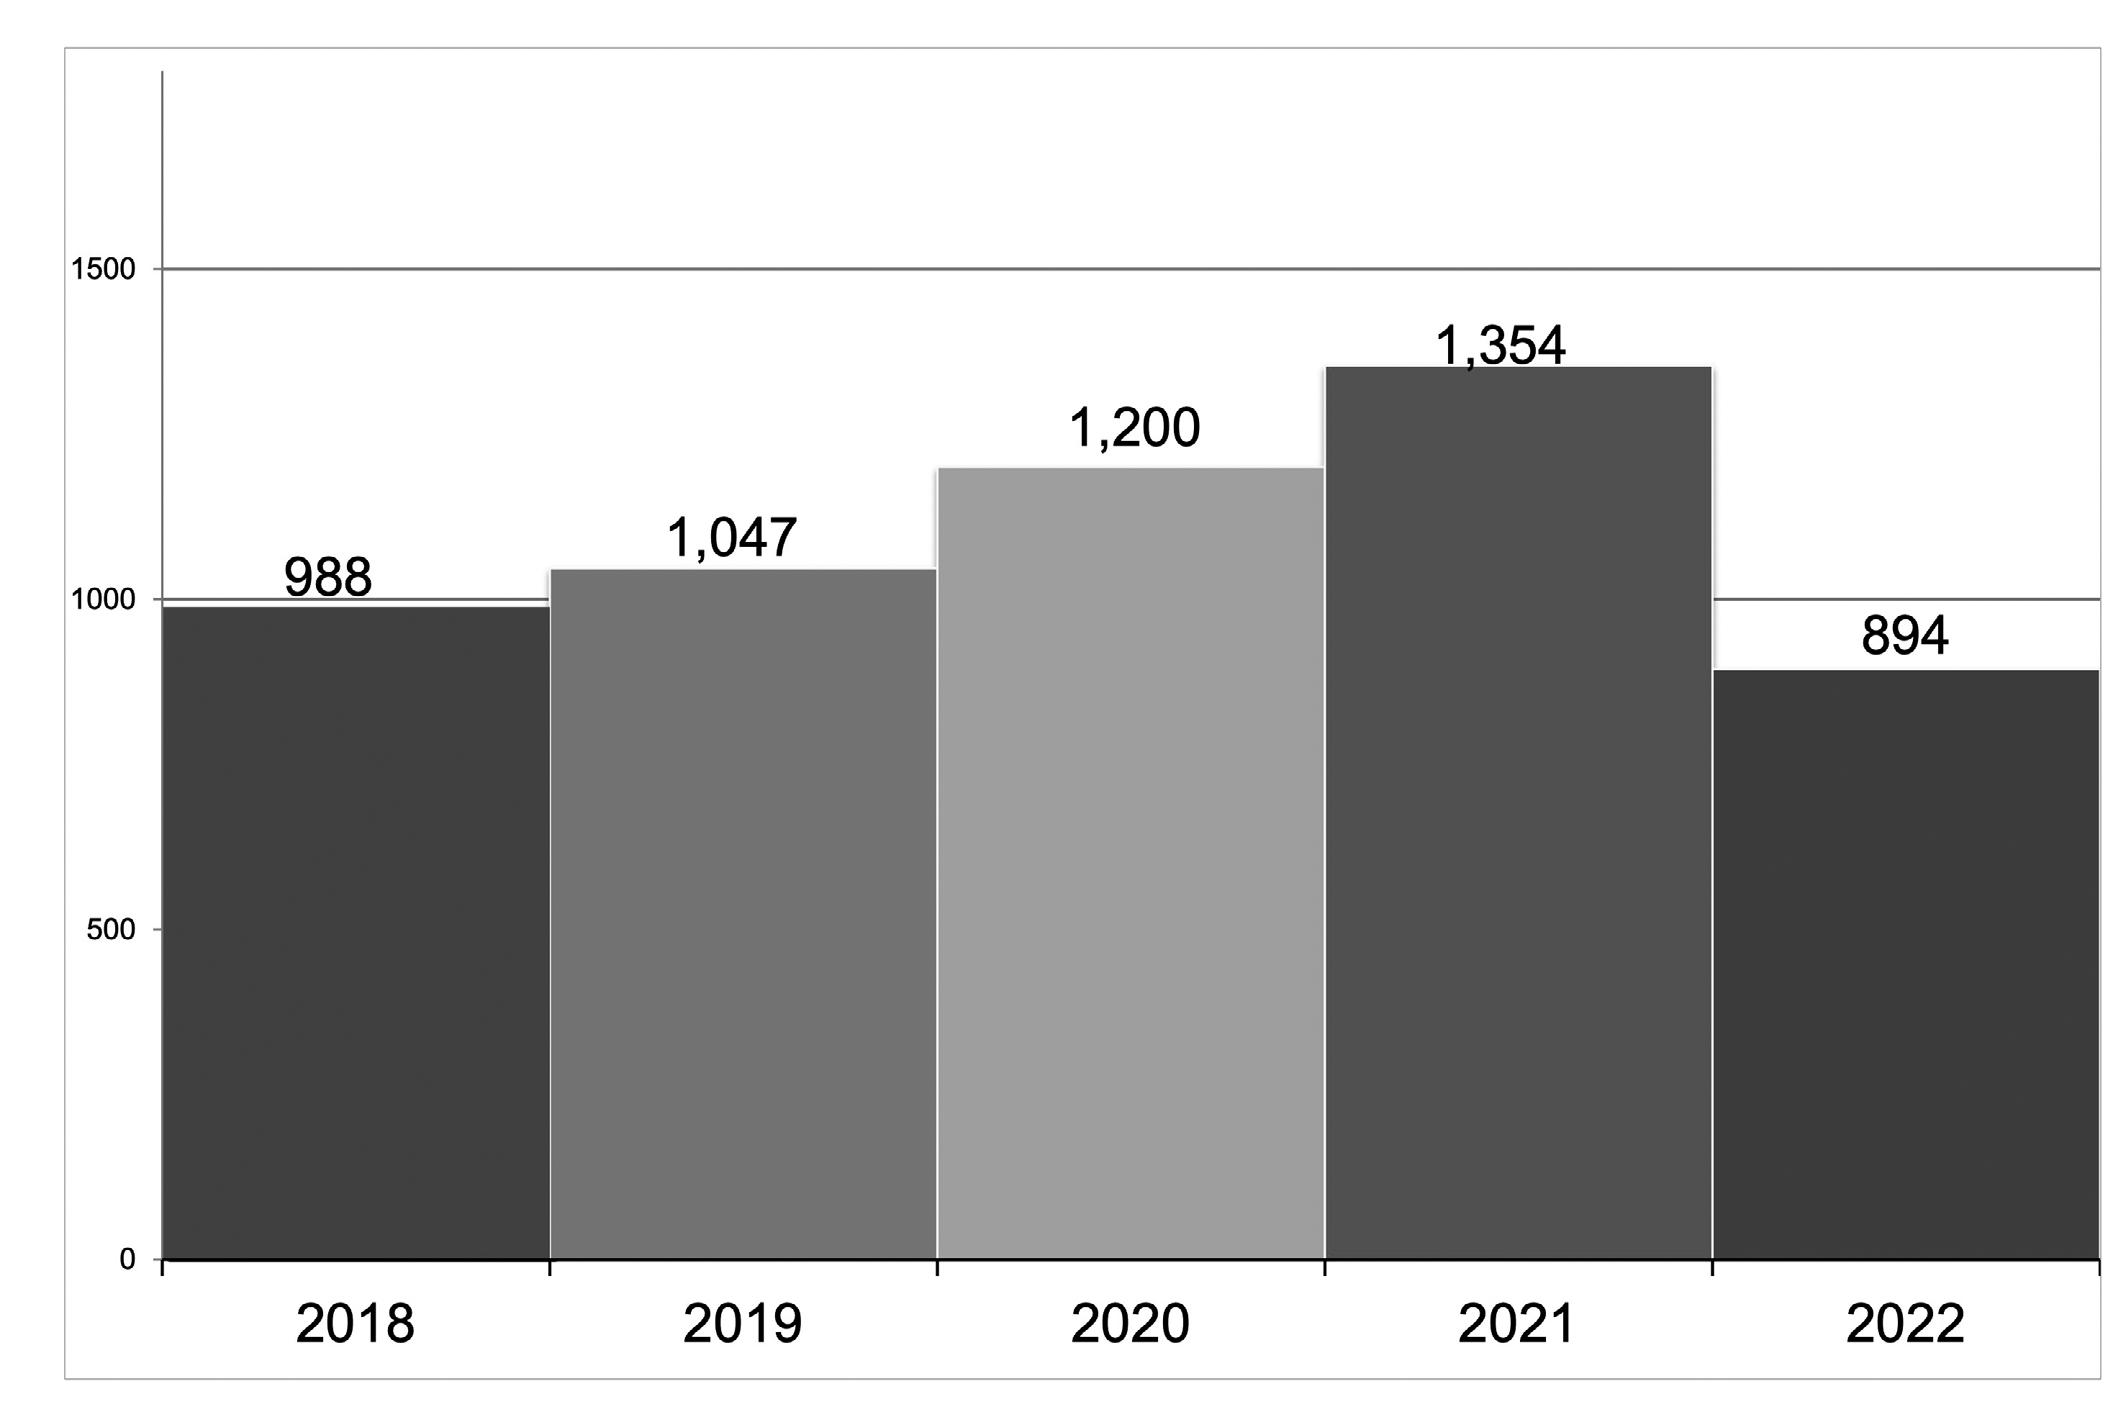
8 SOUTH SANTA BARBARA COUNTY MARKET REPORT | NOVEMBER 2022 - homes | estates | pudsTOTAL SALES YTD 2018-2022 * Excludes condominium homes.
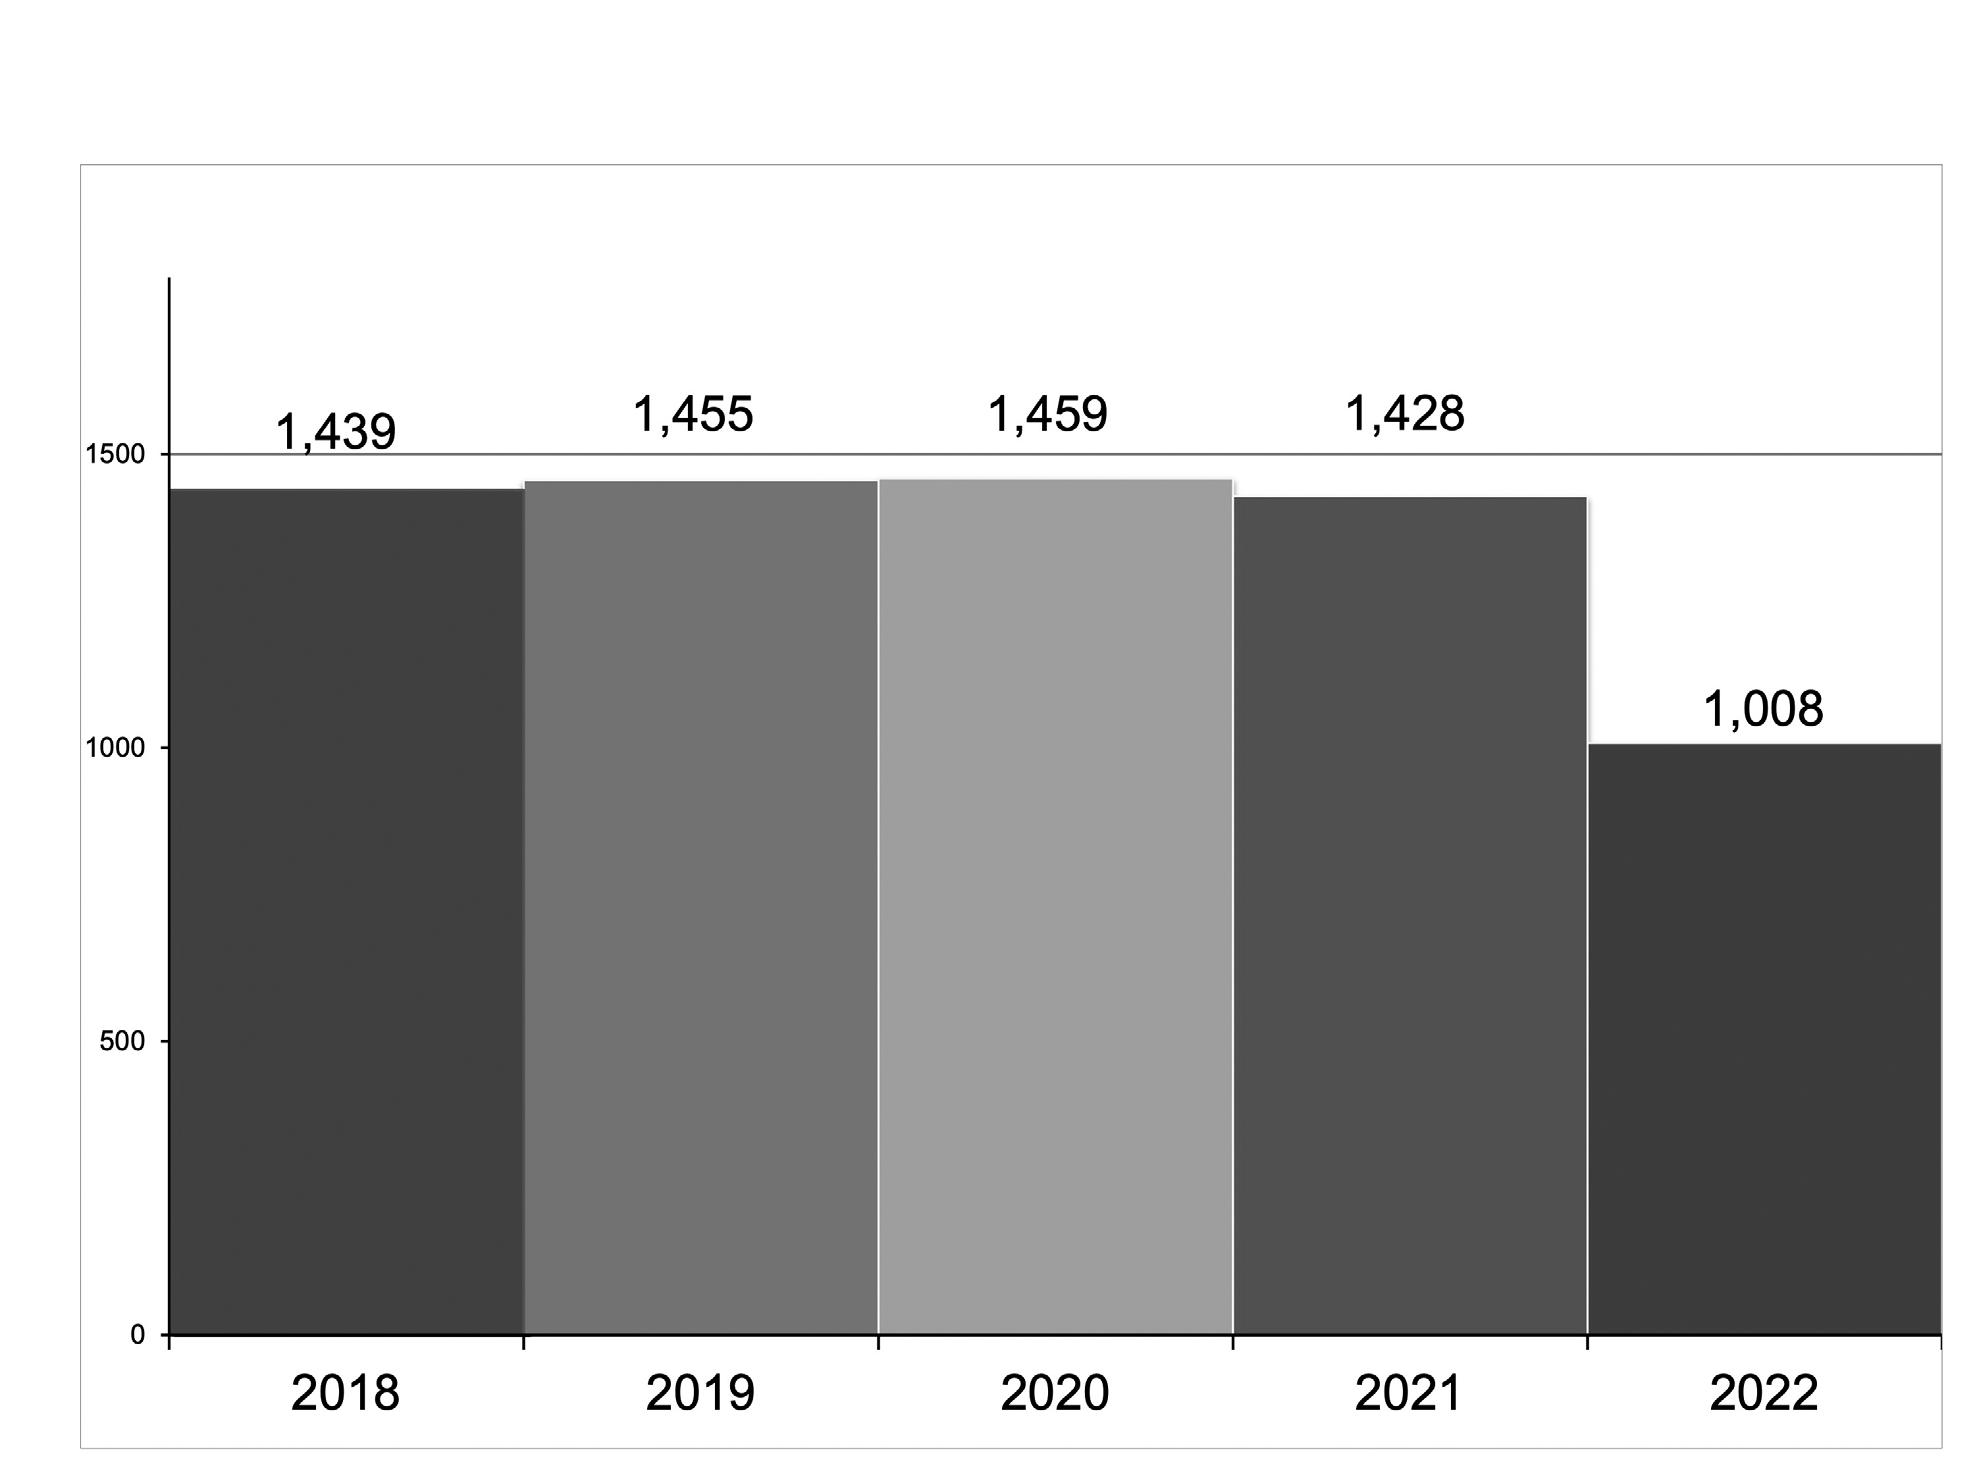
9 - homes | estates | pudsLISTINGS/INVENTORY YTD 2005—2022 * Excludes condominium homes.

10
COUNTY MARKET REPORT | NOVEMBER 2022
SOUTH SANTA BARBARA
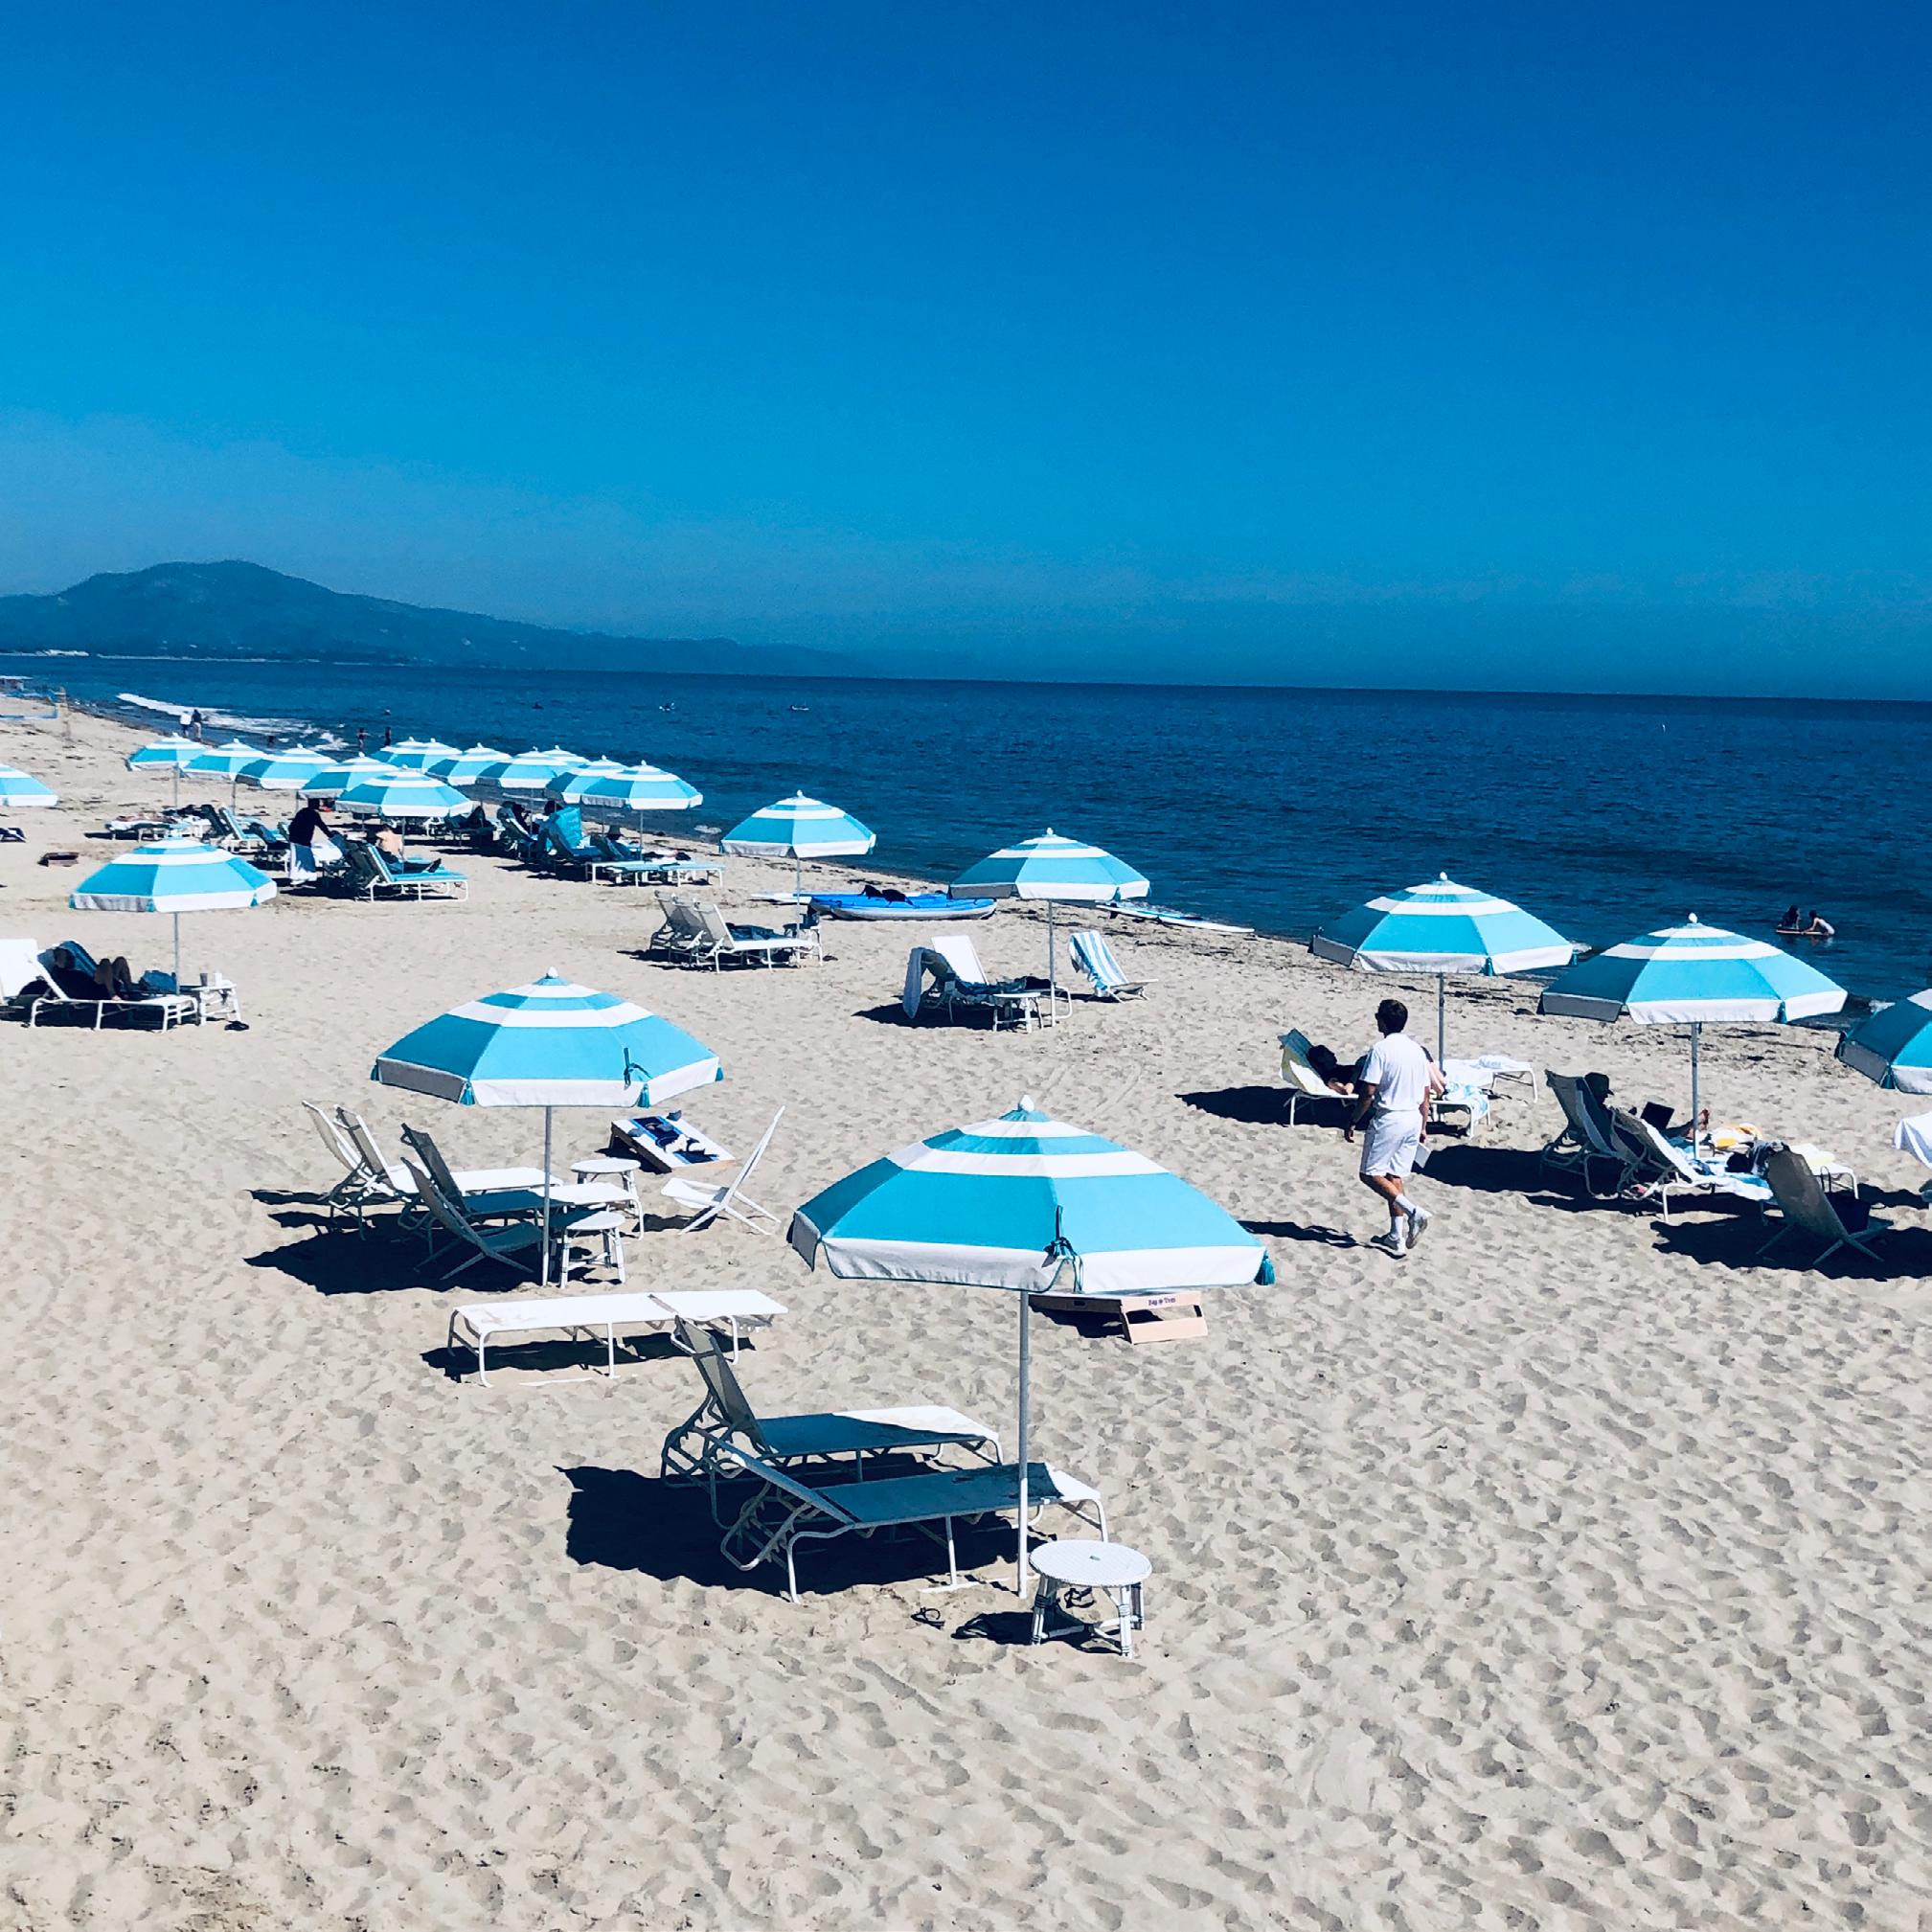
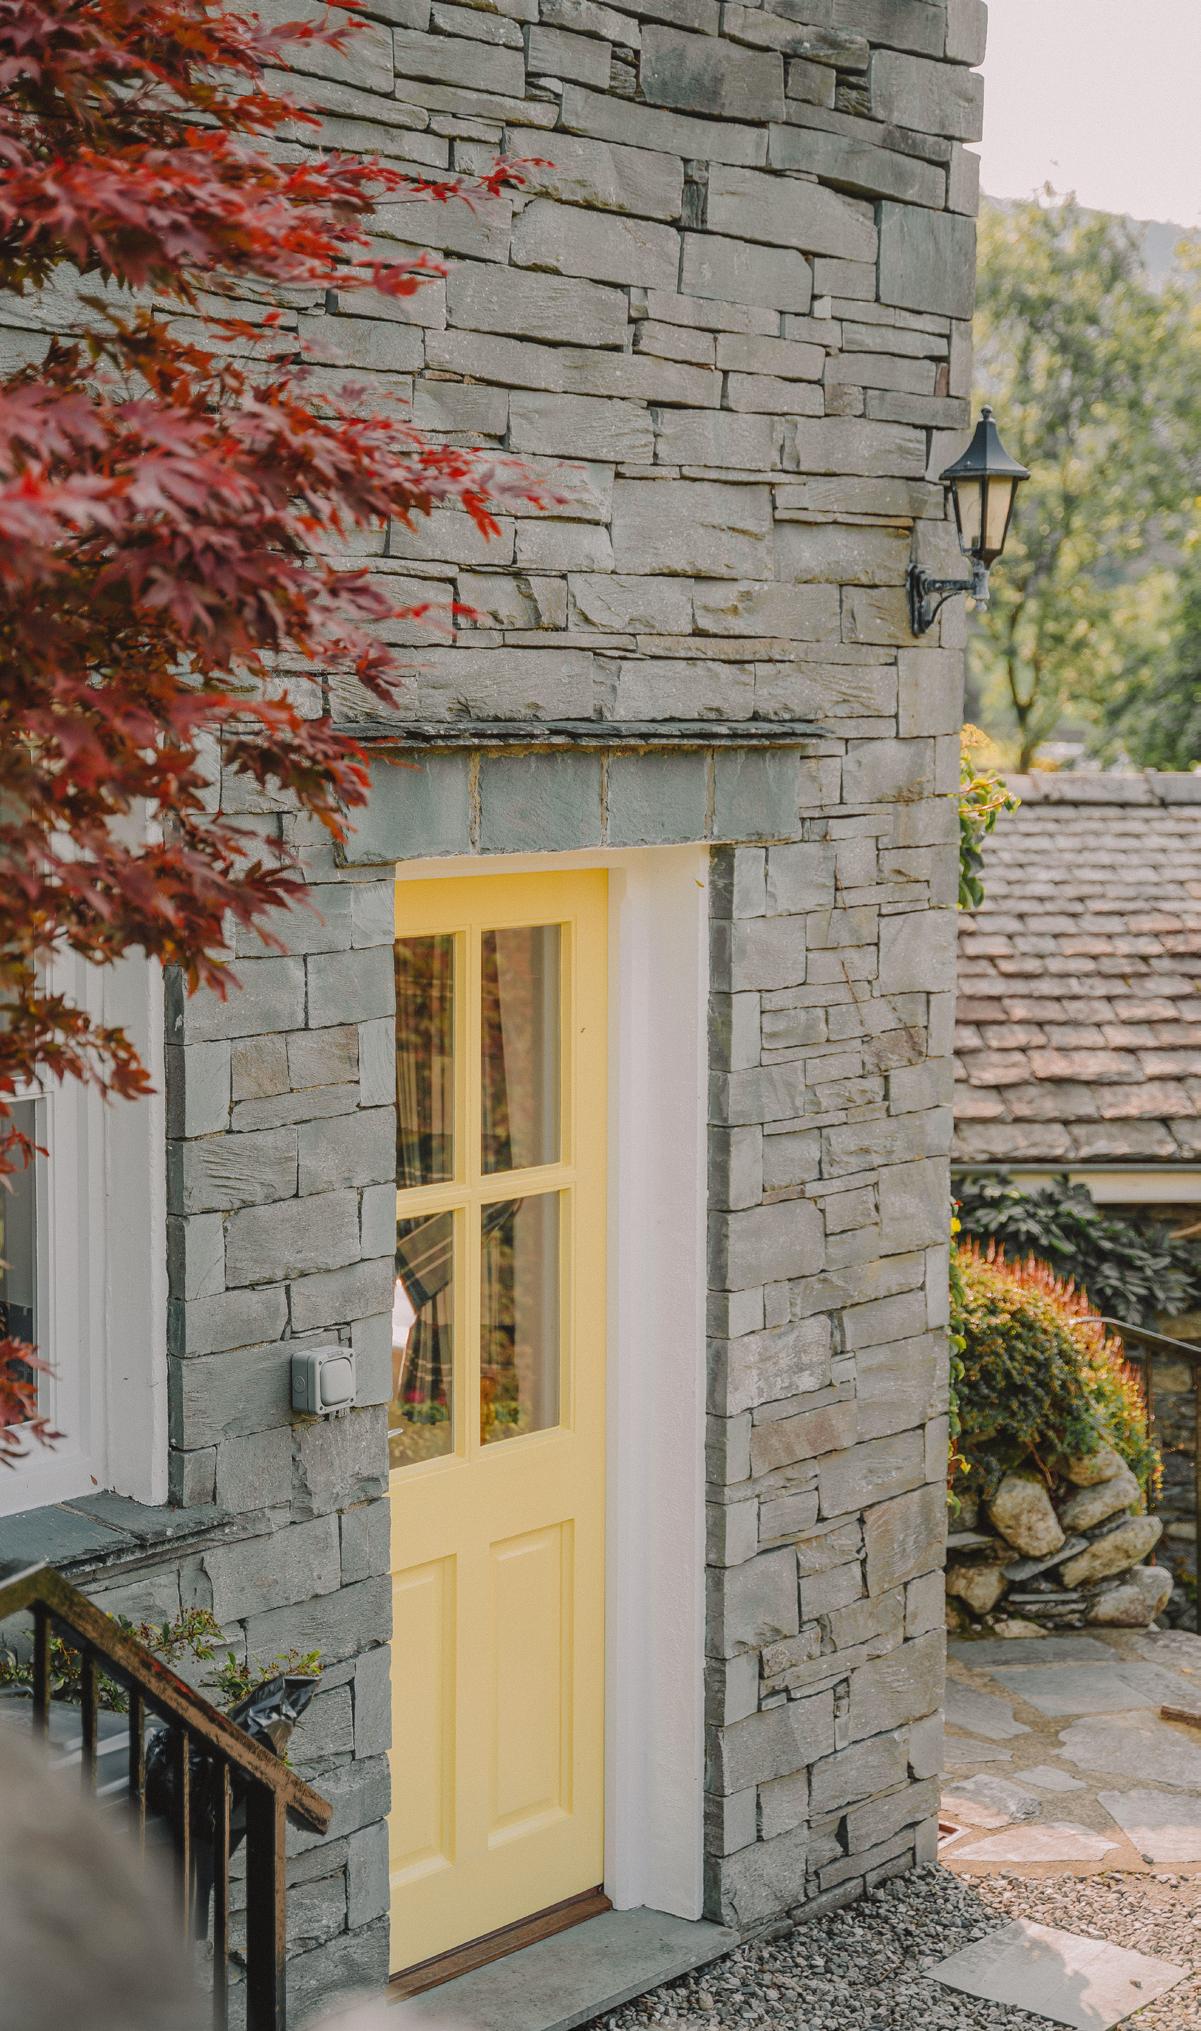
MIRAMAR BEACH RESORT | MONTECITO
11 MONTECITO NOVEMBER 2022 | IN REVIEW Single Family Residences + Condominiums (combined sales) TOTAL NOVEMBER SALES 6 AVERAGE SALES PRICE -9% change from 2021 $5,066,667 MEDIAN SALES PRICE -2% change from 2021 $4,222,500 HIGHEST SALES PRICE 465 Hot Springs Road Montecito CA 93108 $11,500,000 LOWEST SALES PRICE 1308 Plaza De Sonadores Montecito CA 93108 $1,830,000 Click for Real Time Market Data
There are many advantages to investing in real estate. It often acts as a good inflation hedge since there will always be a demand for homes— regardless of the economic climate. Historically, as inflation rises, so do property values.
12 SOUTH
BARBARA COUNTY MARKET REPORT | NOVEMBER 2022
SANTA

13 MONTECITO SALES | NOVEMBER * DOM = Days on Market Address List Price Sold Price % to List DOM 465 Hot Springs Road $15,995,000 $11,500,000 72% 184 251 East Mountain Drive $6,425,000 $5,450,000 85% 63 2150 Ten Acre Road $6,125,000 $5,170,000 84% 169 79 Seaview Drive $3,275,000 $3,275,000 100% 6 29 Seaview Drive $2,995,000 $3,175,000 106% 87 1308 Plaza De Sonadores $1,860,000 $1,830,000 98% 5

14
SOUTH SANTA BARBARA COUNTY MARKET REPORT | NOVEMBER 2022
SANTA AND HIS REINDEERS TAKING A MUCH NEEDED BREAK
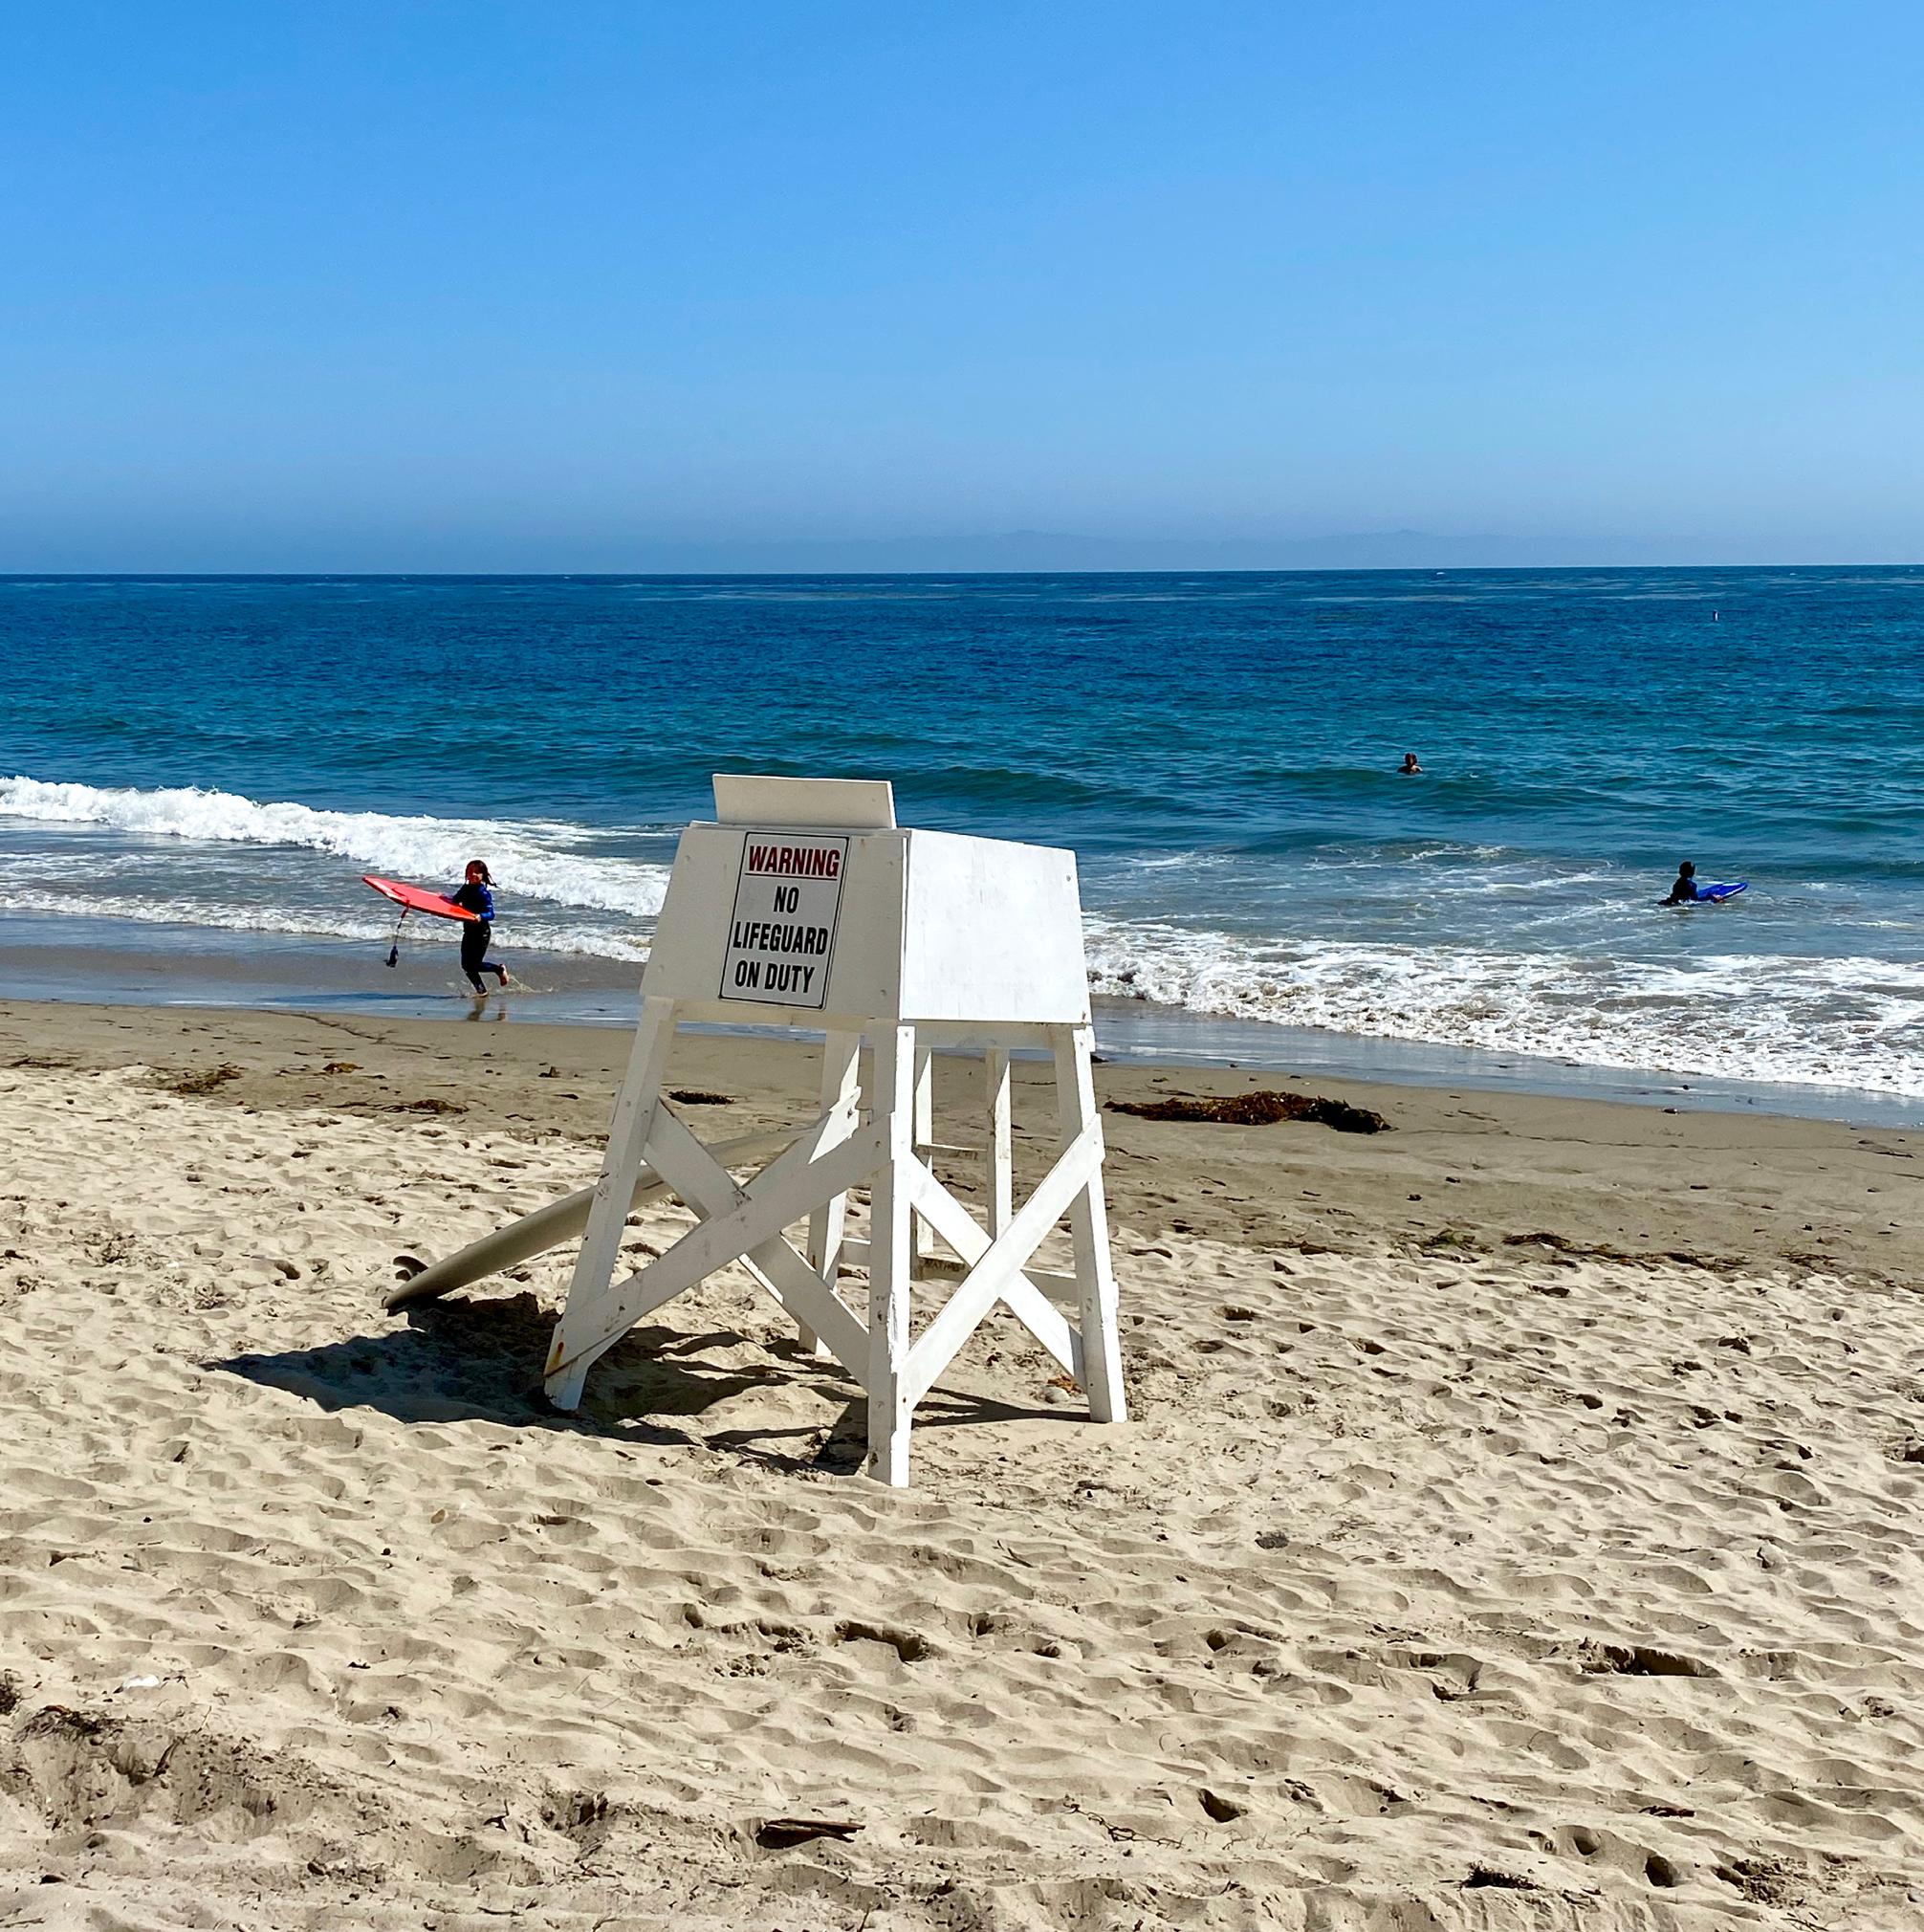
15 NOVEMBER 2022 | IN REVIEW Single Family Residences + Condominiums (combined sales) TOTAL NOVEMBER SALES 36 SANTA BARBARA AVERAGE SALES PRICE +25% change from 2021 $2,111,892 MEDIAN SALES PRICE +10% change from 2021 $1,737,500 HIGHEST SALES PRICE 780 Mission Canyon Road Santa Barbara CA 93109 $6,187,000 LOWEST SALES PRICE 4025 State Street, Unit 72 Santa Barbara CA 93110 $625,000 Condo Click for Real Time Market Data


16
MARKET REPORT | NOVEMBER 2022
SOUTH
SANTA BARBARA
COUNTY
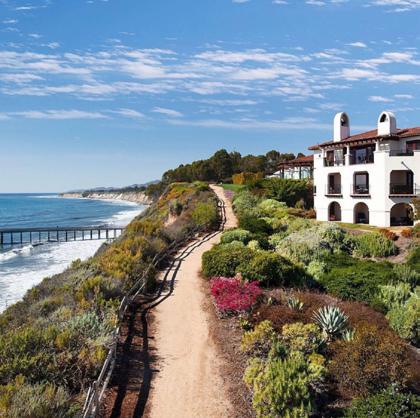
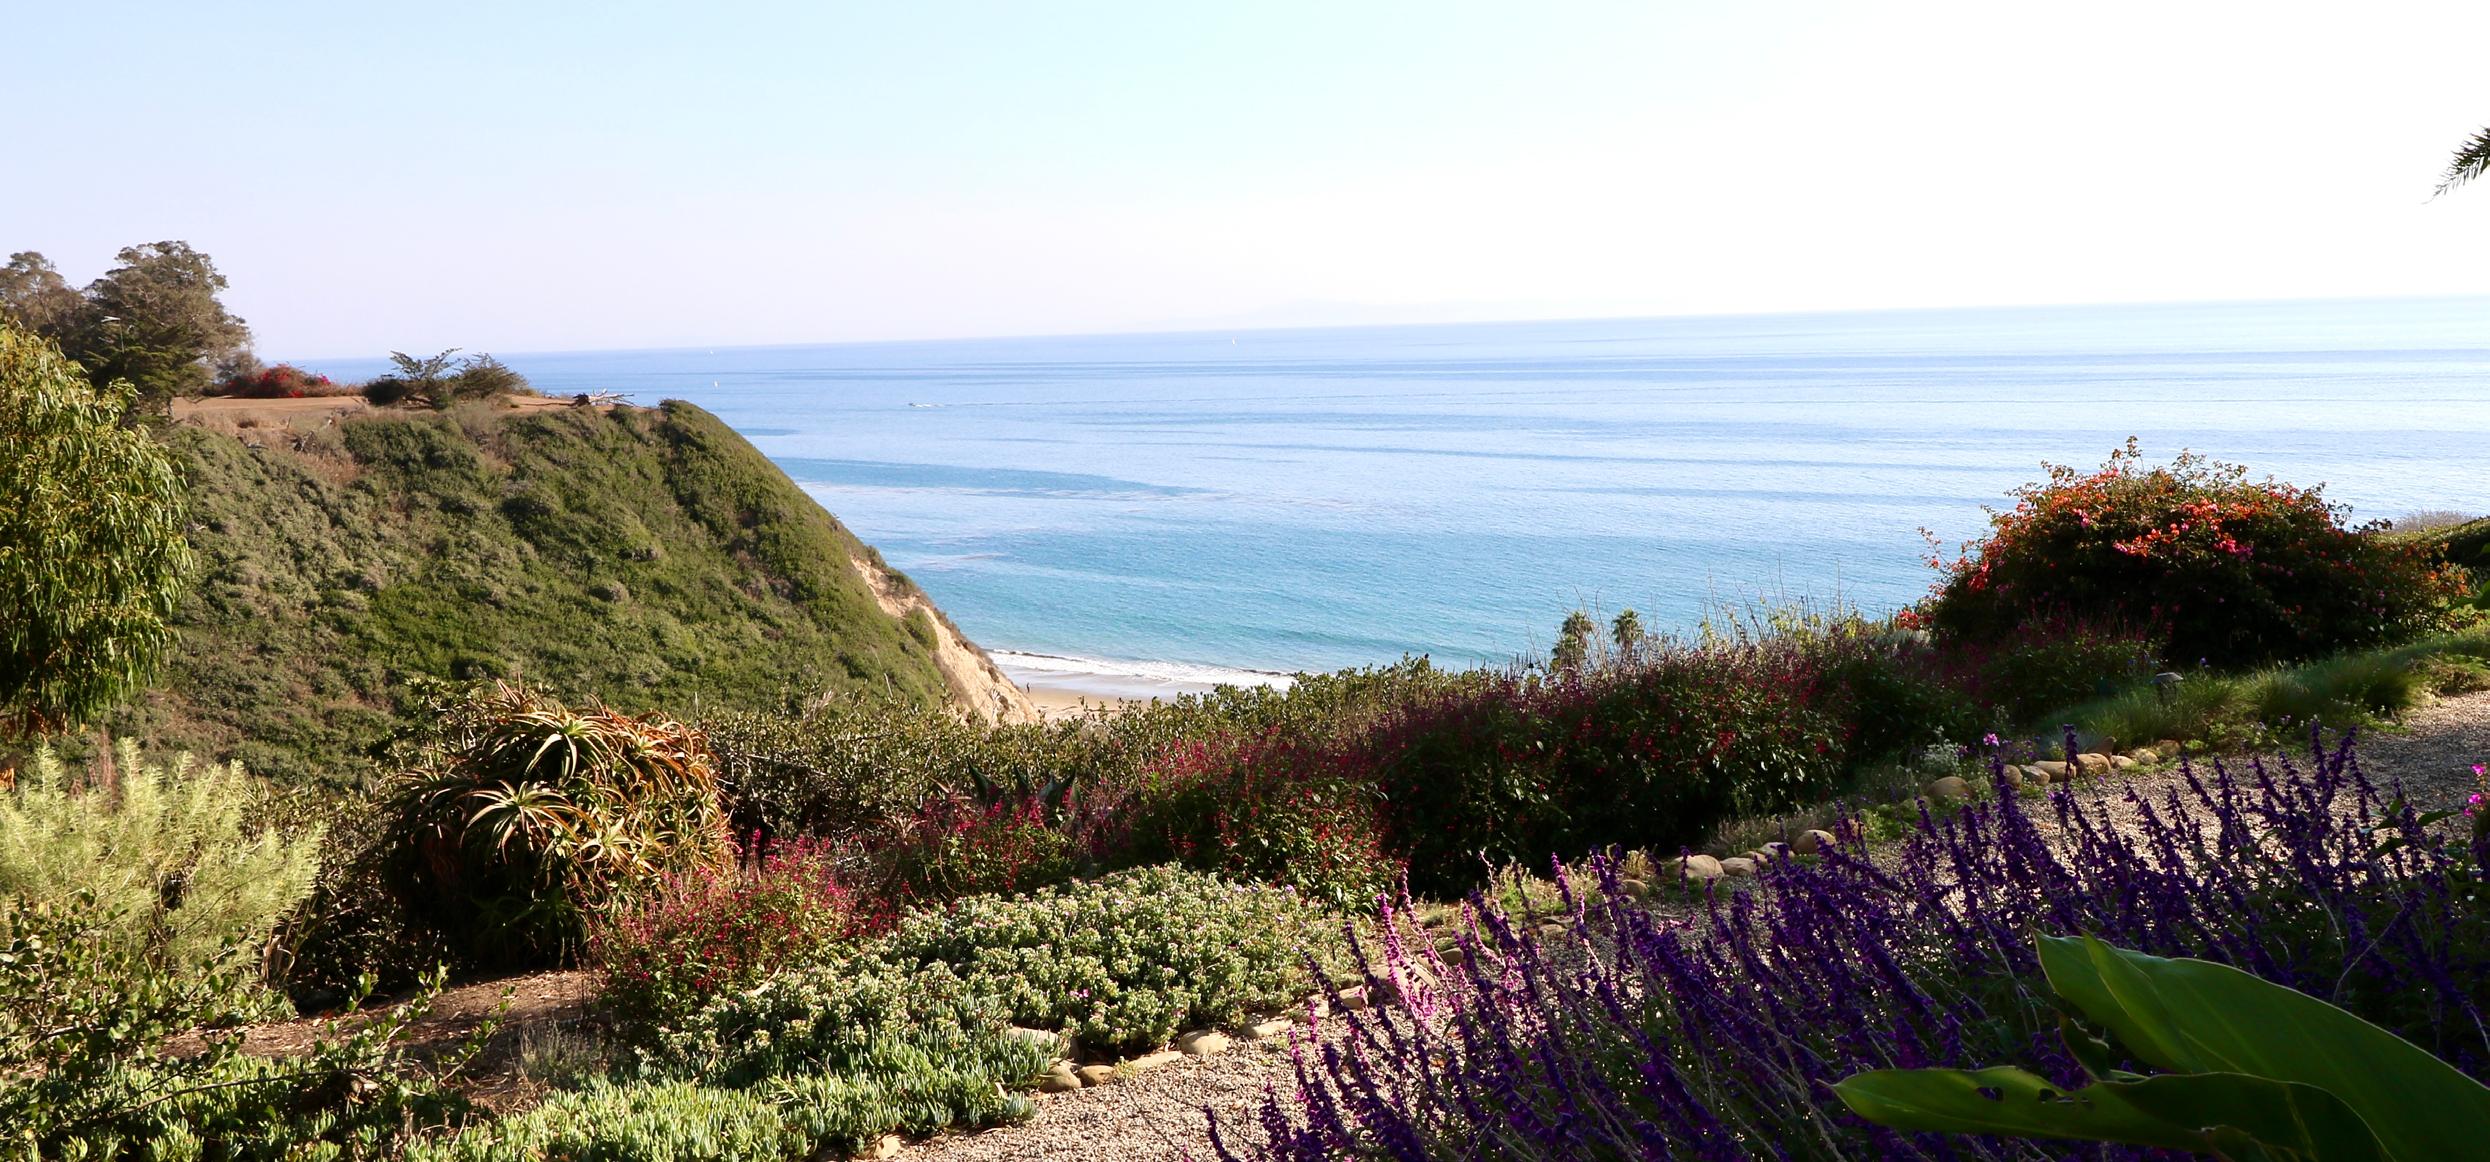
CLIFF SIDE BLUFFS OVERLOOKING PACIFIC OCEAN | HOPE RANCH
17
RANCH NOVEMBER 2022 | IN REVIEW Single Family Residences + Condominiums (combined sales) TOTAL NOVEMBER SALES 0 AVERAGE SALES PRICE n/a change from 2021 n/a MEDIAN SALES PRICE n/a change from 2021 n/a HIGHEST SALES PRICE n/a LOWEST SALES PRICE n/a Click for Real Time Market Data
HOPE

18 SOUTH
COUNTY MARKET REPORT | NOVEMBER 2022
SANTA BARBARA
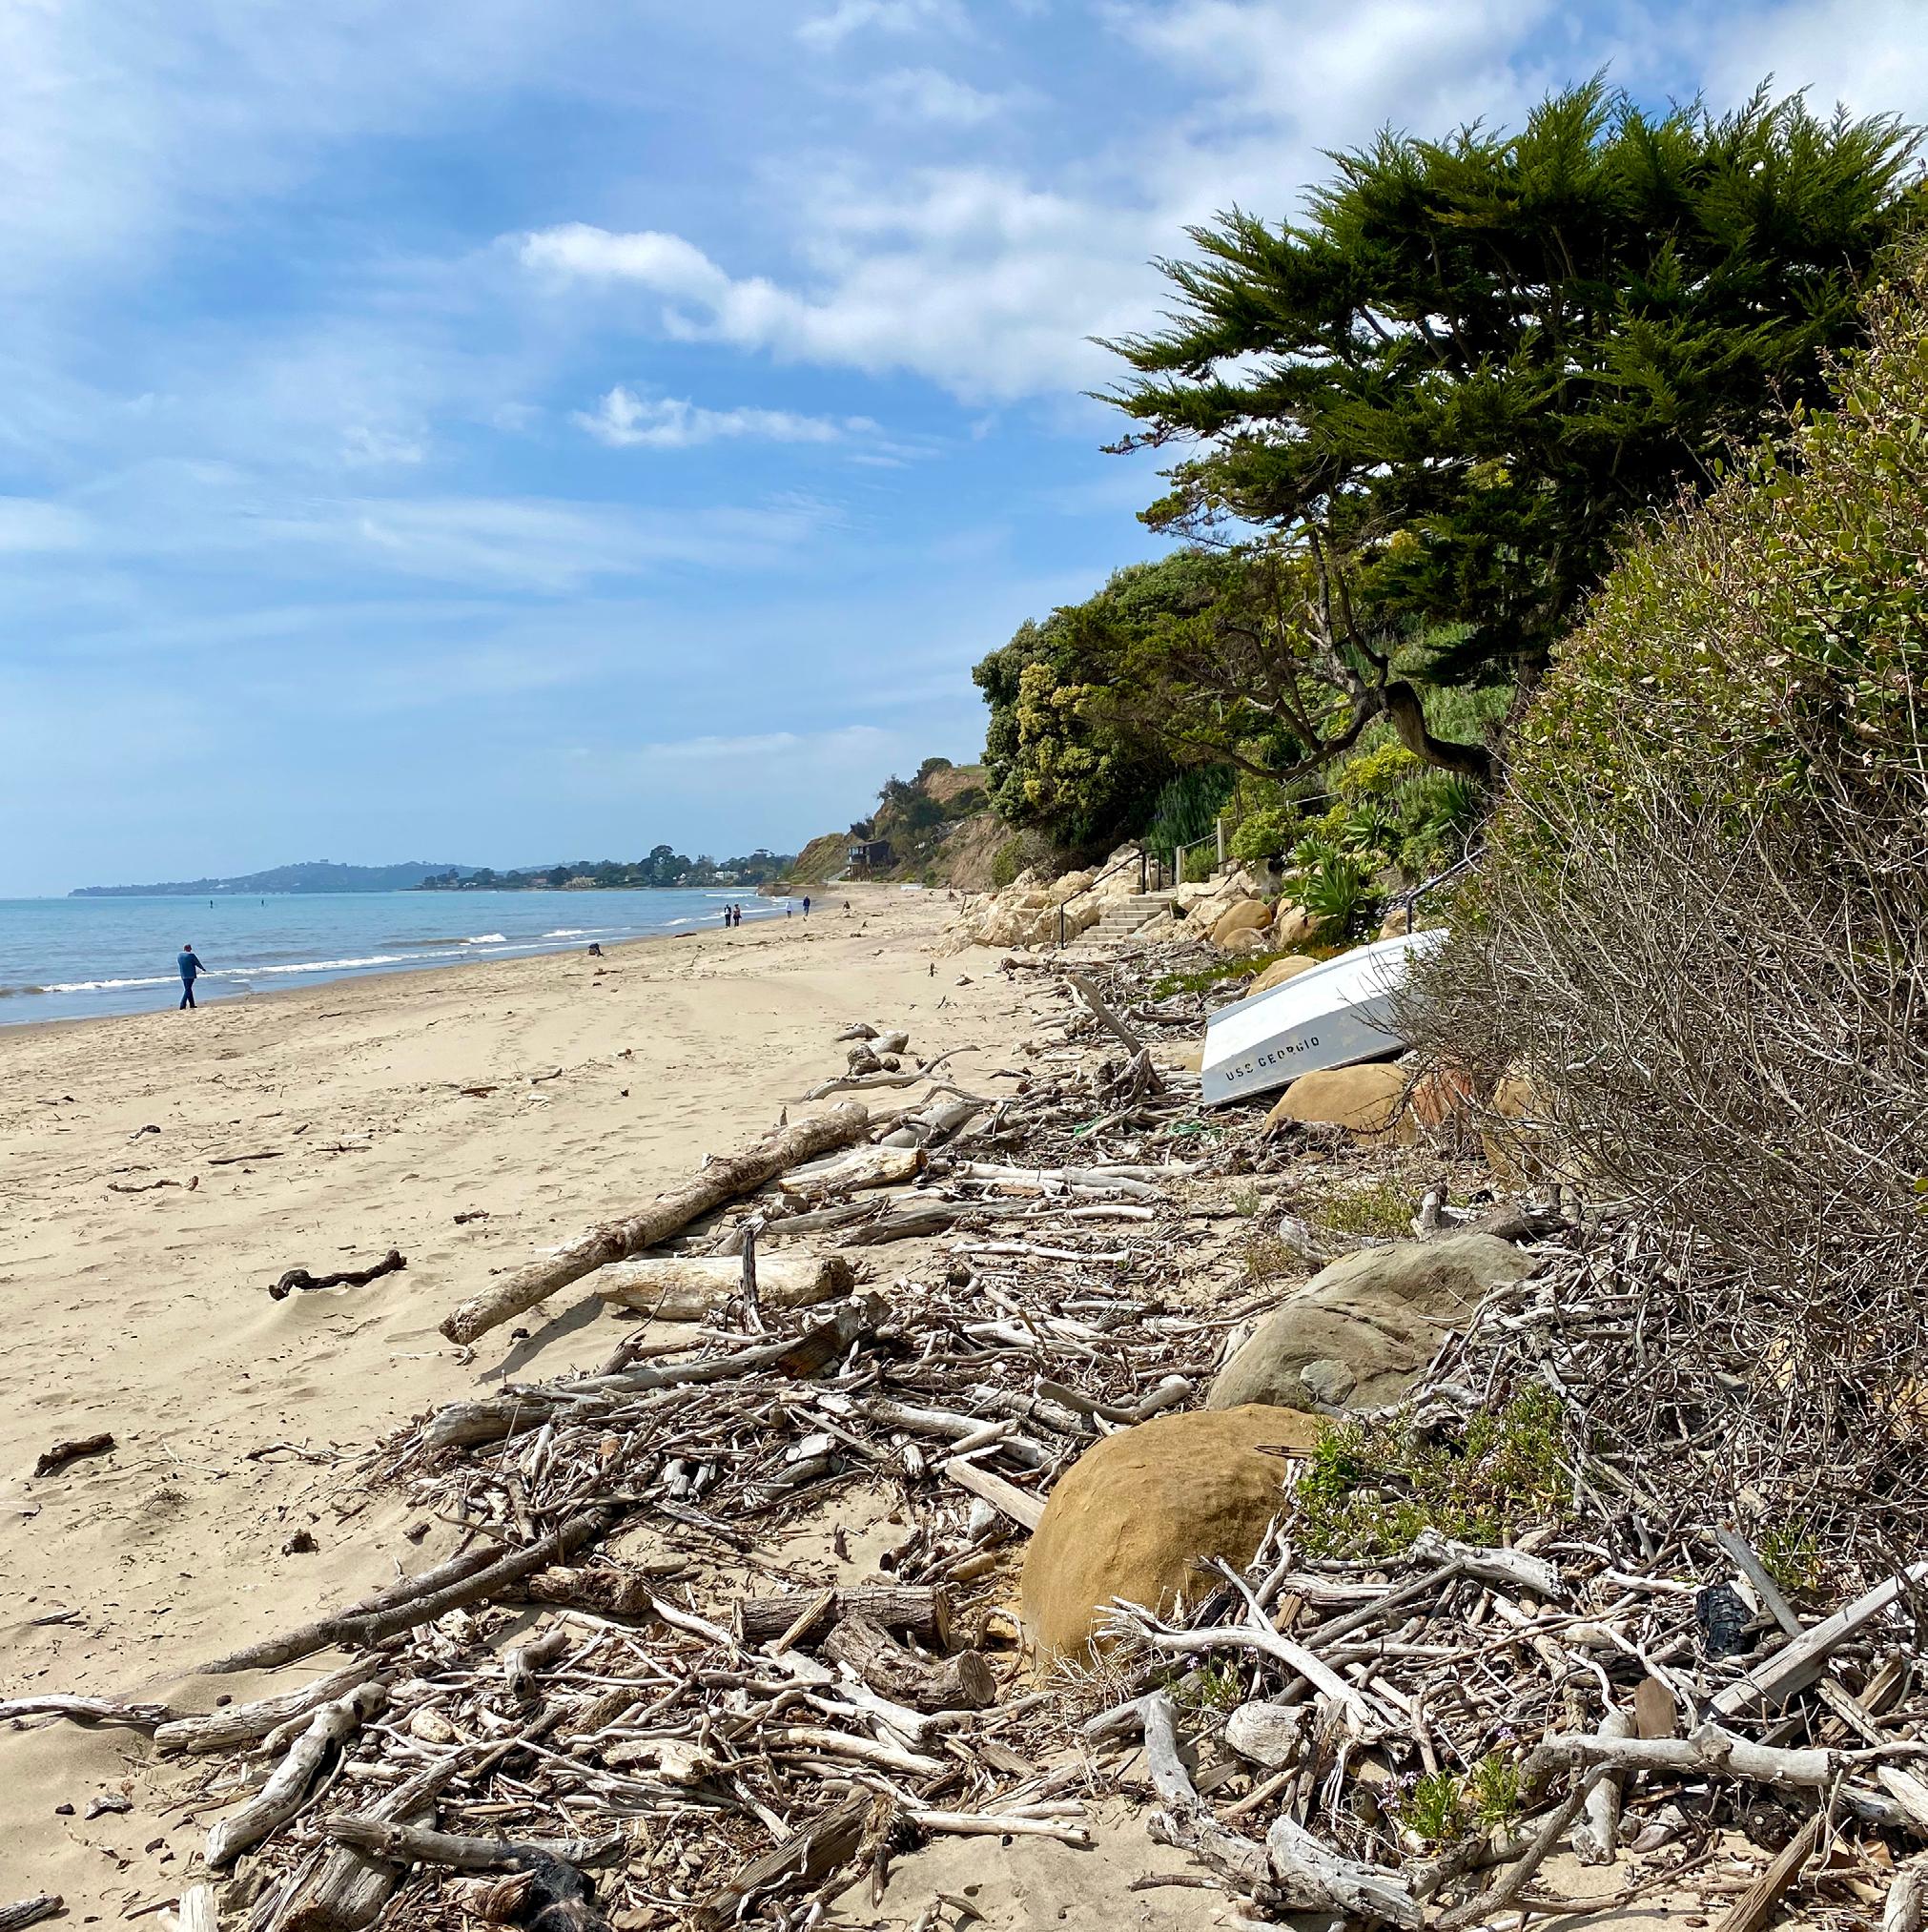
SUMMERLAND BEACH | DRIFTWOOD ABUNDANCE | SUMMERLAND
19 SUMMERLAND NOVEMBER 2022 | IN REVIEW Single Family Residences + Condominiums (combined sales) TOTAL NOVEMBER SALES 1 AVERAGE SALES PRICE +47% change from 2021 $4,250,000 MEDIAN SALES PRICE +47% change from 2021 $4,250,000 HIGHEST SALES PRICE 840 Toro Canyon Road Summerland, CA 93108 $4,250,000 LOWEST SALES PRICE 840 Toro Canyon Road Summerland, CA 93108 $4,250,000 Click for Real Time Market Data


20 SOUTH
COUNTY MARKET REPORT | NOVEMBER 2022
SANTA BARBARA
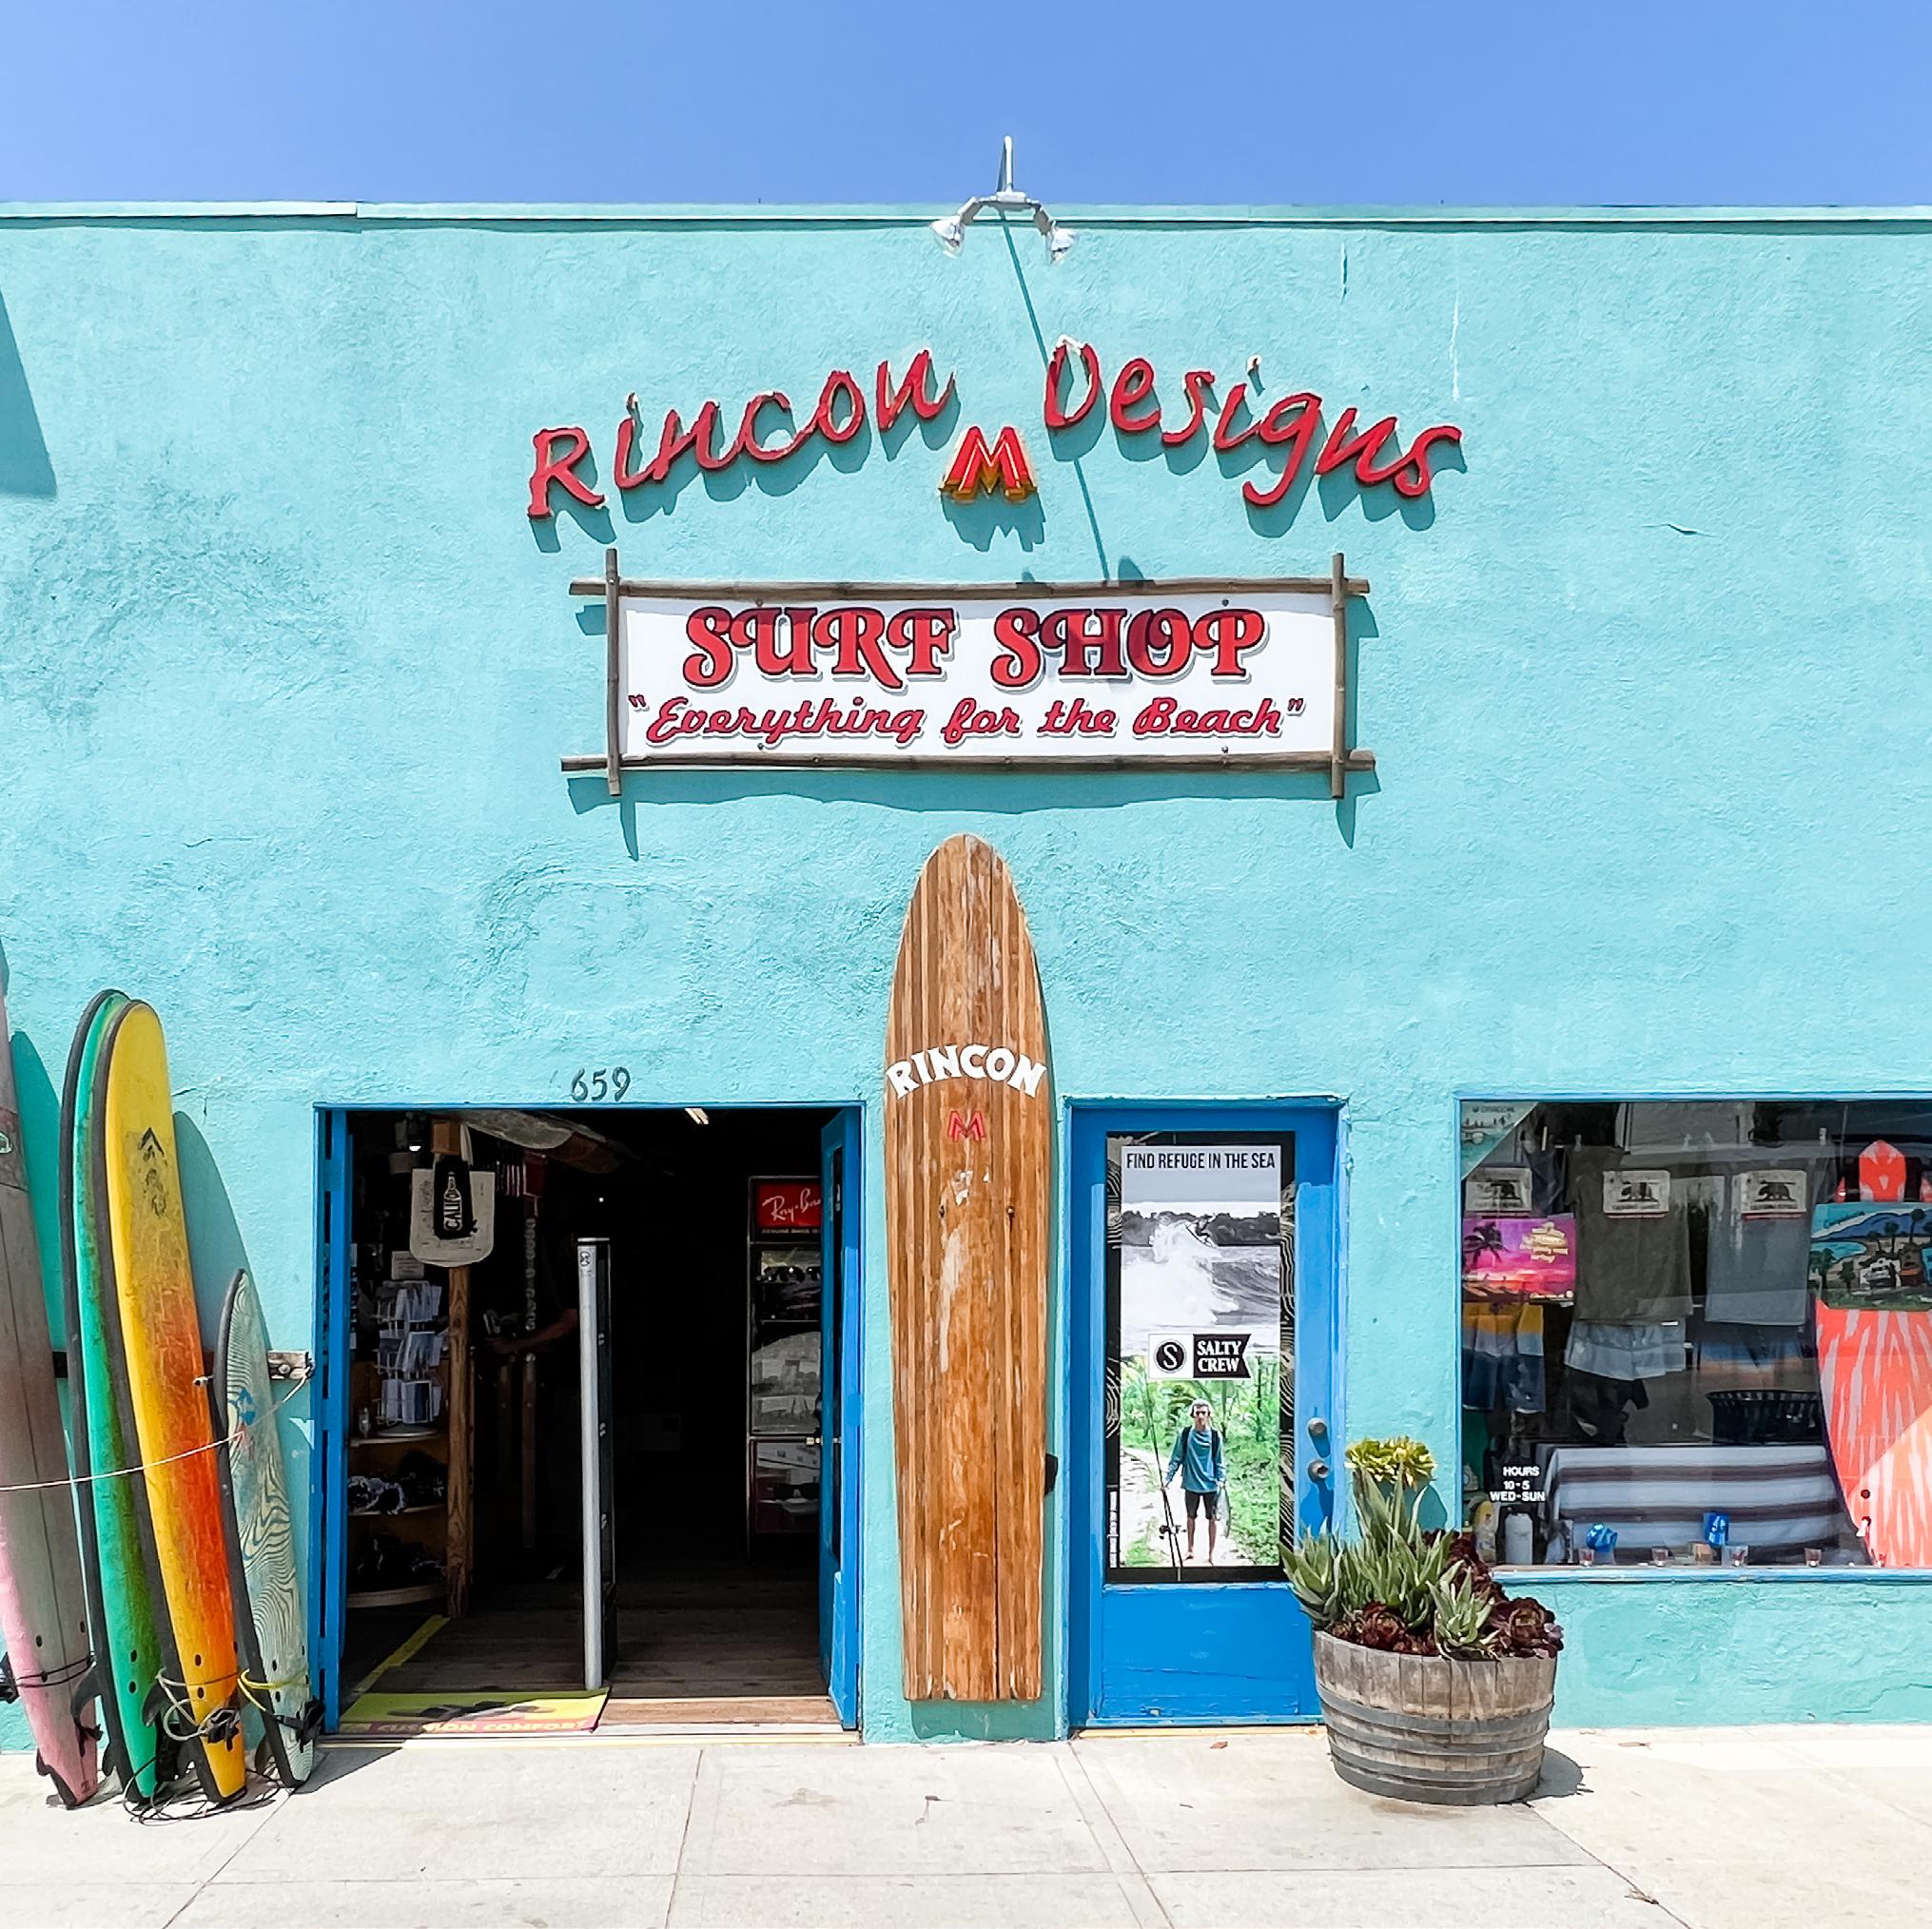
THE ICONIC SURF SHOP | CARPINTERIA
21 CARPINTERIA NOVEMBER 2022 | IN REVIEW Single Family Residences + Condominiums (combined sales) TOTAL NOVEMBER SALES 11 AVERAGE SALES PRICE +18% change from 2021 $1,224,136 MEDIAN SALES PRICE +20% change from 2021 $1.075.000 HIGHEST SALES PRICE 3233 Serena Avenue Carpinteria CA 93013 $2,100,000 LOWEST SALES PRICE 5750 Via Real 286, Space C Carpinteria CA 93013 $440,000 Manufactured Home Click for Real Time Market Data

22 SOUTH
SANTA BARBARA
COUNTY MARKET REPORT | NOVEMBER 2022
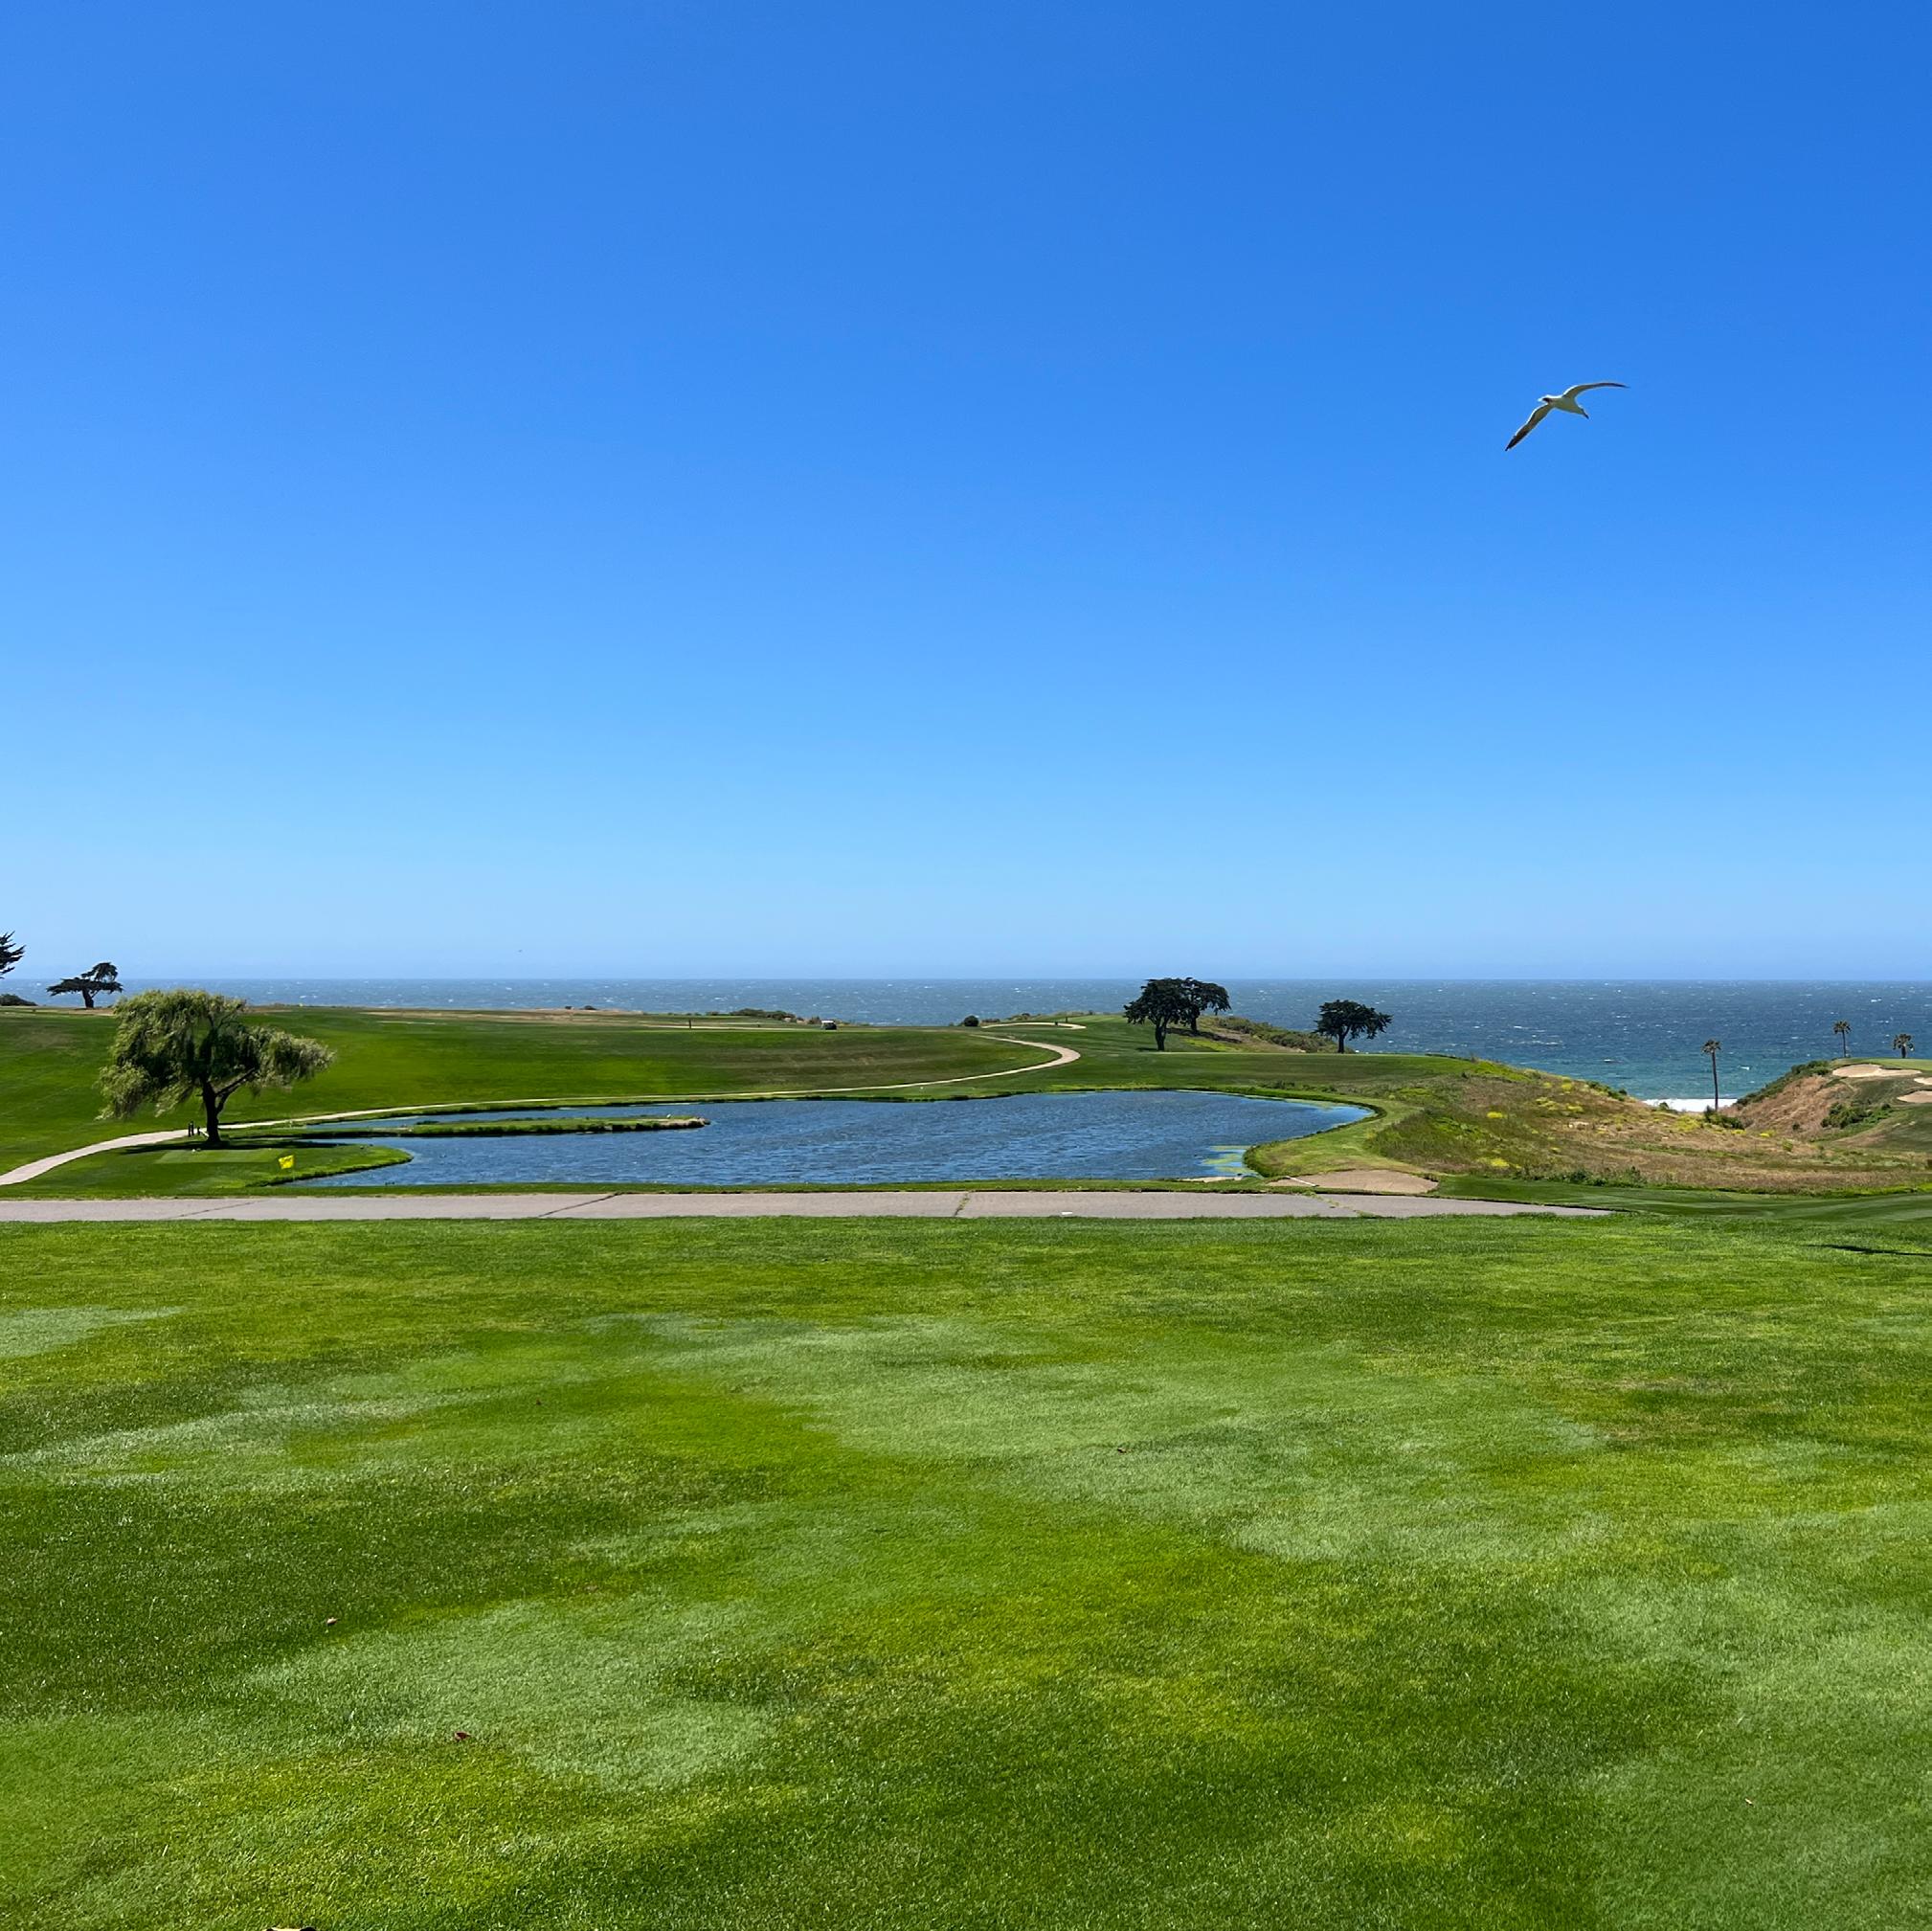
SANDPIPER GOLF CLUB | GOLETA
23 GOLETA NOVEMBER 2022 | IN REVIEW Single Family Residences + Condominiums (combined sales) TOTAL NOVEMBER SALES 31 AVERAGE SALES PRICE +6% change from 2021 $1,371,041 MEDIAN SALES PRICE +8% change from 2021 $1,251,000 HIGHEST SALES PRICE : 7771 Heron Court Goleta CA 93117 $3,450,000 LOWEST SALES PRICE : 7368 Hollister Avenue Space 54 Goleta CA 93117 $189,000 Manufactured Home Click for Real Time Market Data
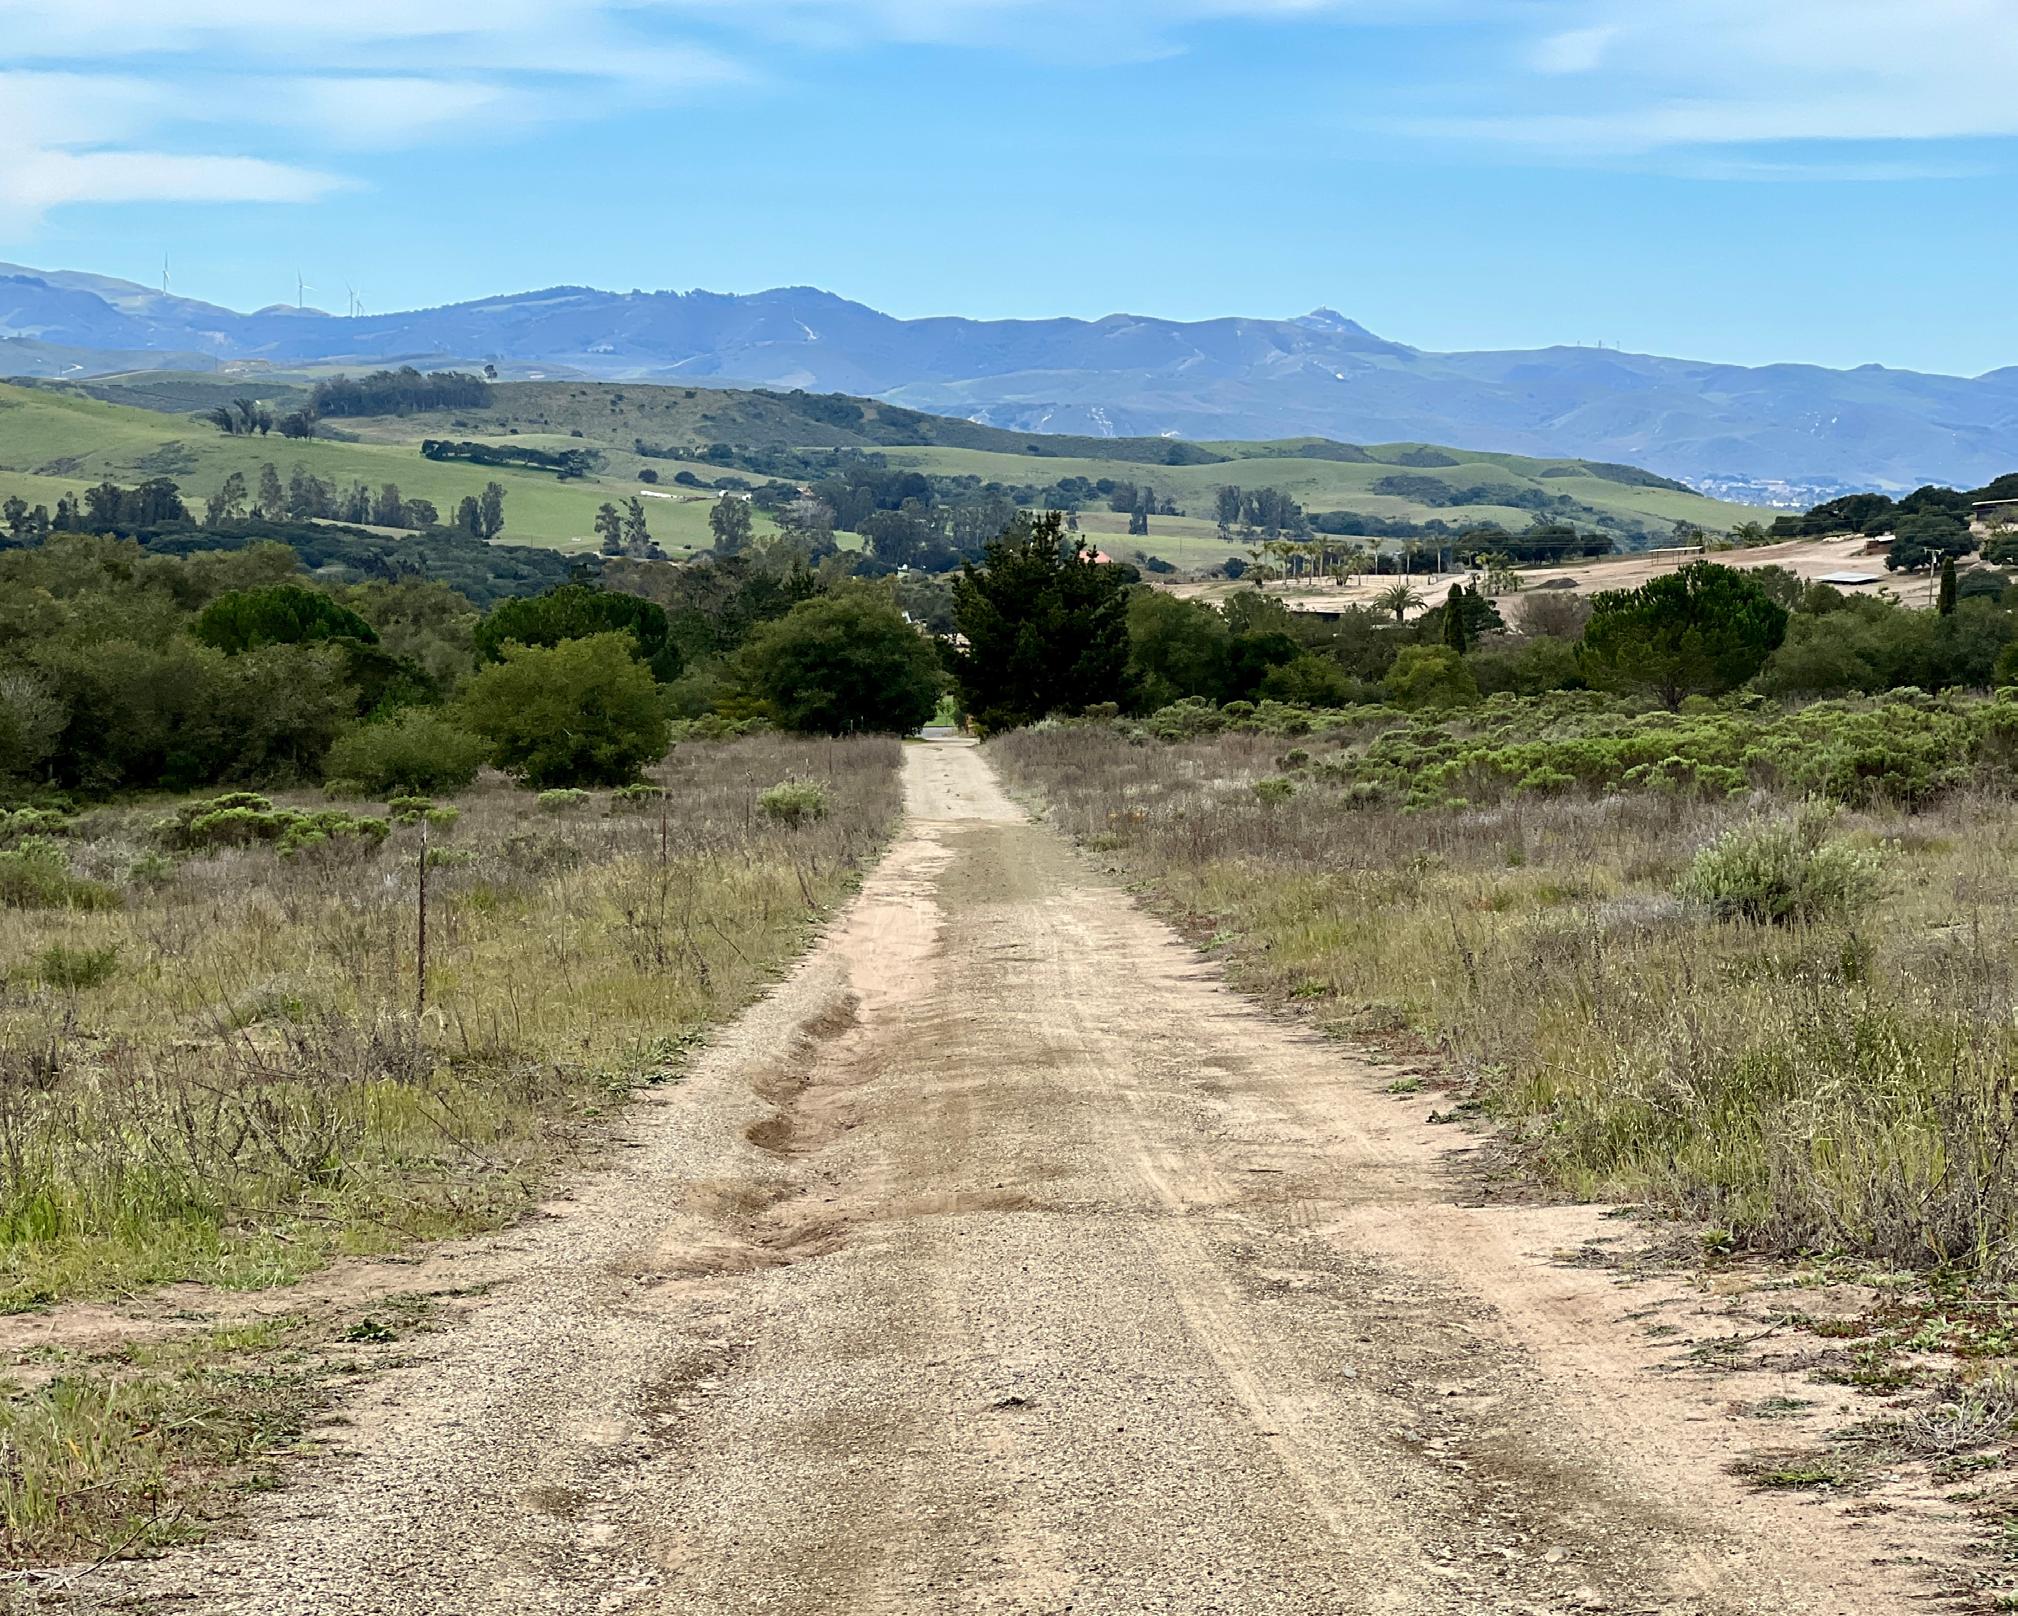

24 SOUTH SANTA BARBARA COUNTY MARKET REPORT | NOVEMBER 2022 1990 TULAROSA ROAD | LOMPOC CA 93436 Santa Ynez Valley AVA | Sweeping Mountain Views 40± Acres | Zoned RR-10 1529± SF Home | 5,000± SF Warehouse Pending/Offered at 1,997,000 Exclusive Offering by Randy Haden/Molly Haden
25 SINGLE FAMILY RESIDENCES TOTAL YTD SALES 182 AVERAGE SALES PRICE $1,990,605 MEDIAN SALES PRICE $1,500,000 CONDOMINIUM HOMES TOTAL YTD SALES 24 AVERAGE SALES PRICE $653,469 MEDIAN SALES PRICE $640,725 NOVEMBER YTD 2022 | IN REVIEW Single Family Residences + Condominiums (separated sales) TOTAL YTD 2022 SALES 206 SANTA YNEZ VALLEY
DISCRETION
Privacy is the Ultimate Commodity And the Decision to Sell Your Home Is a Personal One.
FLEXIBILITY
Decide When to Share Details About Your Home - Including PriceMore Expansively On Your Own Timing.
QUALITY
Exclusive Exposure To Compass Agents, Including Premium Placements On Agent Facing Platform.

VALUE
Get the Best Offer by Testing The Market Privately to Gather Key Insights Without Your Listing Getting Stale or Overexposed.
26 SOUTH SANTA BARBARA COUNTY MARKET REPORT | NOVEMBER 2022
Listing

COMPASS PRIVATE EXCLUSIVE LISTINGS Ask Us About Our Exciting Private Exclusive Listings | Contact Us Live For details!
Private Exclusive
home
A Compass
listing is an off-market home that can be shared by a Compass agent directly with their colleagues and their buyers. Property details are not disseminated widely and won’t appear on public
search websites.
your home as a private exclusive allows you to control what information is shared about you and your home while still getting exposure to top agents at Compass.


28 SOUTH SANTA BARBARA COUNTY MARKET REPORT | NOVEMBER 2022 RANDY HADEN Broker Associate / Realtor DRE 01988499 805.880.6530 randy@hadenhomes.com LET’S CONNECT www.hadenhomes.com @hadenhomesrealtors $ 100M + Total Sales 1% Top 1% of Agents CHOOSE experience MOLLY HADEN Realtor / Marketing Director DRE 02020380 805.880.6540 molly@hadenhomes.com


