
market report september 2022 | haden homes luxury property group / compass | montecito south SANTA BARBARA COUNTY Residential Real Estate Market Report September 2022 superior court of santa barbara county | labor day 2022
2
MARKET REPORT | SEPTEMBER 2022
SOUTH SANTA BARBARA COUNTY
UNDERSTANDING REAL ESTATE it’s local—let’s talk!
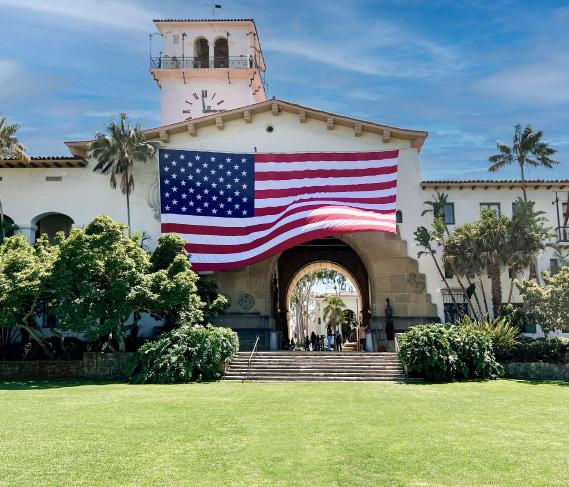
SUPERIOR COURT OF SANTA BARBARA COUNTY | LABOR DAY 2022
Hello Family and Friends -
In the third quarter of 2022, desire to live in our beautiful community is still strong while the year long low inventory of homes continues. Be sure to check our our “In the News” section at the end and let us know your predictions moving forward.
September brought only 85 new single family homes (SFH) to our market. Even though inventory is down, we are seeing that buyers have gained back some leverage in negotiations and are able to take their time to make a better buying decision. The numbers tell the story - let’s compare September 2022 to 2021:
• 32% Increase in homes falling out of escrow and going back on the market
• 39% longer days on market so homes are not selling as fast
• 68% increase in price reductions compared to this time last year
Increased interest rates may also impact both buyer and seller activity. In stark contrast to the frenzy of COVID years, we see a noticeable lack of urgency from buyers who closely monitor market and economic indicators when making a real estate decision. On the seller side, owners who have locked in low interest rates are unlikely to sell in the near future. This will continue to limit inventory and support our real estate prices.
Taking it all in, we still feel this is a good time to buy and sell. Sales are strong and homes that are well priced are still selling quickly – 87% of properties listed in September have sold and at 98% of the final list price. Even while sellers are reducing the price of their homes more frequently, they are still closing for record prices with the median SFH sales price YTD at $2,200,000 (16% over September 2021). There are still good buys to be had for buyers if you understand value and know the area. This is where we excel in helping clients - we know the inventory, our neighborhoods and this market. Our focus is on investment grade properties that will go up in value over time. We can also put together off market deals (17 homes traded off market last month). Zillow or online search sites can not help you accomplish these goals. If you are thinking of buying, make sure you know all the options including our Compass Private Exclusive properties (off-market inventory/pocket listings). When deciding to sell, homeowners now need to be realistic on pricing since we are seeing more and more price reductions each week. Buyers are sophisticated and understand value so you don’t want to be overlooked, then find your home sitting and becoming stale which often leads to a lower sales price. Working with an experienced team like us who understands how to position and market your home will give you the best chance to realize the highest price with the most favorable terms. In this market, experience matters. We offer concierge level professional service to our clients with worldclass marketing, a proven track record of success, the skills necessary to put complicated deals together and negotiate the price and terms that will get your offer accepted amongst multiple offers. Our goal is to get you the best price for your existing home and find you the right replacement property with minimal stress. Let’s explore your property’s current valuation and discuss a strategy.
Looking for professional + creative results-oriented representation - Let’s Talk!
Randy and Molly
3
UNDERSTANDING ESTATE talk!
4 SOUTH SANTA BARBARA COUNTY MARKET REPORT | SEPTEMBER 2022
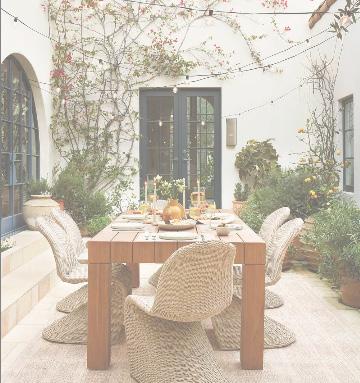
FRESCO EVERY DAY | THIS IS HOW WE DO IT HERE IN SANTA BARBARA FEATURED PROPERTIES CLICK for inventory
AL
5 - southSANTA BARBARA COUNTY SINGLE FAMILY RESIDENCES TOTAL YTD SALES -33% change over 2021 830 AVERAGE SALES PRICE +10% change over 2021 $3,375,107 MEDIAN SALES PRICE +16% change over 2021 $2,186,000 CONDOMINIUM HOMES TOTAL YTD SALES -32% change over 2020 354 AVERAGE SALES PRICE +16% change over 2021 $1,195,256 MEDIAN SALES PRICE +14% change over 2021 $950,000 THIRD QUARTER YTD 2022 | In Review Single Family Residences + Condominiums -32% change over 2021 1184

REPORT
6 SOUTH SANTA BARBARA COUNTY MARKET
| SEPTEMBER 2022
BANDIT BRINGING IN THE FALL SEASON | EL ENCANTO RESORT | SANTA BARBARA
7 - southSANTA BARBARA COUNTY SINGLE FAMILY RESIDENCES TOTAL SALES -28% change over 2021 88 AVERAGE SALES PRICE +19% increase over 2021 $3,177,810 MEDIAN SALES PRICE +22% increase over 2021 $ 2,275,000 CONDOMINIUM HOMES TOTAL SALES -37% change over 2020 31 AVERAGE SALES PRICE +12% change over 2021 $ 1,175,161 MEDIAN SALES PRICE +16% change over 2021 $990,000 SEPTEMBER 2022 | In Review Single Family Residences + Condominiums -30% change over 2021 119
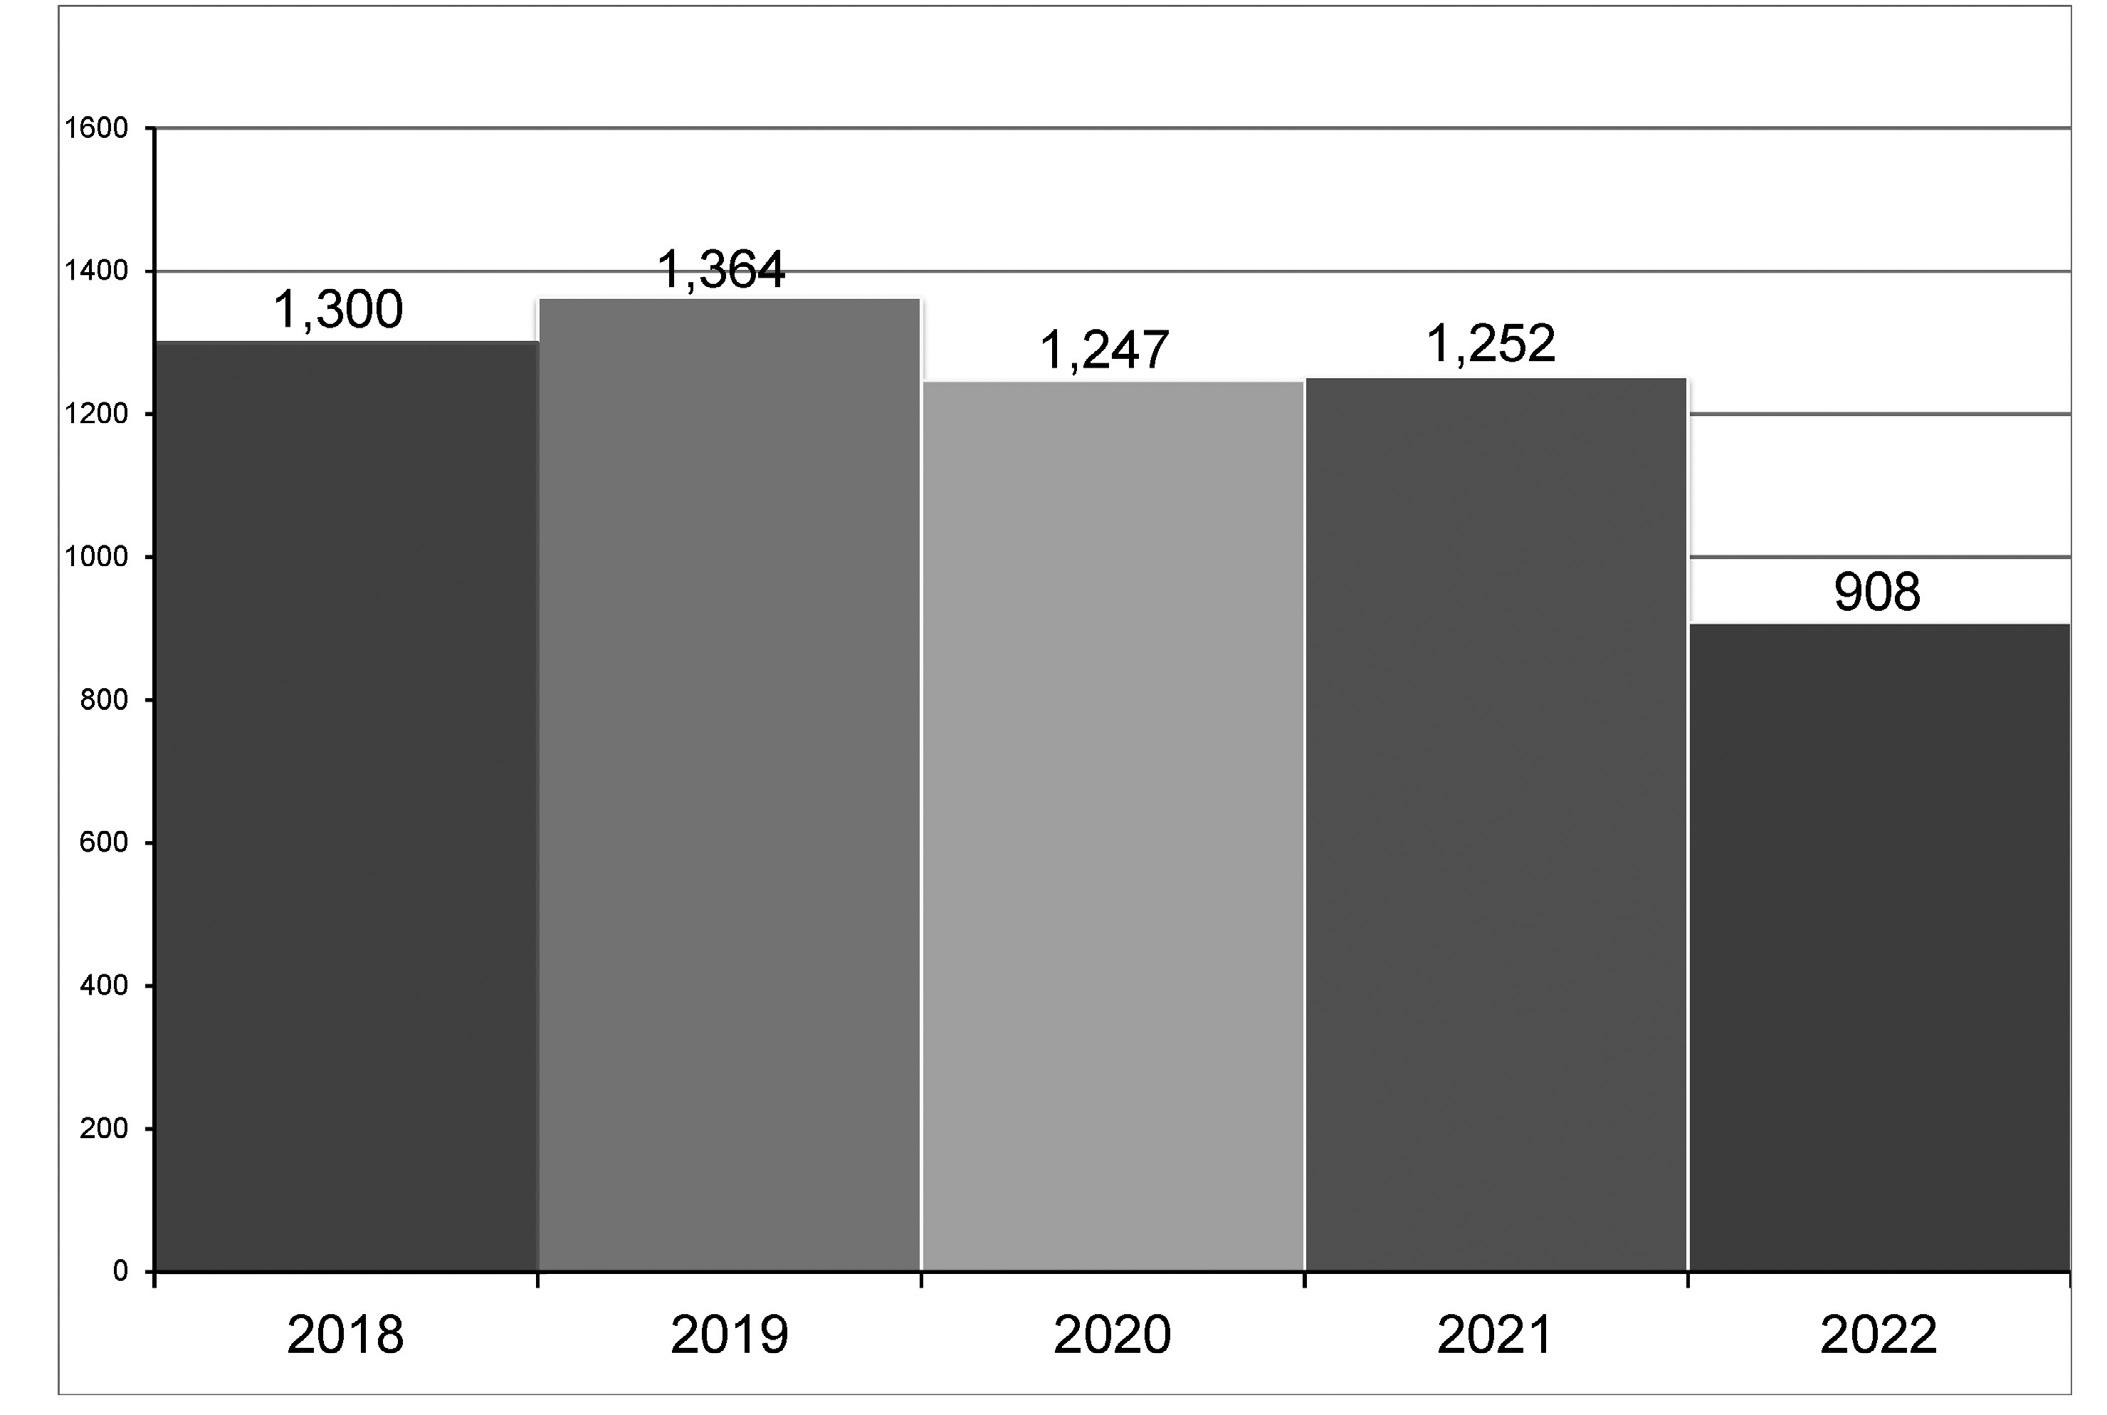
8 SOUTH SANTA BARBARA COUNTY MARKET REPORT | SEPTEMBER 2022 - homes | estates | pudsACTIVE LISTINGS YTD 2018-2022 * Excludes condominium homes.
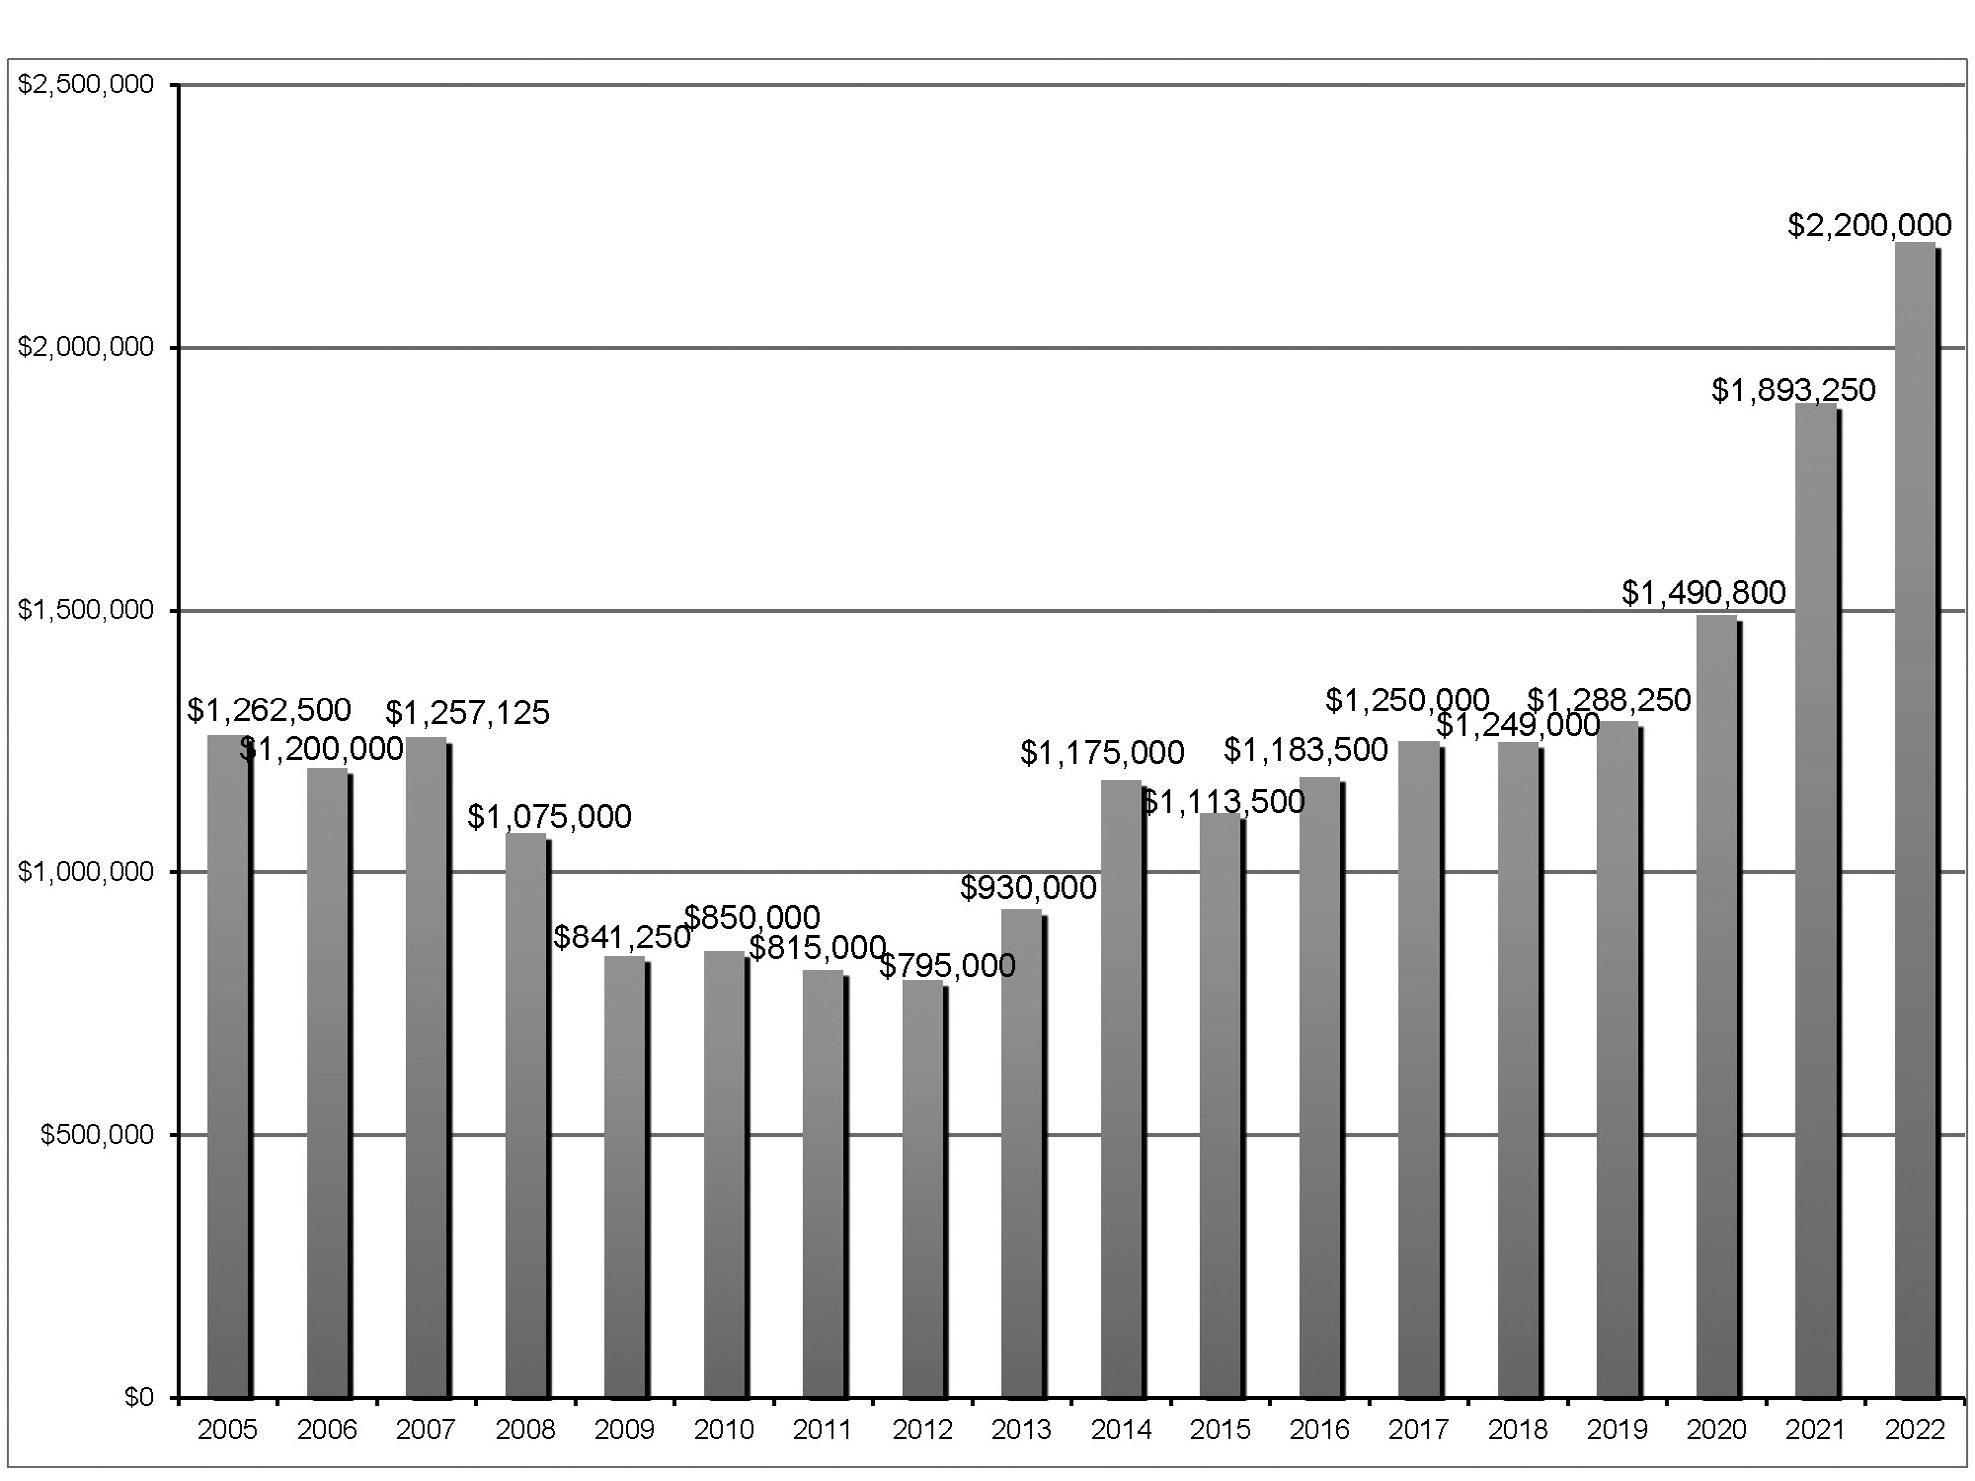
9 - homes | estates | pudsMEDIAN SALES PRICE YTD 2005—2022 * Excludes condominium homes.
10
SEPTEMBER
SOUTH
SANTA
BARBARA COUNTY MARKET REPORT |
2022
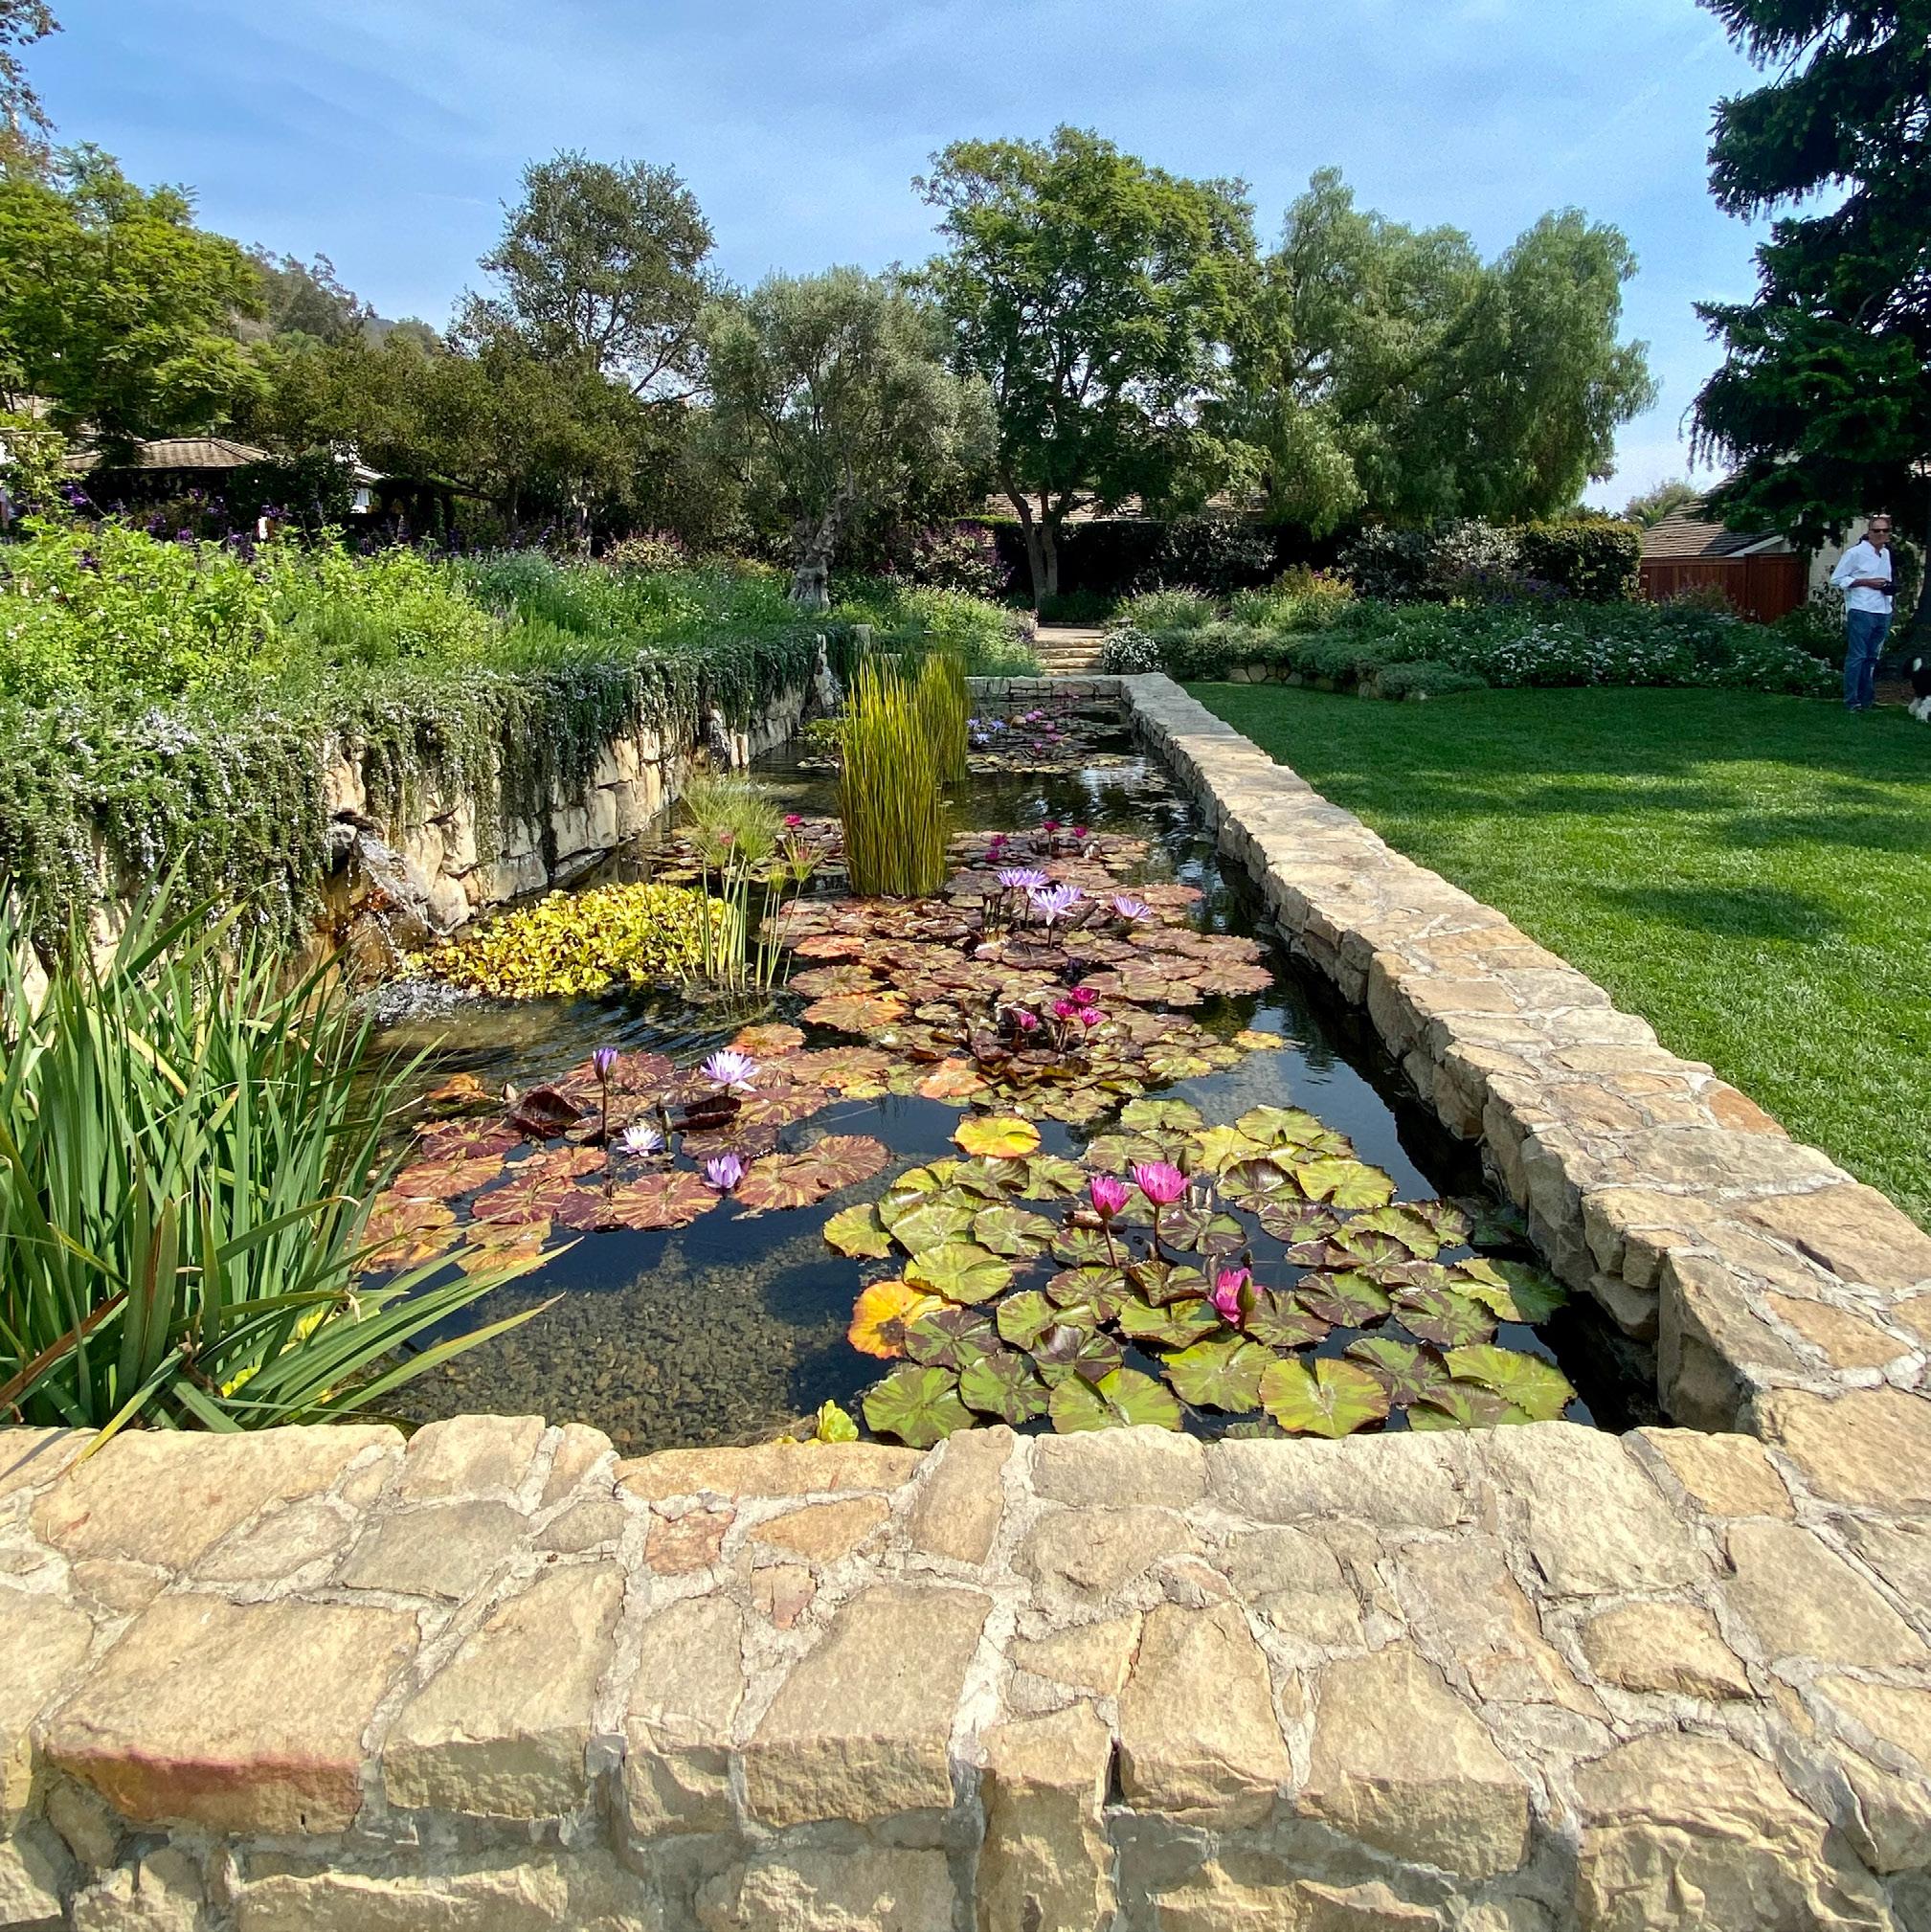
LILLY PONT AT THE SAN YSIDRO RANCH | MONTECITO
11 SINGLE FAMILY RESIDENCES TOTAL YTD SALES 153 AVERAGE SALES PRICE $7,250,037 MEDIAN SALES PRICE $5,400,000 CONDOMINIUM HOMES TOTAL YTD SALES 28 AVERAGE SALES PRICE $2,743,821 MEDIAN SALES PRICE $2,875,000 THIRD QUARTER YTD 2022 | IN REVIEW Single Family Residences + Condominiums (separated sales) TOTAL YTD 2022 SALES 181 MONTECITO
12
MARKET REPORT | SEPTEMBER
SOUTH
SANTA BARBARA
COUNTY
2022
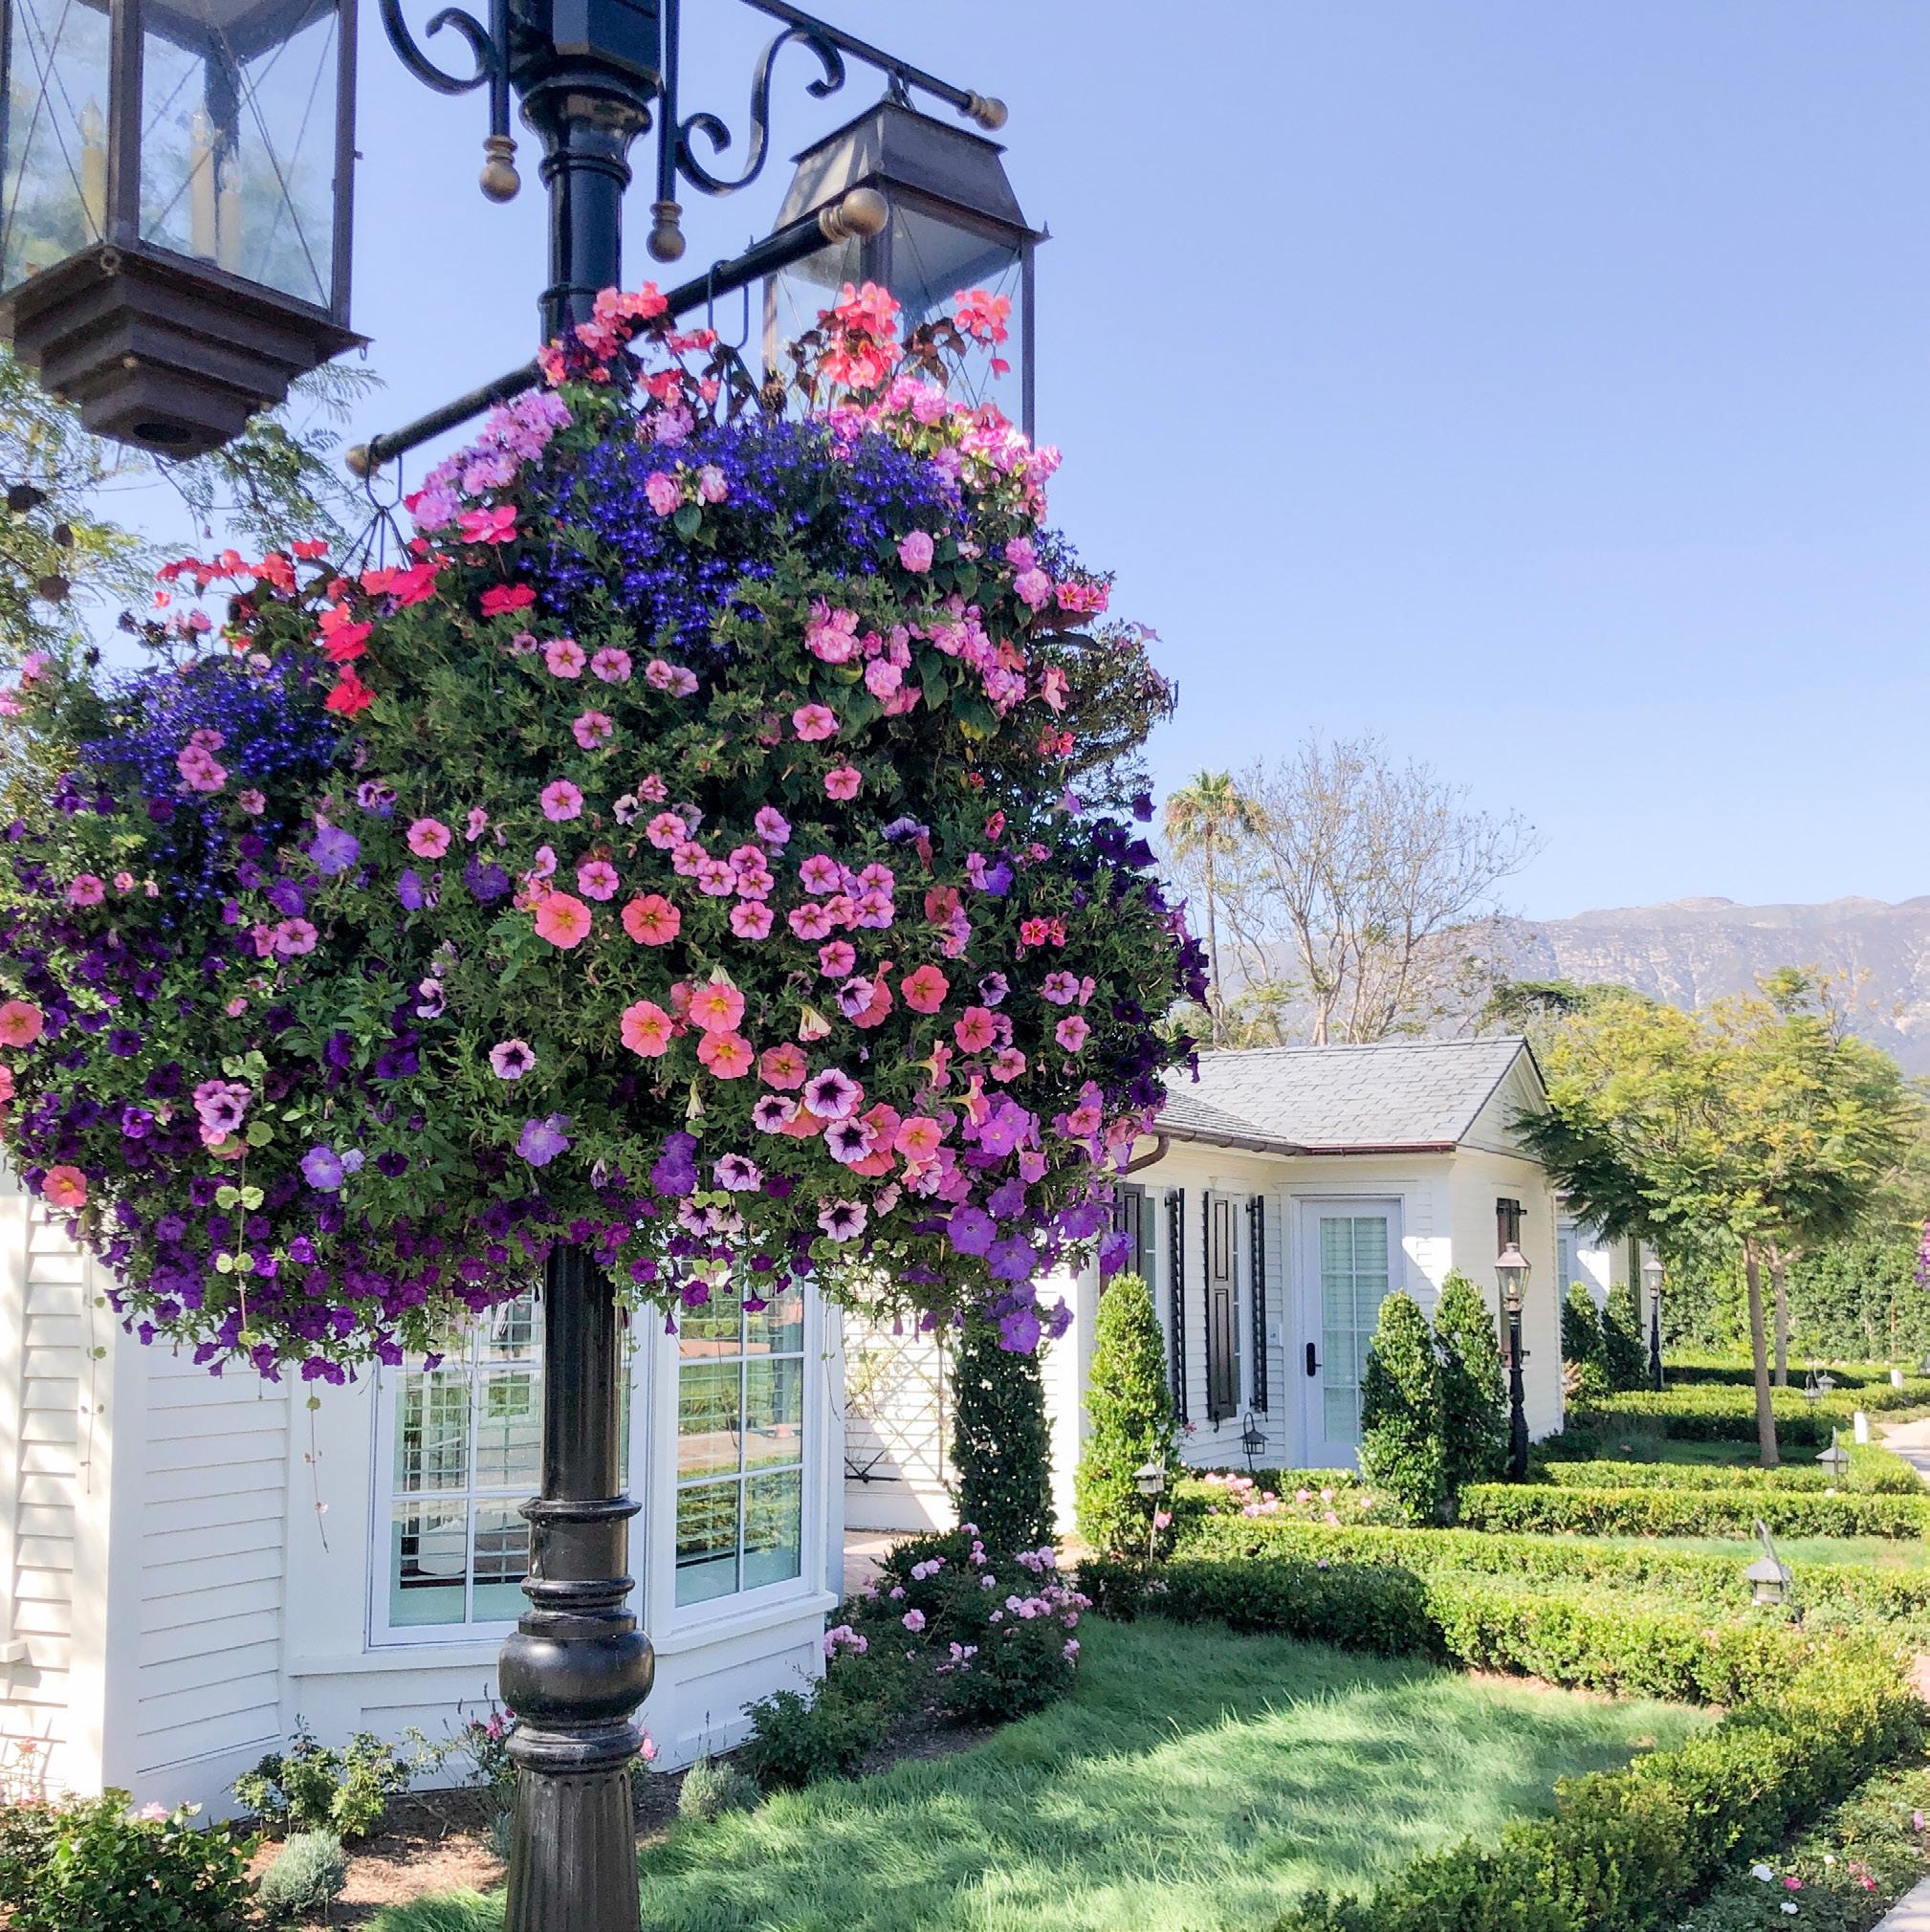
ROSEWOOD MIRAMAR BEACH HOTEL | MONTECITO
13 MONTECITO SEPTEMBER 2022 | IN REVIEW Single Family Residences + Condominiums (combined sales) TOTAL SEPTEMBER SALES 16 AVERAGE SALES PRICE +77% change from 2021 $9,191,438 MEDIAN SALES PRICE +56% change from 2021 $6,450,000 HIGHEST SALES PRICE 848 Hot Springs Road Montecito CA 93108 $36,000,000 LOWEST SALES PRICE 1092 Toro Canyon Road Montecito CA 93108 $1,650,000 CLICK FOR REAL TIME MARKET DATA
Let’s discuss your long-term goals —
Historically, owning property has served as a great investment. Very few people own a home for 2-3 years. Most live in their home for 7-13 years. Almost all homes bought in 2007, prior to the Great Recession, recovered fully and escalated in value. Those owners built equity and were not paying (rising) rent to a landlord.

14 SOUTH SANTA BARBARA COUNTY MARKET REPORT | SEPTEMBER 2022
MONTECITO SALES | SEPTEMBER
Address List Price Sold Price % to List DOM
848 Hot Springs Road Off Market $36,000,000 100% 1 838 Knapp Drive $22,500,000 $18,250,000 81% 42
1284 Mesa Road Off Market $14,500,000 100% 1 260 Oak Road $14,795,000 $13,600,000 92% 17 210 Miramar Avenue Off Market $9,100,000 100% 1
290 Sheffield Drive $8,950,000 $9,000,000 101% 4 207 Eucalyptus Hill Drive $7,975,000 $7,900,000 99% 14
495 Santa Rosa Lane $8,995,000 $7,350,000 82% 77
145 Olive Mill Lane $5,550,000 $5,550,000 100% 26 1944 East Valley Road $5,450,000 $5,400,000 99% 19
125 Santa Isabel Lane Off Market $4,400,000 100% 1 950 Arcady Road $4,250,000 $4,035,000 95% 17
505 El Bosque Road $3,650,000 $3,500,000 96% 40
1517 East Valley Road, B $3,500,000 $3,500,000 100% 6
565 El Bosque Road $3,195,000 $2,900,000 91% 24
585 Sycamore Vista Road $2,195,000 $2,078,000 95% 23
* DOM = Days on Market
15

16 SOUTH
SANTA BARBARA
COUNTY MARKET REPORT | SEPTEMBER 2022
ICONIC RED TILE ROOFTOPS | SANTA BARBARA
17 SINGLE FAMILY RESIDENCES TOTAL YTD SALES 362 AVERAGE SALES PRICE $2,477,275 MEDIAN SALES PRICE $2,180,000 CONDOMINIUM HOMES TOTAL YTD SALES 149 AVERAGE SALES PRICE $1,244,097 MEDIAN SALES PRICE $995,000 THIRD QUARTER YTD 2022 | IN REVIEW Single Family Residences + Condominiums (separated sales) TOTAL YTD 2022 SALES 511 SANTA BARBARA
18
SOUTH
SANTA BARBARA
COUNTY MARKET REPORT | SEPTEMBER 2022
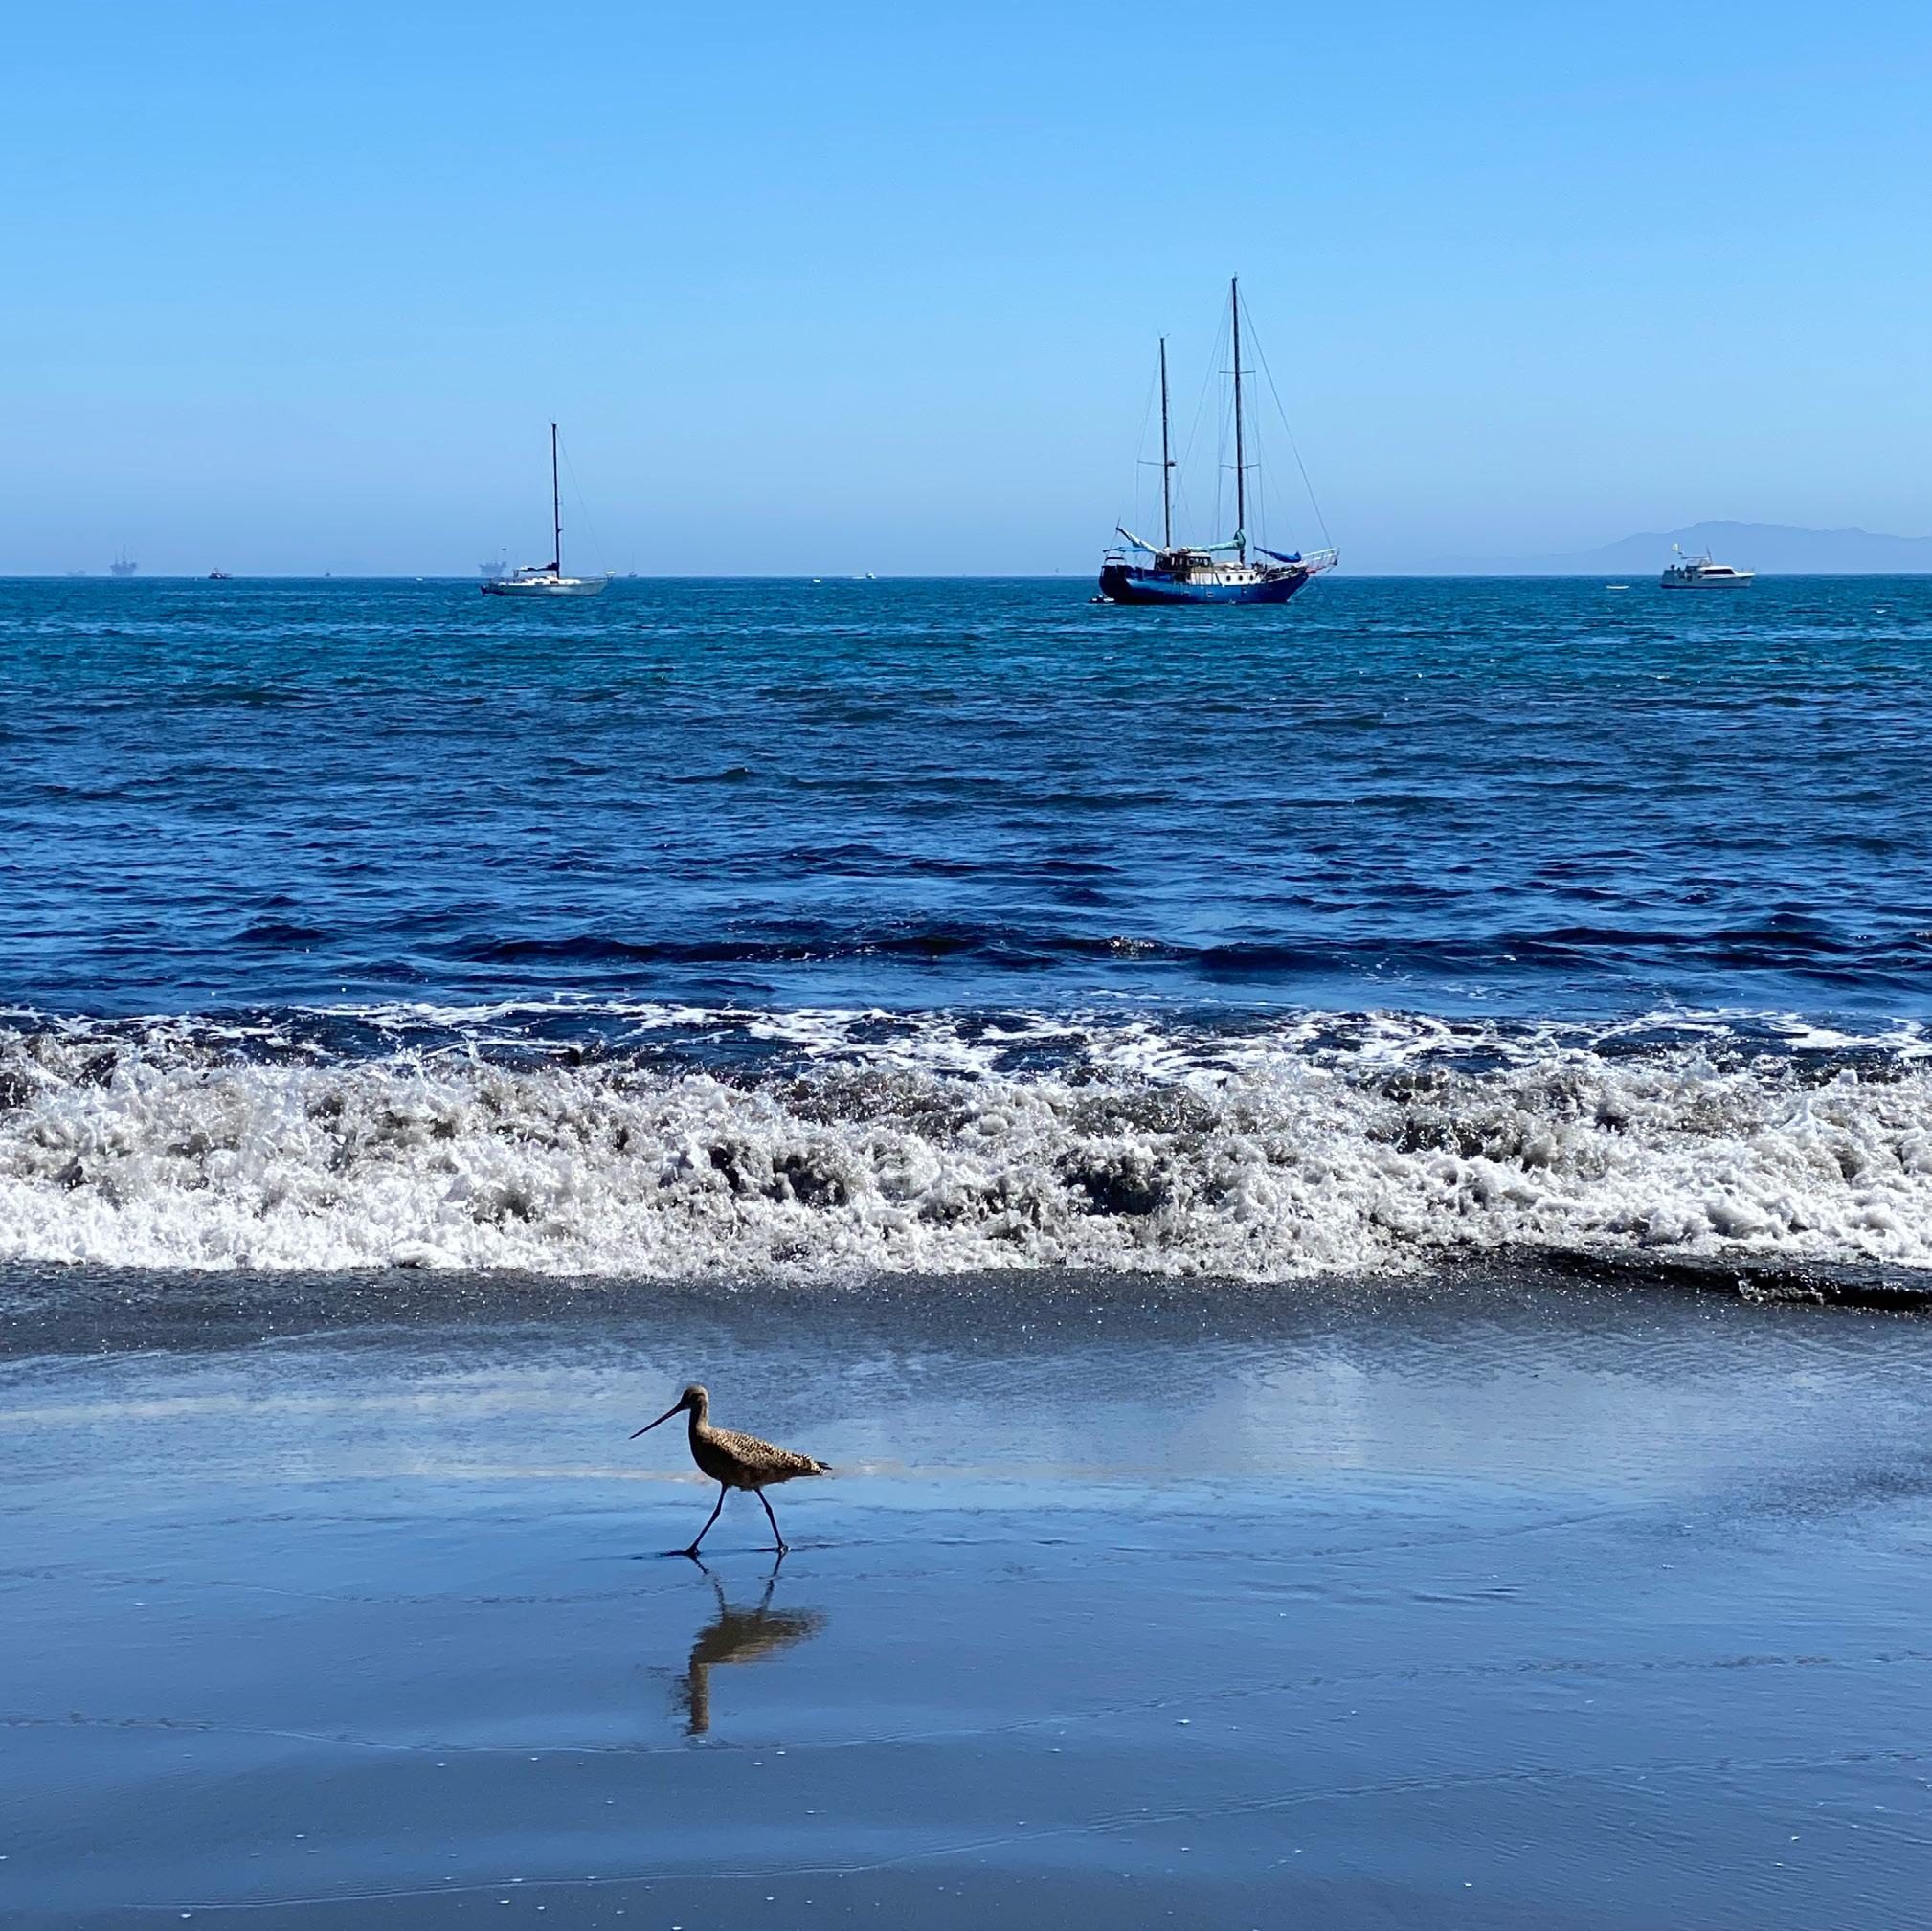
EAST BEACH STROLL | SANTA BARBARA
19 SEPTEMBER 2022 | IN REVIEW Single Family Residences + Condominiums (combined sales) TOTAL SEPTEMBER SALES 52 SANTA BARBARA AVERAGE SALES PRICE +9% change from 2021 $1,805,289 MEDIAN SALES PRICE +2% change from 2021 $1,490,000 HIGHEST SALES PRICE 2232 Santa Barbara Street Santa Barbara CA 93105 $4,888,888 LOWEST SALES PRICE 4025 State Street, Space 55 Santa Barbara CA 93110 $500,000 Manufactured Home CLICK FOR REAL TIME MARKET DATA
20
SOUTH
SANTA
BARBARA COUNTY MARKET REPORT | SEPTEMBER 2022
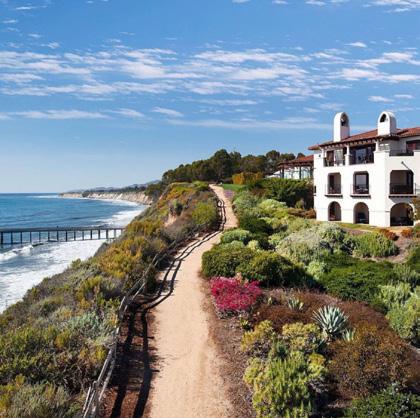
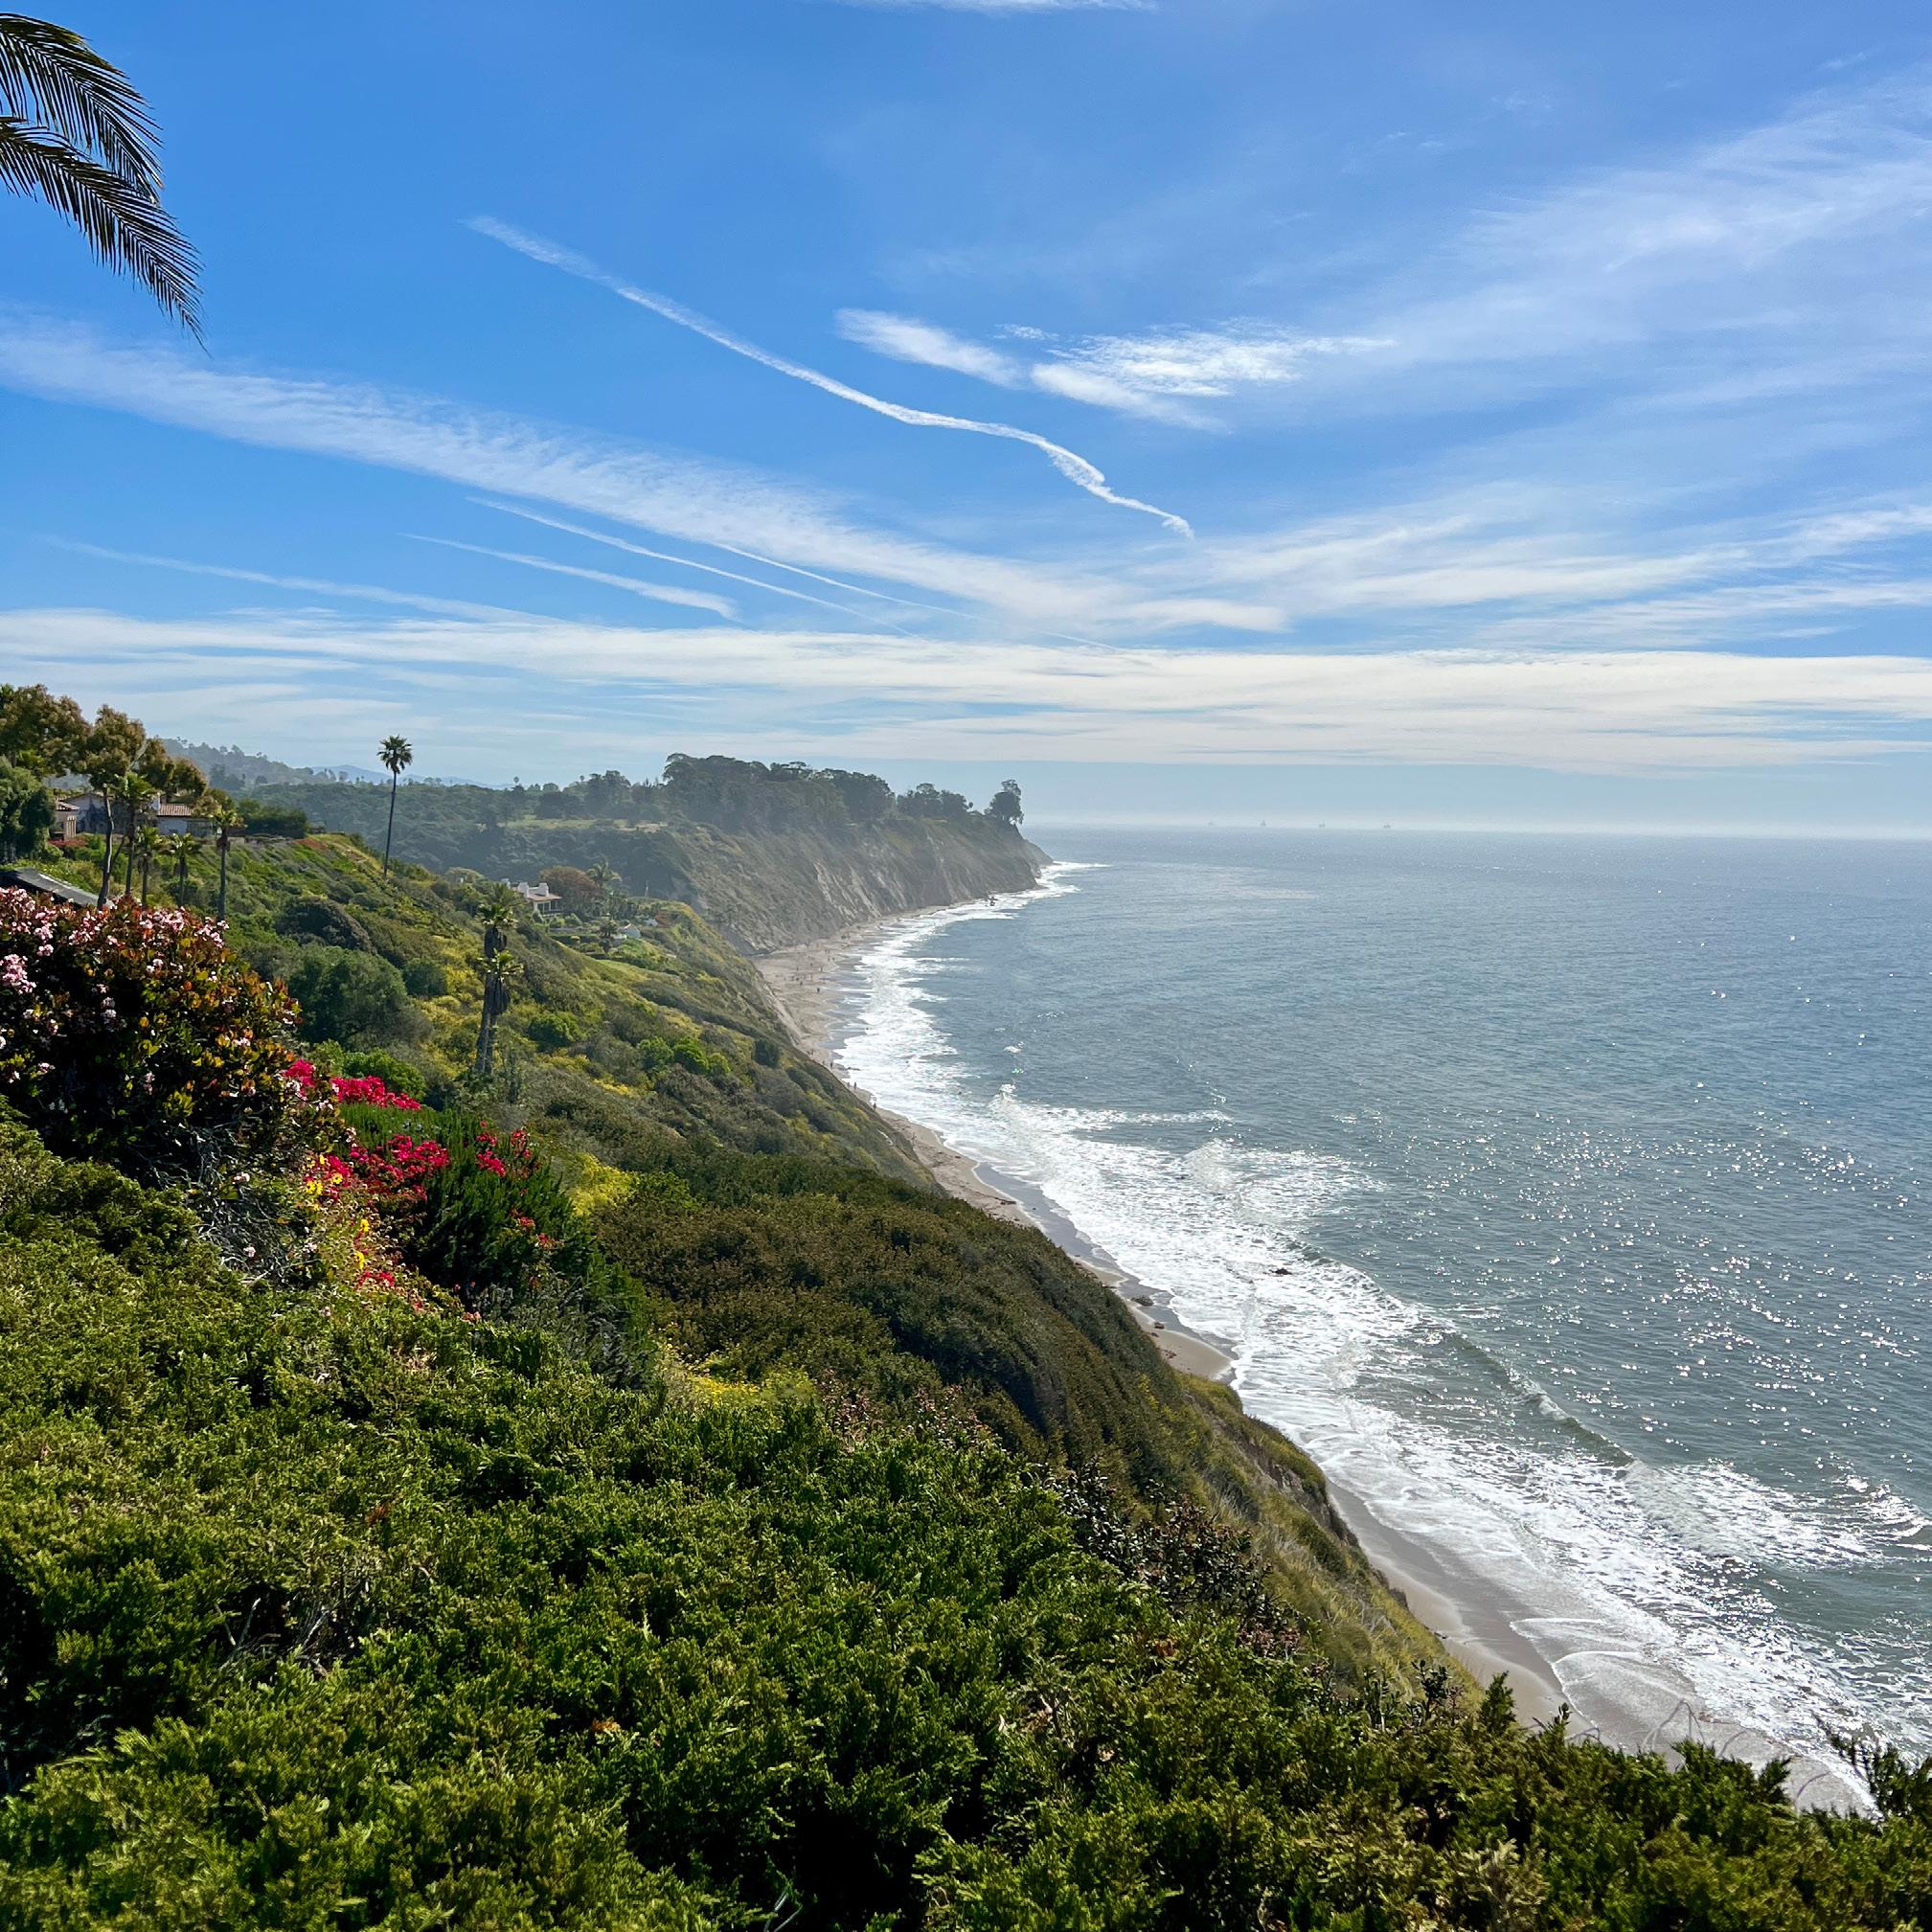
CLIFF SIDE BLUFFS OVERLOOKING PACIFIC OCEAN | HOPE RANCH
21 SINGLE FAMILY RESIDENCES TOTAL YTD SALES 20 AVERAGE SALES PRICE $7,964,873 MEDIAN SALES PRICE $5,412,500 CONDOMINIUM HOMES TOTAL YTD SALES n/a AVERAGE SALES PRICE n/a MEDIAN SALES PRICE n/a THIRD QUARTER YTD 2022 | IN REVIEW Single Family Residences + Condominiums (separated sales) TOTAL YTD 2022 SALES 28 HOPE RANCH

22
SEPTEMBER
SOUTH
SANTA
BARBARA COUNTY MARKET REPORT |
2022
CLIFF SIDE BLUFFS OVERLOOKING PACIFIC OCEAN | HOPE RANCH
23 HOPE RANCH SEPTEMBER 2022 | IN REVIEW Single Family Residences + Condominiums (combined sales) TOTAL SEPTEMBER SALES 4 AVERAGE SALES PRICE +20% change from 2021 $3,950,000 MEDIAN SALES PRICE +8% change from 2021 $3,550,000 HIGHEST SALES PRICE 4539 Via Huerto Hope Ranch CA 93110 $5,400,000 LOWEST SALES PRICE 585 Las Palmas Drive Hope Ranch CA 93110 $3,300,000 CLICK FOR REAL TIME MARKET DATA

24 SOUTH
MARKET REPORT | SEPTEMBER 2022
SANTA BARBARA COUNTY
SUMMERLAND BEACH | DRIFTWOOD ABUNDANCE | SUMMERLAND
25 SINGLE FAMILY RESIDENCES TOTAL YTD SALES 12 AVERAGE SALES PRICE $2,858,750 MEDIAN SALES PRICE $2,175,000 CONDOMINIUM HOMES TOTAL YTD SALES 3 AVERAGE SALES PRICE $1,306,667 MEDIAN SALES PRICE $1,075,000 THIRD QUARTER YTD 2022 | IN REVIEW Single Family Residences + Condominiums (separated sales) TOTAL YTD 2022 SALES 15 SUMMERLAND
26
MARKET REPORT
SOUTH SANTA BARBARA COUNTY
| SEPTEMBER 2022
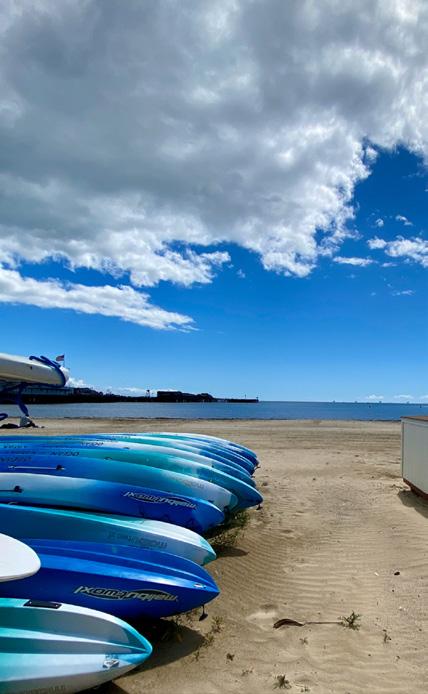
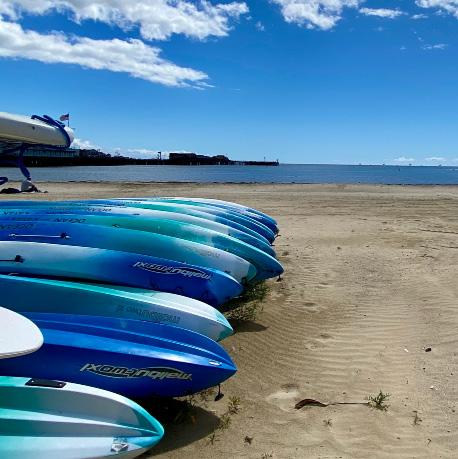
SURF’S UP | SUMMERLAND BEACH
27 SUMMERLAND SEPTEMBER 2022 | IN REVIEW Single Family Residences + Condominiums (combined sales) TOTAL SEPTEMBER SALES 1 AVERAGE SALES PRICE -39% change from 2021 $1,650,000 MEDIAN SALES PRICE -39% change from 2021 $1,650,000 HIGHEST SALES PRICE 1092 Toro Canyon Road Summerland, CA 93108 $1,650,000 LOWEST SALES PRICE 1092 Toro Canyon Road Summerland, CA 93108 $1,650,000 CLICK FOR REAL TIME MARKET DATA
28
MARKET REPORT | SEPTEMBER
SOUTH SANTA BARBARA COUNTY
2022
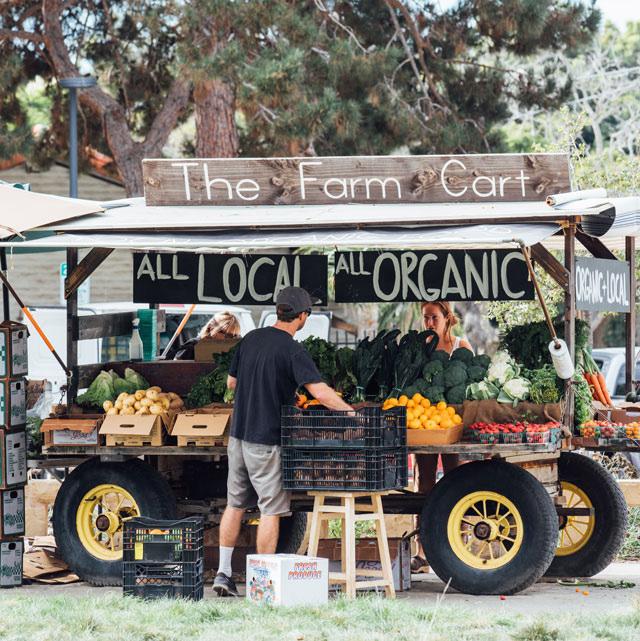
FARMERS MARKET | CARPINTERIA
29 SINGLE FAMILY RESIDENCES TOTAL YTD SALES 57 AVERAGE SALES PRICE $2,890,057 MEDIAN SALES PRICE $1,619,500 CONDOMINIUM HOMES TOTAL YTD SALES 54 AVERAGE SALES PRICE $869,222 MEDIAN SALES PRICE $815,000 THIRD QUARTER YTD 2022 | IN REVIEW Single Family Residences + Condominiums (separated sales) TOTAL YTD 2022 SALES 111 CARPINTERIA
30 SOUTH
COUNTY MARKET REPORT | SEPTEMBER 2022
SANTA BARBARA
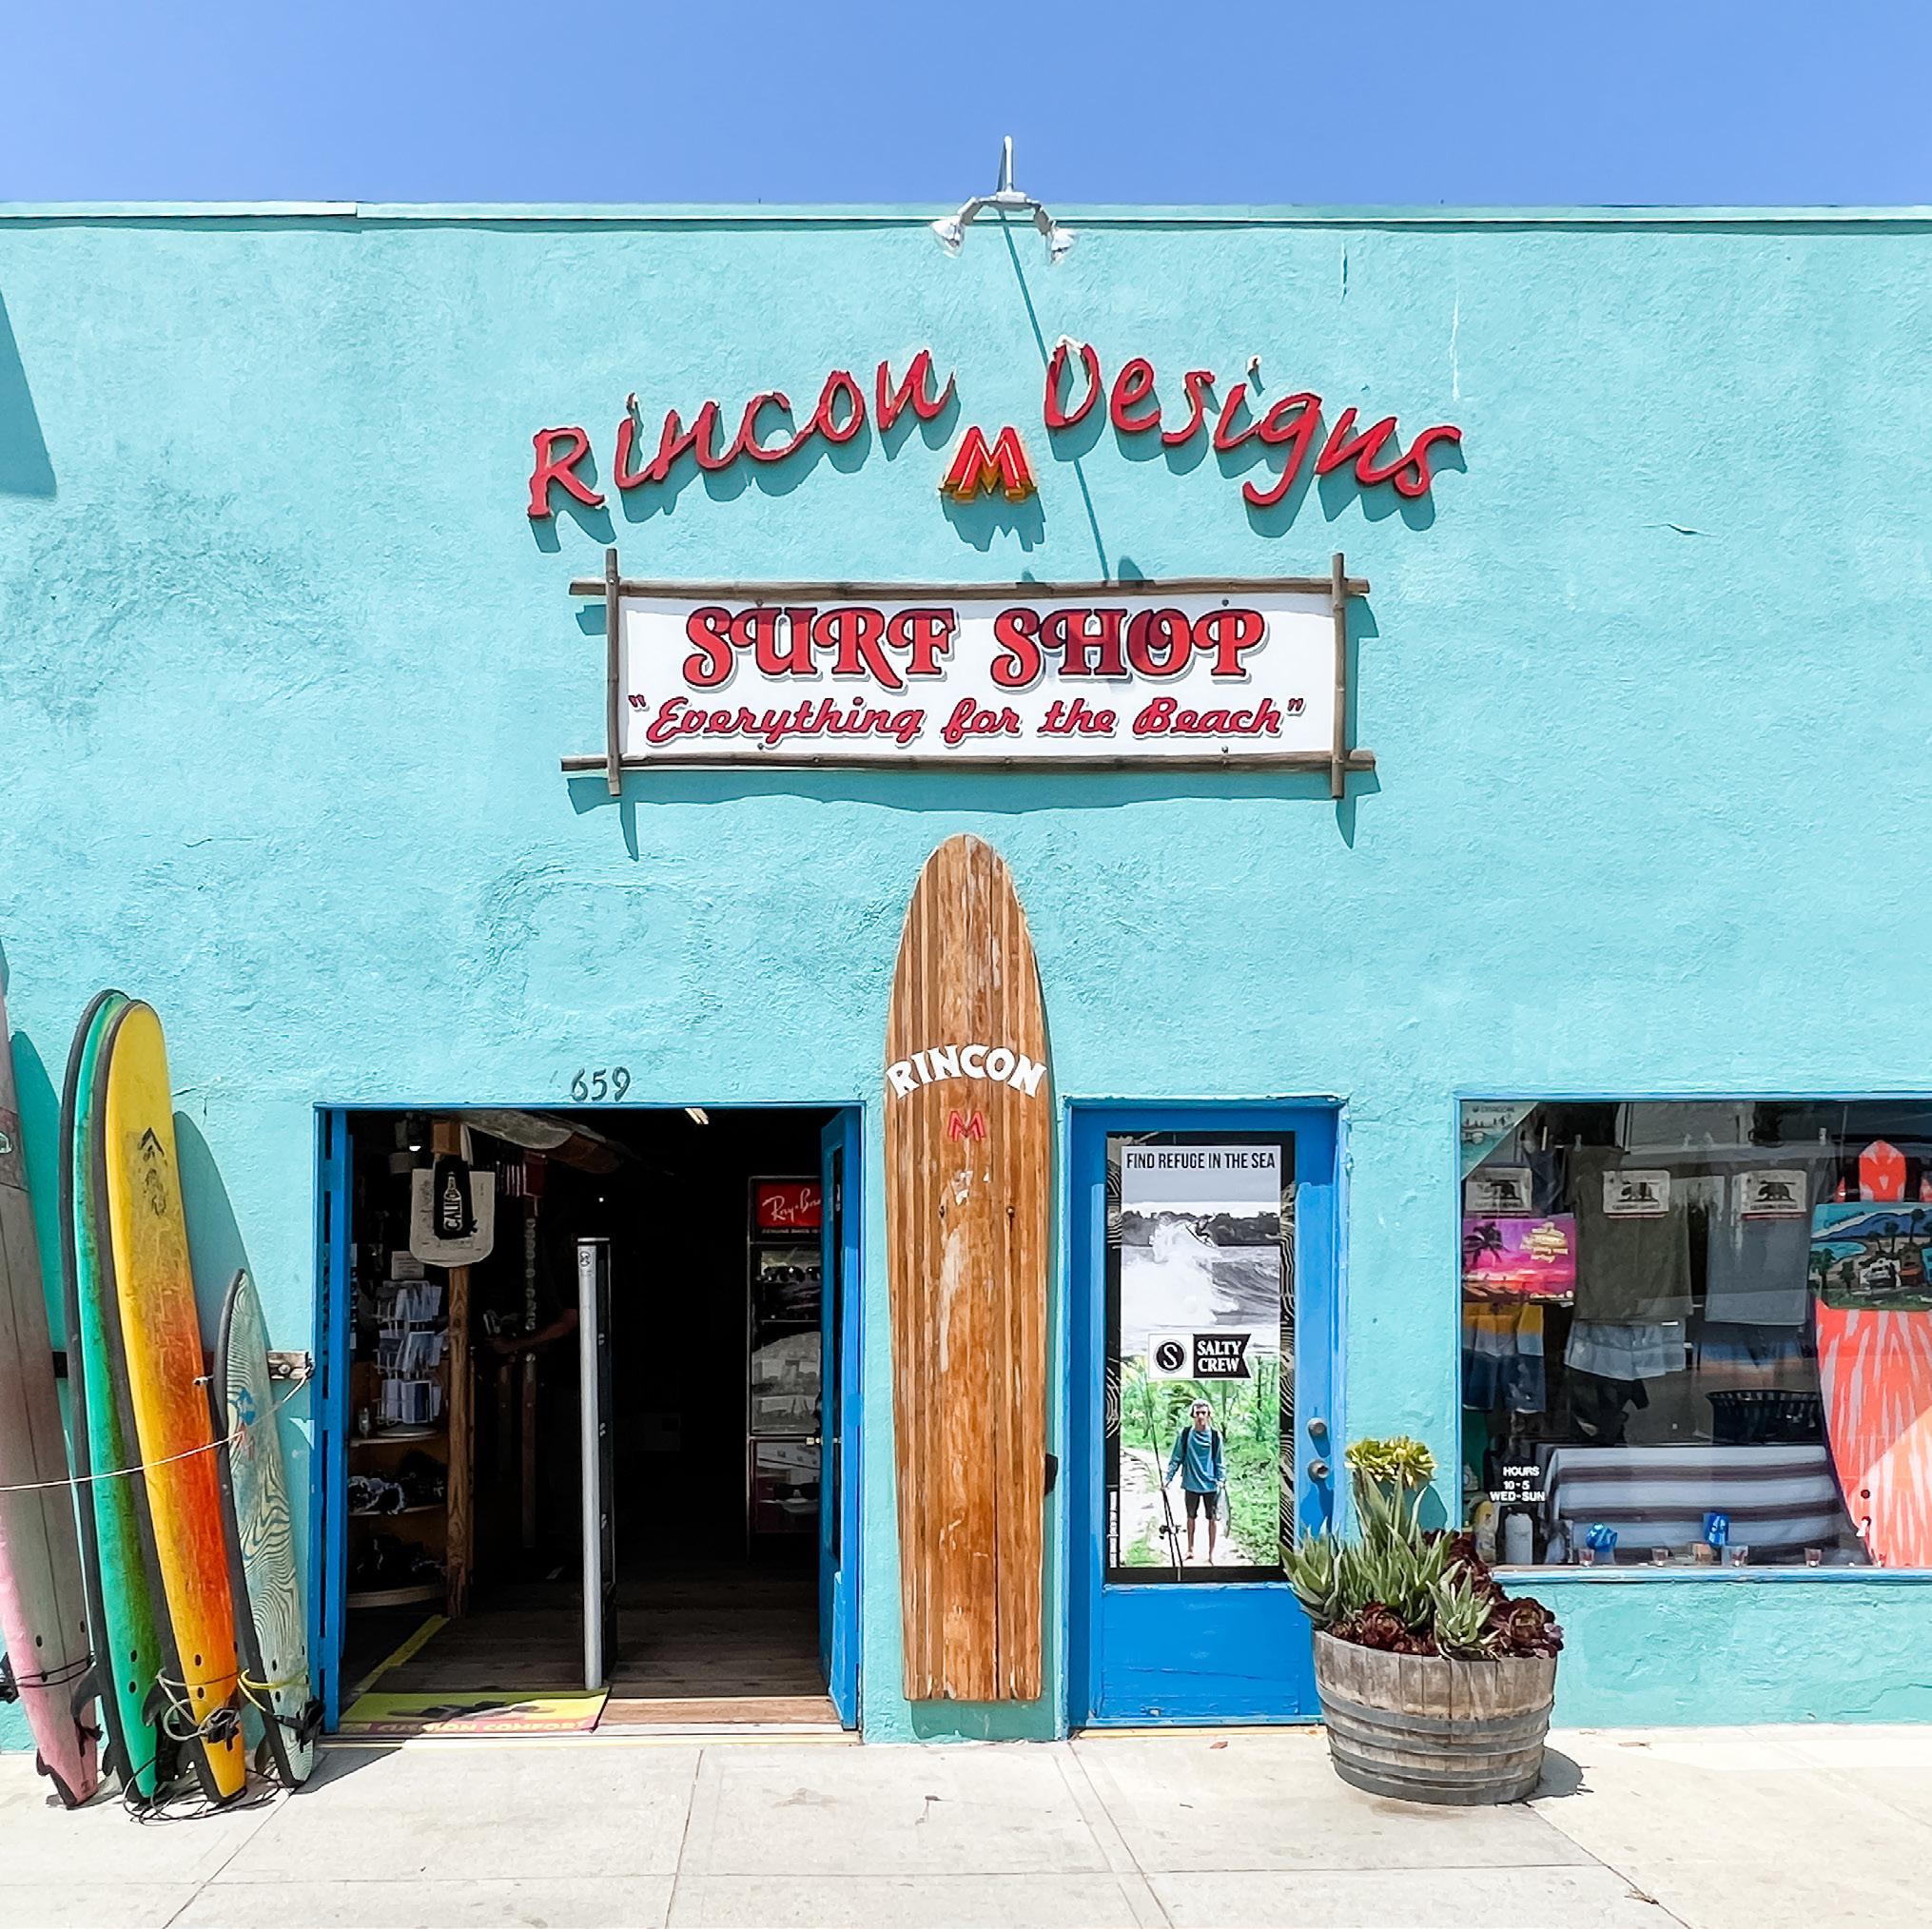
THE ICONIC SURF SHOP | CARPINTERIA
31 CARPINTERIA SEPTEMBER 2022 | IN REVIEW Single Family Residences + Condominiums (combined sales) TOTAL SEPTEMBER SALES 13 AVERAGE SALES PRICE -18% change from 2021 $1,541,731 MEDIAN SALES PRICE +81% change from 2021 $1,499,000 HIGHEST SALES PRICE 5586 Retorno Drive Carpinteria CA 93013 $2,375,000 LOWEST SALES PRICE 349 Ash Avenue, Space 30 Carpinteria CA 93013 $525,000 Manufactured Home CLICK FOR REAL TIME MARKET DATA
32 SOUTH
SANTA BARBARA
COUNTY MARKET REPORT | SEPTEMBER 2022
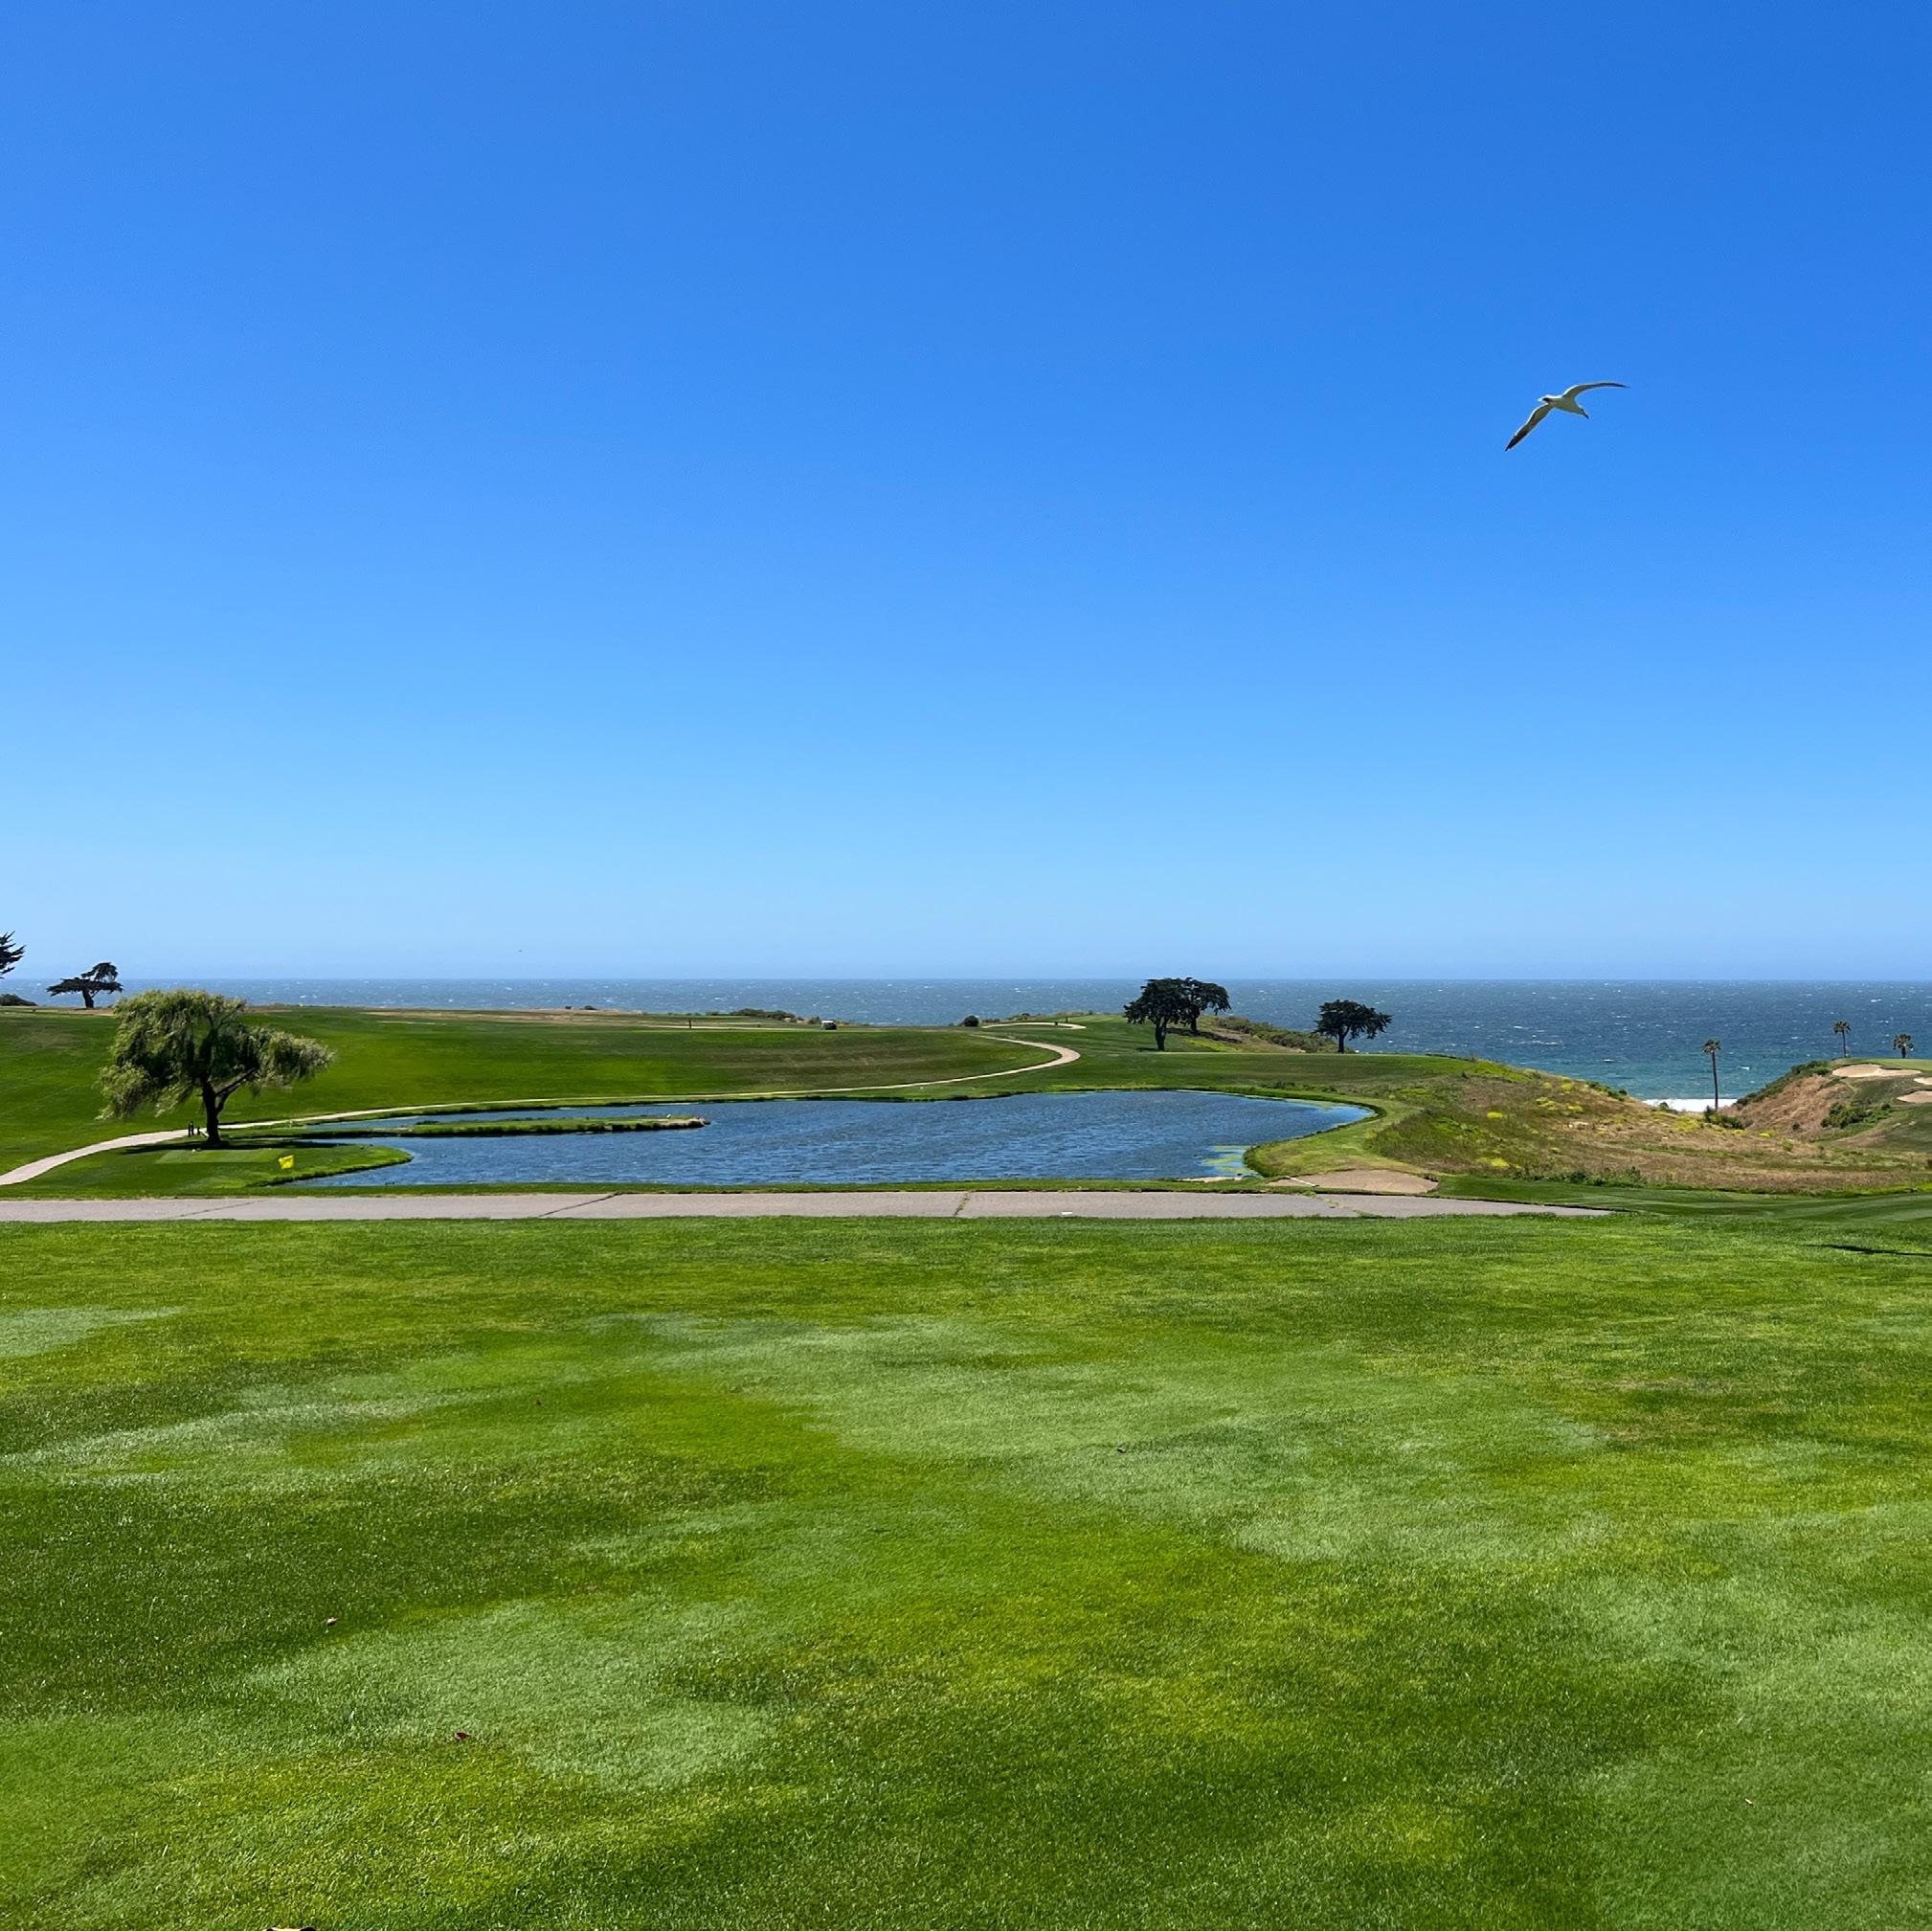
SANDPIPER GOLF CLUB | GOLETA
33 SINGLE FAMILY RESIDENCES TOTAL YTD SALES 218 AVERAGE SALES PRICE $1,712,177 MEDIAN SALES PRICE $1,586,550 CONDOMINIUM HOMES TOTAL YTD SALES 120 AVERAGE SALES PRICE $917,211 MEDIAN SALES PRICE $837,500 THIRD QUARTER YTD 2022 | IN REVIEW Single Family Residences + Condominiums (separated sales) TOTAL YTD 2022 SALES 338 GOLETA
 34 SOUTH SANTA BARBARA COUNTY MARKET REPORT | SEPTEMBER 2022
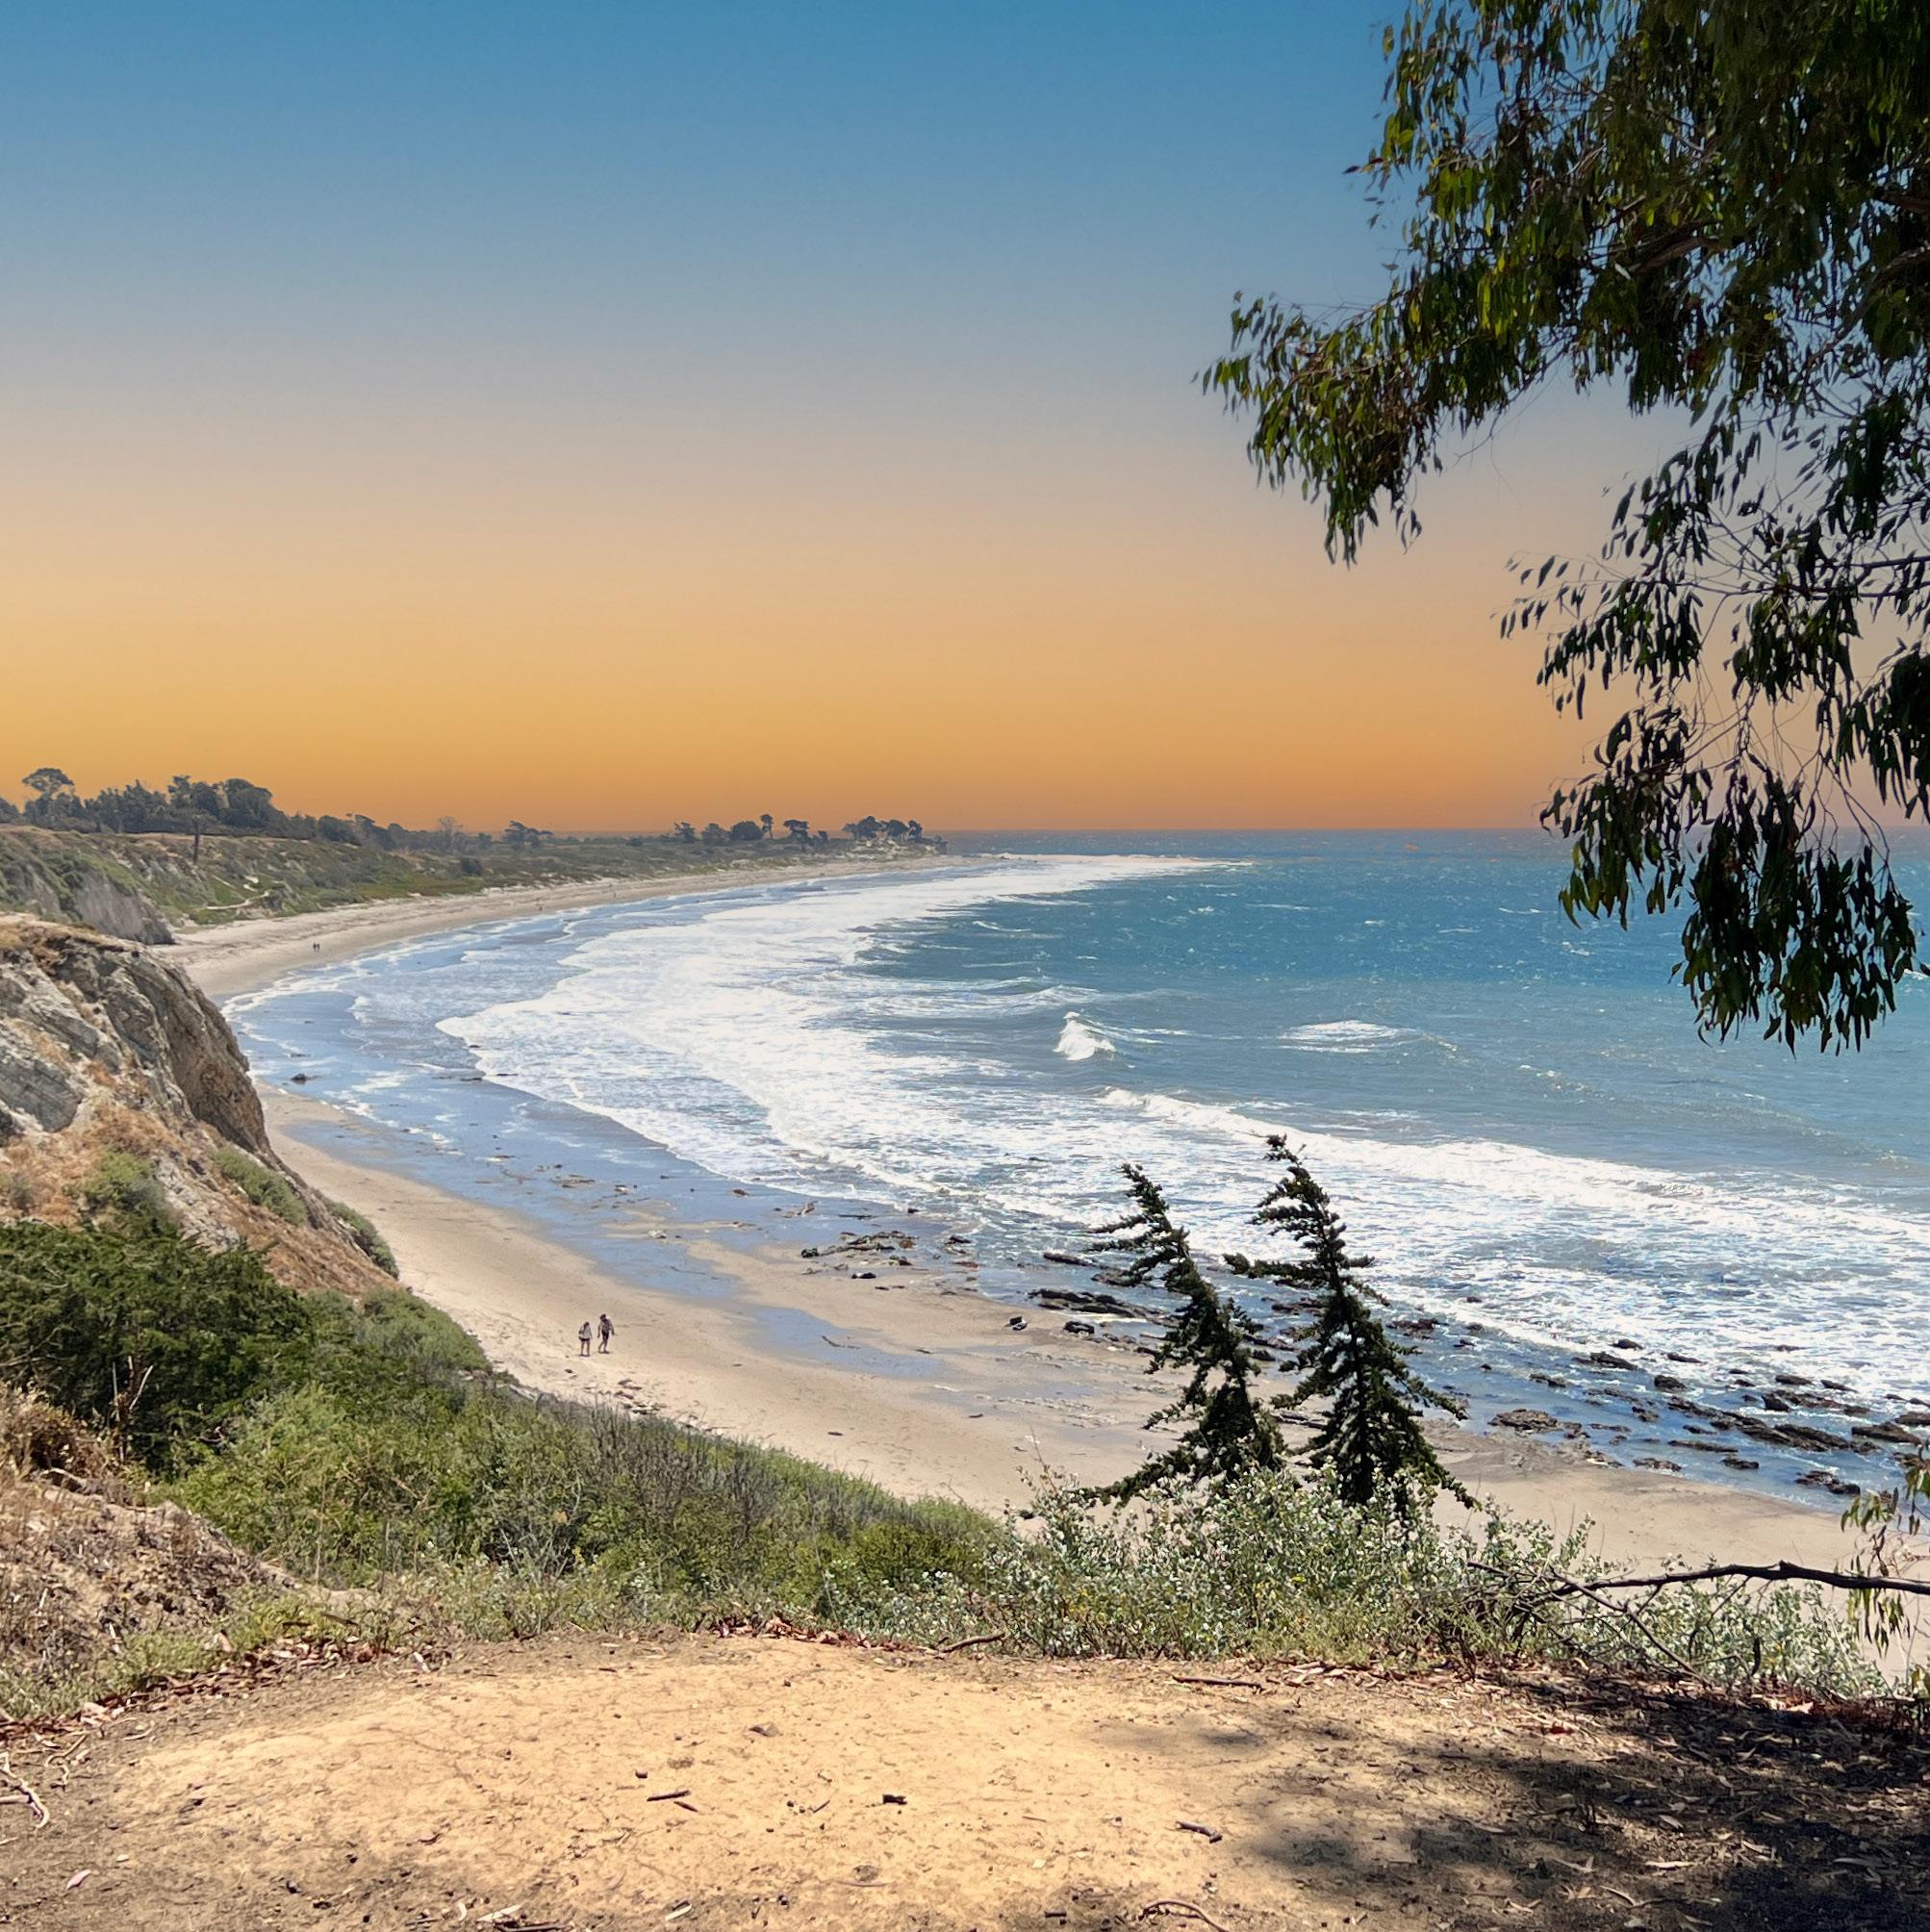
BUTTERFLY PRESERVE + PATH TO SANTA BARBARA SHORES COUNTY PARK | GOLETA
35 GOLETA SEPTEMBER 2022 | IN REVIEW Single Family Residences + Condominiums (combined sales) TOTAL SEPTEMBER SALES 34 AVERAGE SALES PRICE +2% change from 2021 $1,335,368 MEDIAN SALES PRICE +34% change from 2021 $1,357,500 HIGHEST SALES PRICE 1042 Via Los Padres Goleta CA 93111 $3,850,000 LOWEST SALES PRICE 945 Ward Drive, Space 47 Goleta CA 93111 $455,000 Manufactured Home CLICK FOR REAL TIME MARKET DATA

36 SOUTH SANTA BARBARA COUNTY MARKET REPORT | SEPTEMBER 2022 1990 TULAROSA ROAD | LOMPOC CA 93436 Santa Ynez Valley AVA | Sweeping Mountain Views 40± Acres | Zoned RR-10 1529± SF Home | 5,000± SF Warehouse Fantastic New Price at 1,997,000 Exclusive Offering by Randy Haden/Molly Haden
37 SINGLE FAMILY RESIDENCES TOTAL YTD SALES 158 AVERAGE SALES PRICE $2,035,159 MEDIAN SALES PRICE $1,550,000 CONDOMINIUM HOMES TOTAL YTD SALES 21 AVERAGE SALES PRICE $658,186 MEDIAN SALES PRICE $650,000 THIRD QUARTER YTD 2022 | IN REVIEW Single Family Residences + Condominiums (separated sales) TOTAL YTD 2022 SALES 179 SANTA YNEZ VALLEY
DISCRETION
Privacy is the Ultimate Commodity And the Decision to Sell Your Home Is a Personal One.

FLEXIBILITY
Decide When to Share Details About Your Home - Including PriceMore Expansively On Your Own Timing.
QUALITY
Exclusive Exposure To Compass Agents, Including Premium Placements On Agent Facing Platform.

VALUE
Get the Best Offer by Testing The Market Privately to Gather Key Insights Without Your Listing Getting Stale or Overexposed.
38 SOUTH SANTA BARBARA COUNTY MARKET REPORT | SEPTEMBER 2022
Listing


COMPASS PRIVATE EXCLUSIVE LISTINGS Ask Us About Our Exciting Private Exclusive Listings | Contact Us Live For details!
Private Exclusive
home
A Compass
listing is an off-market home that can be shared by a Compass agent directly with their colleagues and their buyers. Property details are not disseminated widely and won’t appear on public
search websites.
your home as a private exclusive allows you to control what information is shared about you and your home while still getting exposure to top agents at Compass.
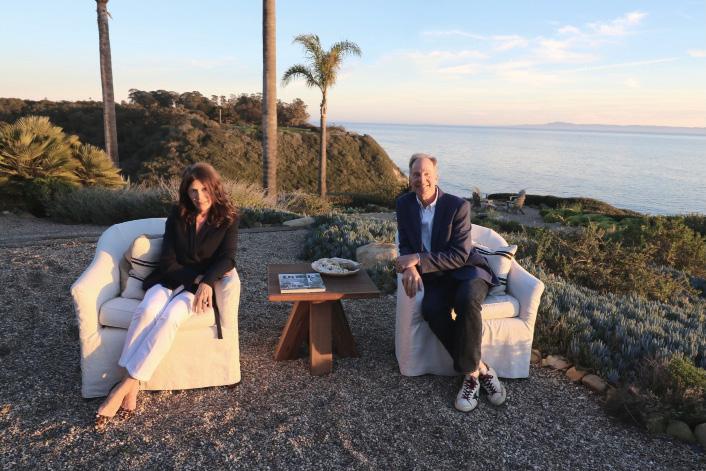


40 SOUTH SANTA BARBARA COUNTY MARKET REPORT | SEPTEMBER 2022 RANDY HADEN Broker Associate / Realtor DRE 01988499 805.880.6530 randy@hadenhomes.com LET’S CONNECT www.hadenhomes.com @hadenhomesrealtors $ 100M + Total Sales 1% Top 1% of Agents CHOOSE experience MOLLY HADEN Realtor / Marketing Director DRE 02020380 805.880.6540 molly@hadenhomes.com


 34 SOUTH SANTA BARBARA COUNTY MARKET REPORT | SEPTEMBER 2022
BUTTERFLY PRESERVE + PATH TO SANTA BARBARA SHORES COUNTY PARK | GOLETA


