Michael Deininger (Milwaukee), Shai Izraeli (Tel Aviv), Pier Mannuccio Mannucci (Milan), Jessica Okosun (London), Pavan Reddy (Ann Arbor), David C. Rees (London), Paul G. Richardson (Boston), Francesco Rodeghiero (Vicenza), Gilles Salles (New York), Kerry Savage (Vancouver), Aaron Schimmer (Toronto), Richard F. Schlenk (Heidelberg)
Statistical Consultant
Catherine Klersy (Pavia)
AI Consultant
Jean Louis Raisaro (Lausanne)
Editorial Board
Walter Ageno (Varese), Sarit Assouline (Montreal), Andrea Bacigalupo (Roma), Taman Bakchoul (Tübingen), Pablo Bartolucci (Créteil), Katherine Borden (Montreal), Marco Cattaneo (Milan), Corey Cutler (Boston), Kate Cwynarski (London), Laurence de Leval (Lausanne), Ahmet Dogan (New York), Mary Eapen (Milwaukee), Francesca Gay (Torino), Ajay Gopal (Seattle), Alex Herrera (Duarte), Martin Kaiser (London), Marina Konopleva (Bronx), Nicolaus Kröger (Hamburg), Austin Kulasekararaj (London), Shaji Kumar (Rochester), Ann LaCasce (Boston), Matthew J. Mauer (Rochester) Neha Mehta-Shah (St. Louis), Moshe Mittelman (Tel Aviv), Alison Moskowitz (New York), Yishai Ofran (Haifa), Farhad Ravandi (Houston), John W. Semple (Lund), Liran Shlush (Toronto), Sarah K. Tasian (Philadelphia), Ofir Wolach (Haifa), Loic Ysebaert (Toulouse)
Haematologica (print edition, pISSN 0390-6078, eISSN 1592-8721) publishes peer-reviewed papers on all areas of experimental and clinical hematology. The journal is owned by a non-profit organization, the Ferrata Storti Foundation, and serves the scientific community following the recommendations of the World Association of Medical Editors (www. wame.org) and the International Committee of Medical Journal Editors (www.icmje.org).
Haematologica publishes Editorials, Original articles, Review articles, Perspective articles, Editorials, Guideline articles, Letters to the Editor, Case reports & Case series and Comments. Manuscripts should be prepared according to our guidelines (www.haematologica.org/information-for-authors), and the Uniform Requirements for Manuscripts Submitted to Biomedical Journals, prepared by the International Committee of Medical Journal Editors (www.icmje.org).
Manuscripts should be submitted online at http://www.haematologica.org/.
Conflict of interests. According to the International Committee of Medical Journal Editors (http://www.icmje. org/#conflicts), “Public trust in the peer review process and the credibility of published articles depend in part on how well conflict of interest is handled during writing, peer review, and editorial decision making”. The ad hoc journal’s policy is reported in detail at www.haematologica.org/content/policies.
Transfer of Copyright and Permission to Reproduce Parts of Published Papers. Authors will grant copyright of their articles to the Ferrata Storti Foundation. No formal permission will be required to reproduce parts (tables or illustrations) of published papers, provided the source is quoted appropriately and reproduction has no commercial intent. Reproductions with commercial intent will require written permission and payment of royalties.
Subscription. Detailed information about subscriptions is available at www.haematologica.org. Haematologica is an open access journal and access to the online journal is free. For subscriptions to the printed issue of the journal, please contact: Haematologica Office, via Giuseppe Belli 4, 27100 Pavia, Italy (phone +39.0382.27129, fax +39.0382.394705, E-mail: info@haematologica.org).
Rates of the printed edition for the year 2022 are as following:
Institutional: Euro 700
Personal: Euro 170
Advertisements. Contact the Advertising Manager, Haematologica Office, via Giuseppe Belli 4, 27100 Pavia, Italy (phone +39.0382.27129, fax +39.0382.394705, e-mail: marketing@haematologica.org).
Disclaimer. Whilst every effort is made by the publishers and the editorial board to see that no inaccurate or misleading data, opinion or statement appears in this journal, they wish to make it clear that the data and opinions appearing in the articles or advertisements herein are the responsibility of the contributor or advisor concerned. Accordingly, the publisher, the editorial board and their respective employees, officers and agents accept no liability whatsoever for the consequences of any inaccurate or misleading data, opinion or statement. Whilst all due care is taken to ensure that drug doses and other quantities are presented accurately, readers are advised that new methods and techniques involving drug usage, and described within this journal, should only be followed in conjunction with the drug manufacturer’s own published literature.
Direttore responsabile: Prof. Carlo Balduini; Autorizzazione del Tribunale di Pavia n. 63 del 5 marzo 1955. Printing: Press Up, zona Via Cassia Km 36, 300 Zona Ind.le Settevene - 01036 Nepi (VT)
Associated with USPI, Unione Stampa Periodica Italiana. Premiato per l’alto valore culturale dal Ministero dei Beni Culturali ed Ambientali
Table of Contents
Volume 109, Issue 8: August 2024
About the Cover
Image taken from the Editorial by Angela Maria Savino and Lucille Stuani in this issue.
Landmark Paper in Hematology
2383 Combination chemotherapy for Hodgkin lymphoma
A.J. Moskowitz
https://doi.org/10.3324/haematol.2024.285825
Editorials
2385 Rethinking paraneoplastic eosinophilia
K.M. Bernt
https://doi.org/10.3324/haematol.2024.285081
2388 Targeting glycolysis to rescue 2-hydroxyglutarate immunosuppressive effects in dendritic cells and acute myeloid leukemia
A.M. Savino and L. Stuani
https://doi.org/10.3324/haematol.2023.284893
2391 SH2B3 alterations in a novel genetic condition, juvenile myelomonocytic leukemia, and myeloproliferative neoplasia
C.M. Niemeyer and M. Erlacher
https://doi.org/10.3324/haematol.2023.284747
2395 More is not always better, sometimes it is just more
A. Salar Silvestre
https://doi.org/10.3324/haematol.2024.285019
2398 Beyond adenosine triphosphate: unveiling the pleiotropic effects of pyruvate kinase activation in sickle cell anemia
A. Glenthøj https://doi.org/10.3324/haematol.2024.285390
Review Articles
2401 Health-related quality of life in patients with hematologic malignancies treated with chimeric antigen receptor T-cell therapy: review and current progress
E. Tchernonog et al.
https://doi.org/10.3324/haematol.2022.282363
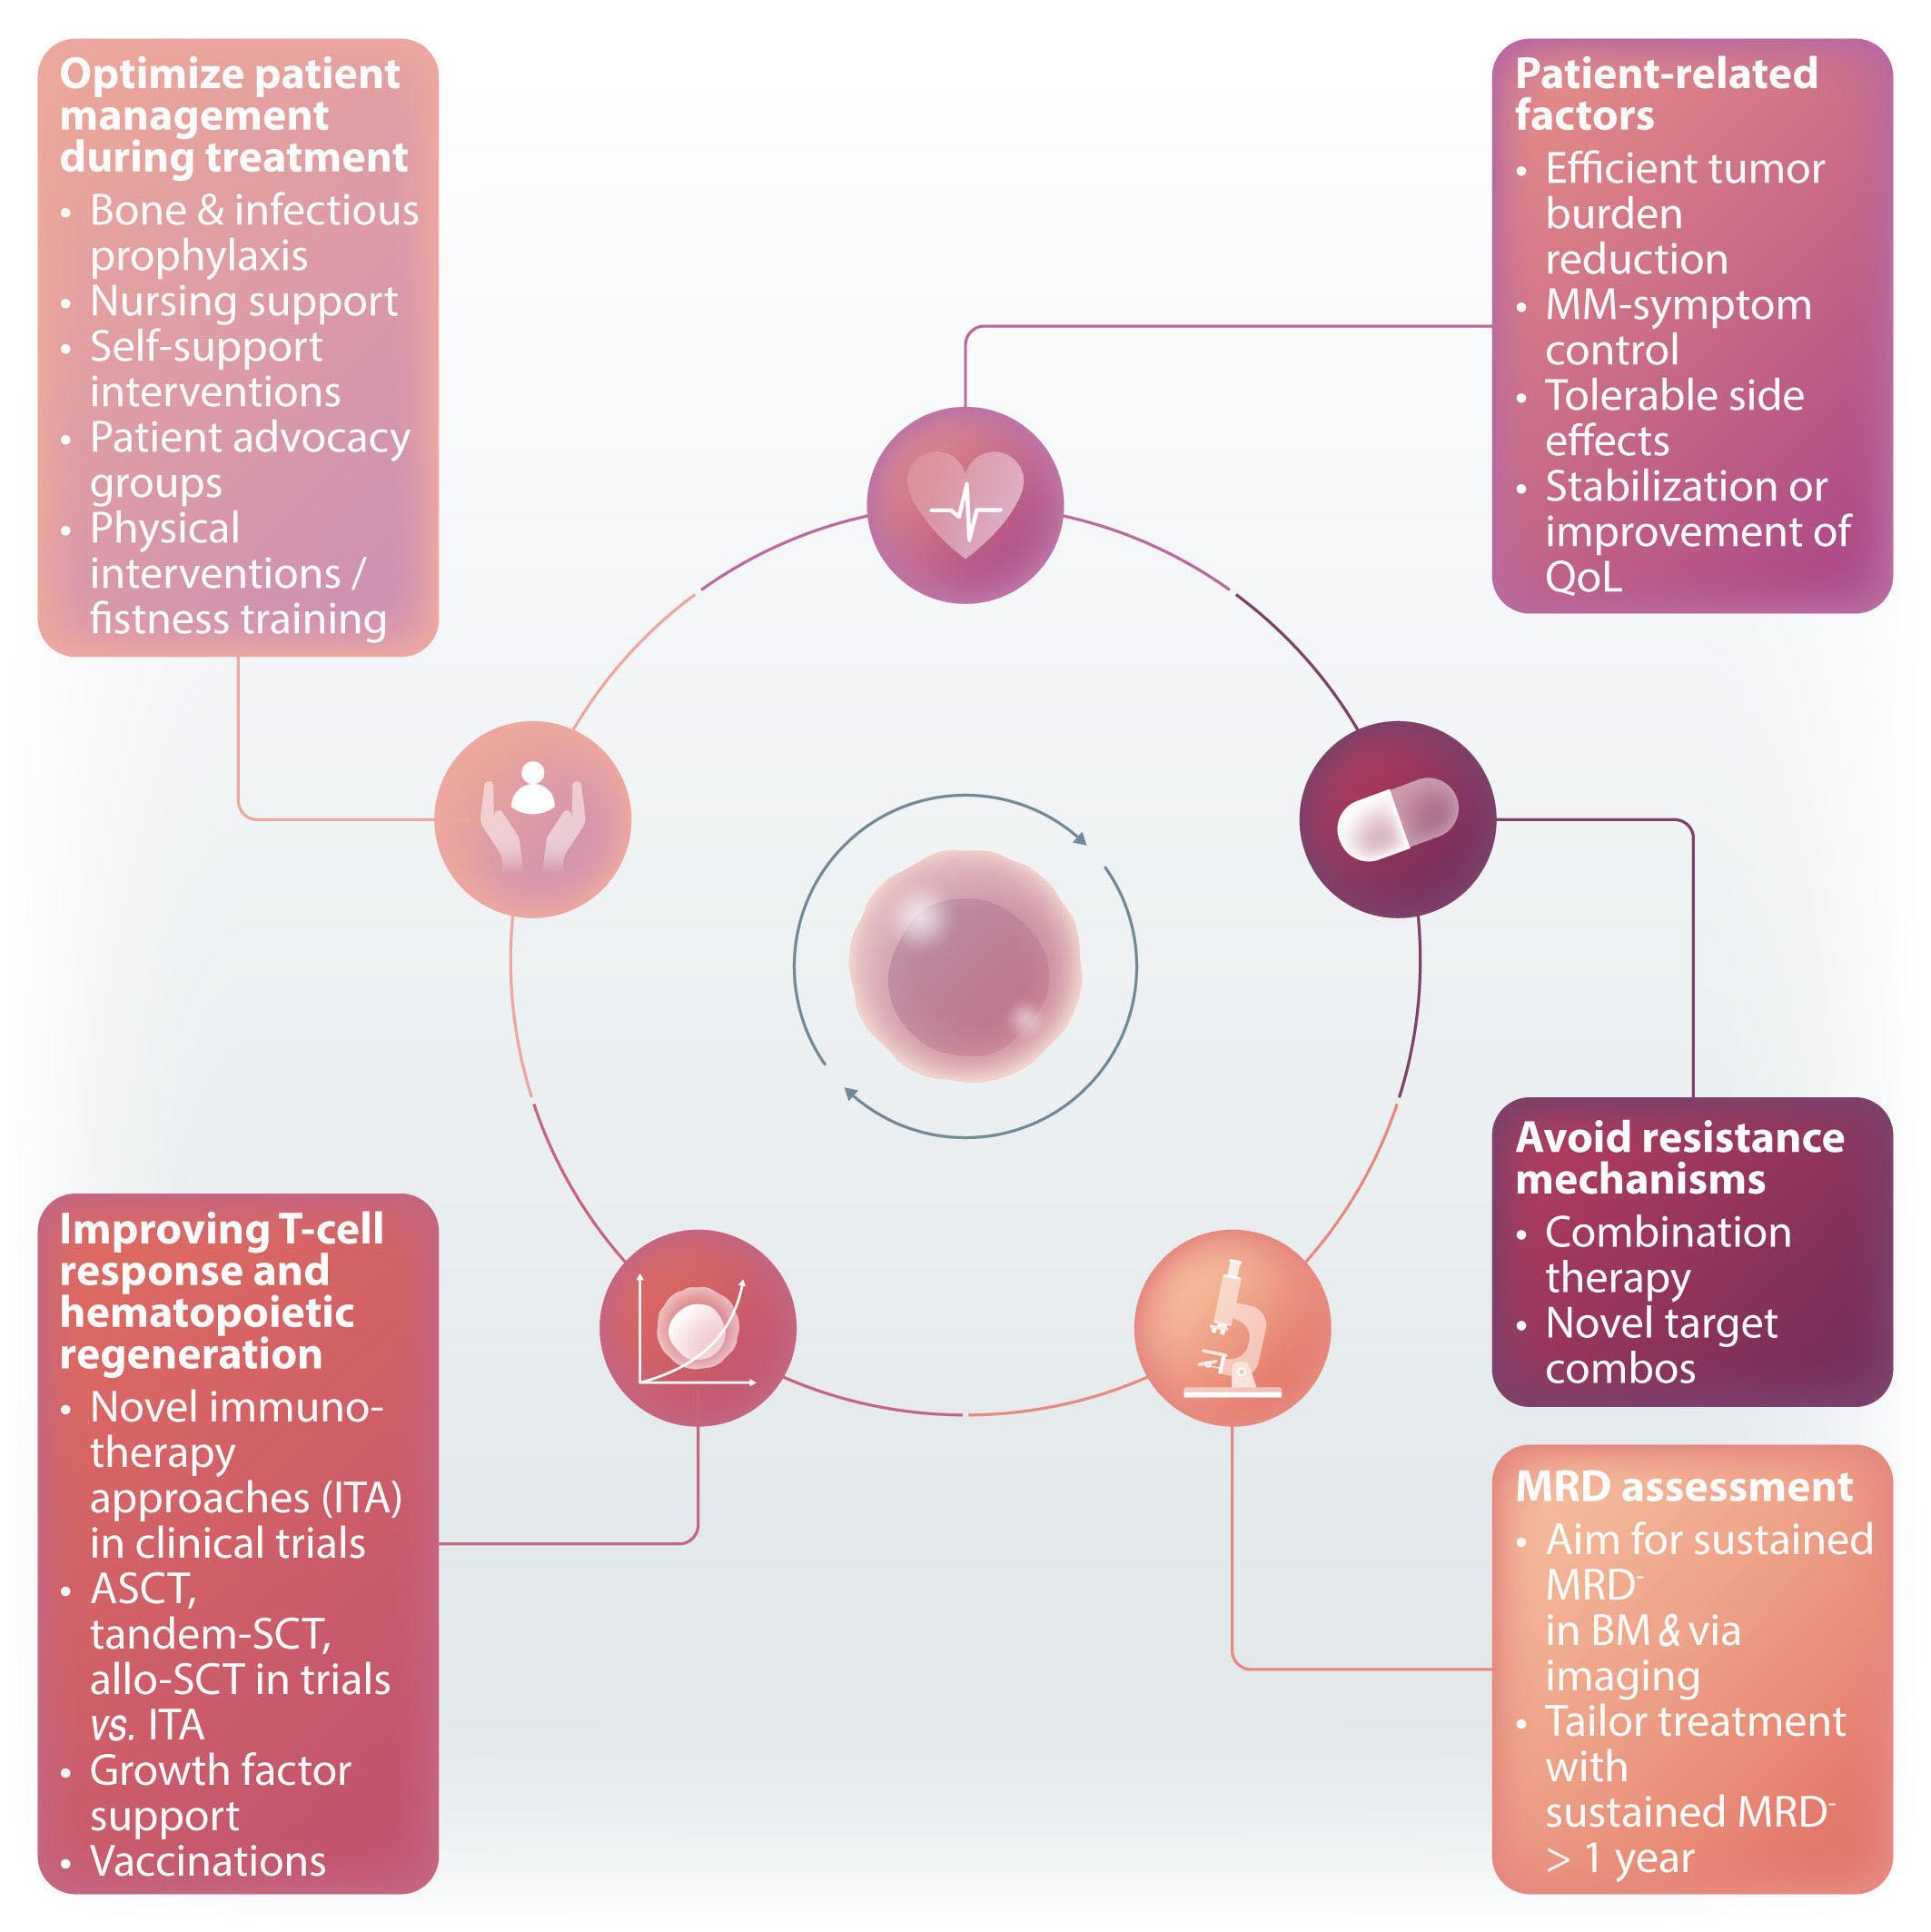
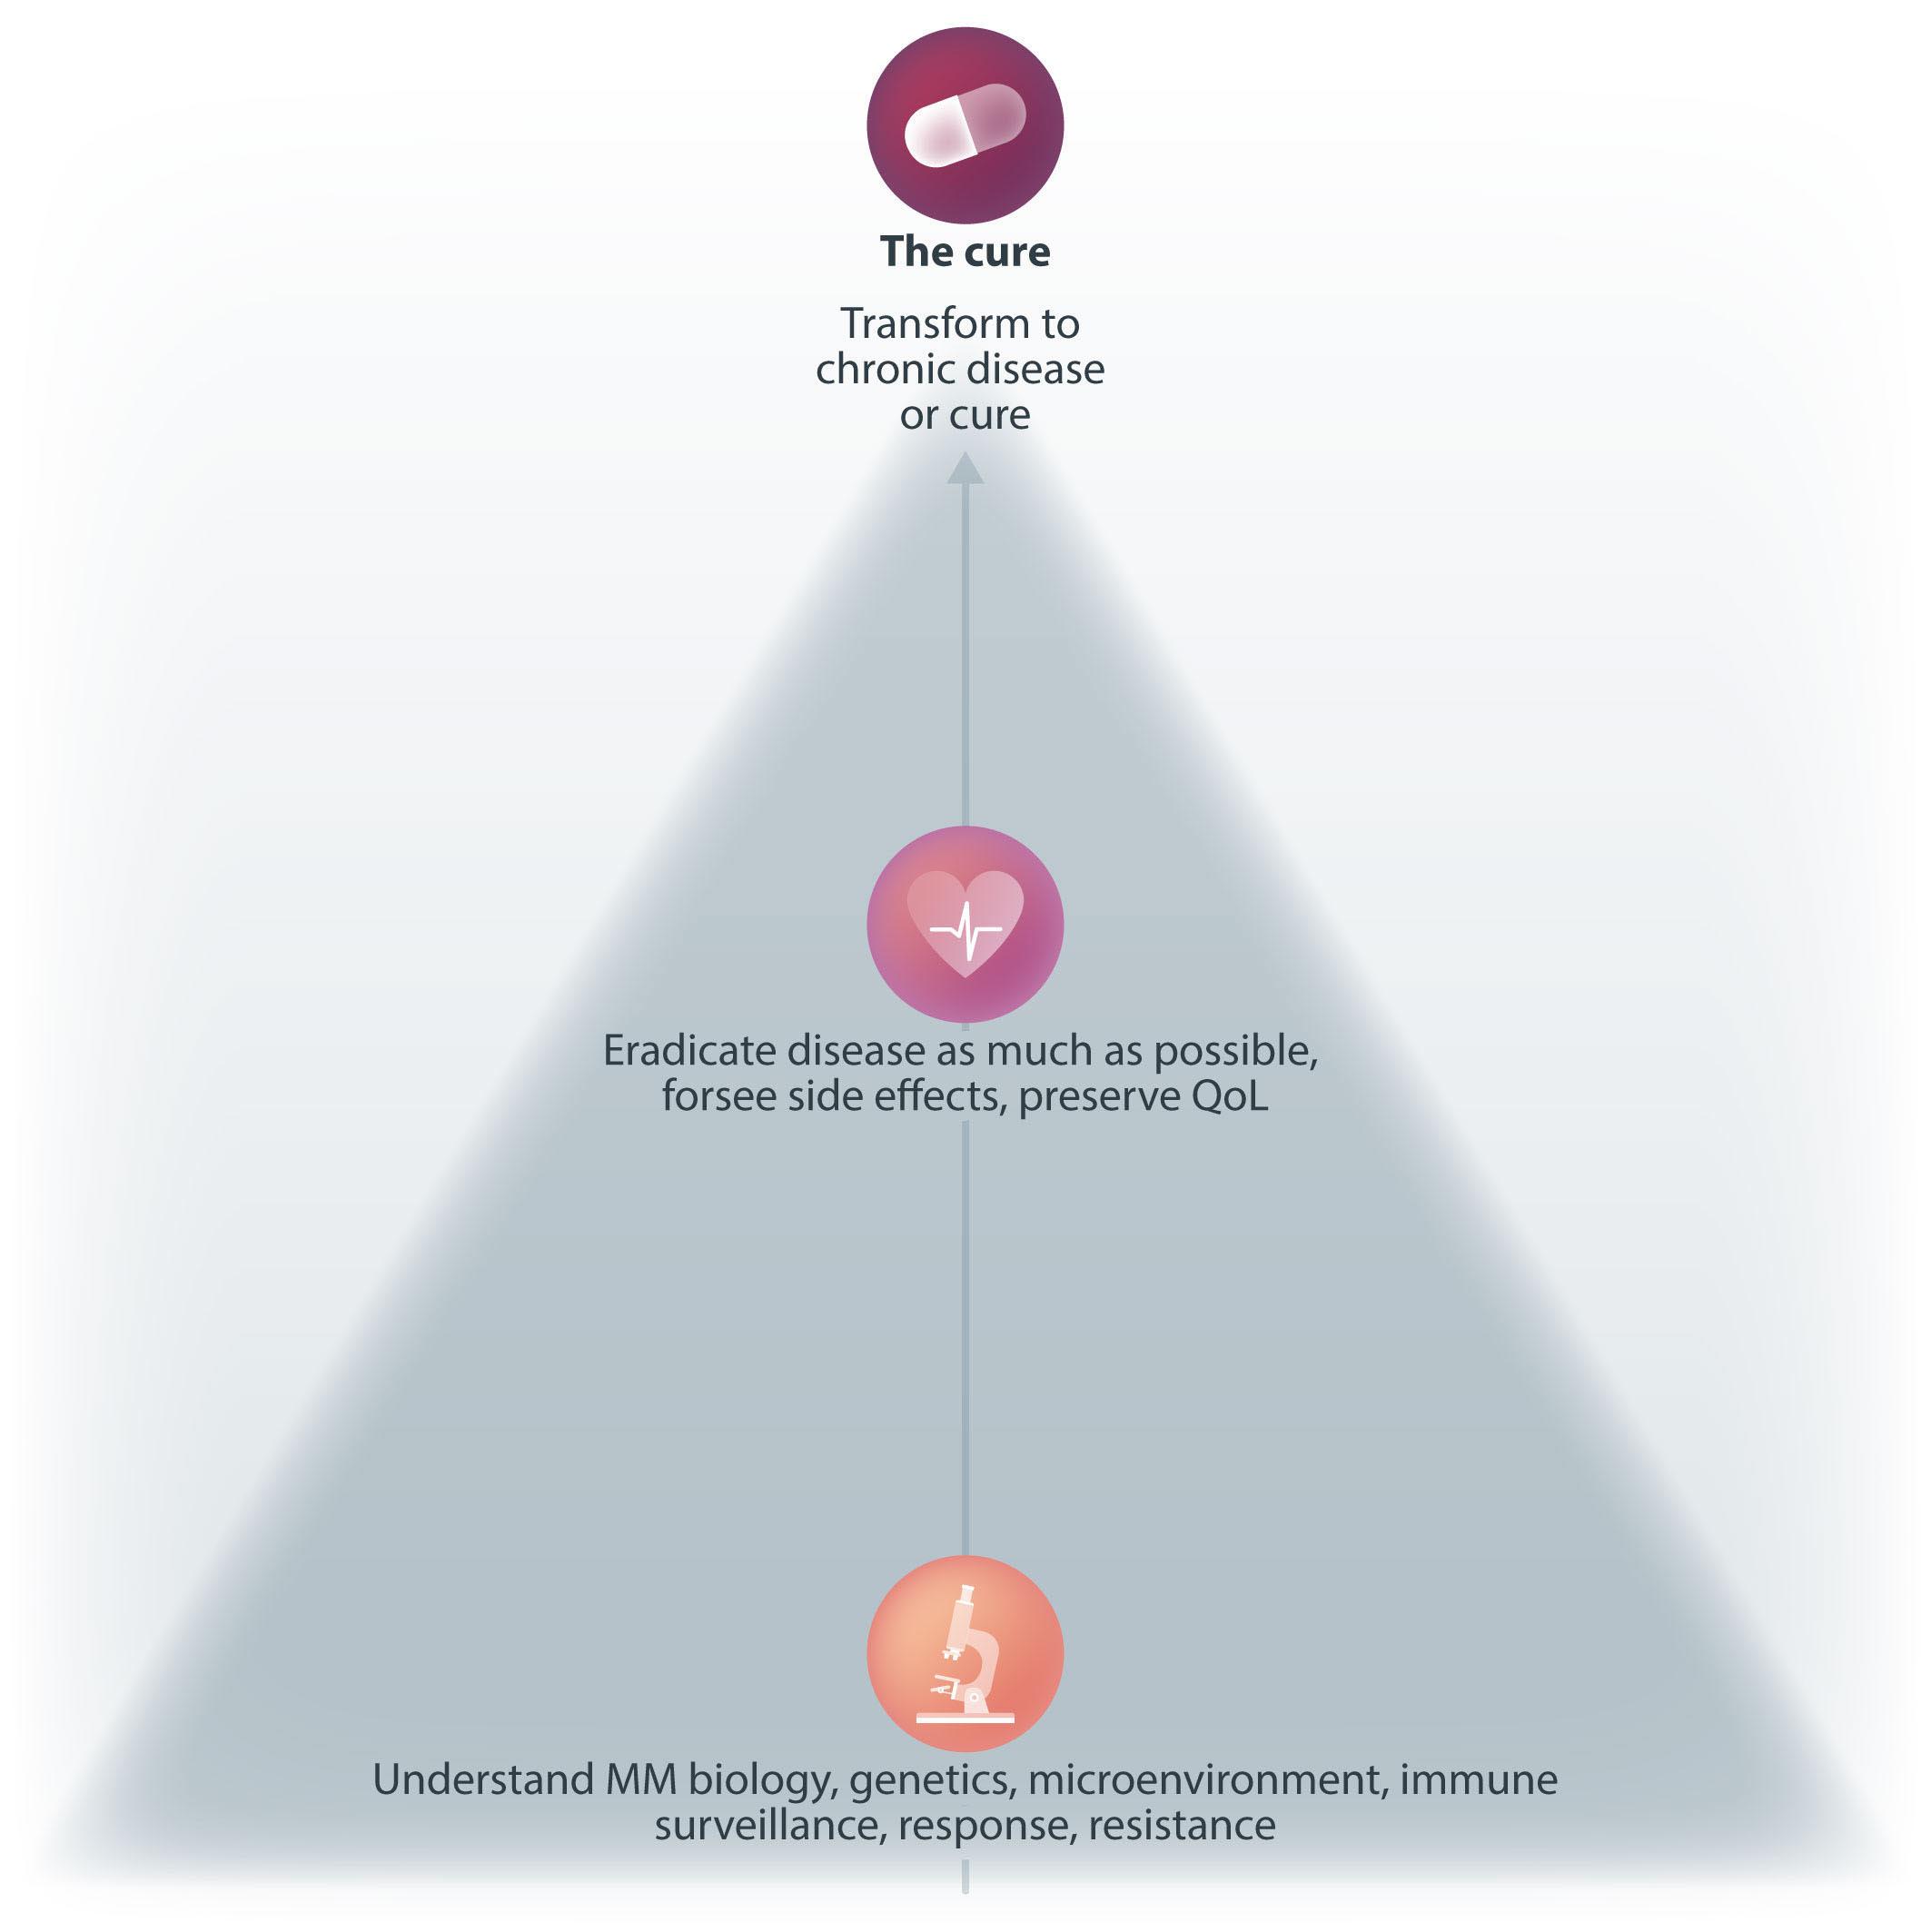
2420 Functional cure and long-term survival in multiple myeloma: how to challenge the previously impossible
M. Engelhardt et al.
https://doi.org/10.3324/haematol.2023.283058
Spotlight Review Article
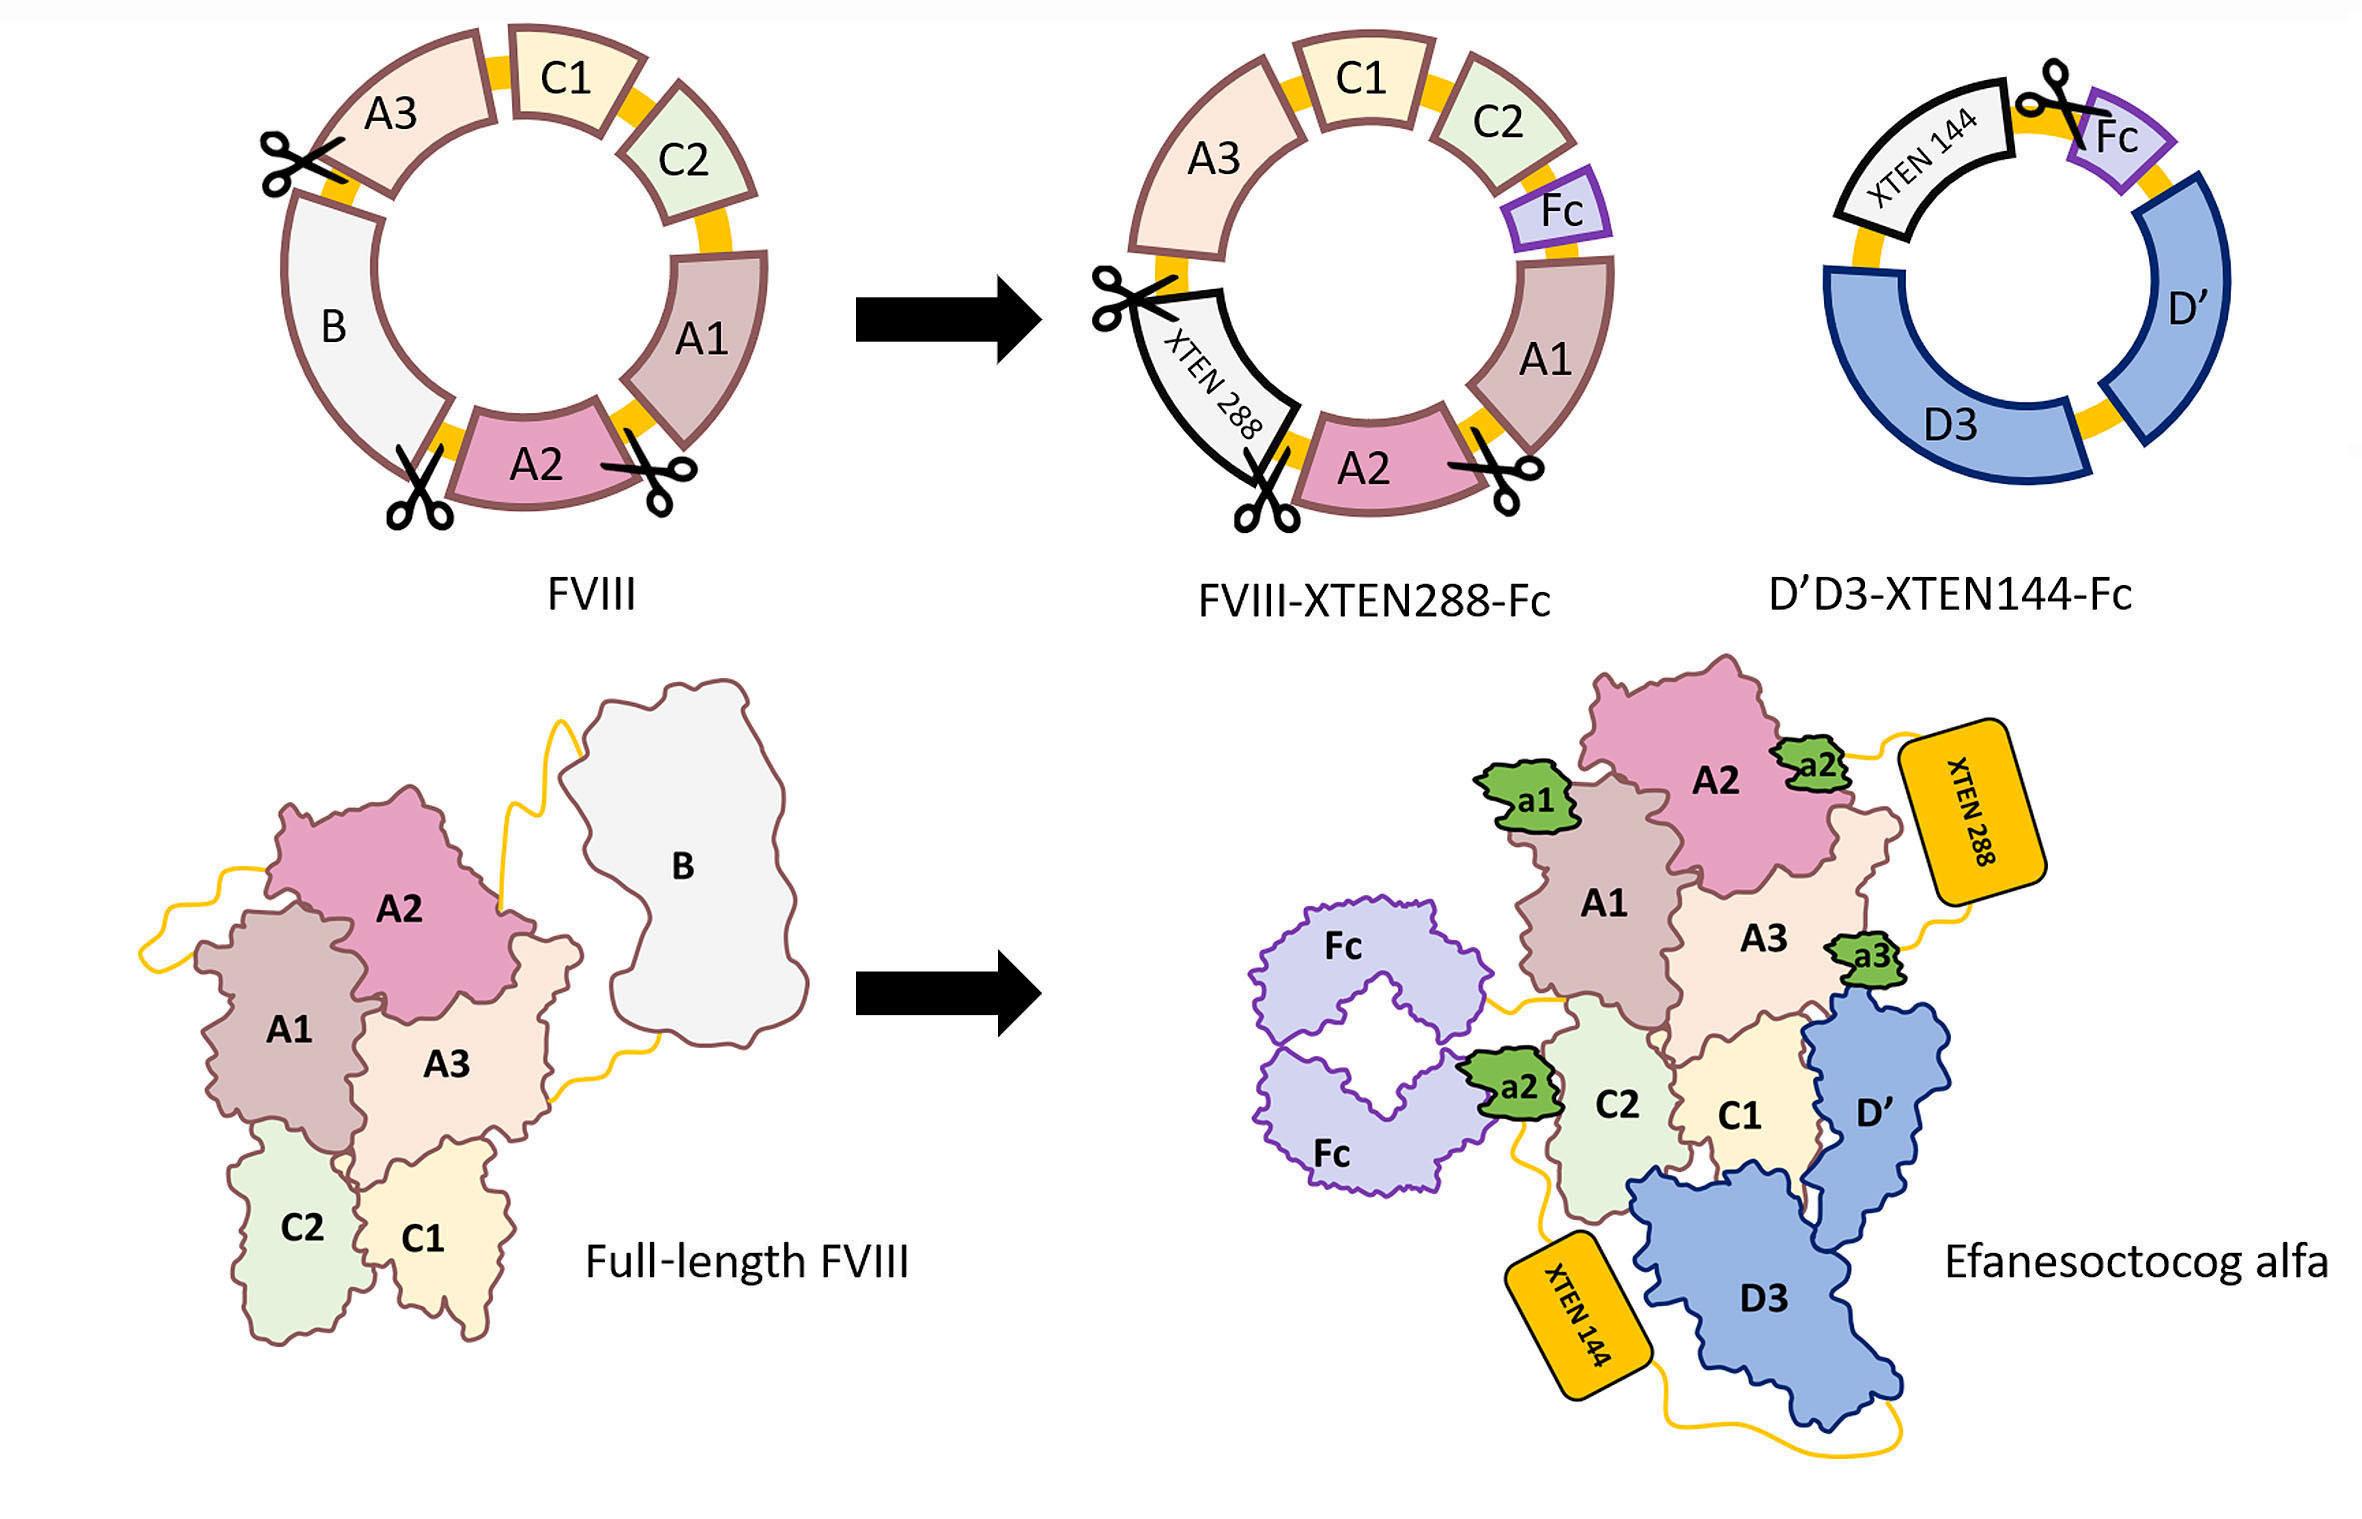
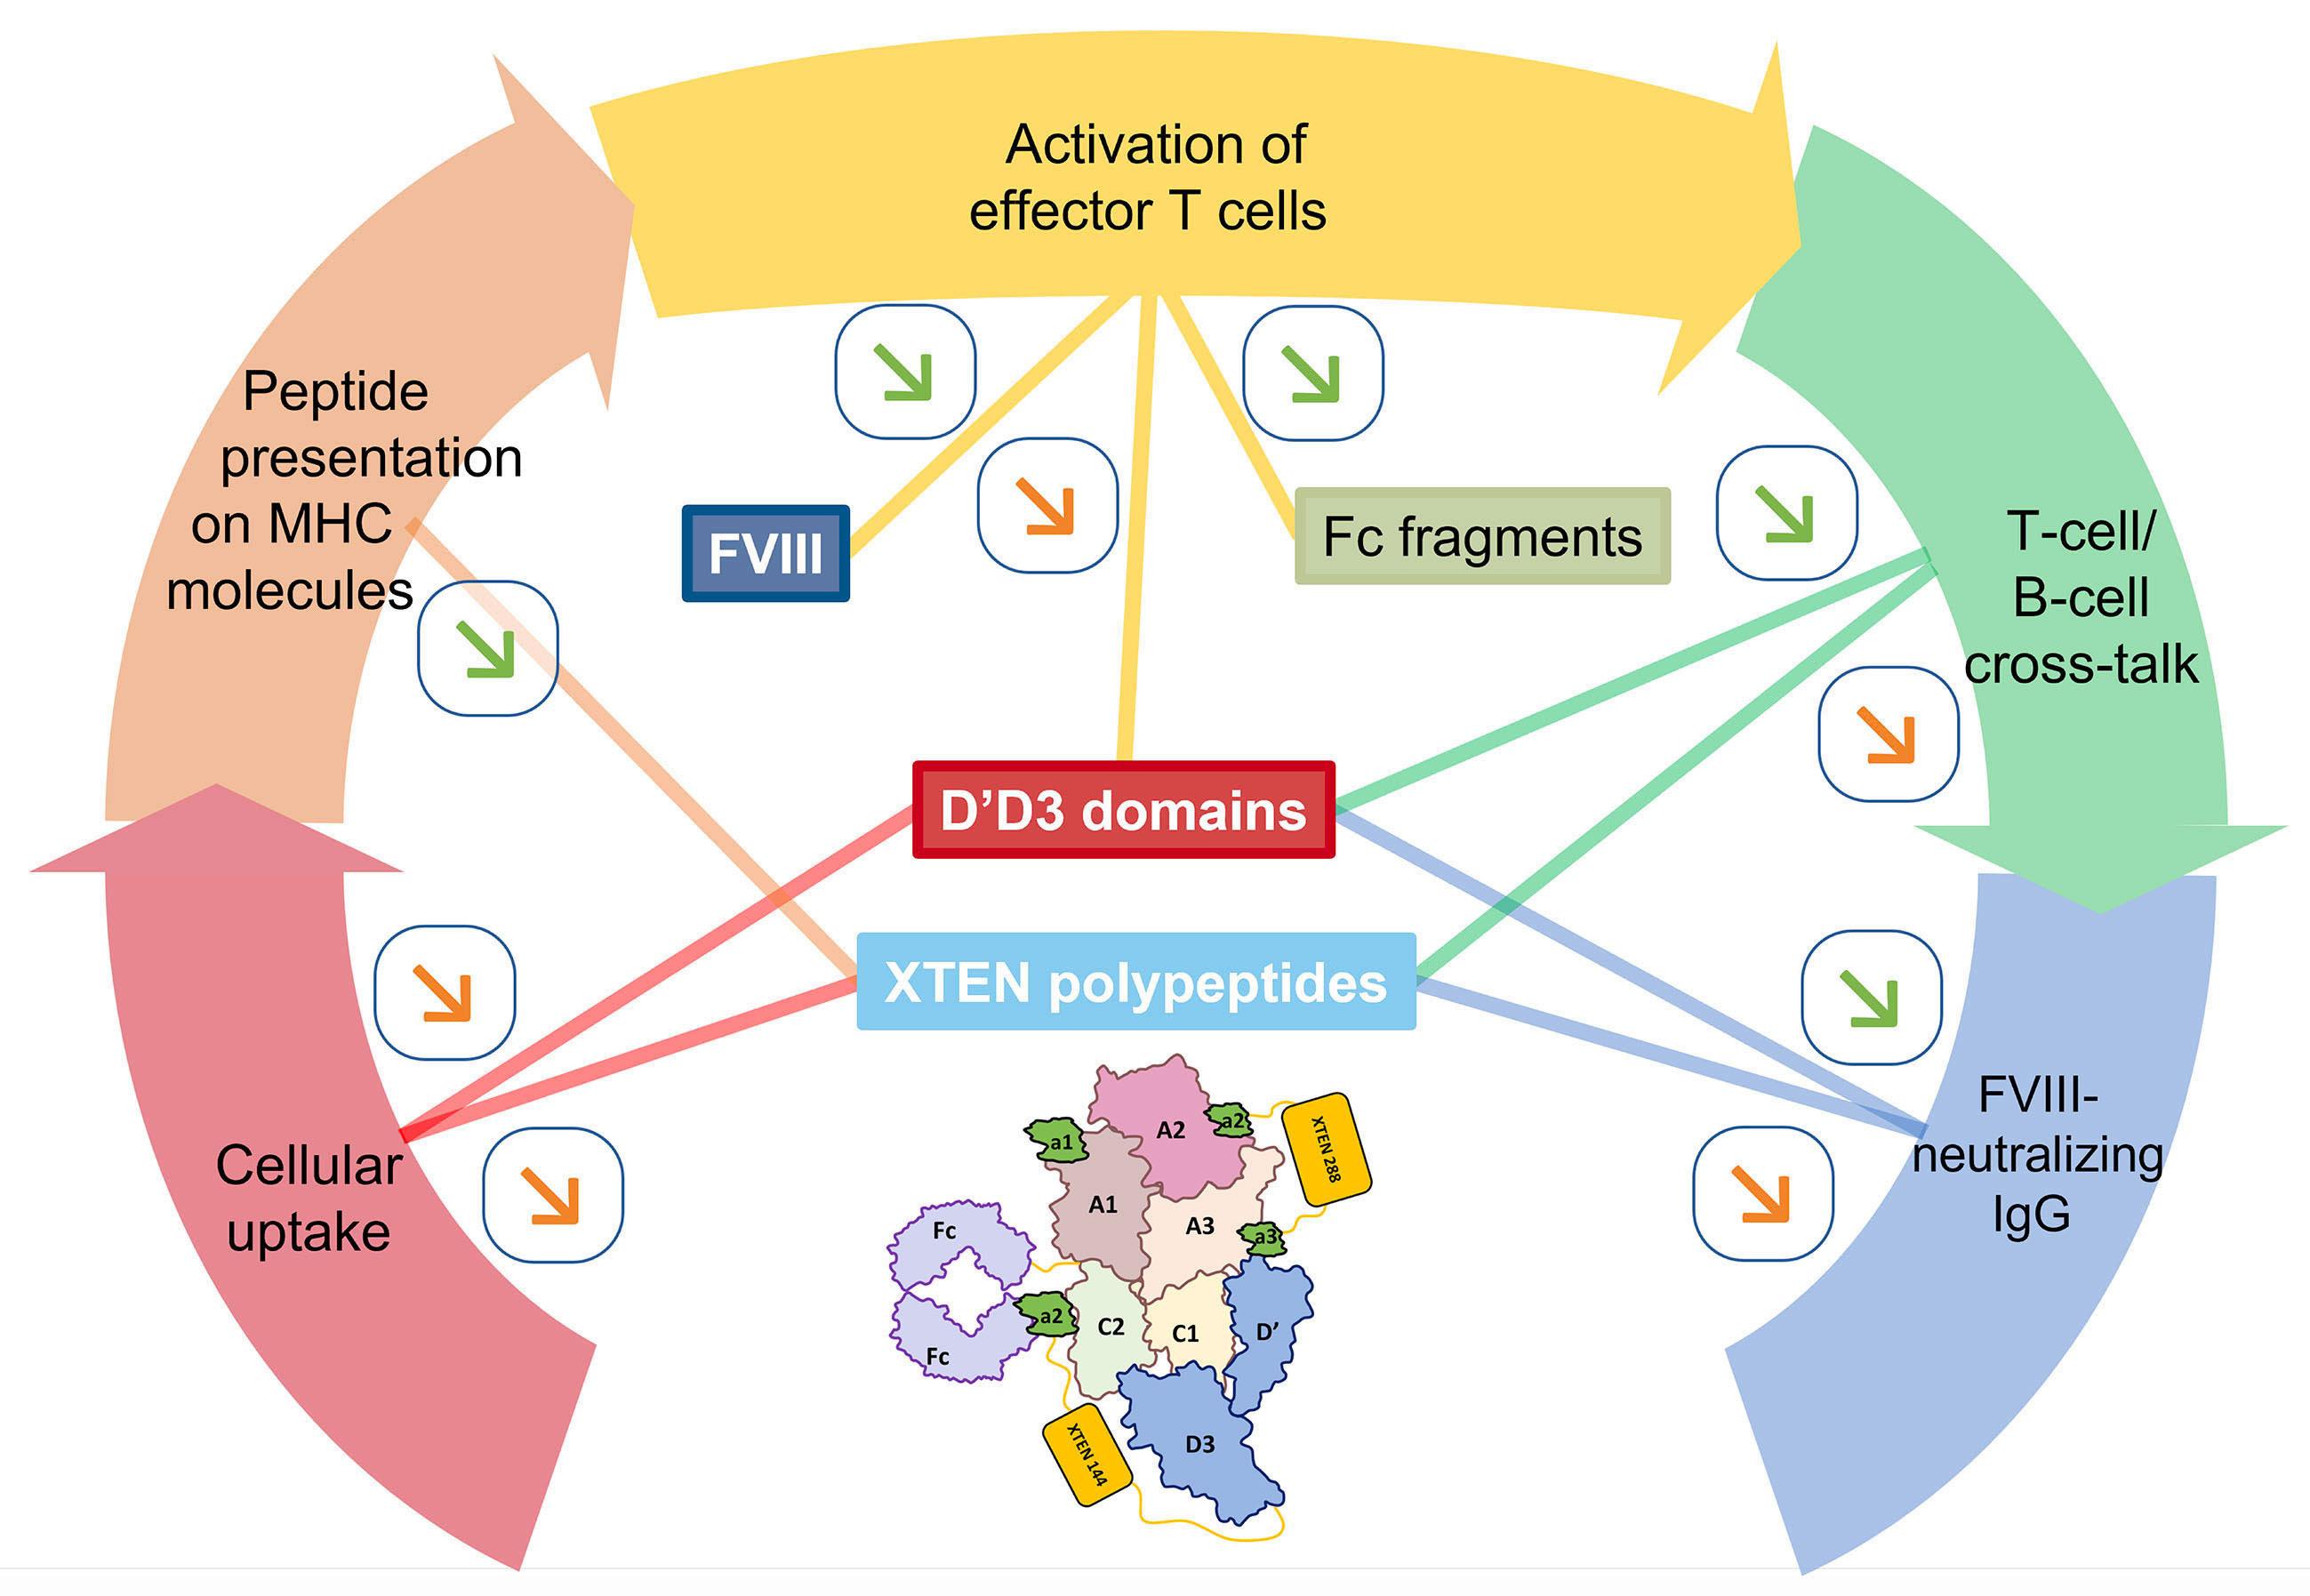
2436 Efanesoctocog alfa: the renaissance of Factor VIII replacement therapy
Y. Dargaud et al.
https://doi.org/10.3324/haematol.2023.284498
Articles
Acute Lymphoblastic Leukemia
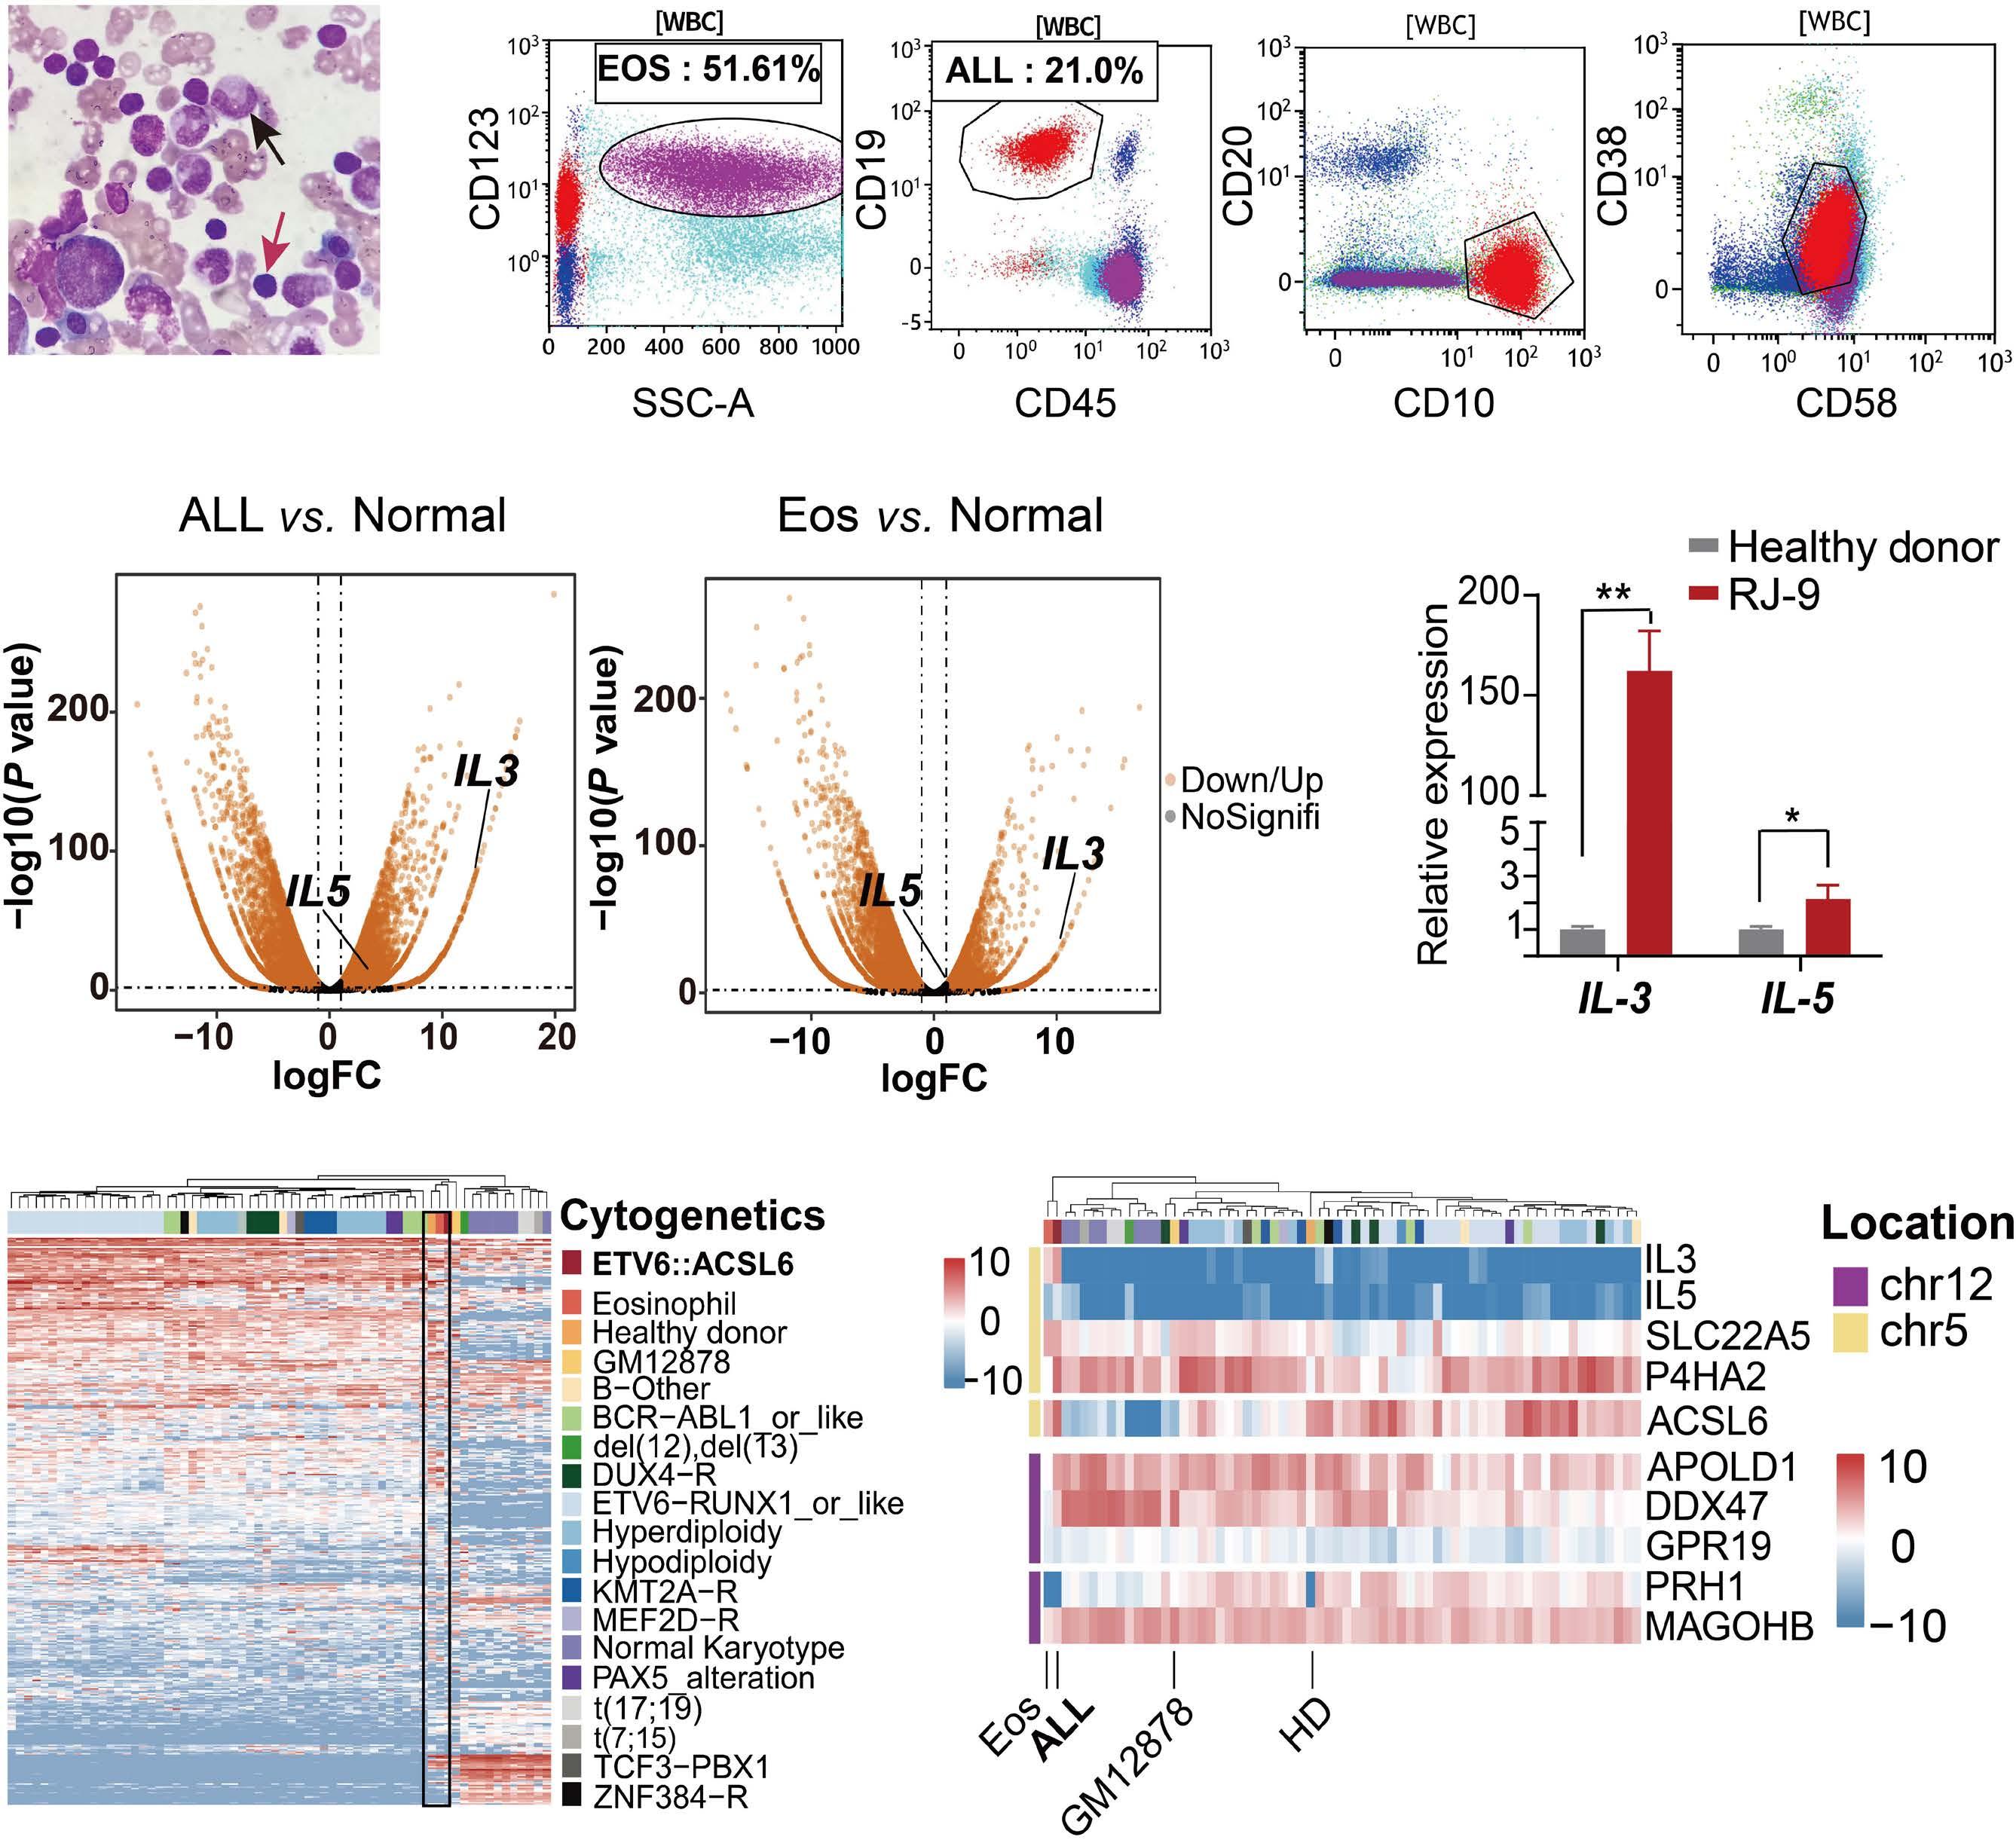
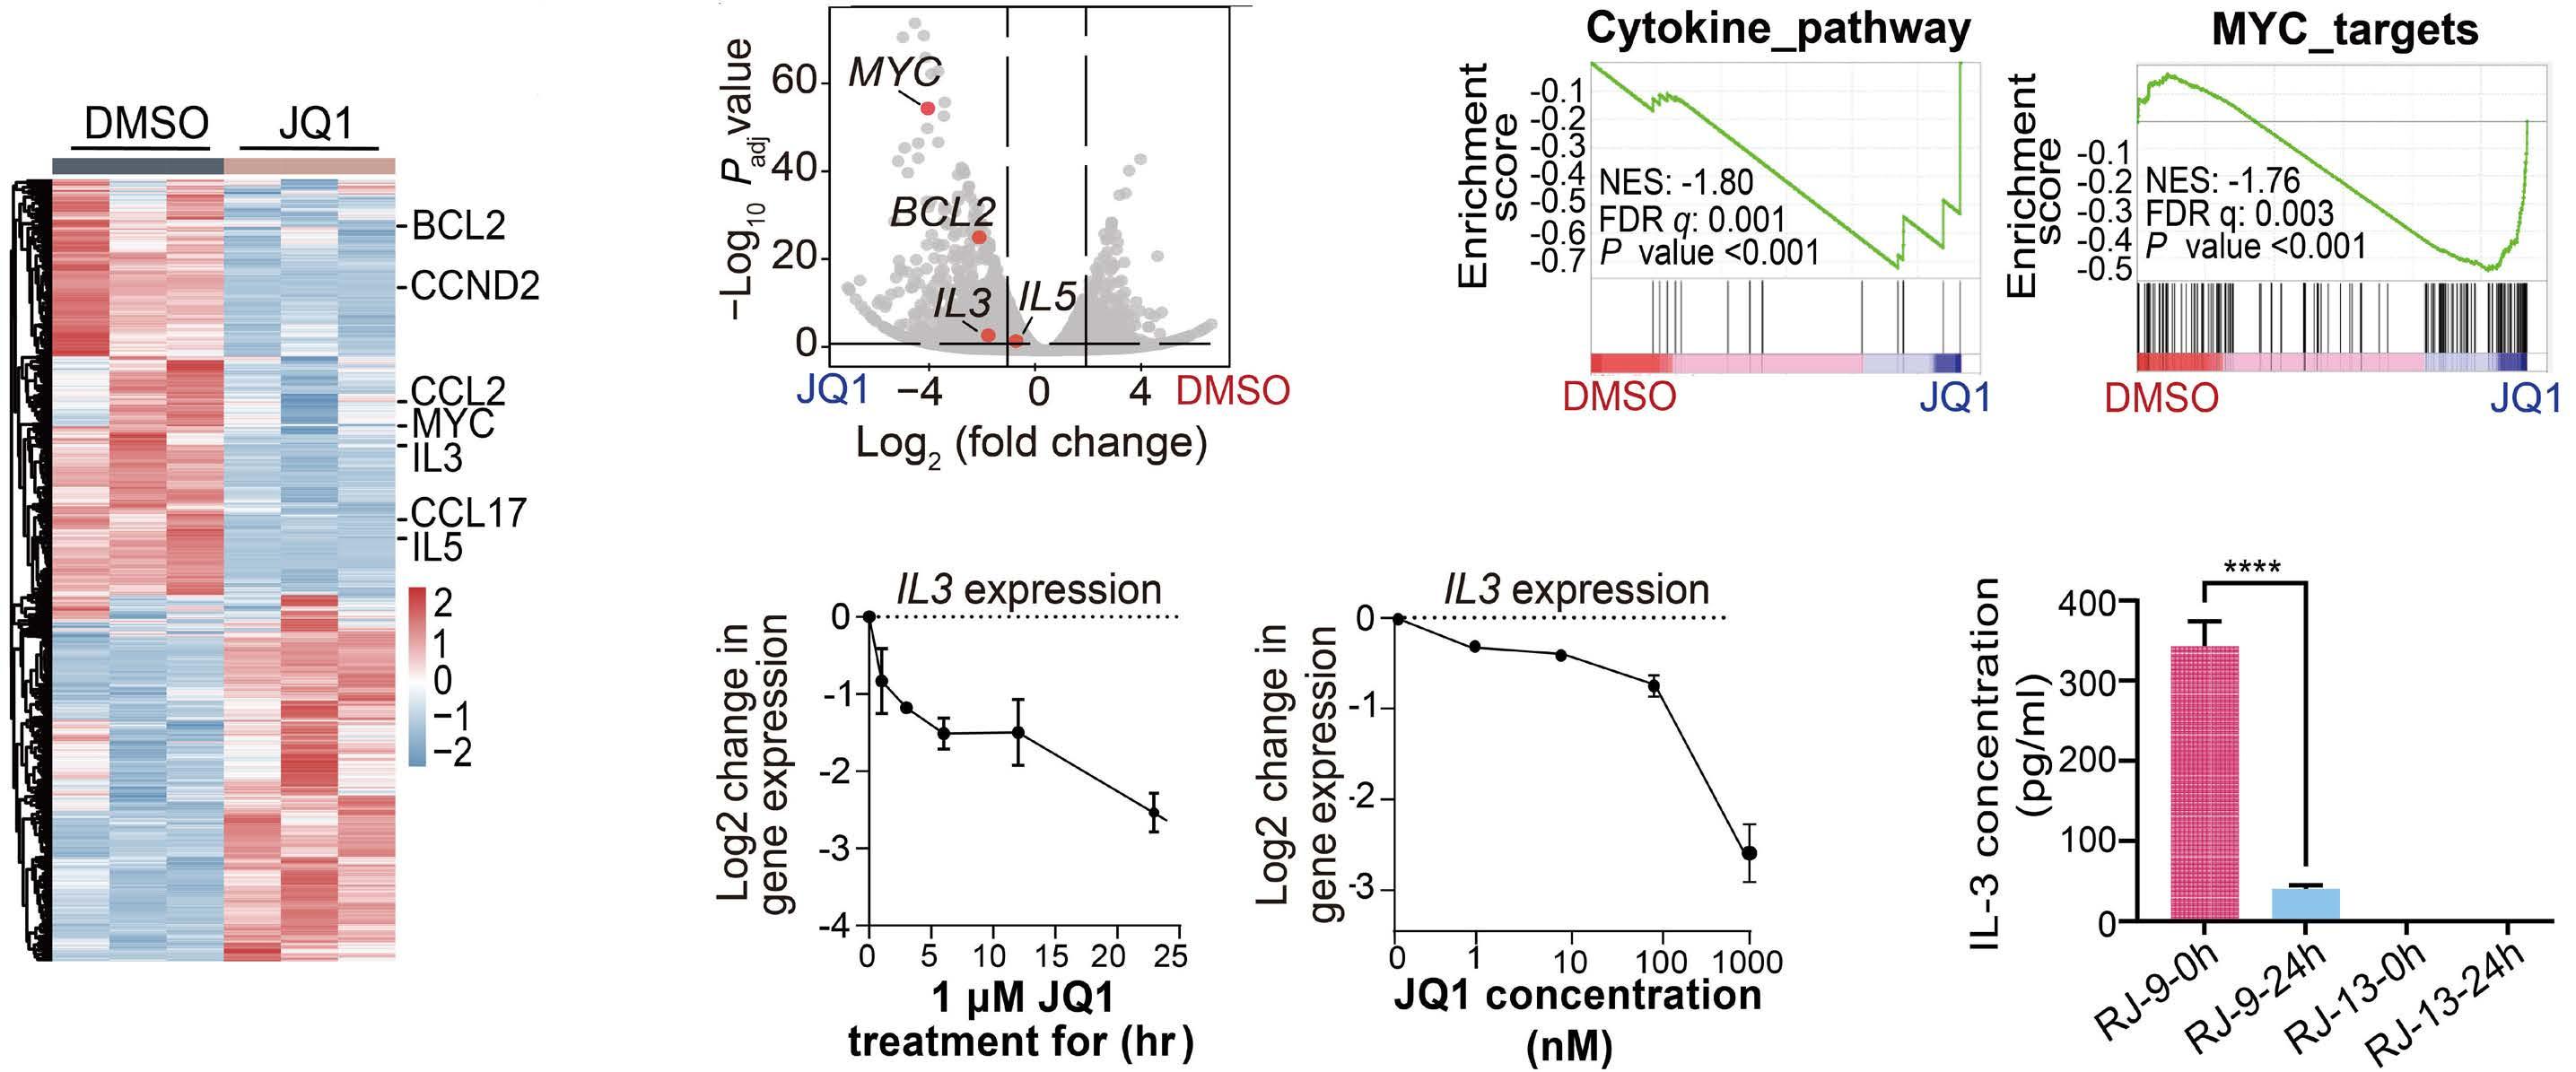
2445 ETV6::ACSL6 translocation-driven super-enhancer activation leads to eosinophilia in acute lymphoblastic leukemia through IL-3 overexpression
W. Xu et al.
https://doi.org/10.3324/haematol.2023.284121
Acute Myeloid Leukemia
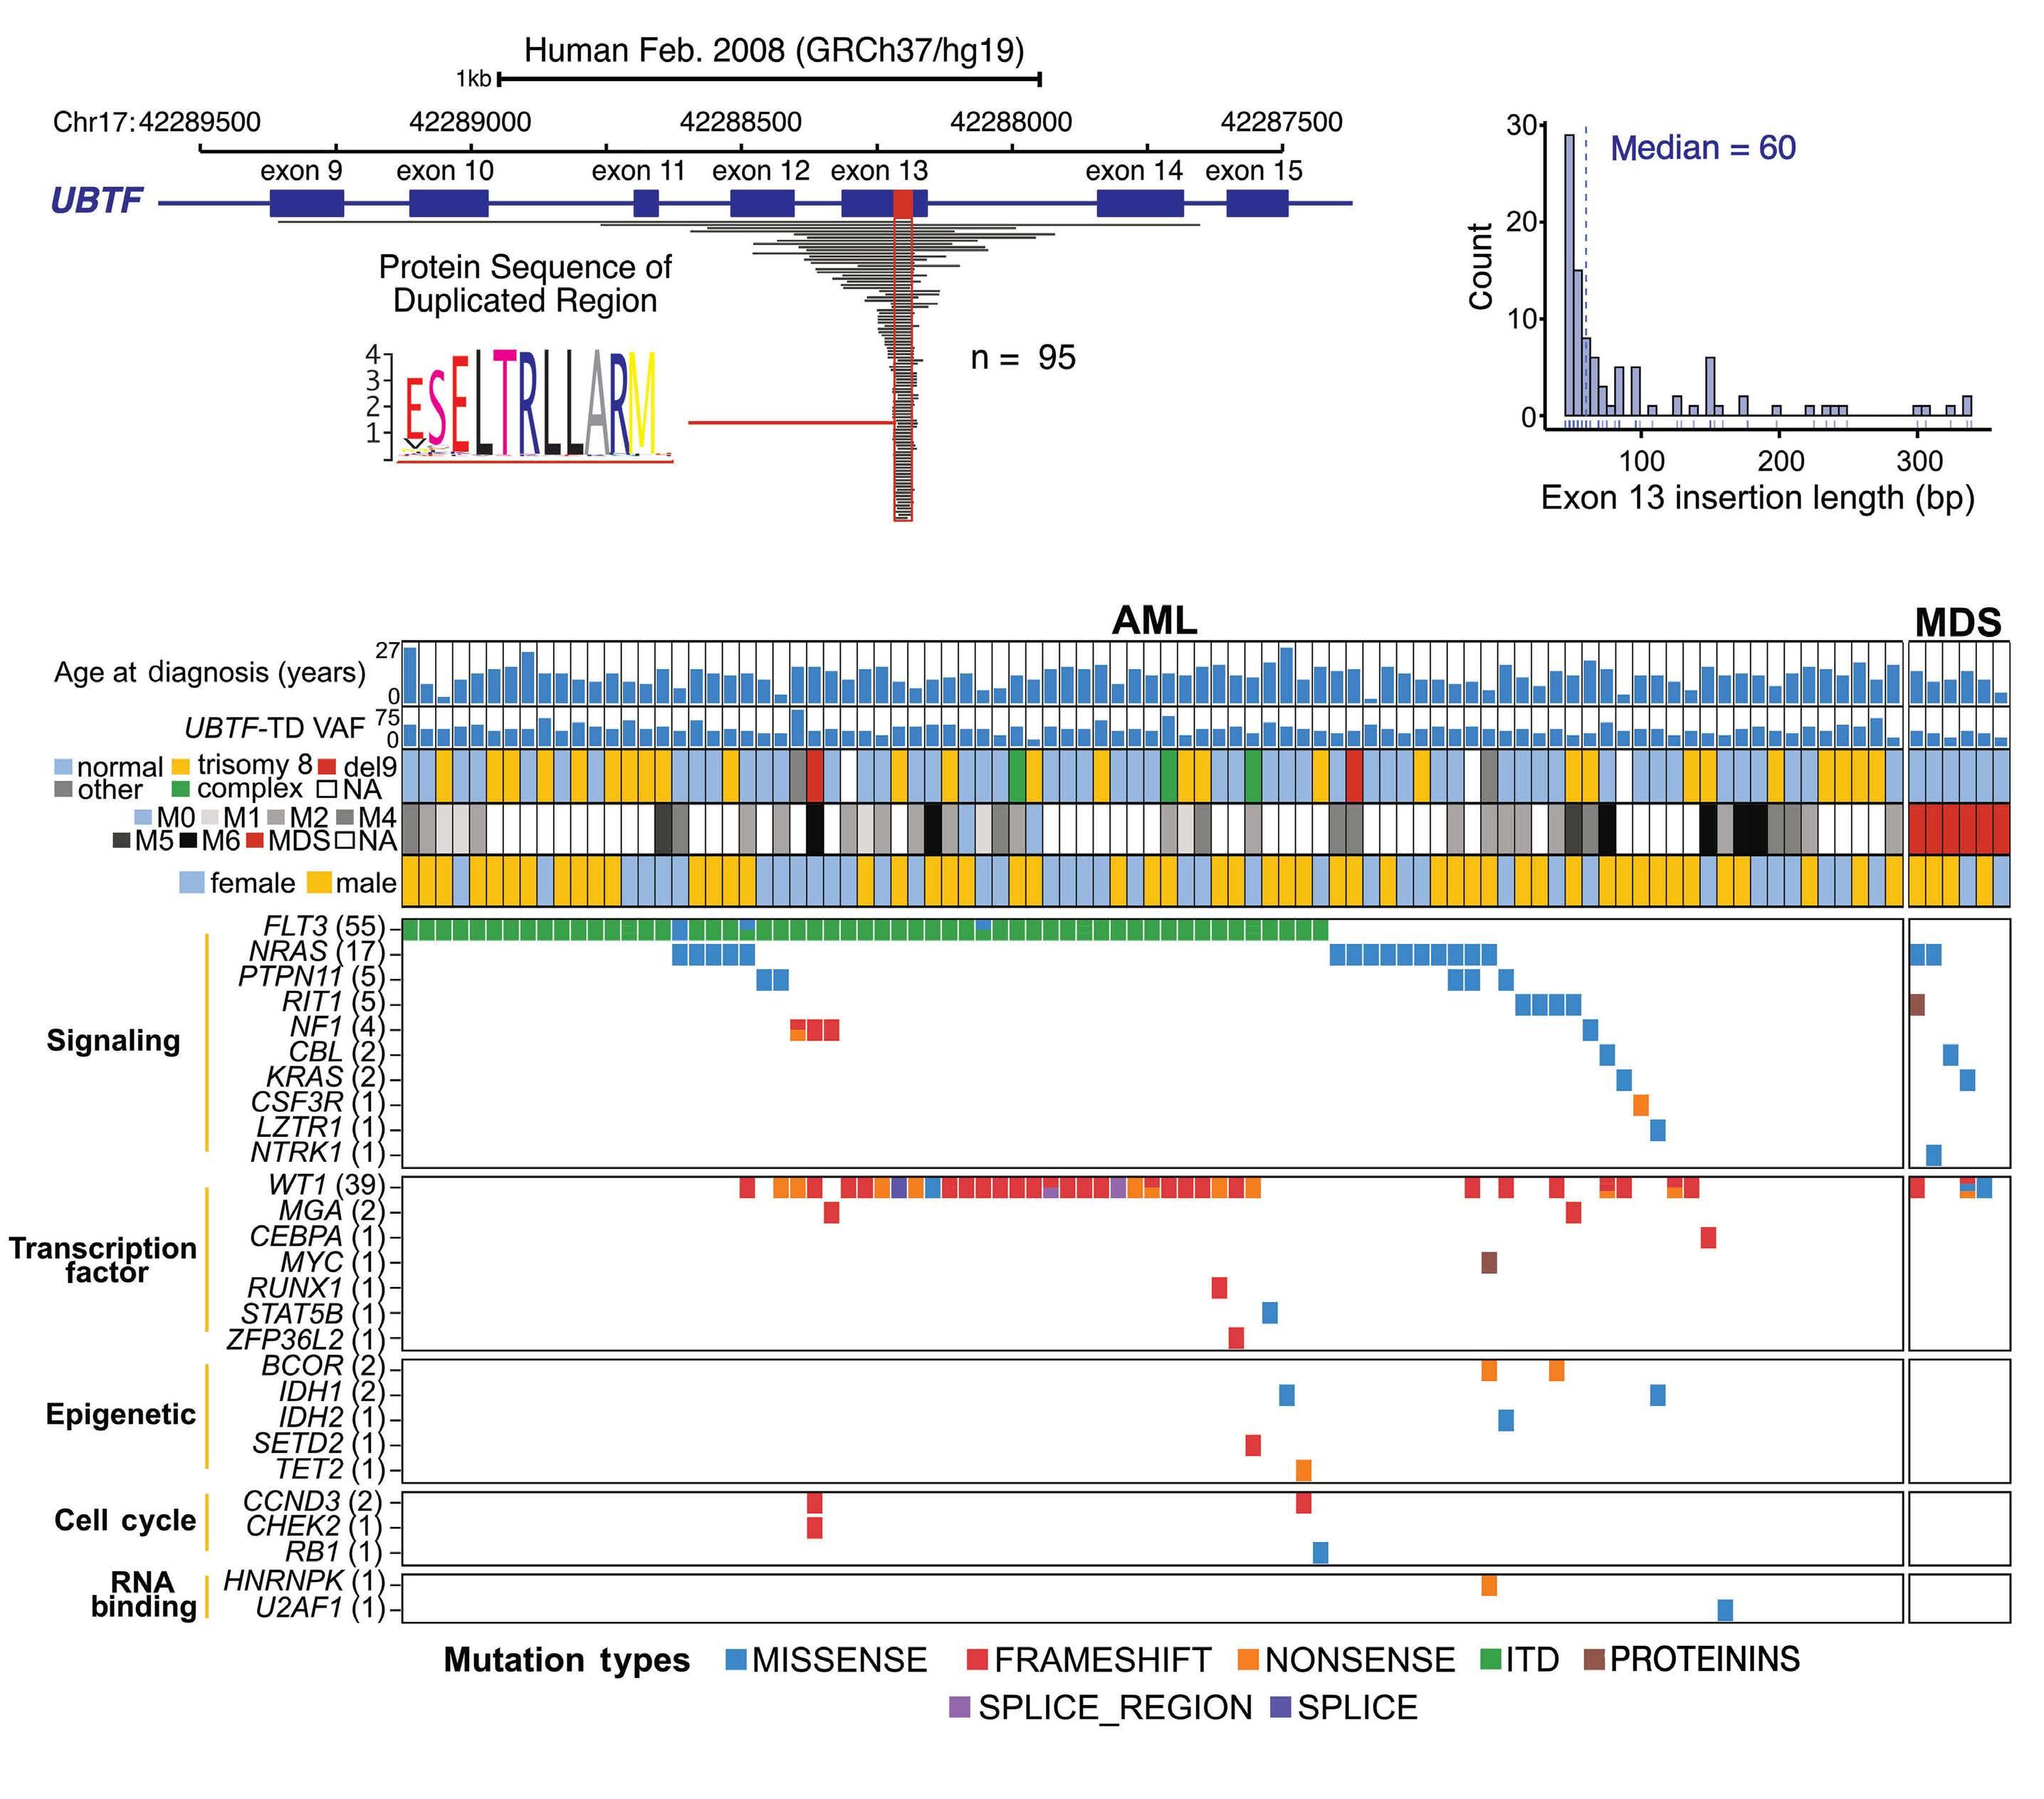
2459 UBTF tandem duplications in pediatric myelodysplastic syndrome and acute myeloid leukemia: implications for clinical screening and diagnosis
J.M. Barajas et al.
https://doi.org/10.3324/haematol.2023.284683
Acute Myeloid Leukemia
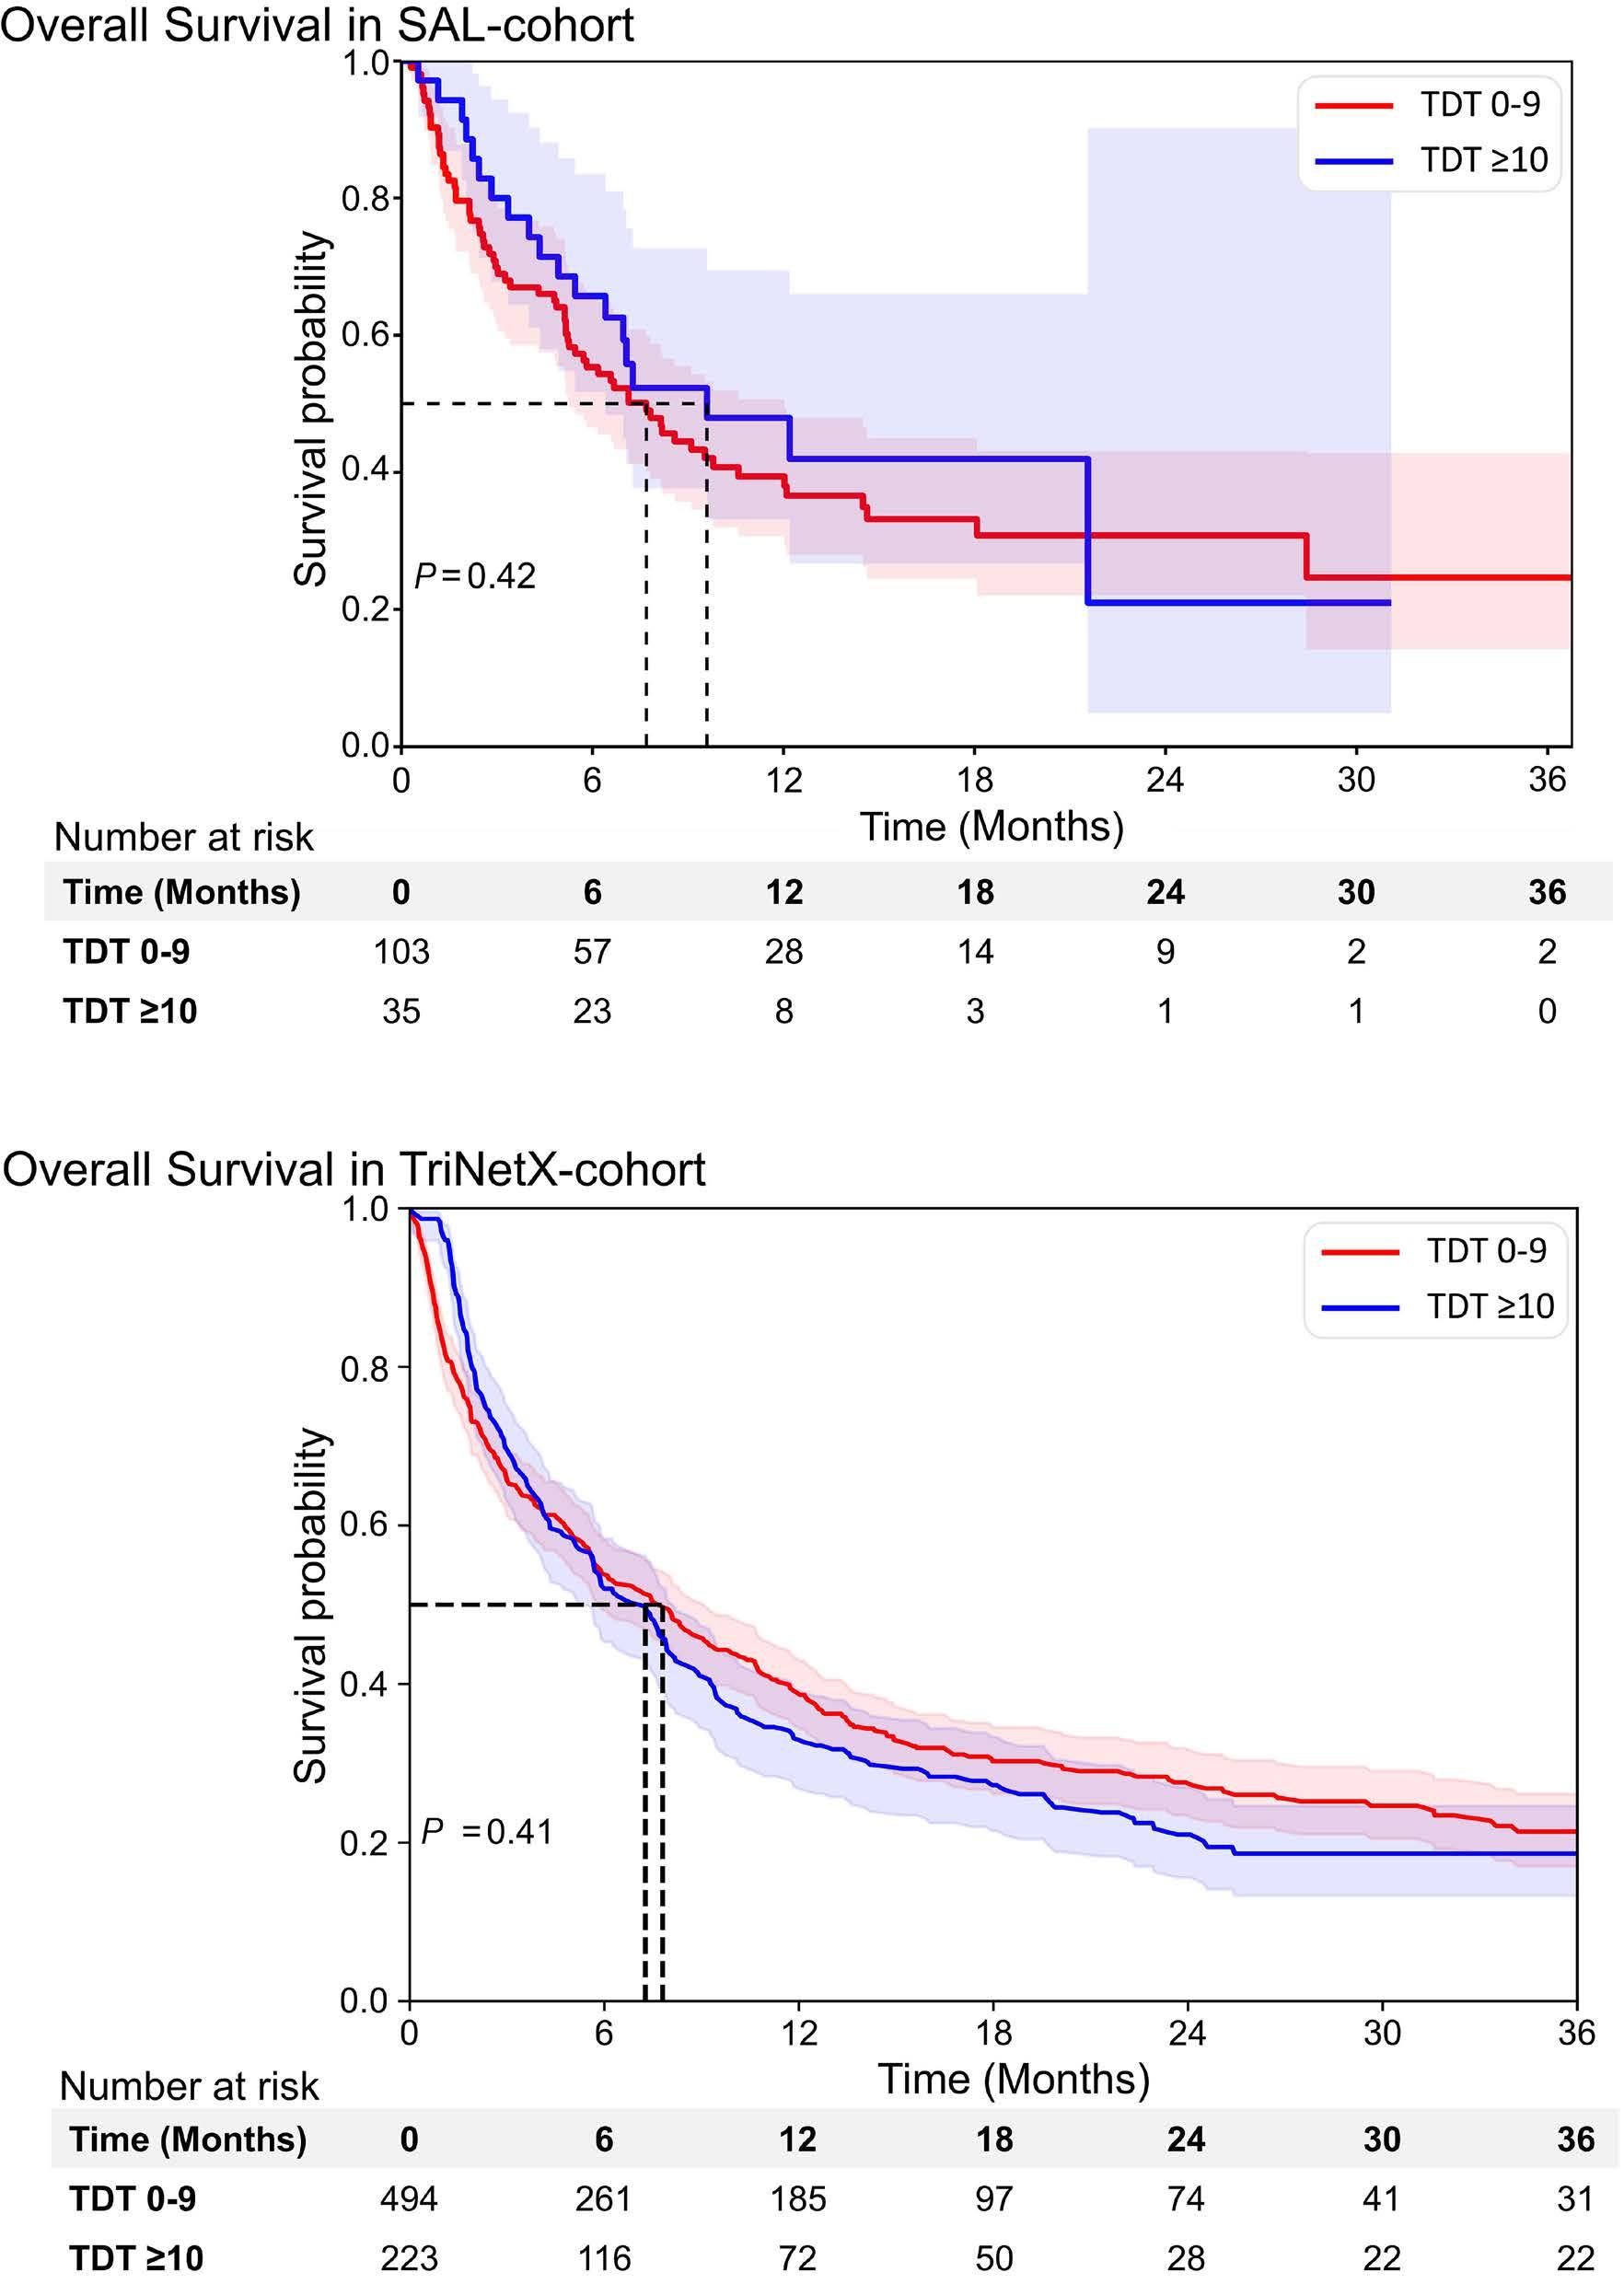
2469 Time from diagnosis to treatment has no impact on survival in newly diagnosed acute myeloid leukemia treated with venetoclax-based regimens
D. Baden et al.
https://doi.org/10.3324/haematol.2024.285225
Blood Transfusion
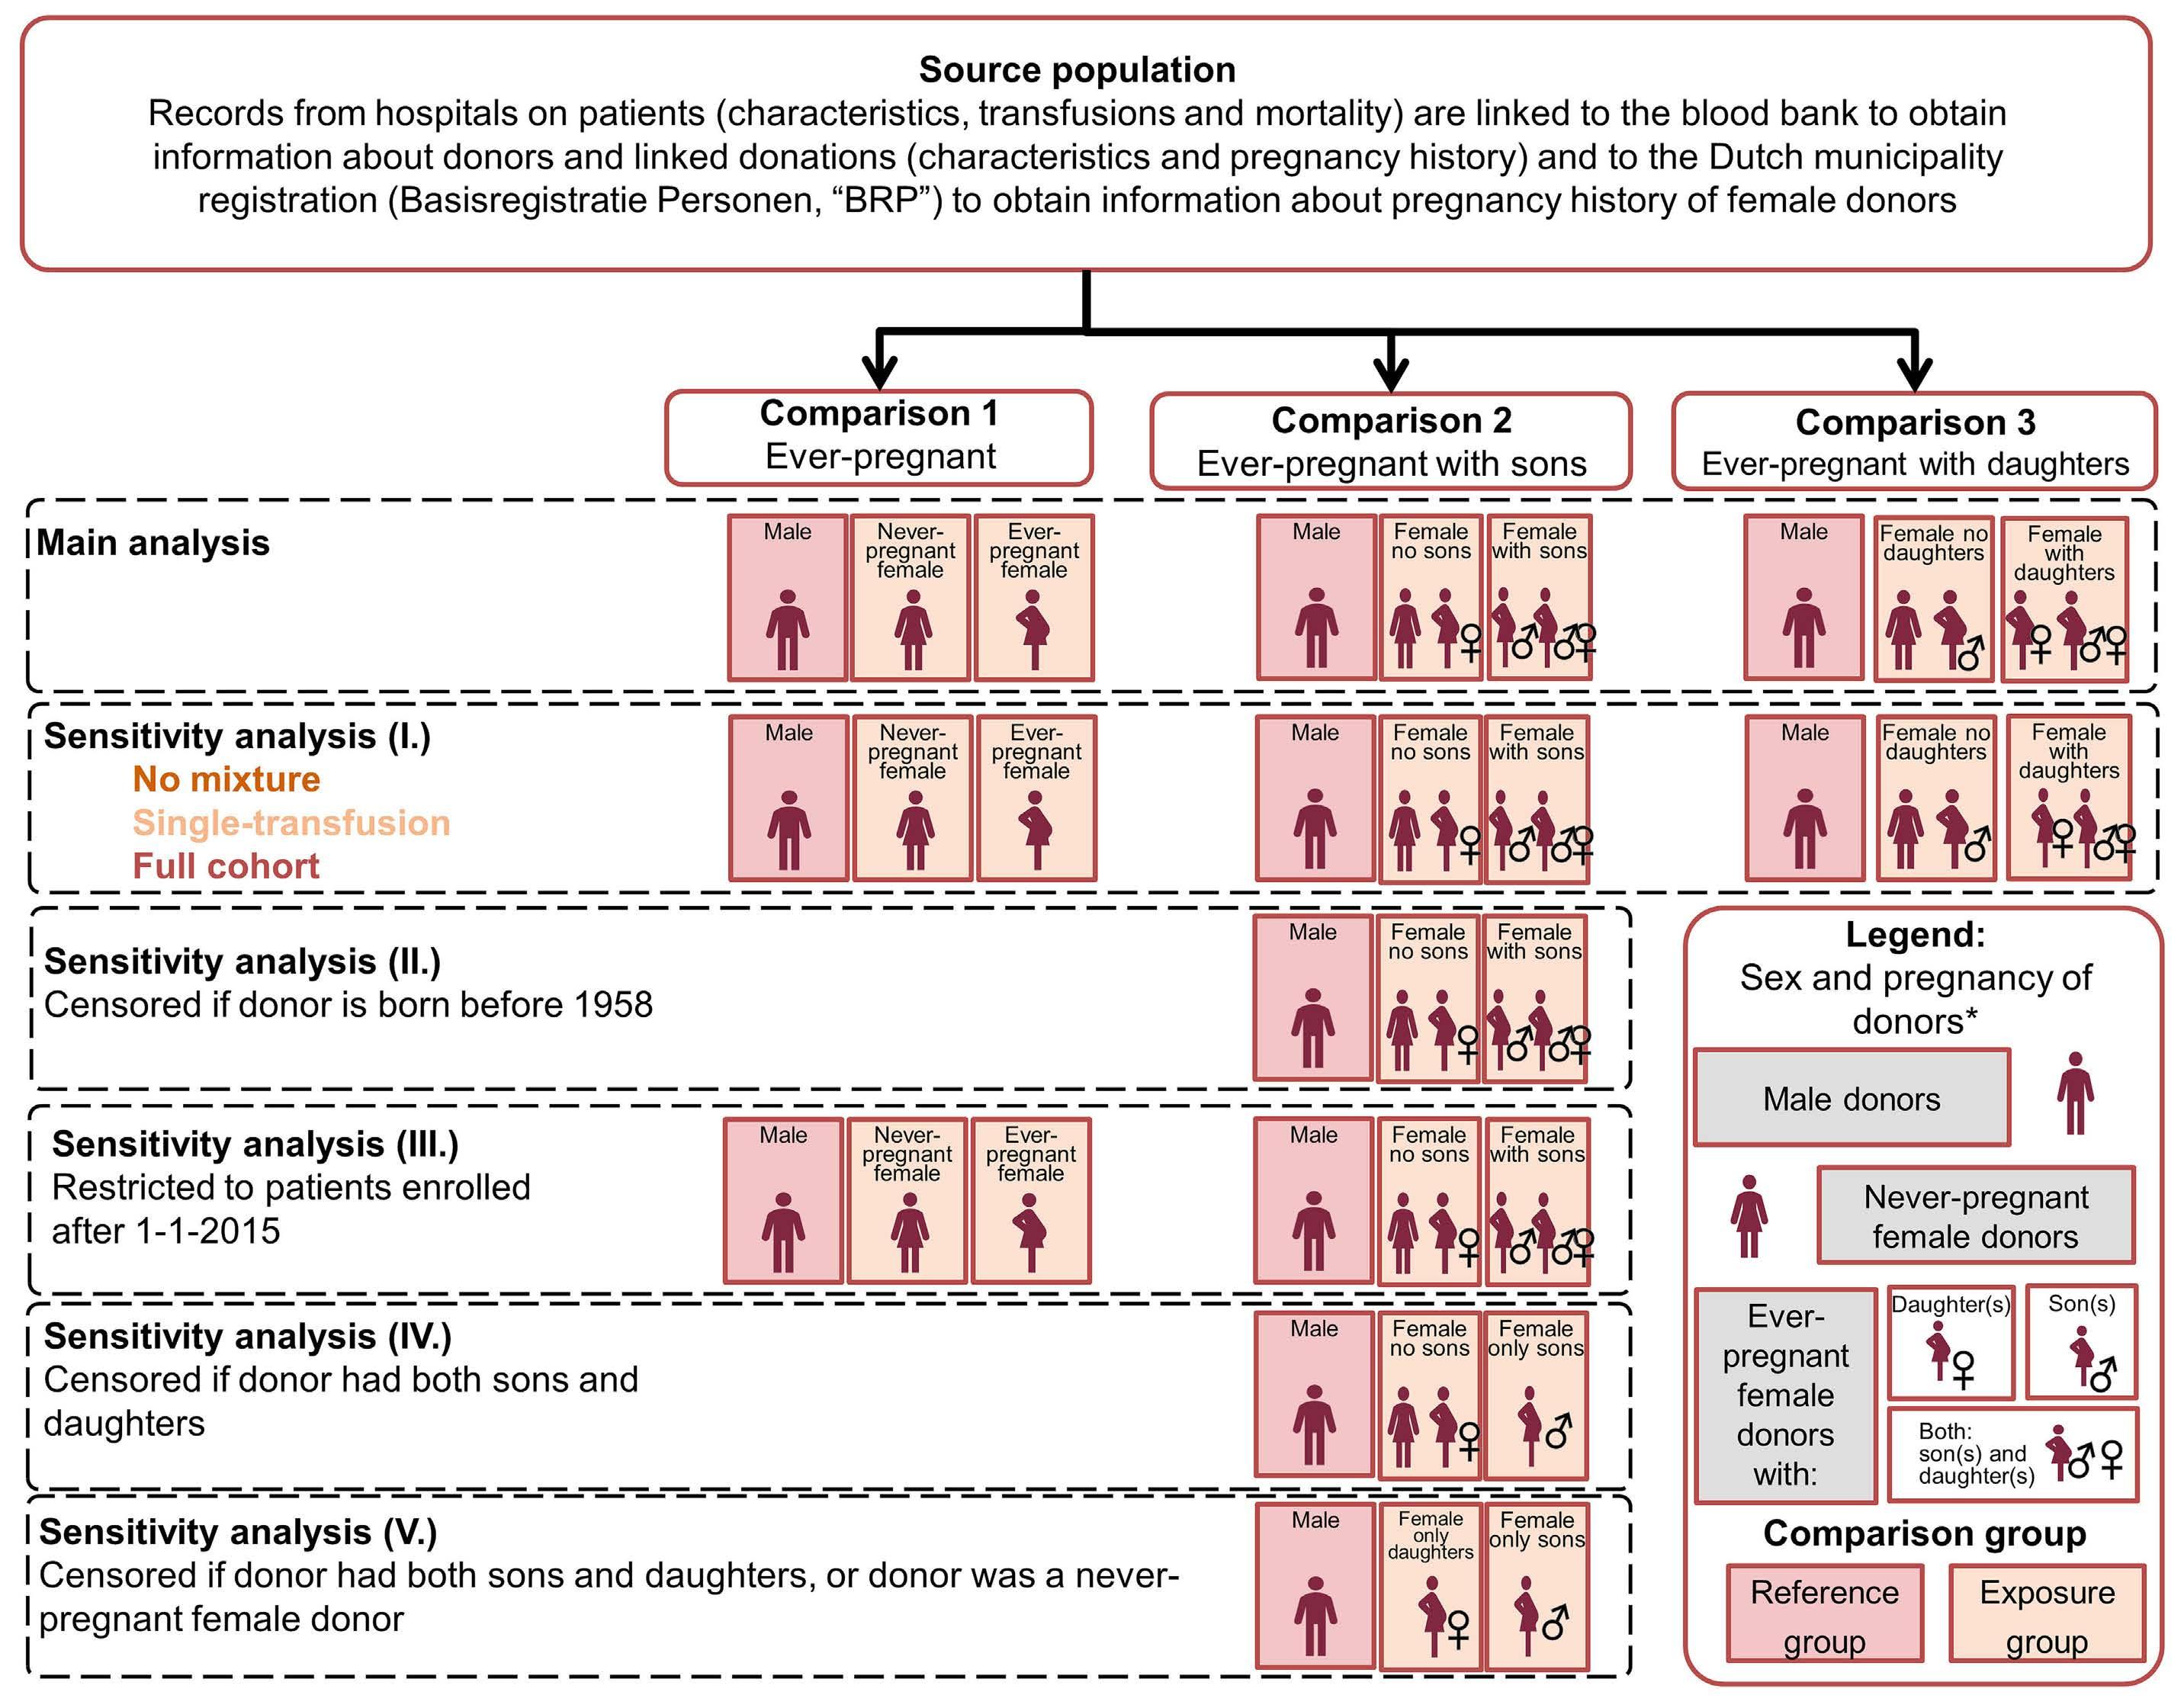
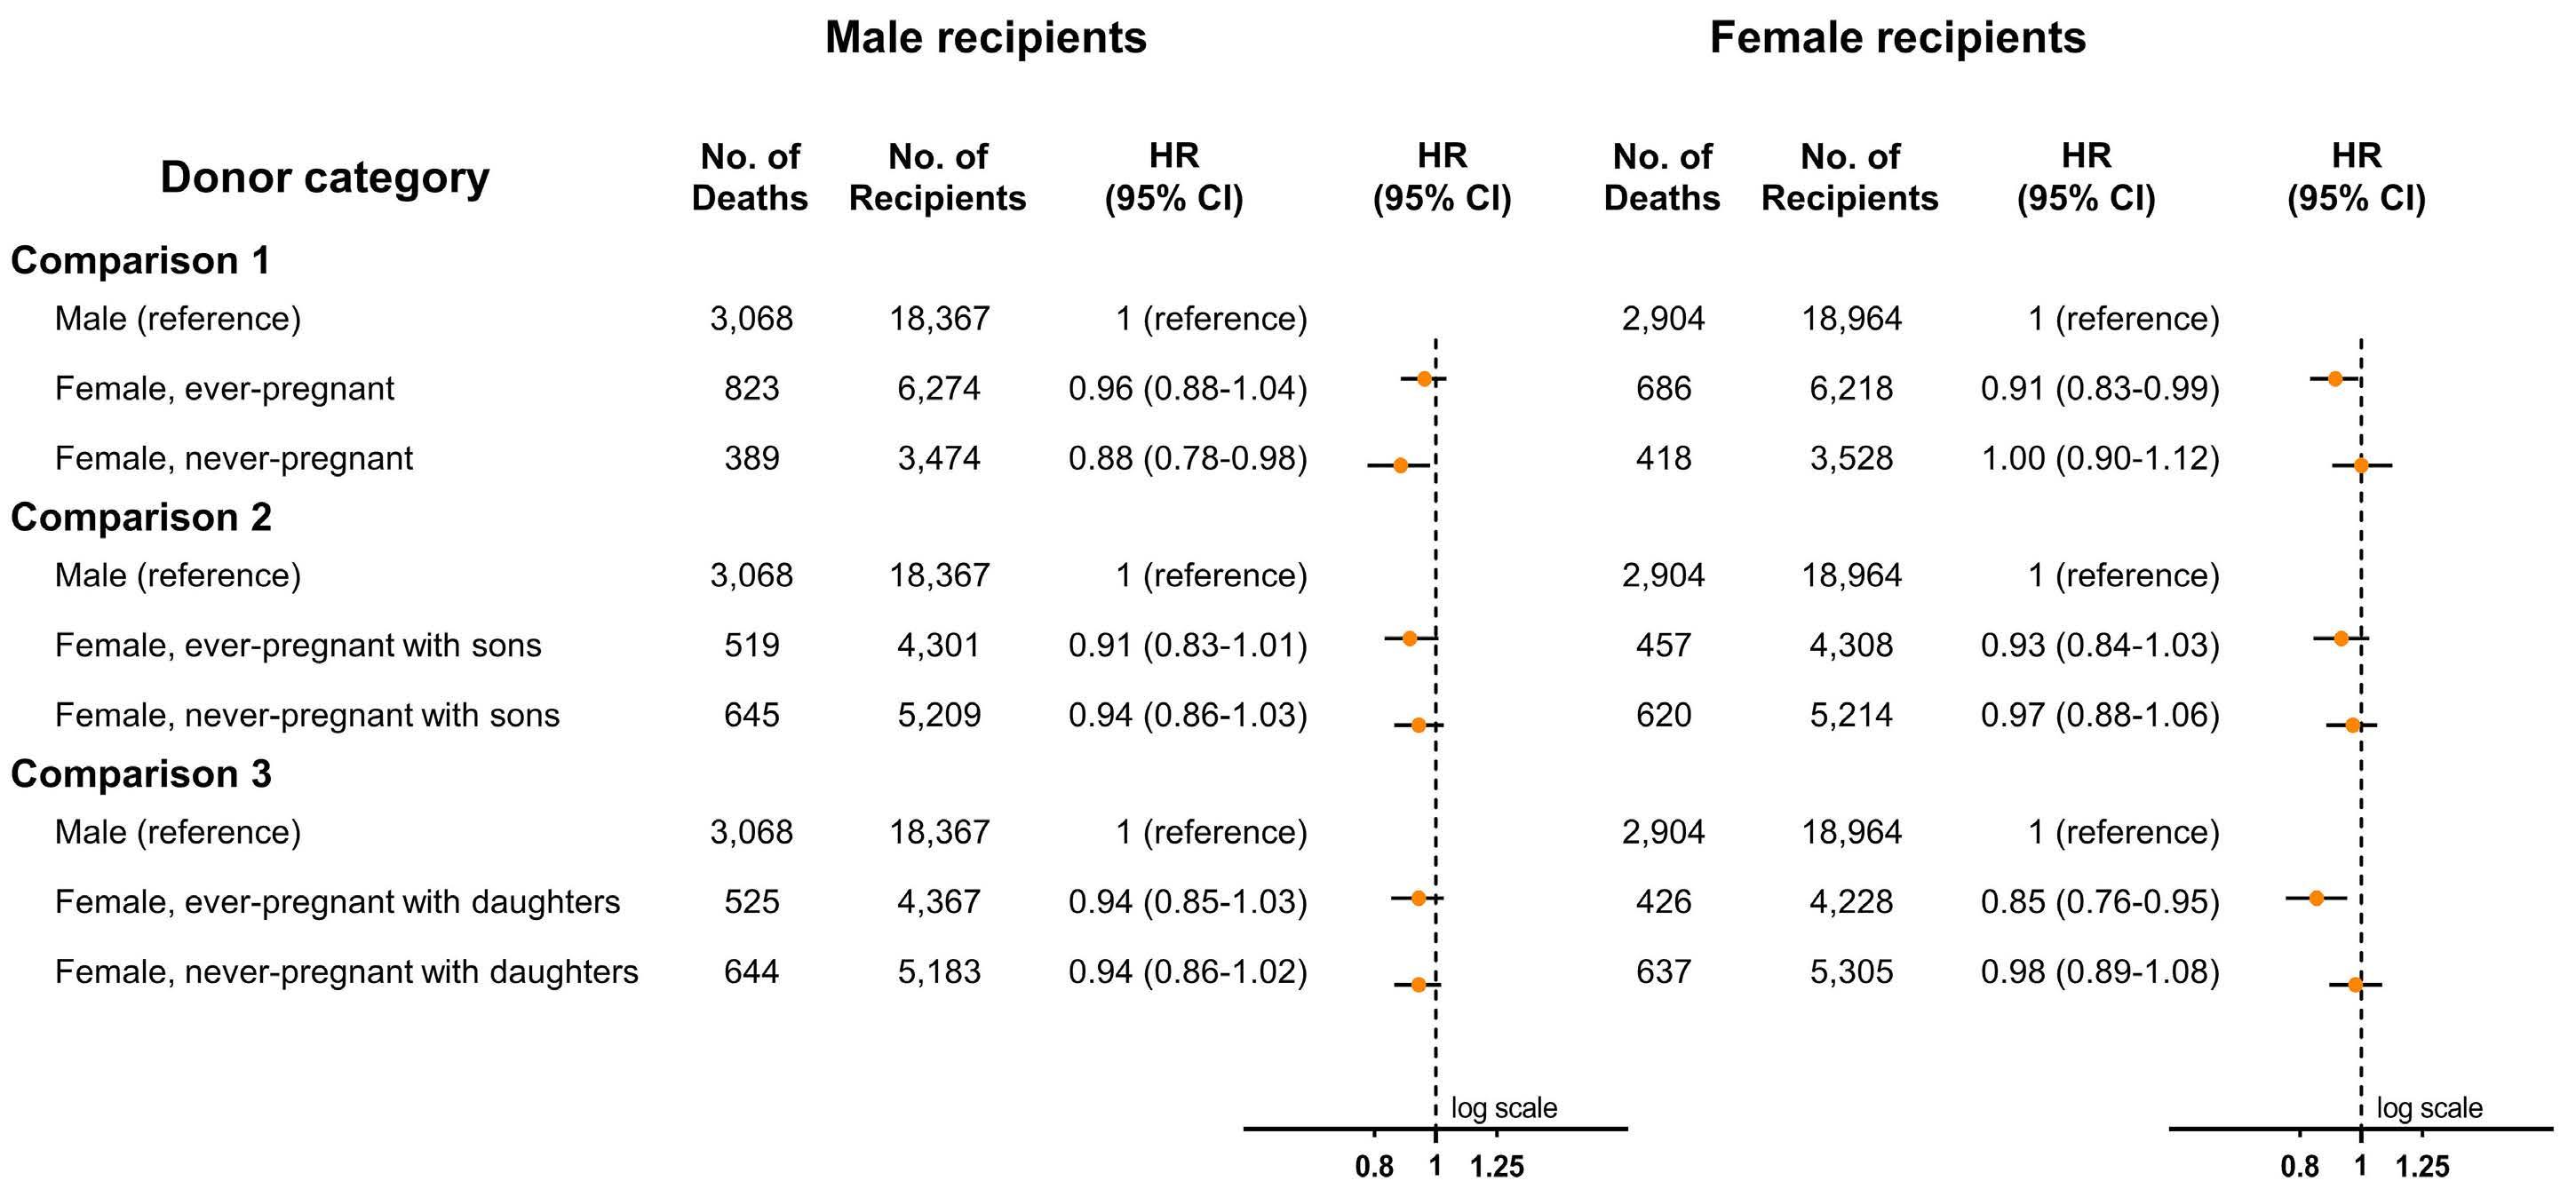
2478 Transfusion of ever-pregnant donor red blood cells and mortality of male patients
S.J. Valk et al.
https://doi.org/10.3324/haematol.2023.283550
Coagulation & its Disorders
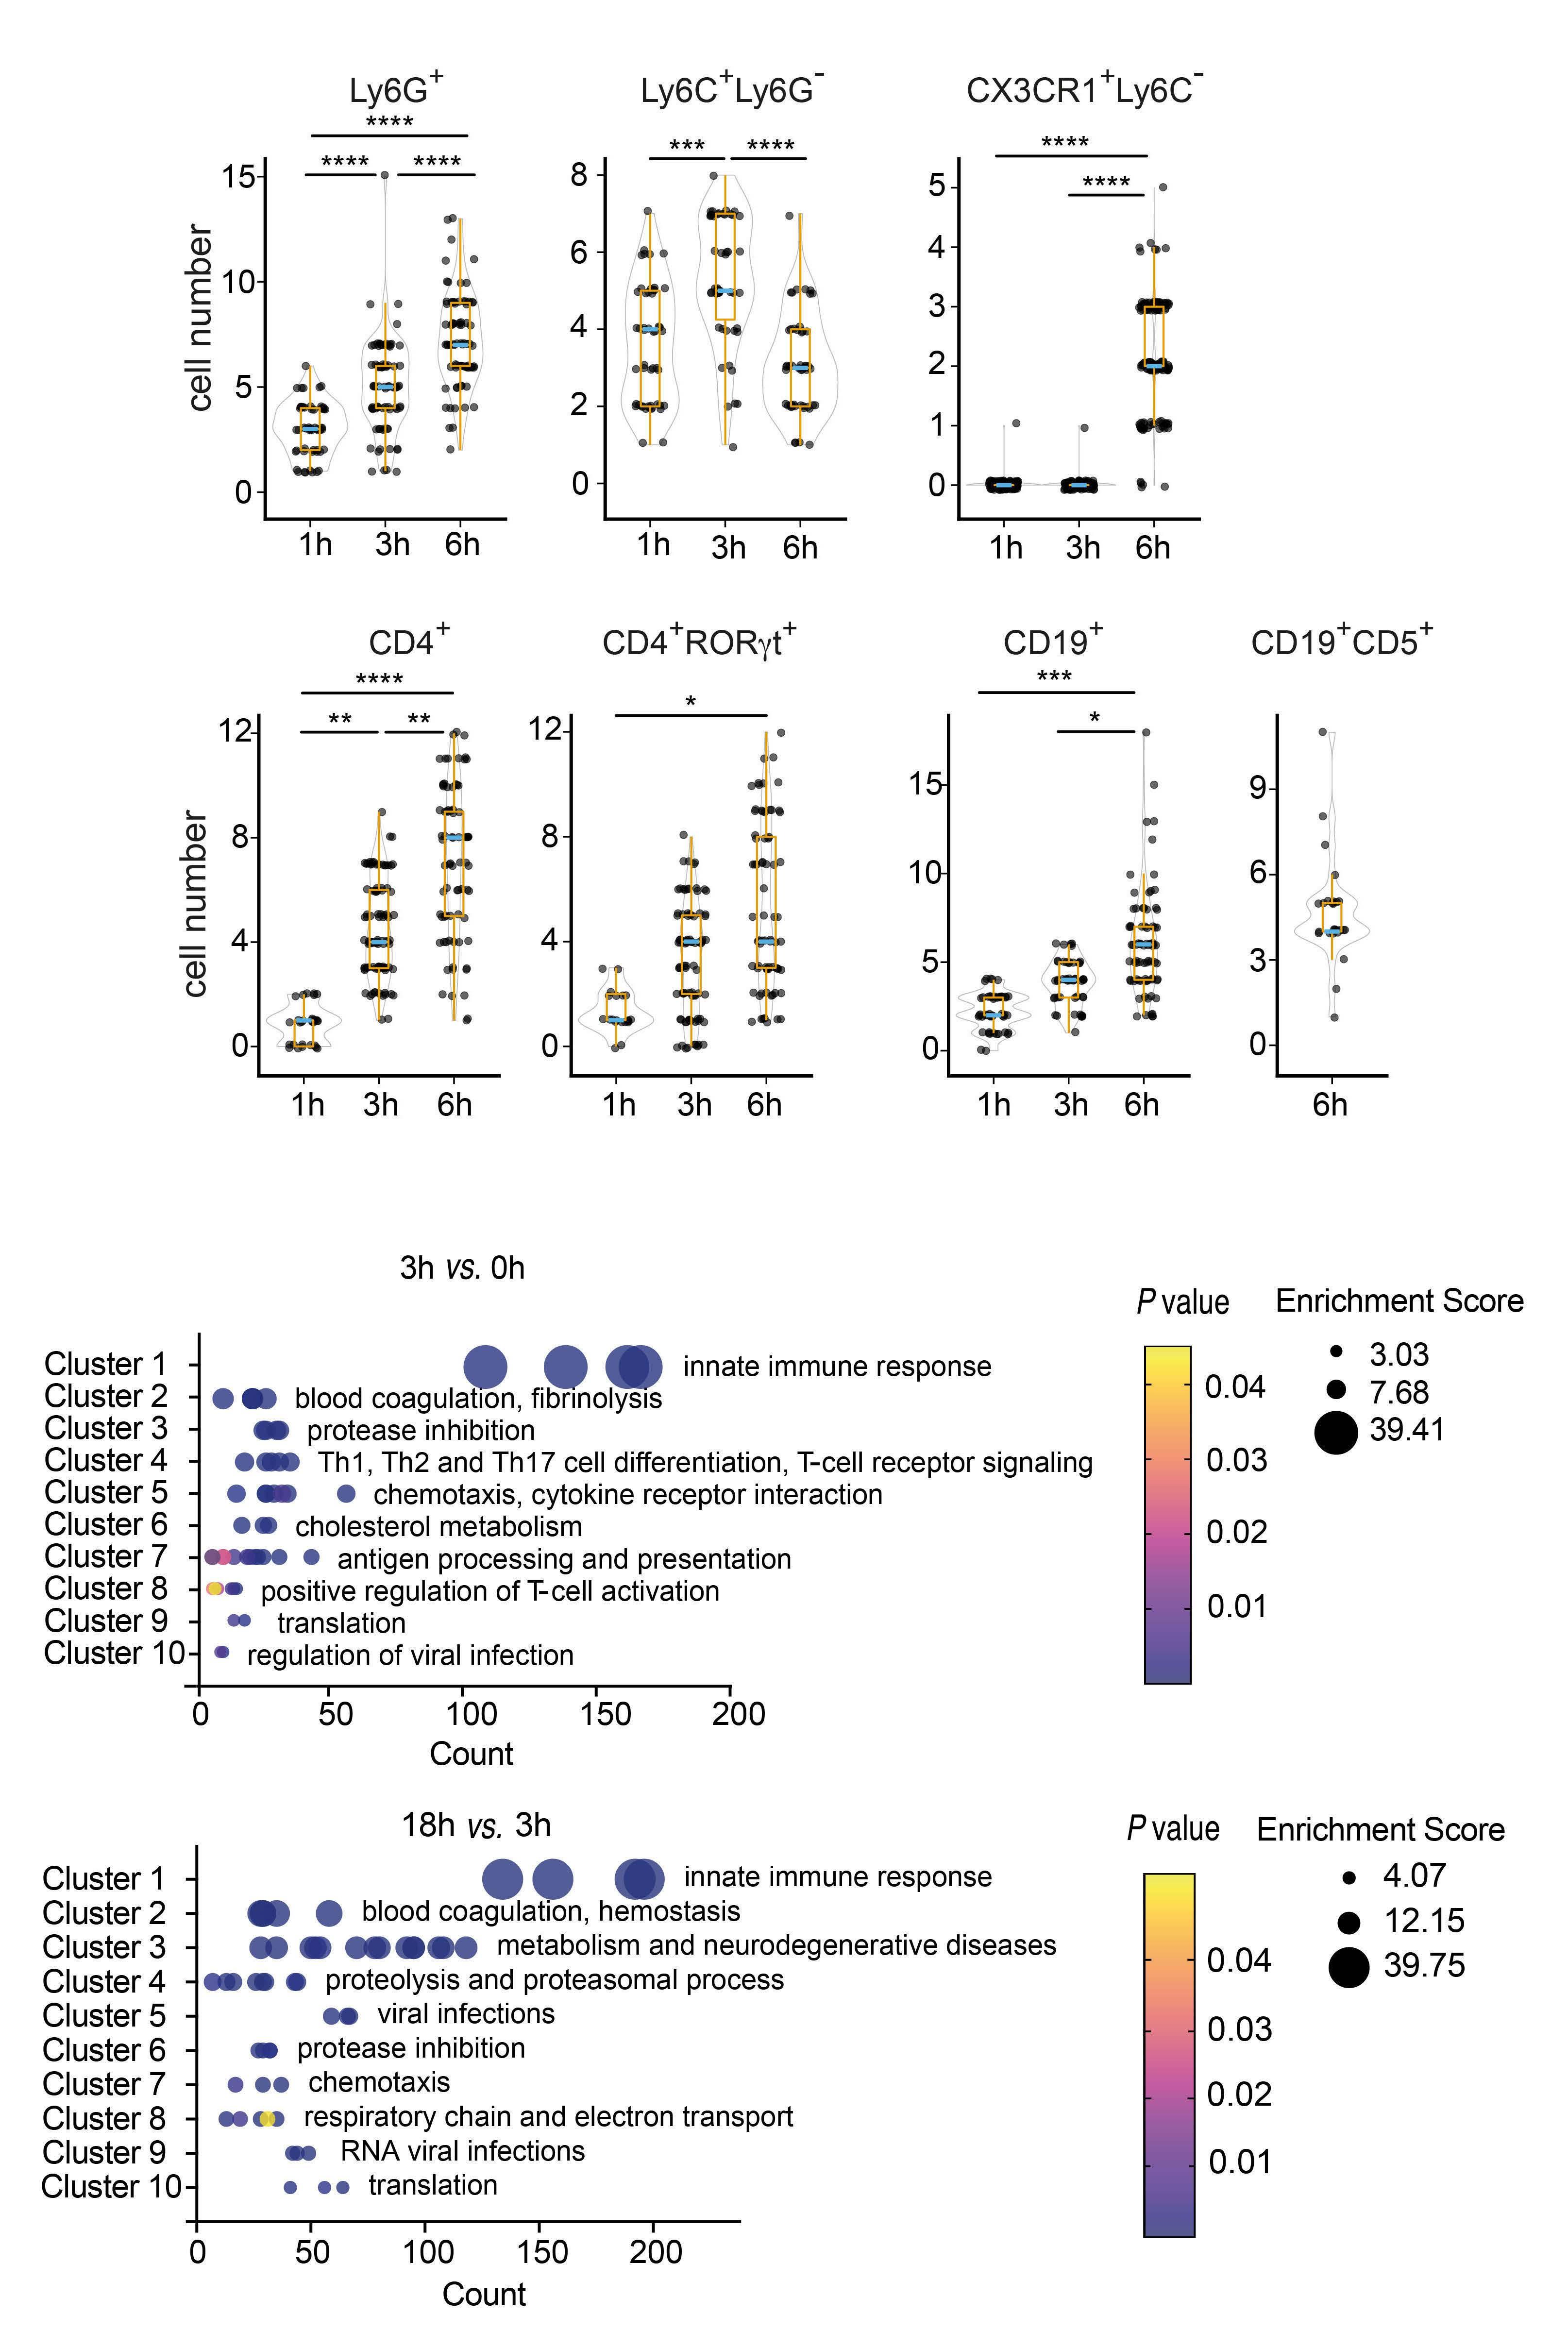
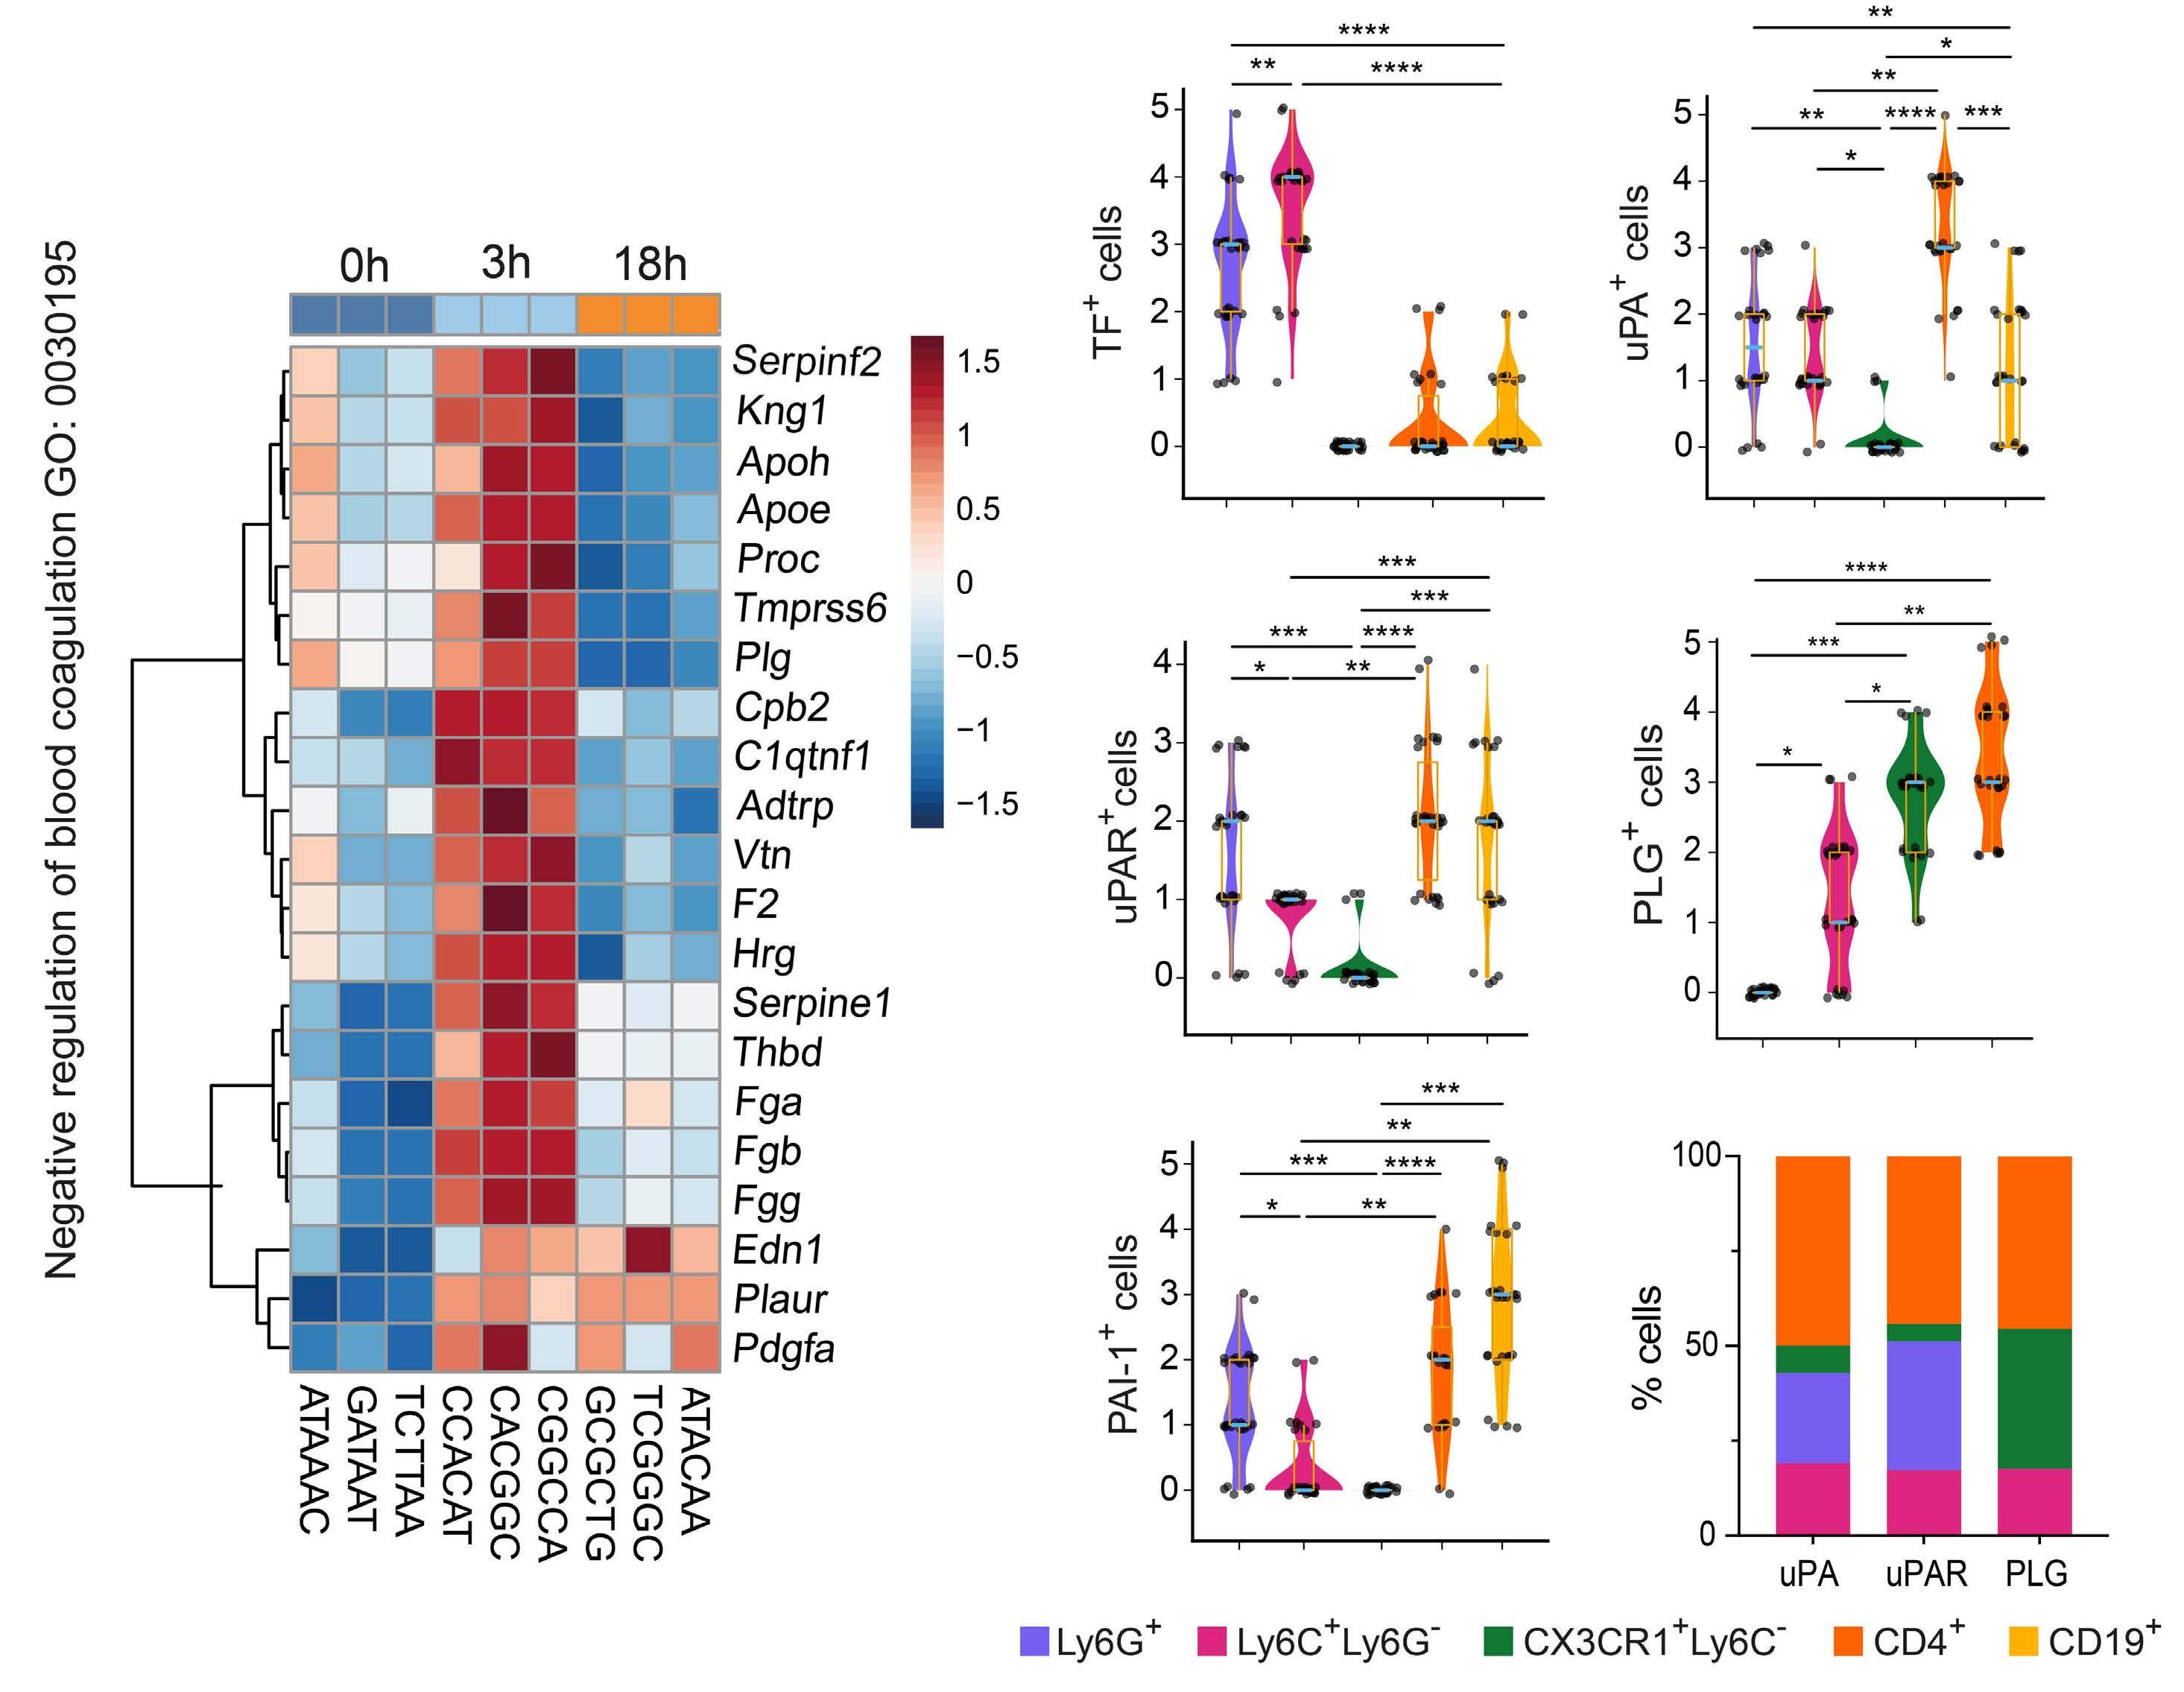
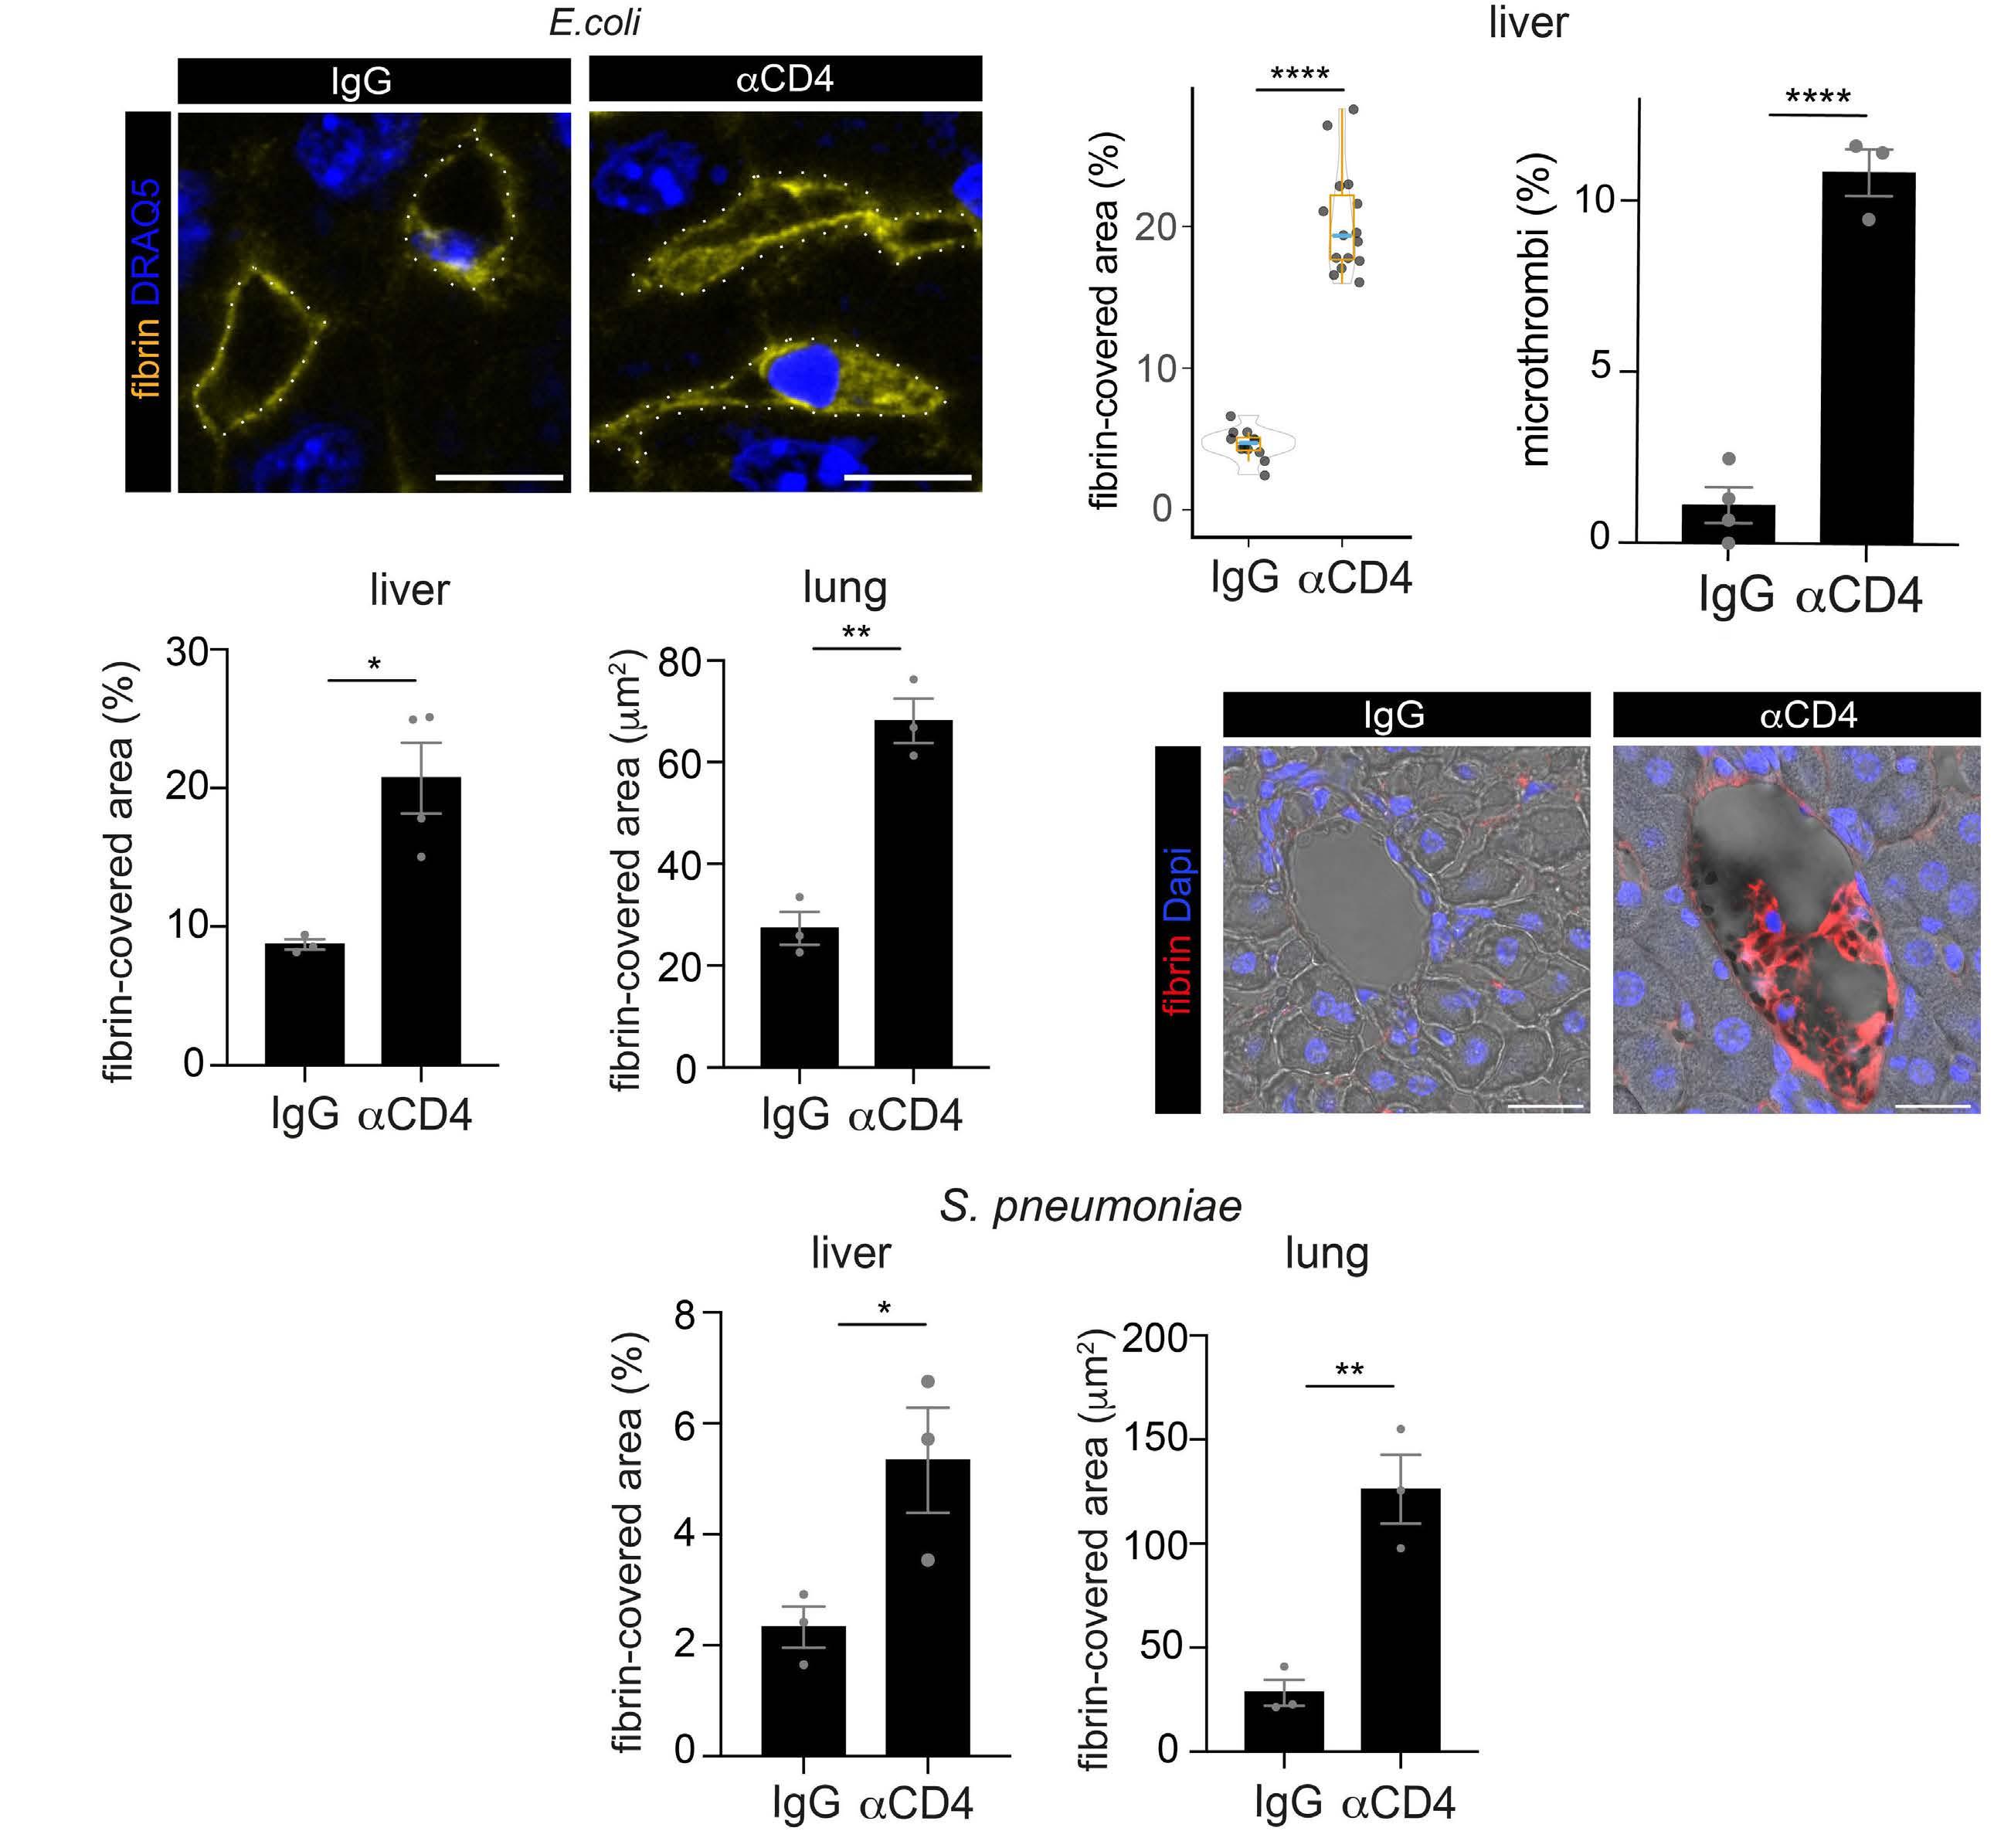
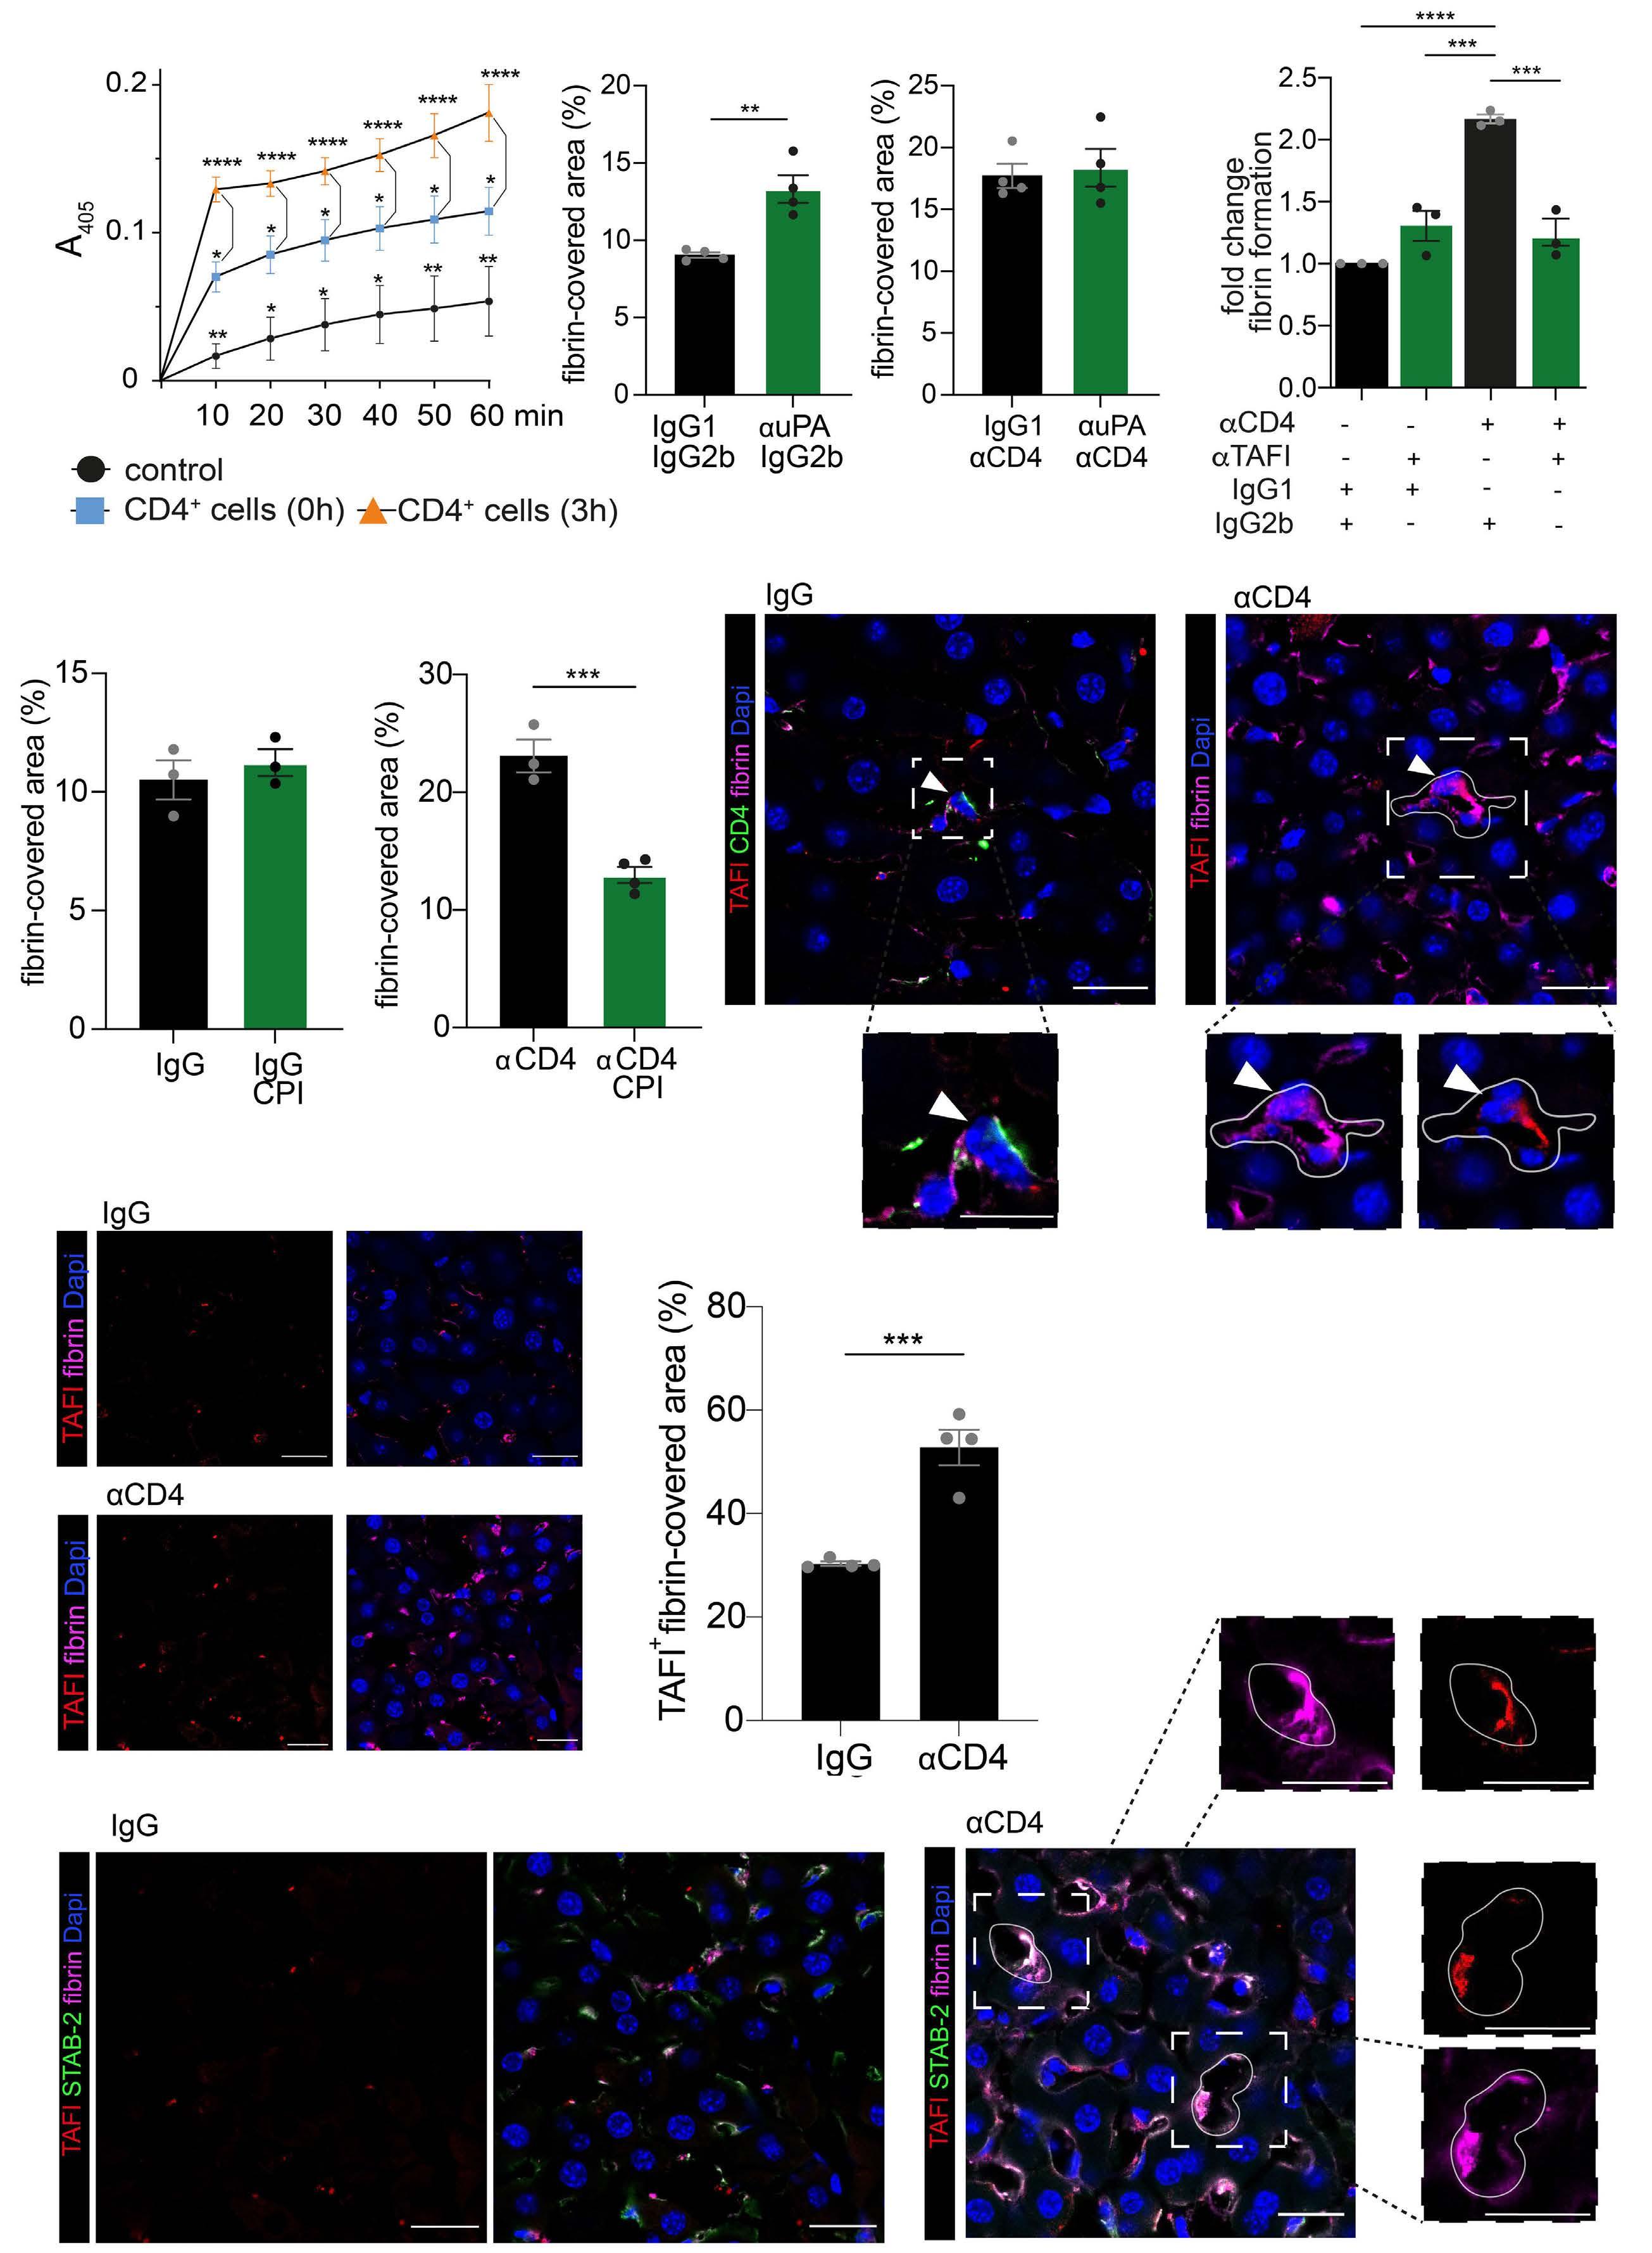
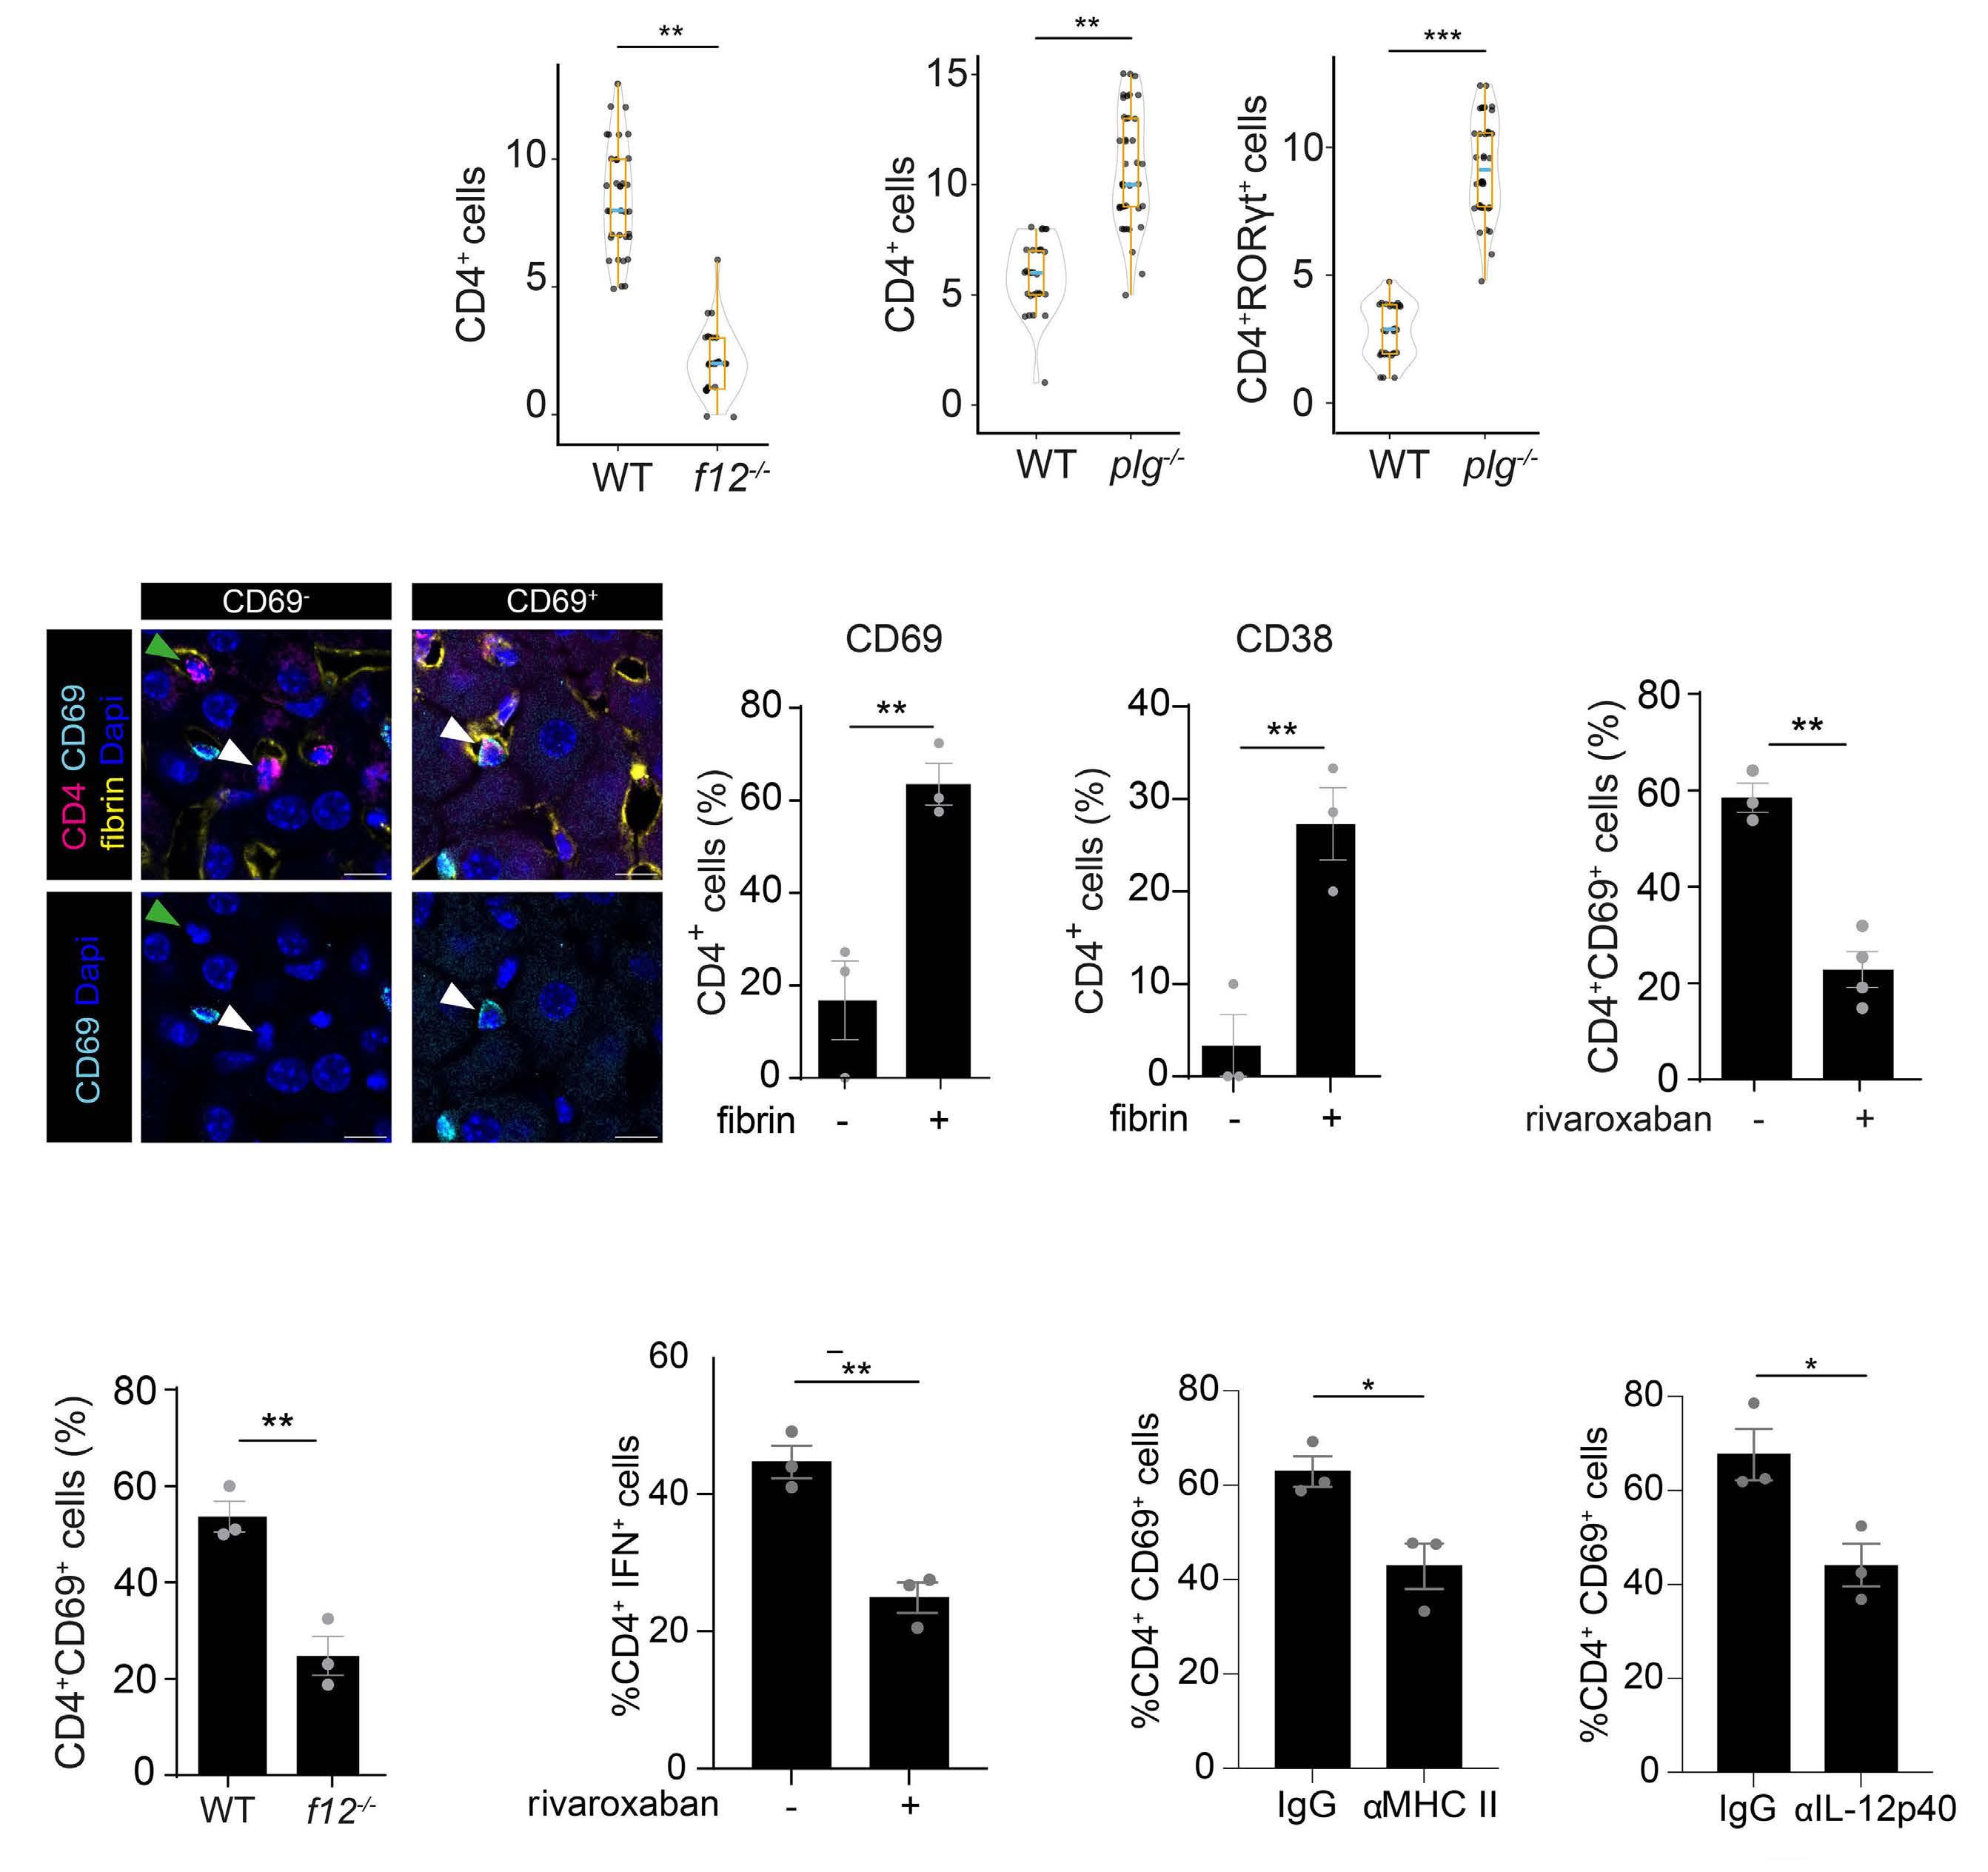
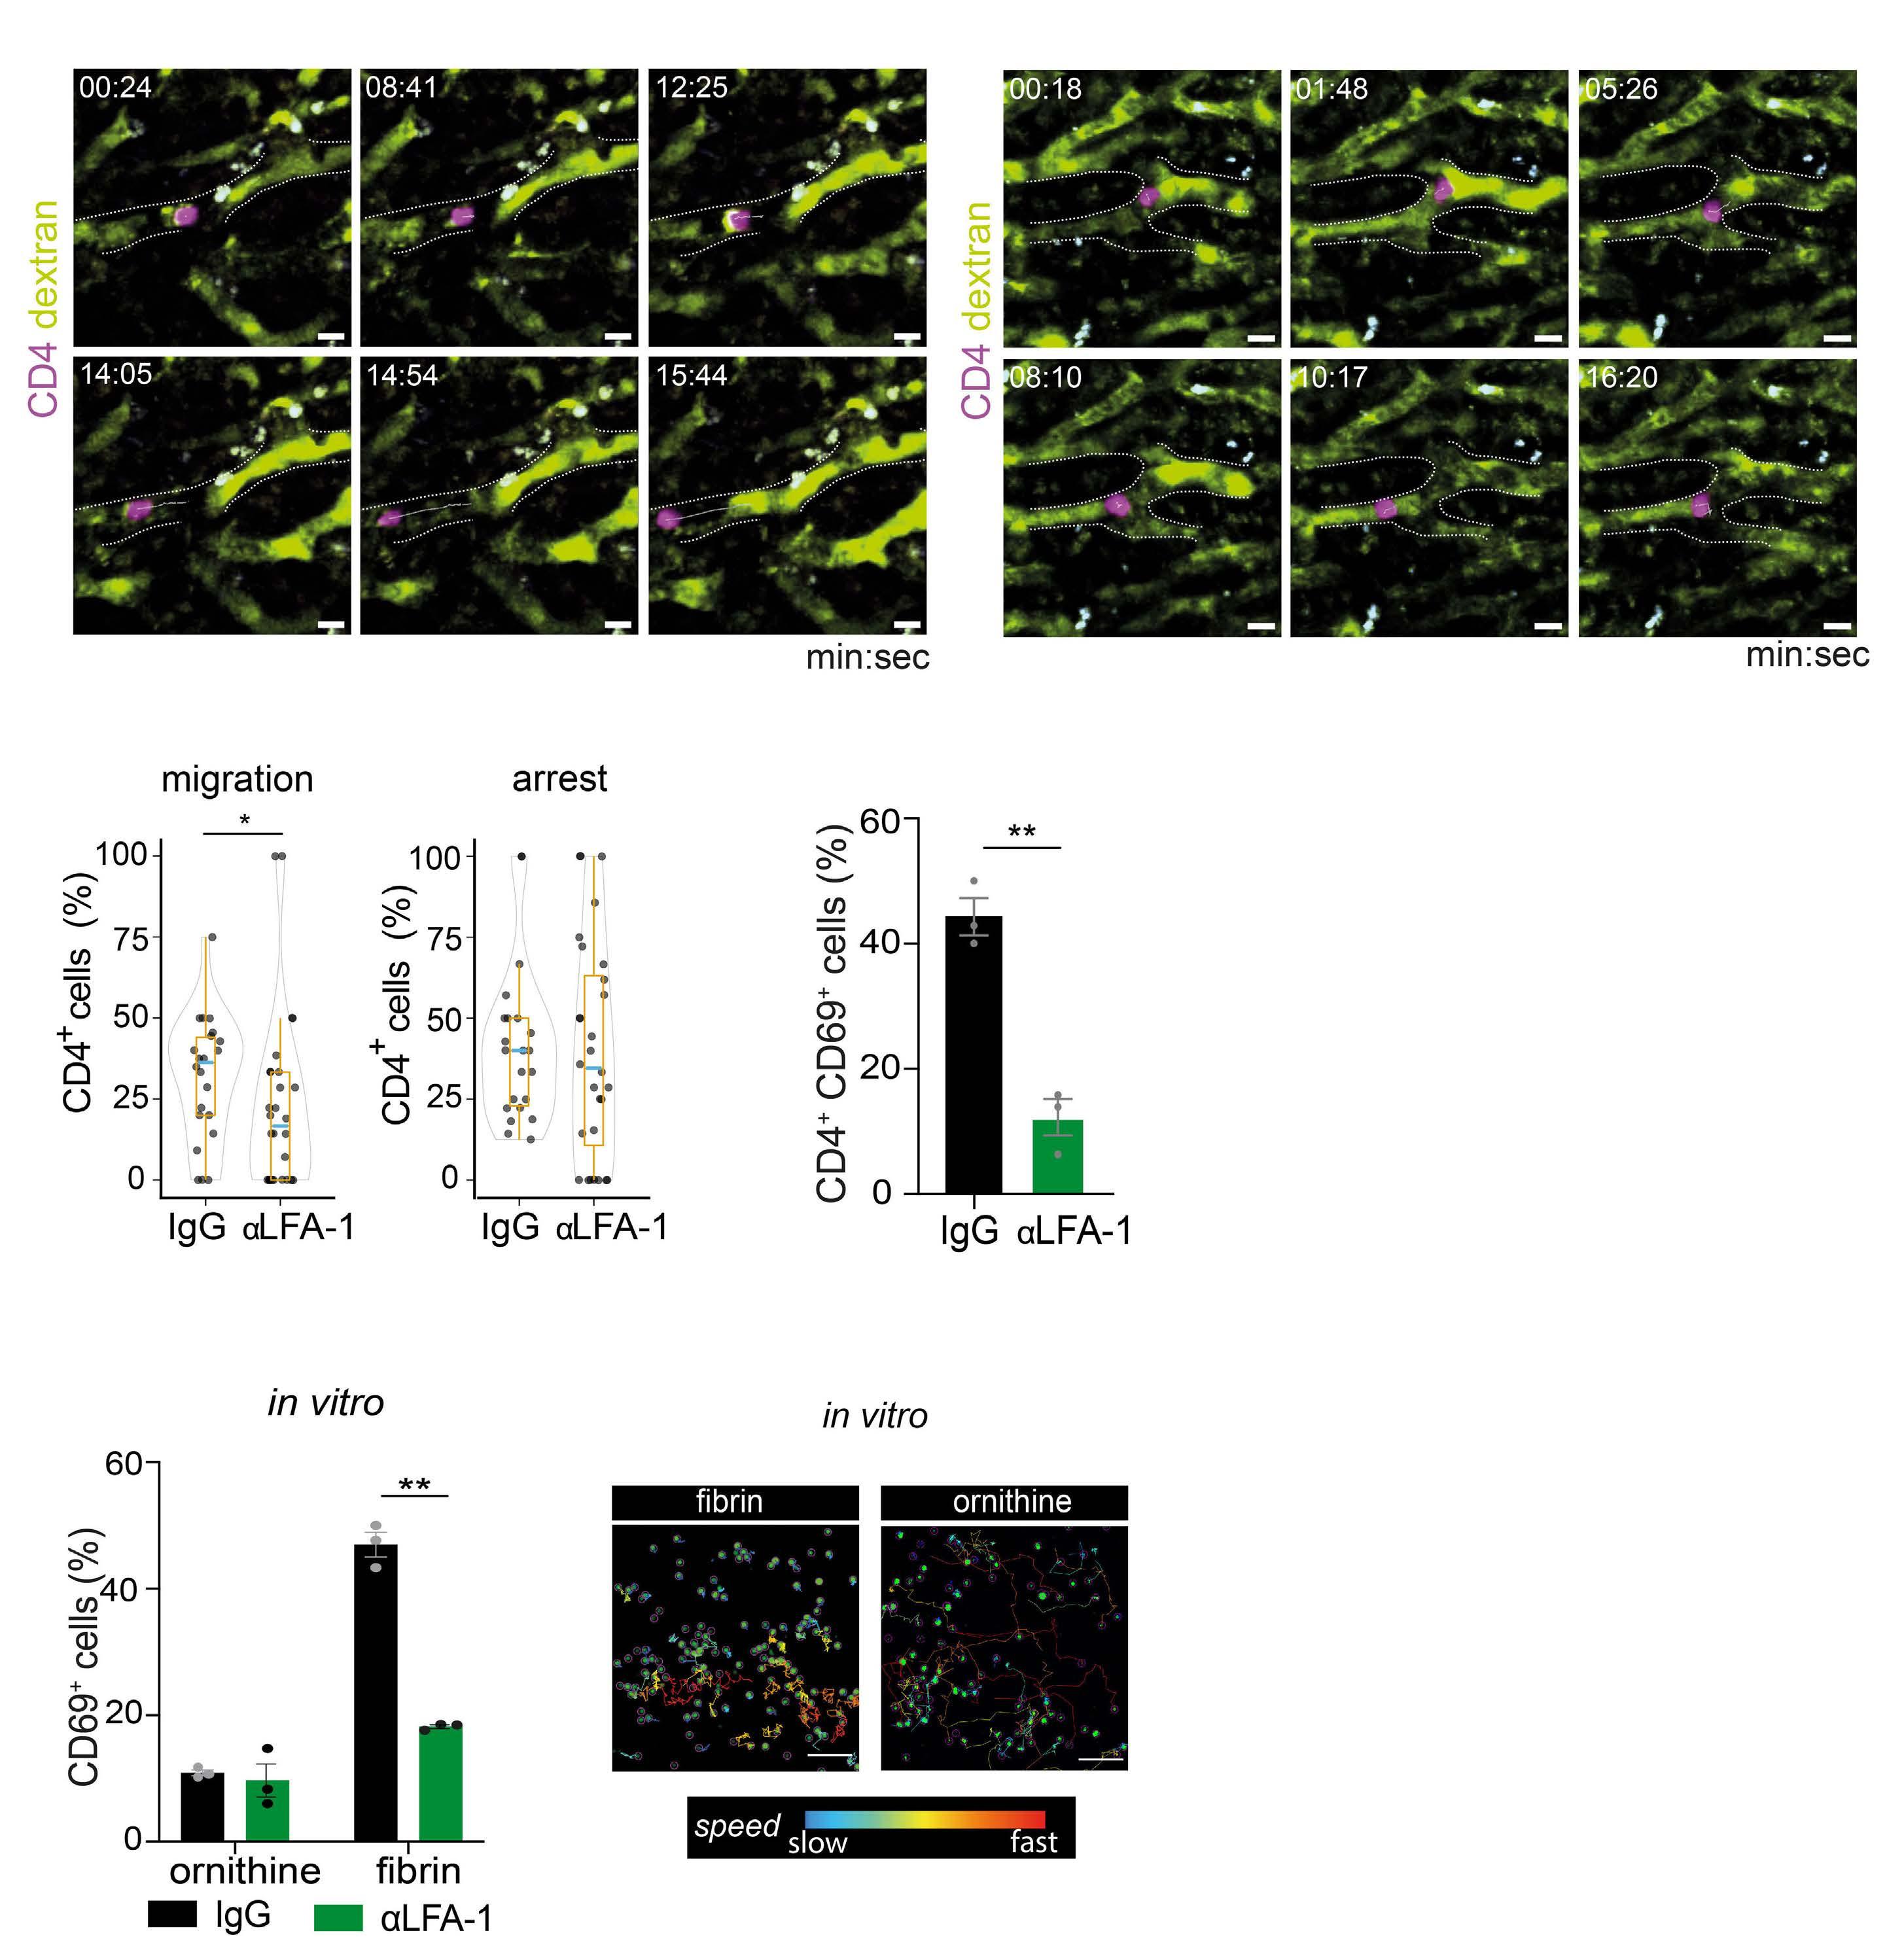
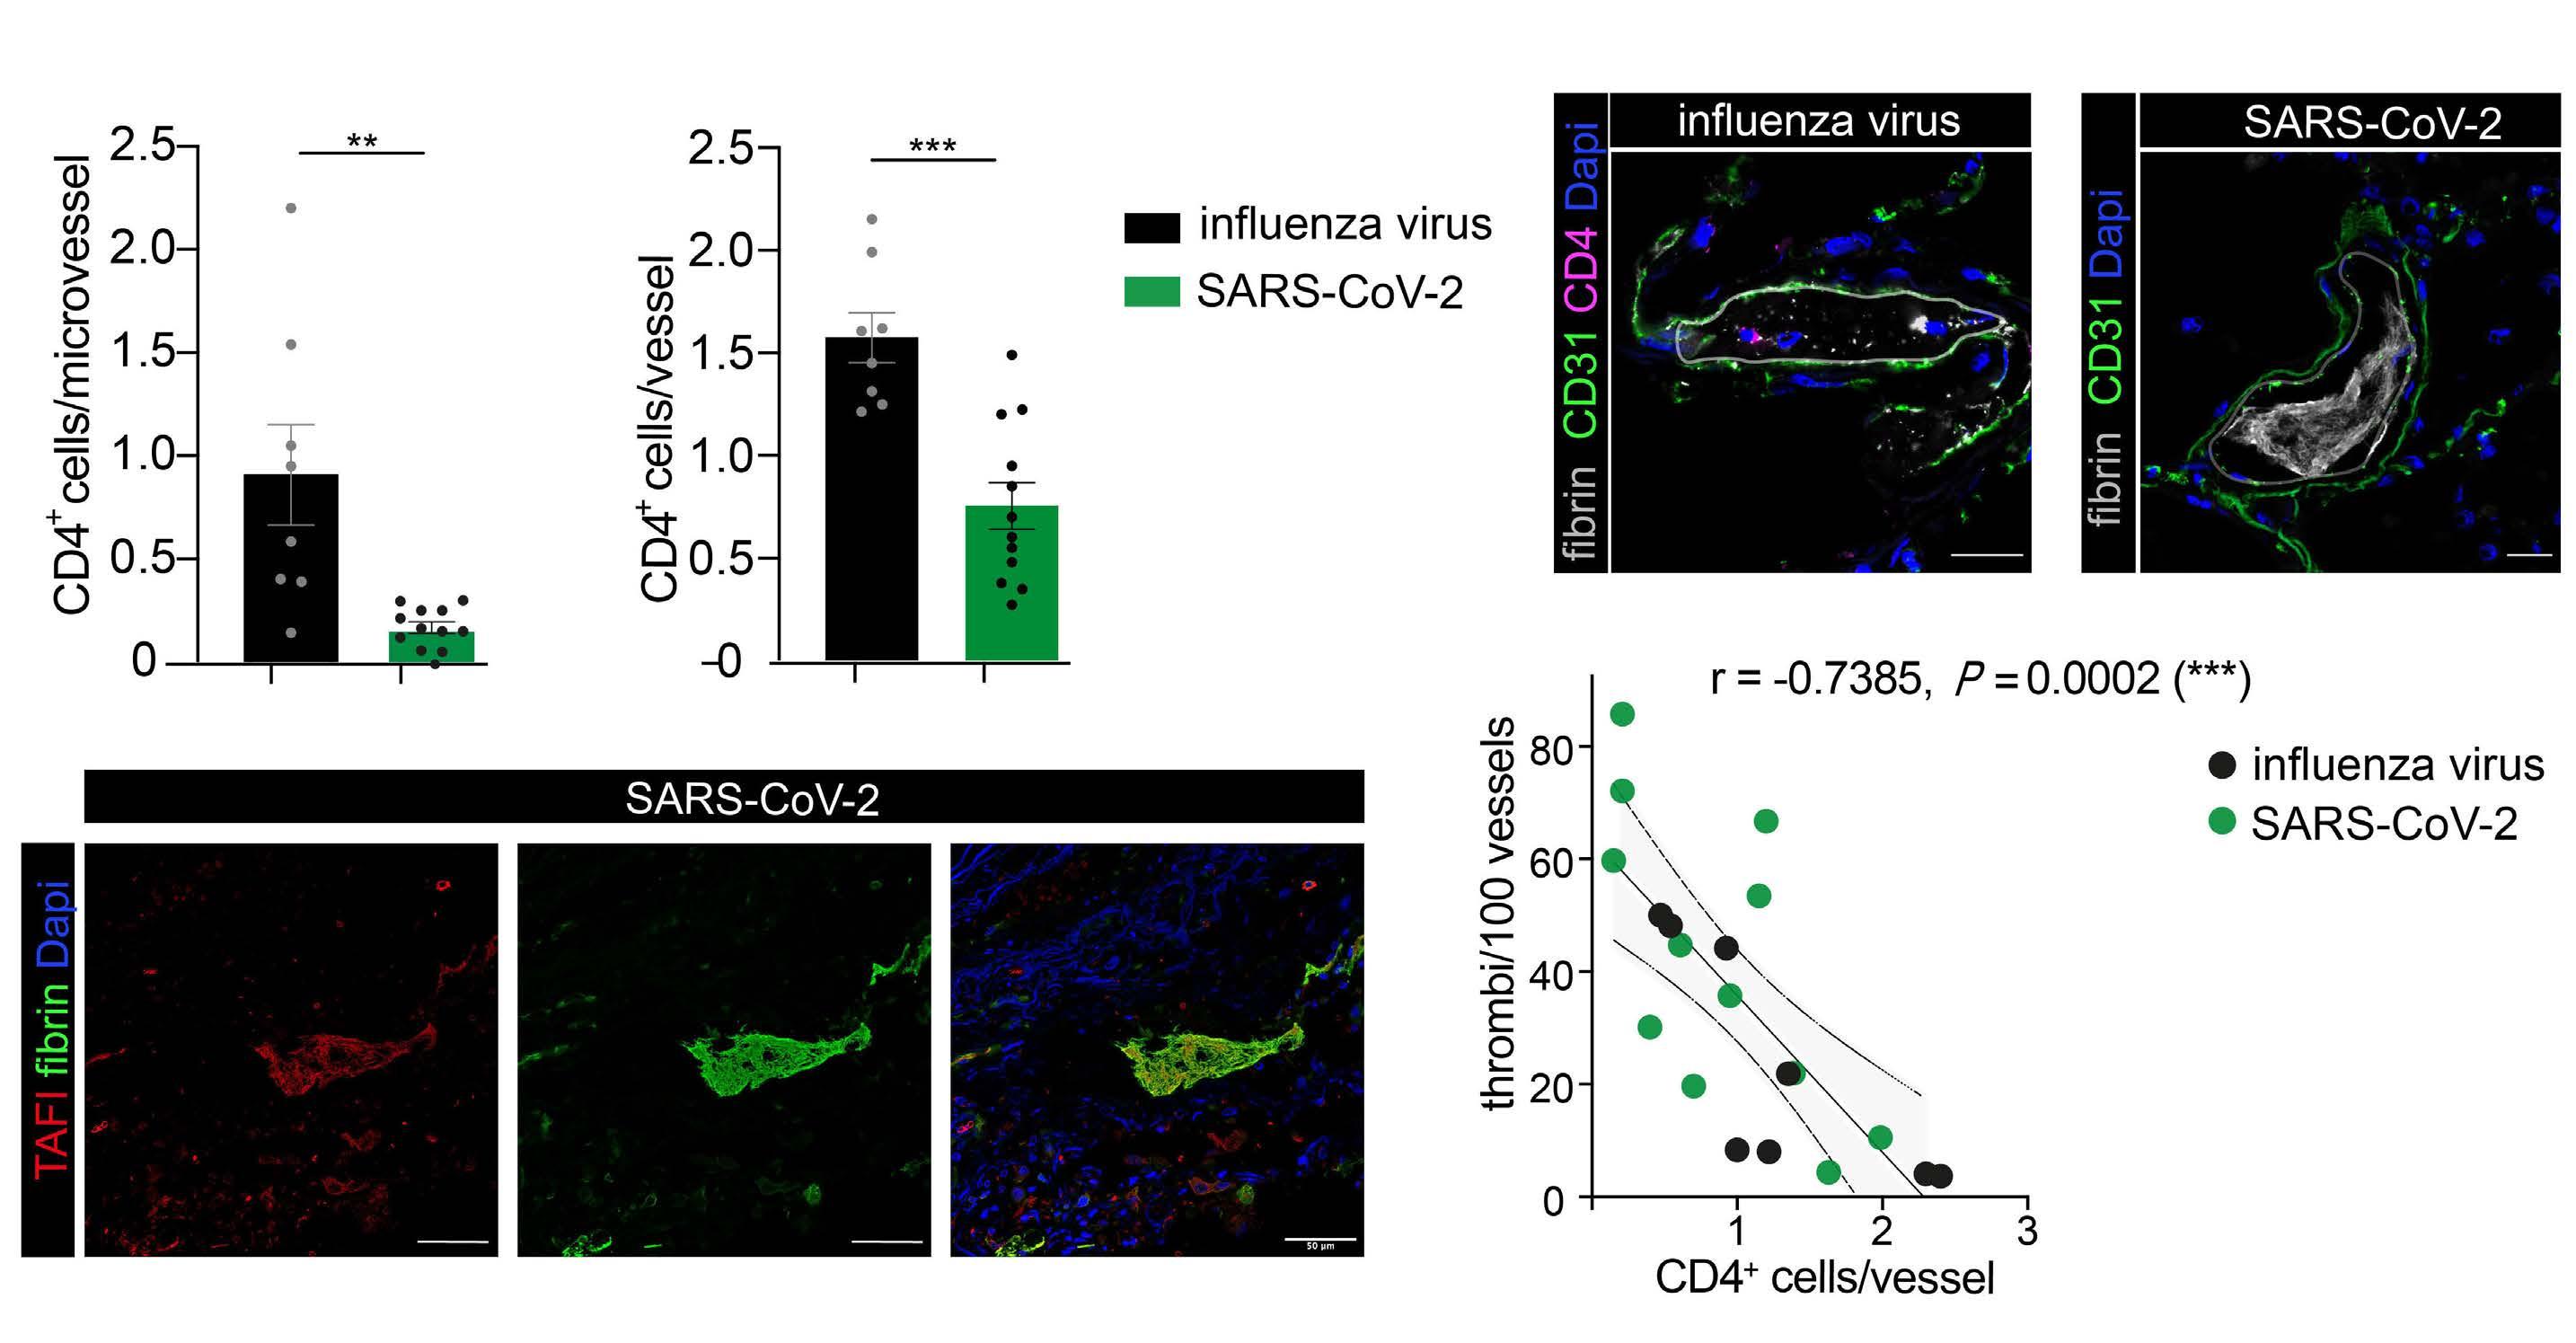
2487 Mutual regulation of CD4+ T cells and intravascular fibrin in infections
T.T. Mueller et al.
https://doi.org/10.3324/haematol.2023.284619
Hematopoiesis
2500 D-2-hydroxyglutarate supports a tolerogenic phenotype with lowered major histocompatibility class II expression in non-malignant dendritic cells and acute myeloid leukemia cells
K. Hammon et al.
https://doi.org/10.3324/haematol.2023.283597
Hematopoiesis
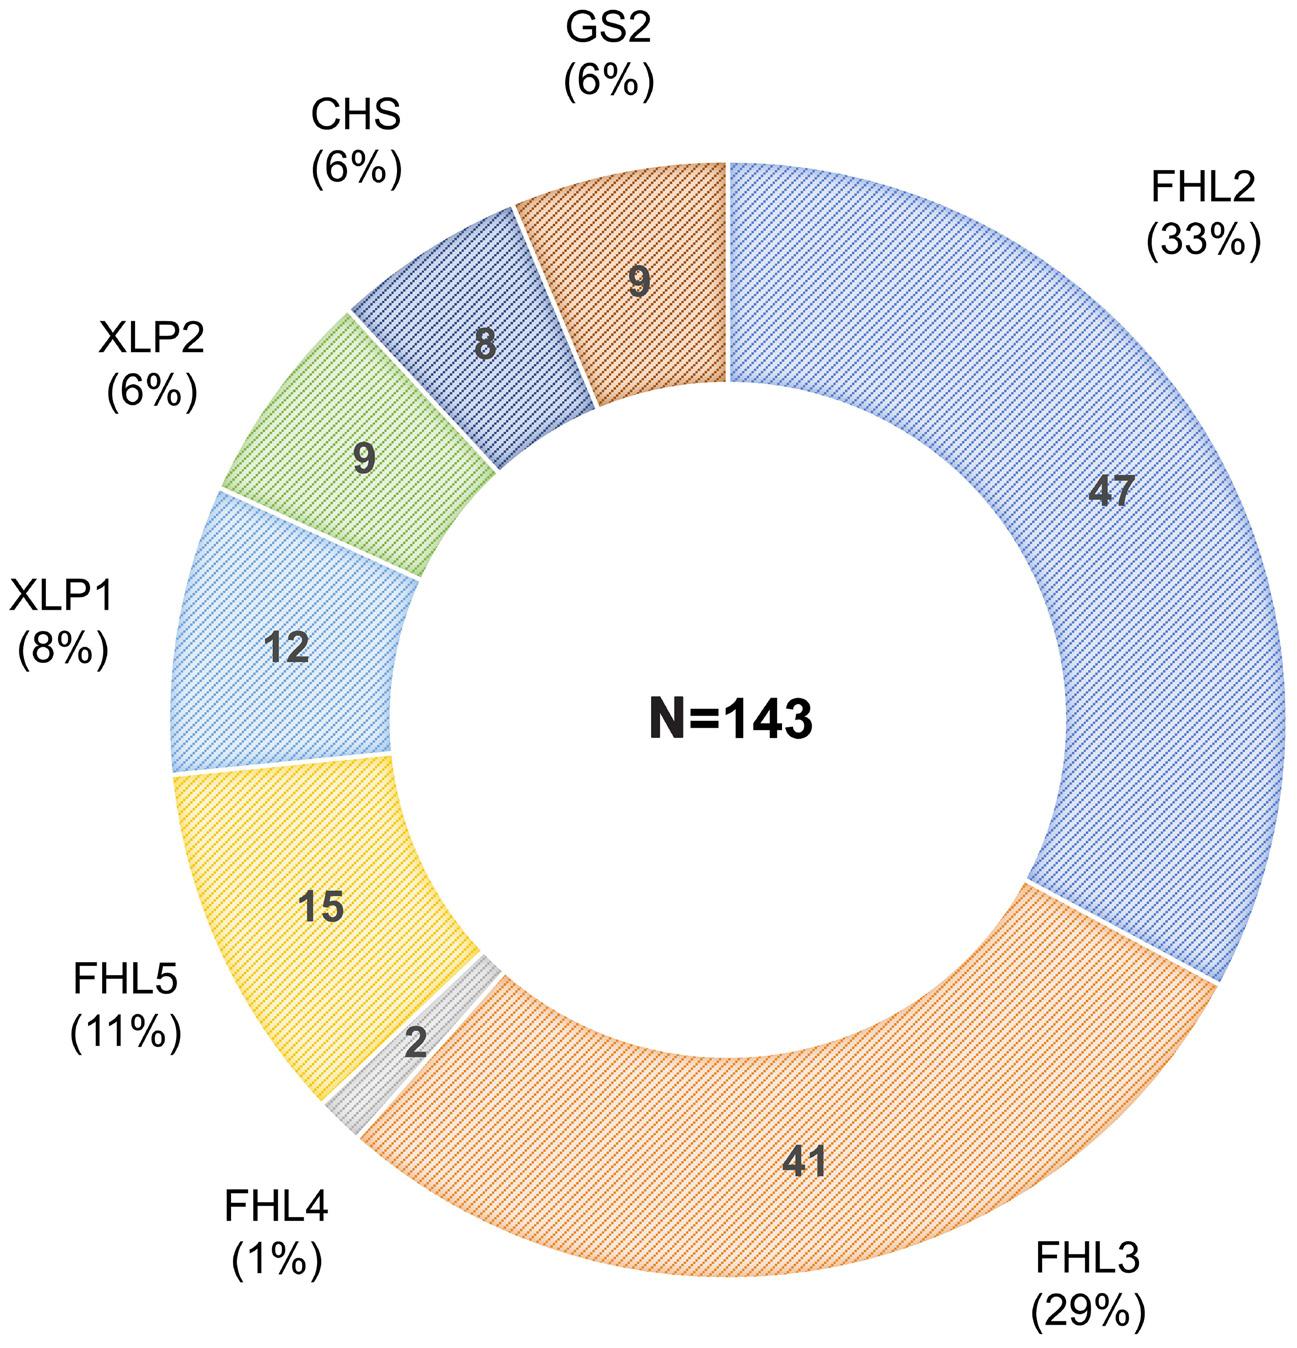
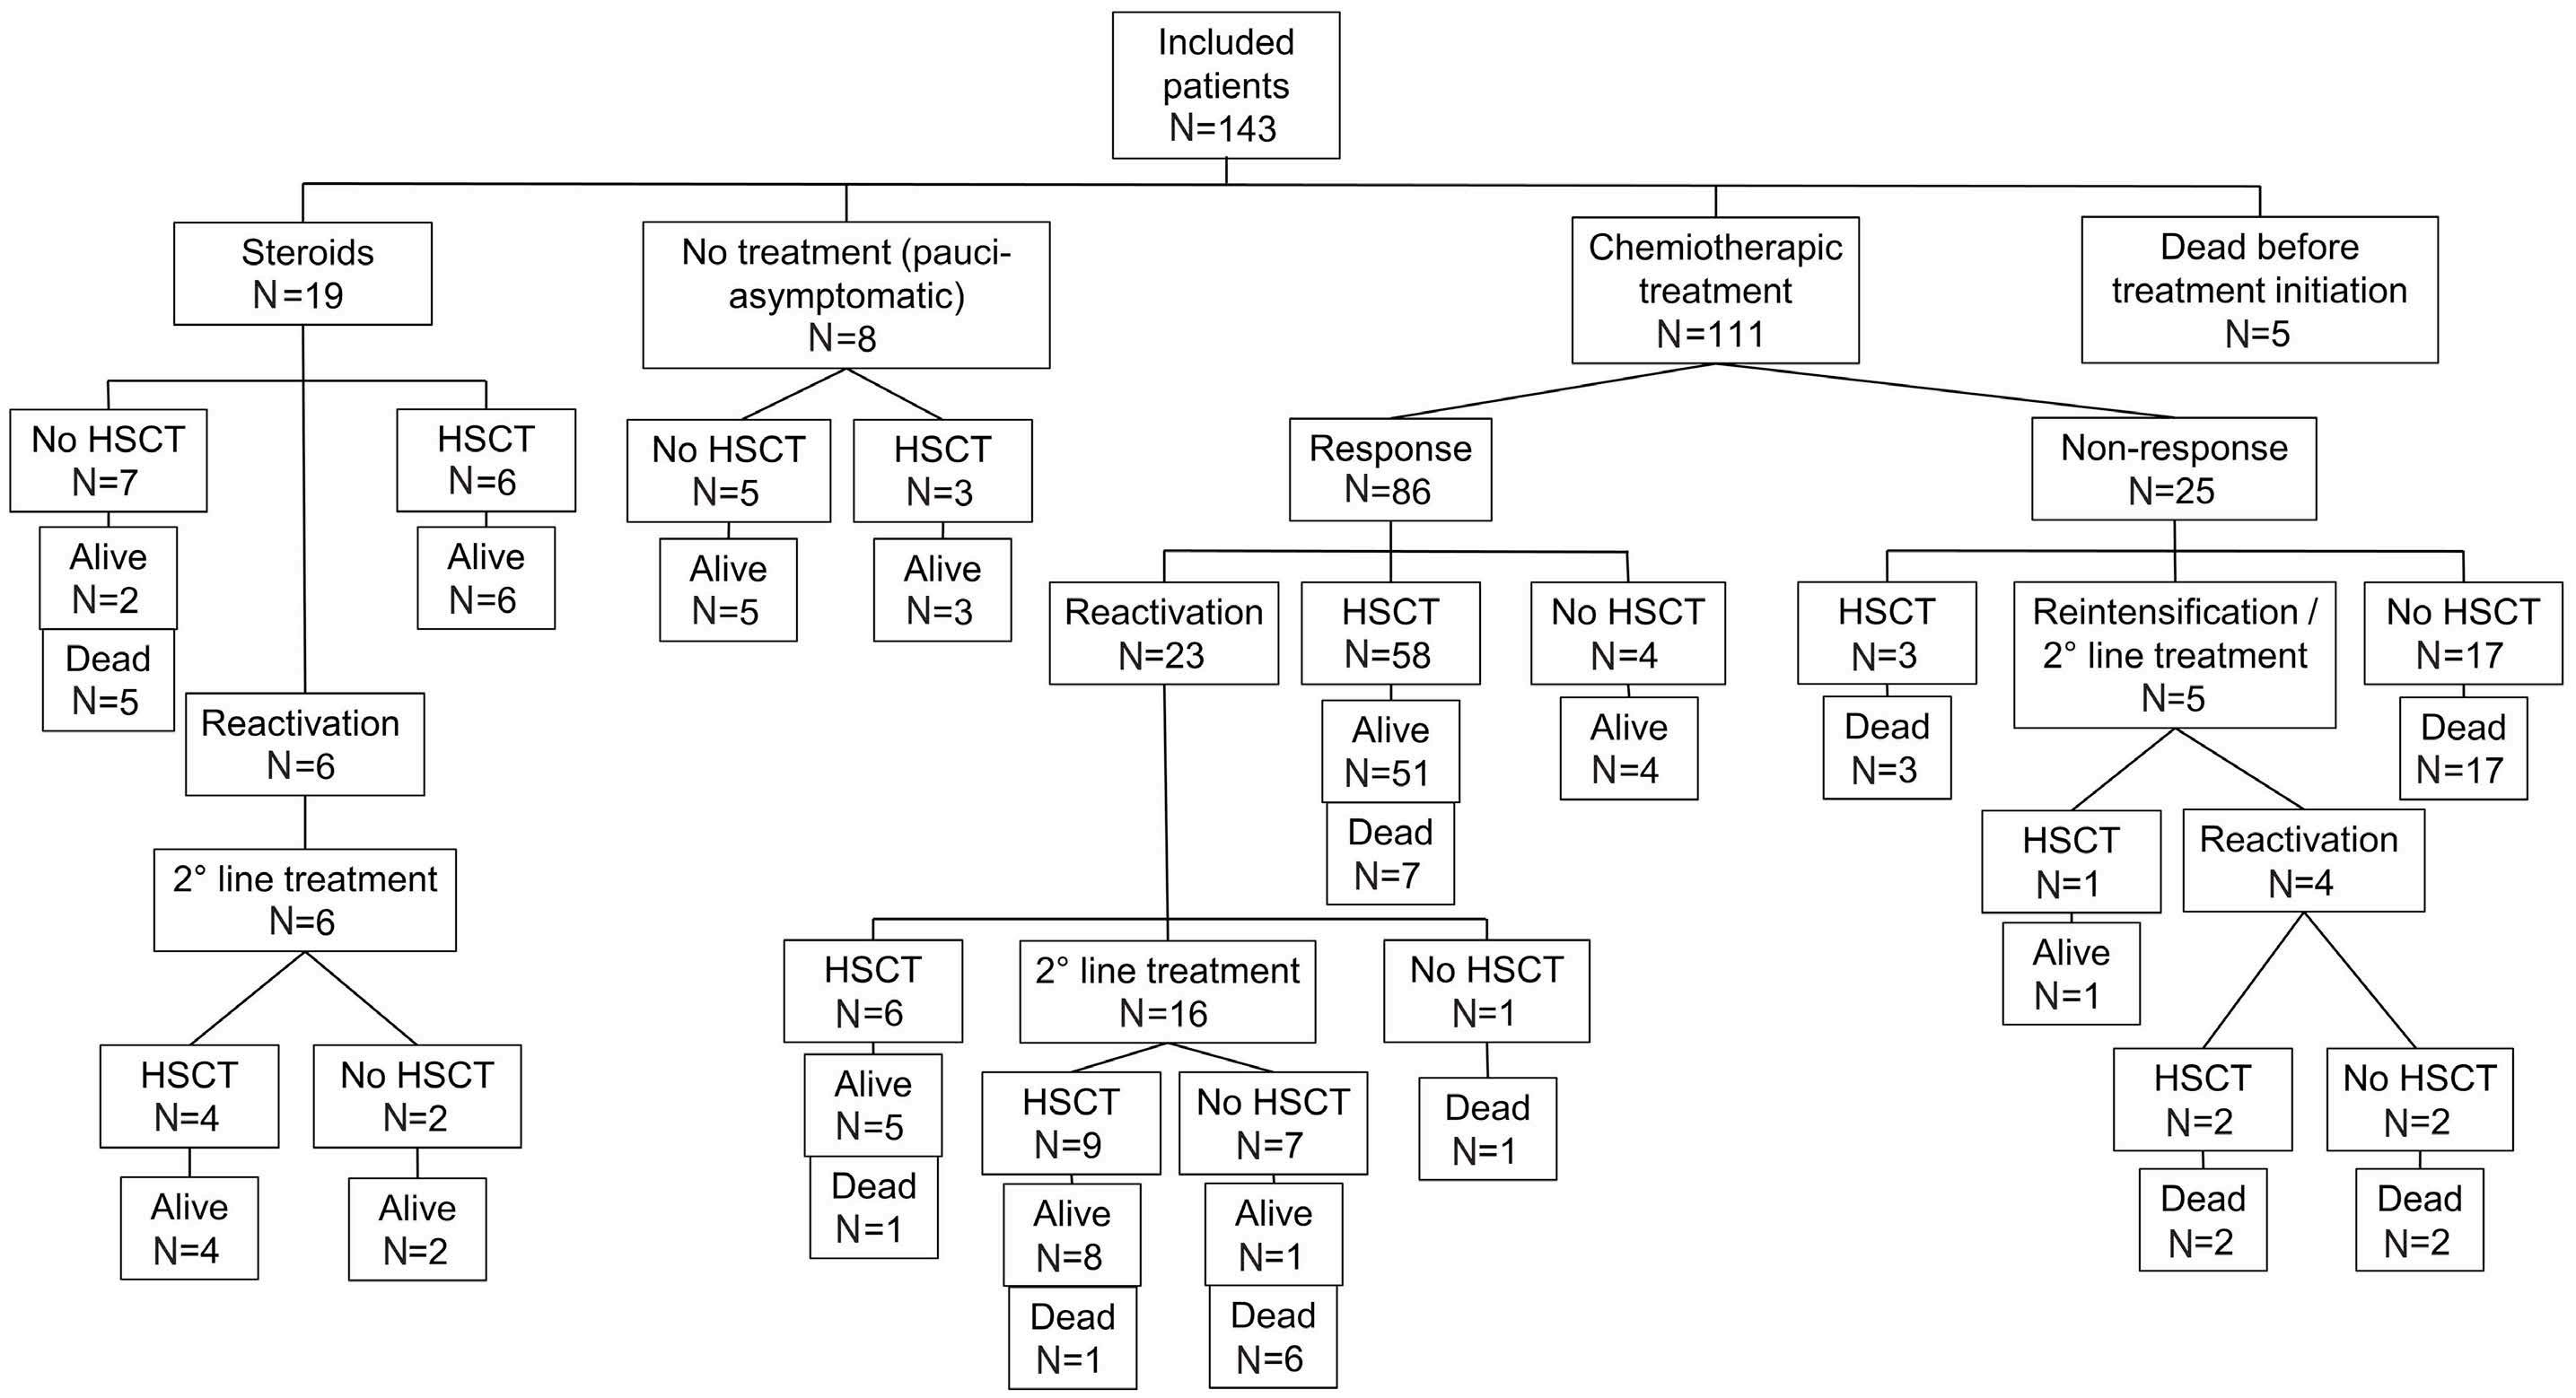
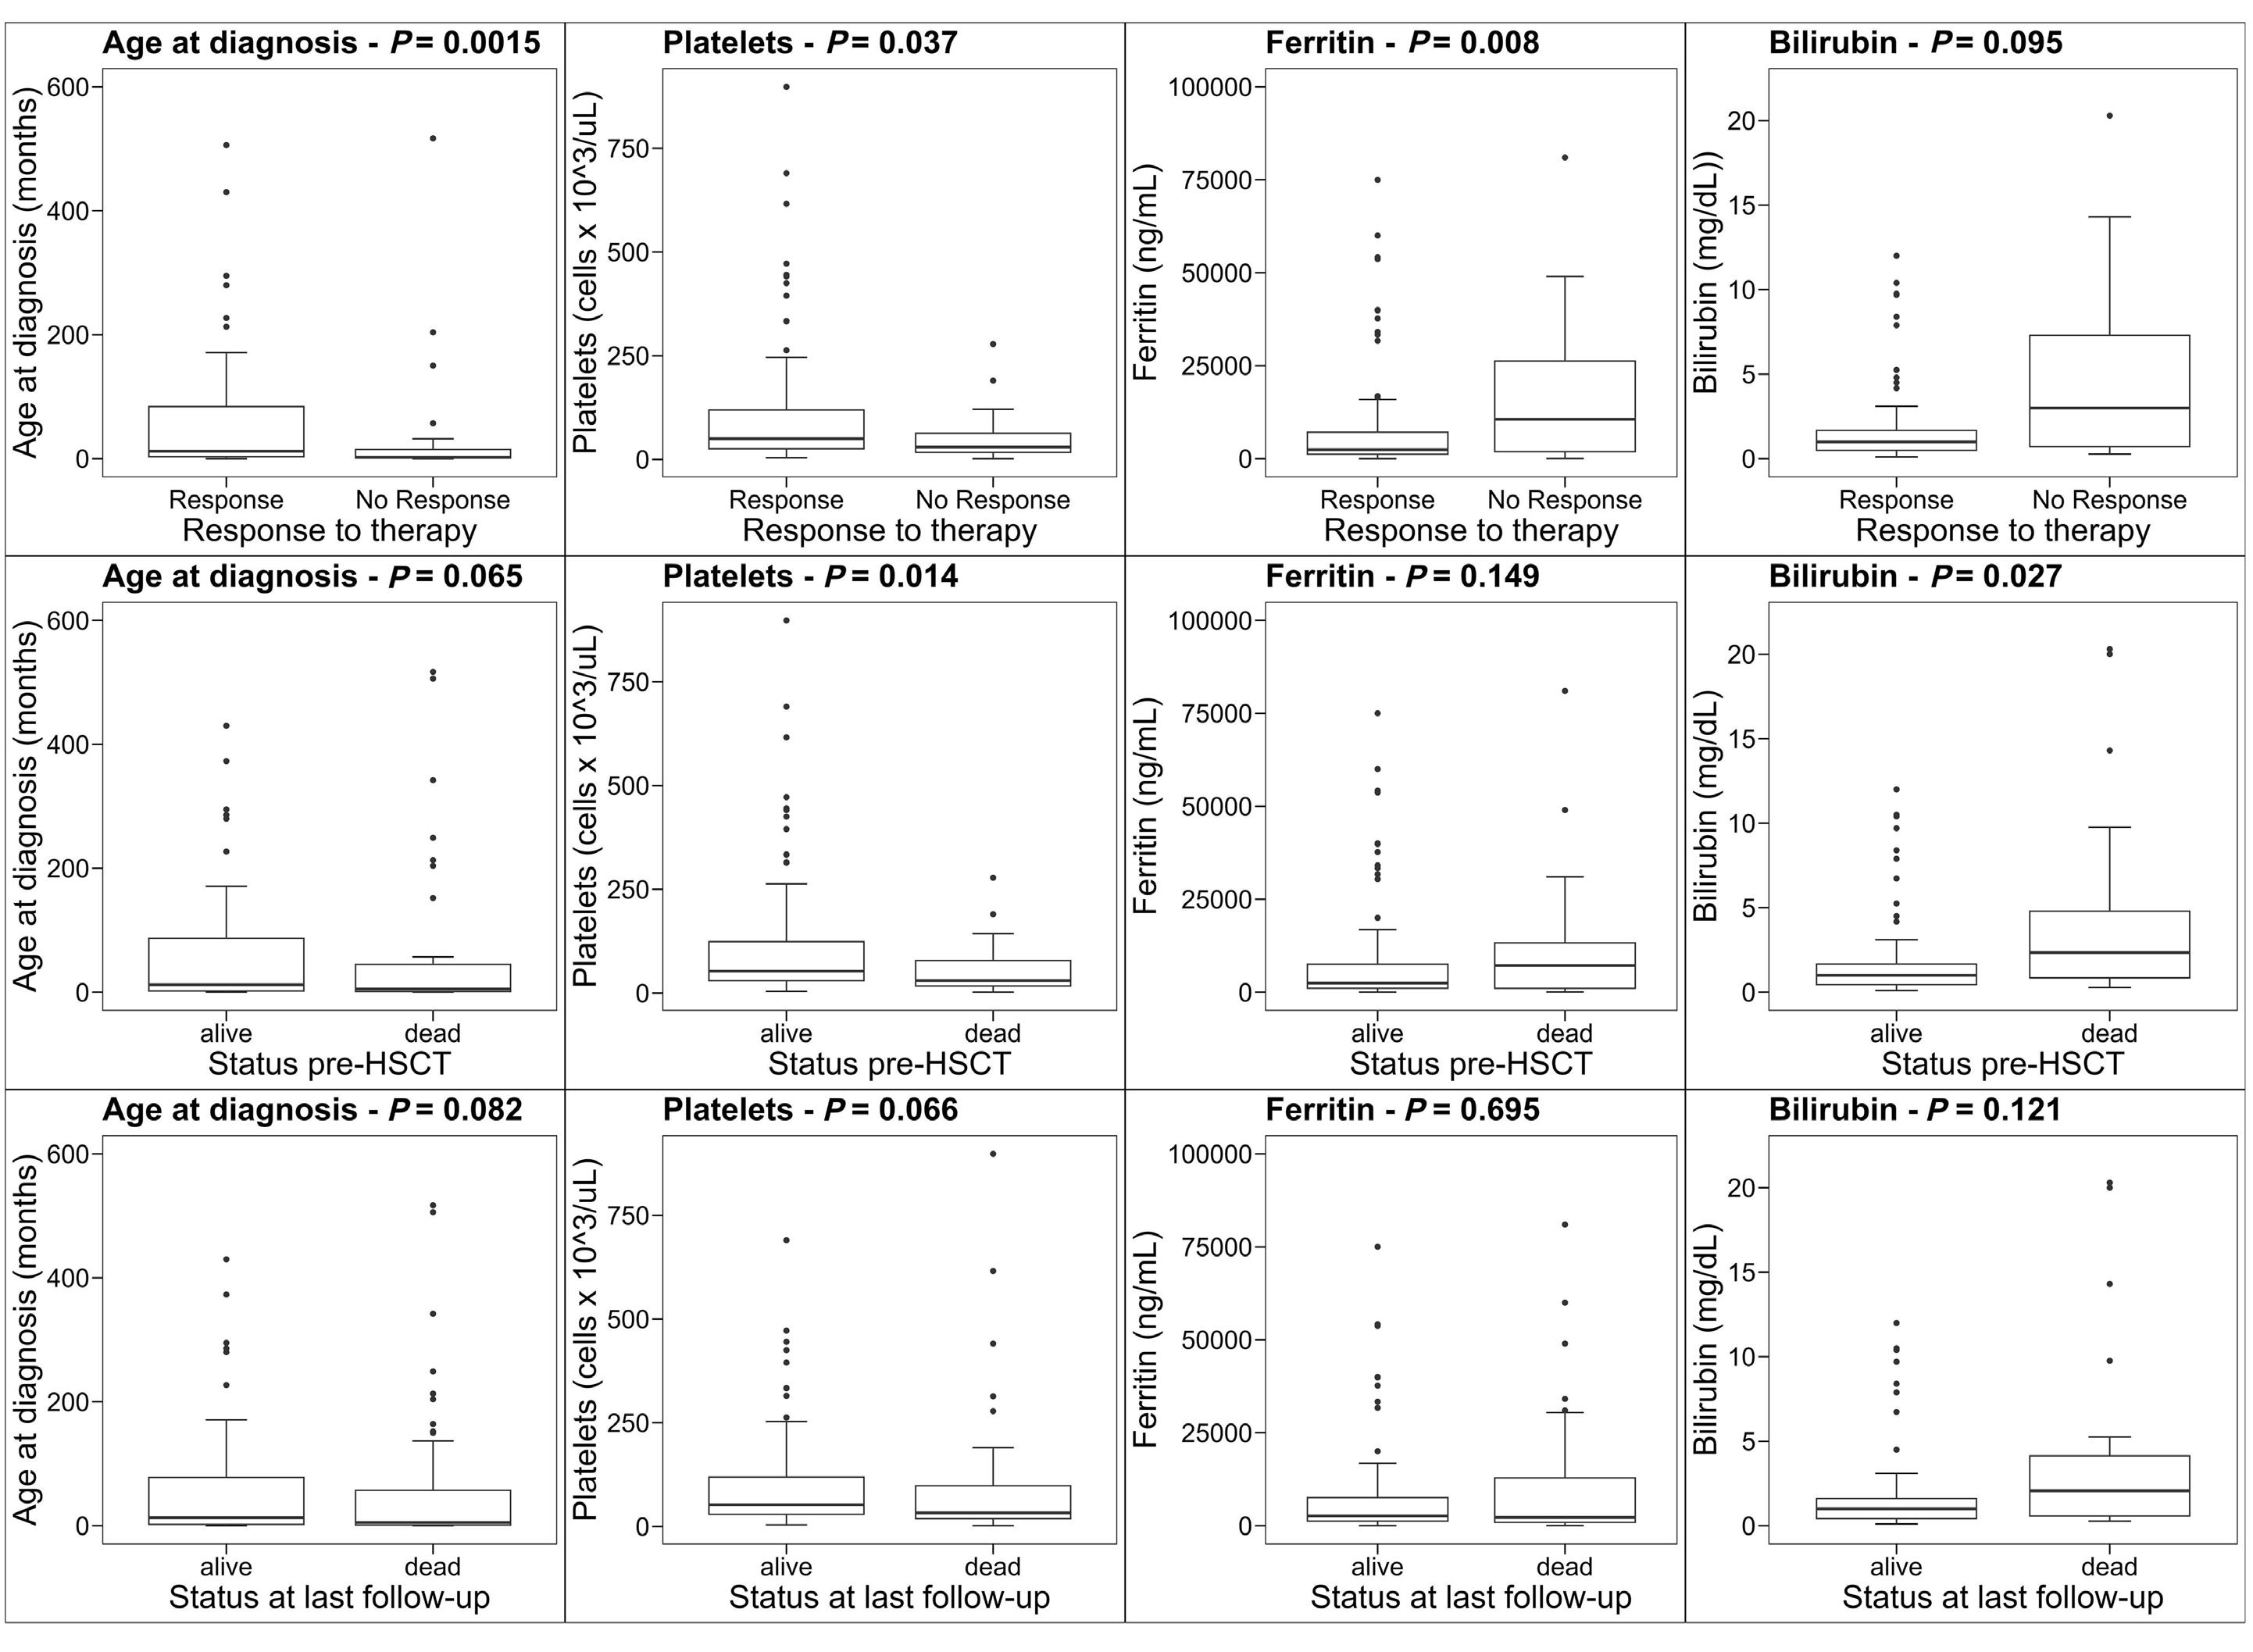
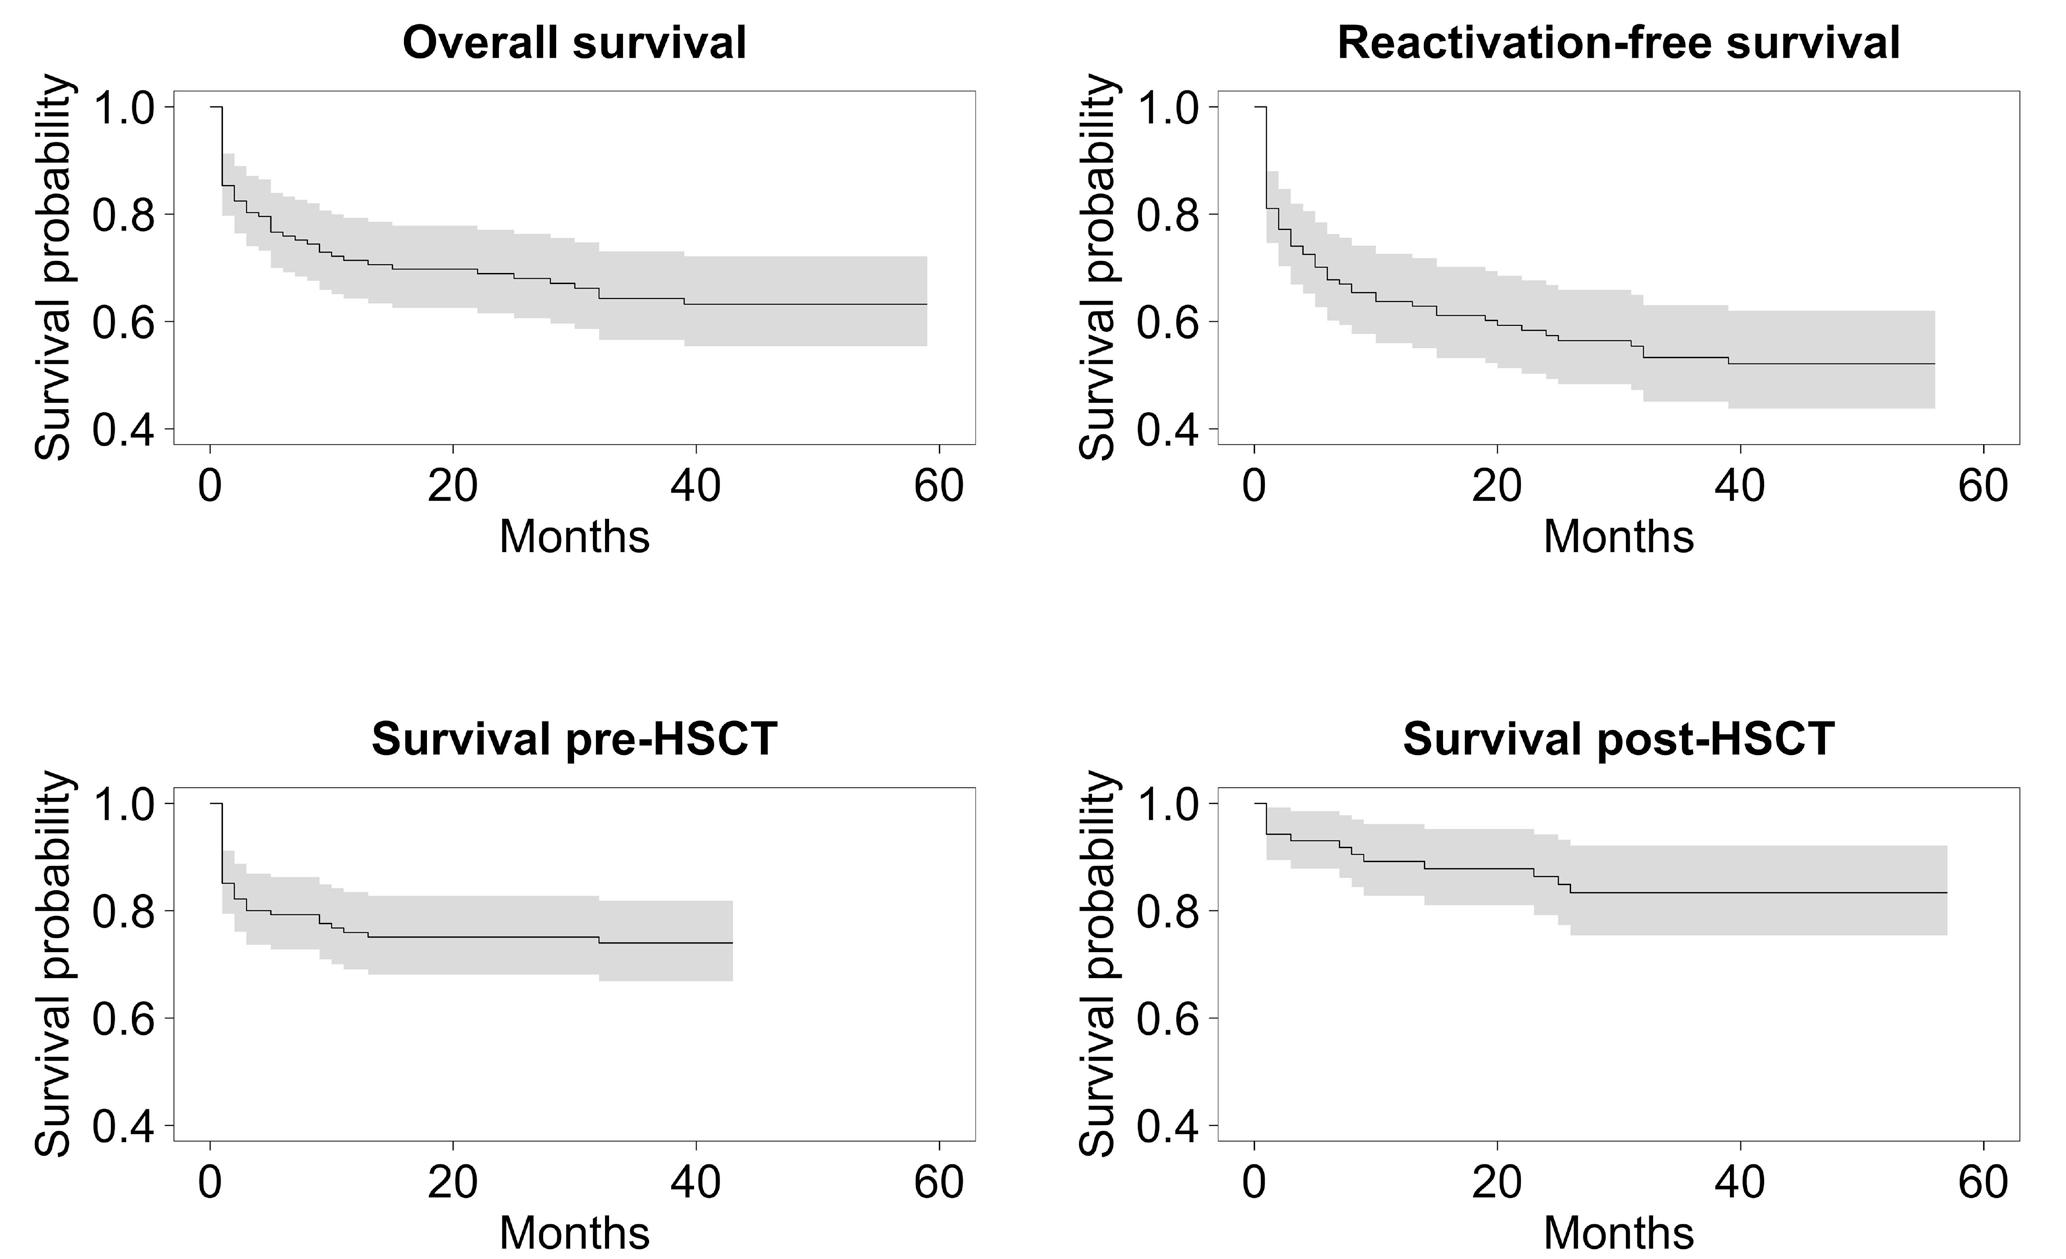
2515 Outcome of primary hemophagocytic lymphohistiocytosis: a report on 143 patients from the Italian Registry
F. Pegoraro et al.
https://doi.org/10.3324/haematol.2023.283893
Myelodysplastic Syndromes
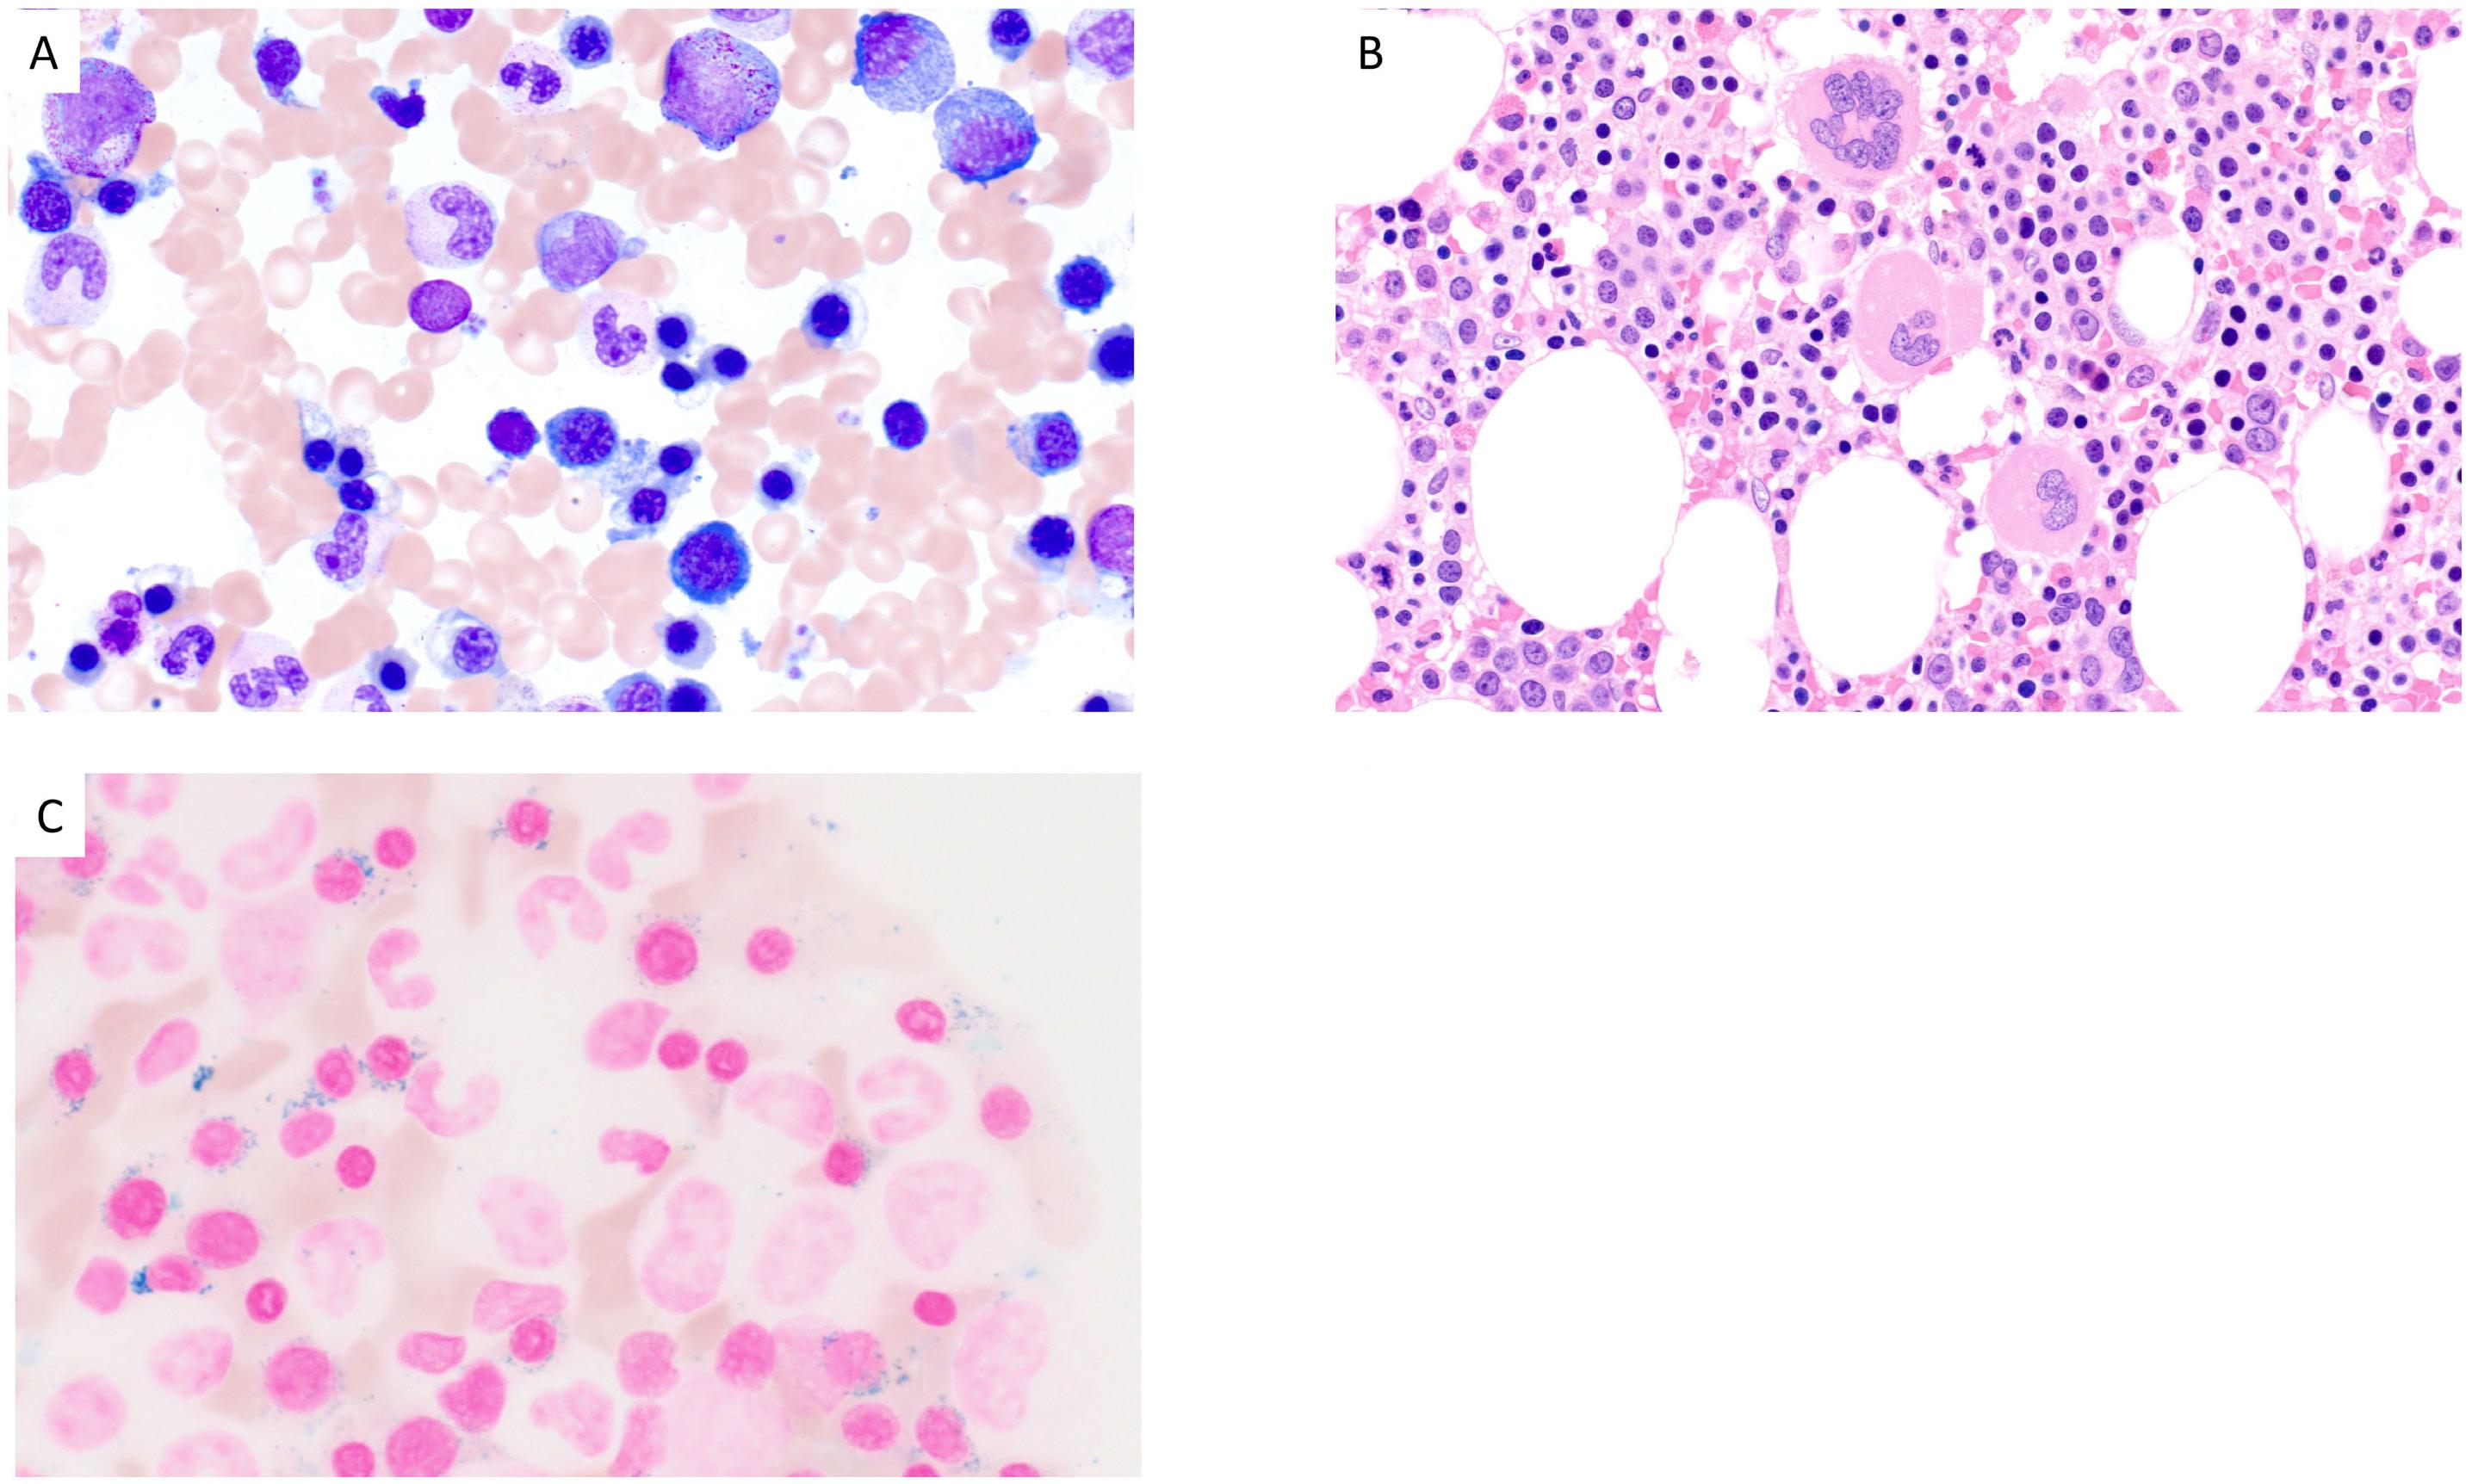
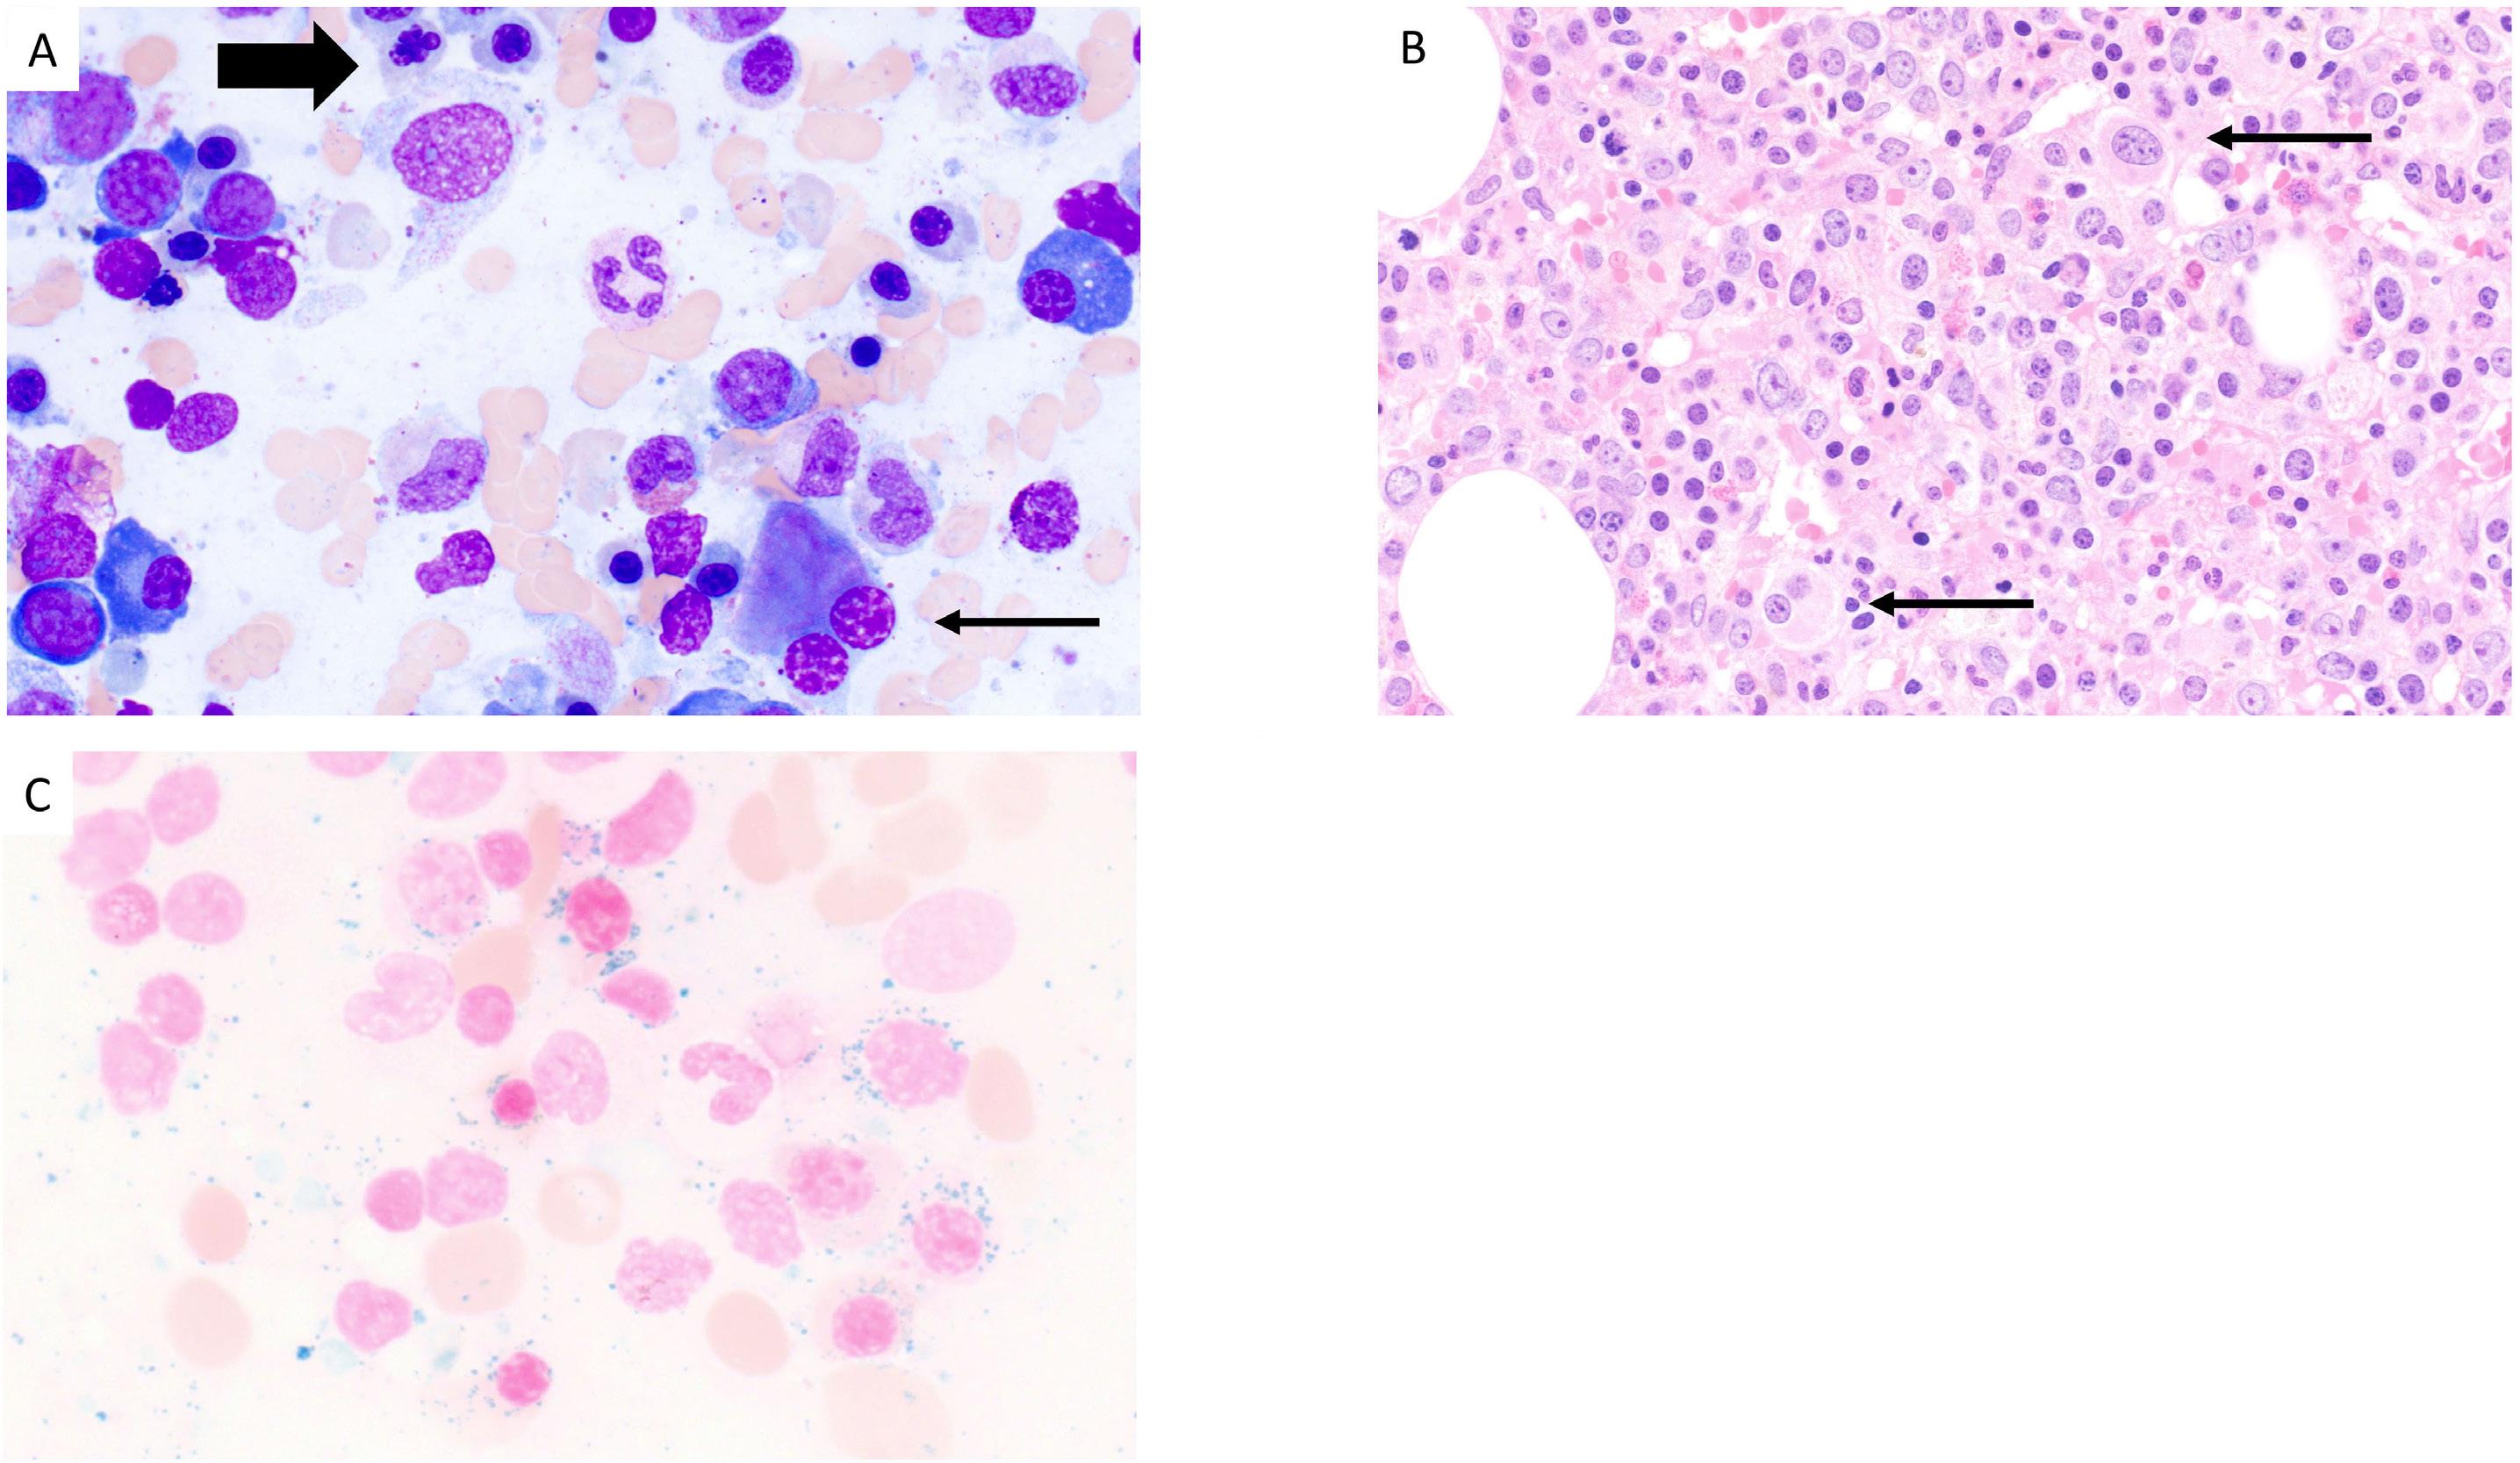
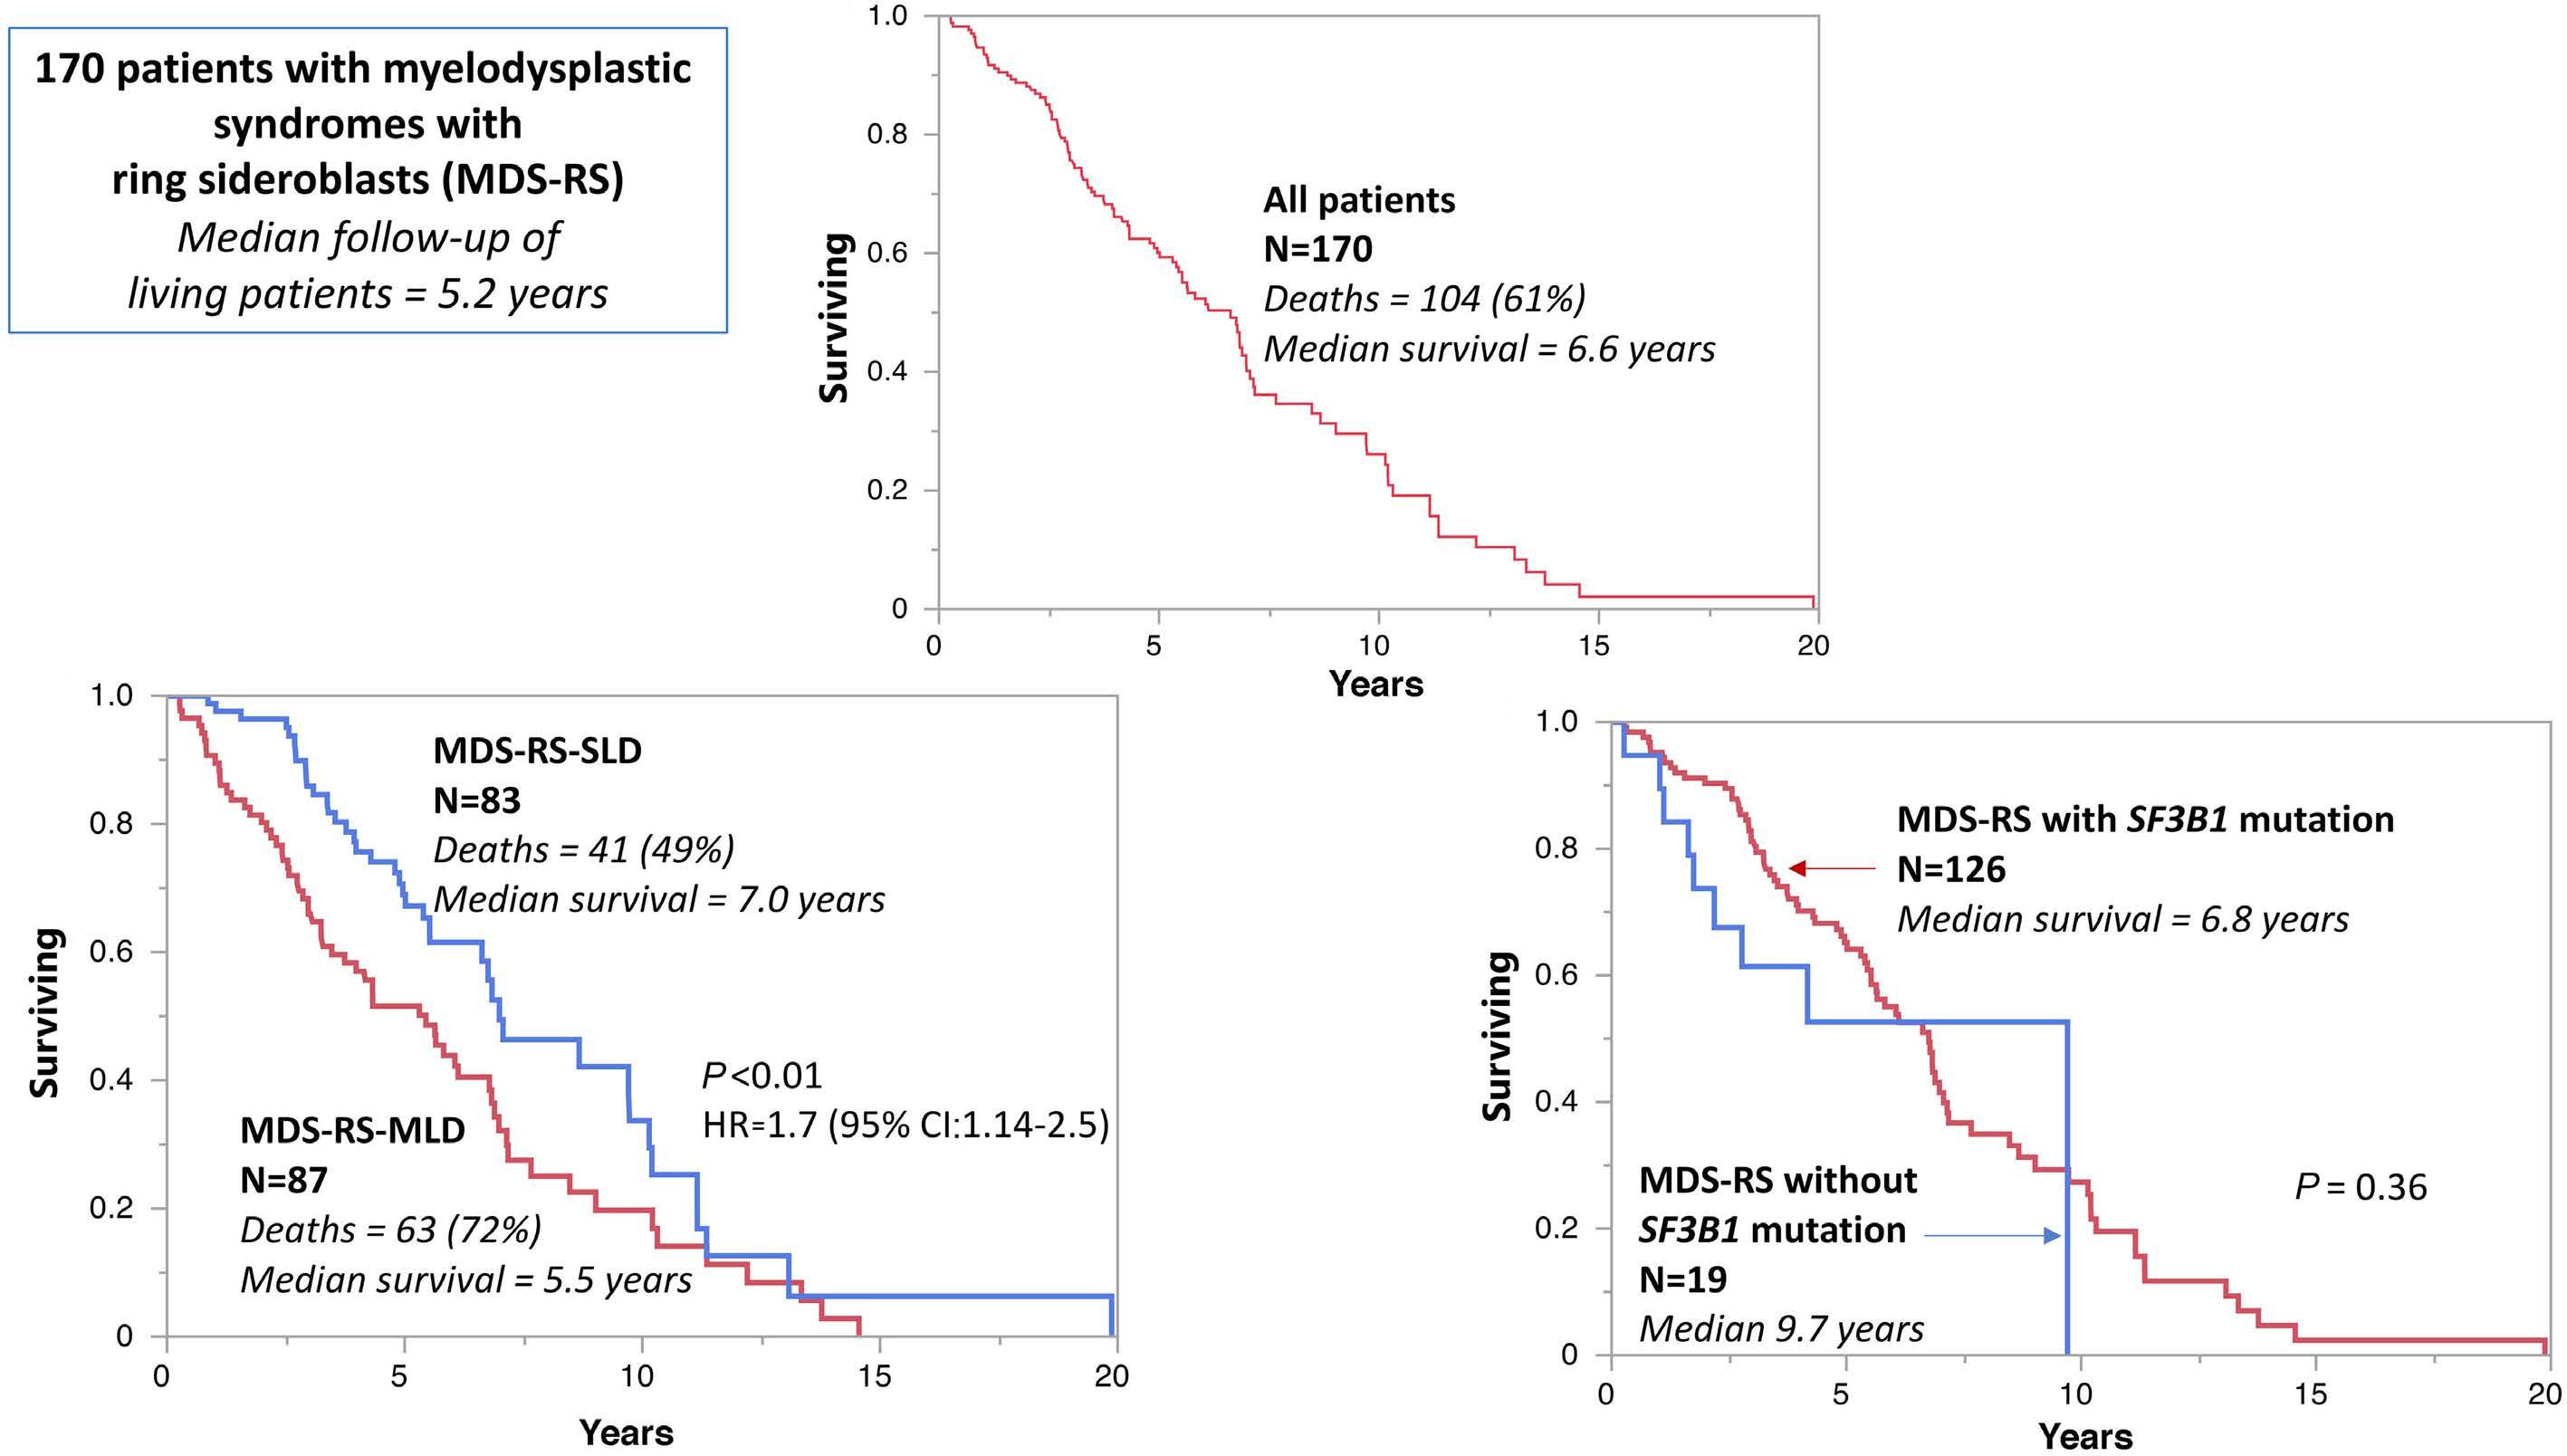
2525 Prognostic impact of SF3B1 mutation and multilineage dysplasia in myelodysplastic syndromes with ring sideroblasts: a Mayo Clinic study of 170 informative cases
F. Farrukh et al.
https://doi.org/10.3324/haematol.2023.284719
Myeloproliferative Disorders
2533 LNK/SH2B3 as a novel driver in juvenile myelomonocytic leukemia
A. Wintering et al.
https://doi.org/10.3324/haematol.2023.283776
Myeloproliferative Disorders
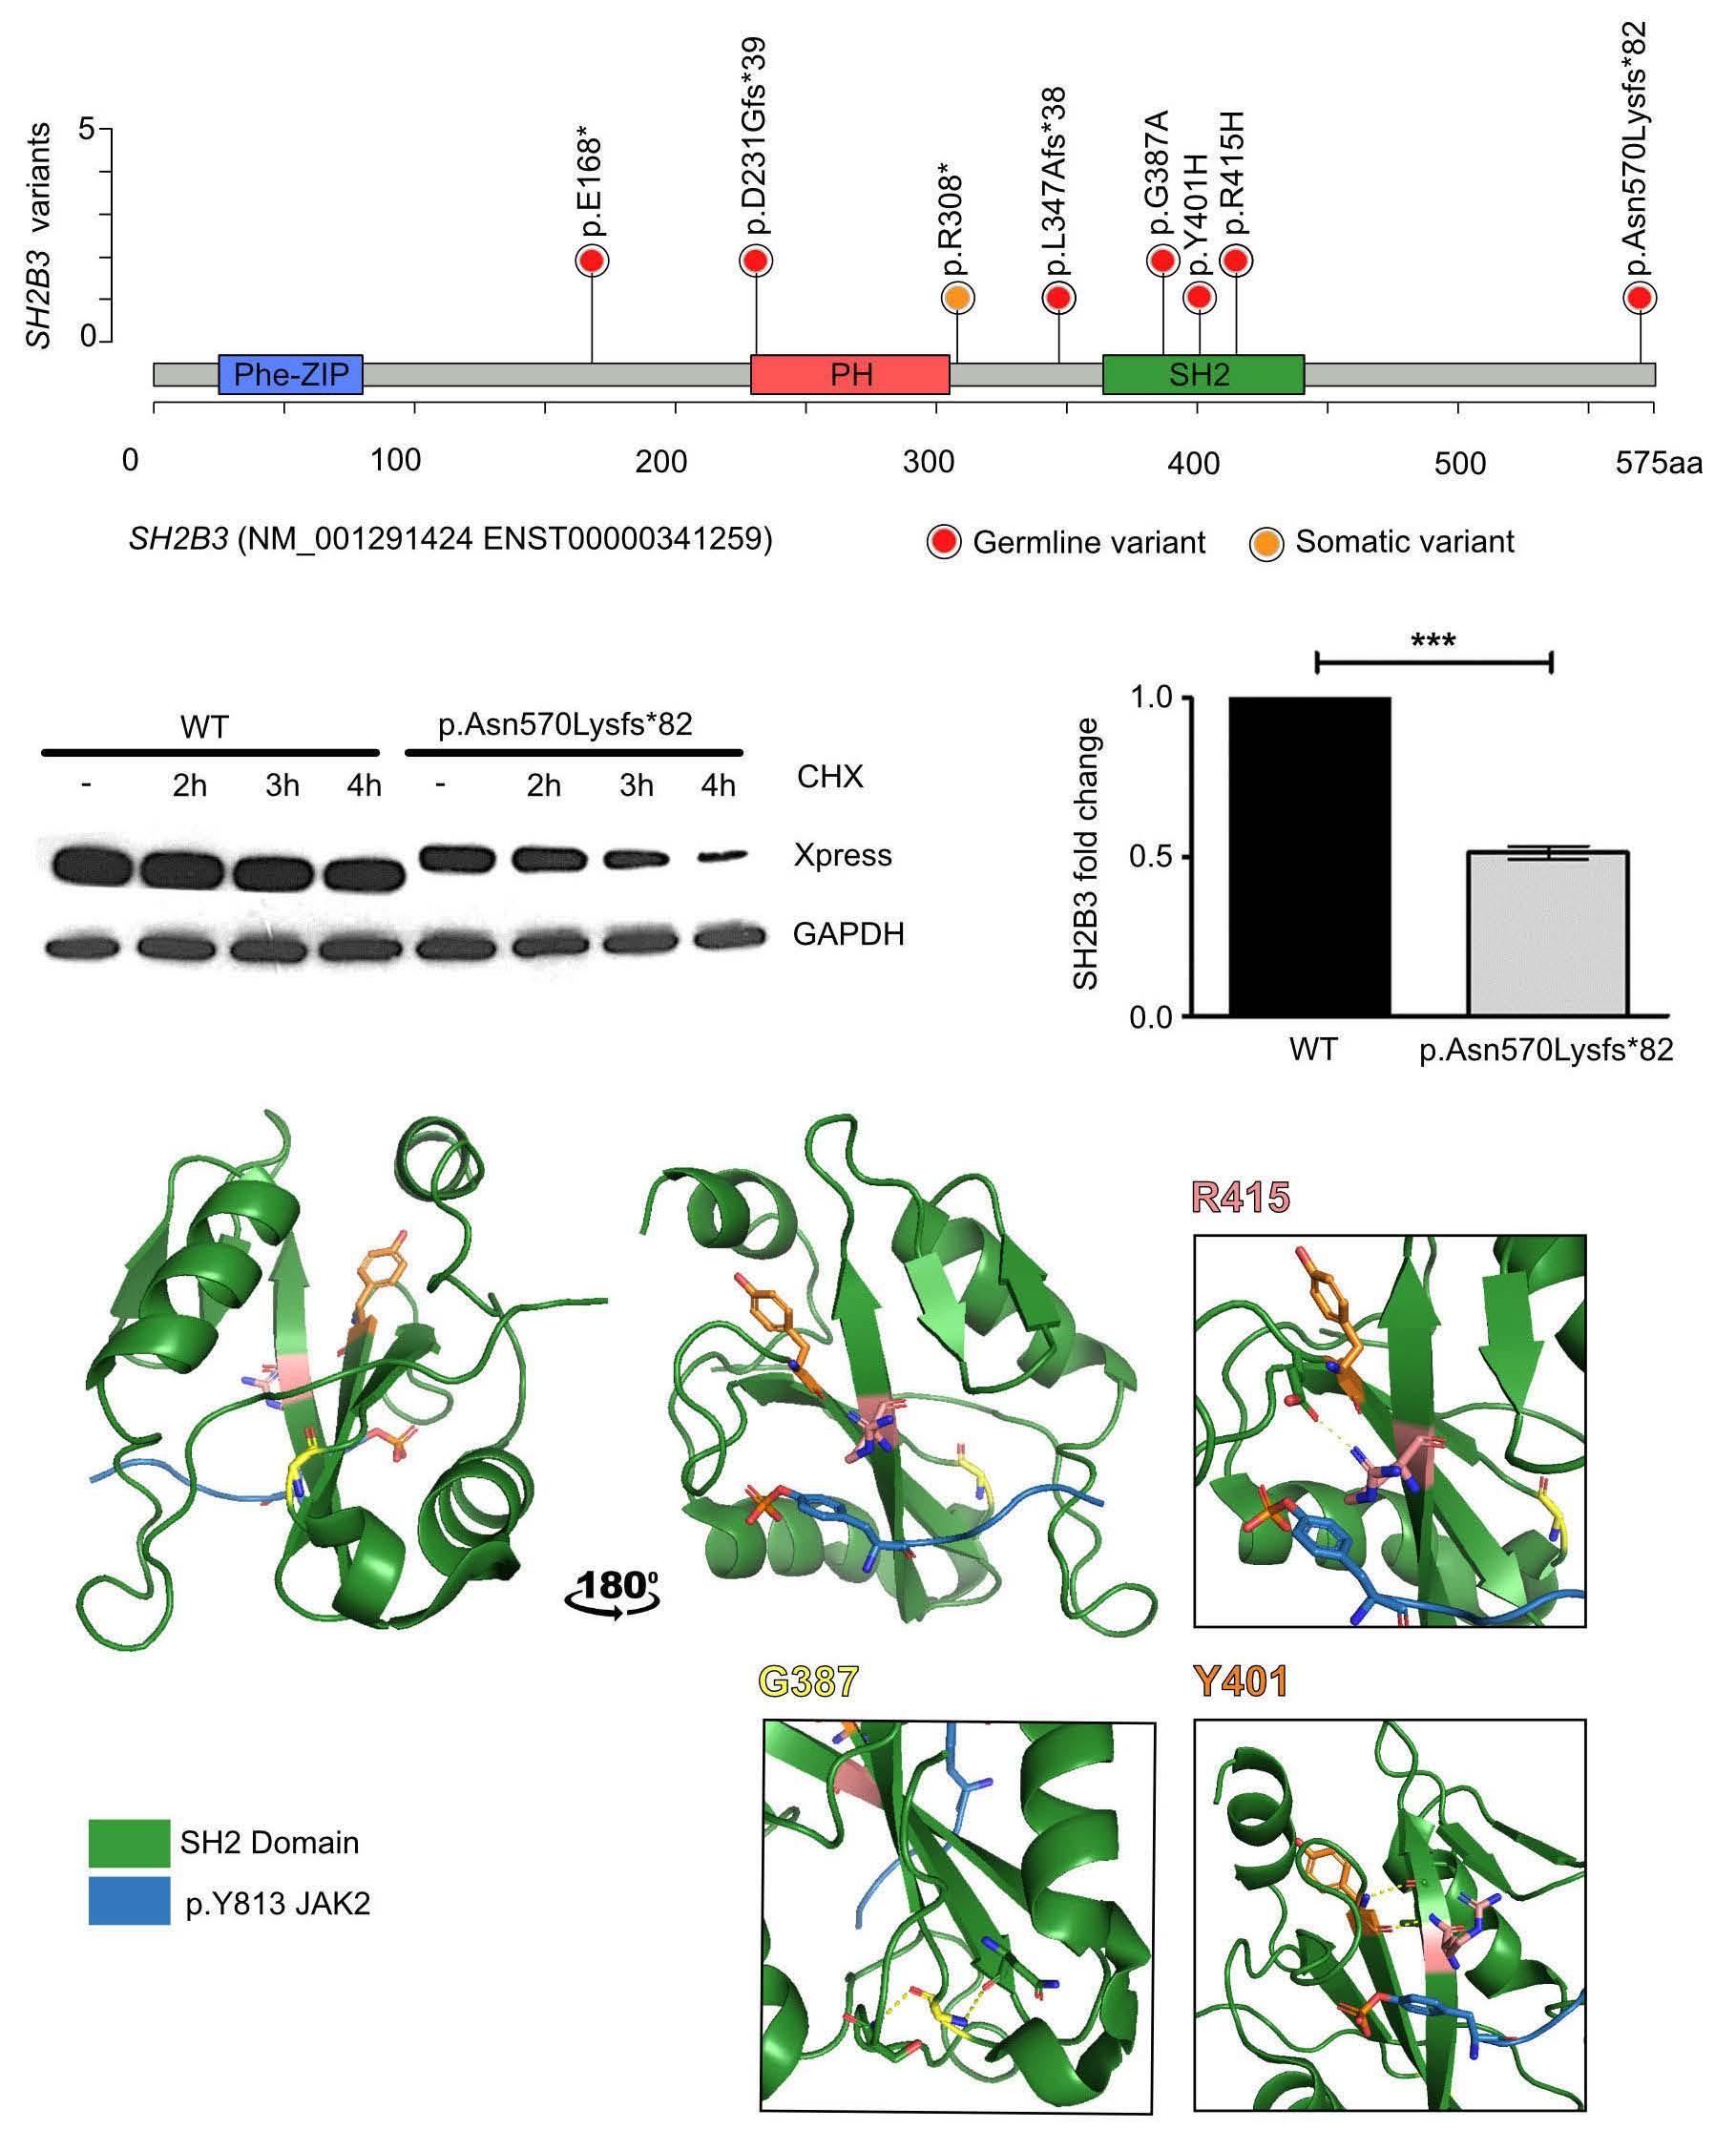
2542 Germline bi-allelic SH2B3/LNK alteration predisposes to a neonatal juvenile myelomonocytic leukemia-like disorder
C. Arfeuille et al.
https://doi.org/10.3324/haematol.2023.283917
Myeloproliferative Disorders
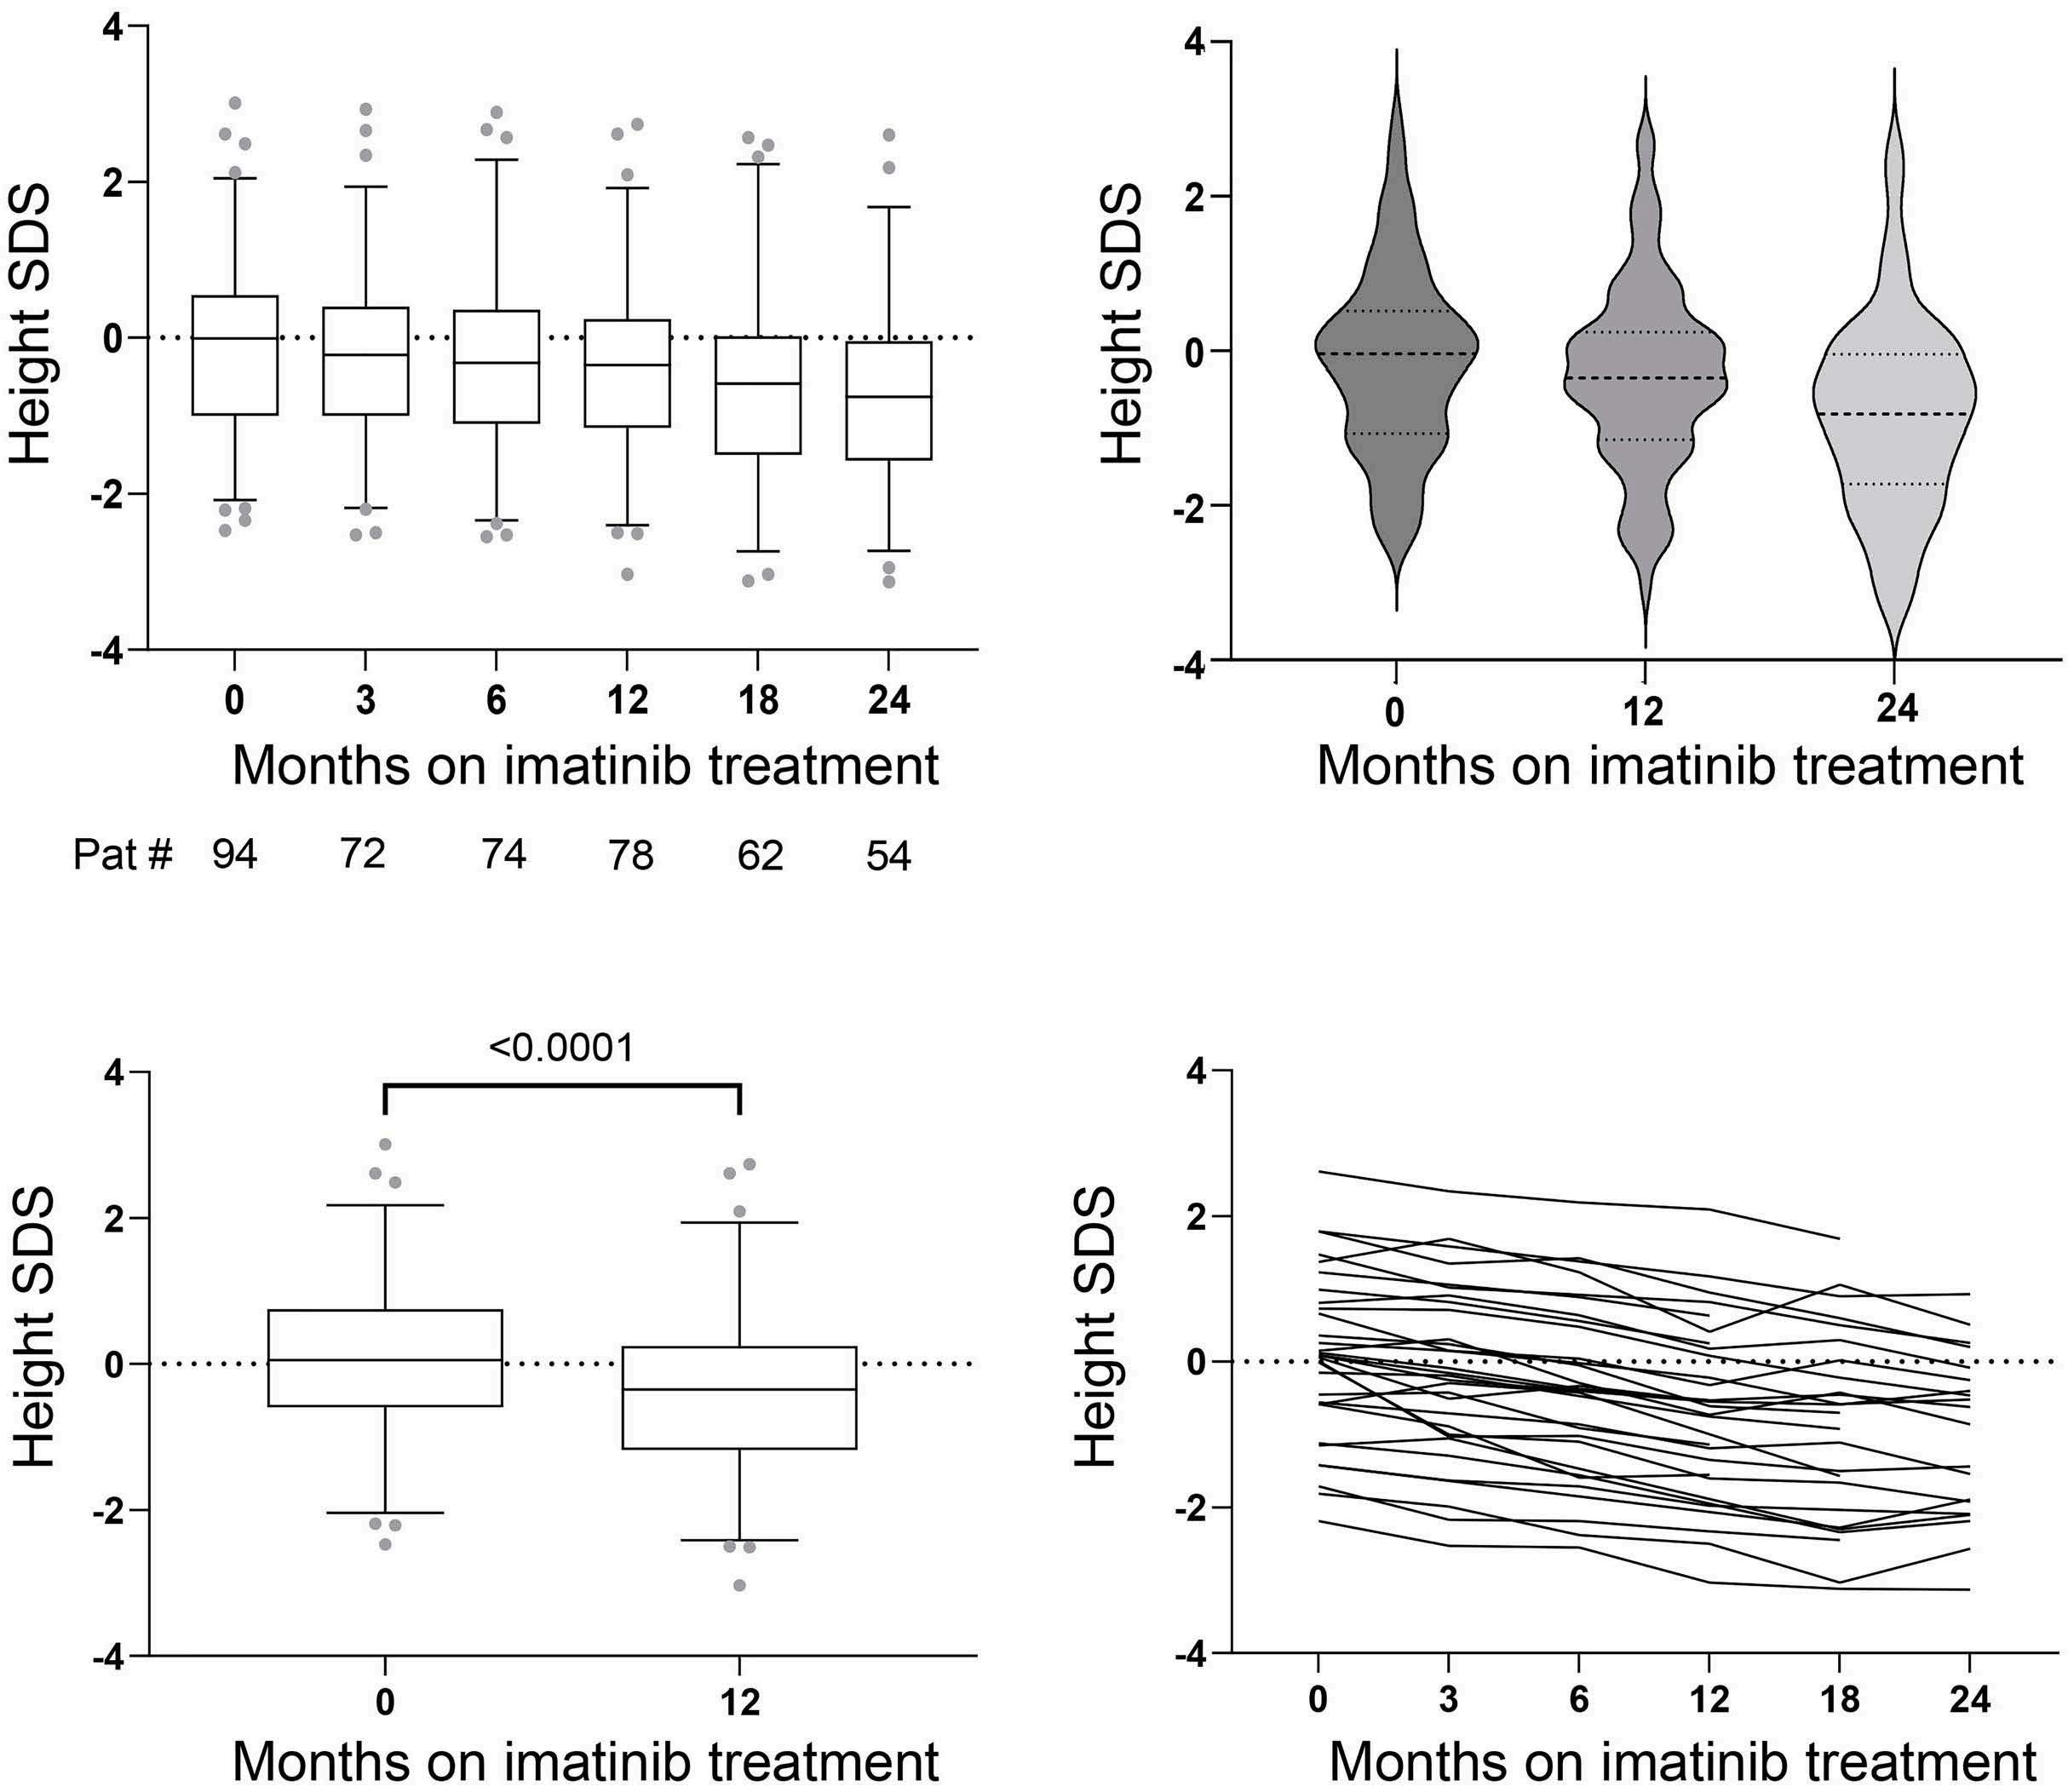
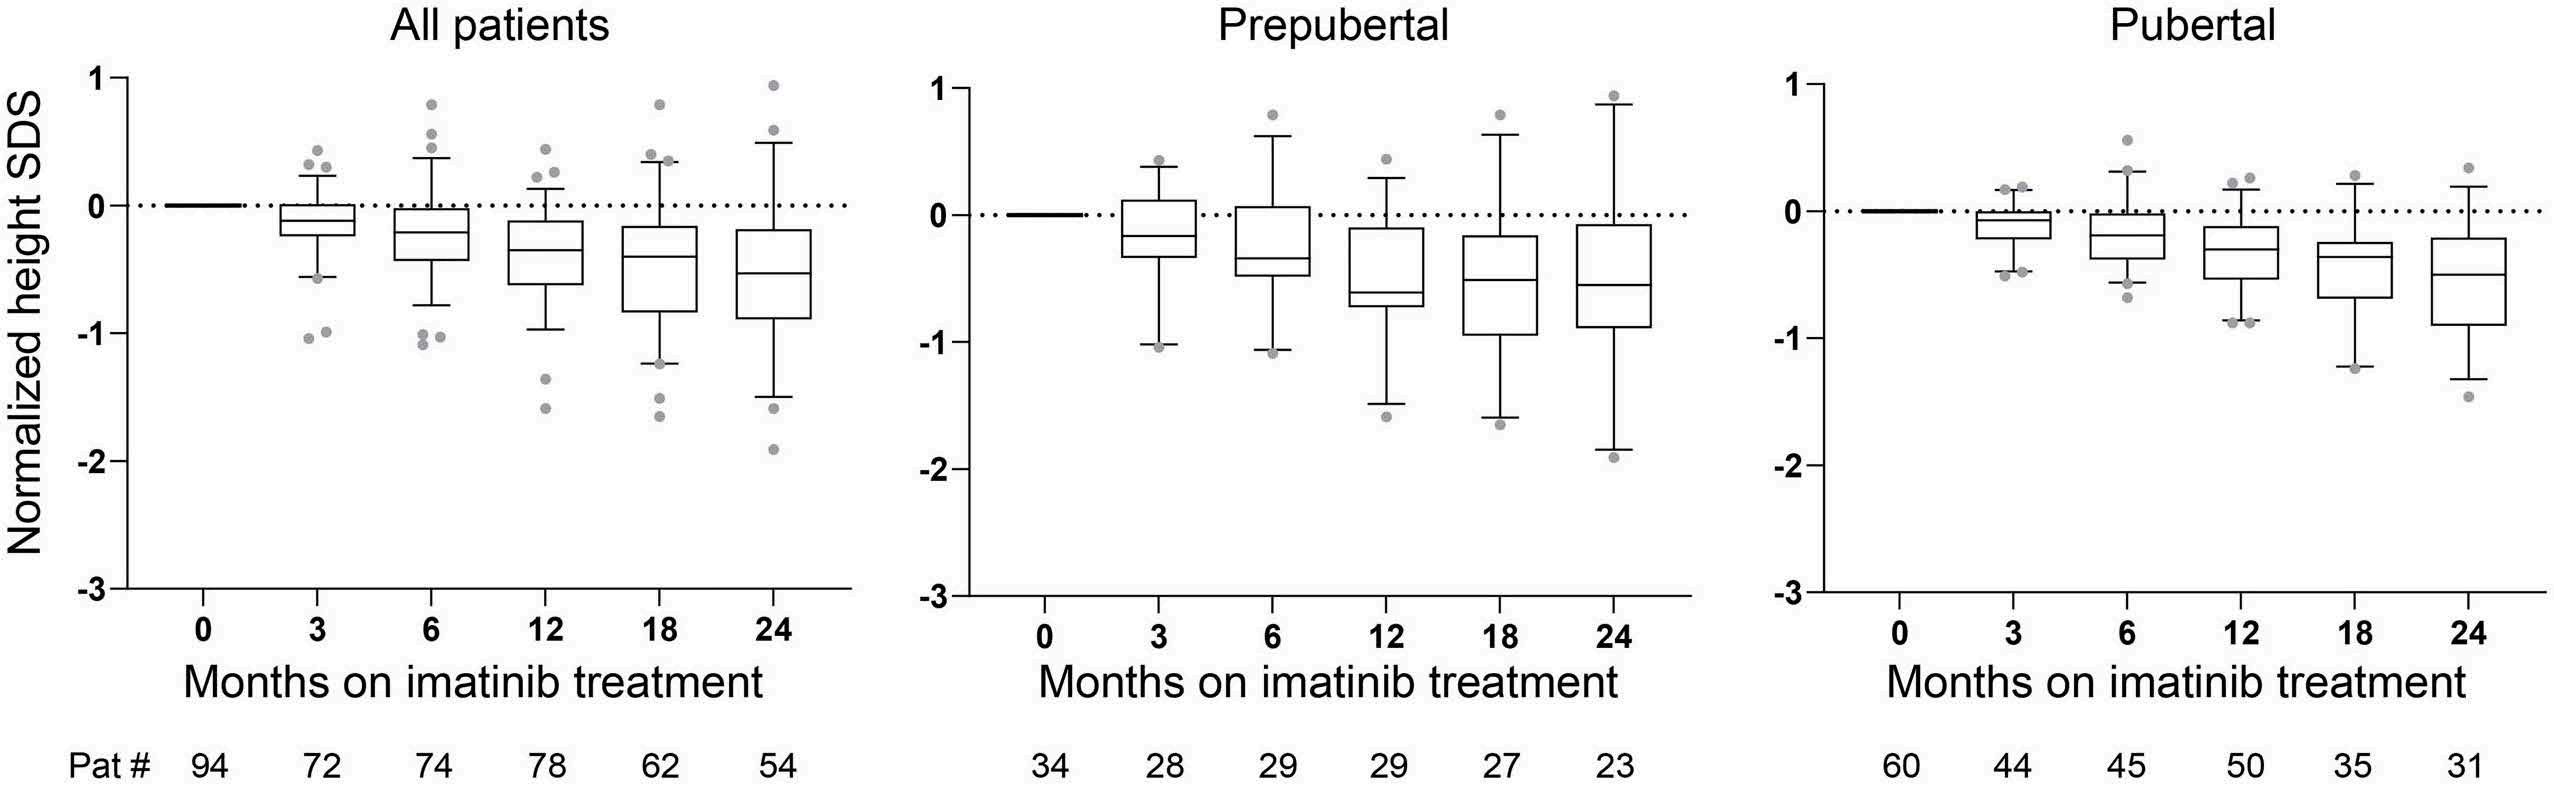
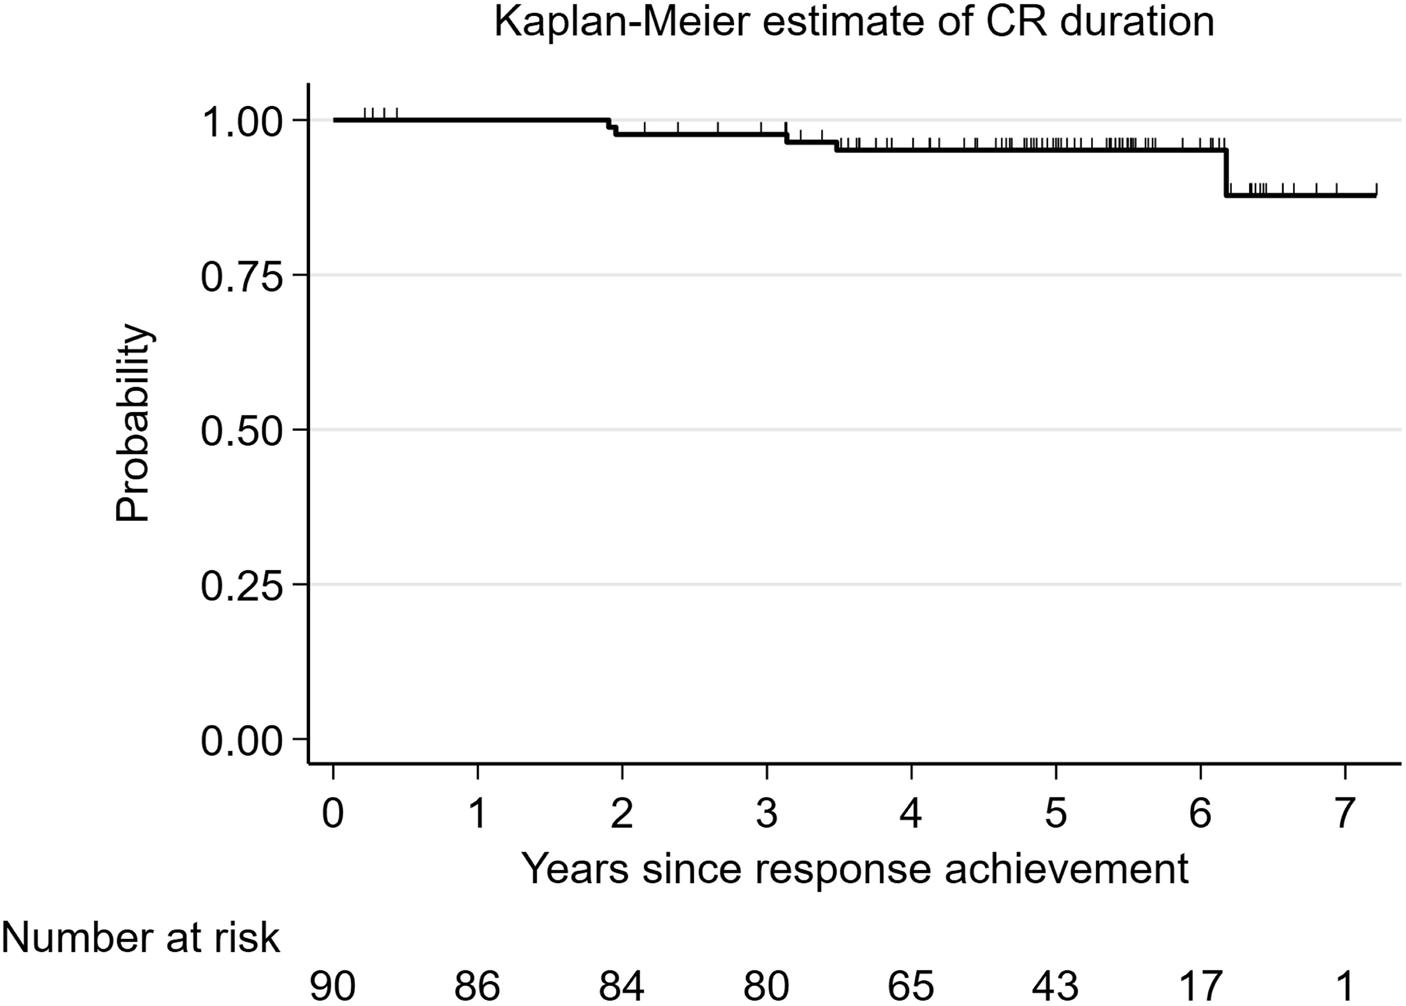
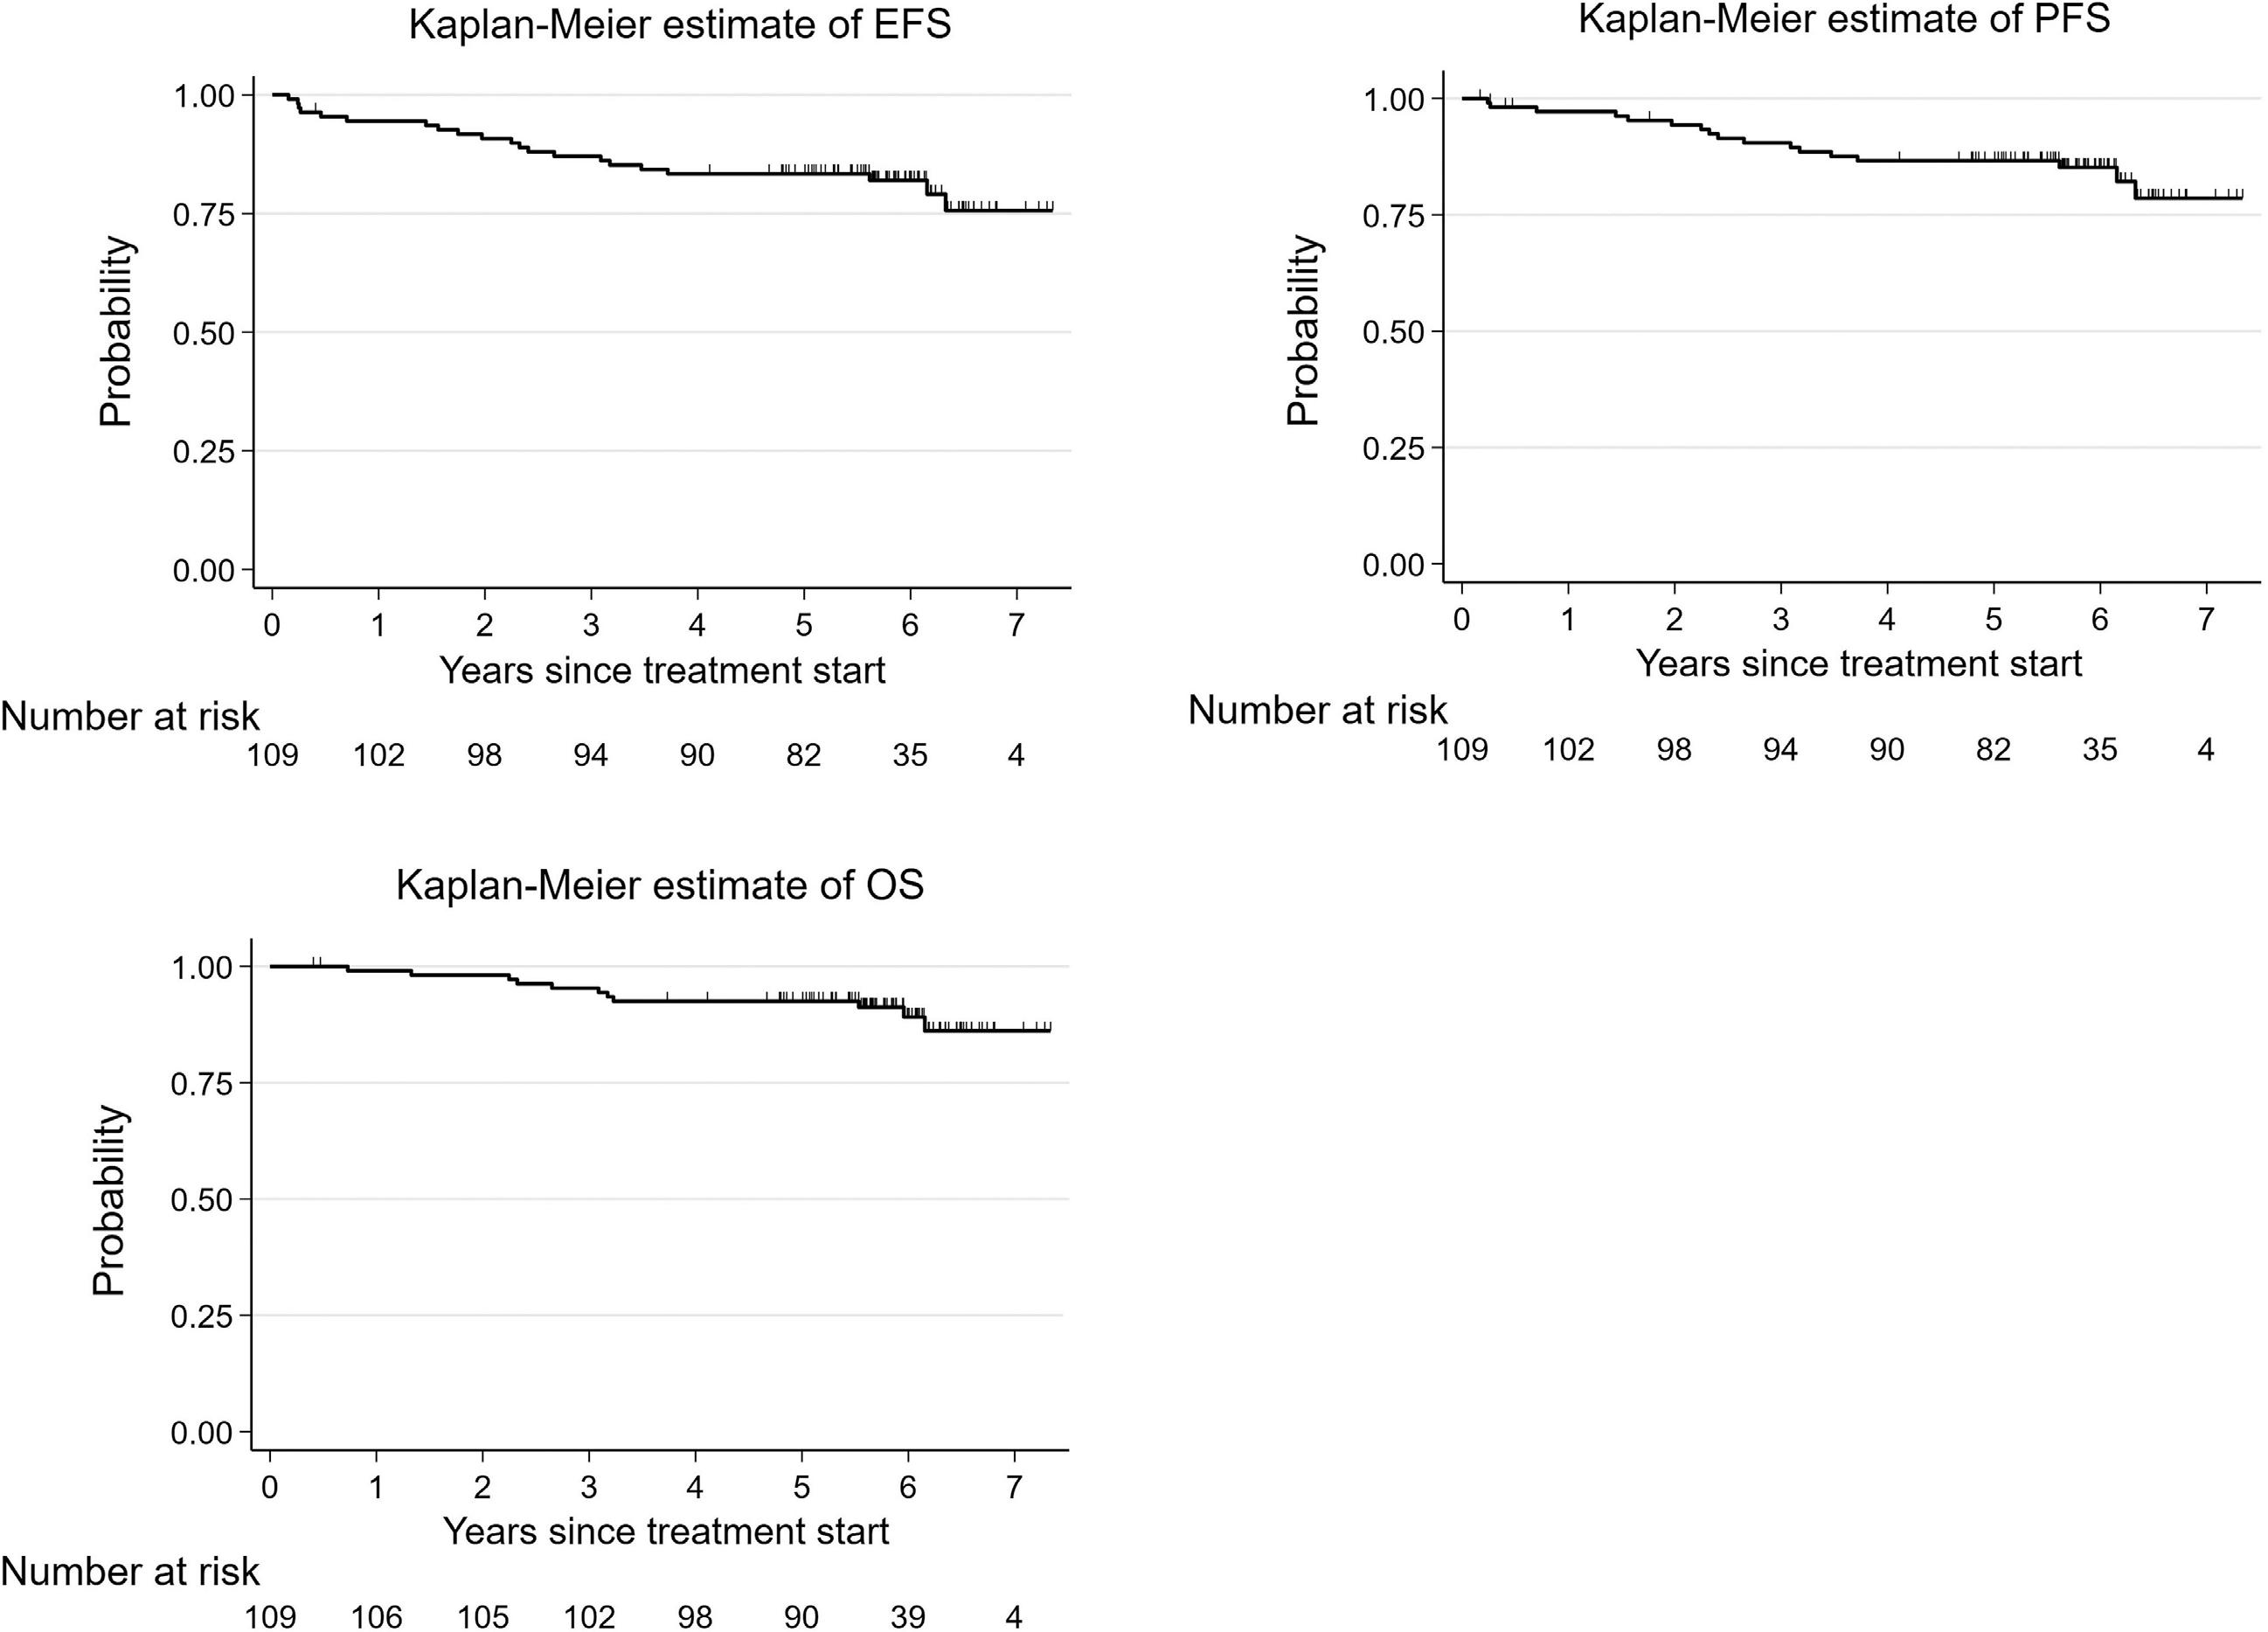
2555 Imatinib treatment and longitudinal growth in pediatric patients with chronic myeloid leukemia: influence of demographic, pharmacological, and genetic factors in the German CML-PAED cohort
S. Stiehler et al.
https://doi.org/10.3324/haematol.2023.284668
Non-Hodgkin Lymphoma
2564 IELSG38: phase II trial of front-line chlorambucil plus subcutaneous rituximab induction and maintenance in mucosa-associated lymphoid tissue lymphoma
A. Stathis et al.
https://doi.org/10.3324/haematol.2023.283918
Non-Hodgkin Lymphoma
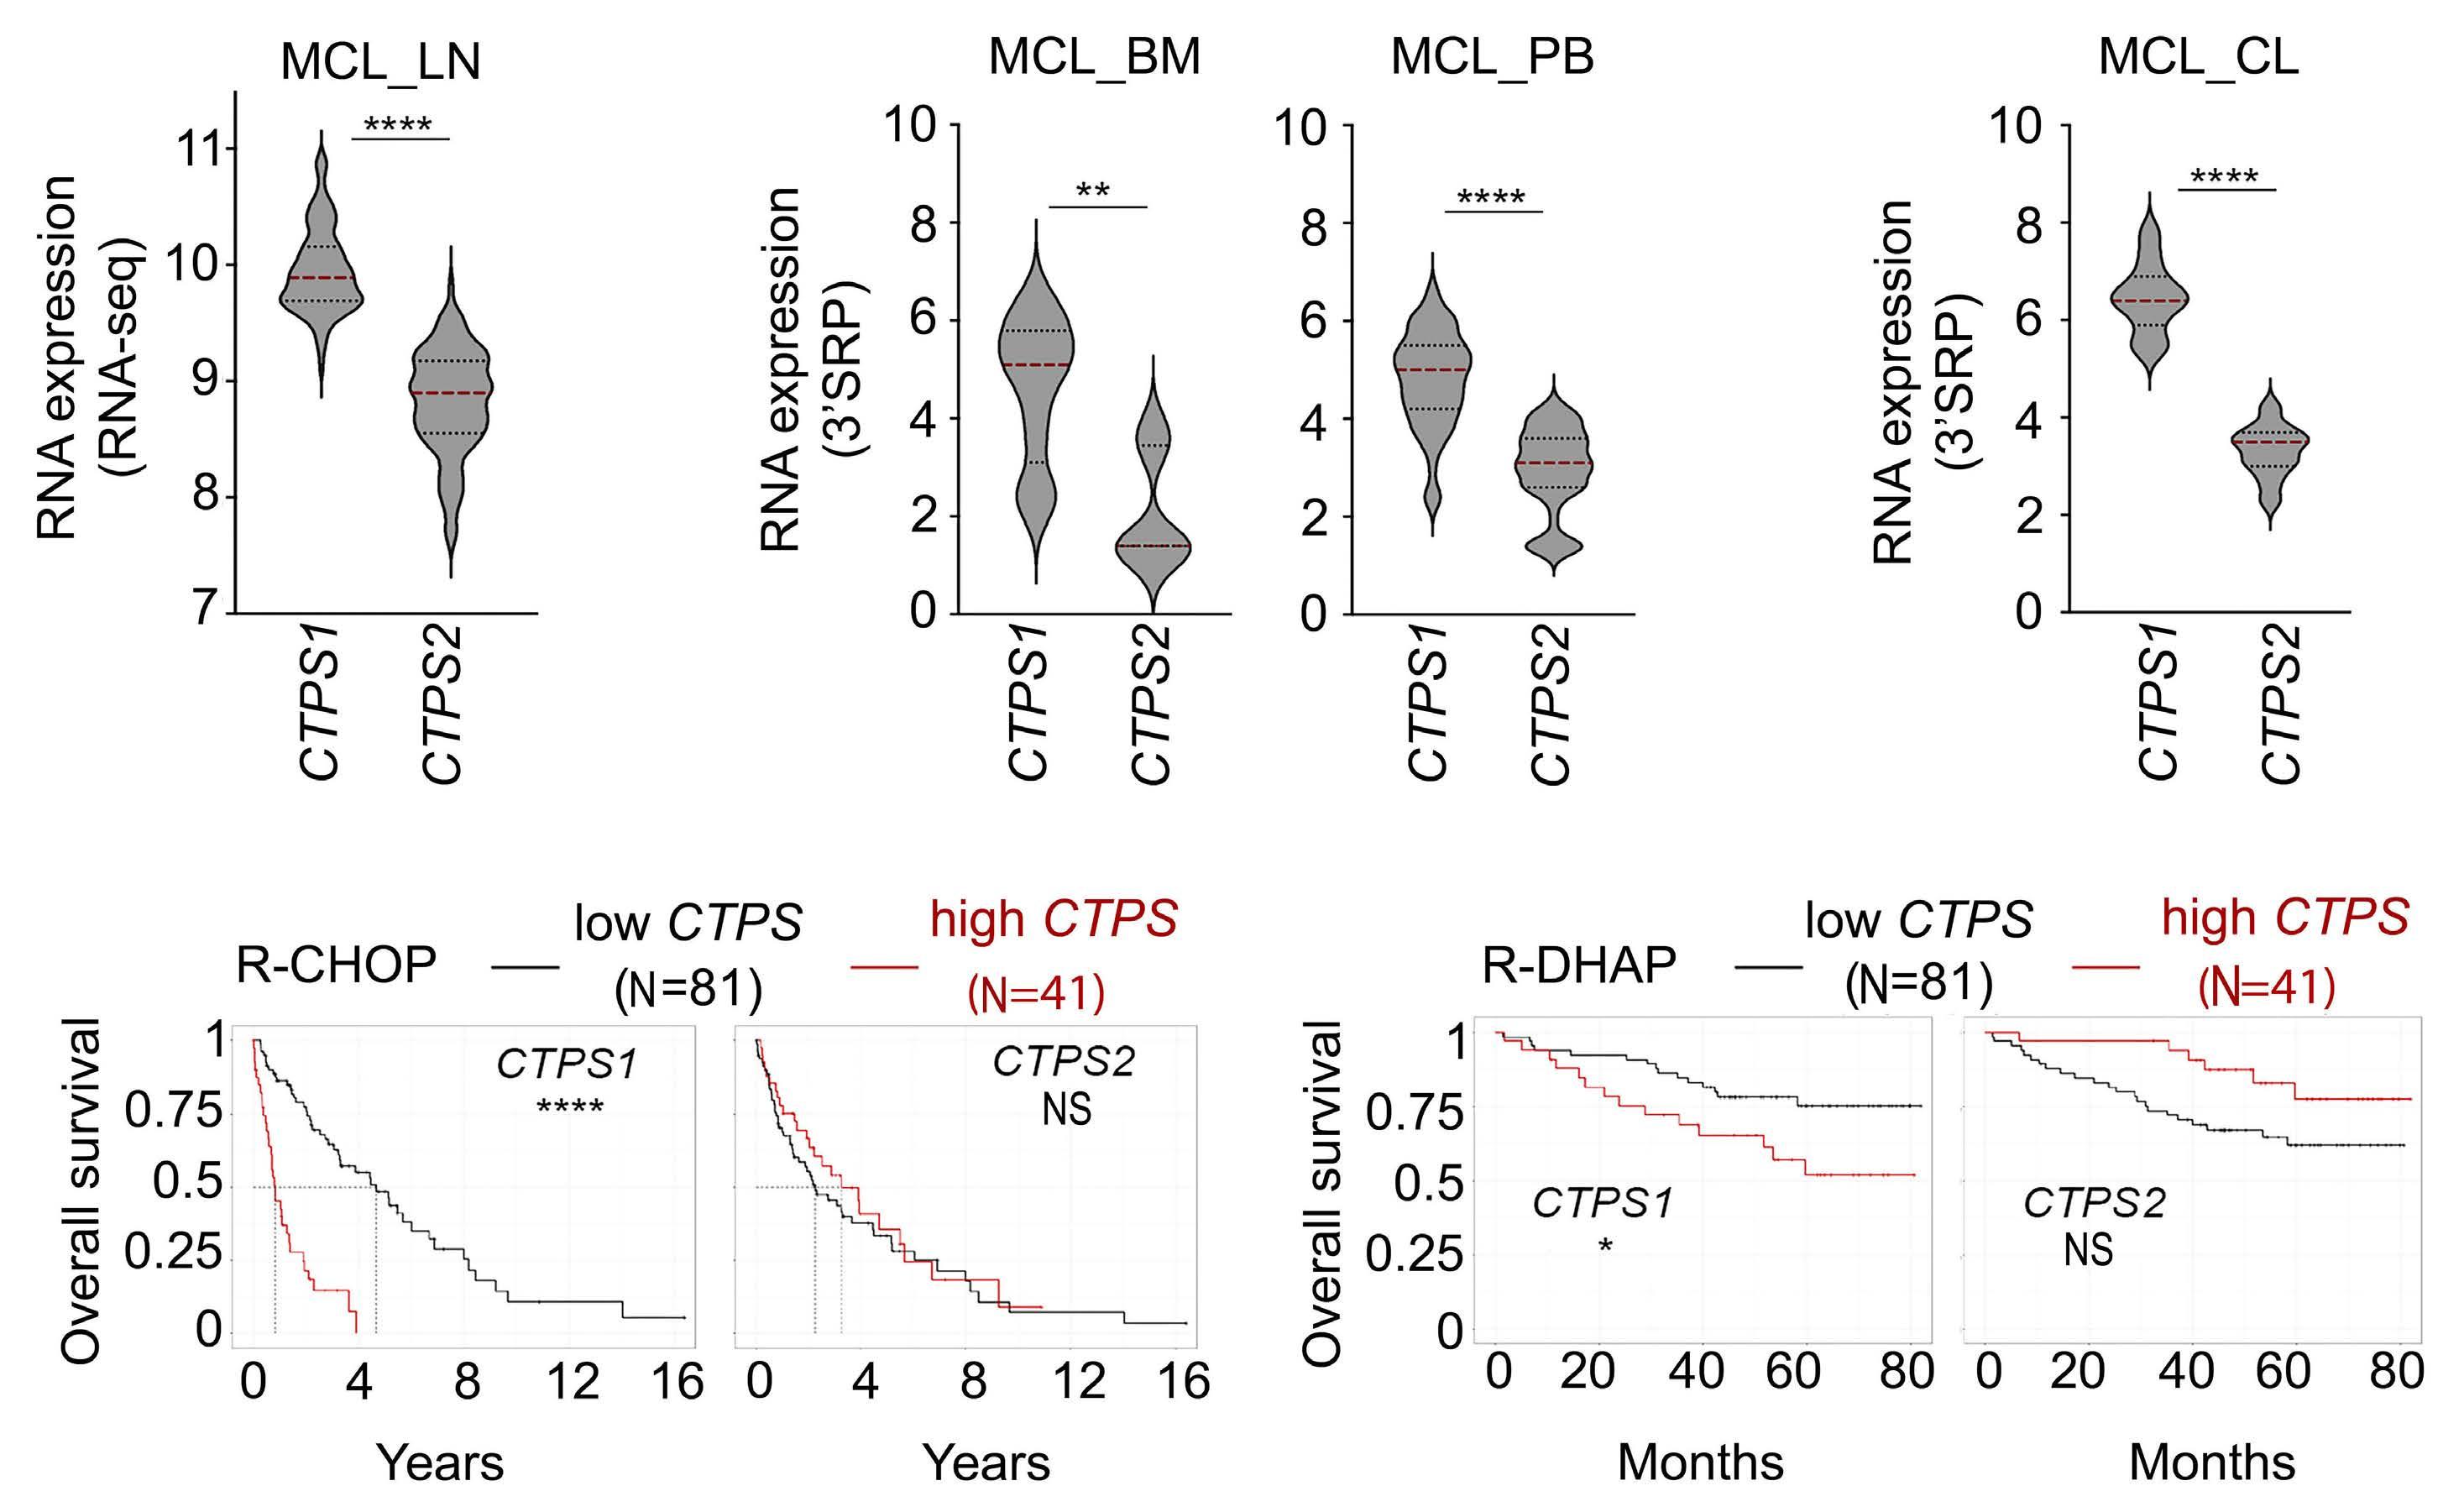
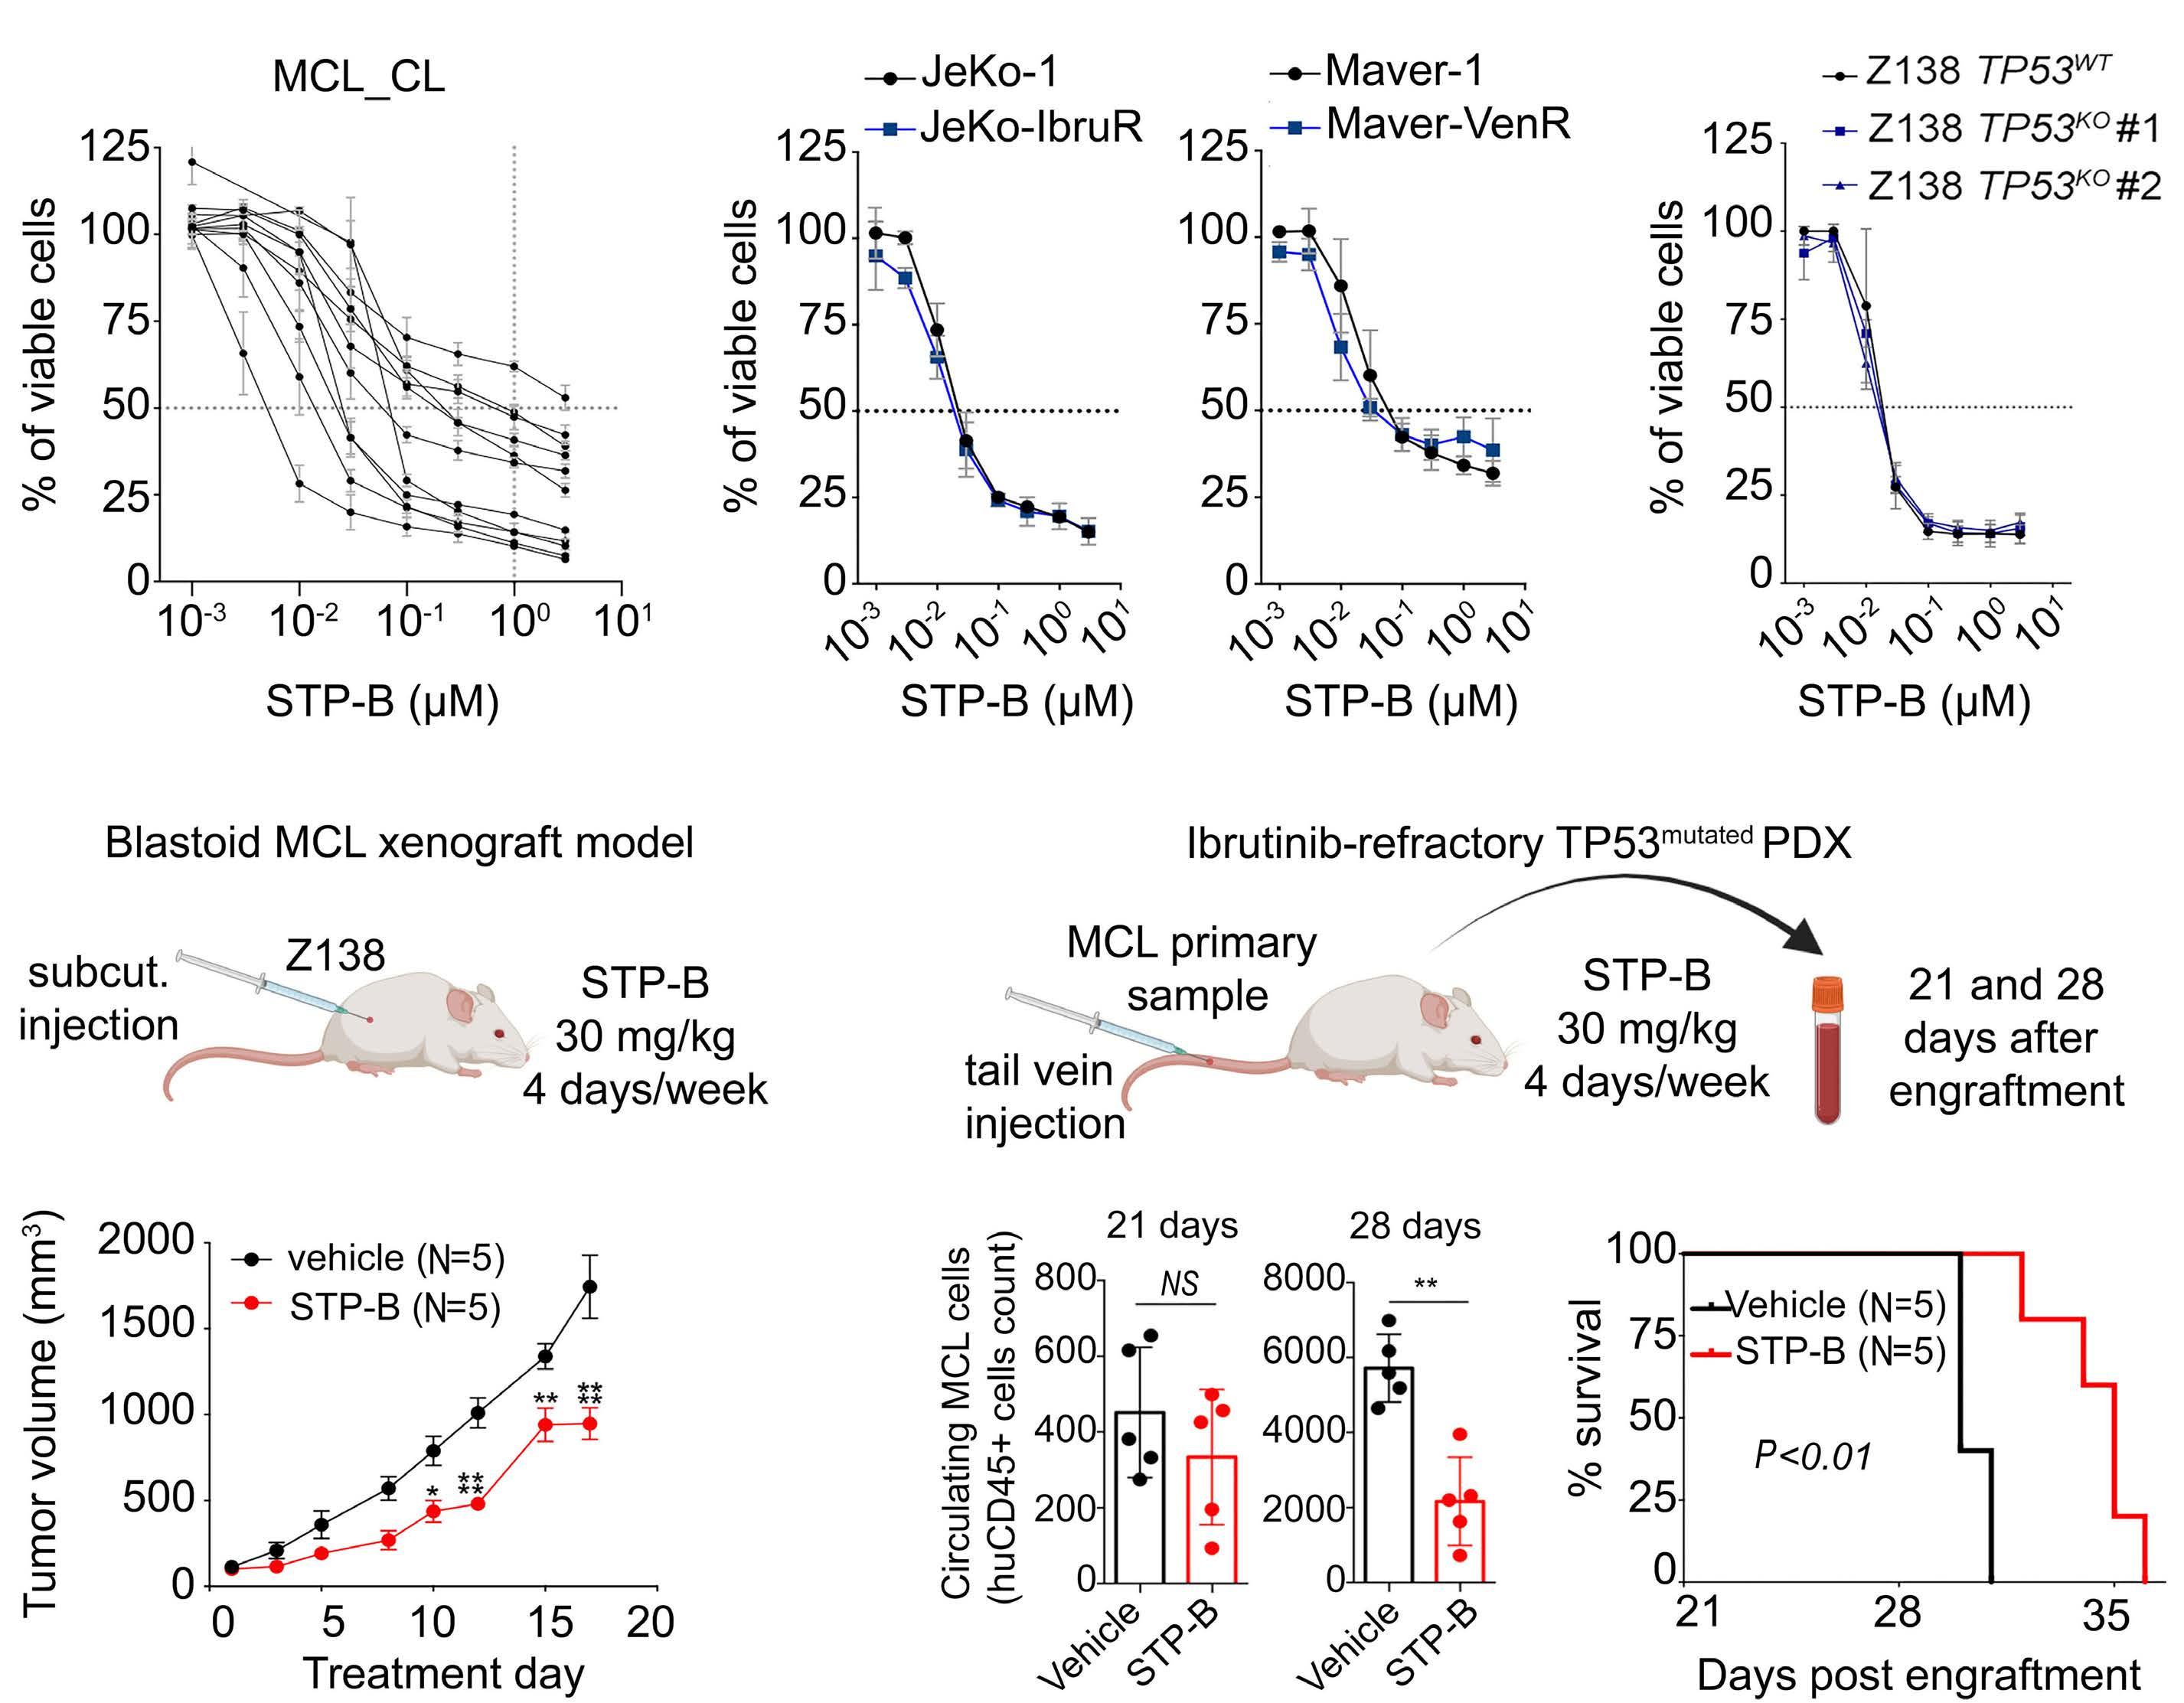
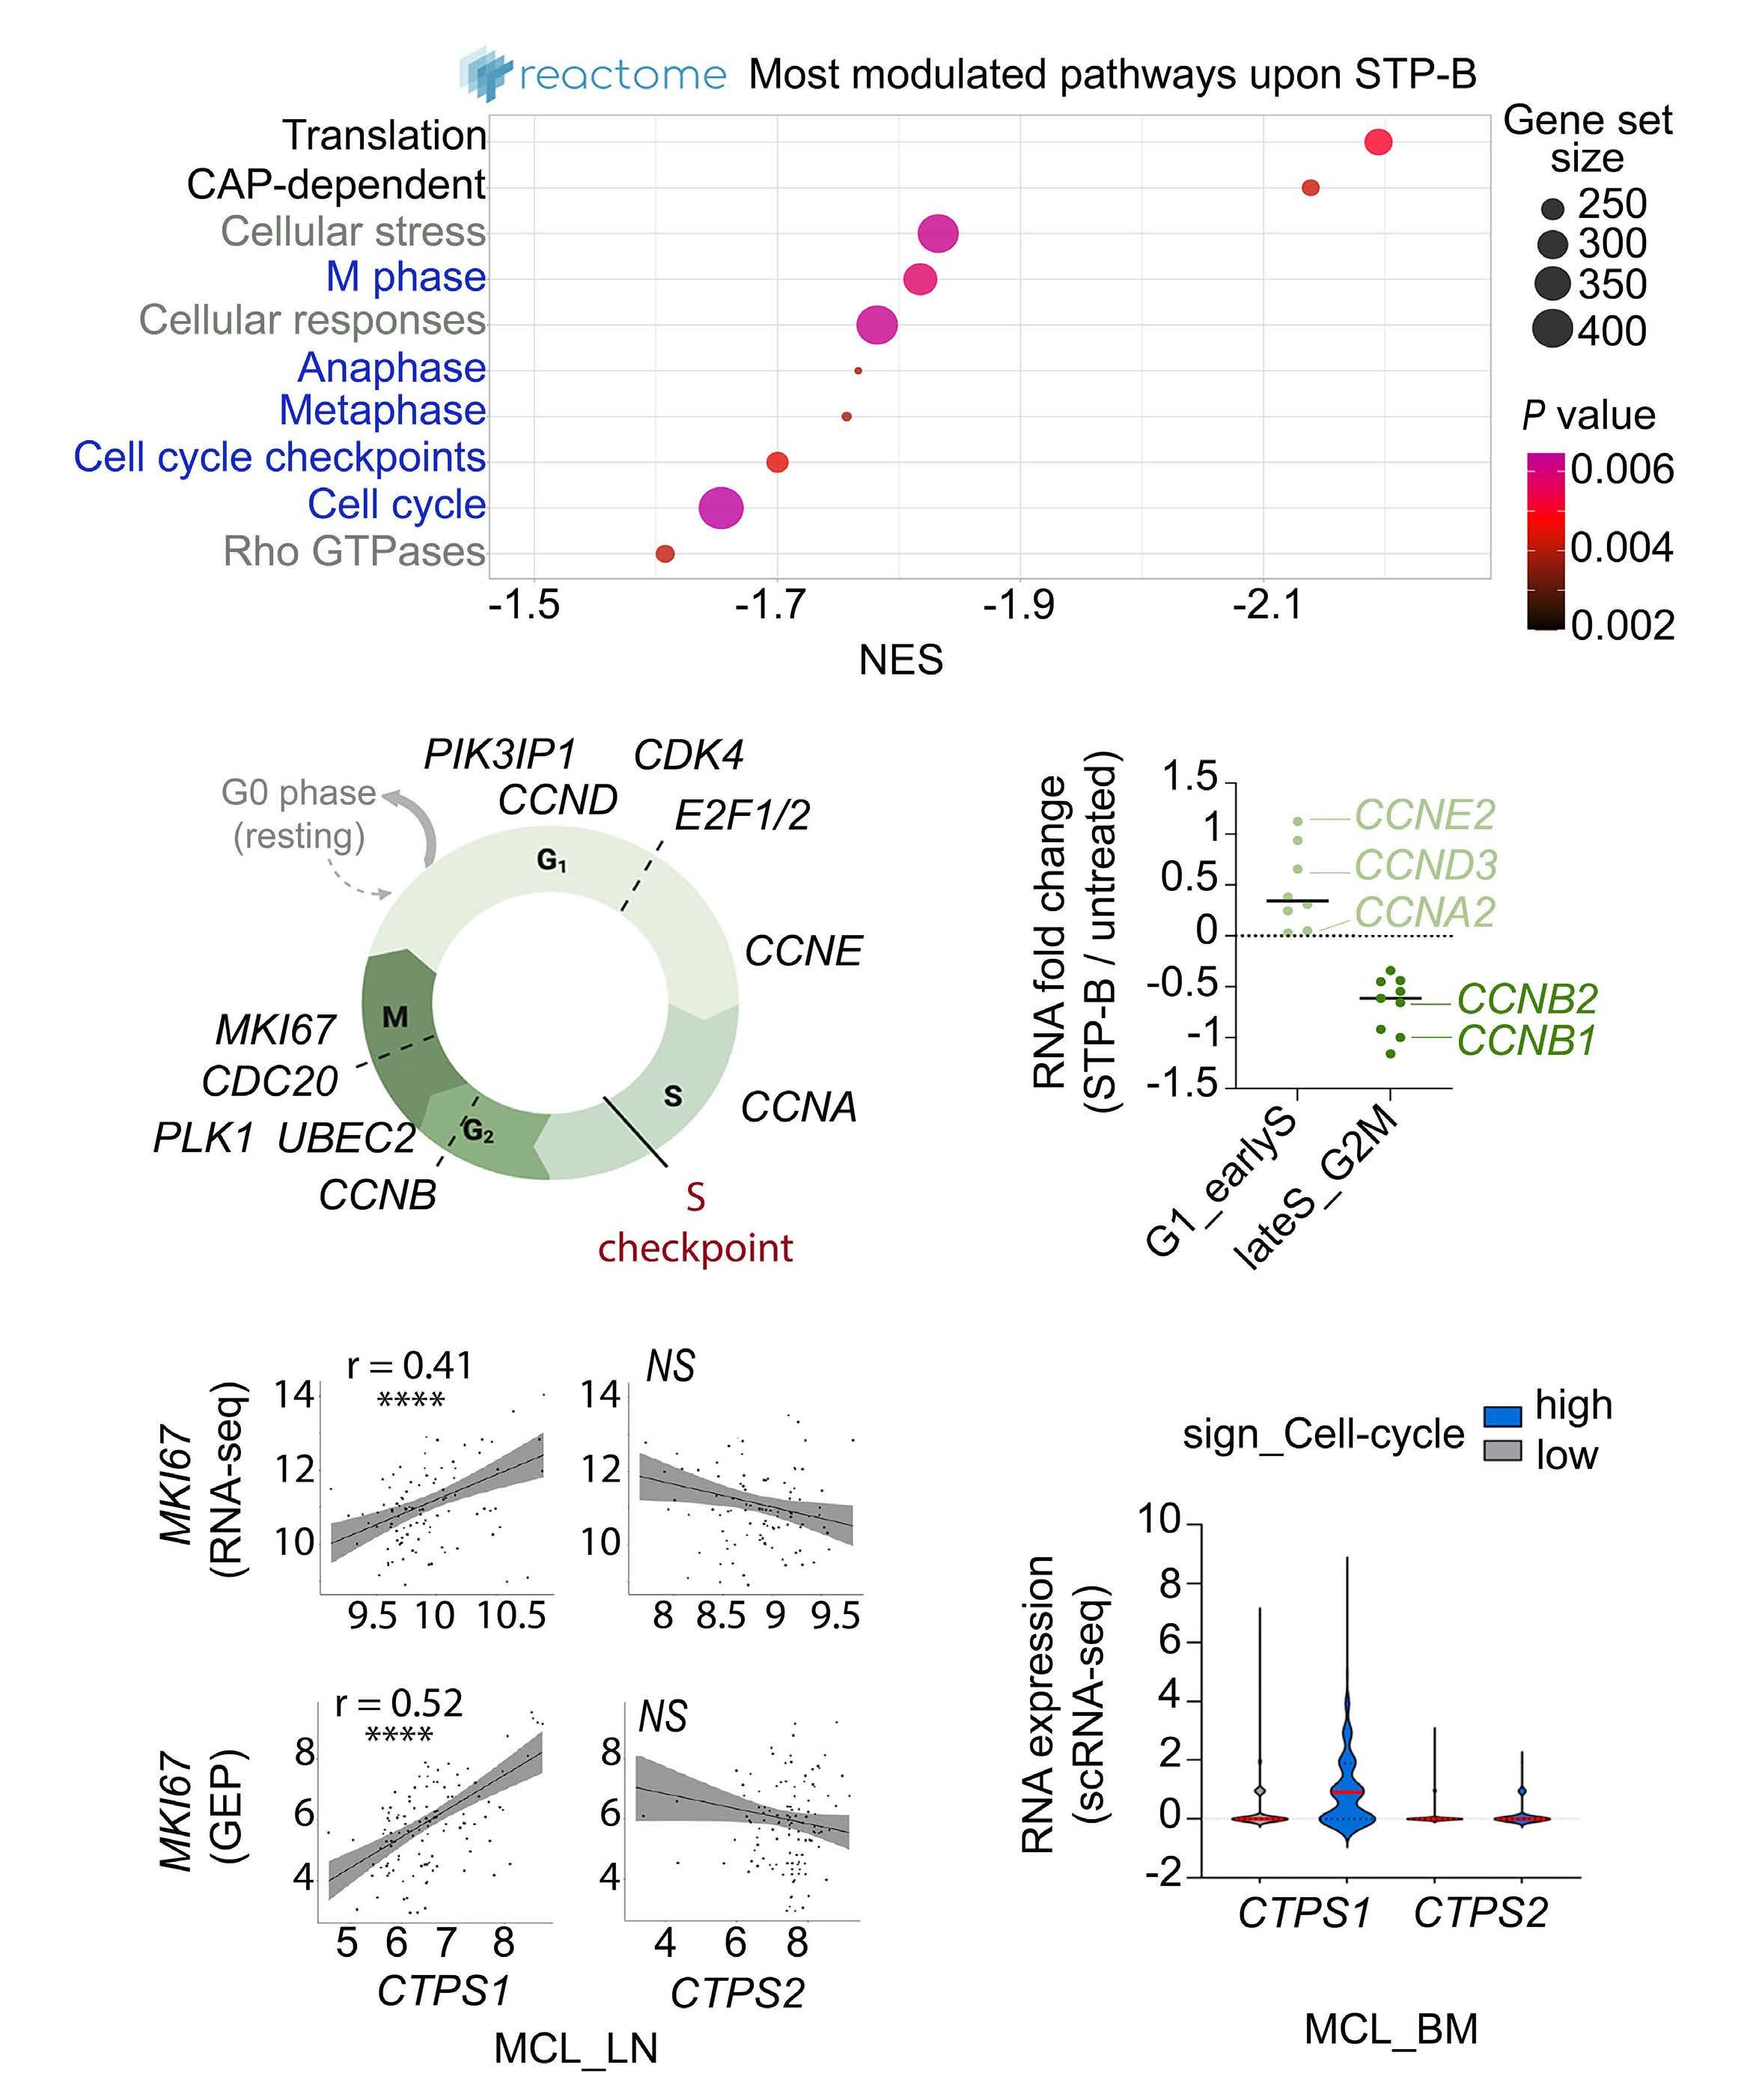
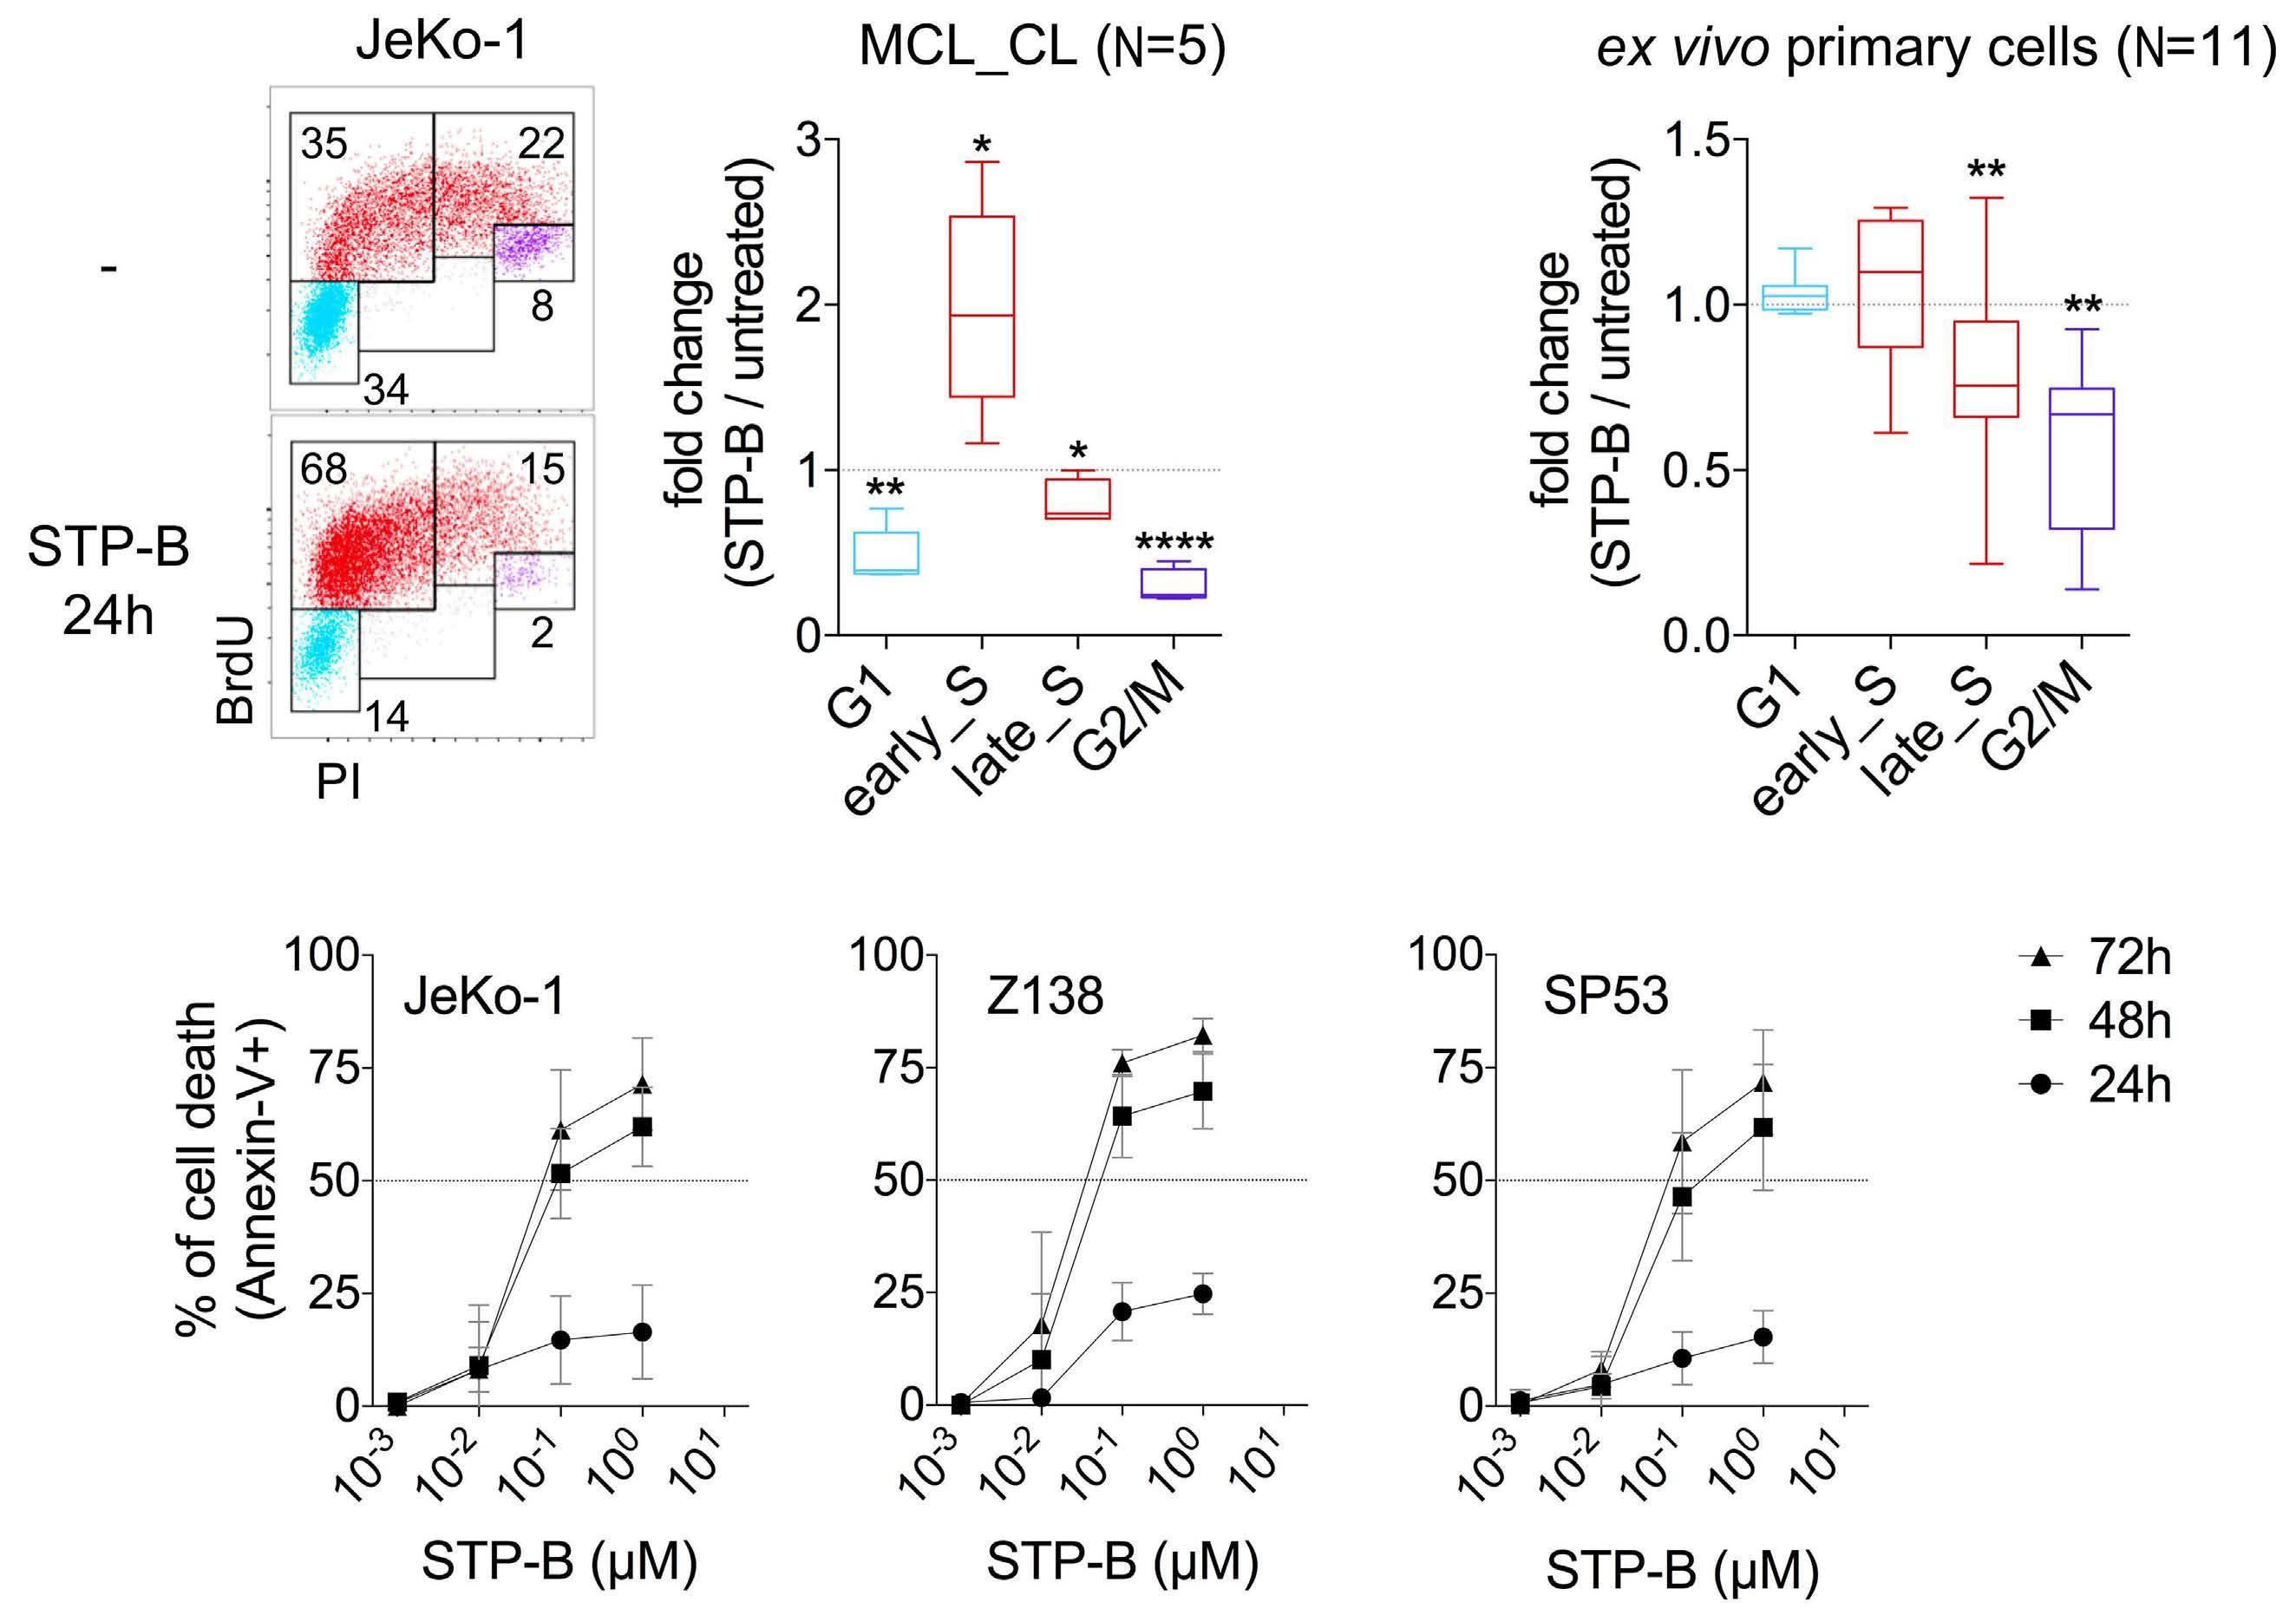
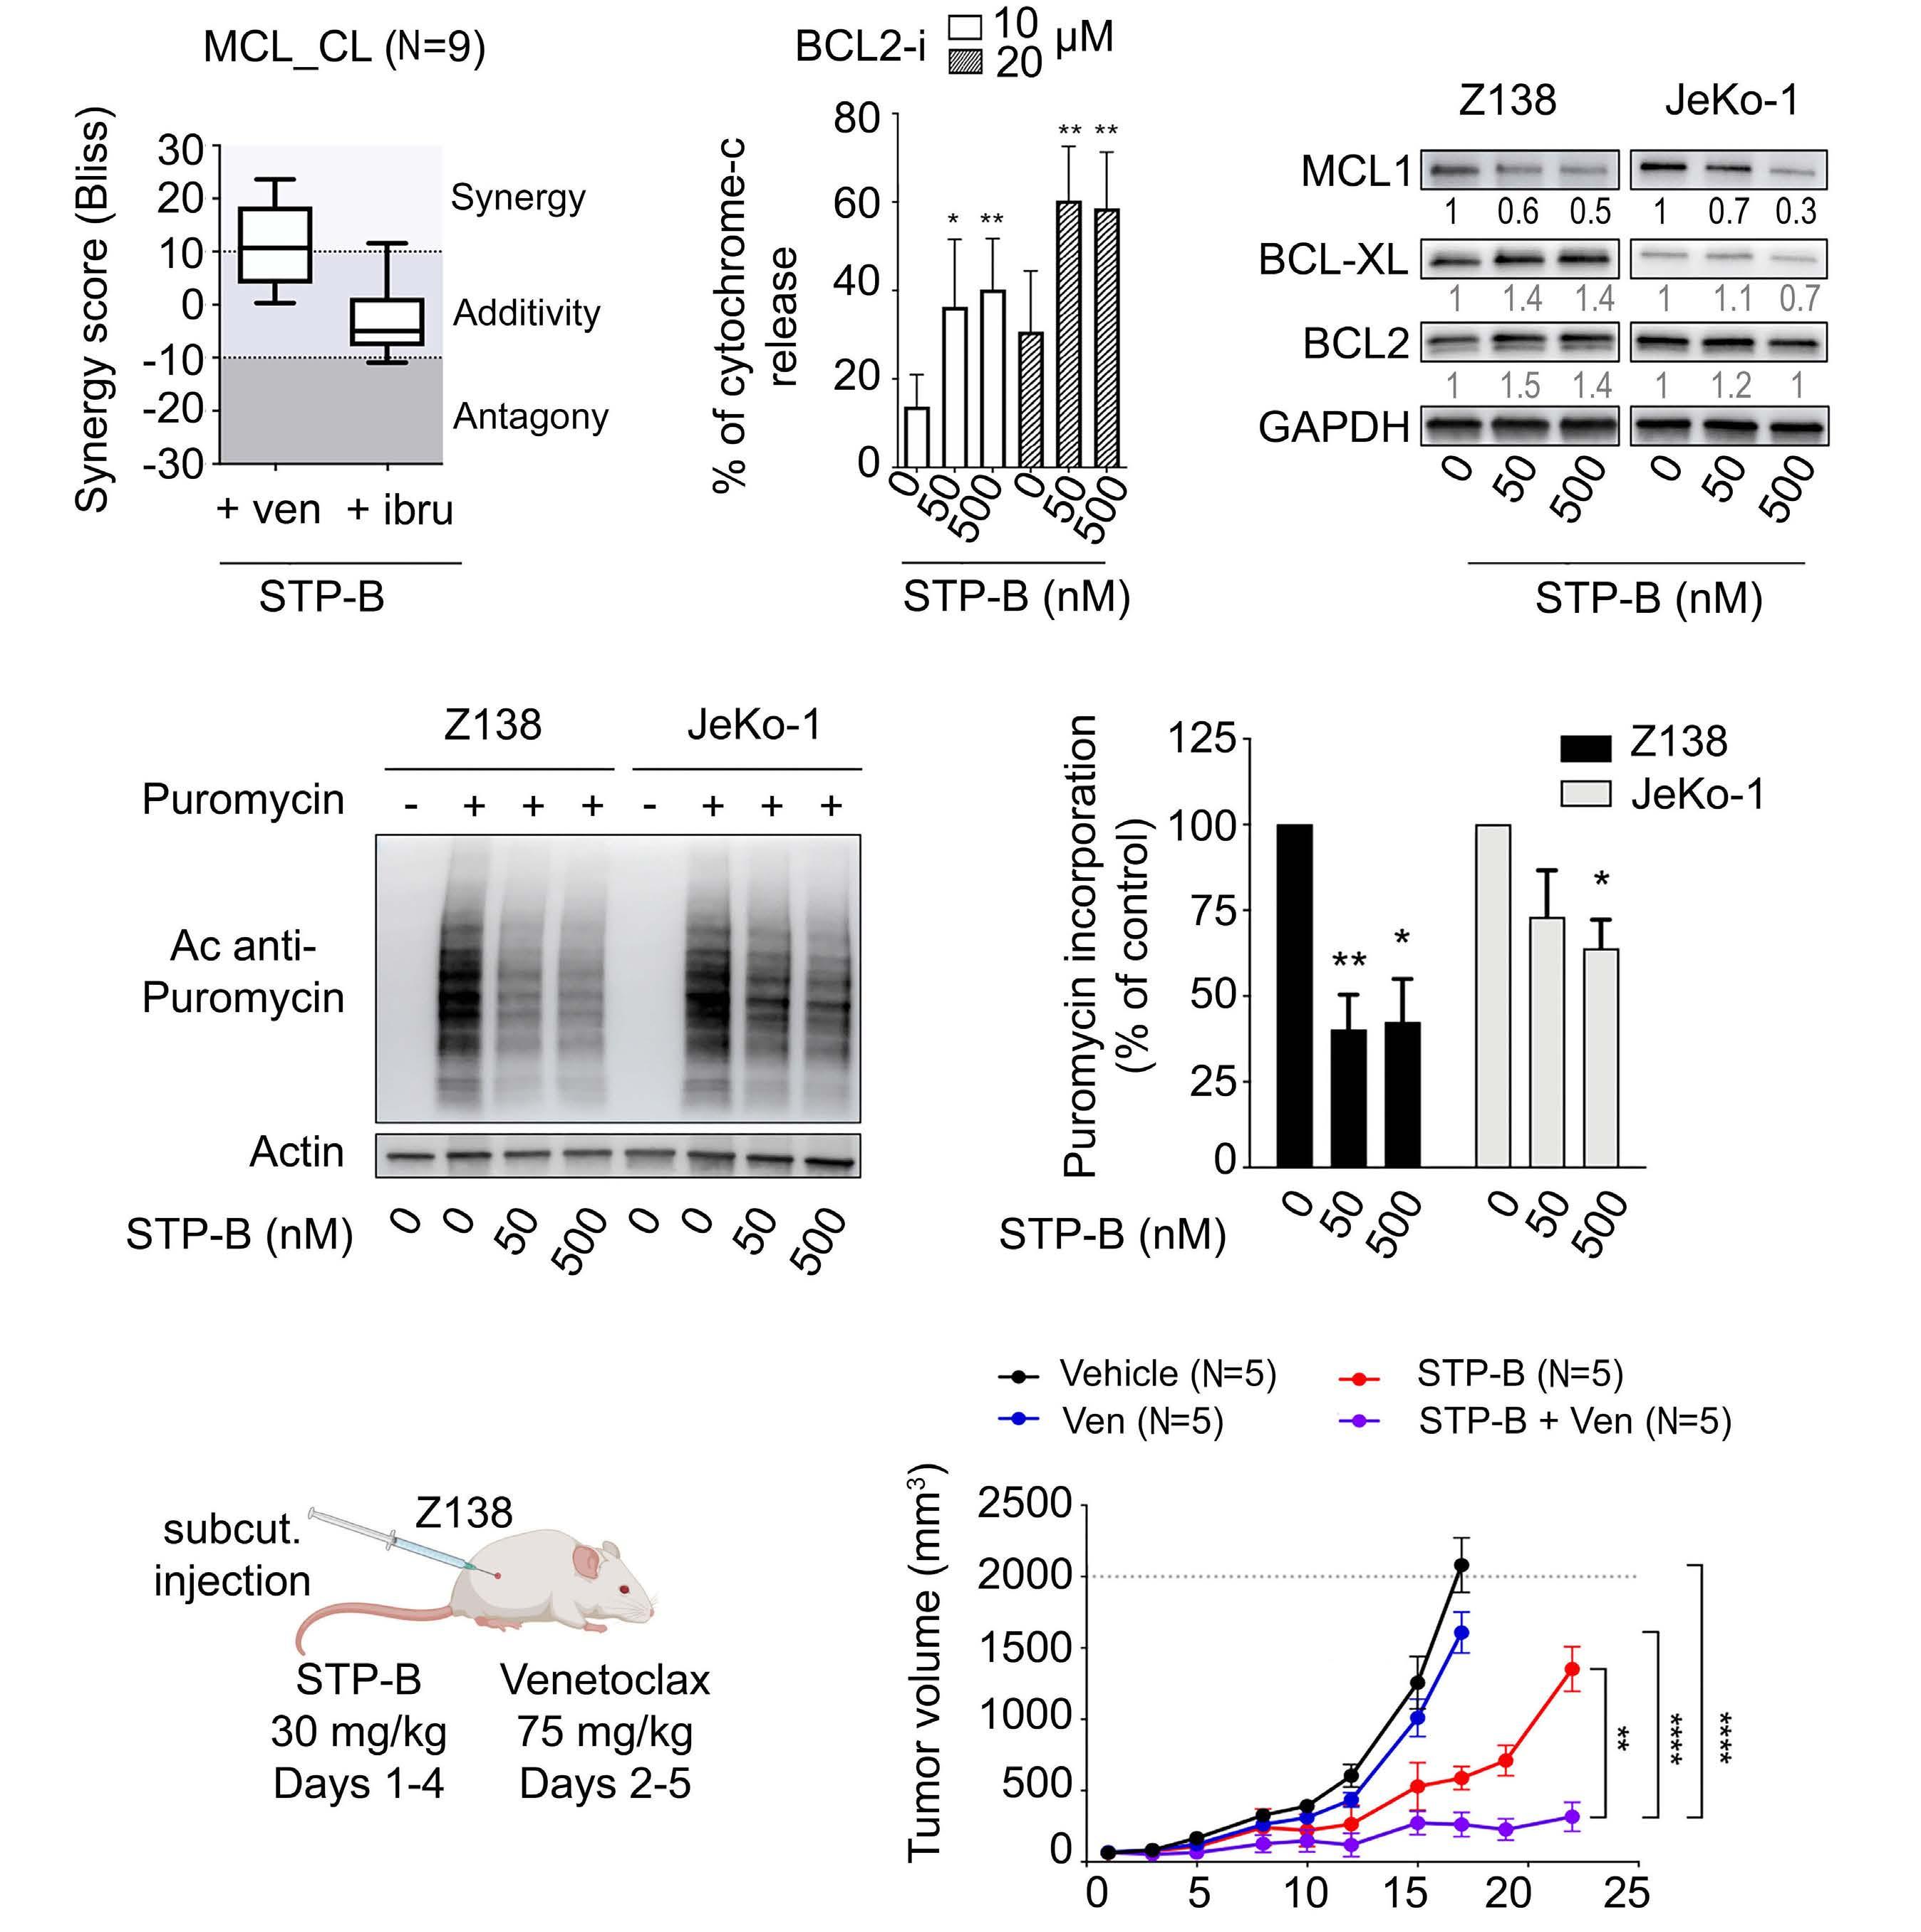
2574 Selective pharmacologic targeting of CTPS1 shows single-agent activity and synergizes with BCL2 inhibition in aggressive mantle cell lymphoma
R. Durand et al.
https://doi.org/10.3324/haematol.2023.284345
Plasma Cell Disorders
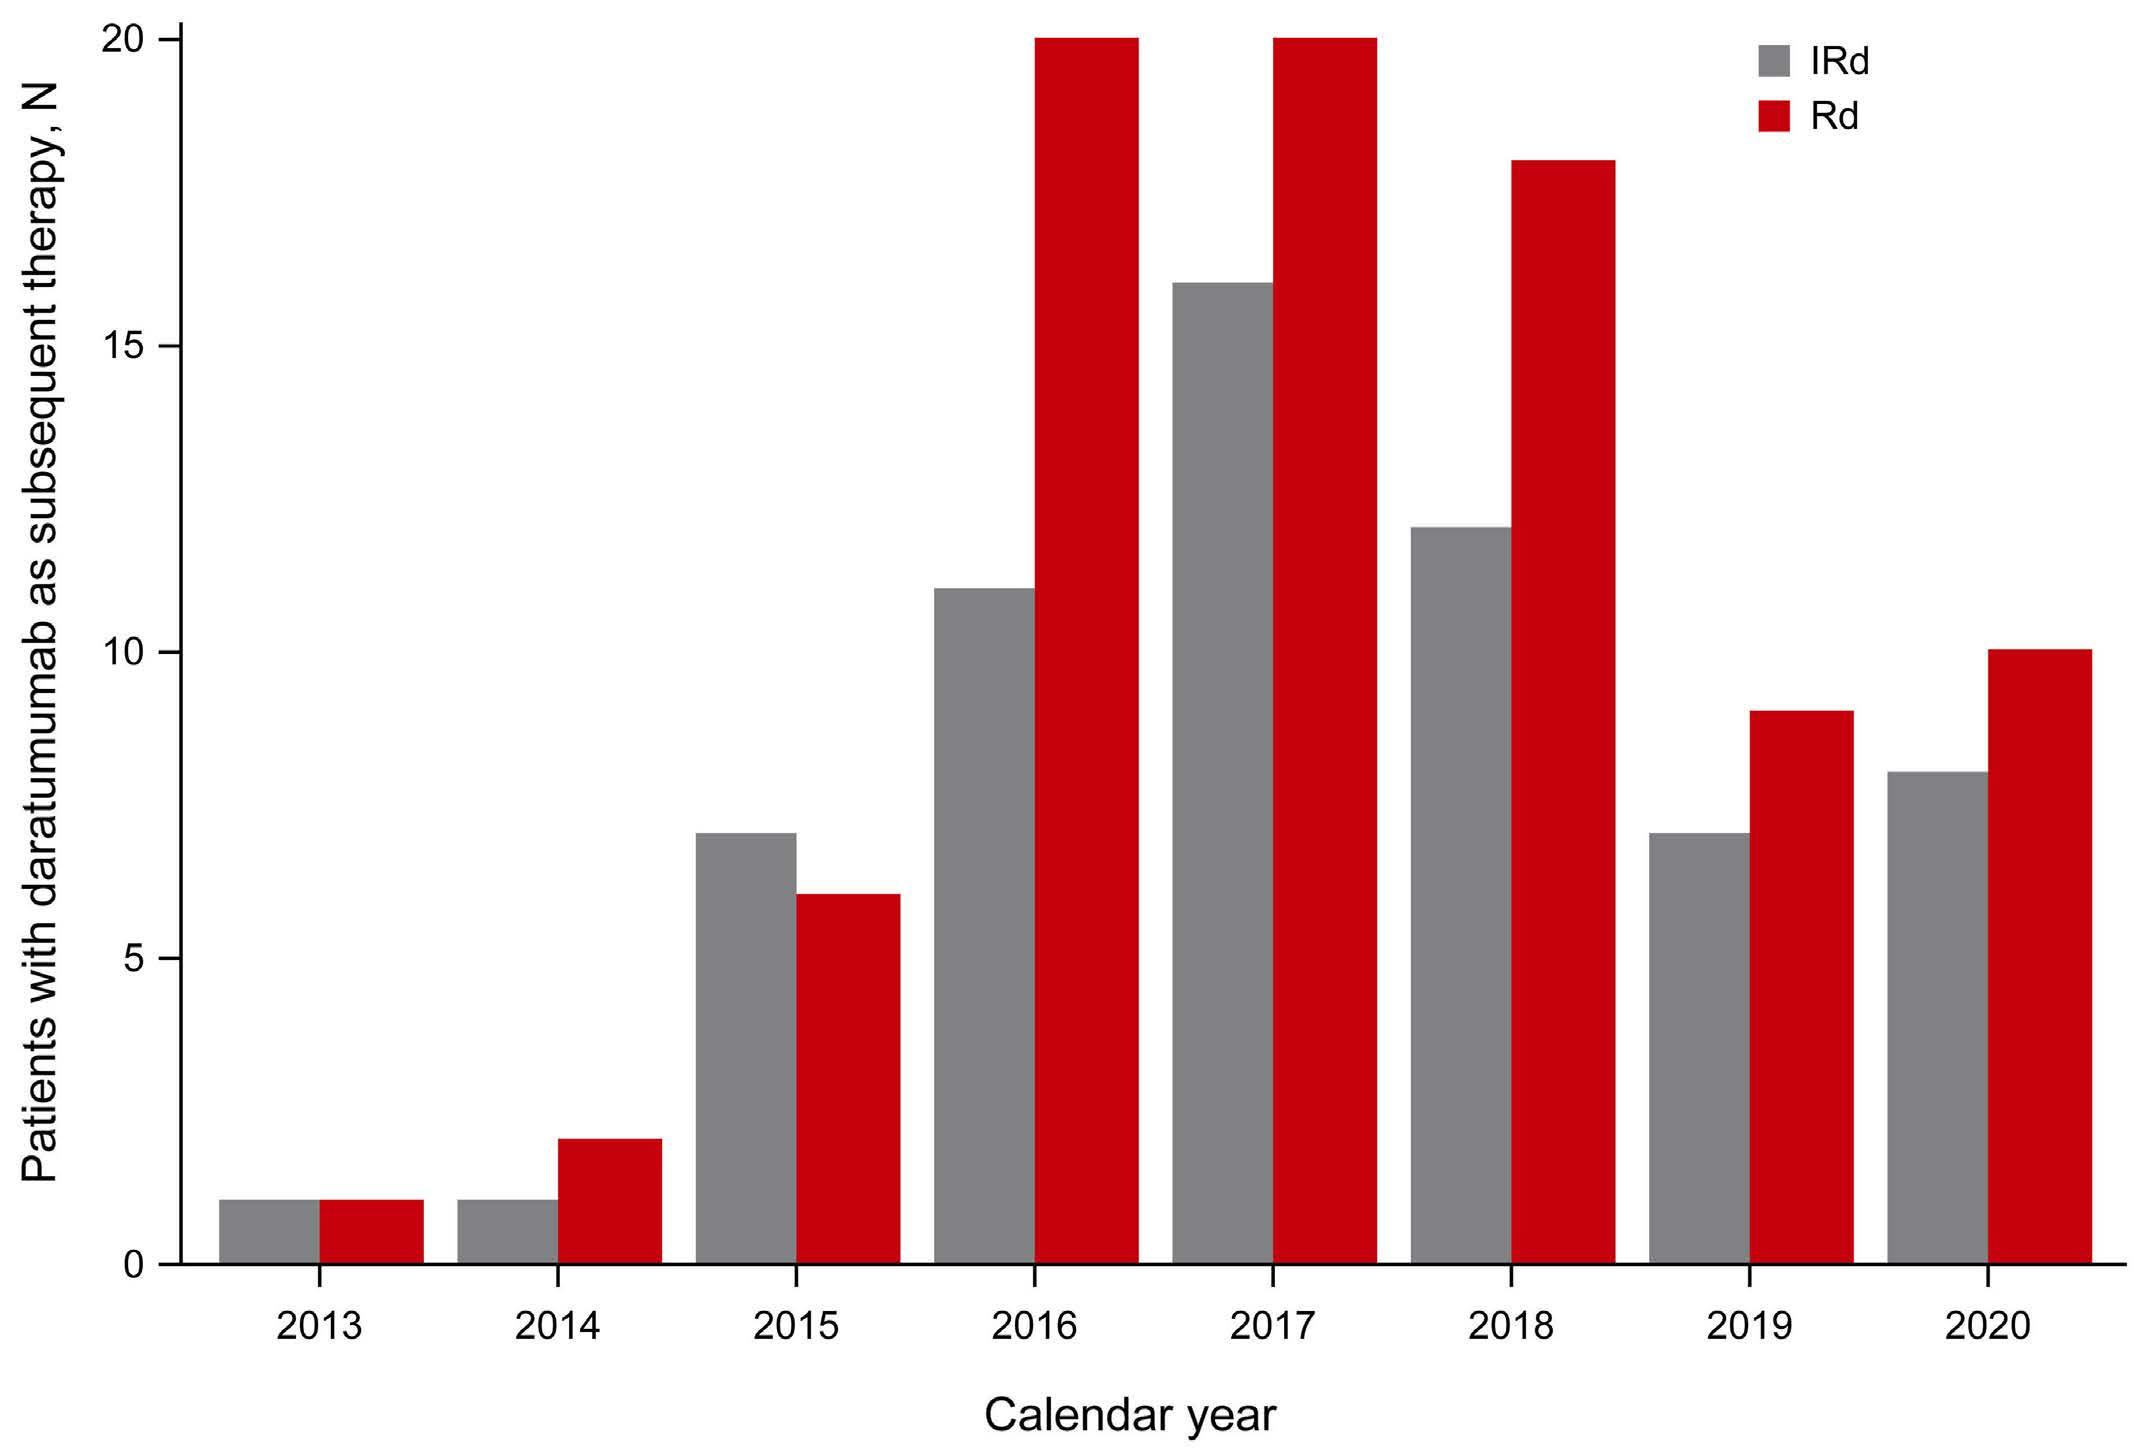
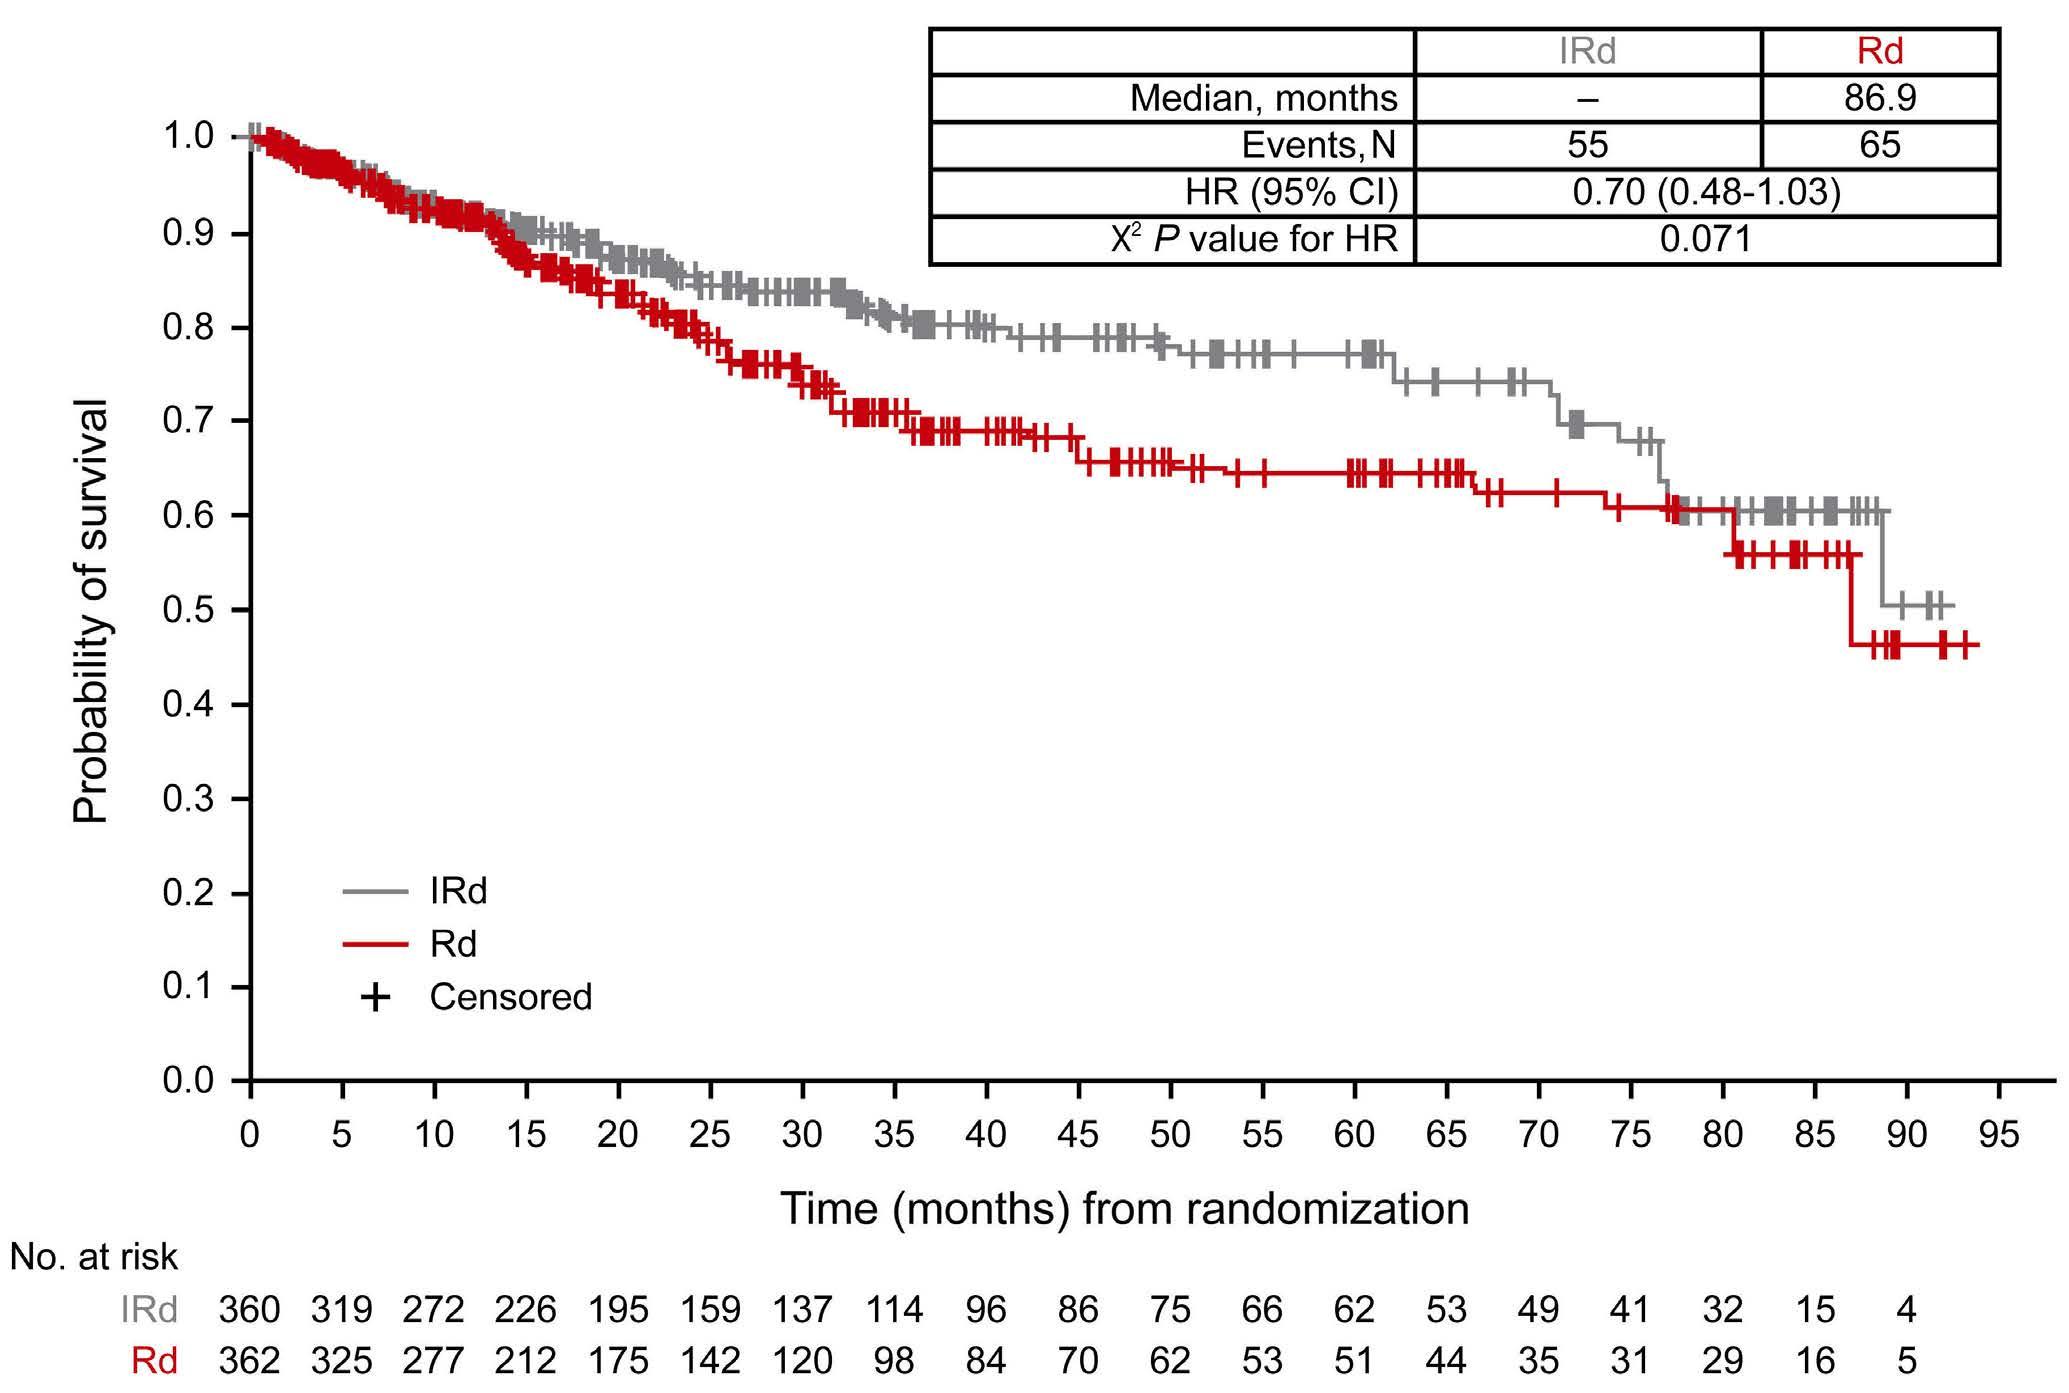
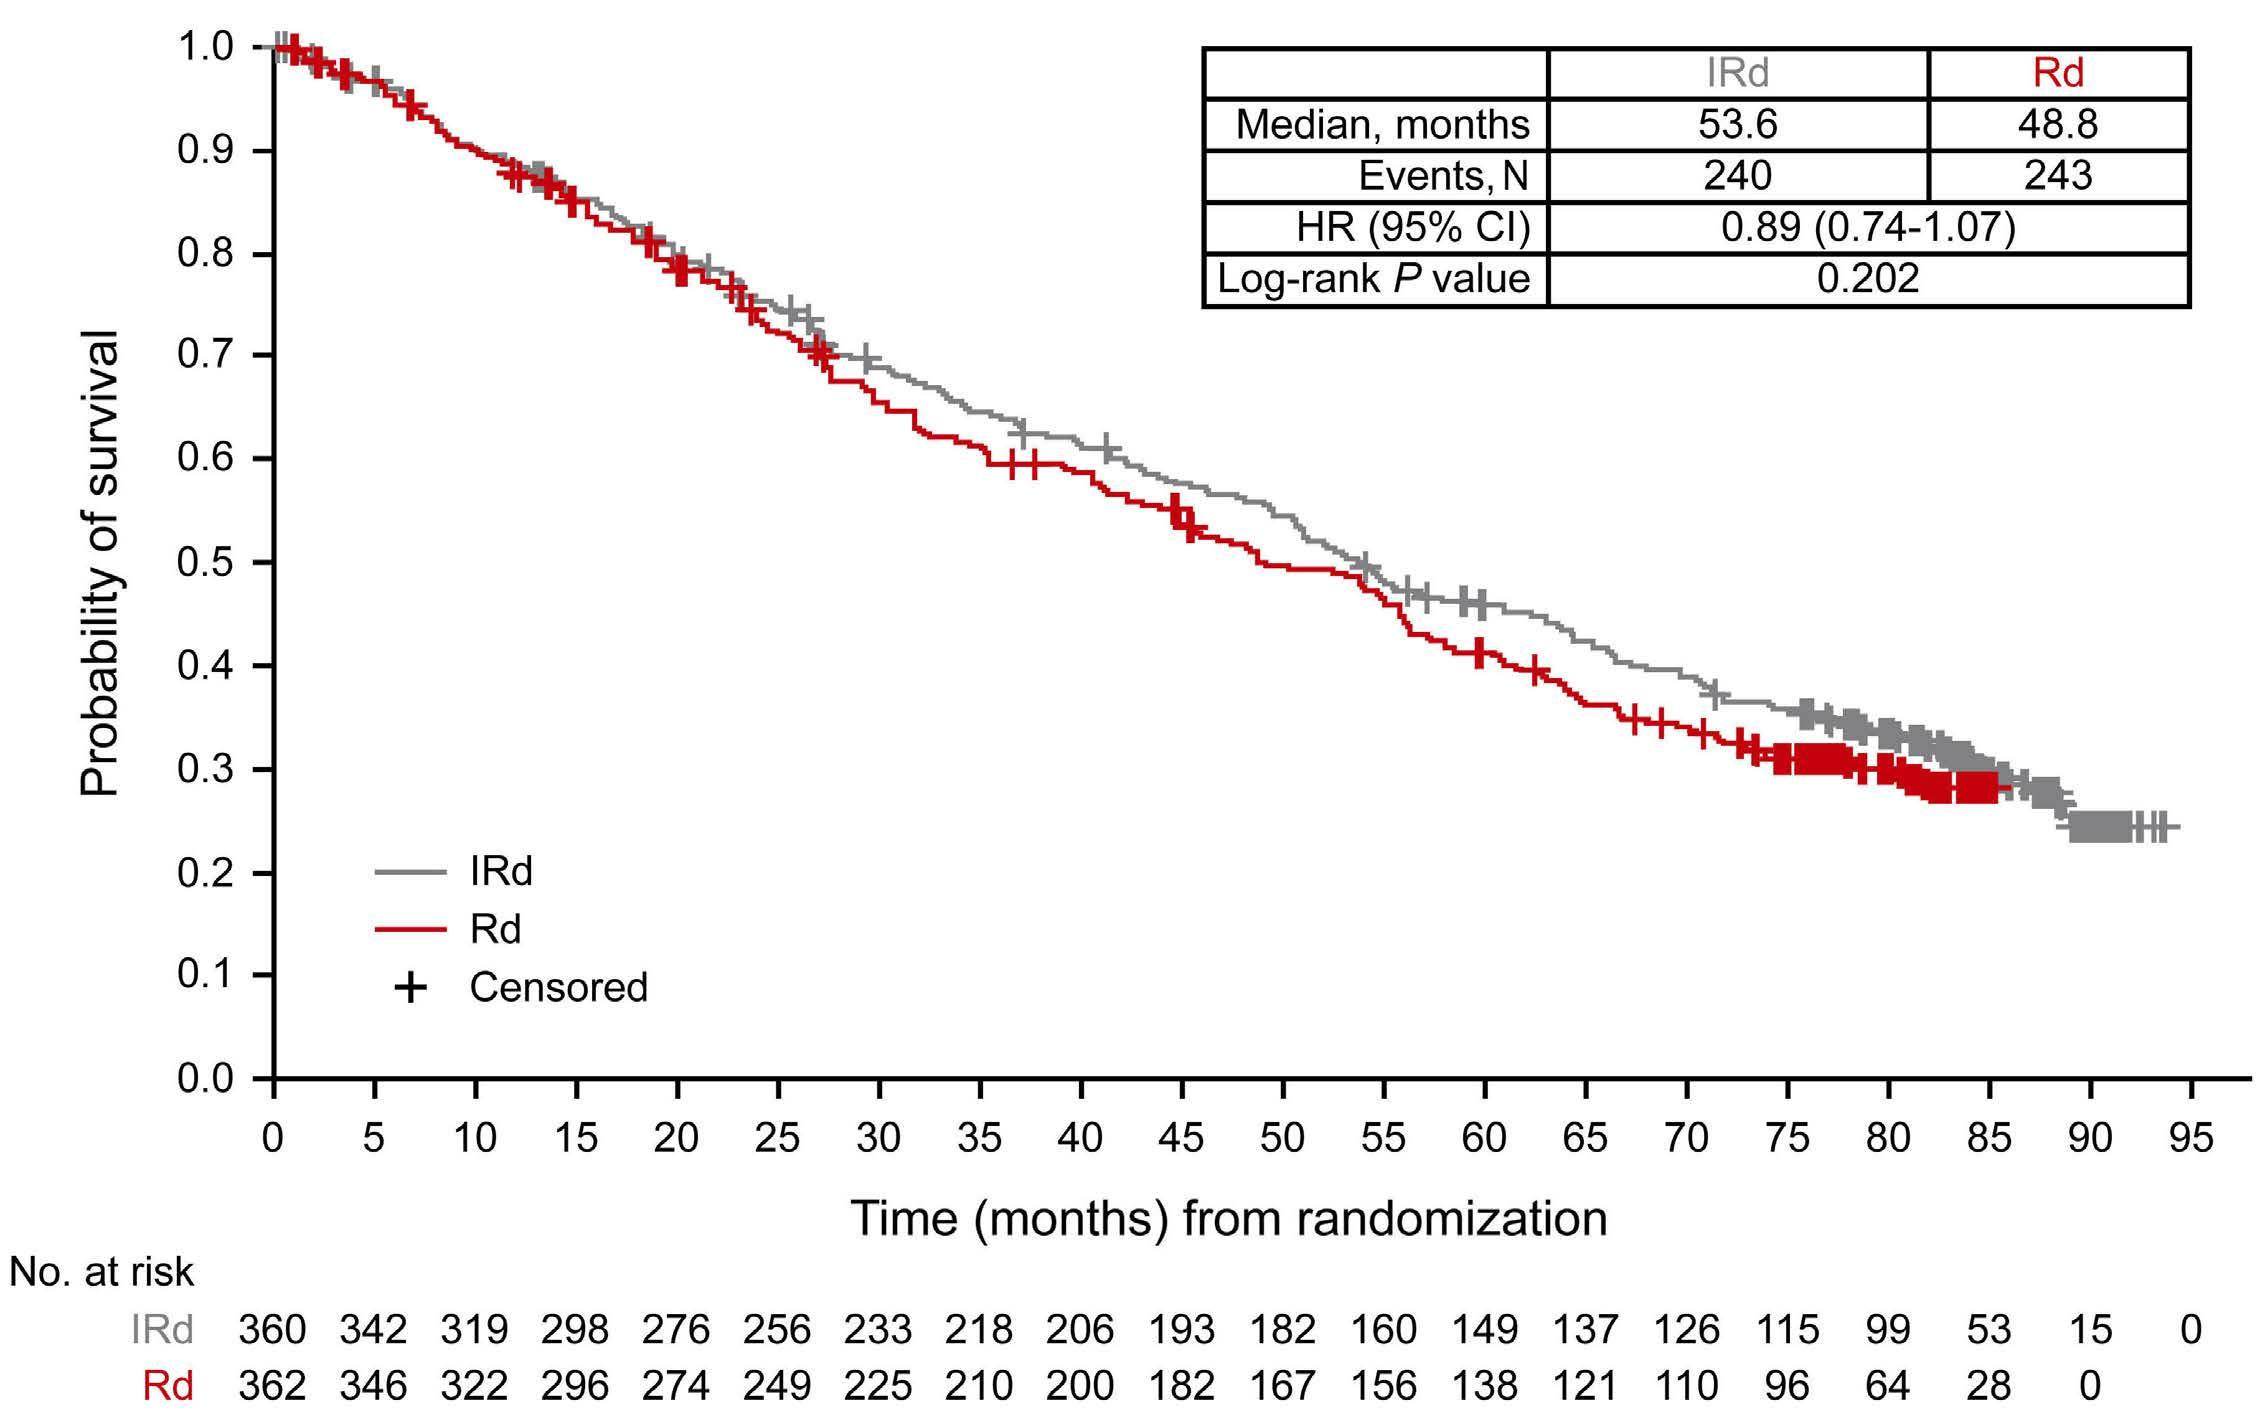
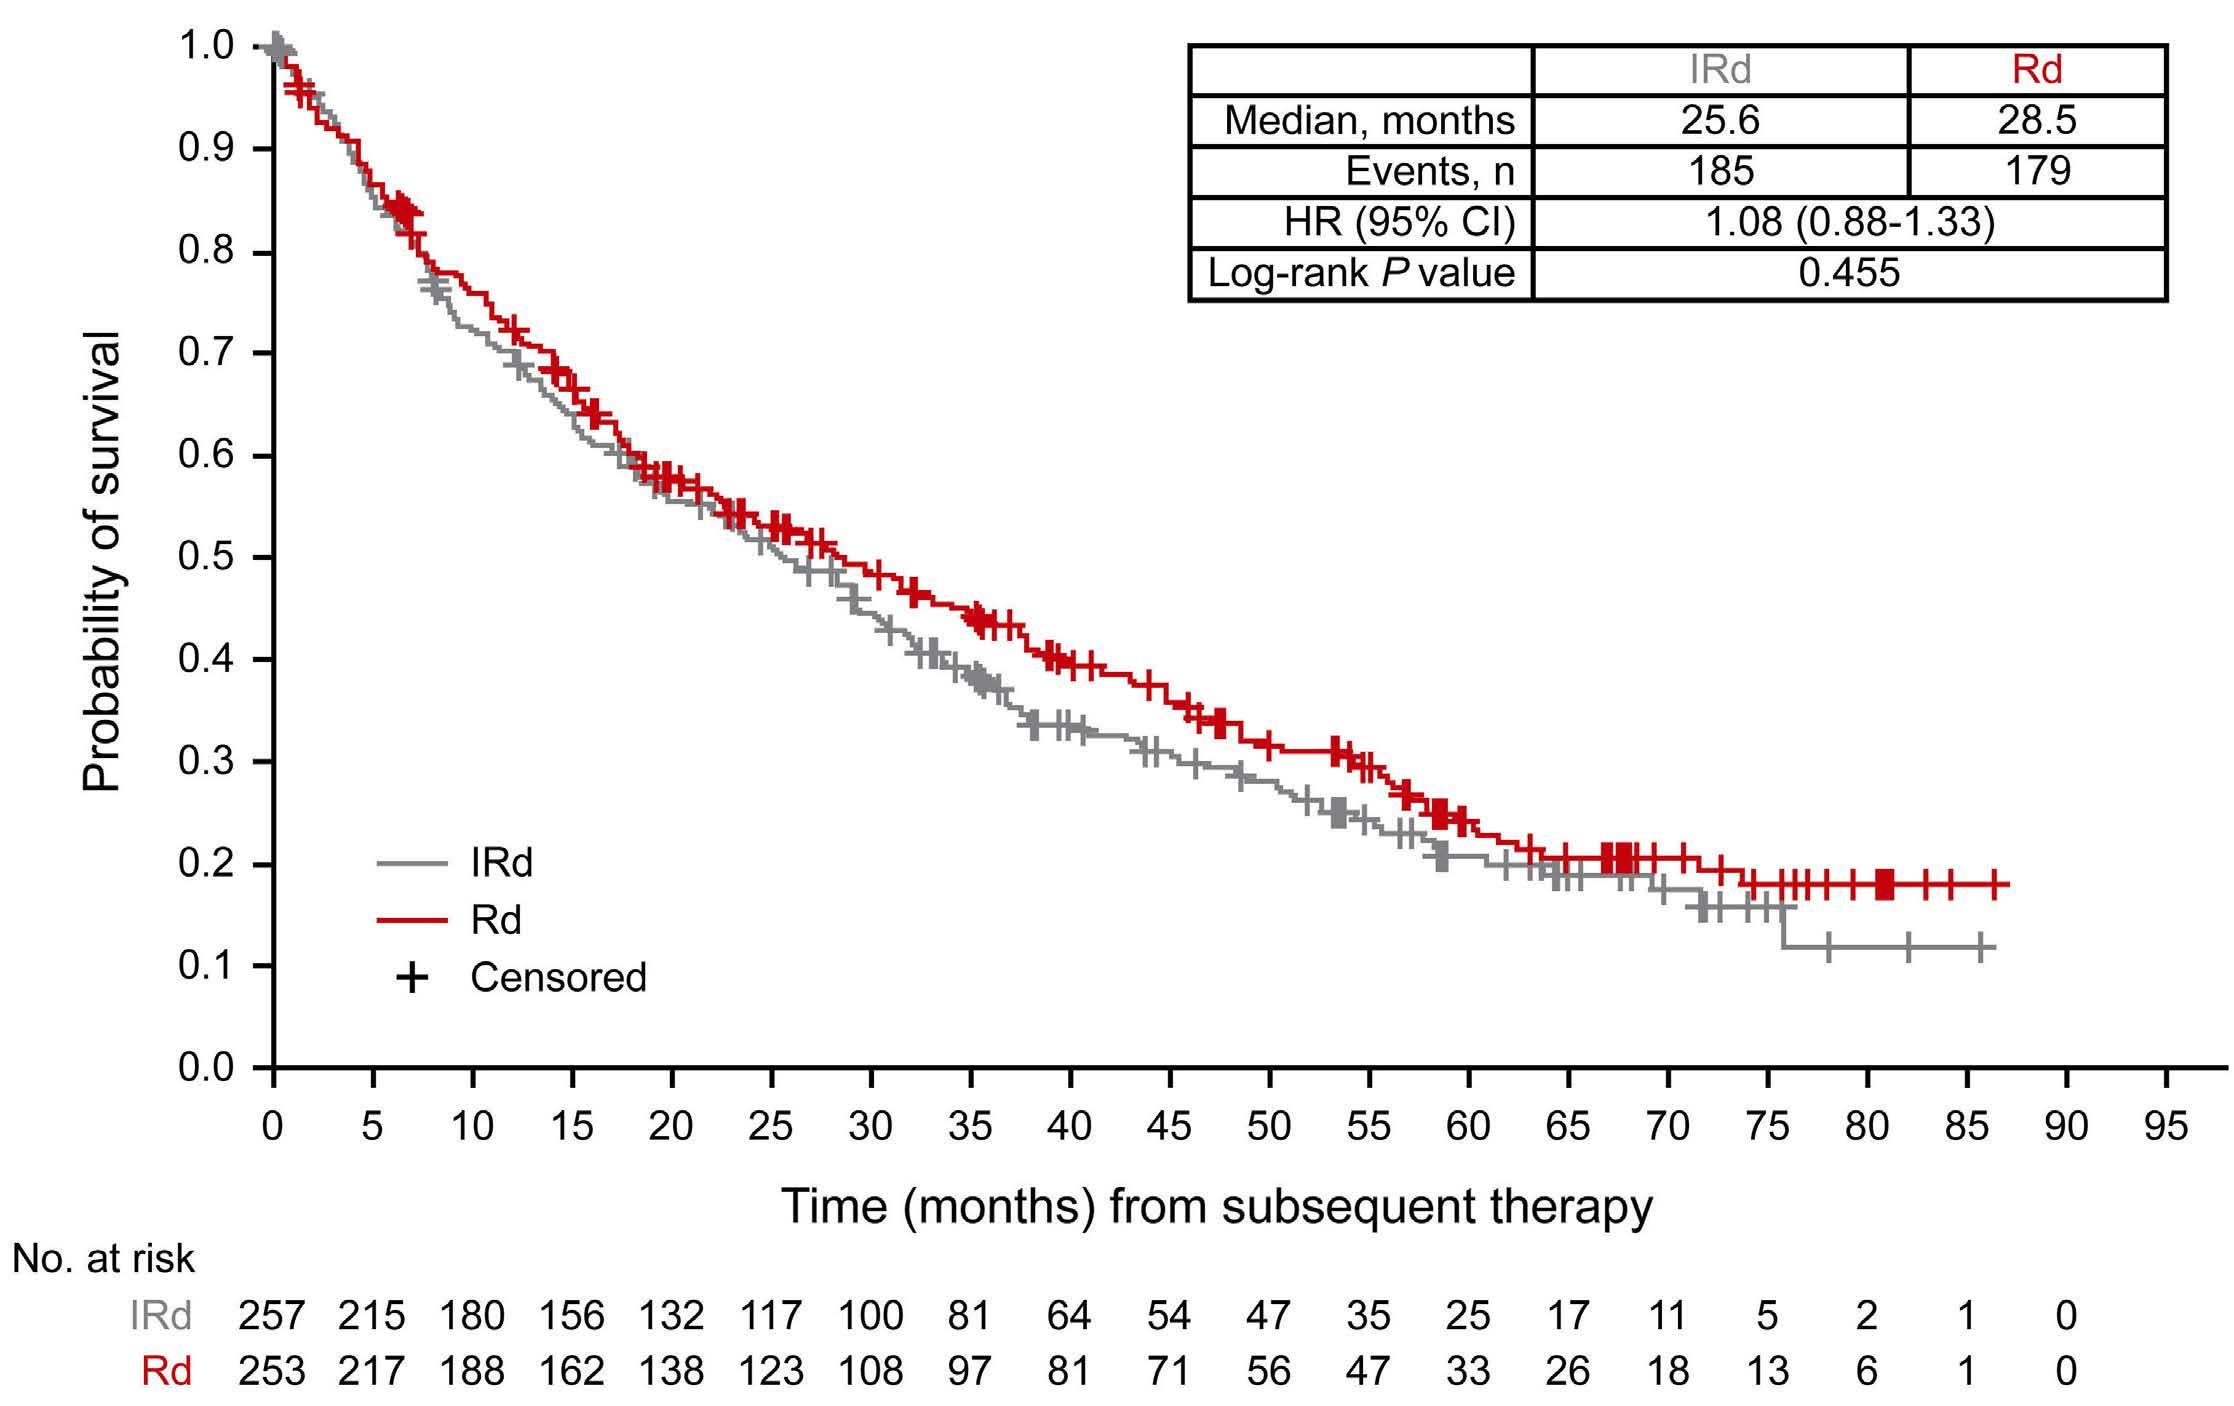
2585 Adjusting for subsequent therapies in the TOURMALINE-MM1 study shows clinically meaningful improvement in overall survival with addition of ixazomib to lenalidomide and dexamethasone
K. Ramasamy et al.
https://doi.org/10.3324/haematol.2023.283713
Plasma Cell Disorders
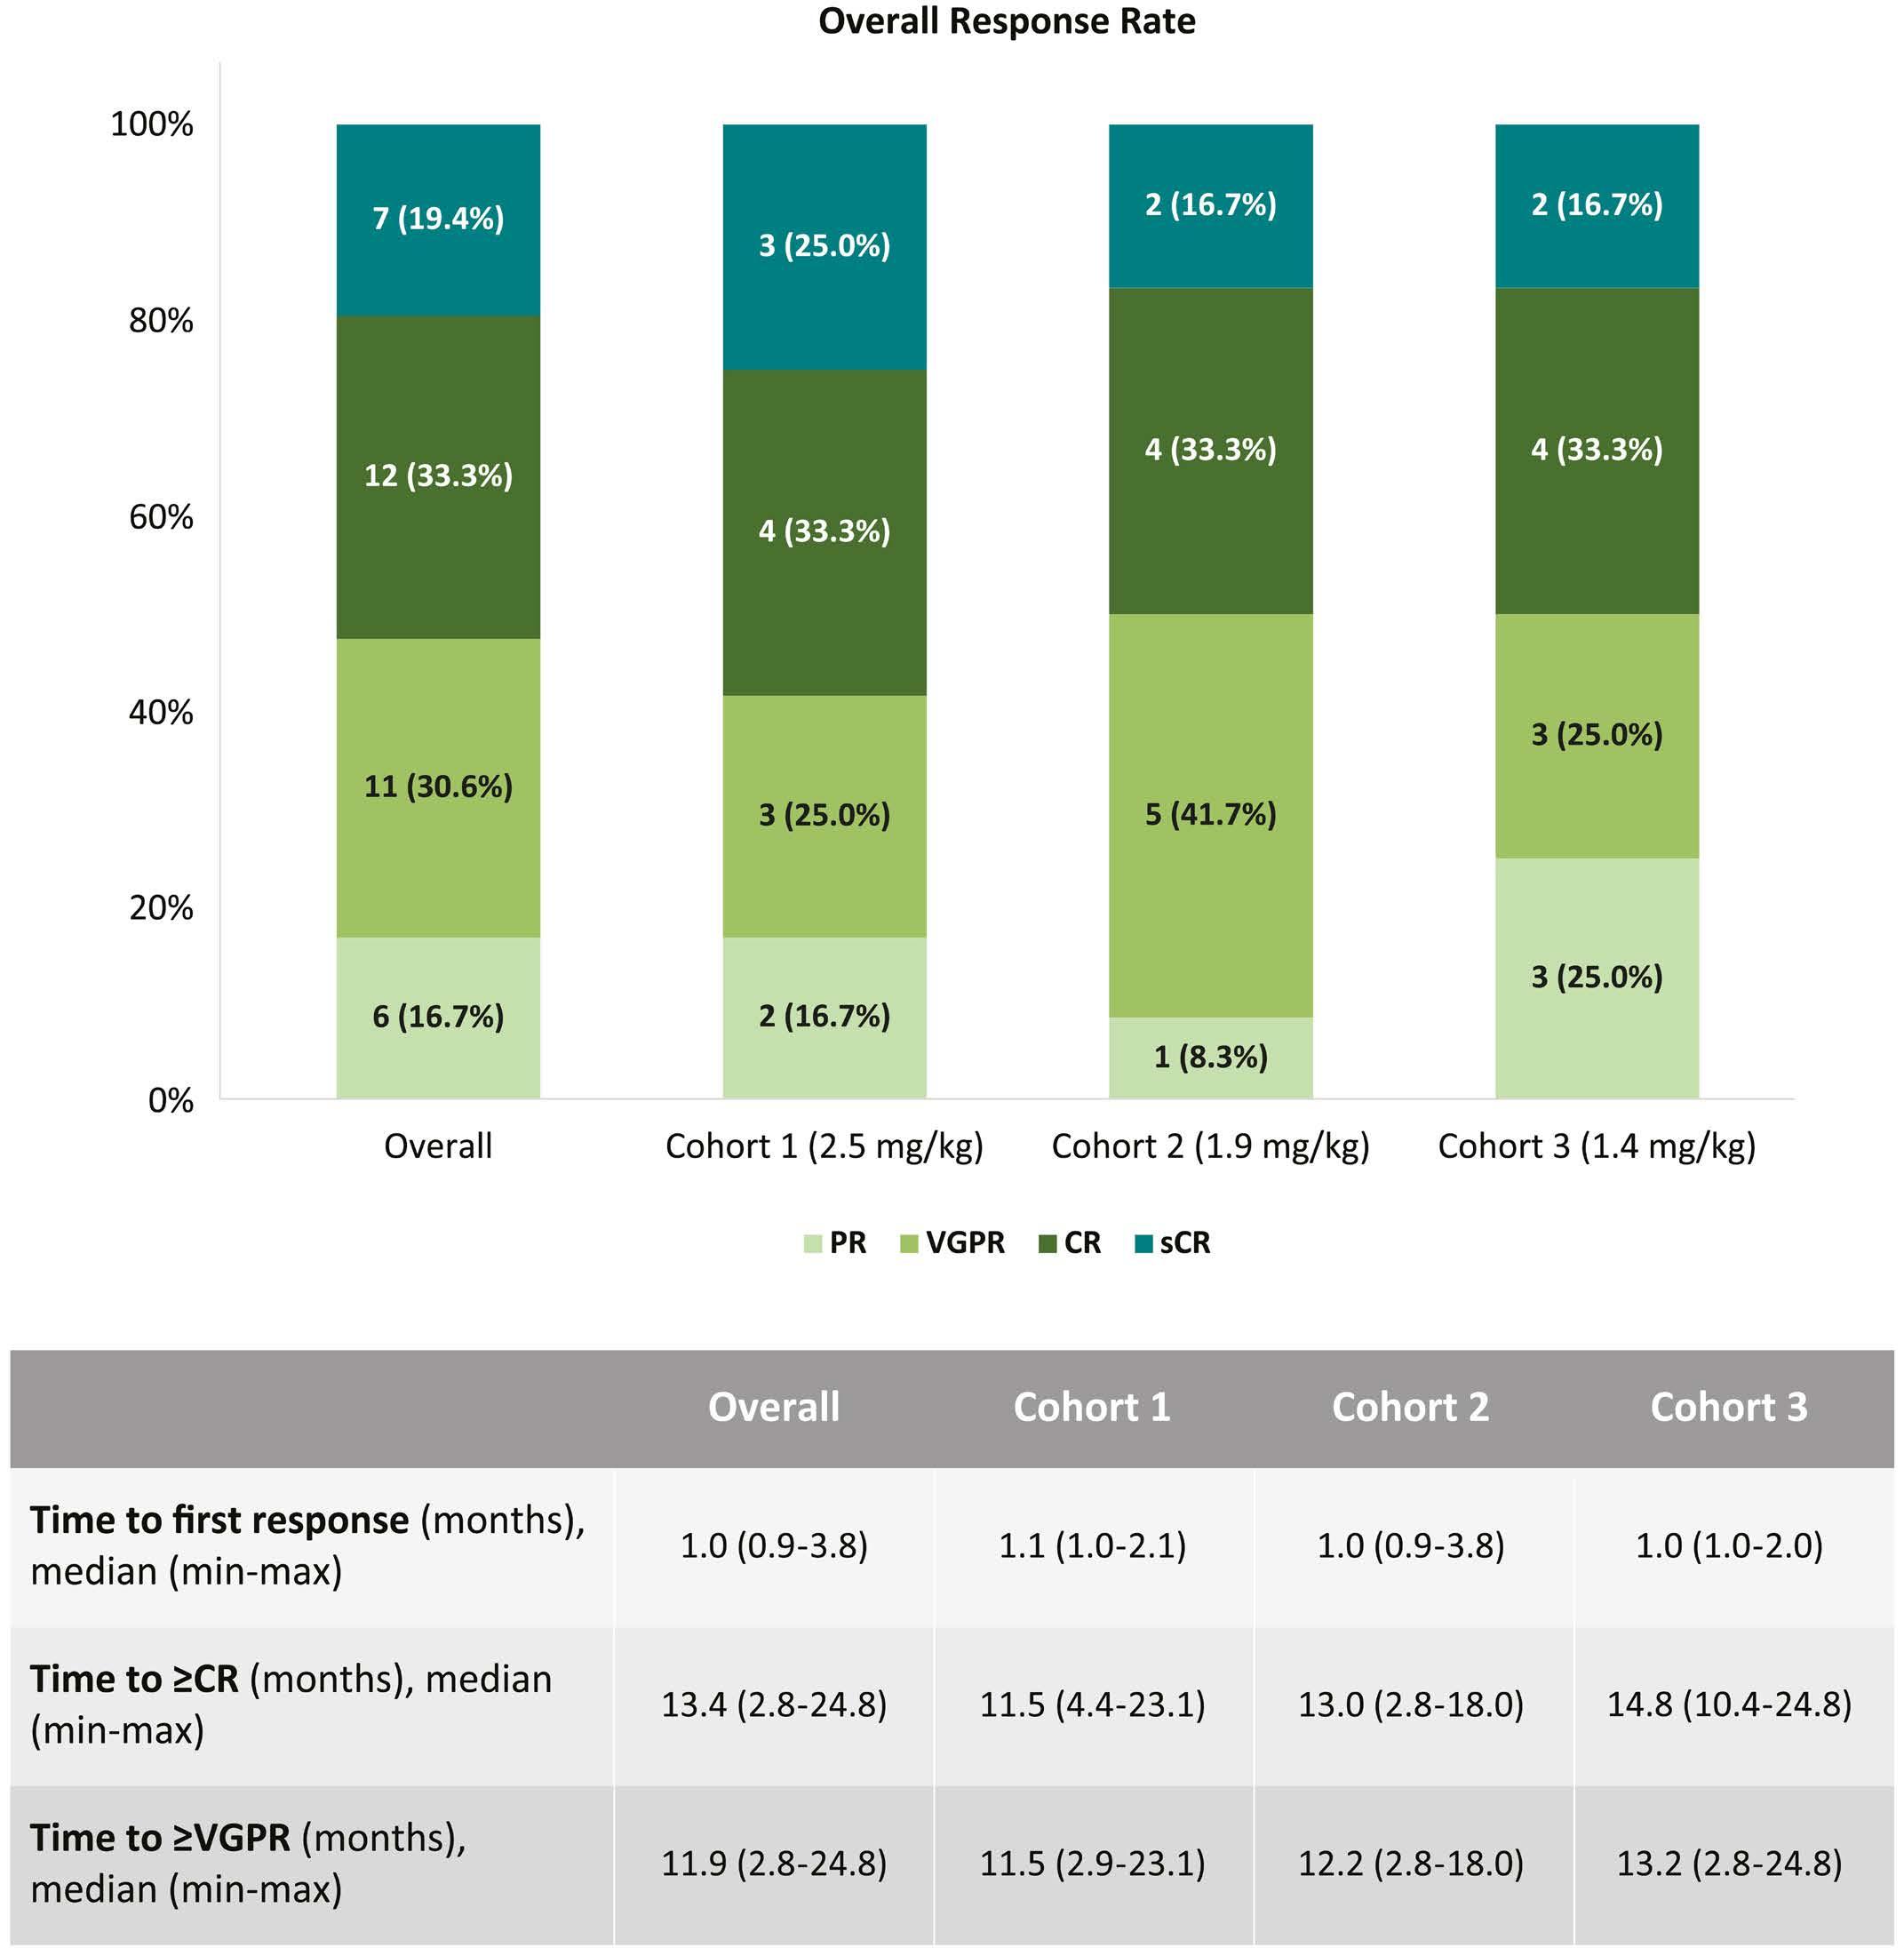
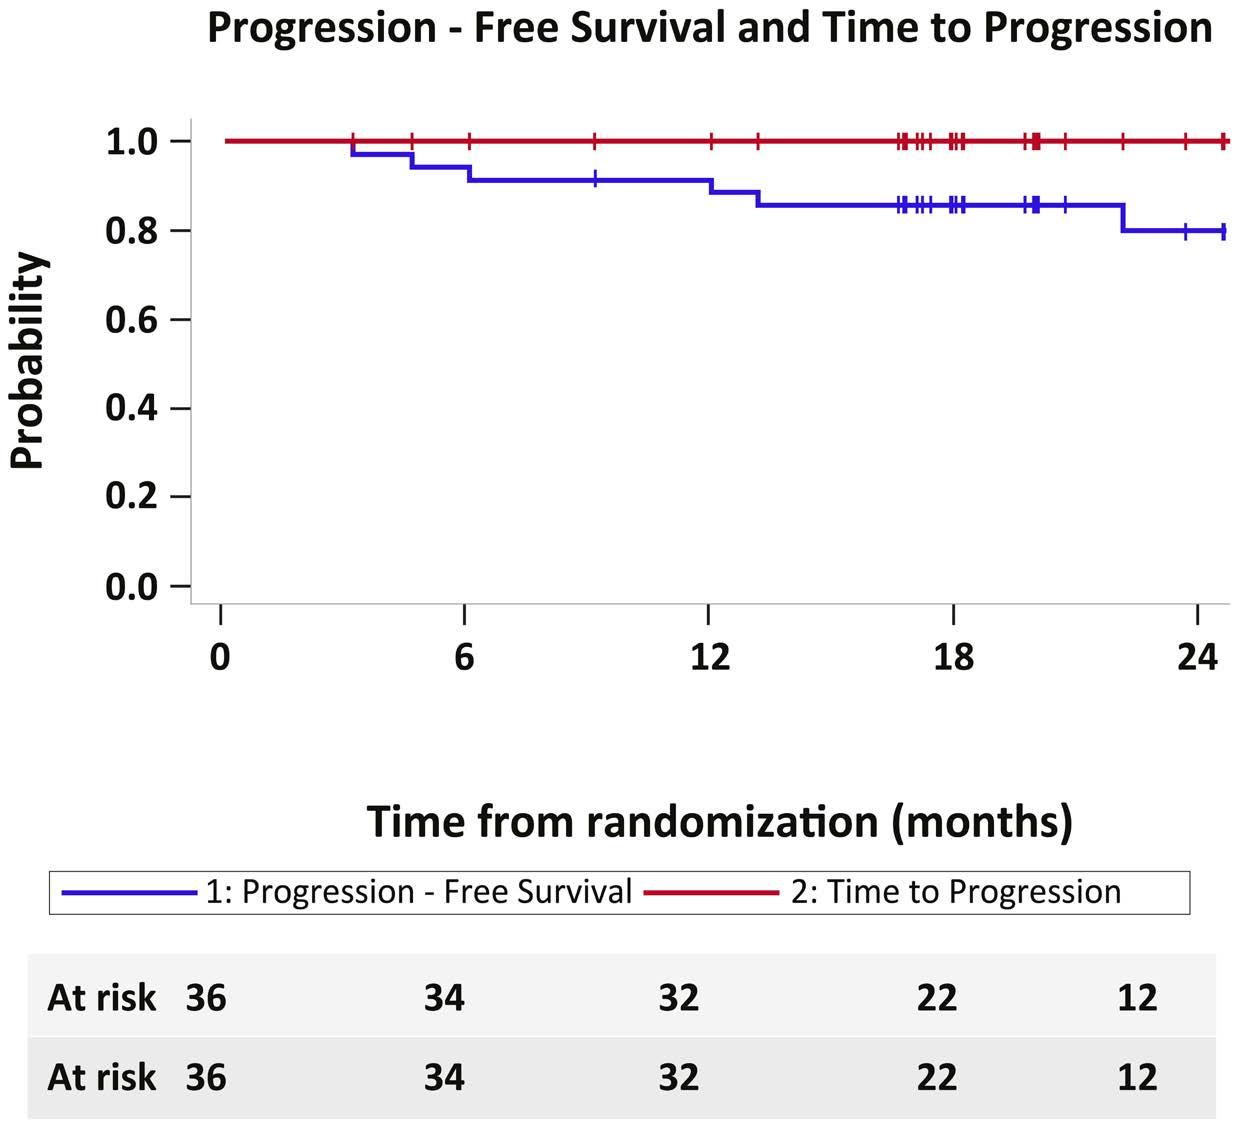
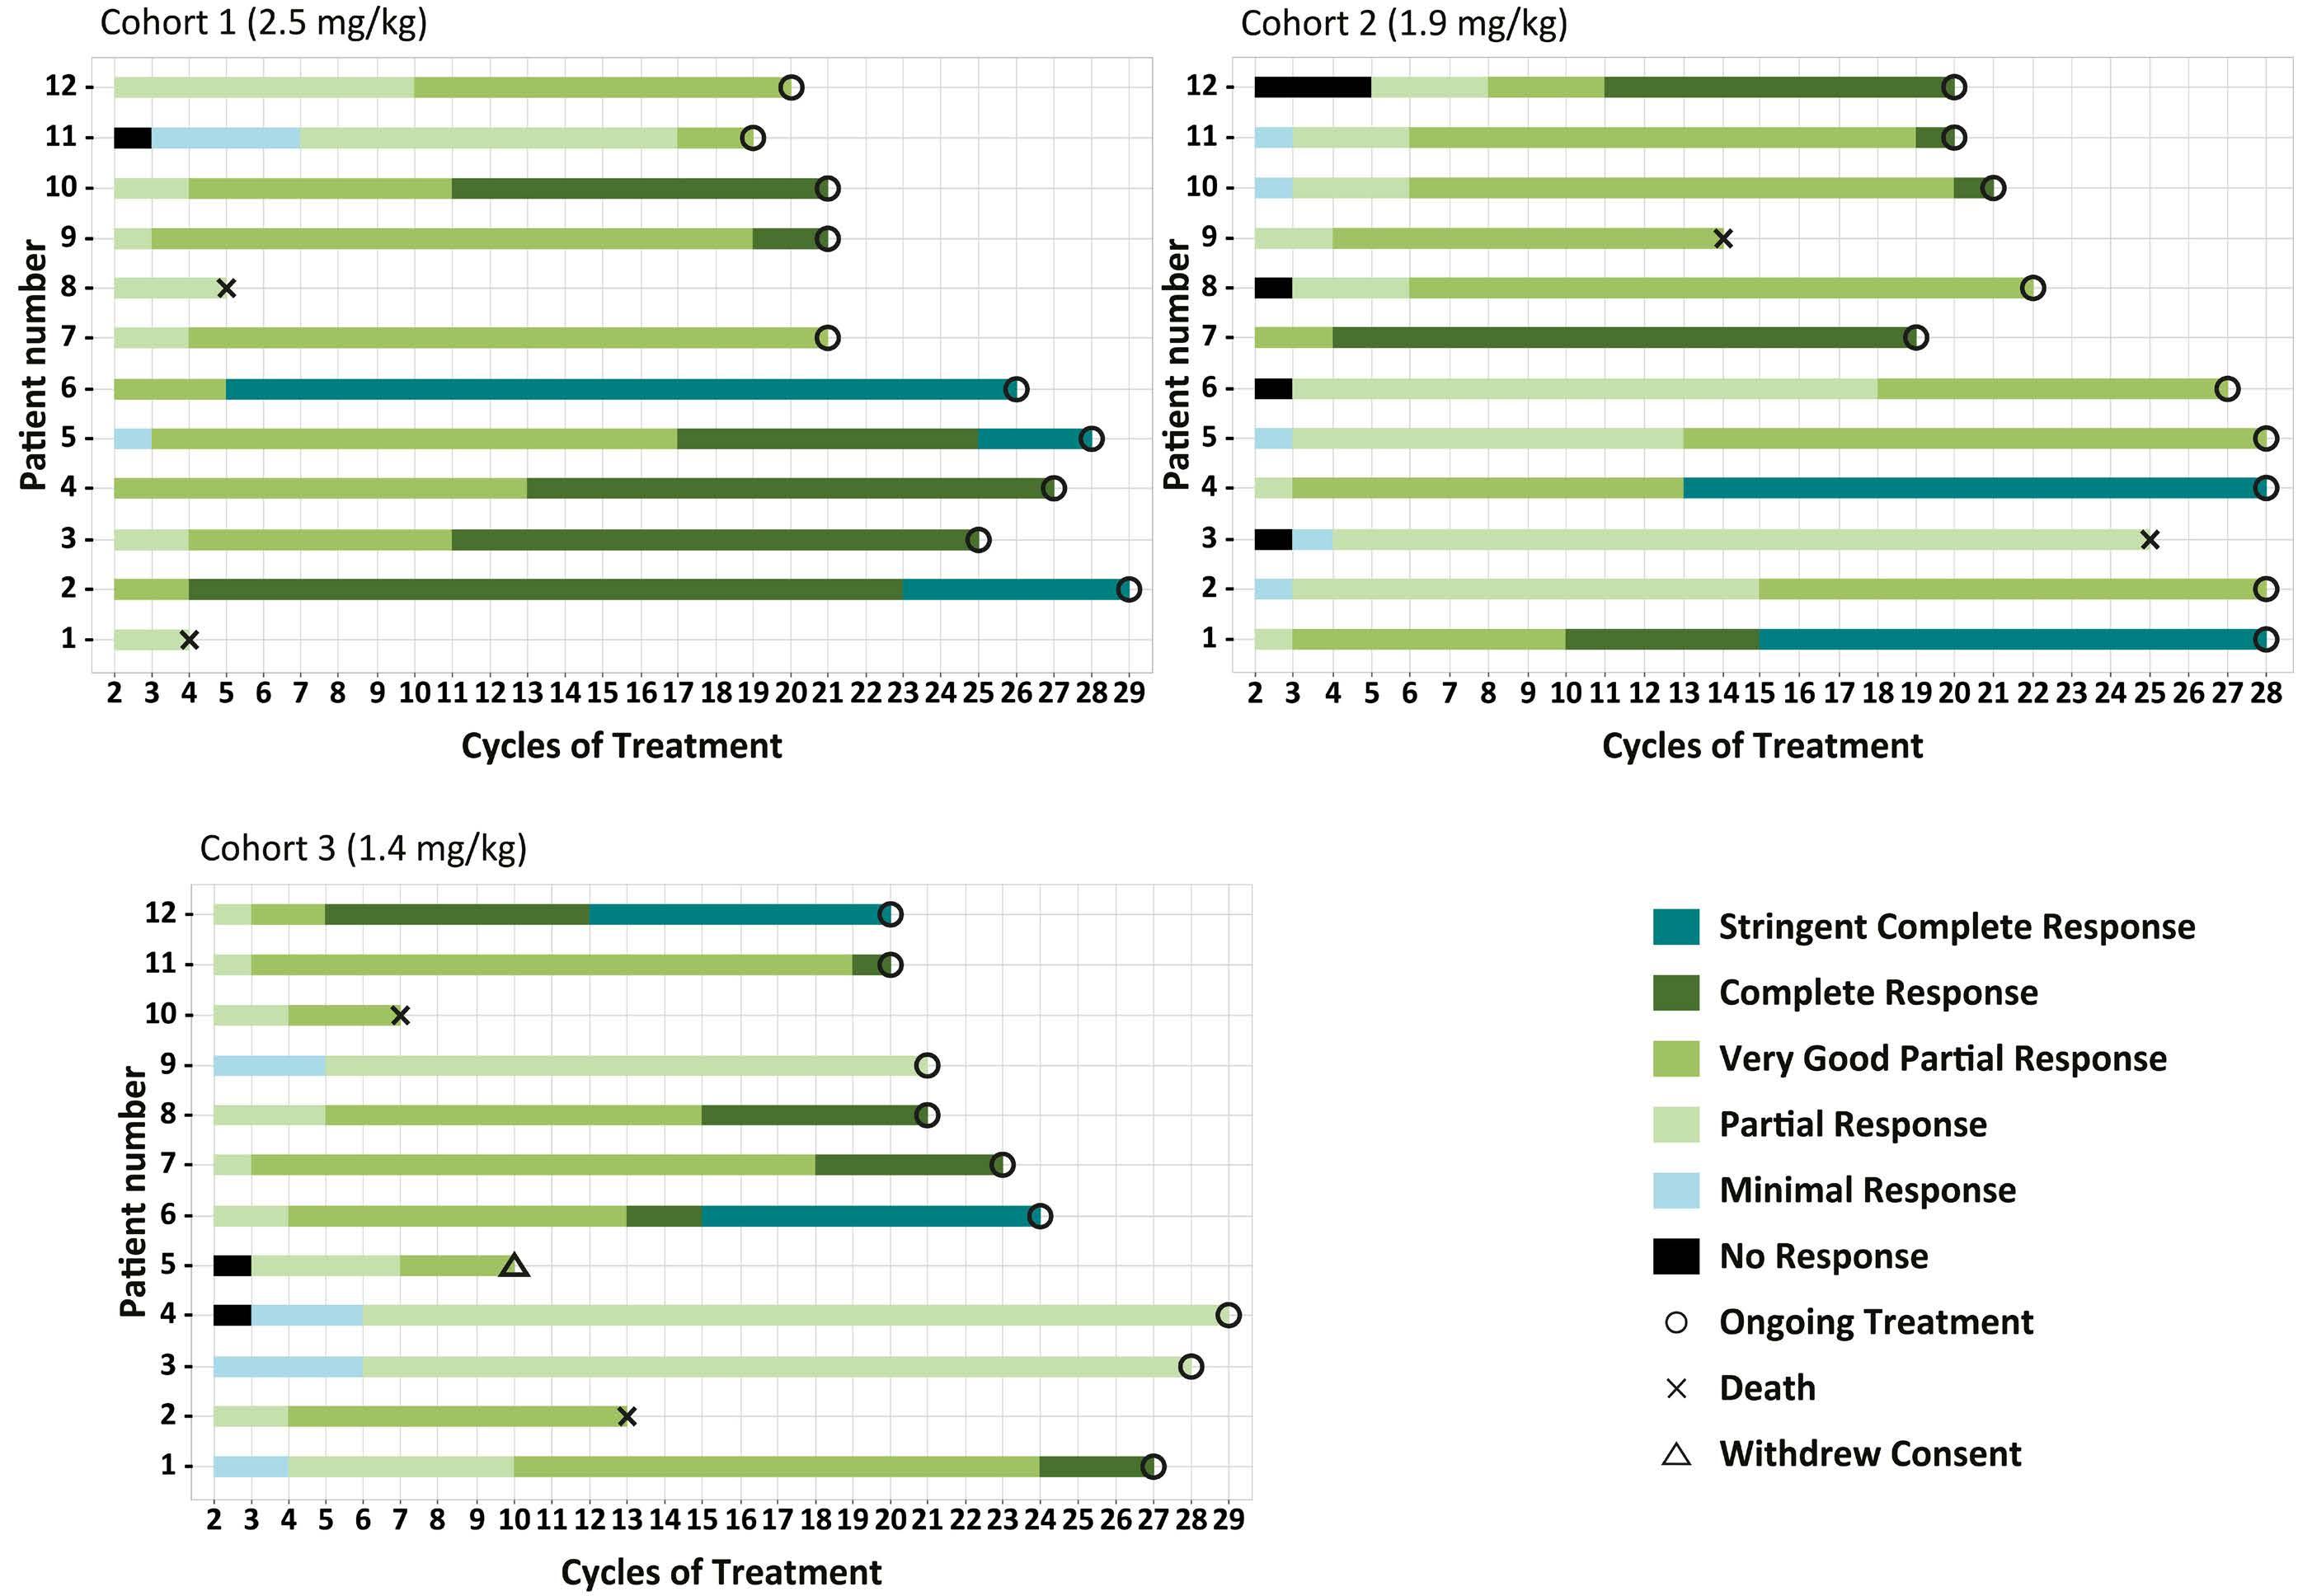
2594 Belantamab mafodotin, lenalidomide and dexamethasone in transplant-ineligible patients with newly diagnosed multiple myeloma: part 1 results of a phase I/II study
E. Terpos et al.
https://doi.org/10.3324/haematol.2023.284347
Plasma Cell Disorders
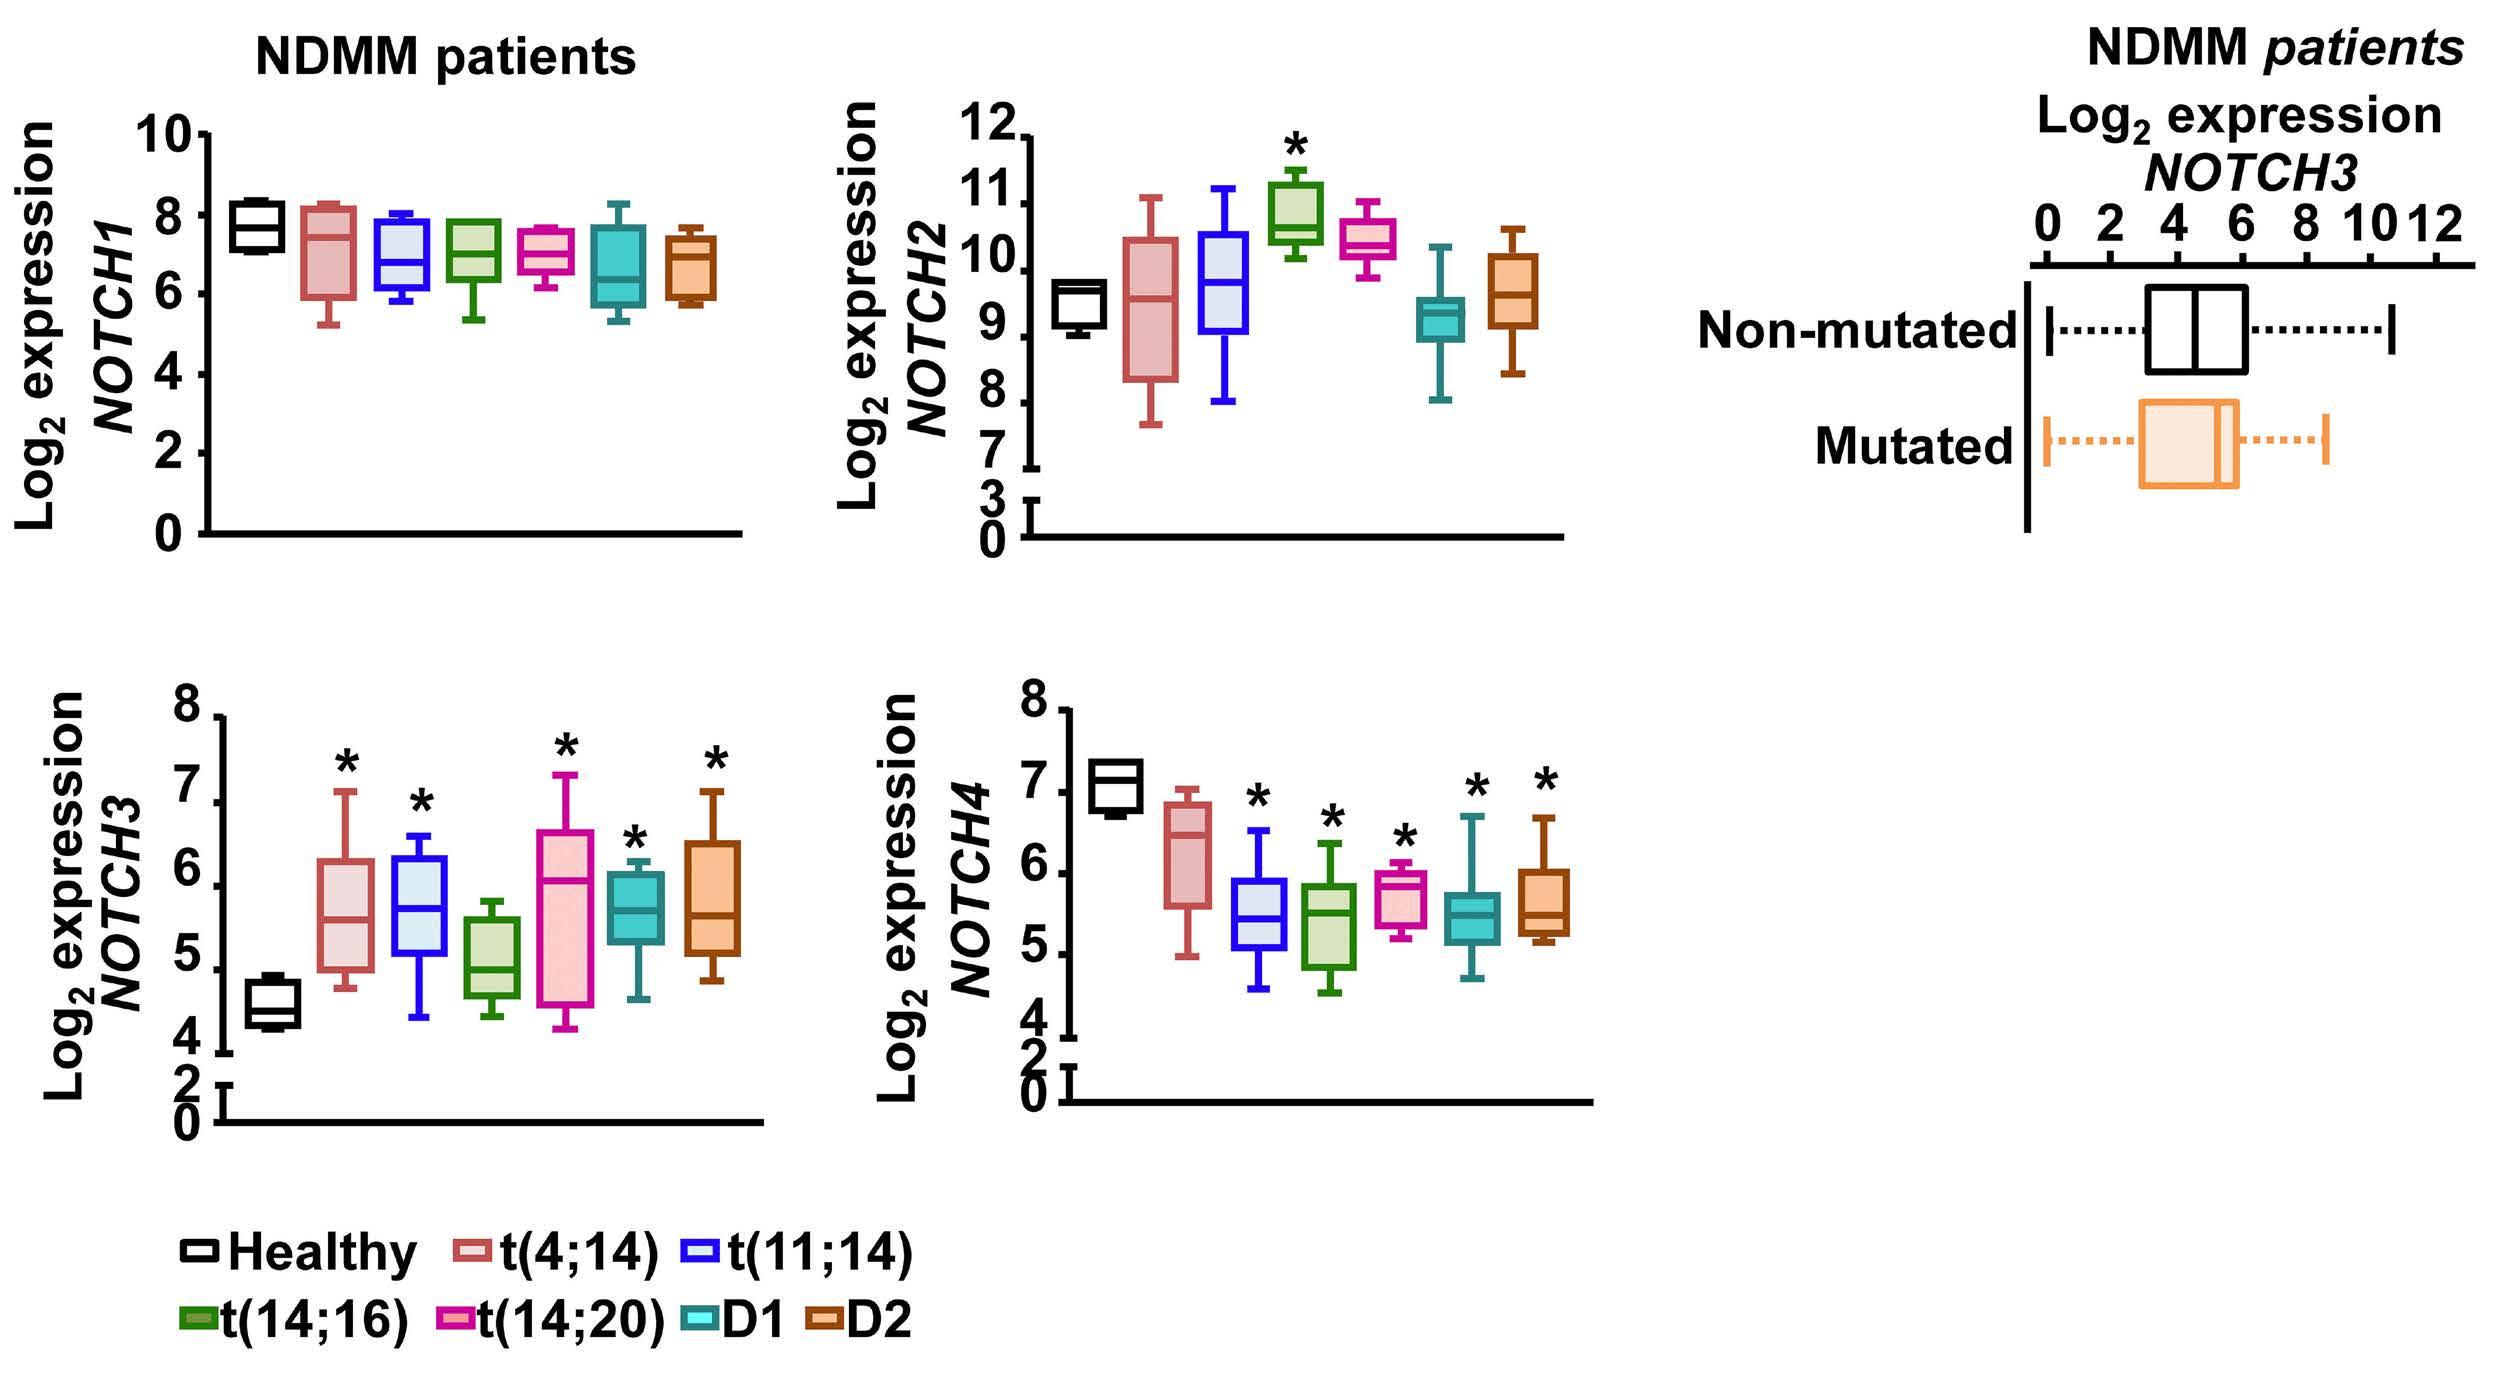
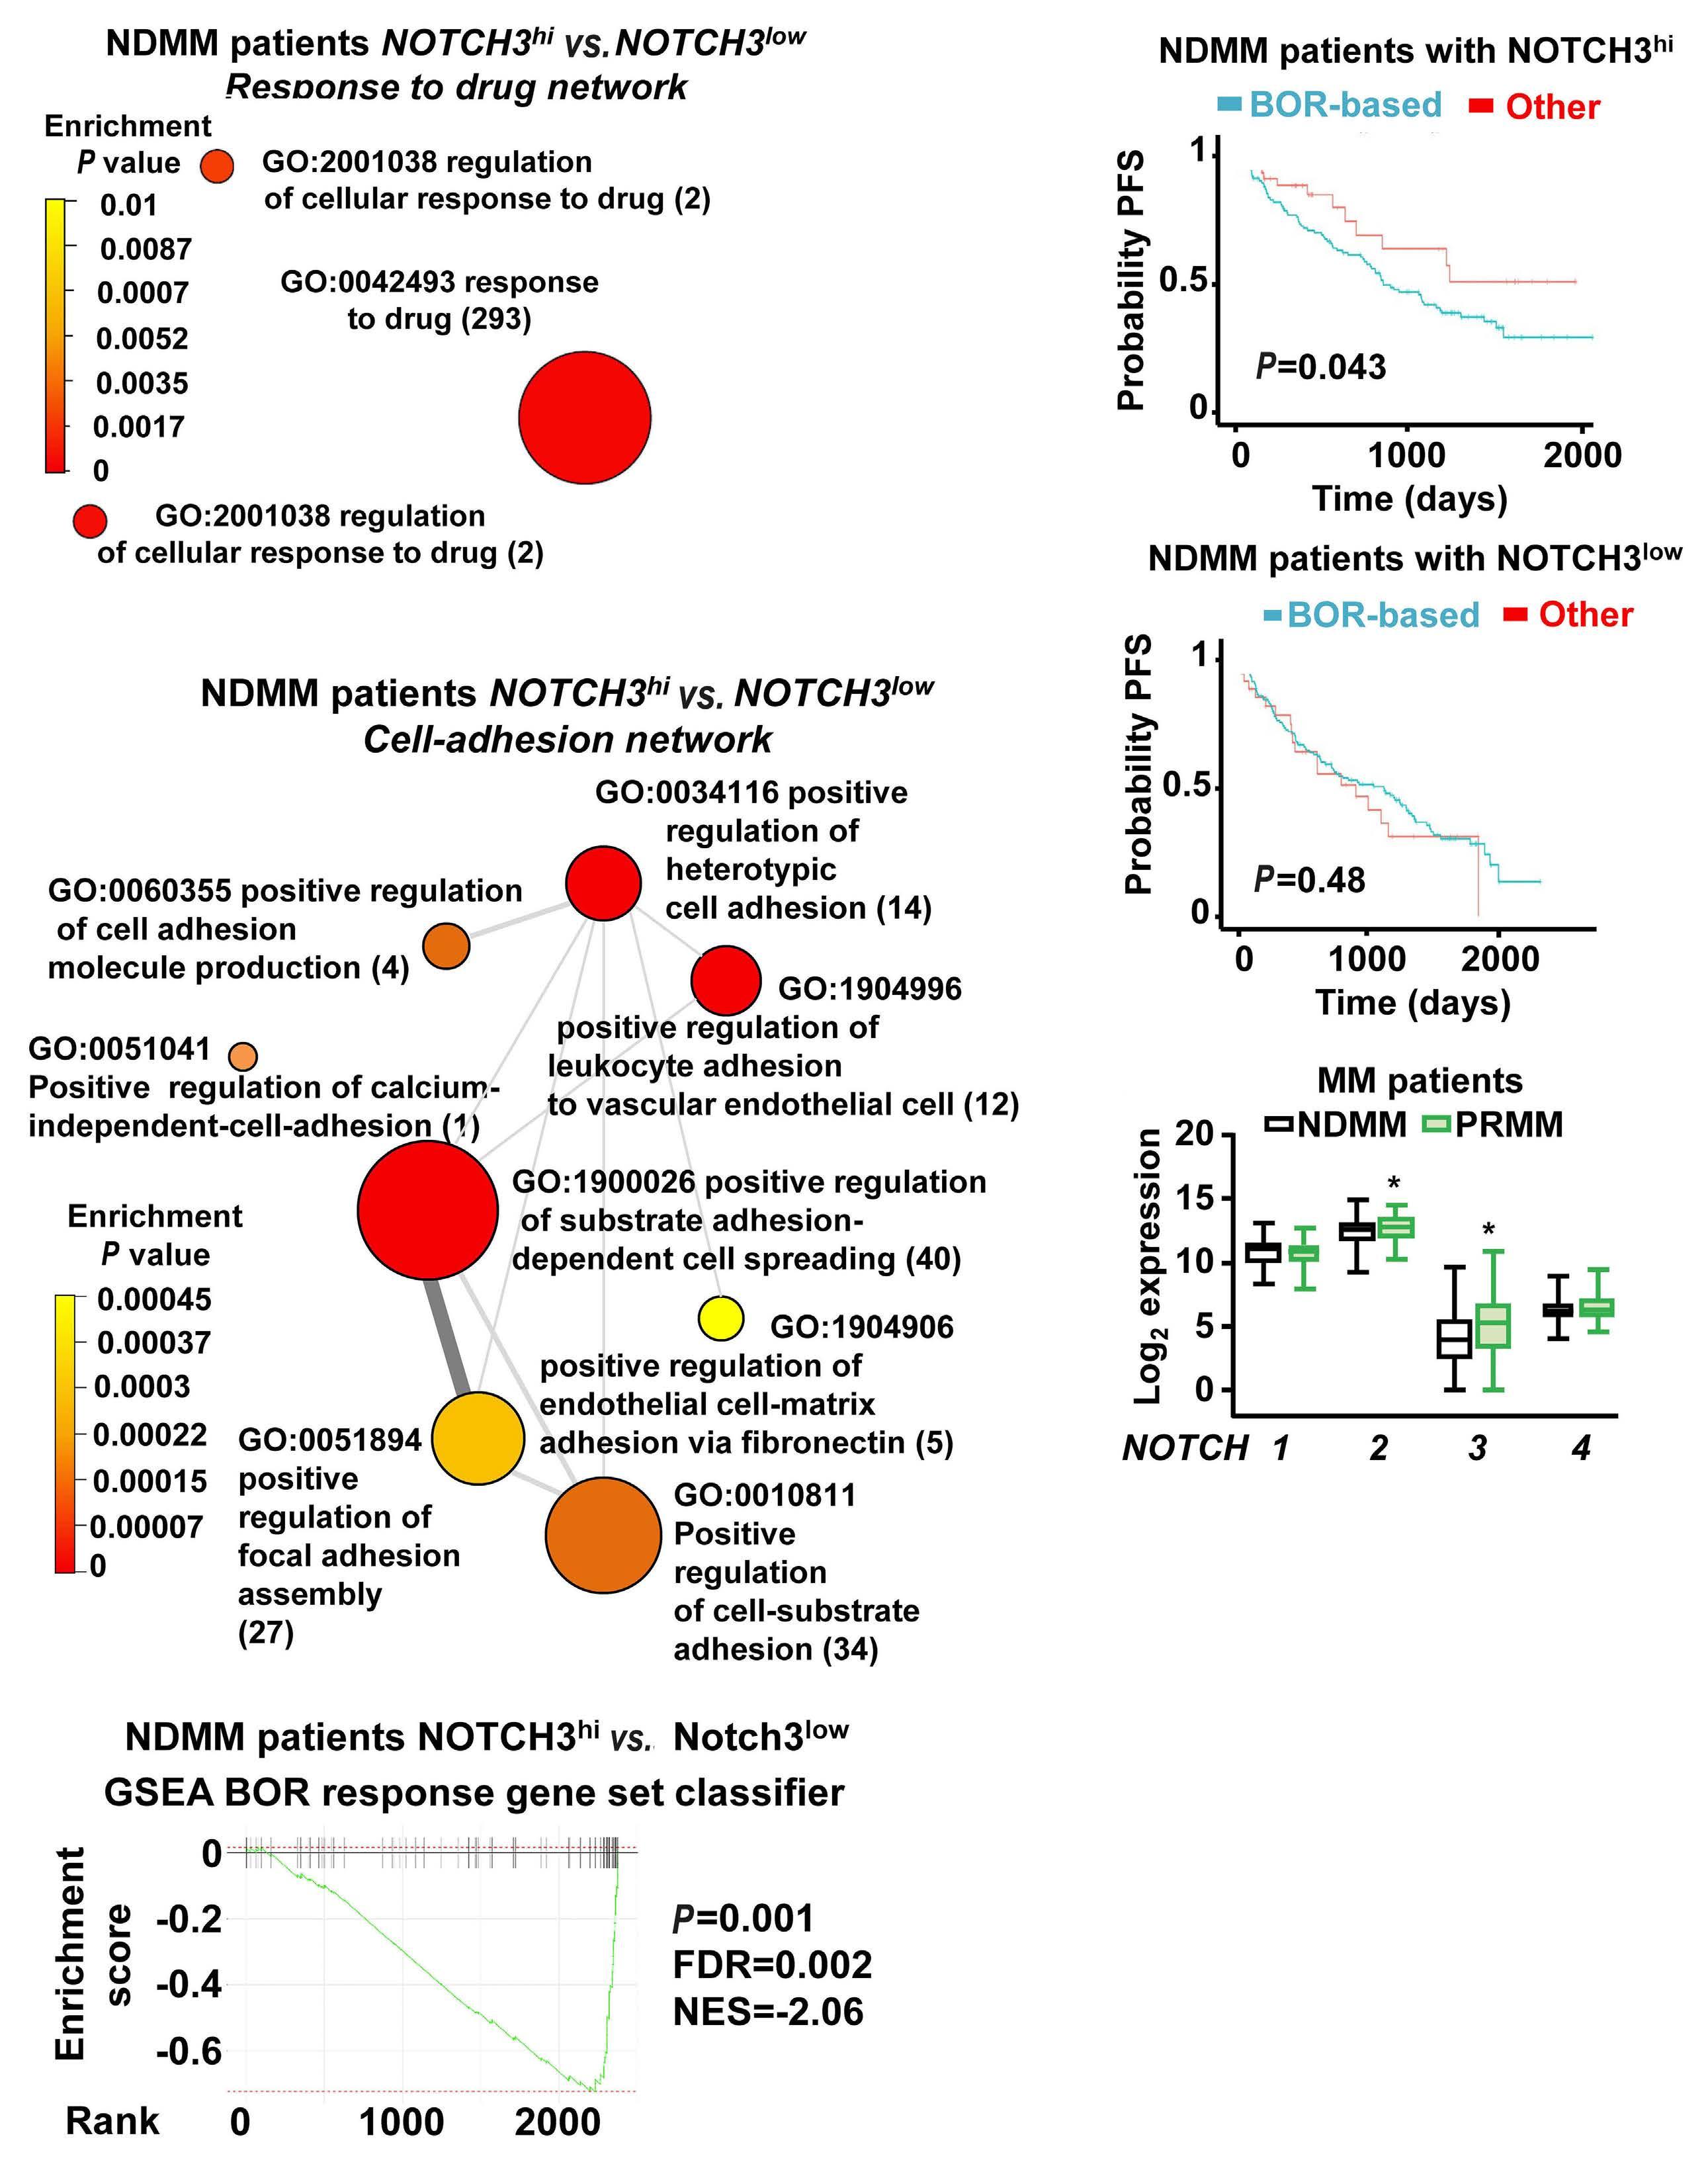
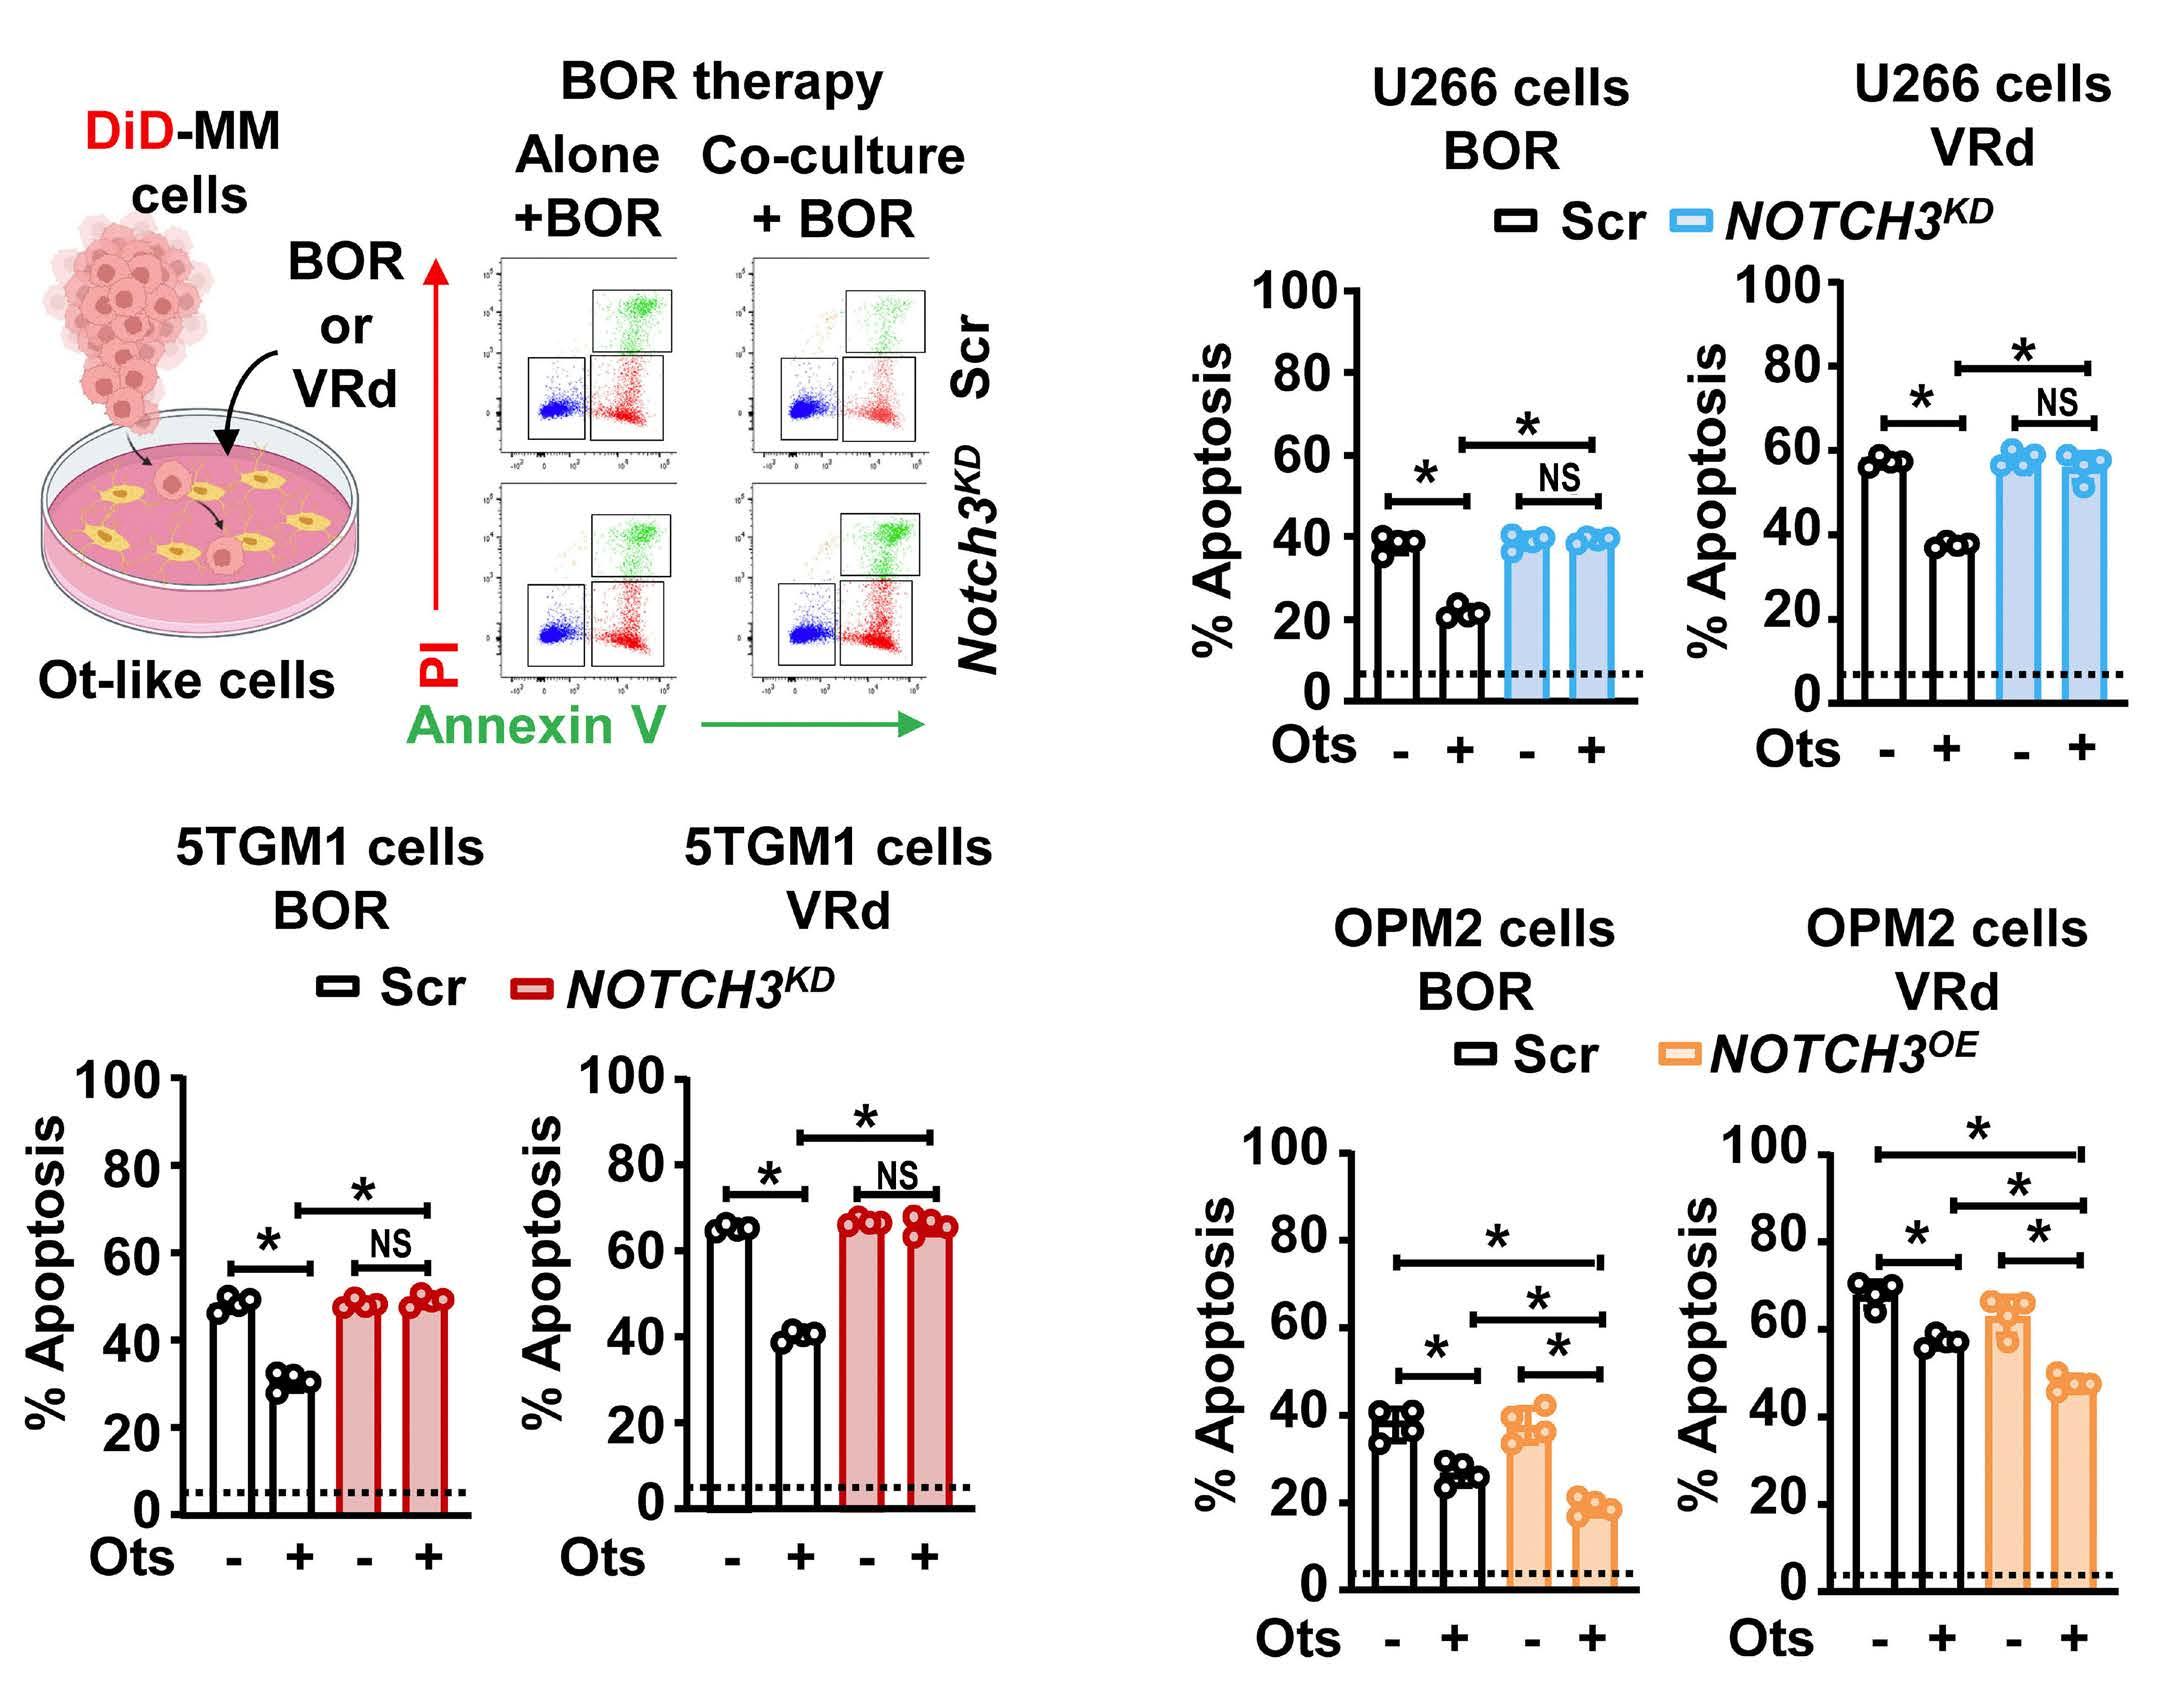
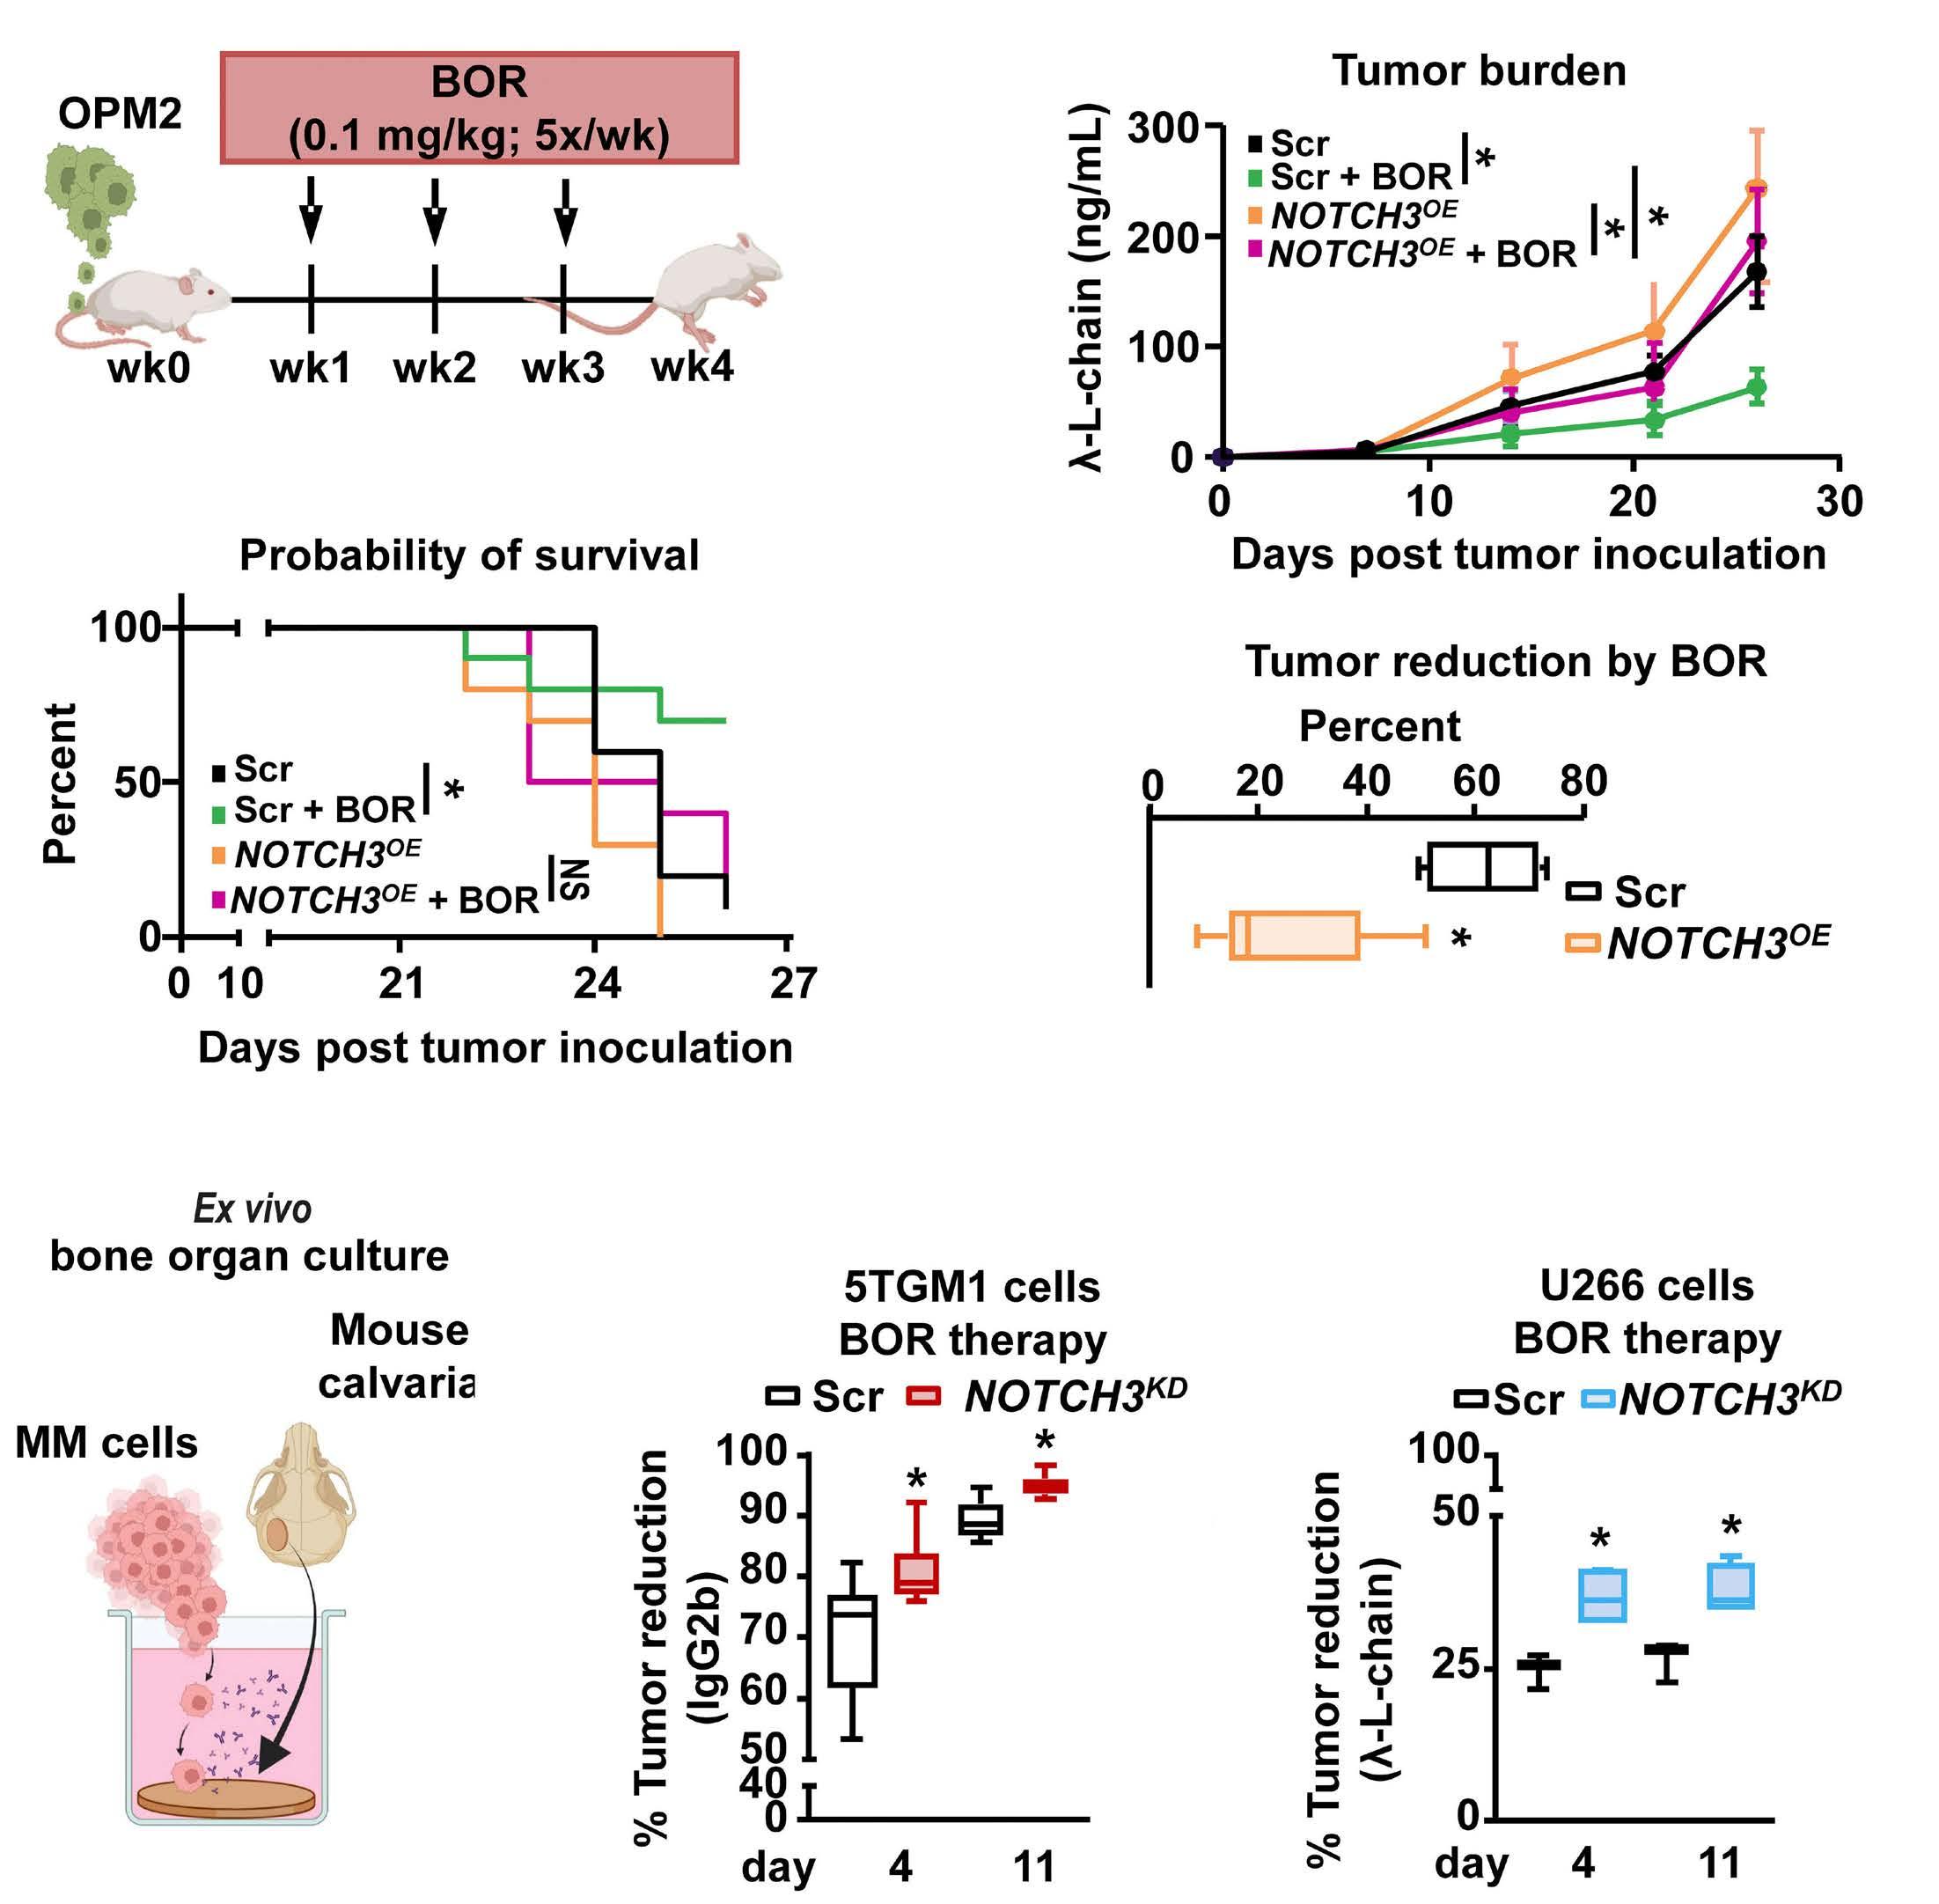
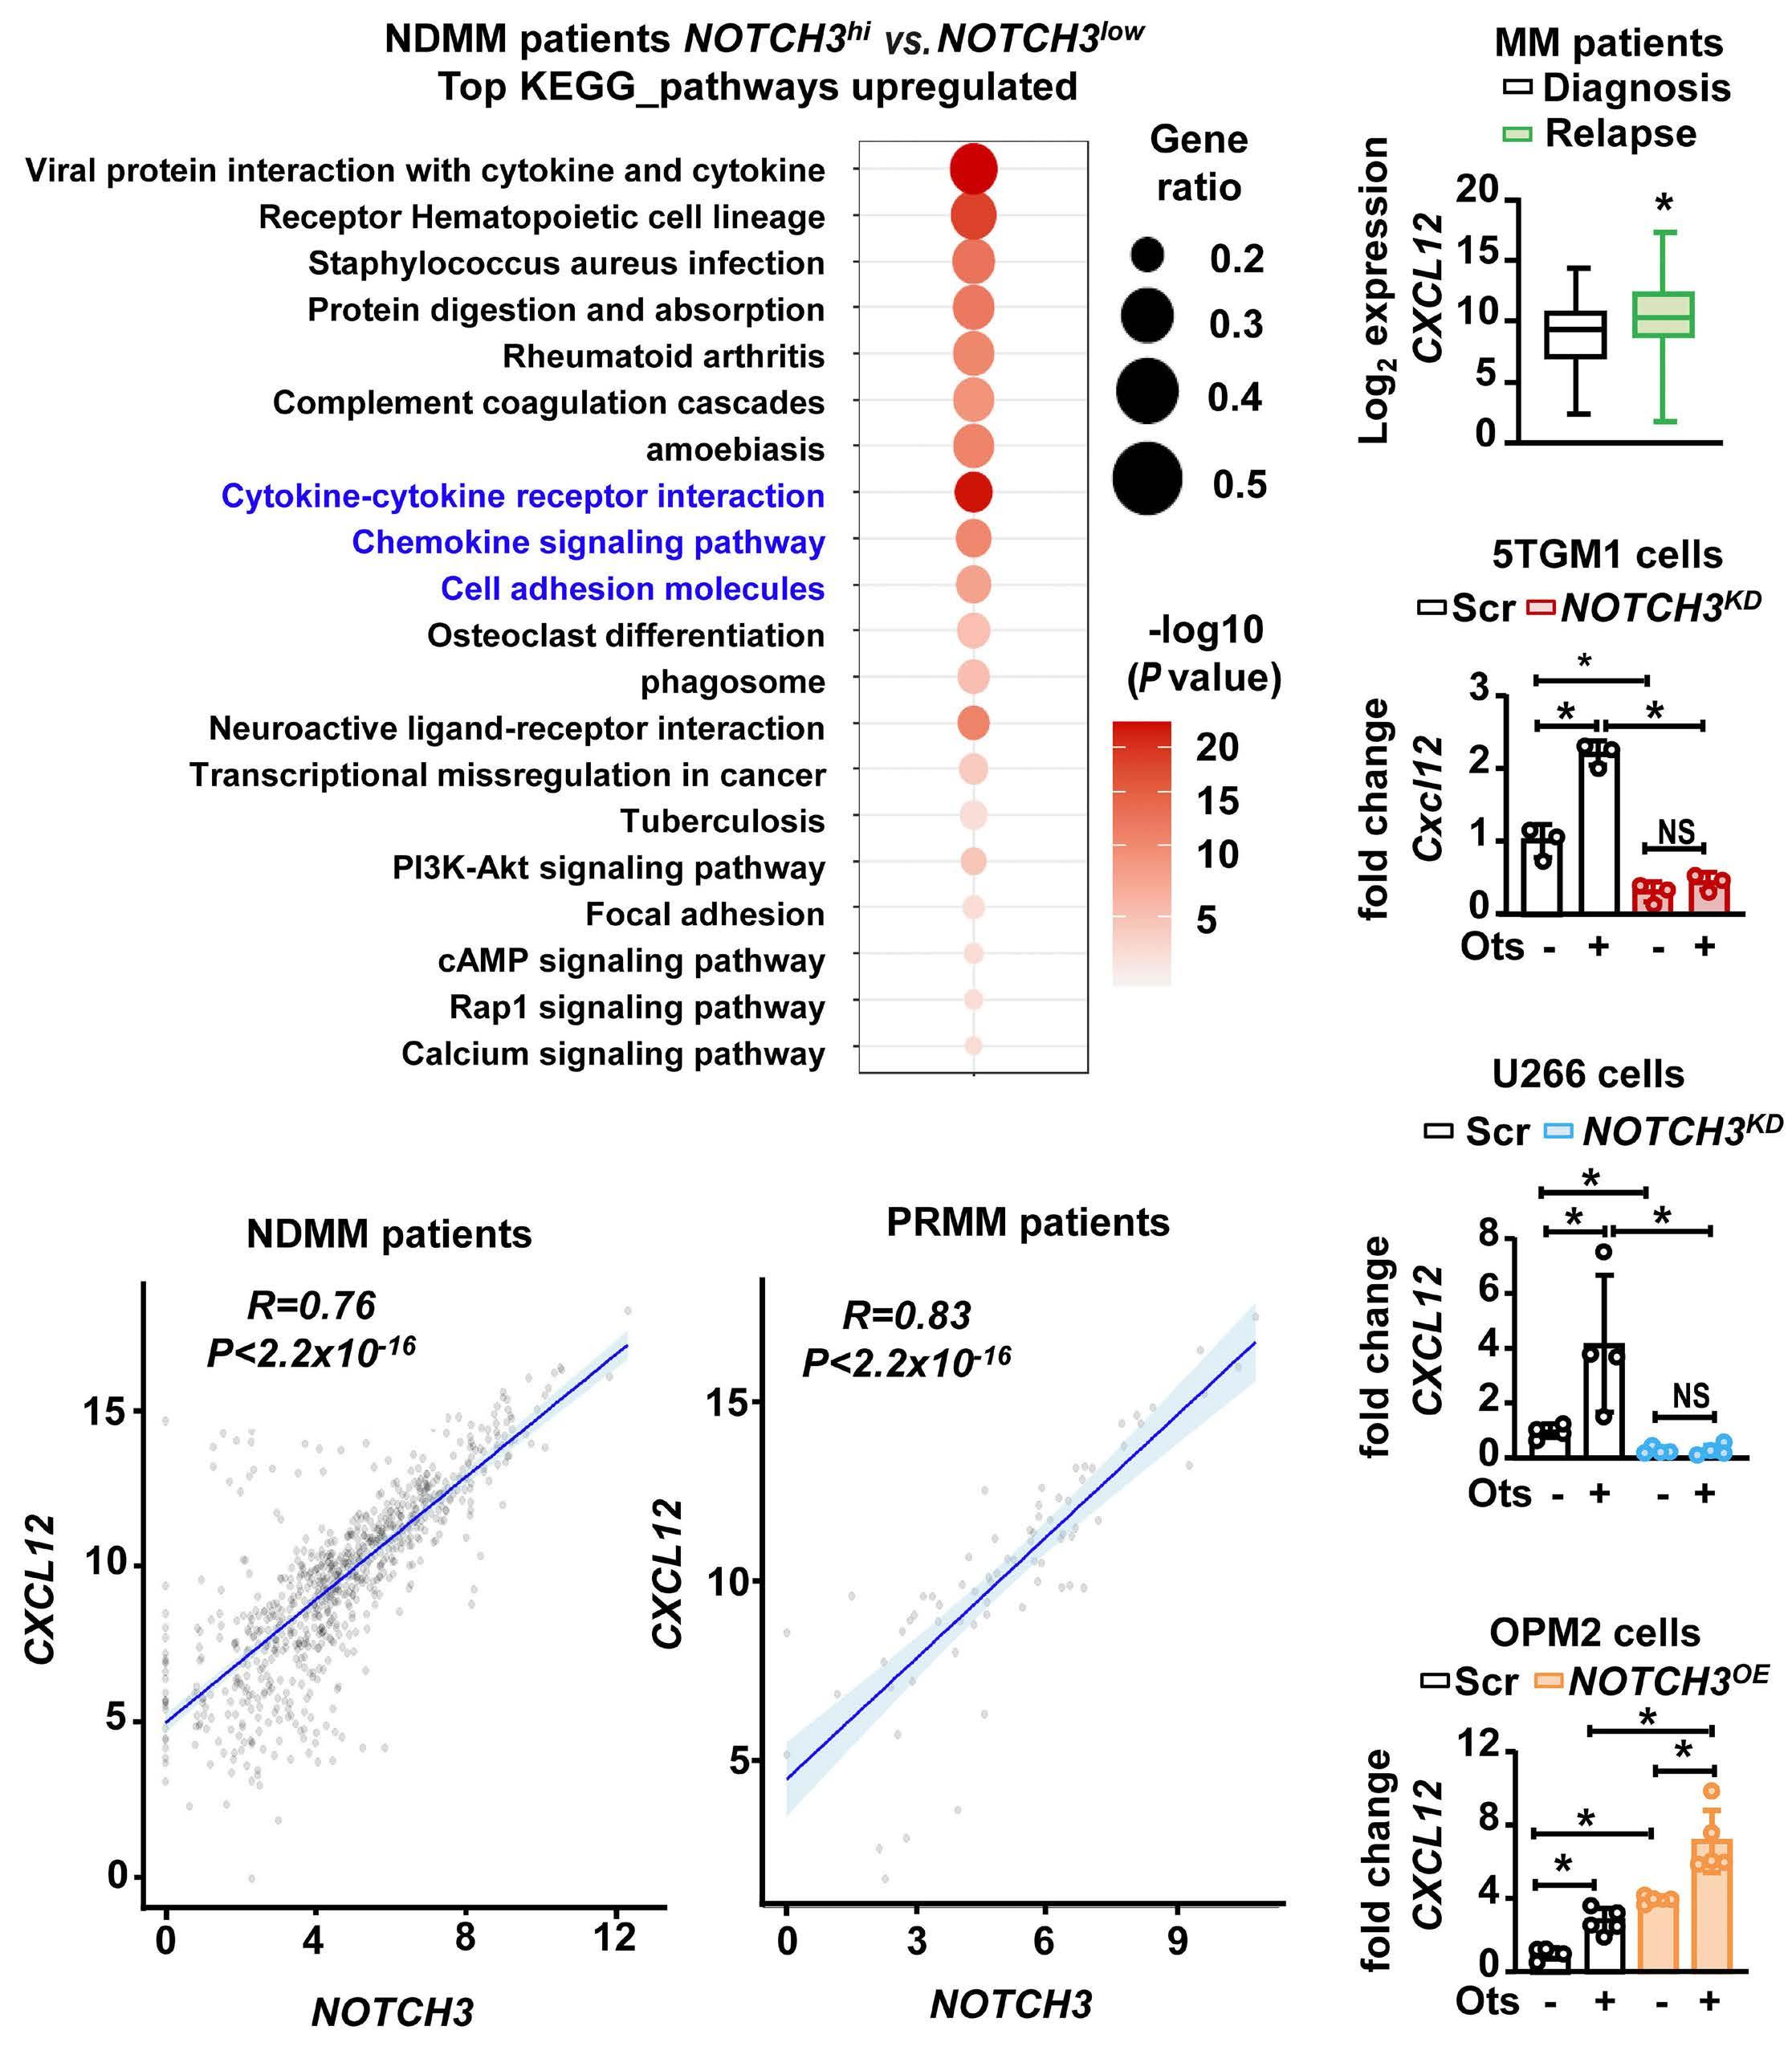
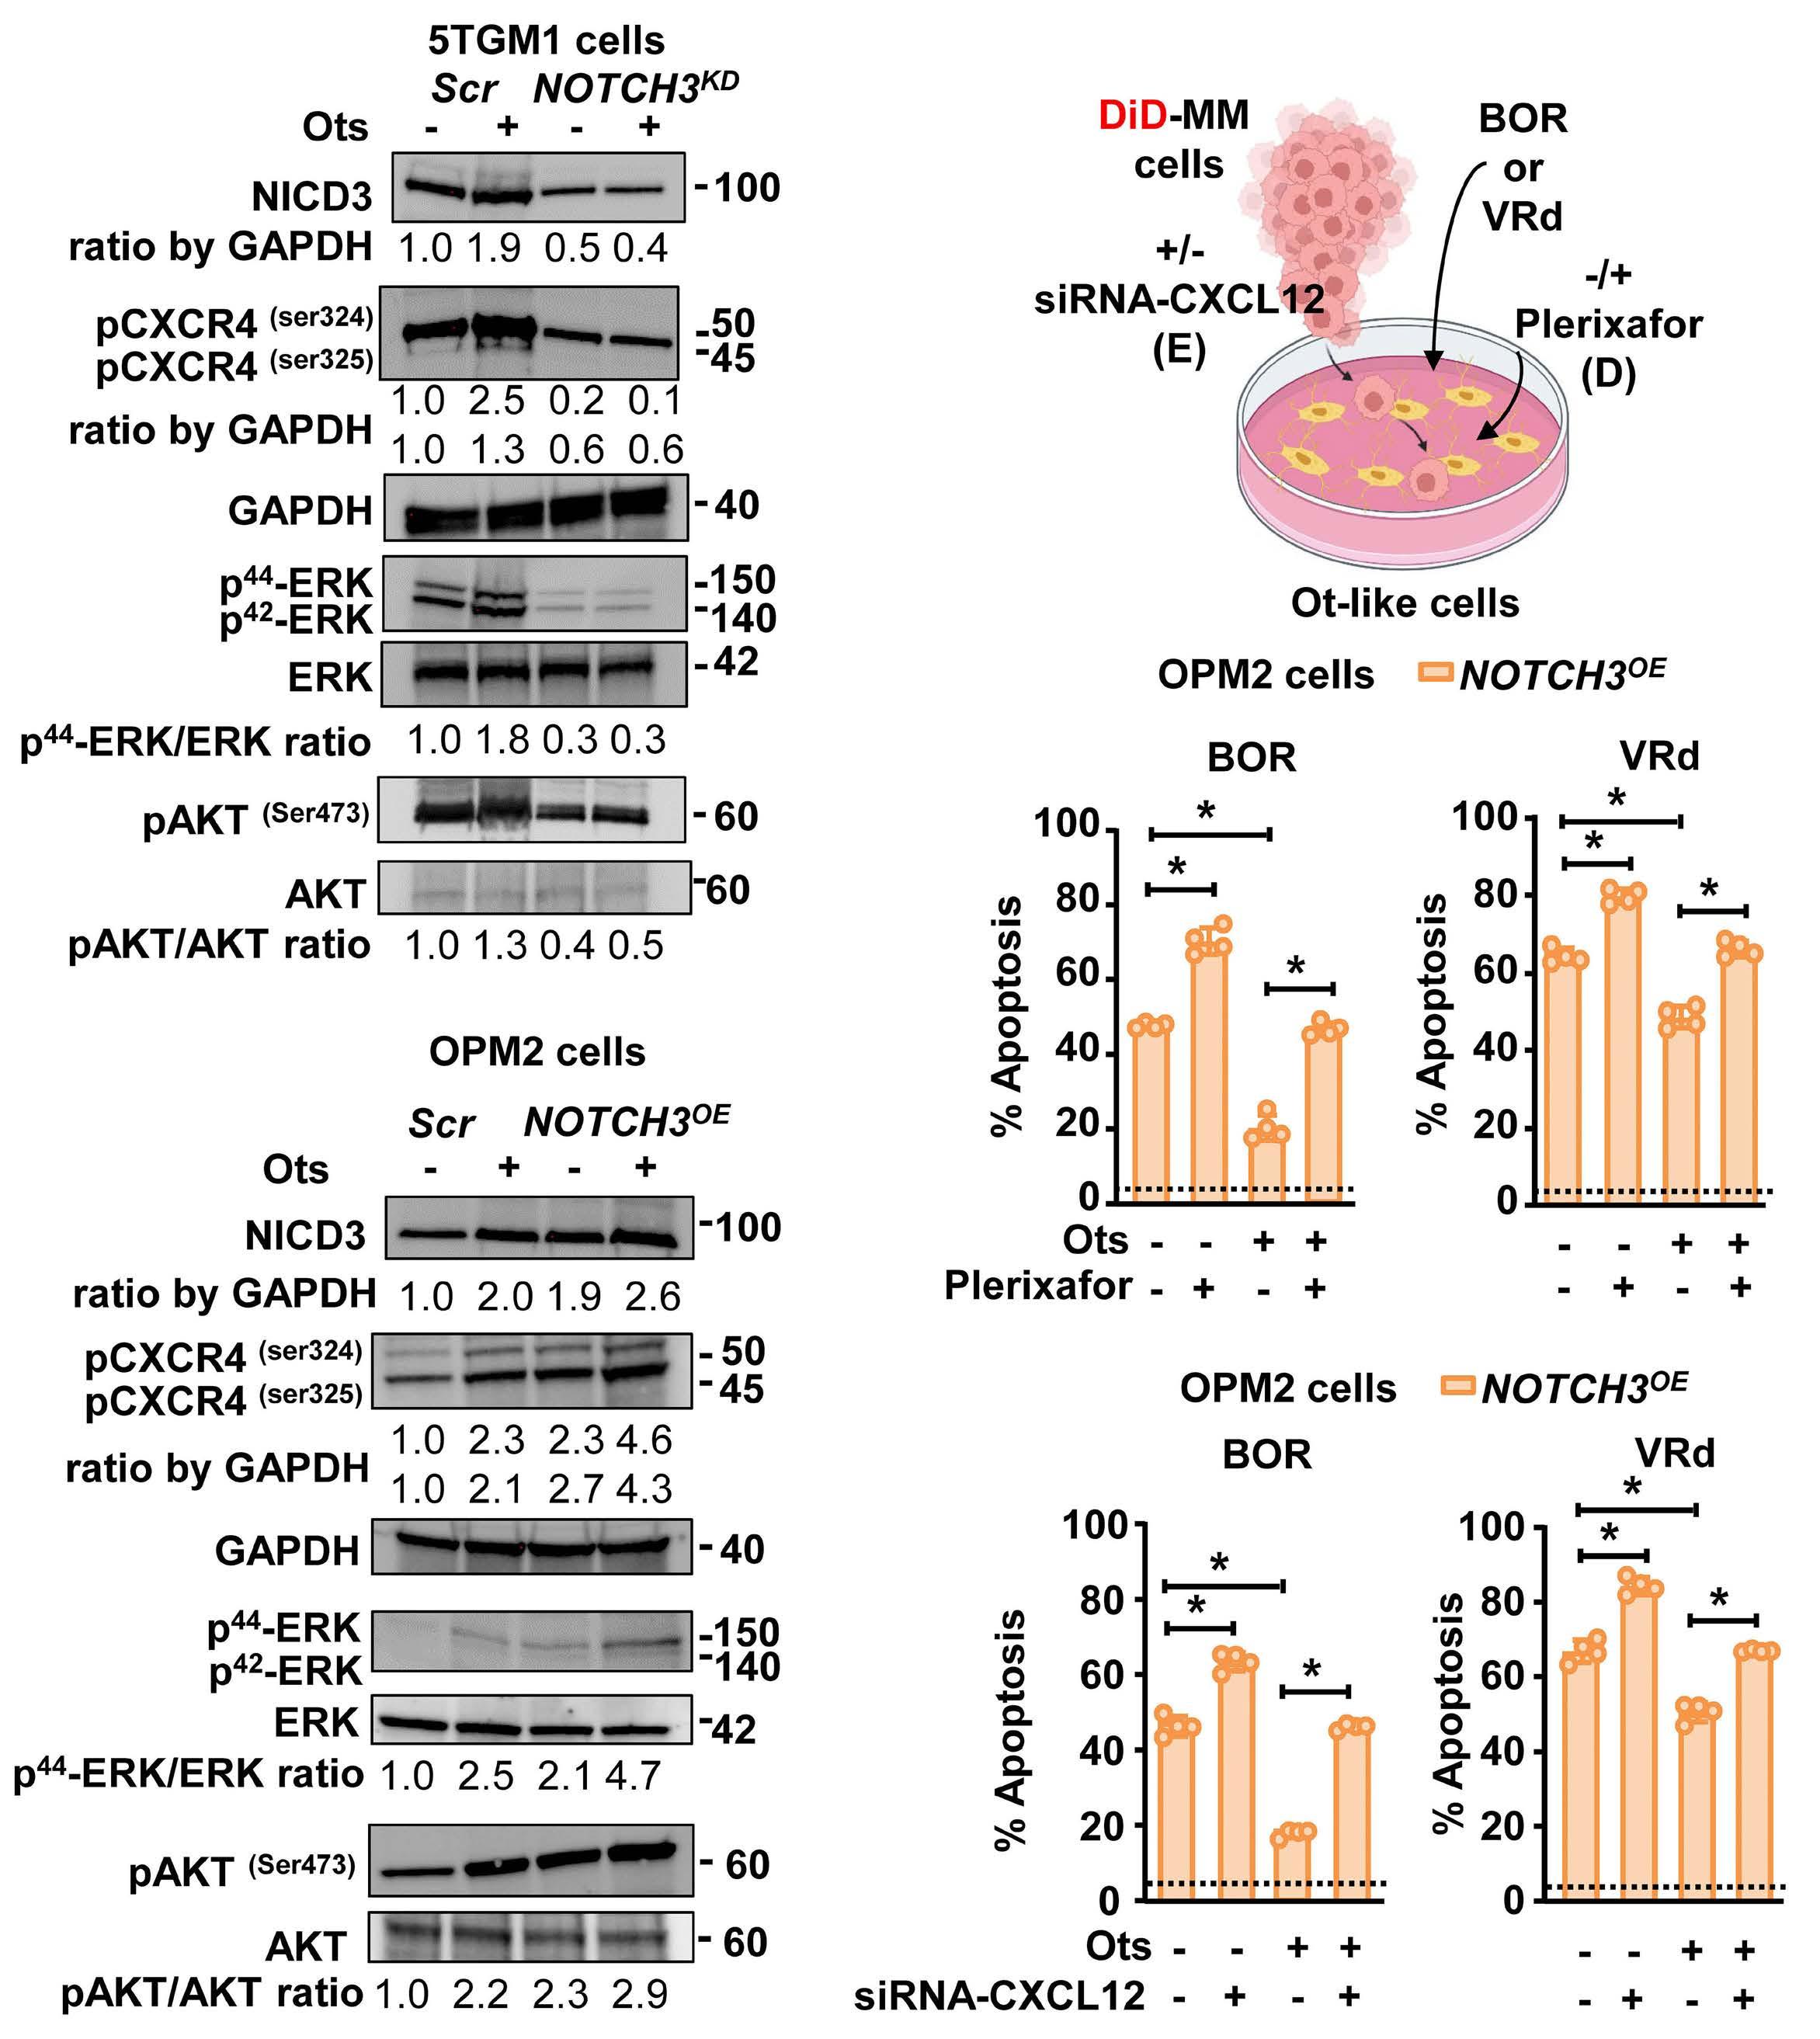
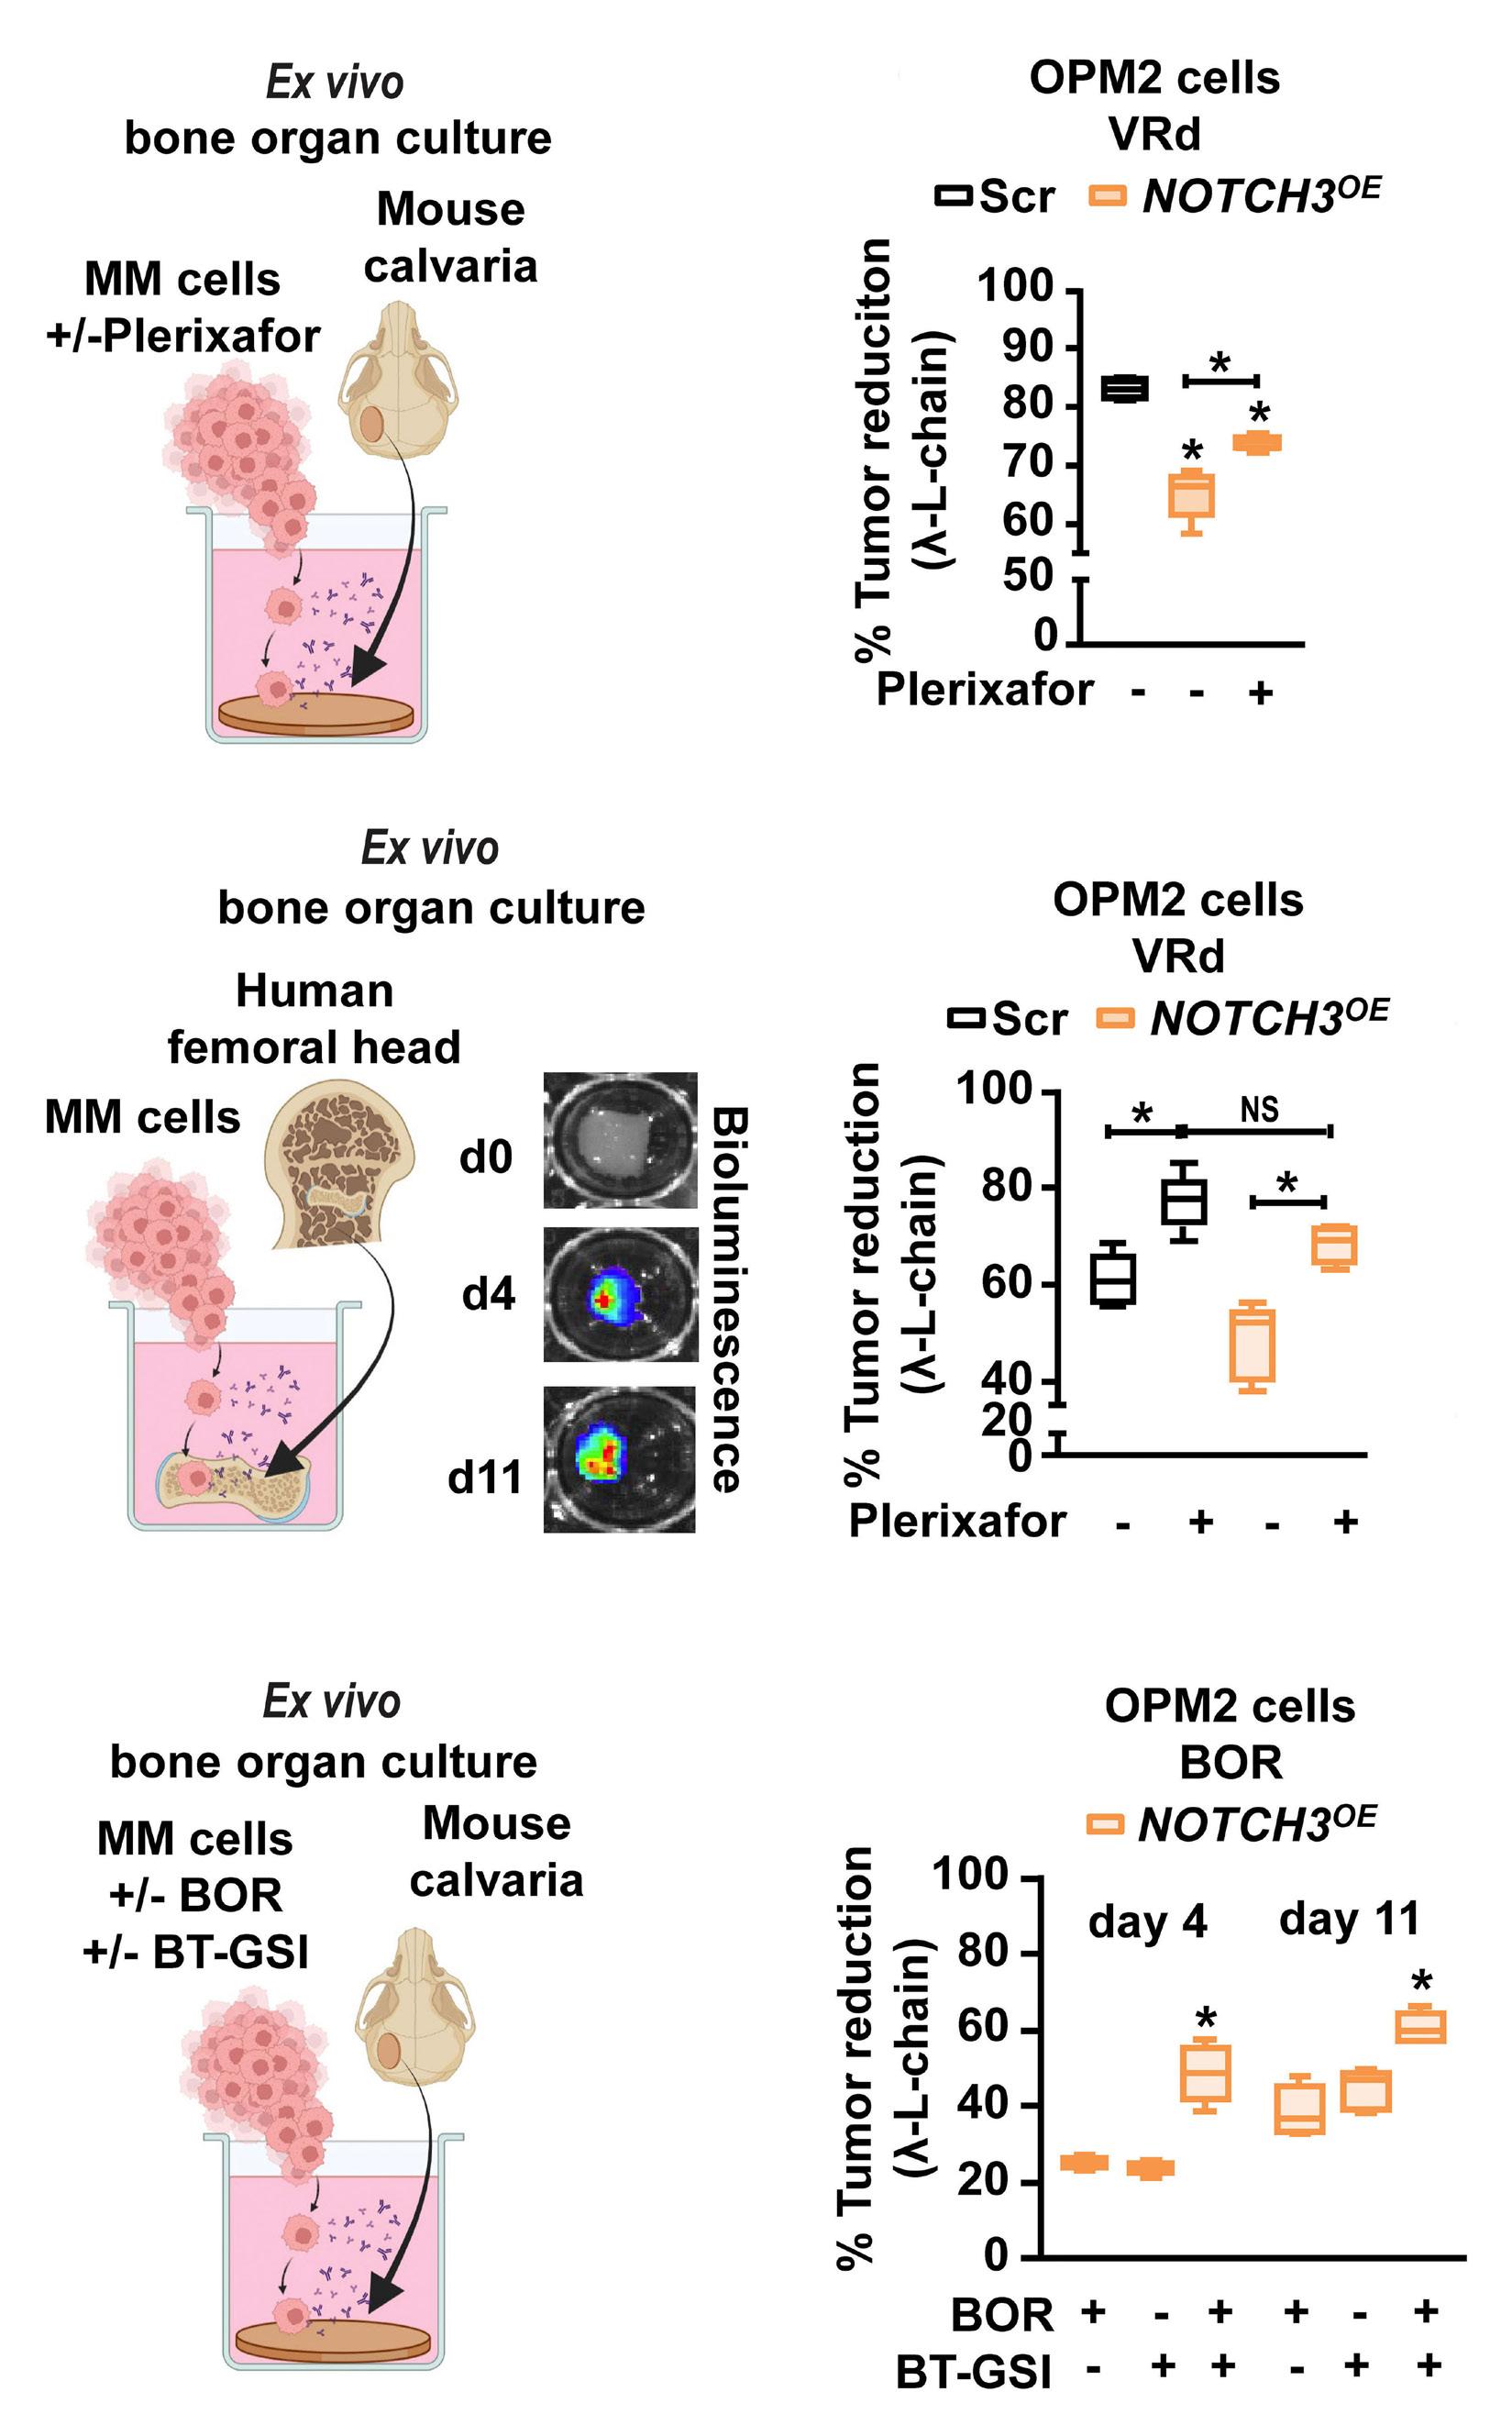
2606 A NOTCH3-CXCL12-driven myeloma-tumor niche signaling axis promotes chemoresistance in multiple myeloma
H.M. Sabol et al.
https://doi.org/10.3324/haematol.2023.284443
Plasma Cell Disorders
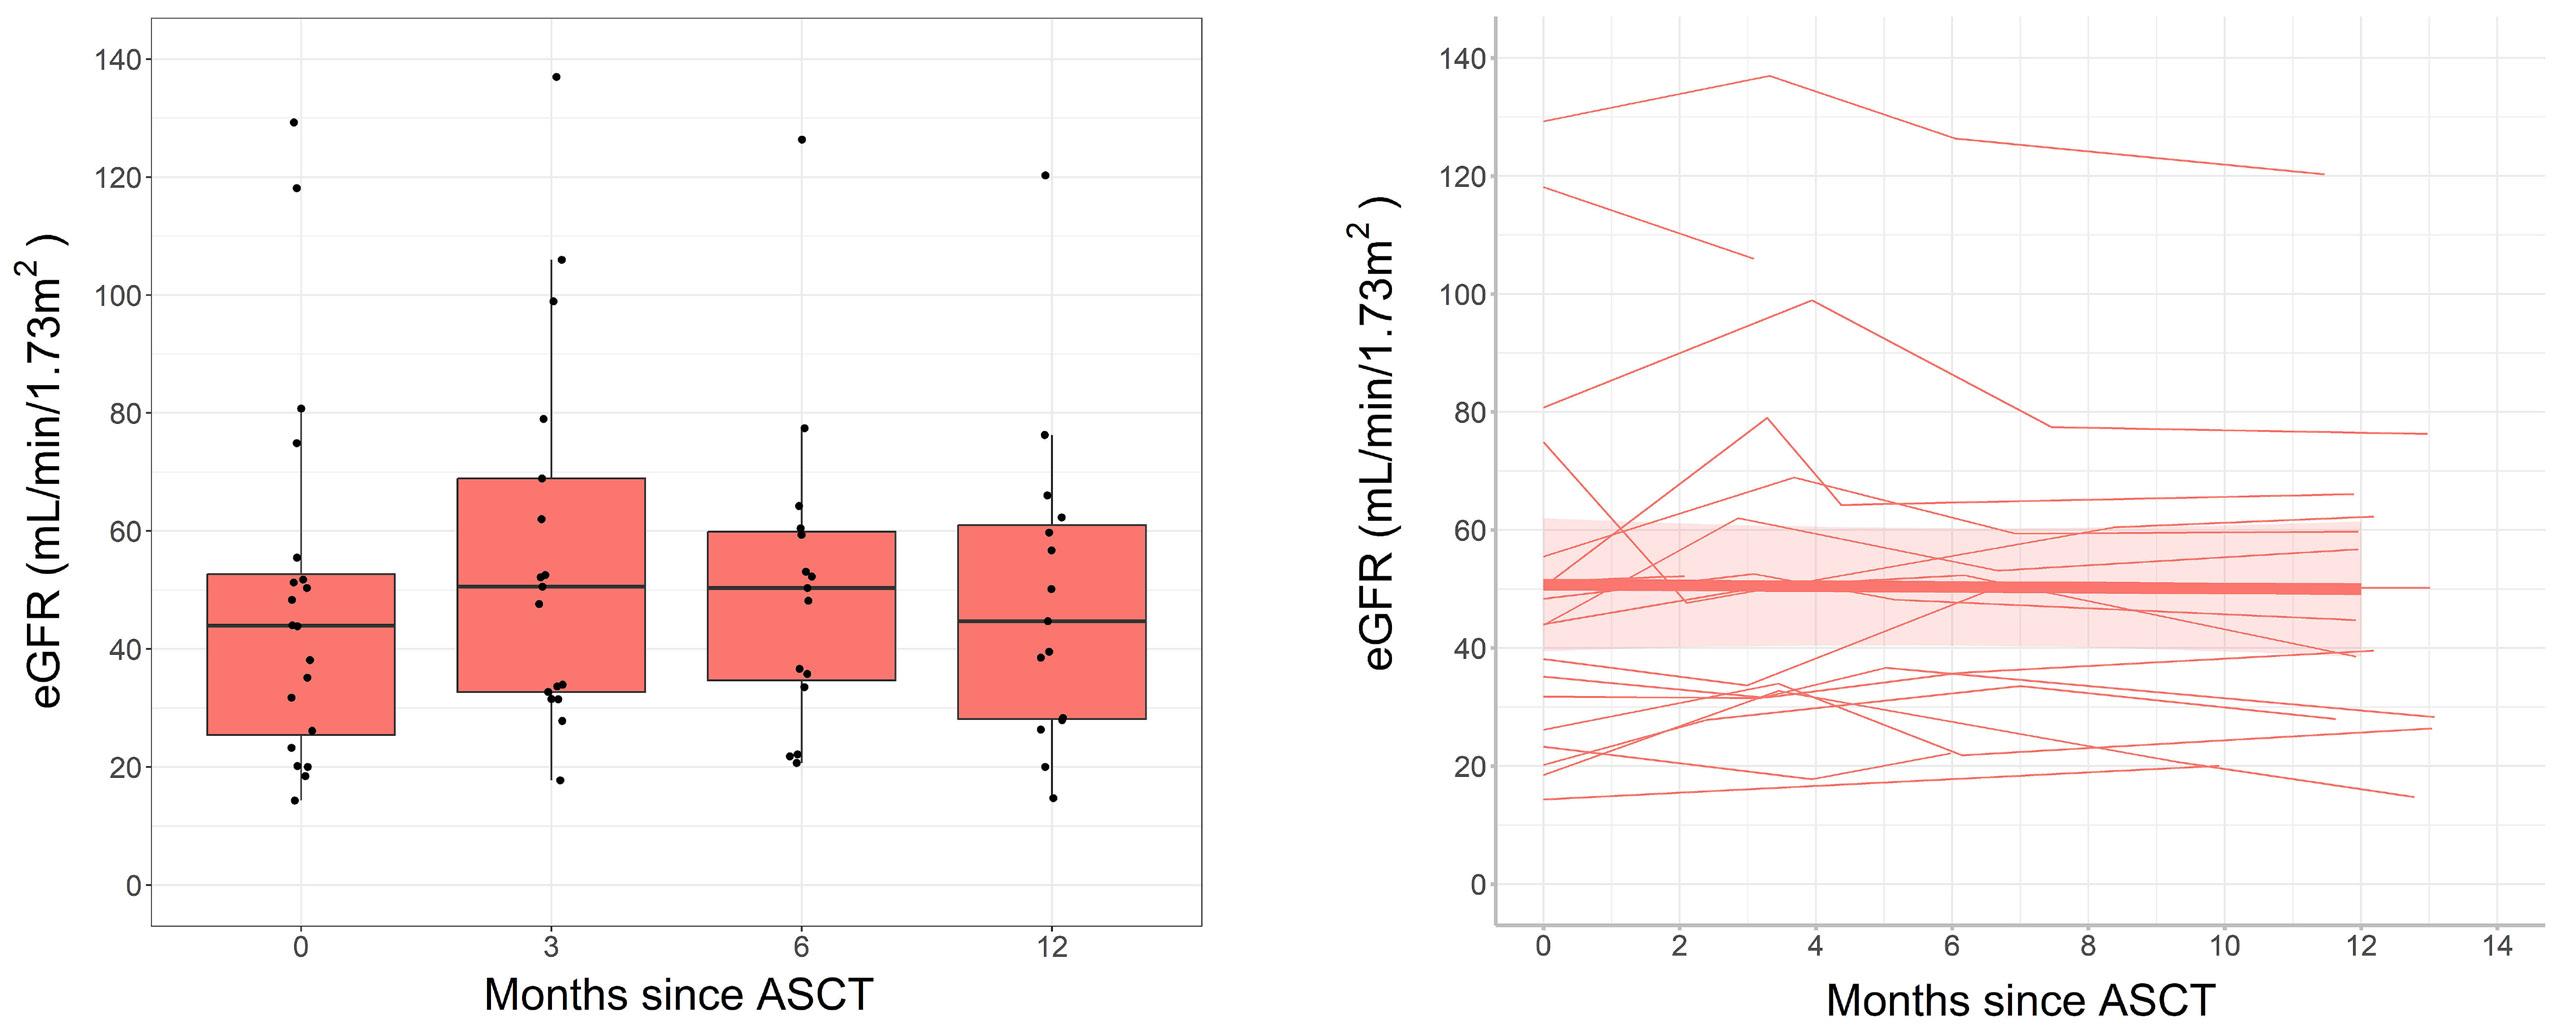
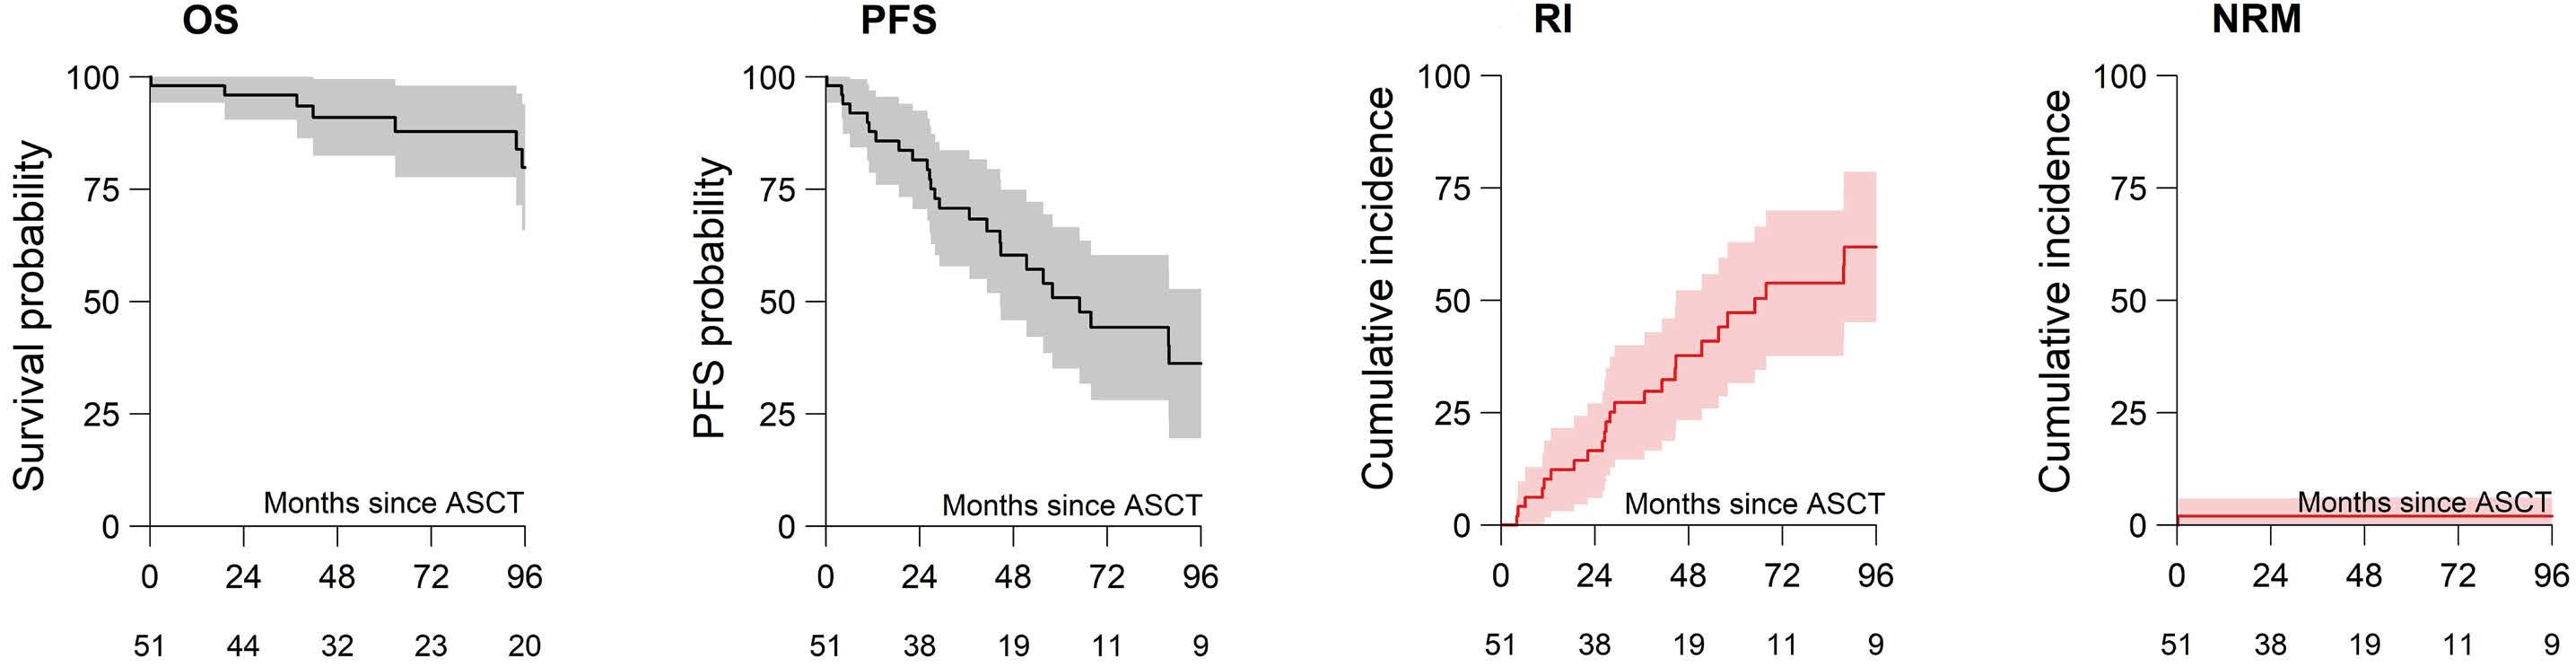
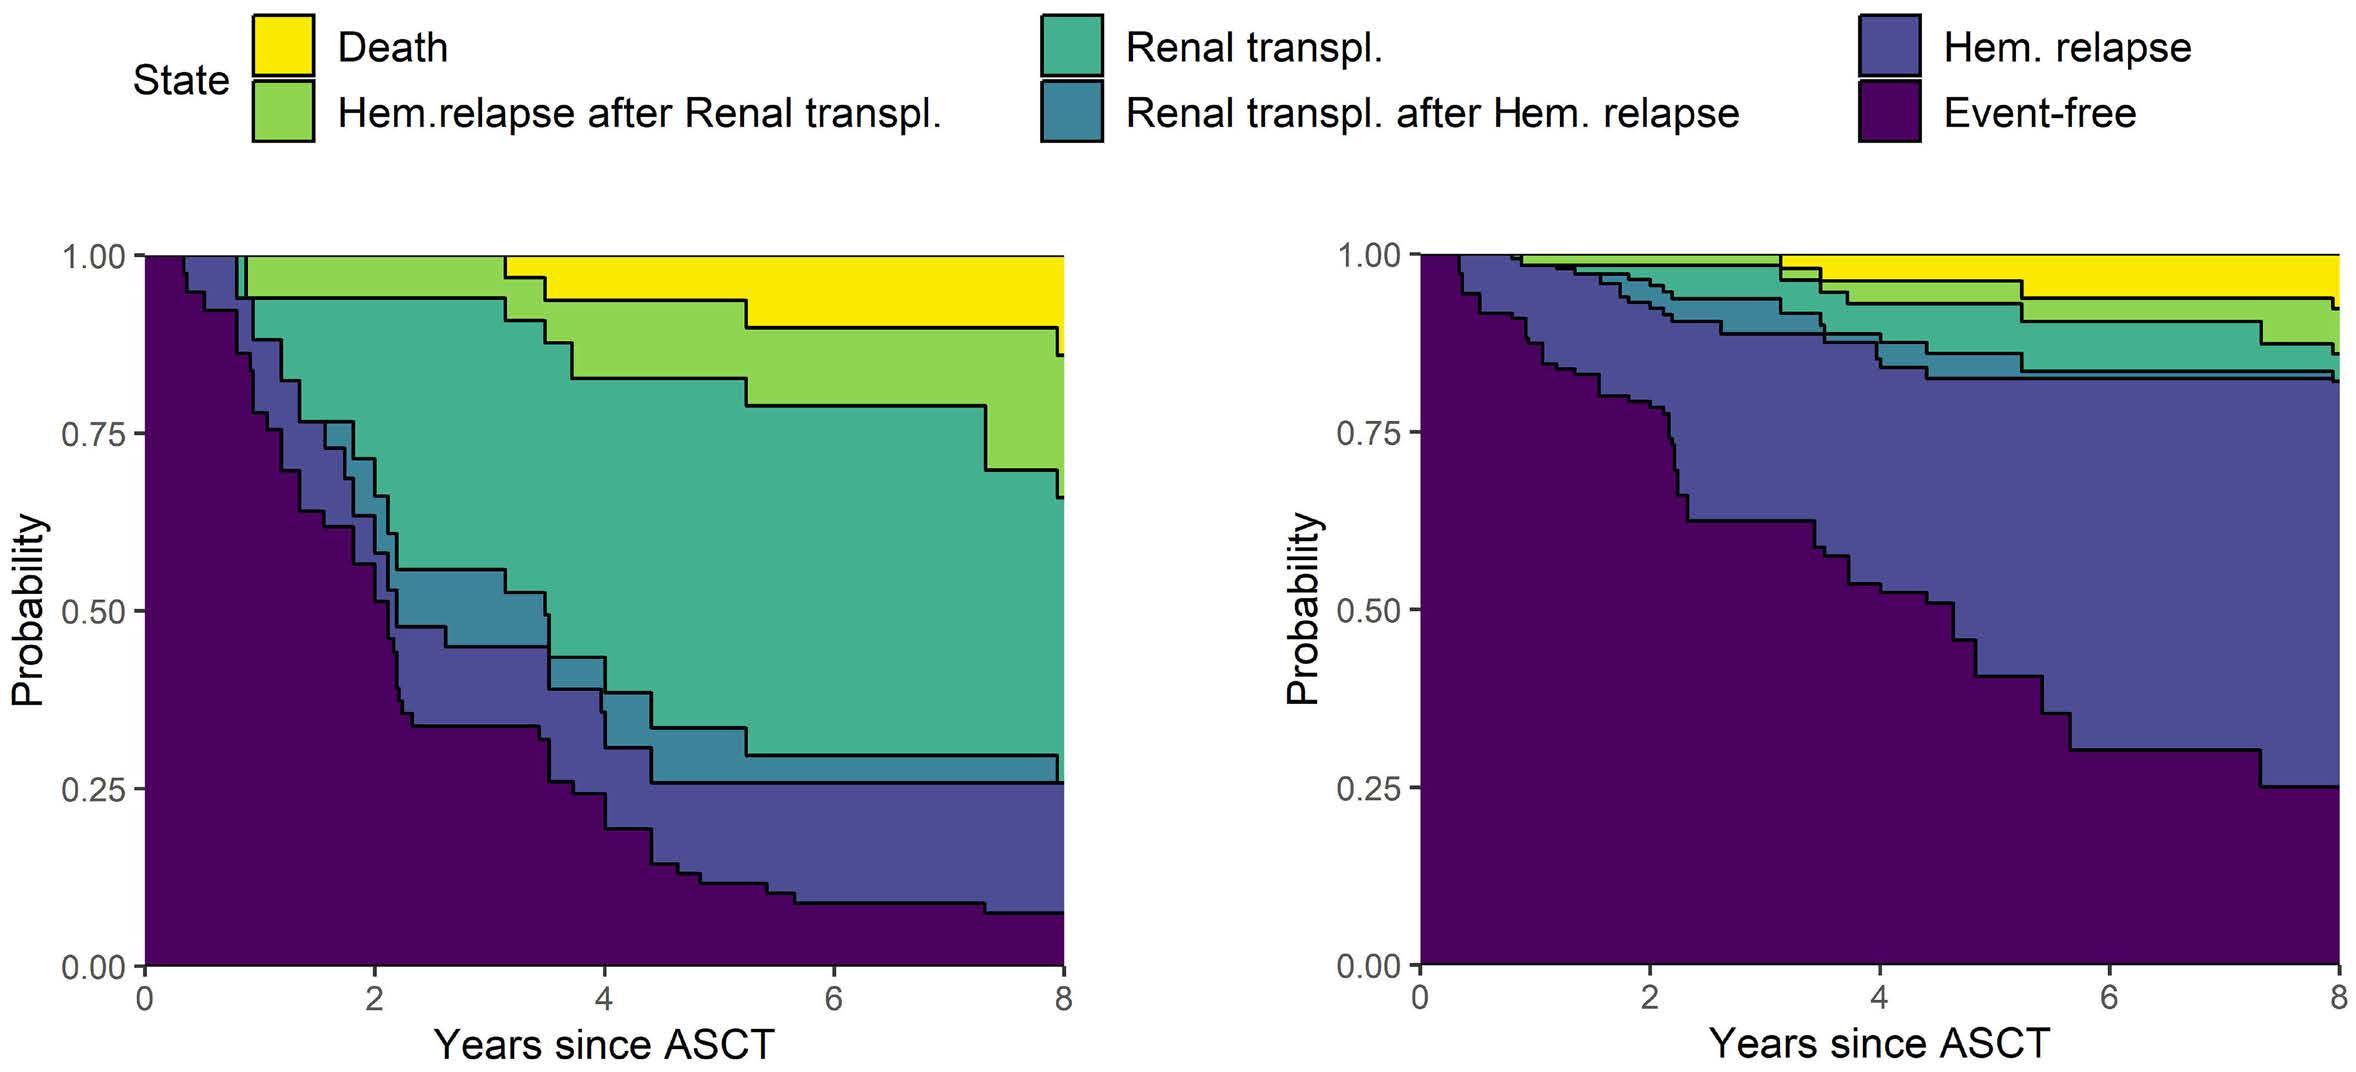
2619 Long-term outcomes and renal responses following autologous hematopoietic stem cell transplantation for light chain deposition disease: a retrospective study on behalf of the Chronic Malignancies Working Party of the European Society for Blood and Marrow Transplantation
L. Garderet et al.
https://doi.org/10.3324/haematol.2023.284520
Red Cell Biology & its Disorders
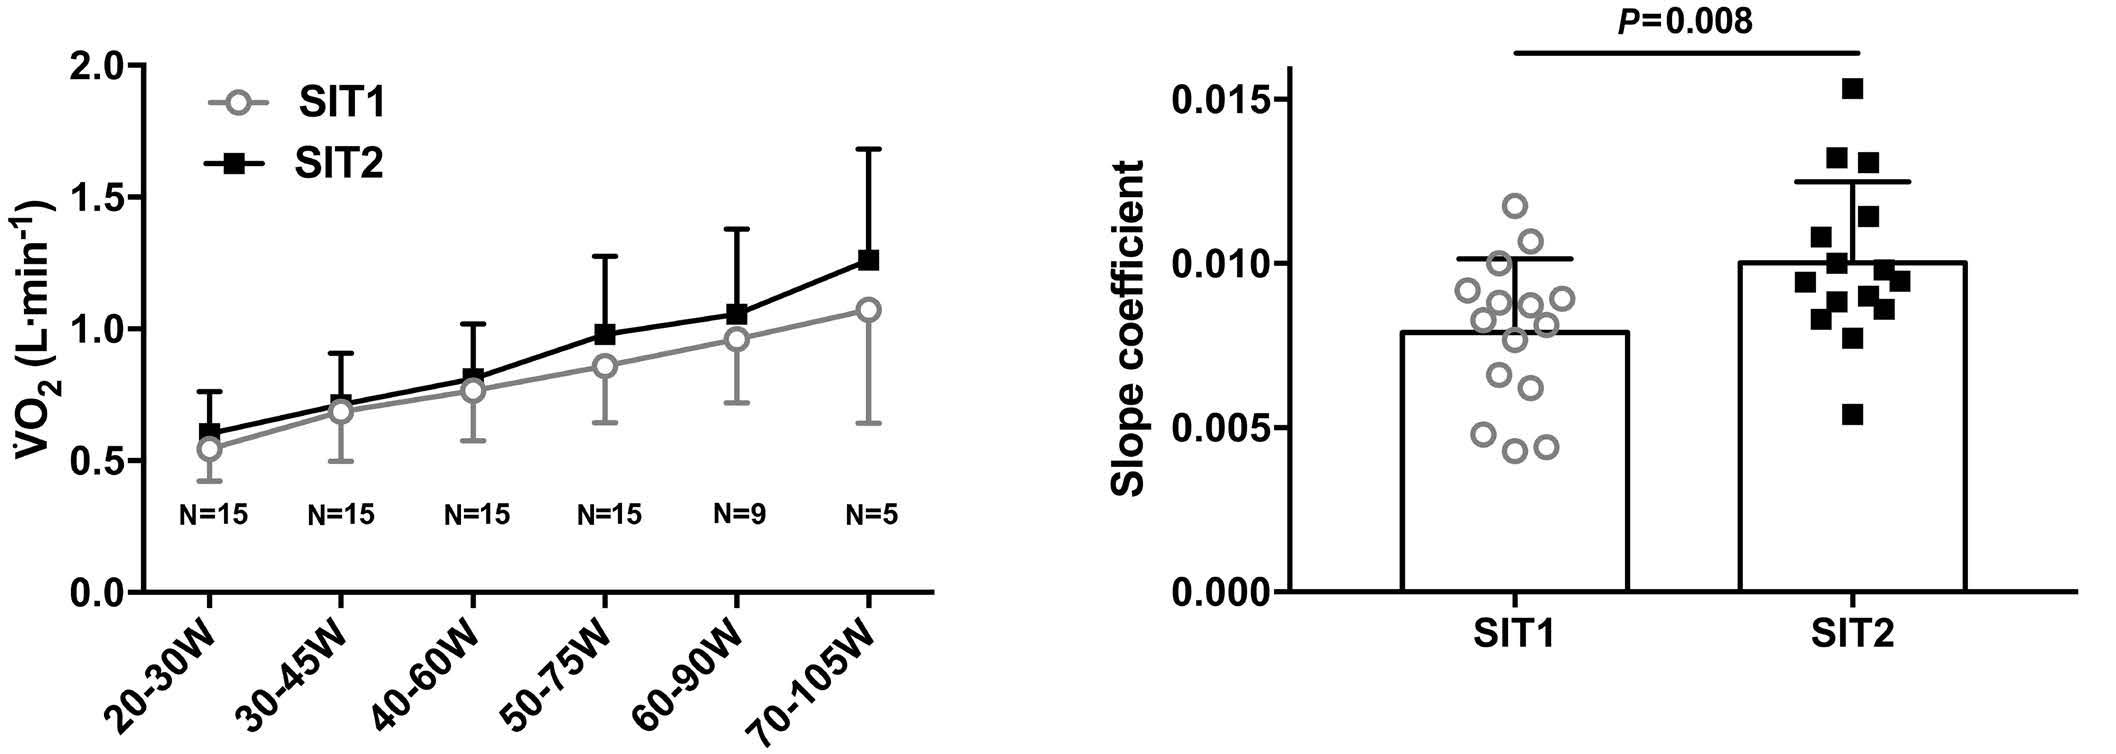
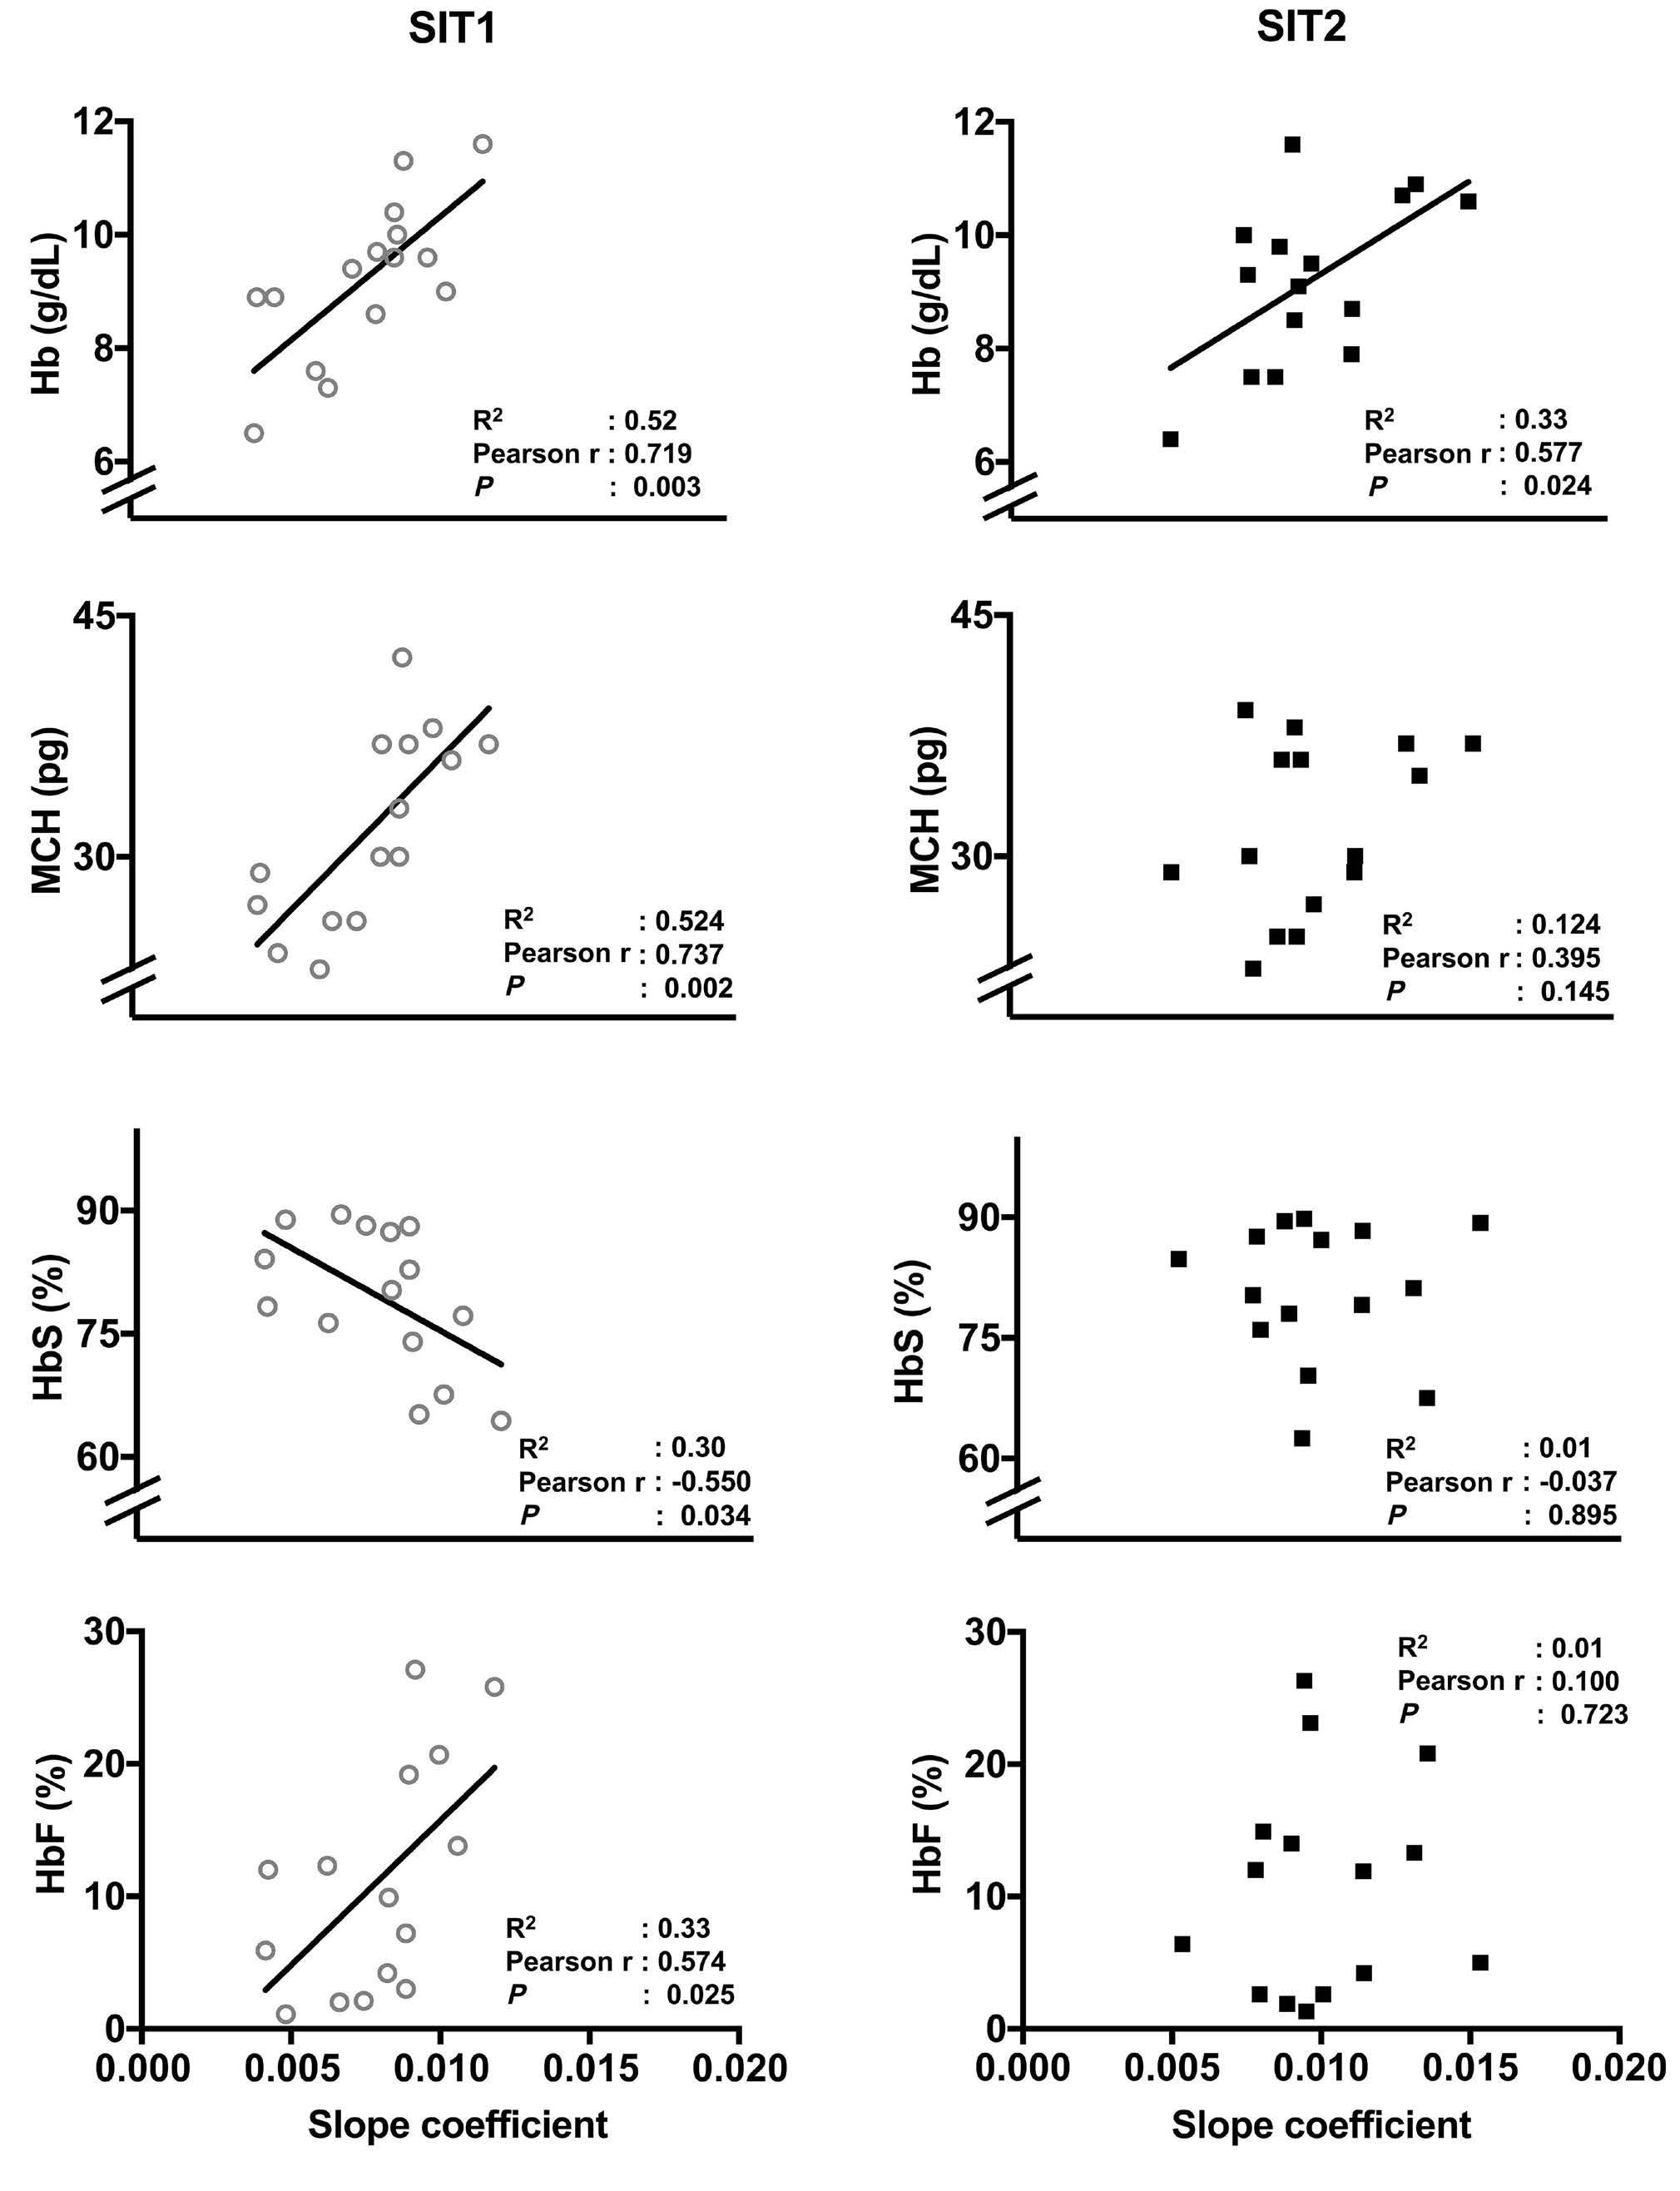
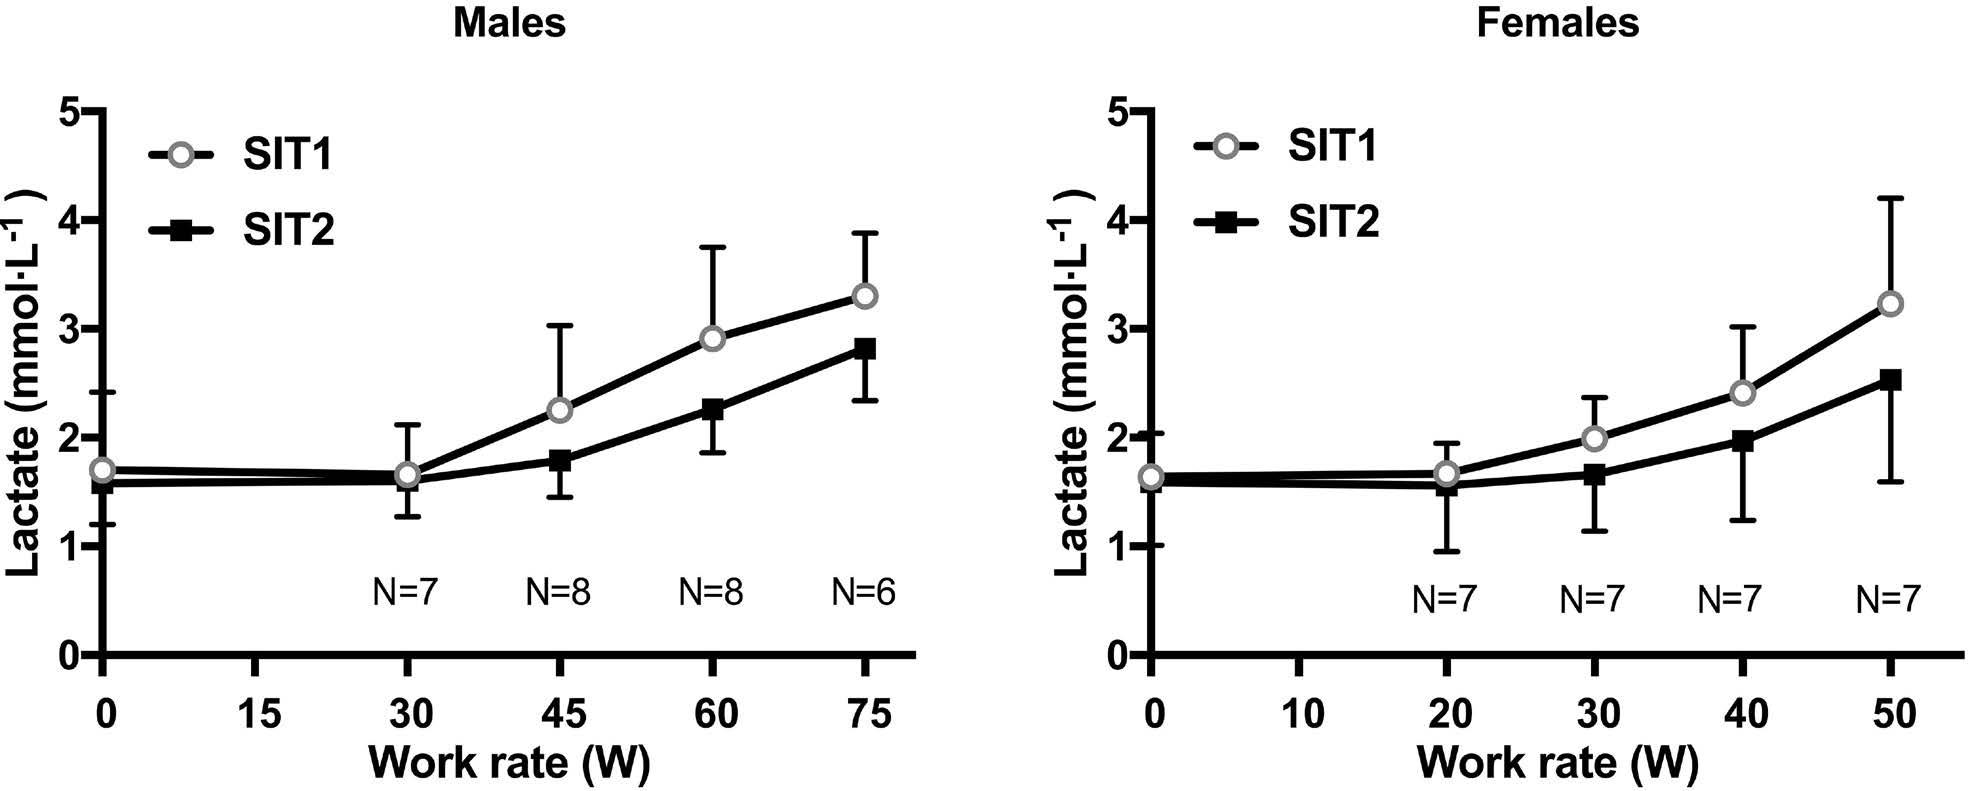
2628 Endurance training improves oxygen uptake/demand mismatch, metabolic flexibility and recovery in patients with sickle cell disease
L. Mougin et al.
https://doi.org/10.3324/haematol.2023.284474
Red Cell Biology & its Disorders
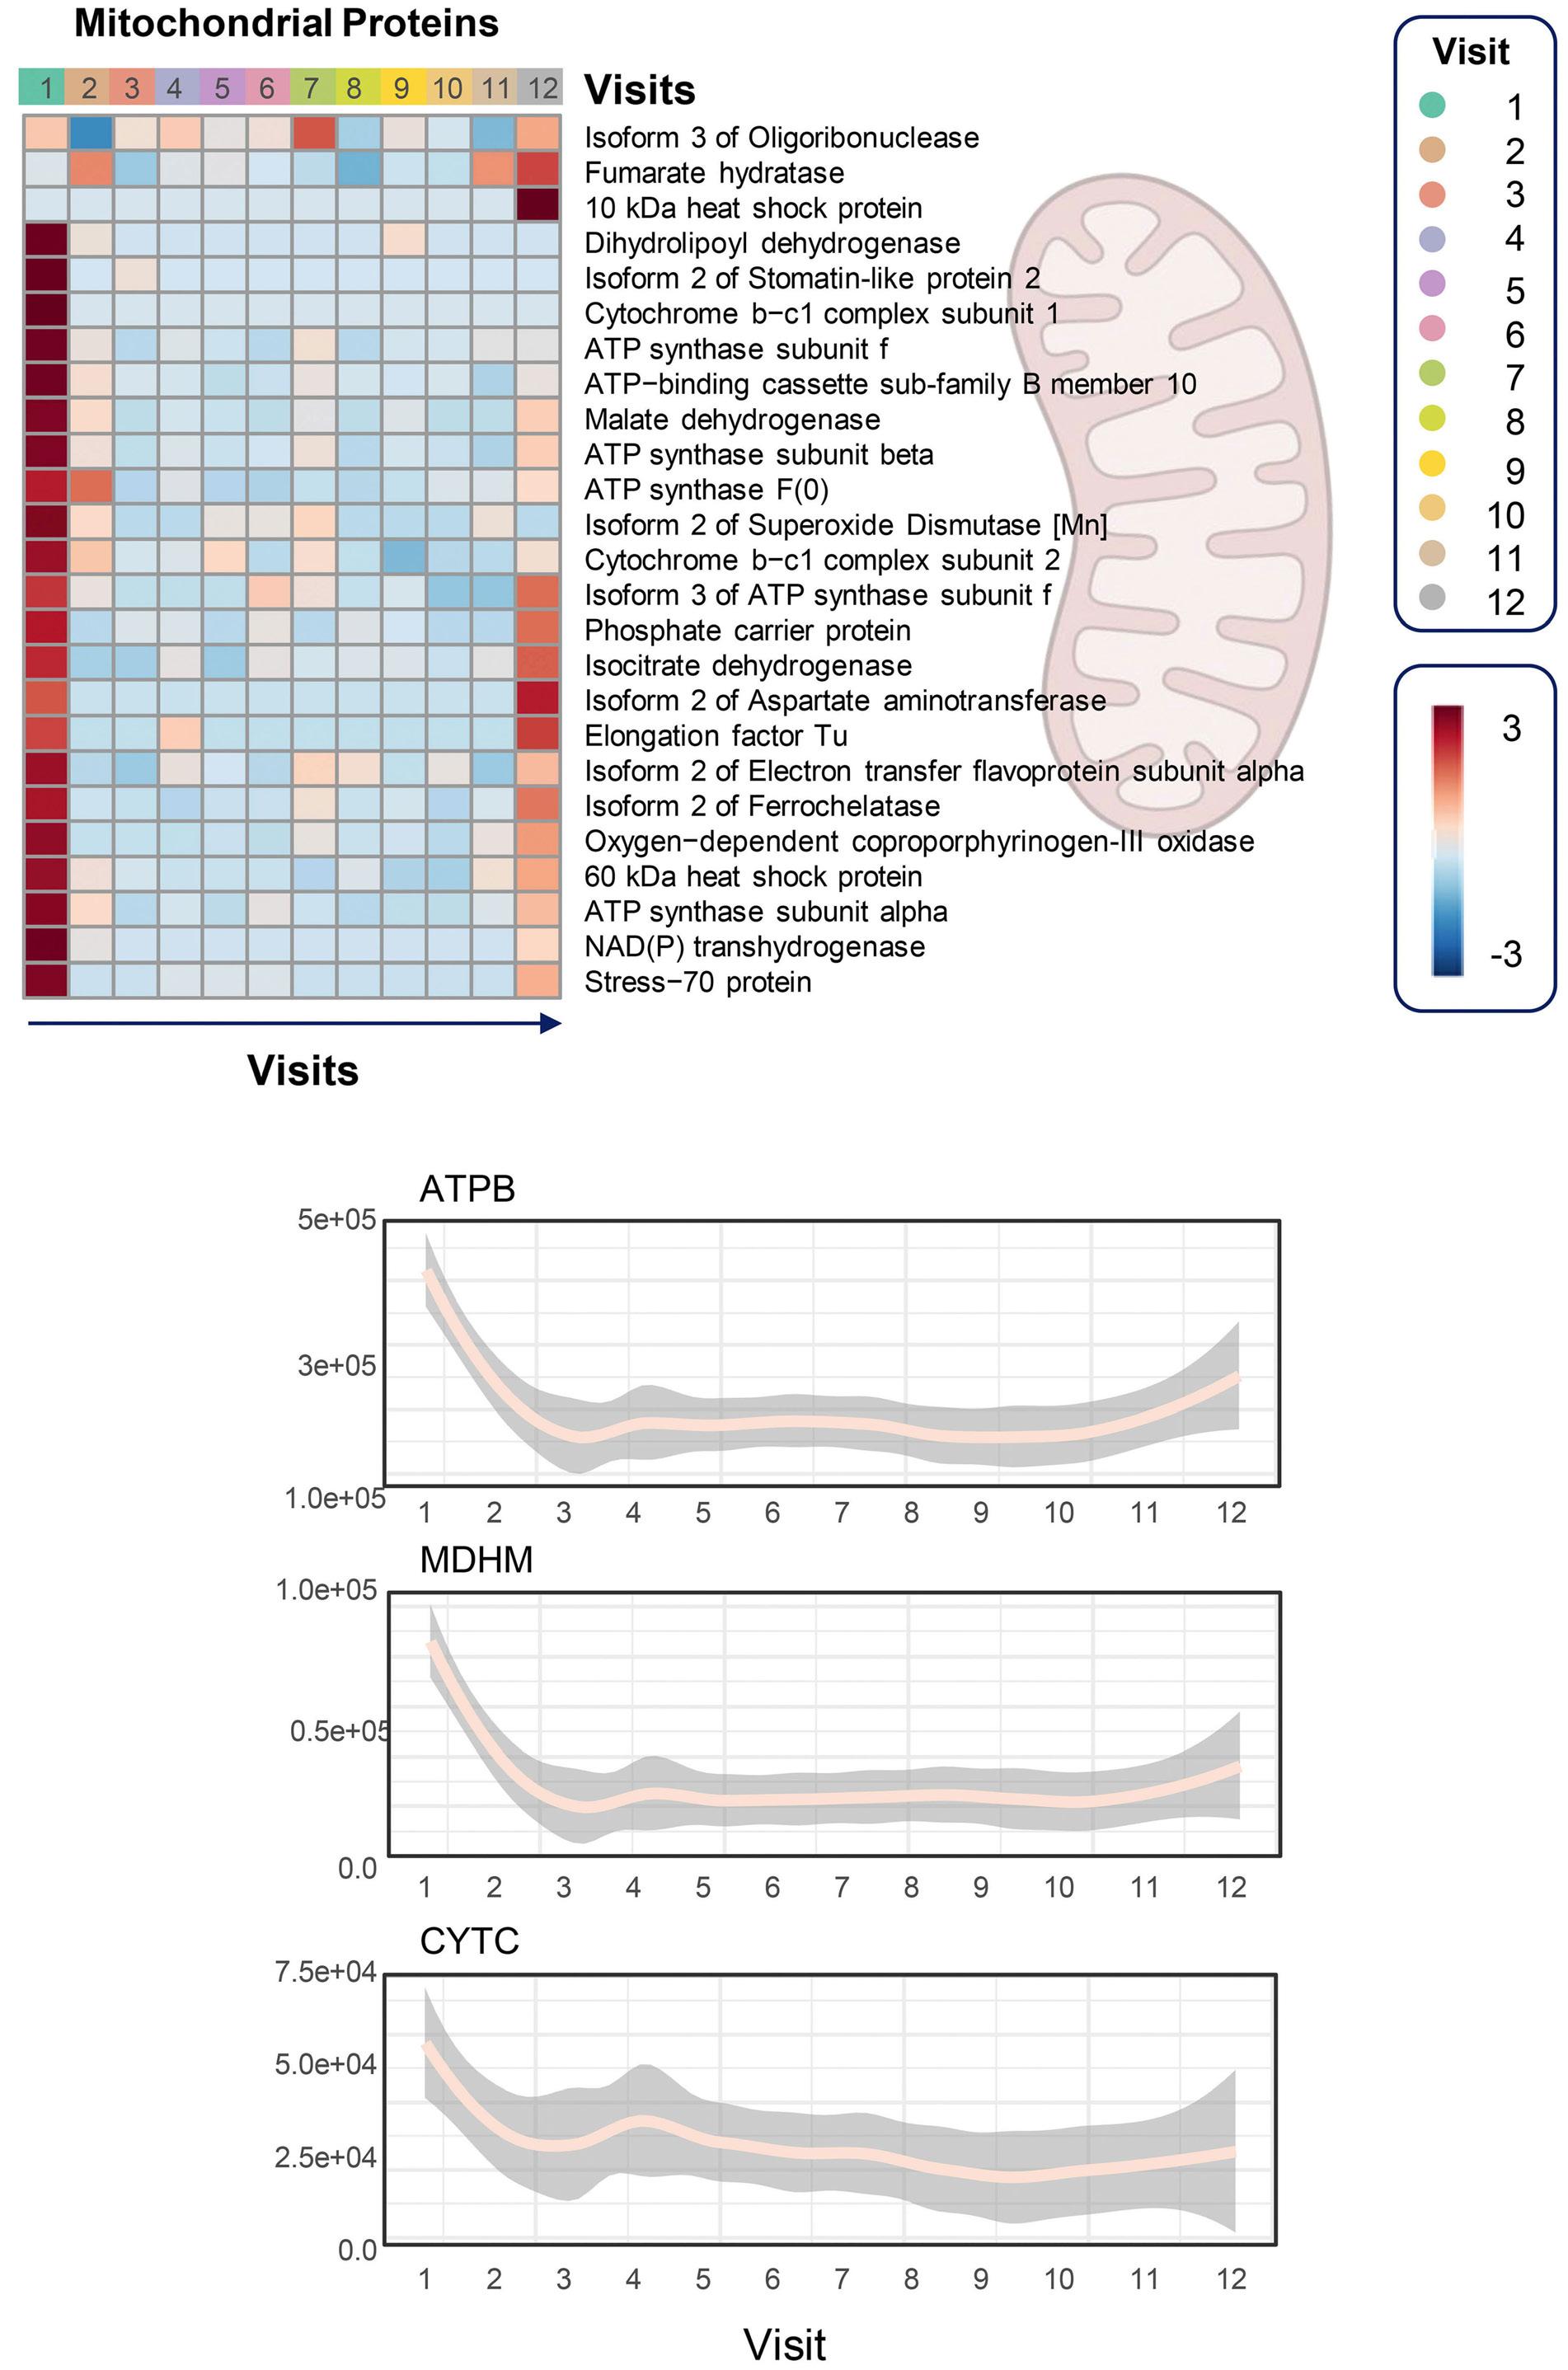
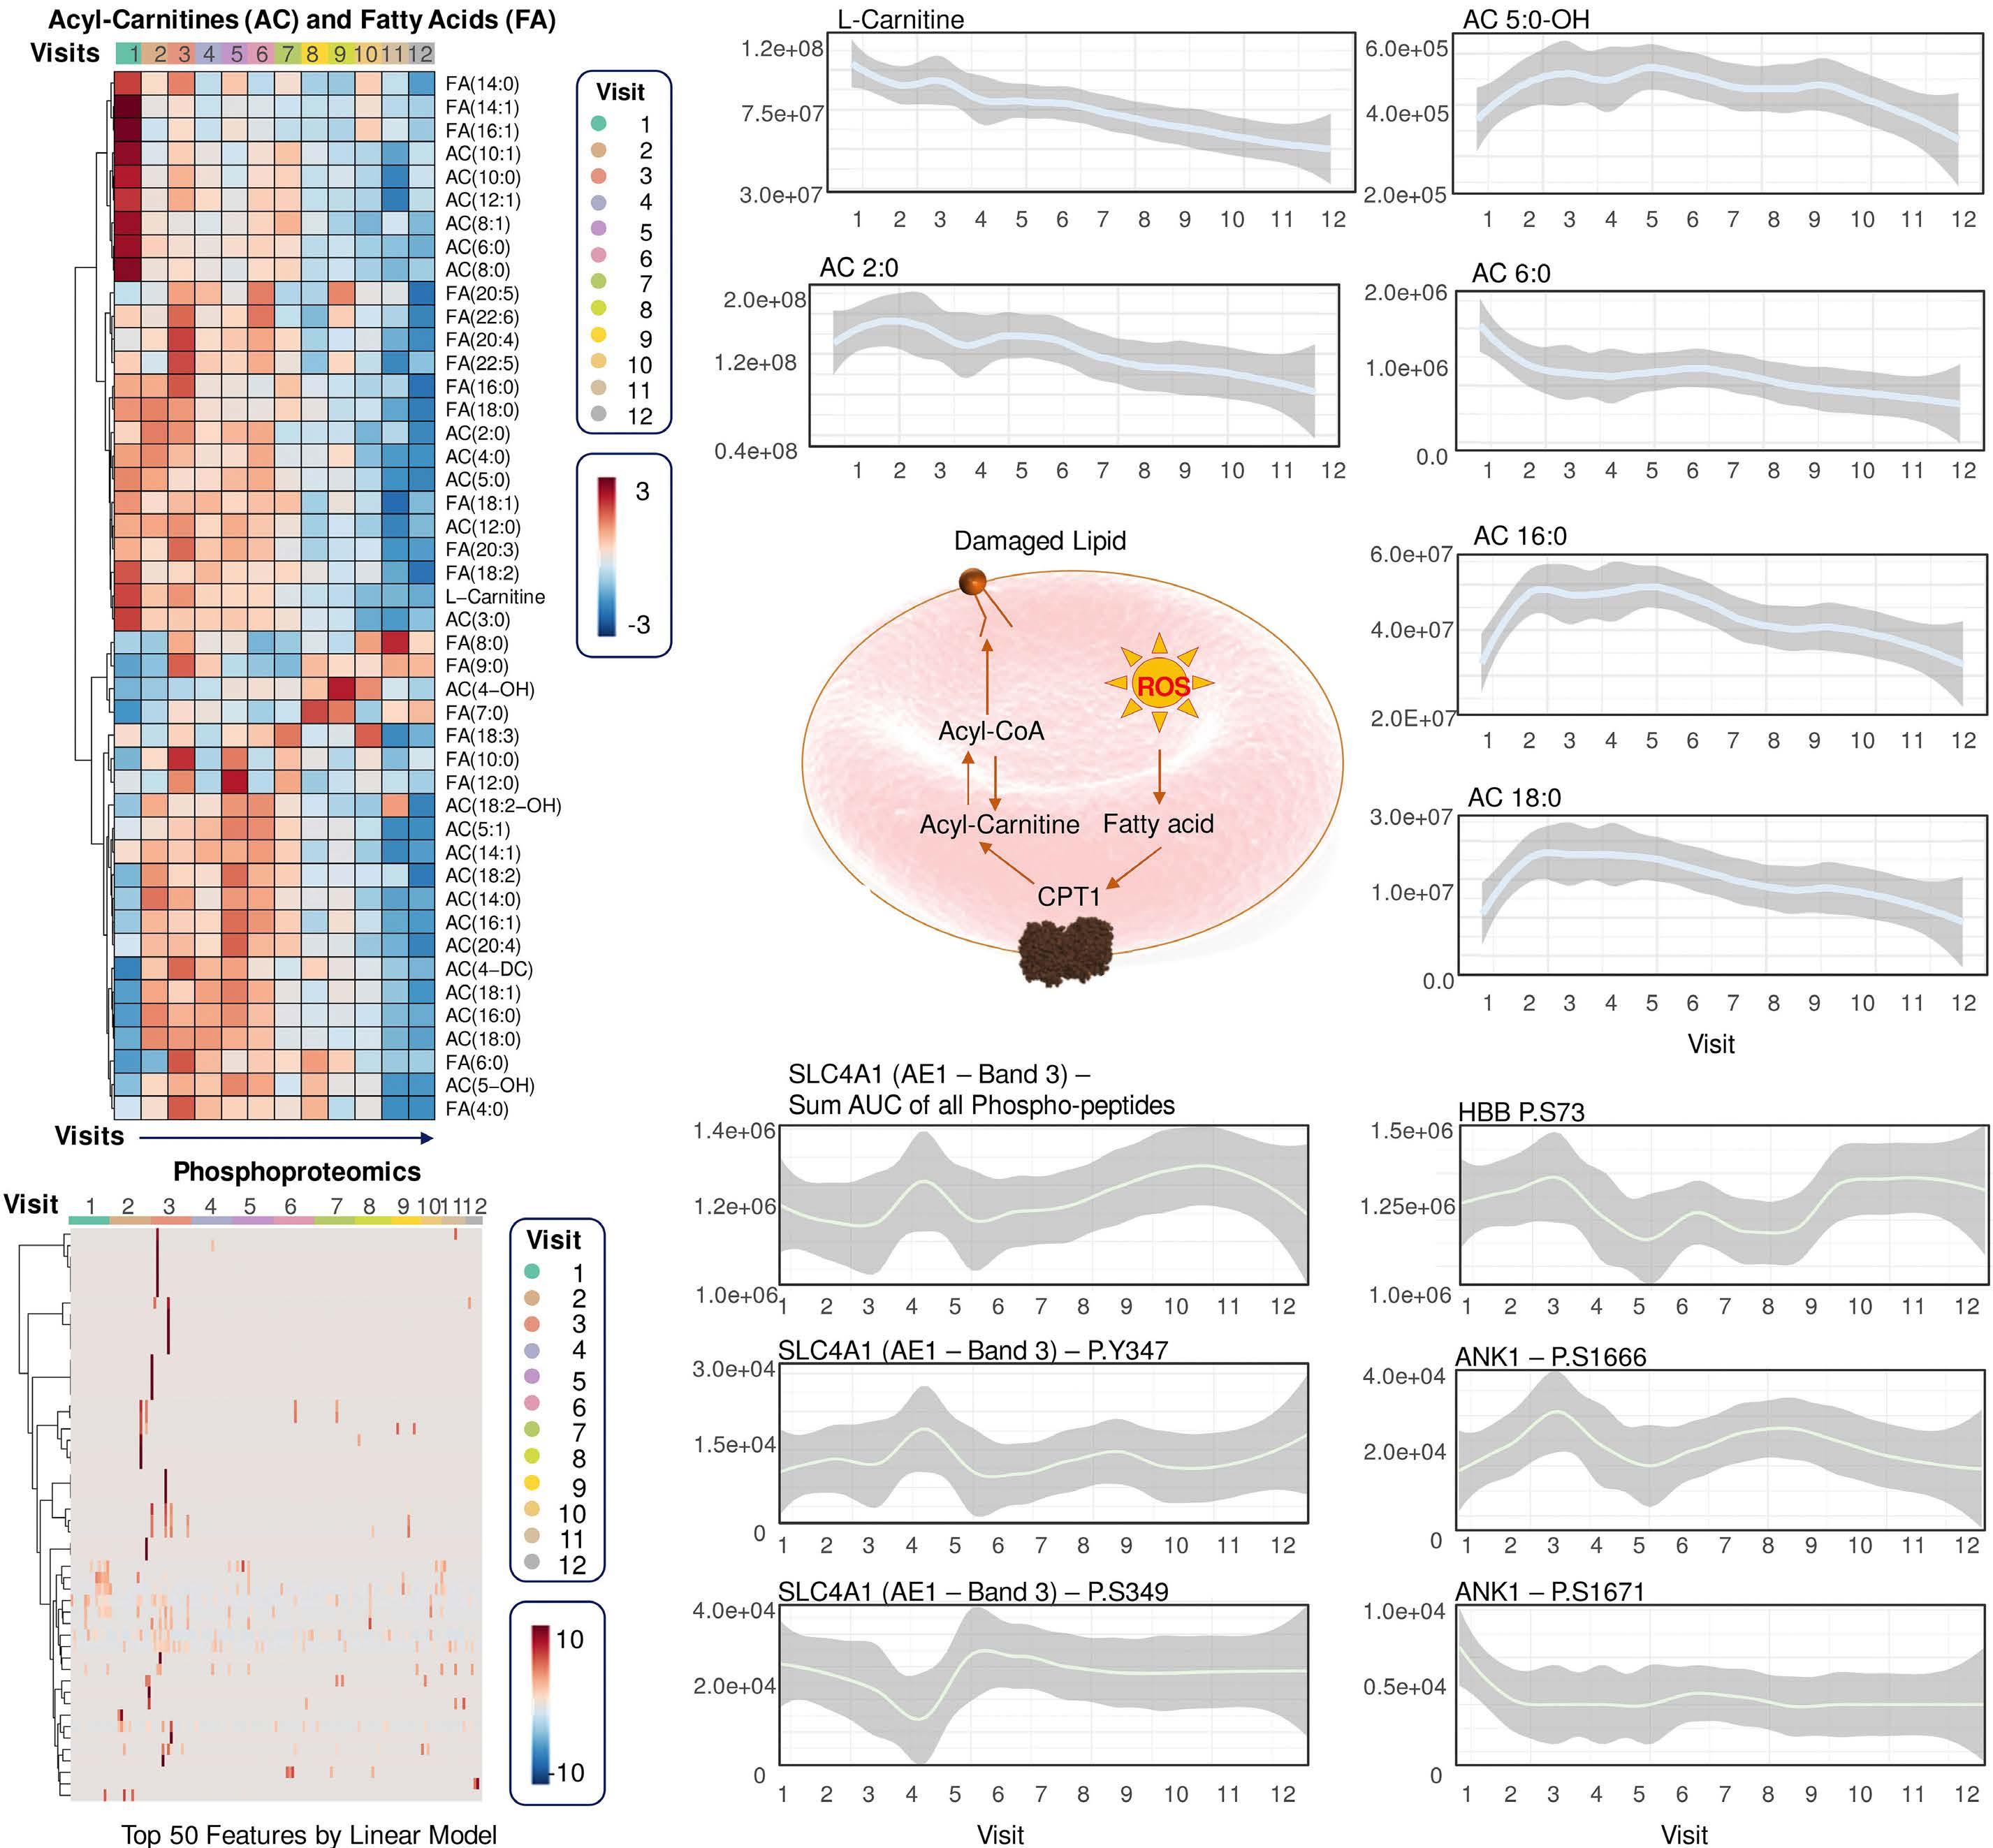
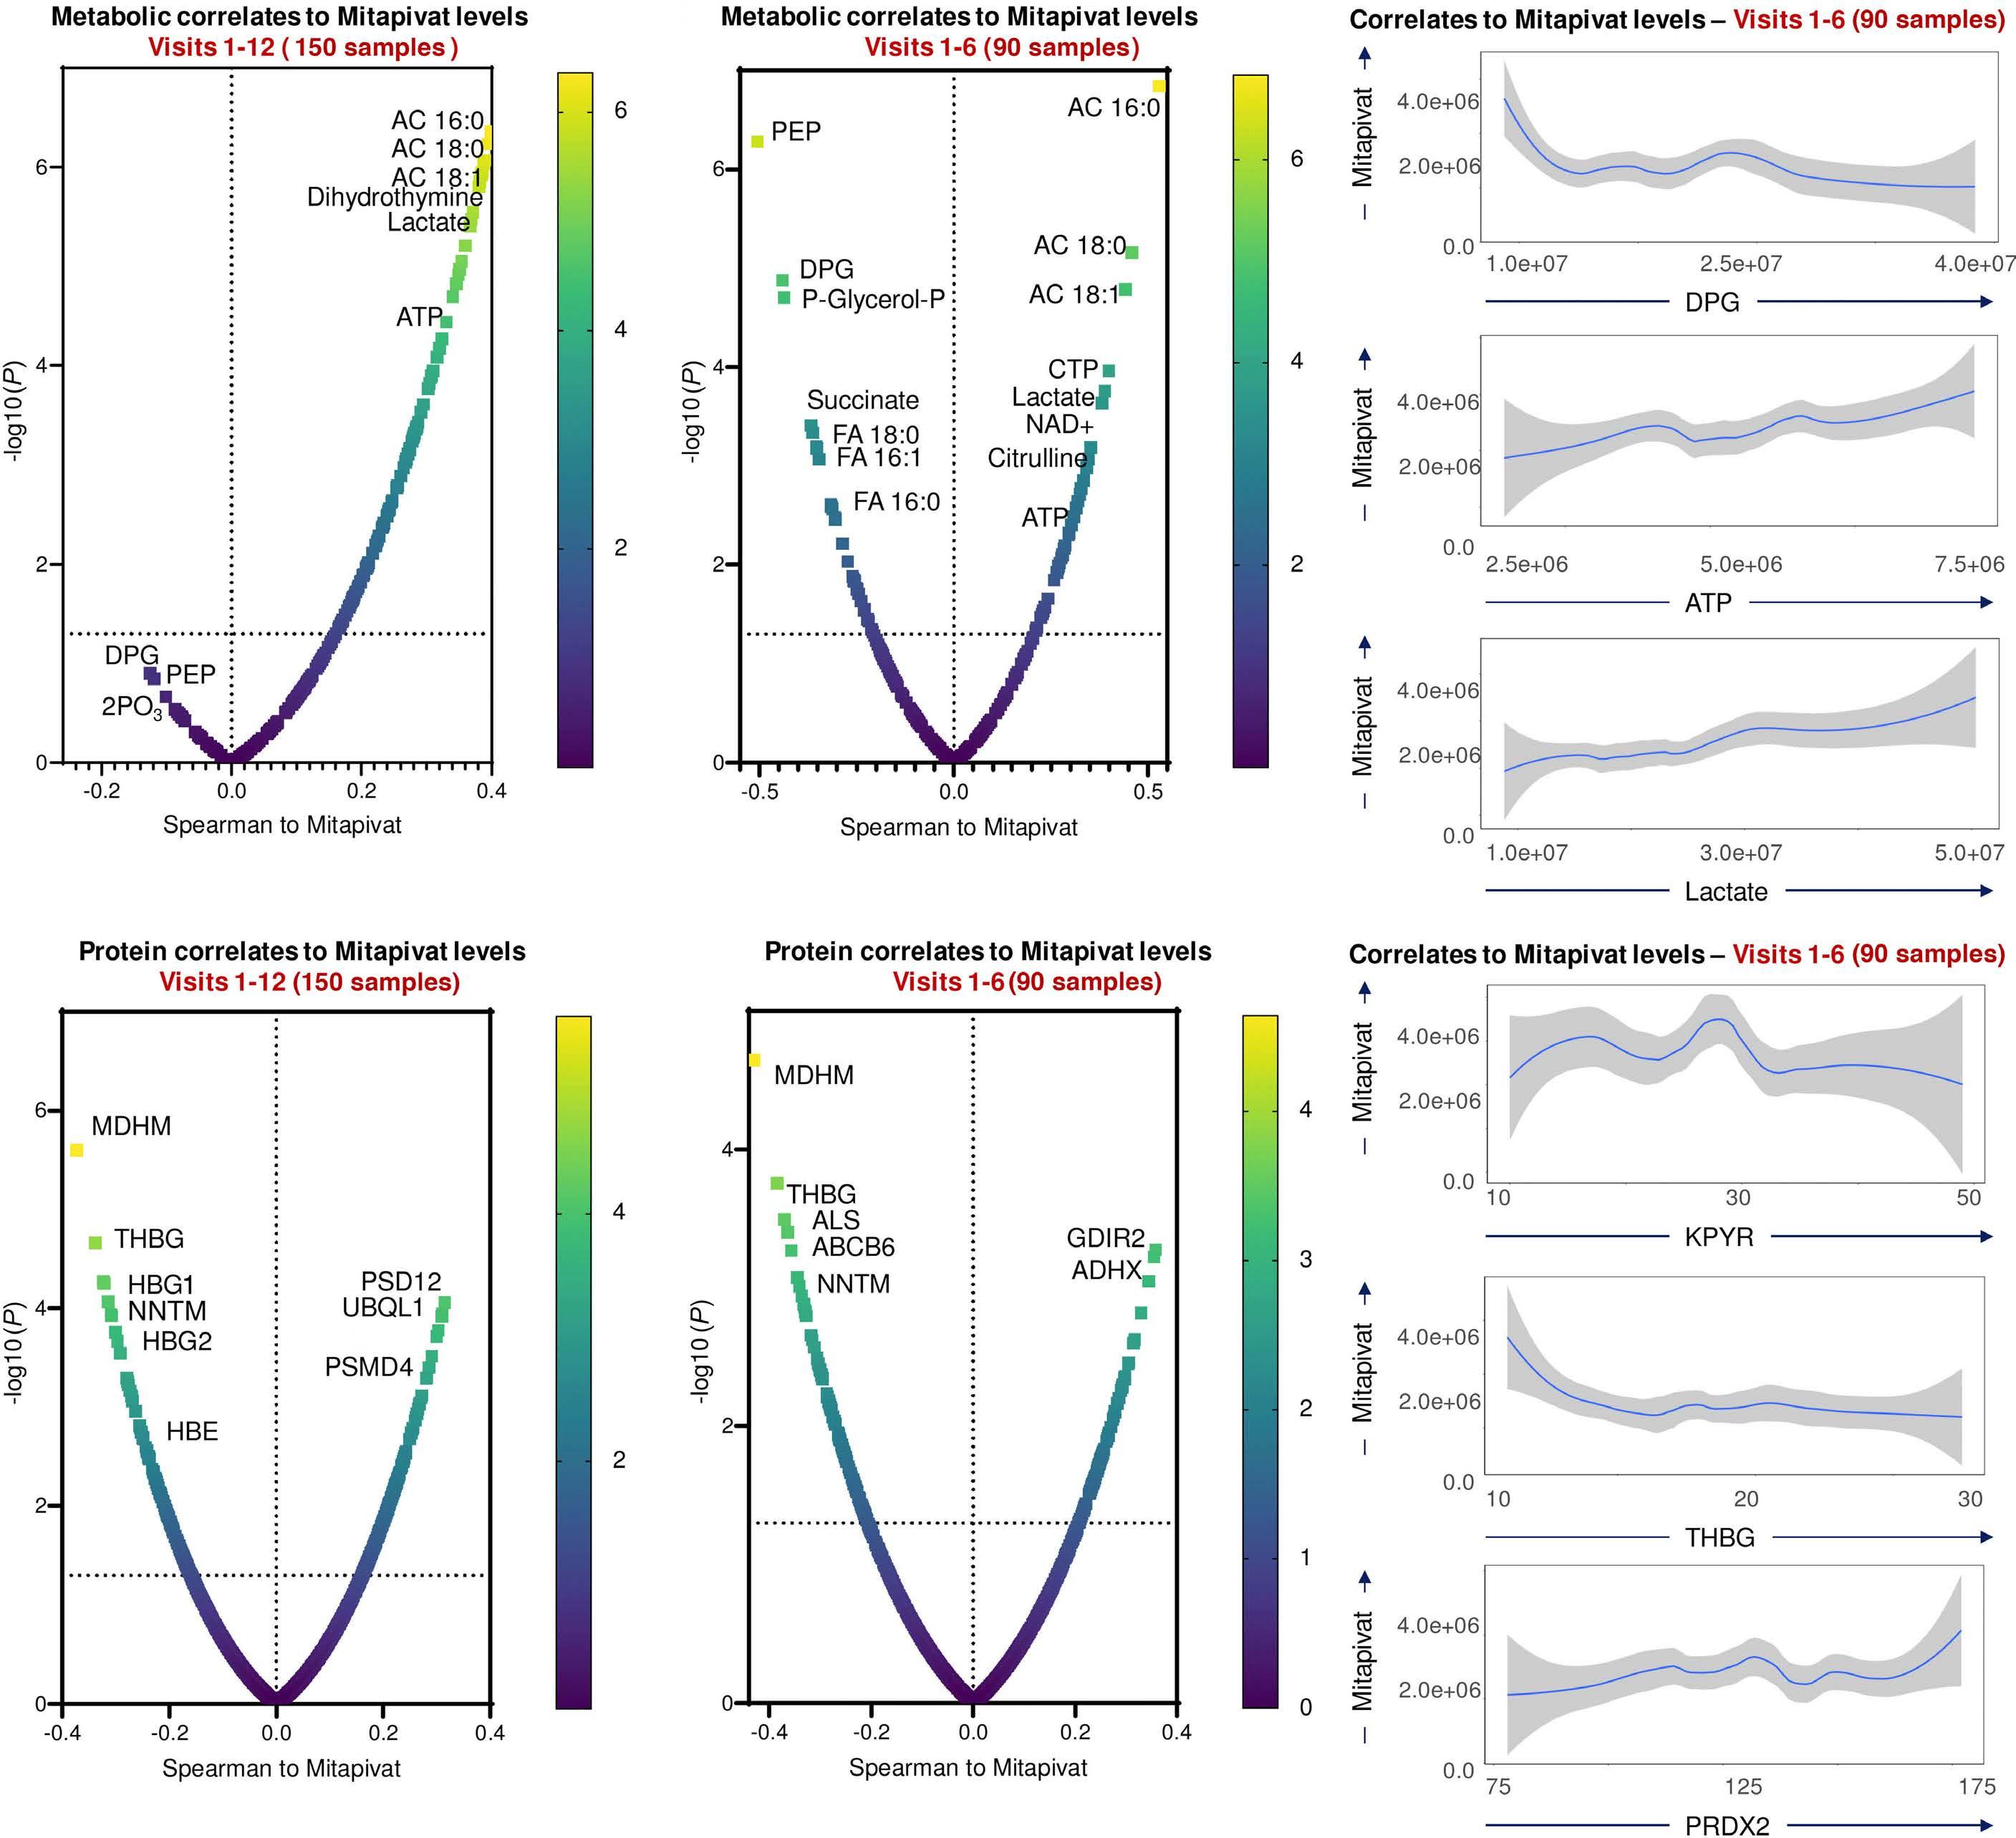
2639 Functional and multi-omics signatures of mitapivat efficacy upon activation of pyruvate kinase in red blood cells from patients with sickle cell disease
A. D’Alessandro et al.
https://doi.org/10.3324/haematol.2023.284831
Letters to the Editor
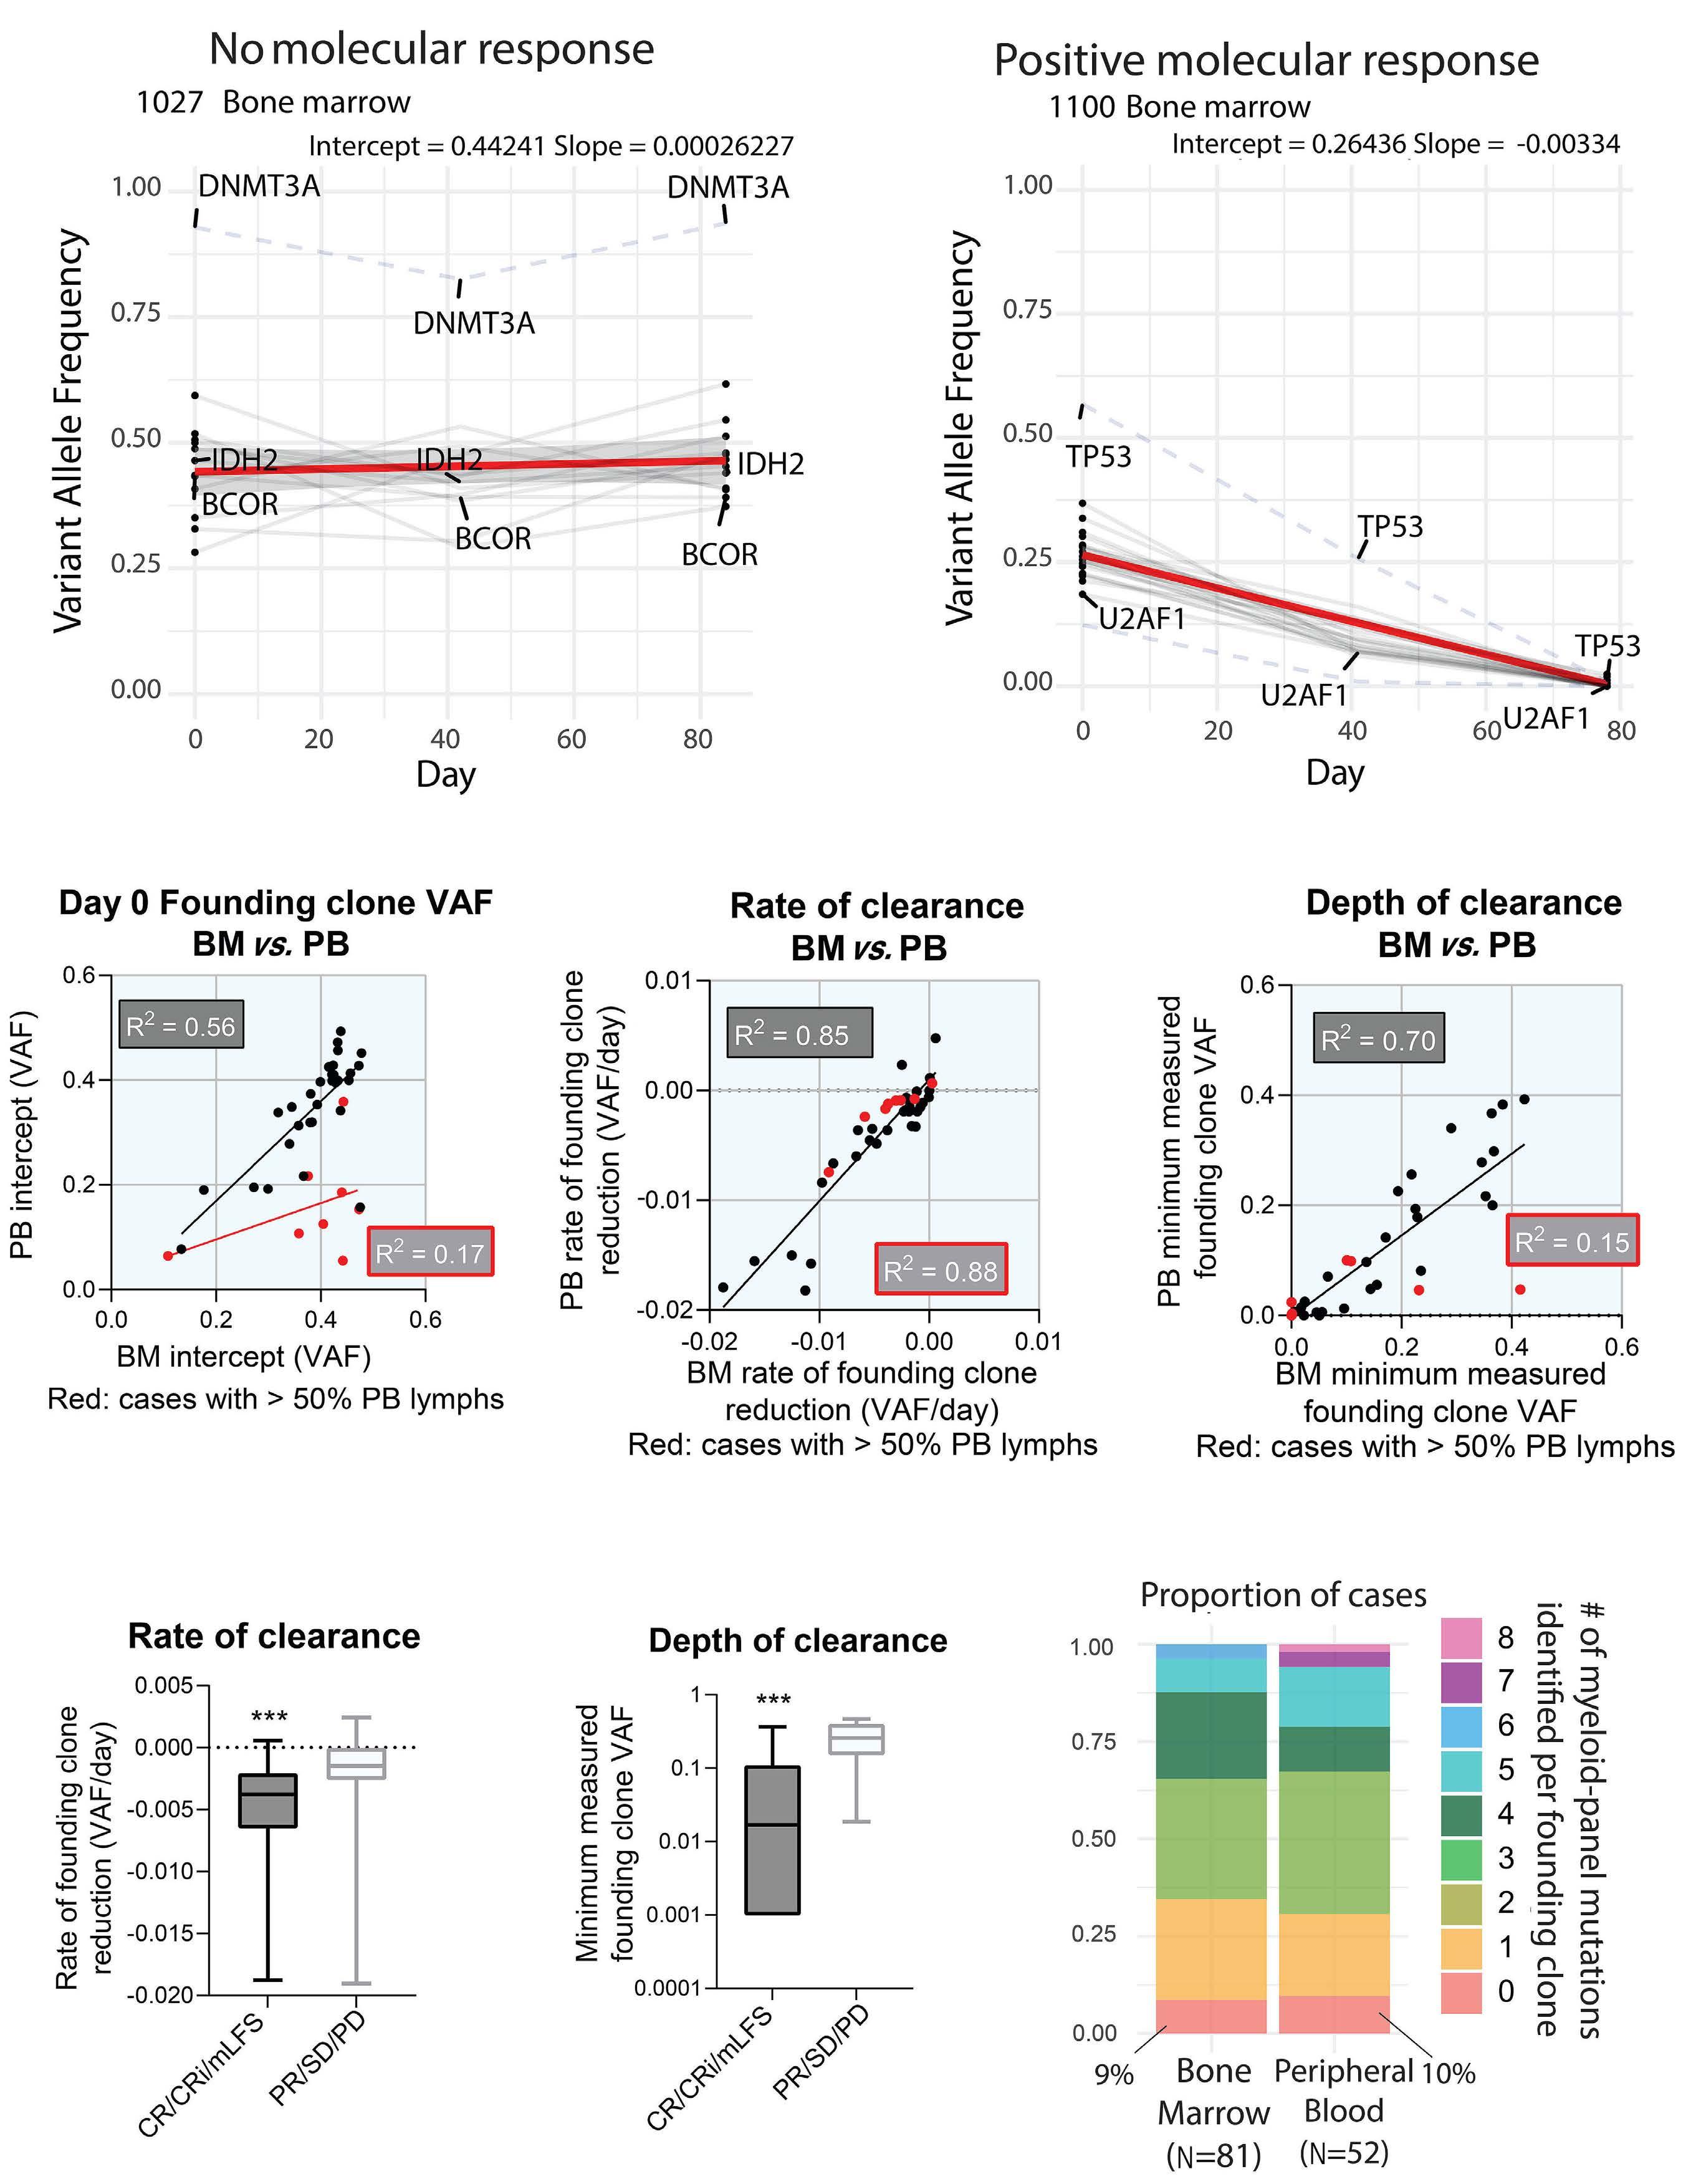
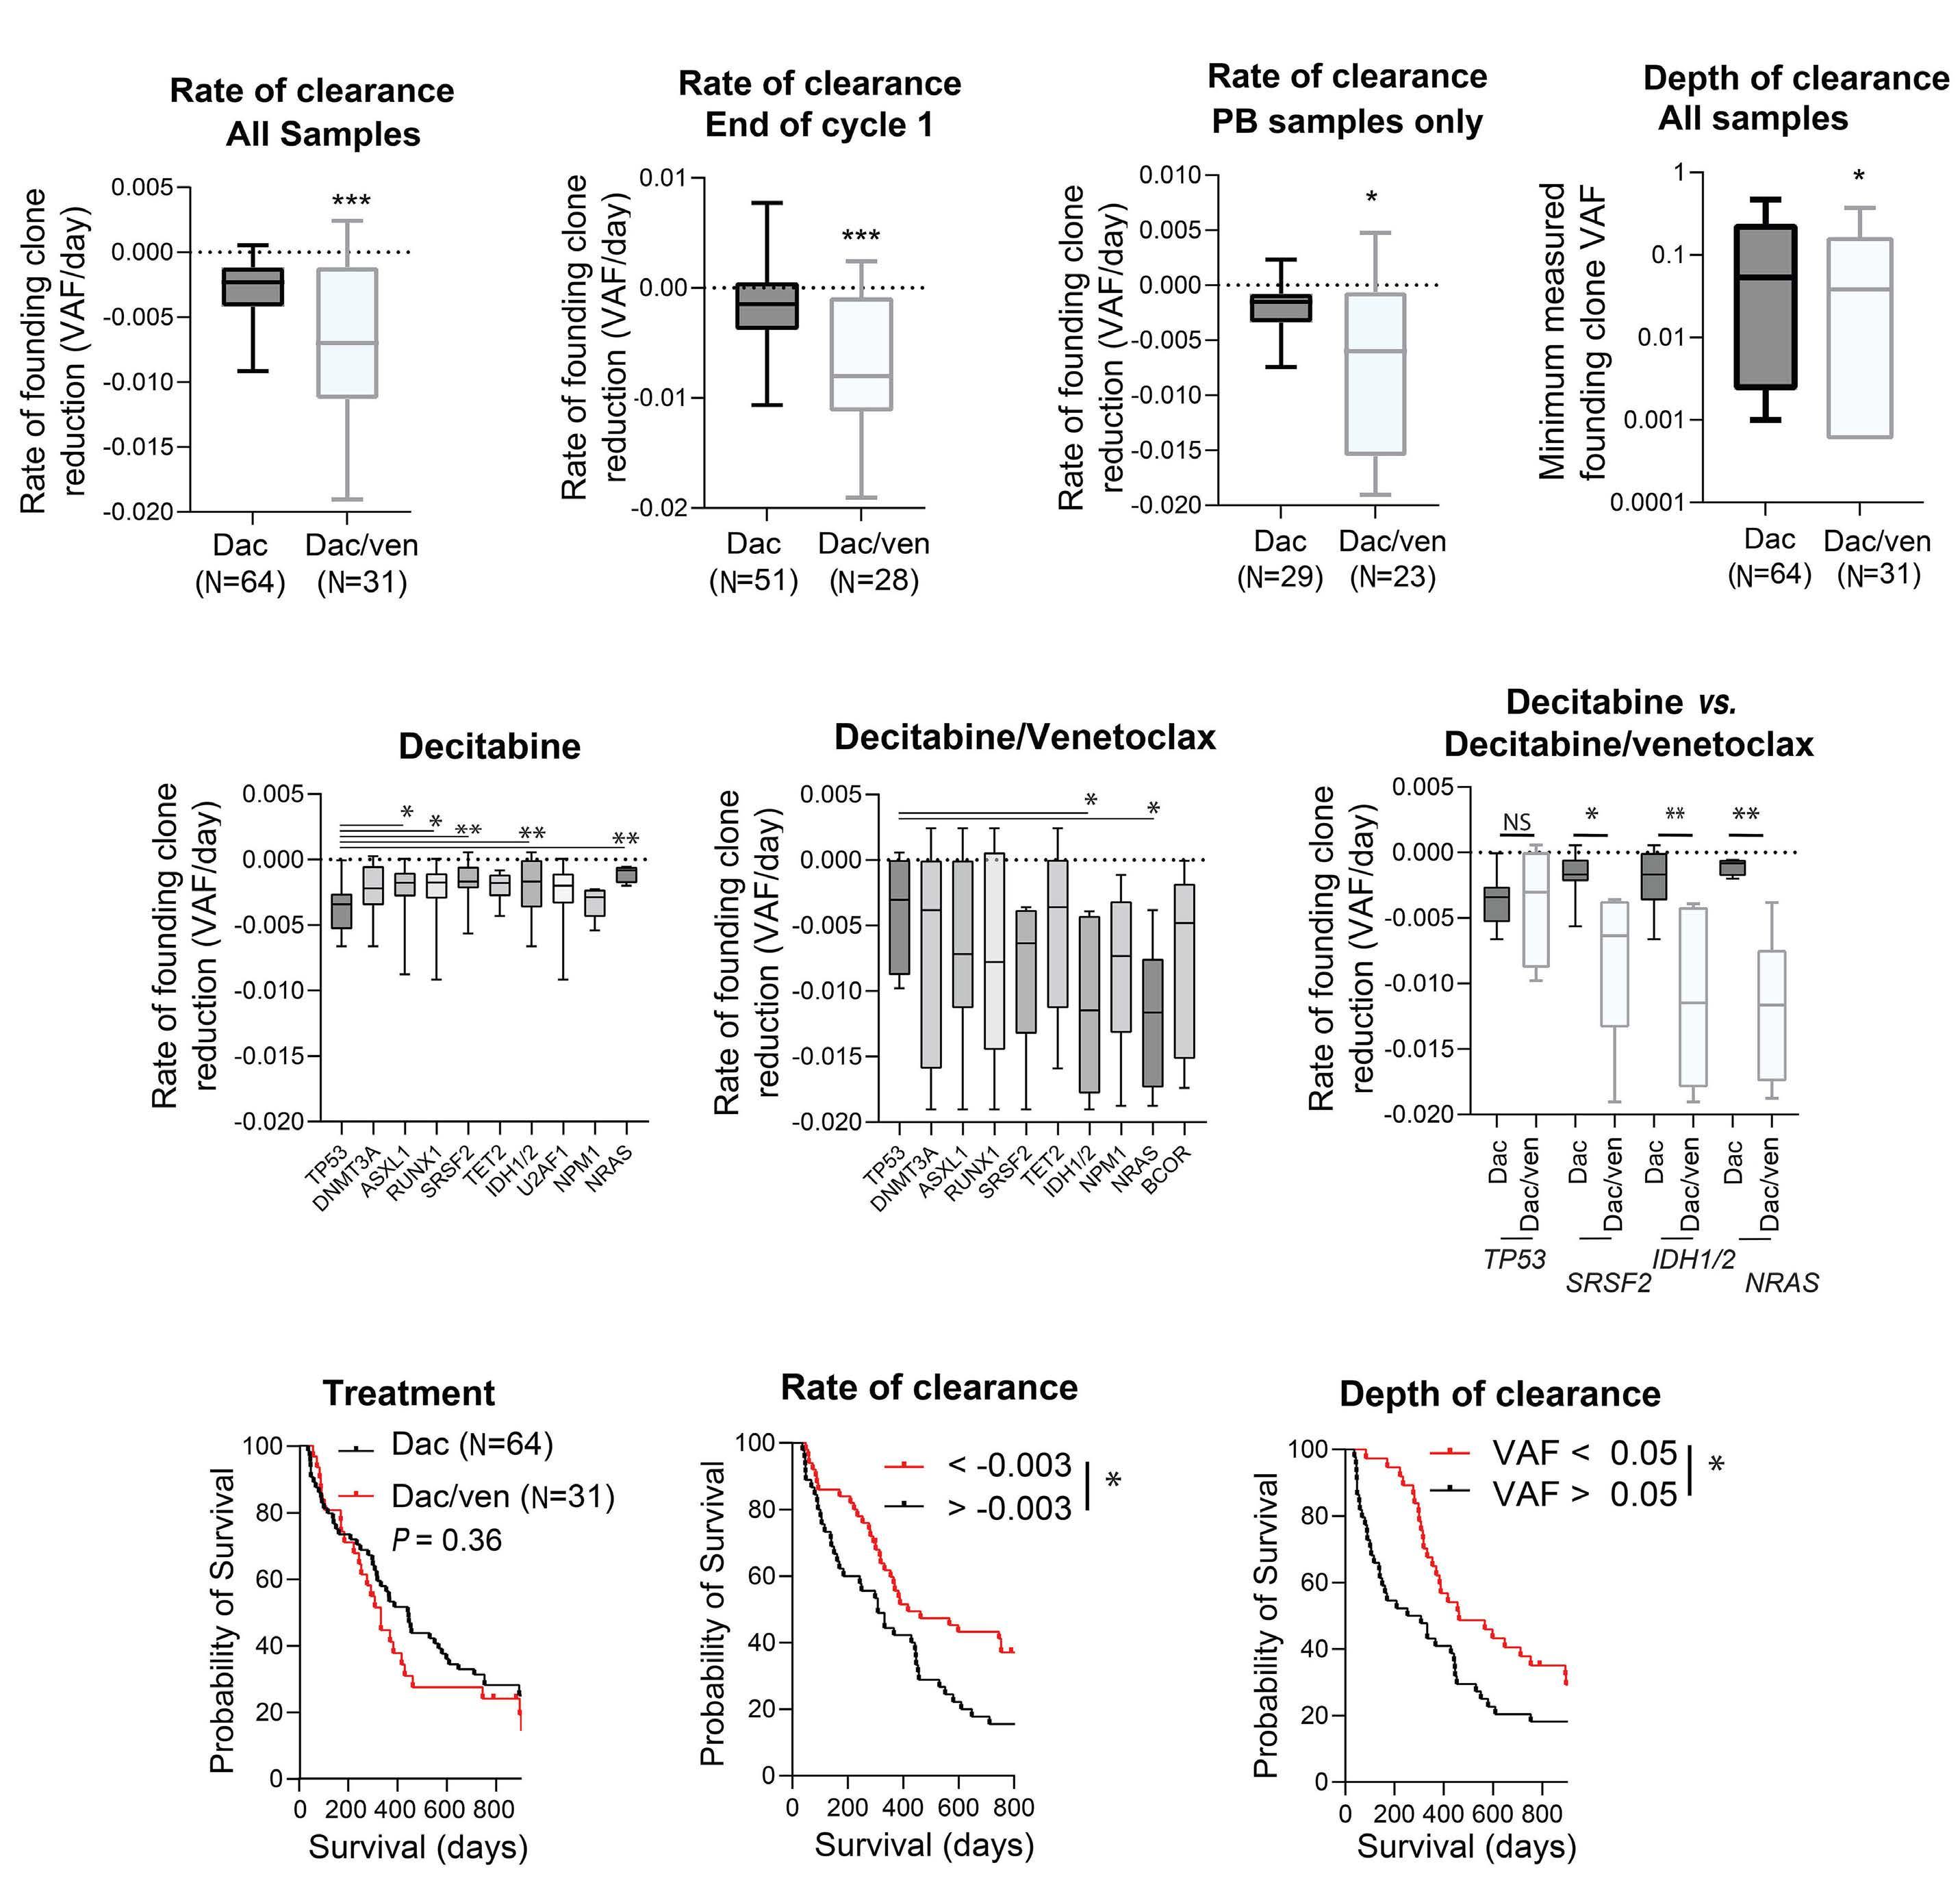
2653 Molecular responses in decitabine- and decitabine/venetoclax-treated patients with acute myeloid leukemia and myelodysplastic syndromes
A. Gruszczynska et al.
https://doi.org/10.3324/haematol.2022.281396
2660 Sotatercept for anemia of myelofibrosis: a phase II investigator-initiated study
P. Bose et al.
https://doi.org/10.3324/haematol.2023.284078
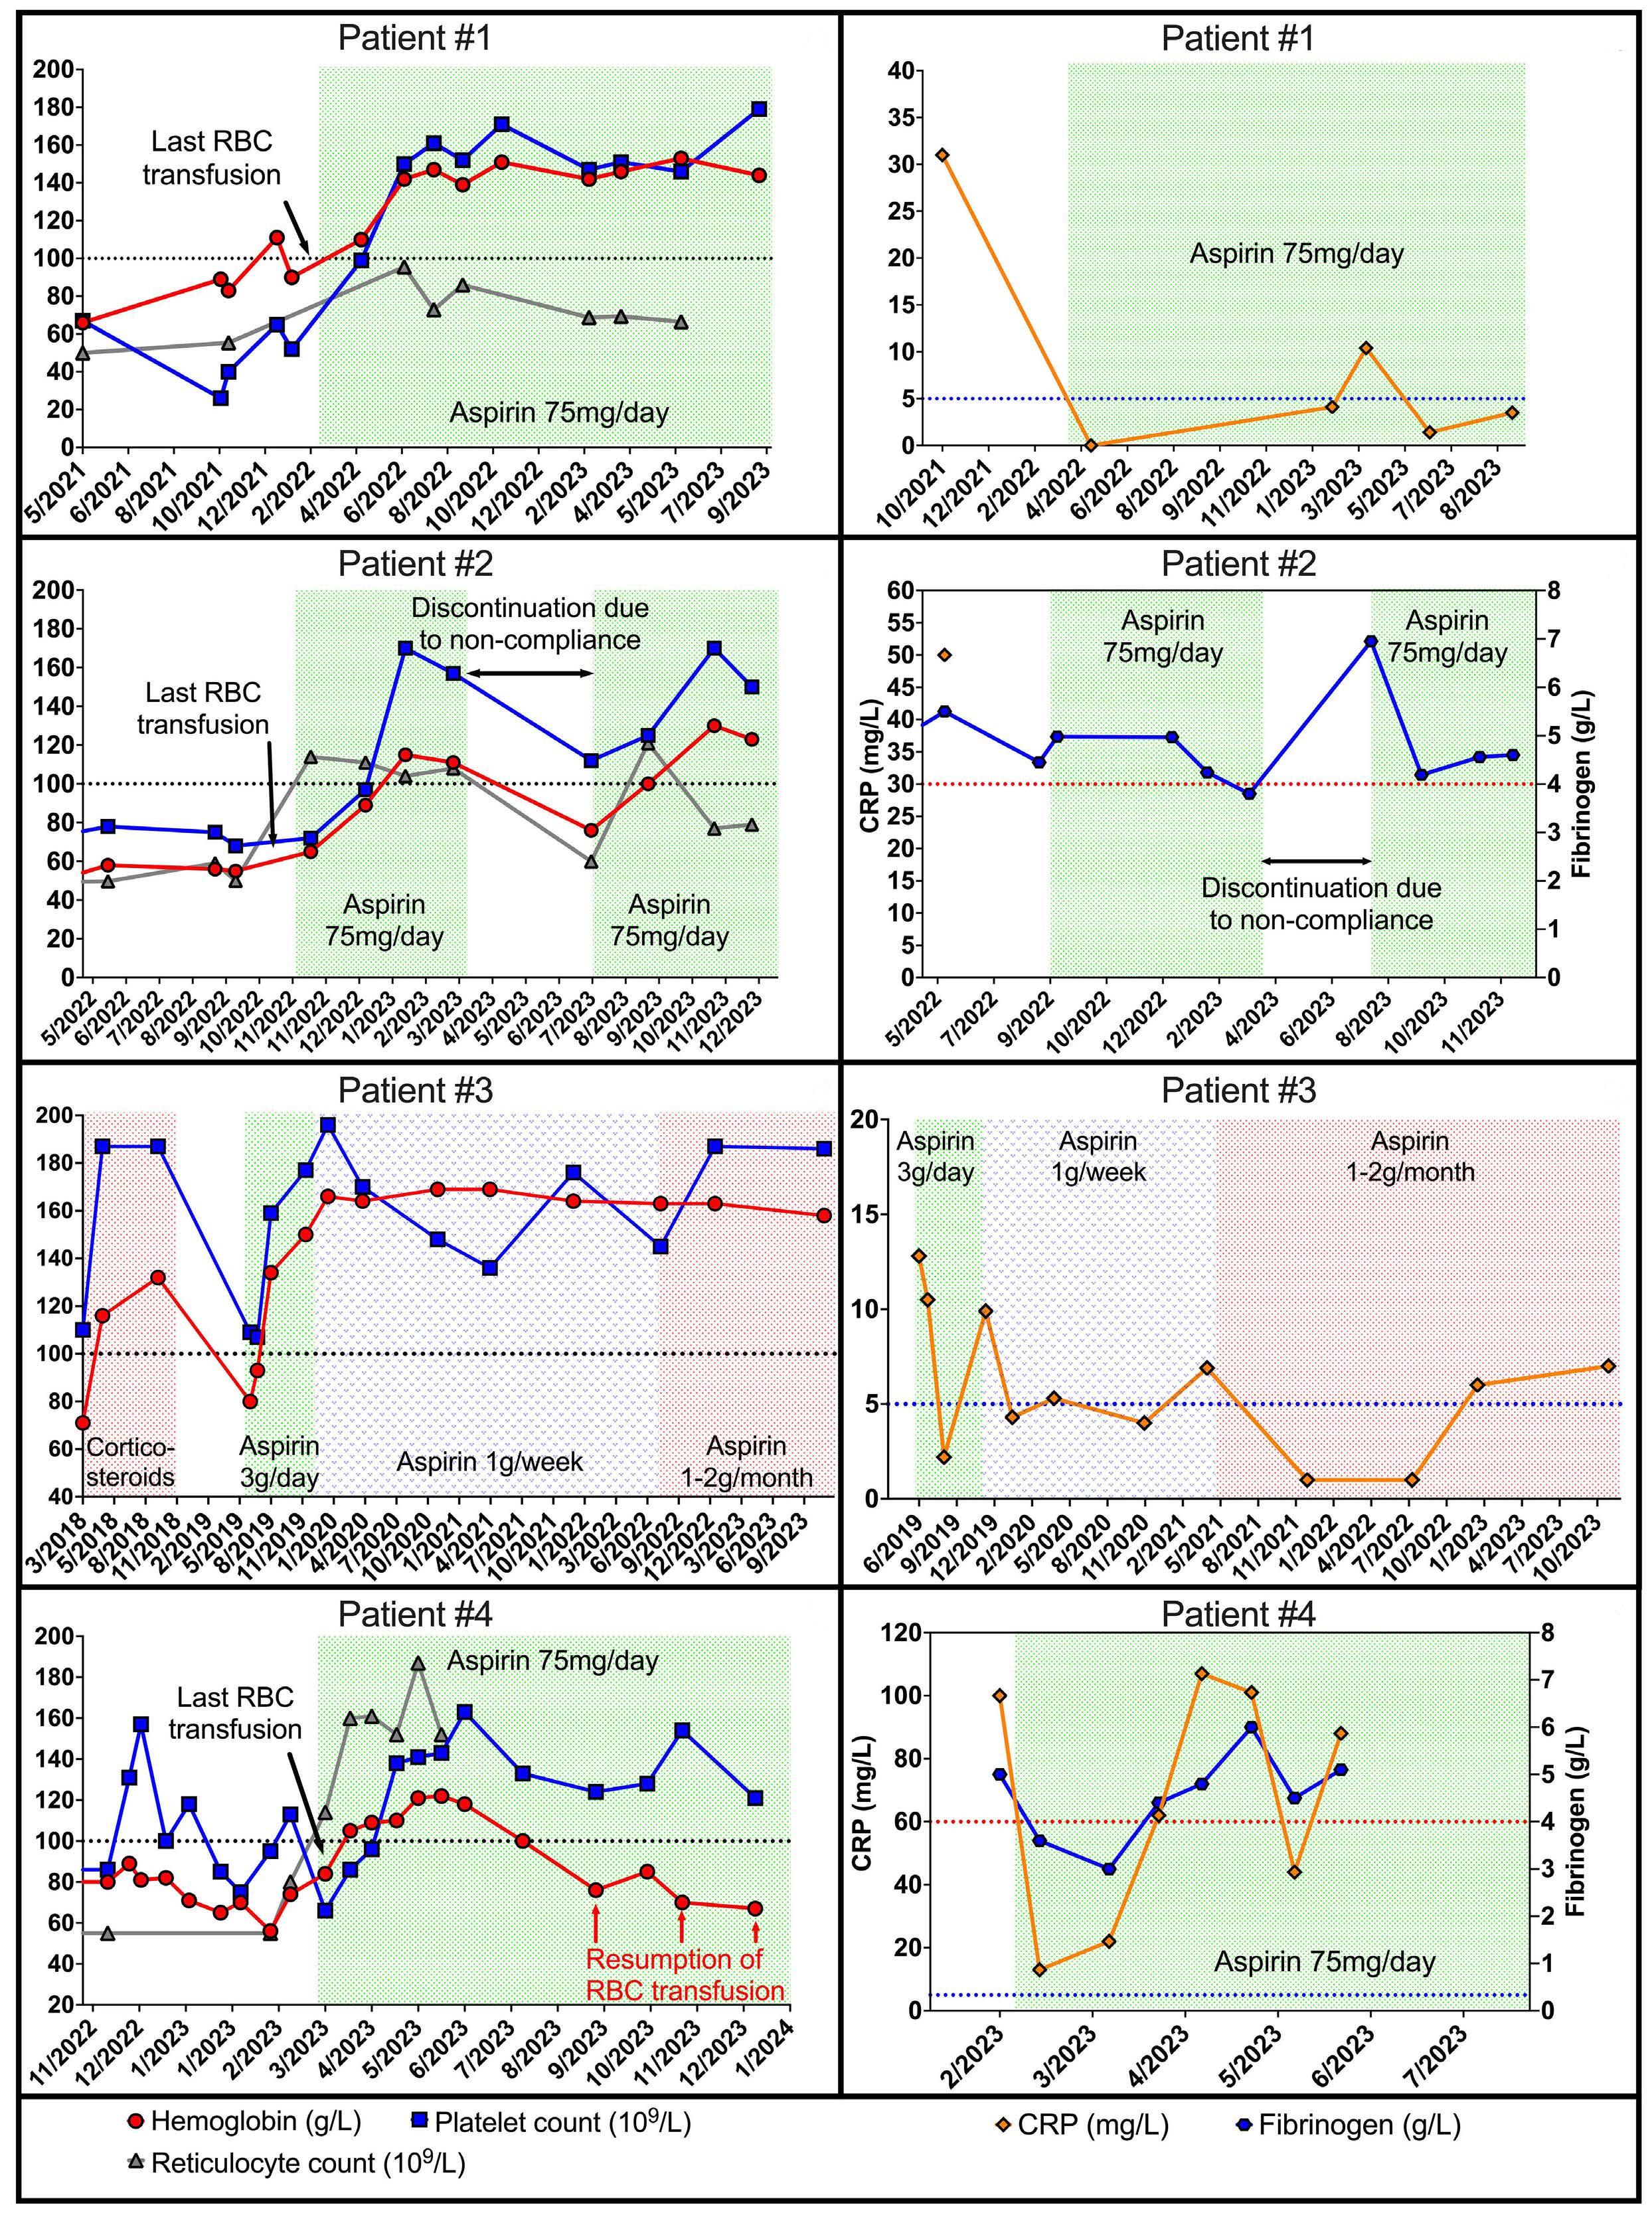
2665 Low-dose non-steroidal anti-inflammatory drugs: a promising approach for the treatment of symptomatic bone marrow failure in Ghosal hematodiaphyseal dysplasia
J. Bordat et al.
https://doi.org/10.3324/haematol.2023.284098
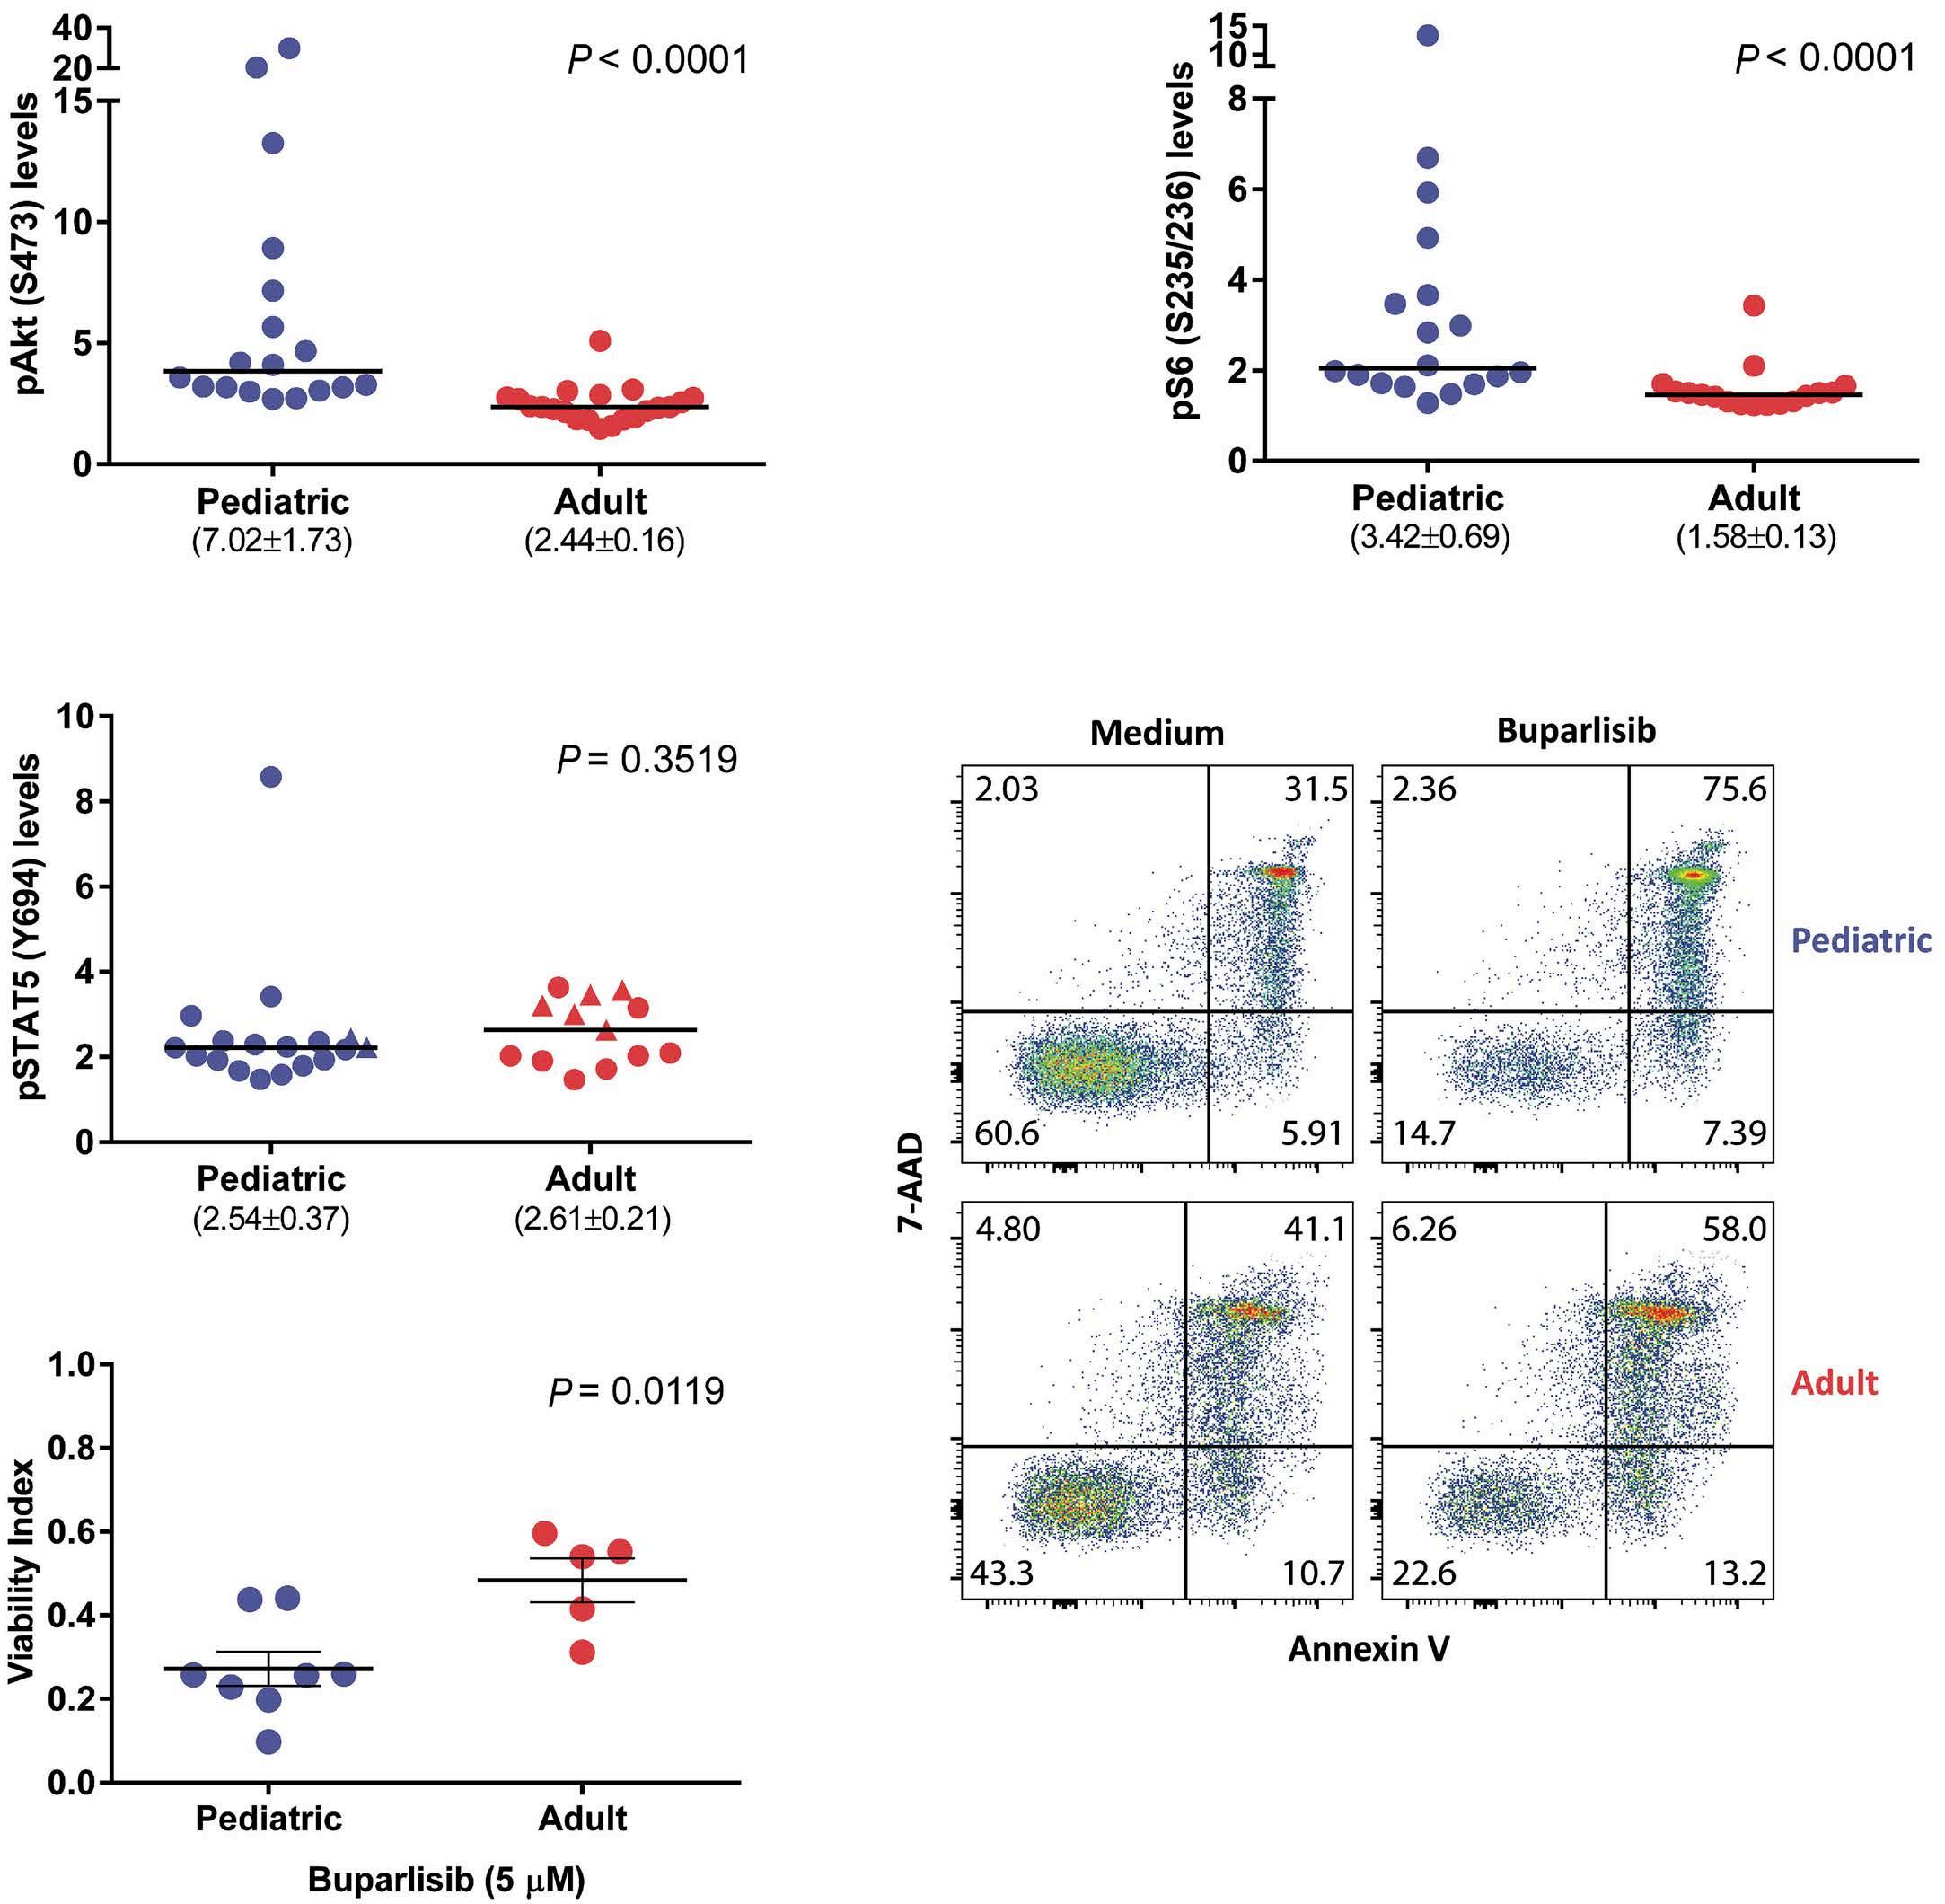
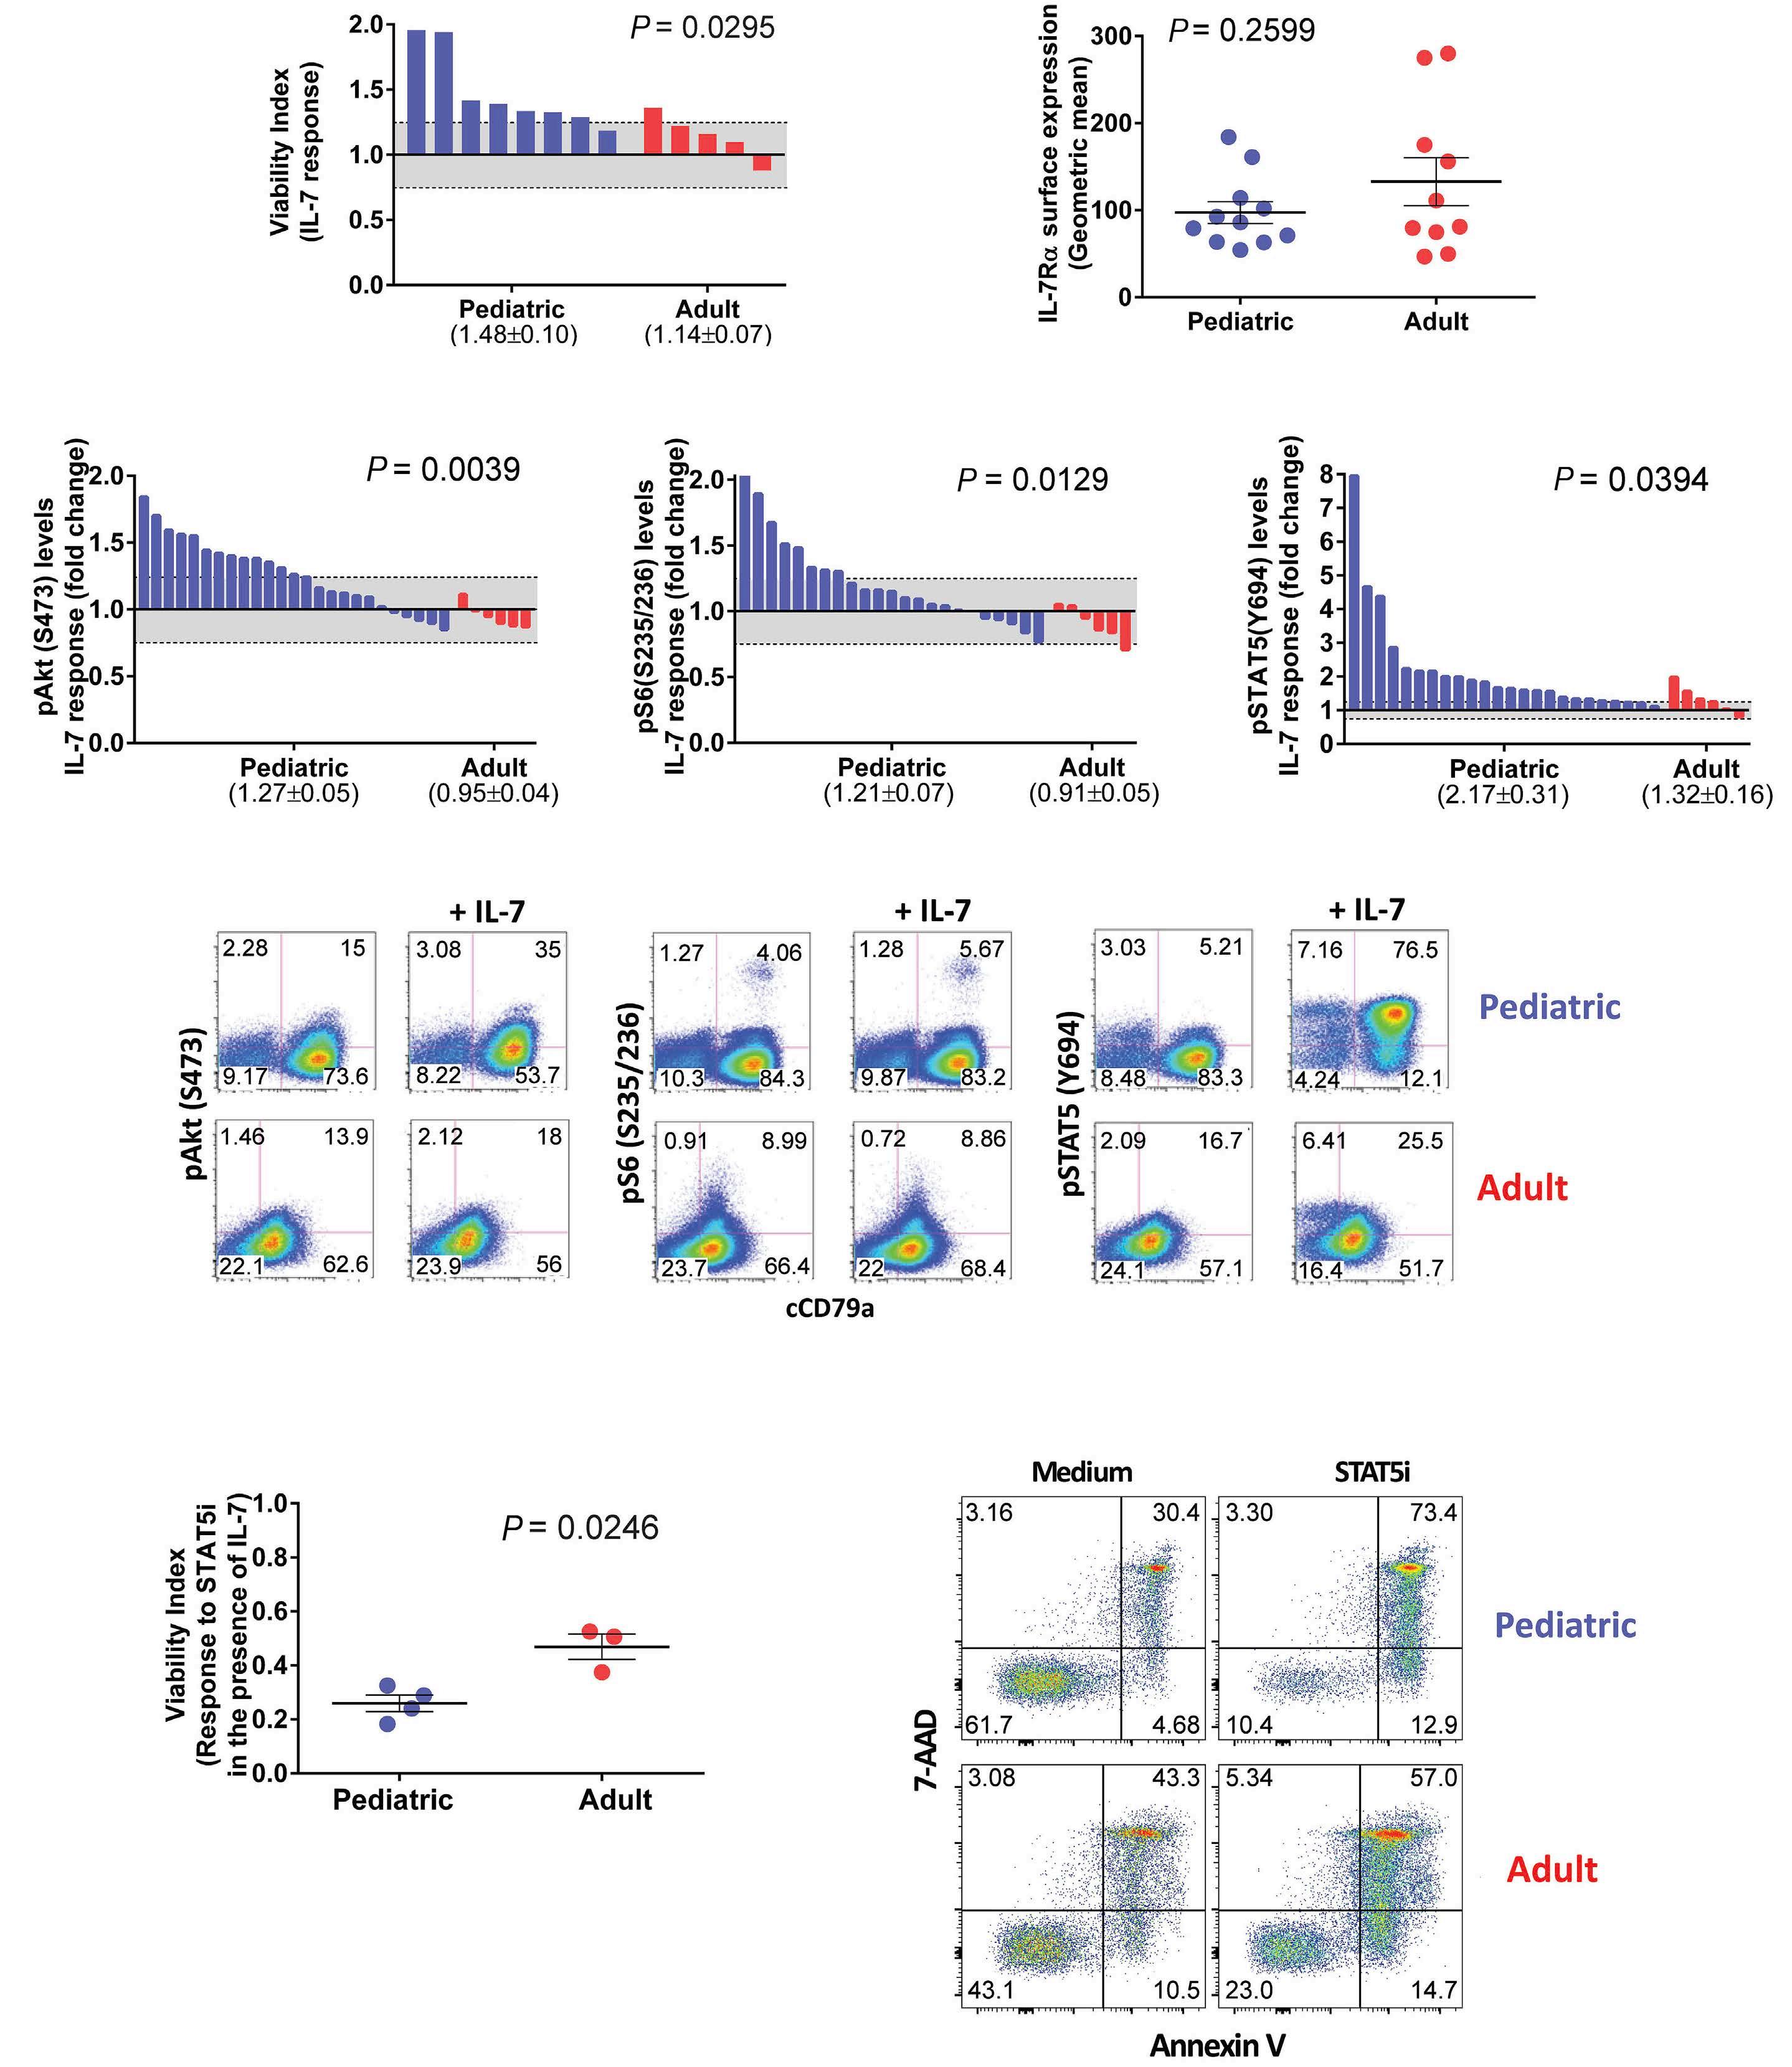
2671 Differential activation of basal and IL-7-induced PI3K/Akt/mTOR and JAK/STAT5 signaling distinguishes pediatric from adult acute lymphoblastic leukemia
M.B. Fernandes et al.
https://doi.org/10.3324/haematol.2023.284102
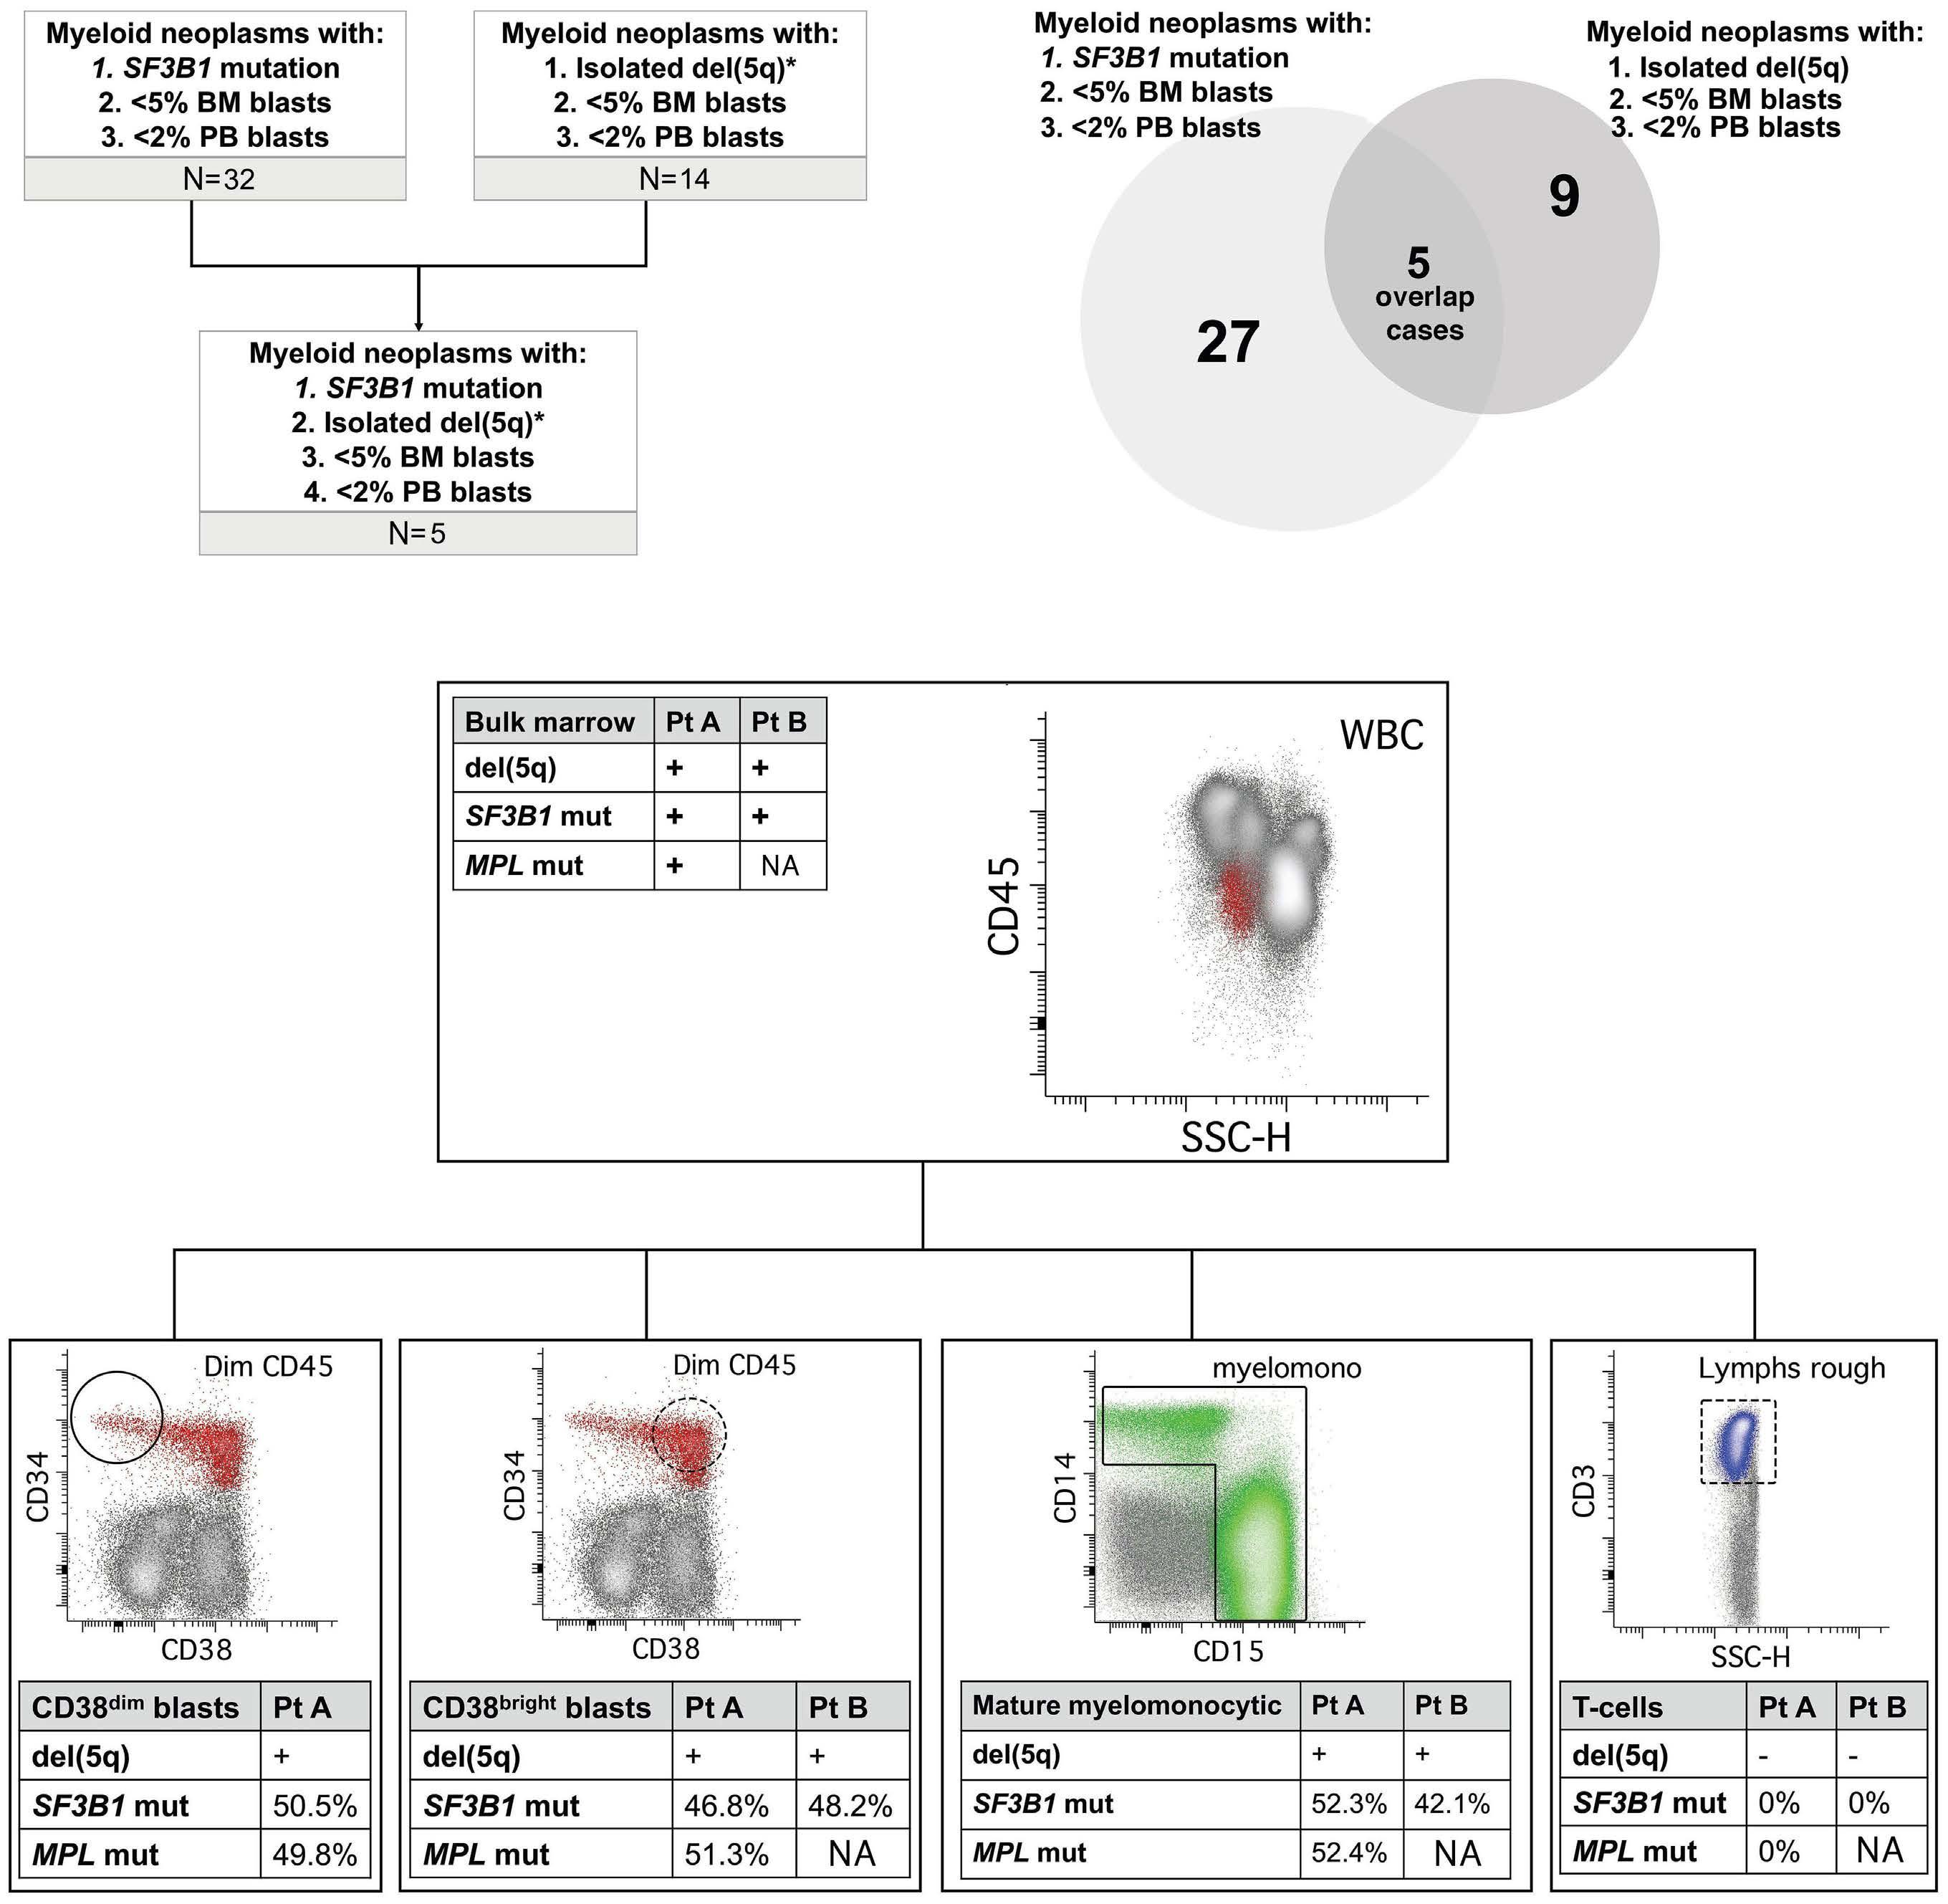
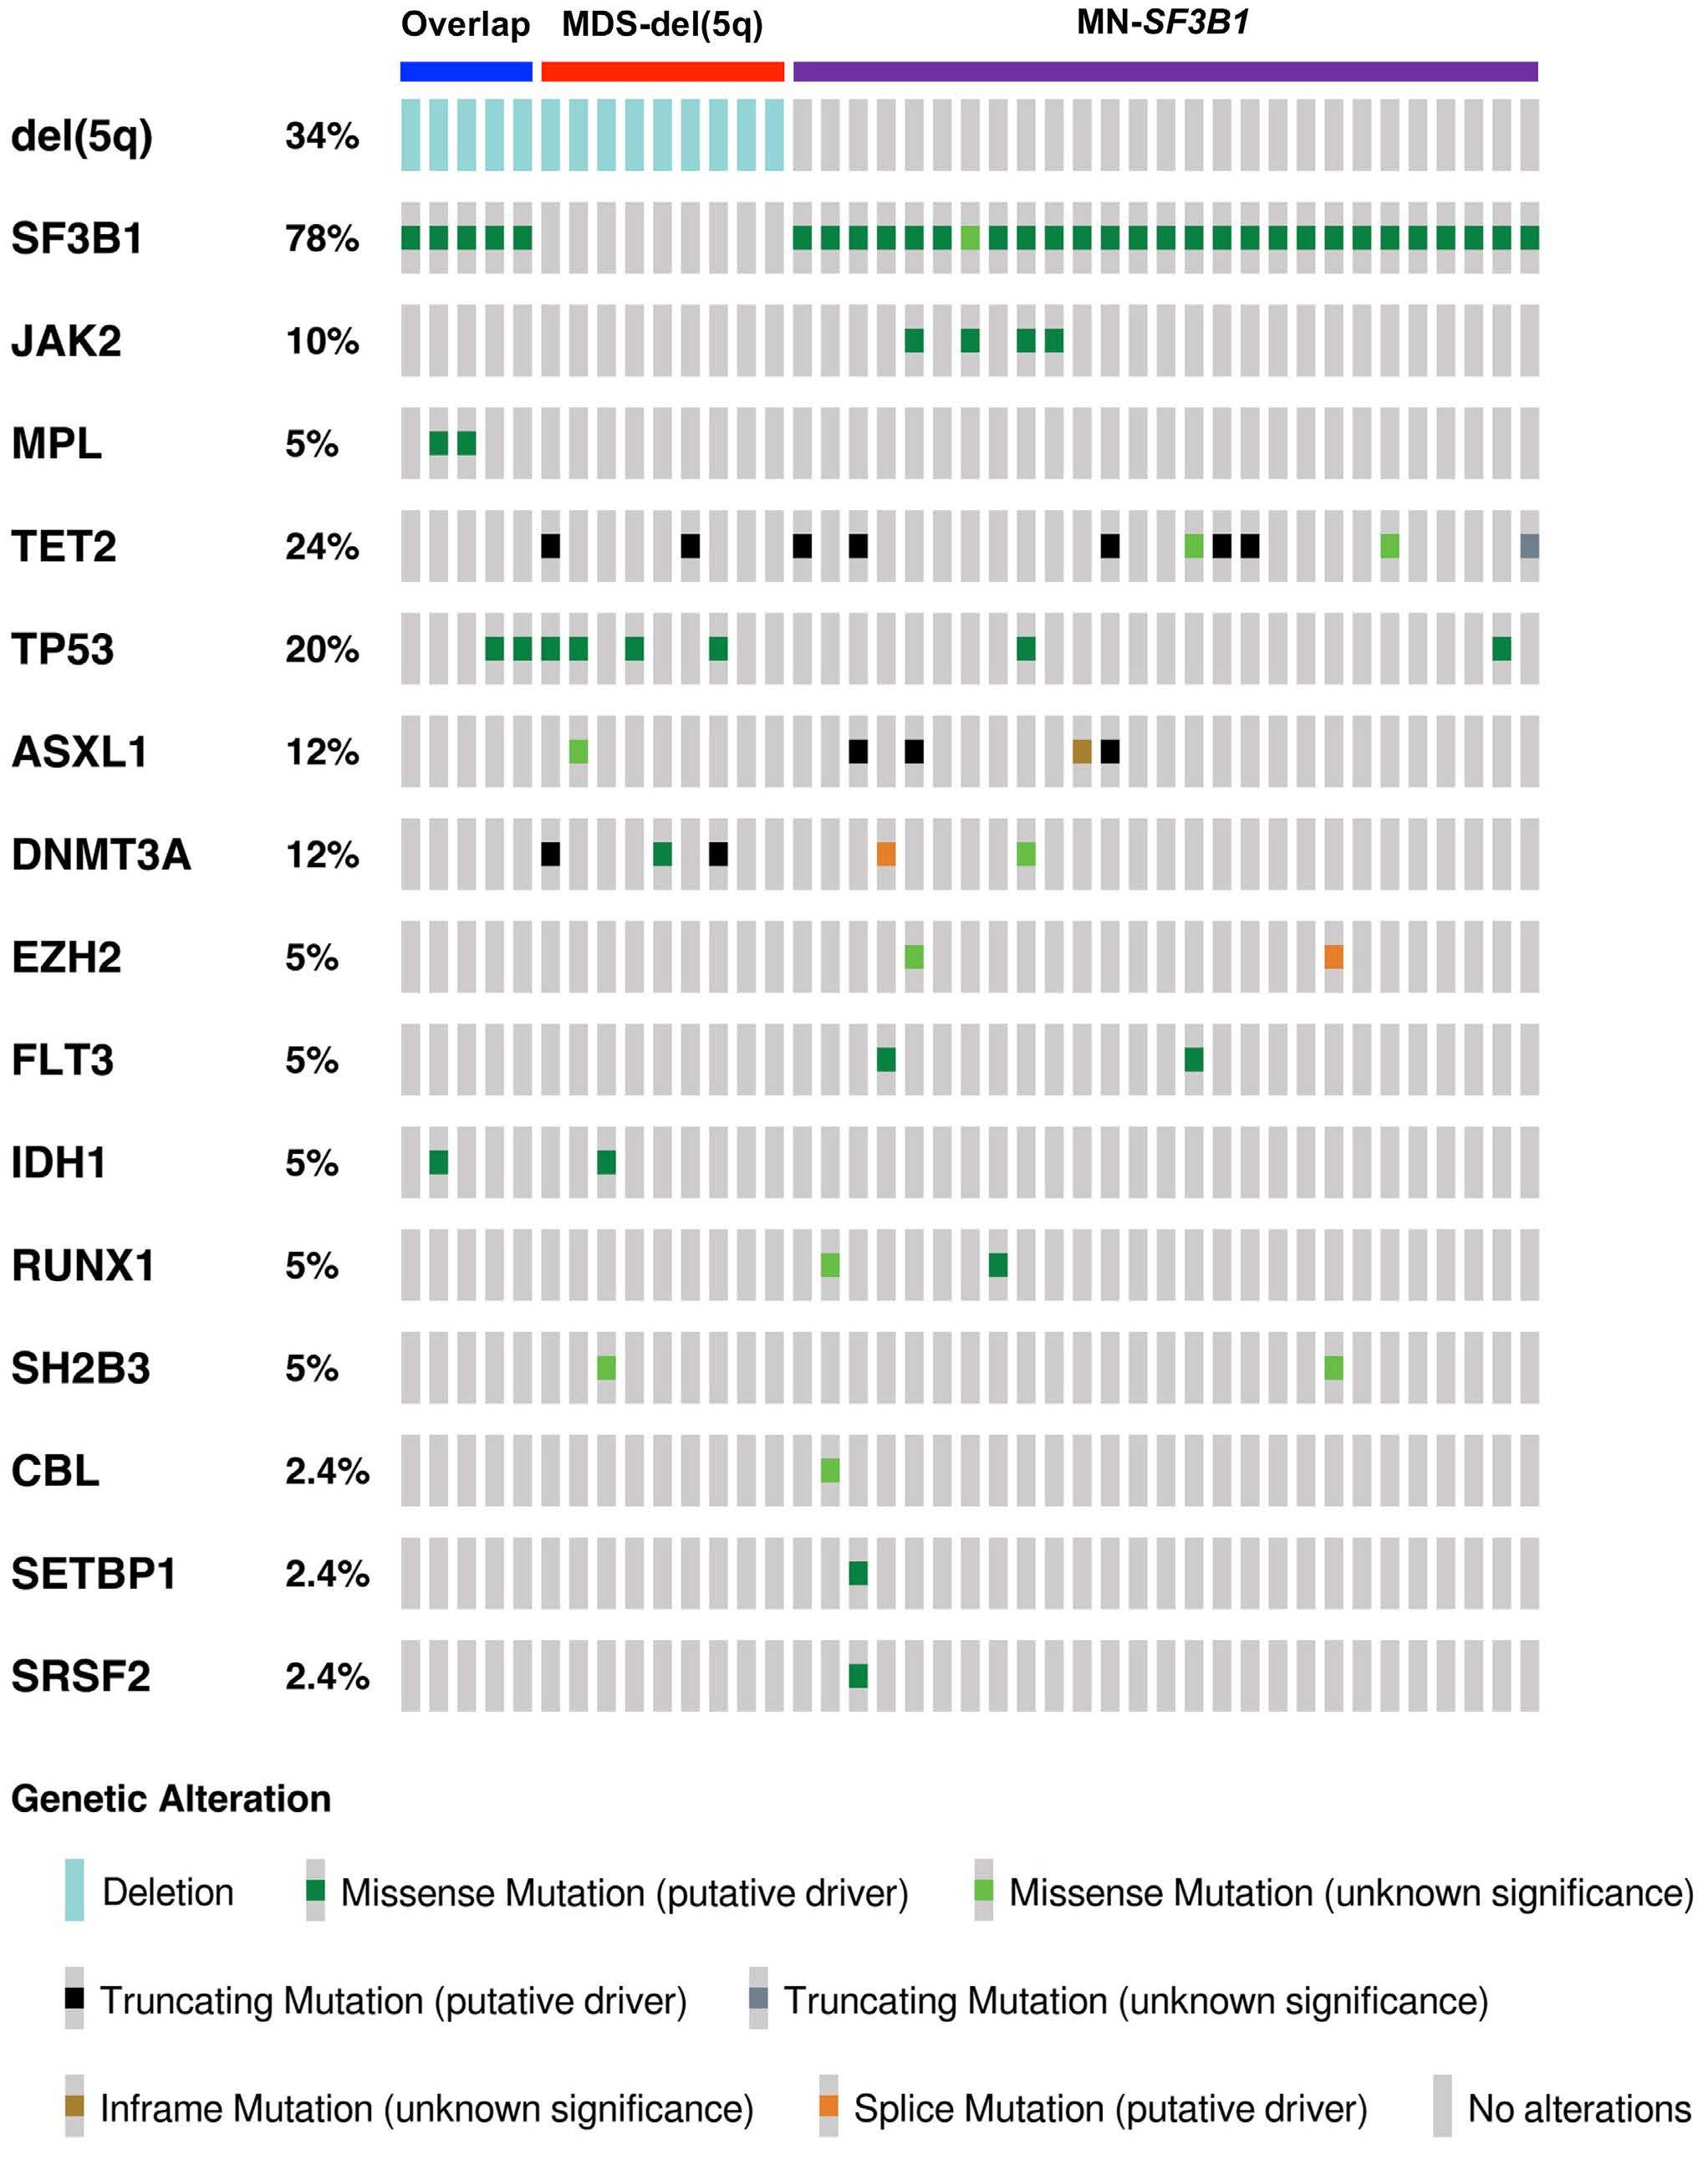
2676 Diagnostic challenges and proposed classification of myeloid neoplasms with overlapping features of thrombocytosis, ring sideroblasts and concurrent del(5q) and SF3B1 mutations
J. Kumar et al.
https://doi.org/10.3324/haematol.2023.284599
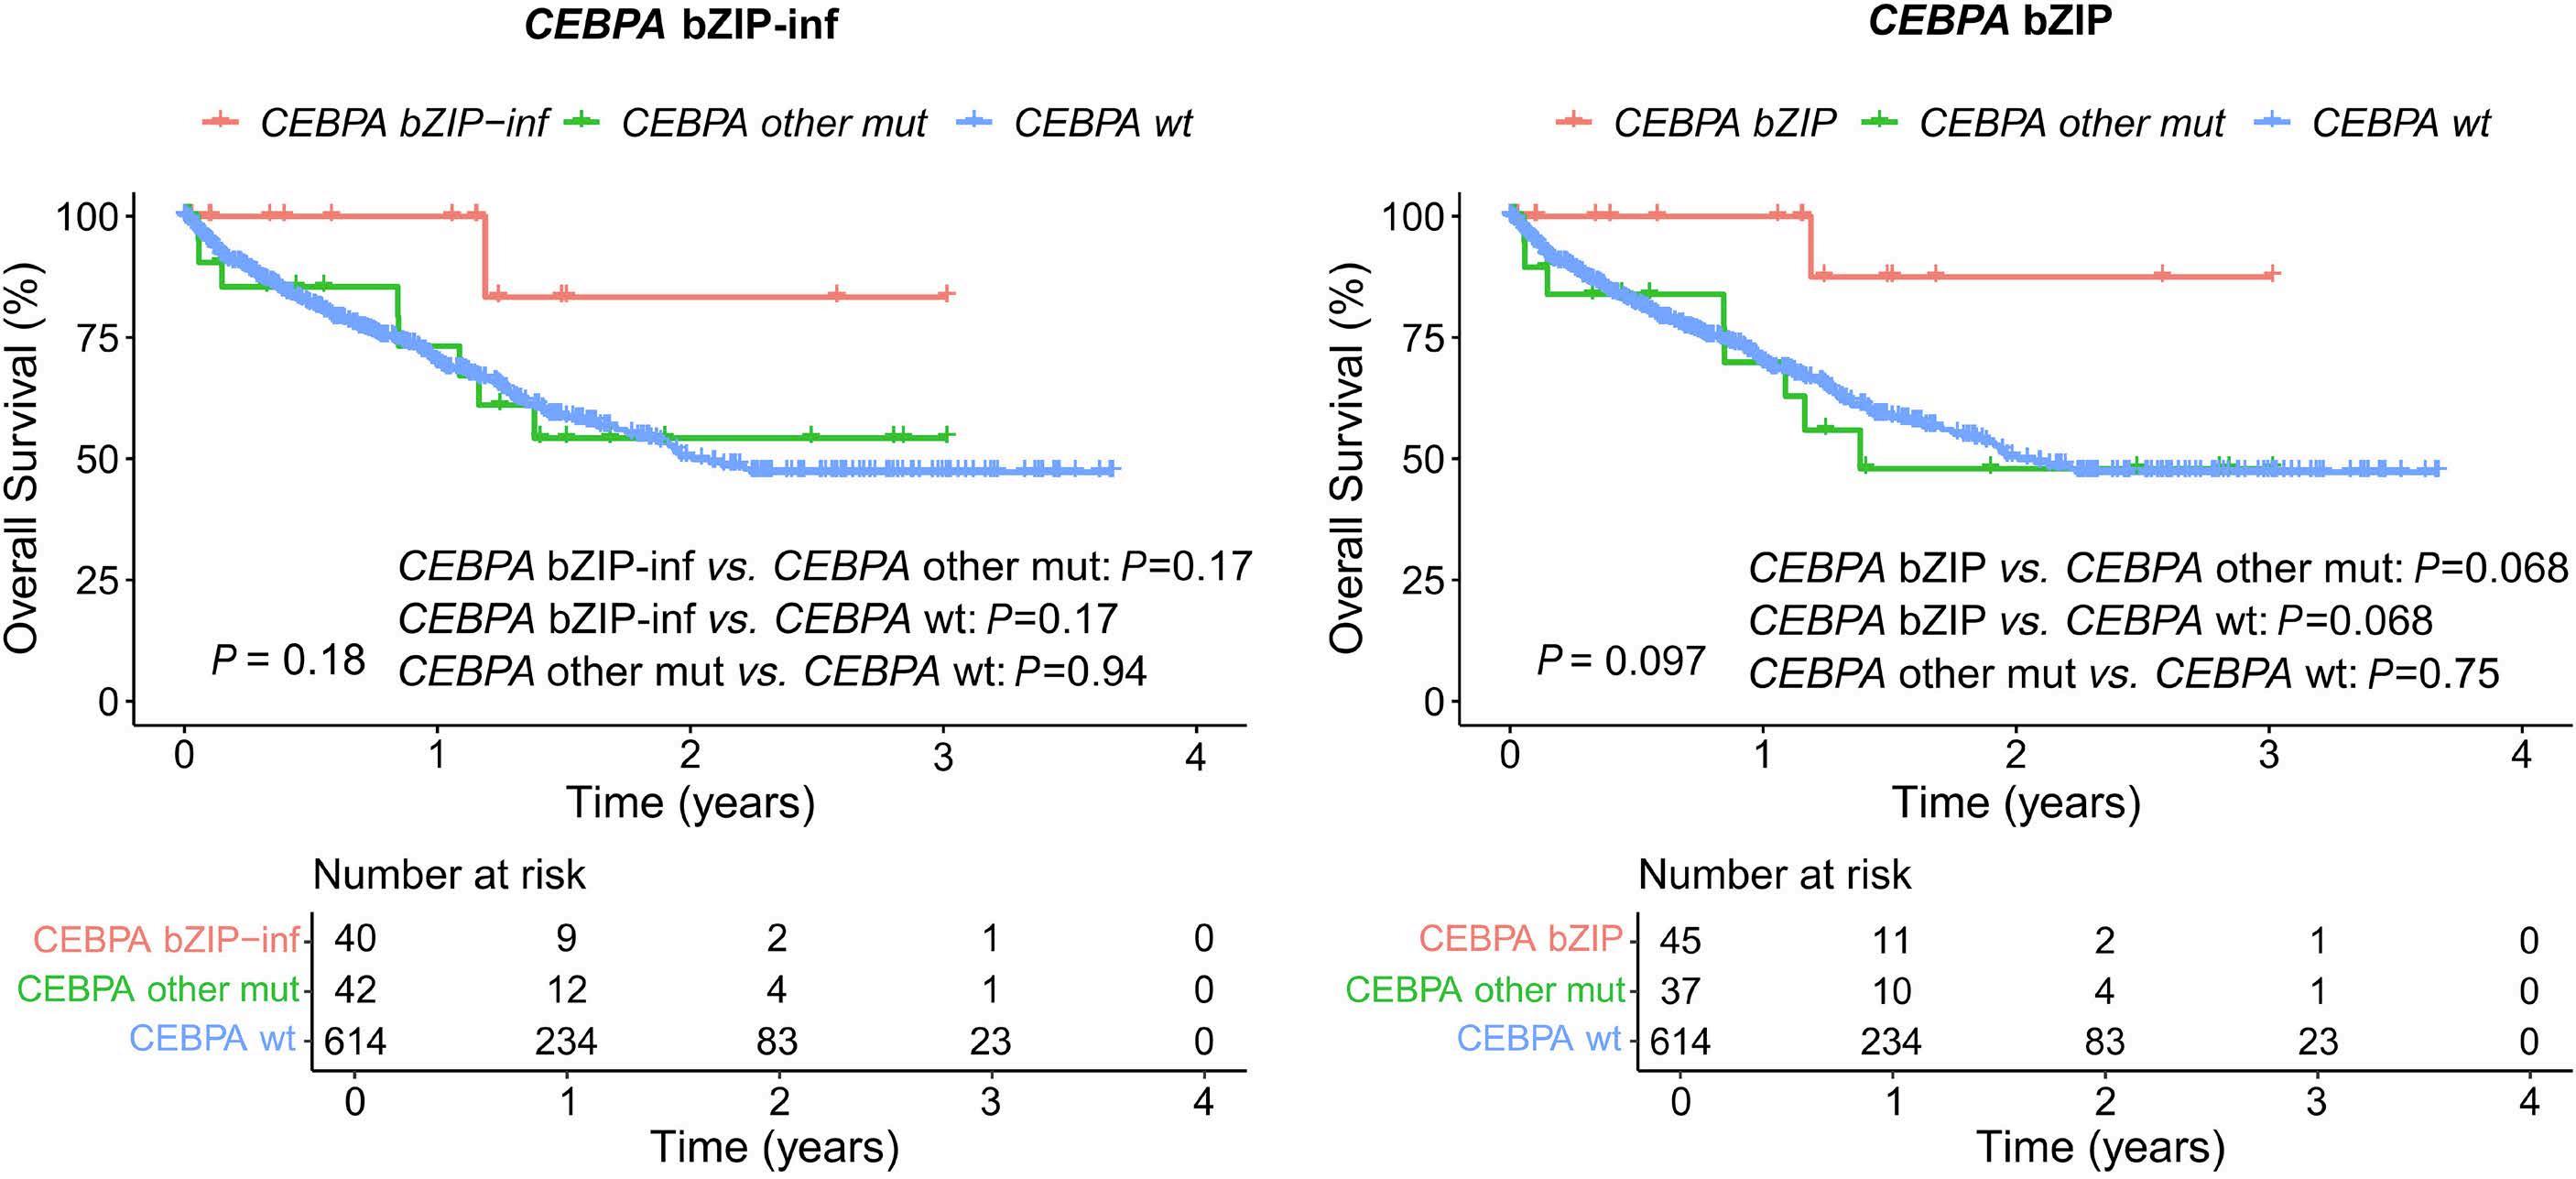
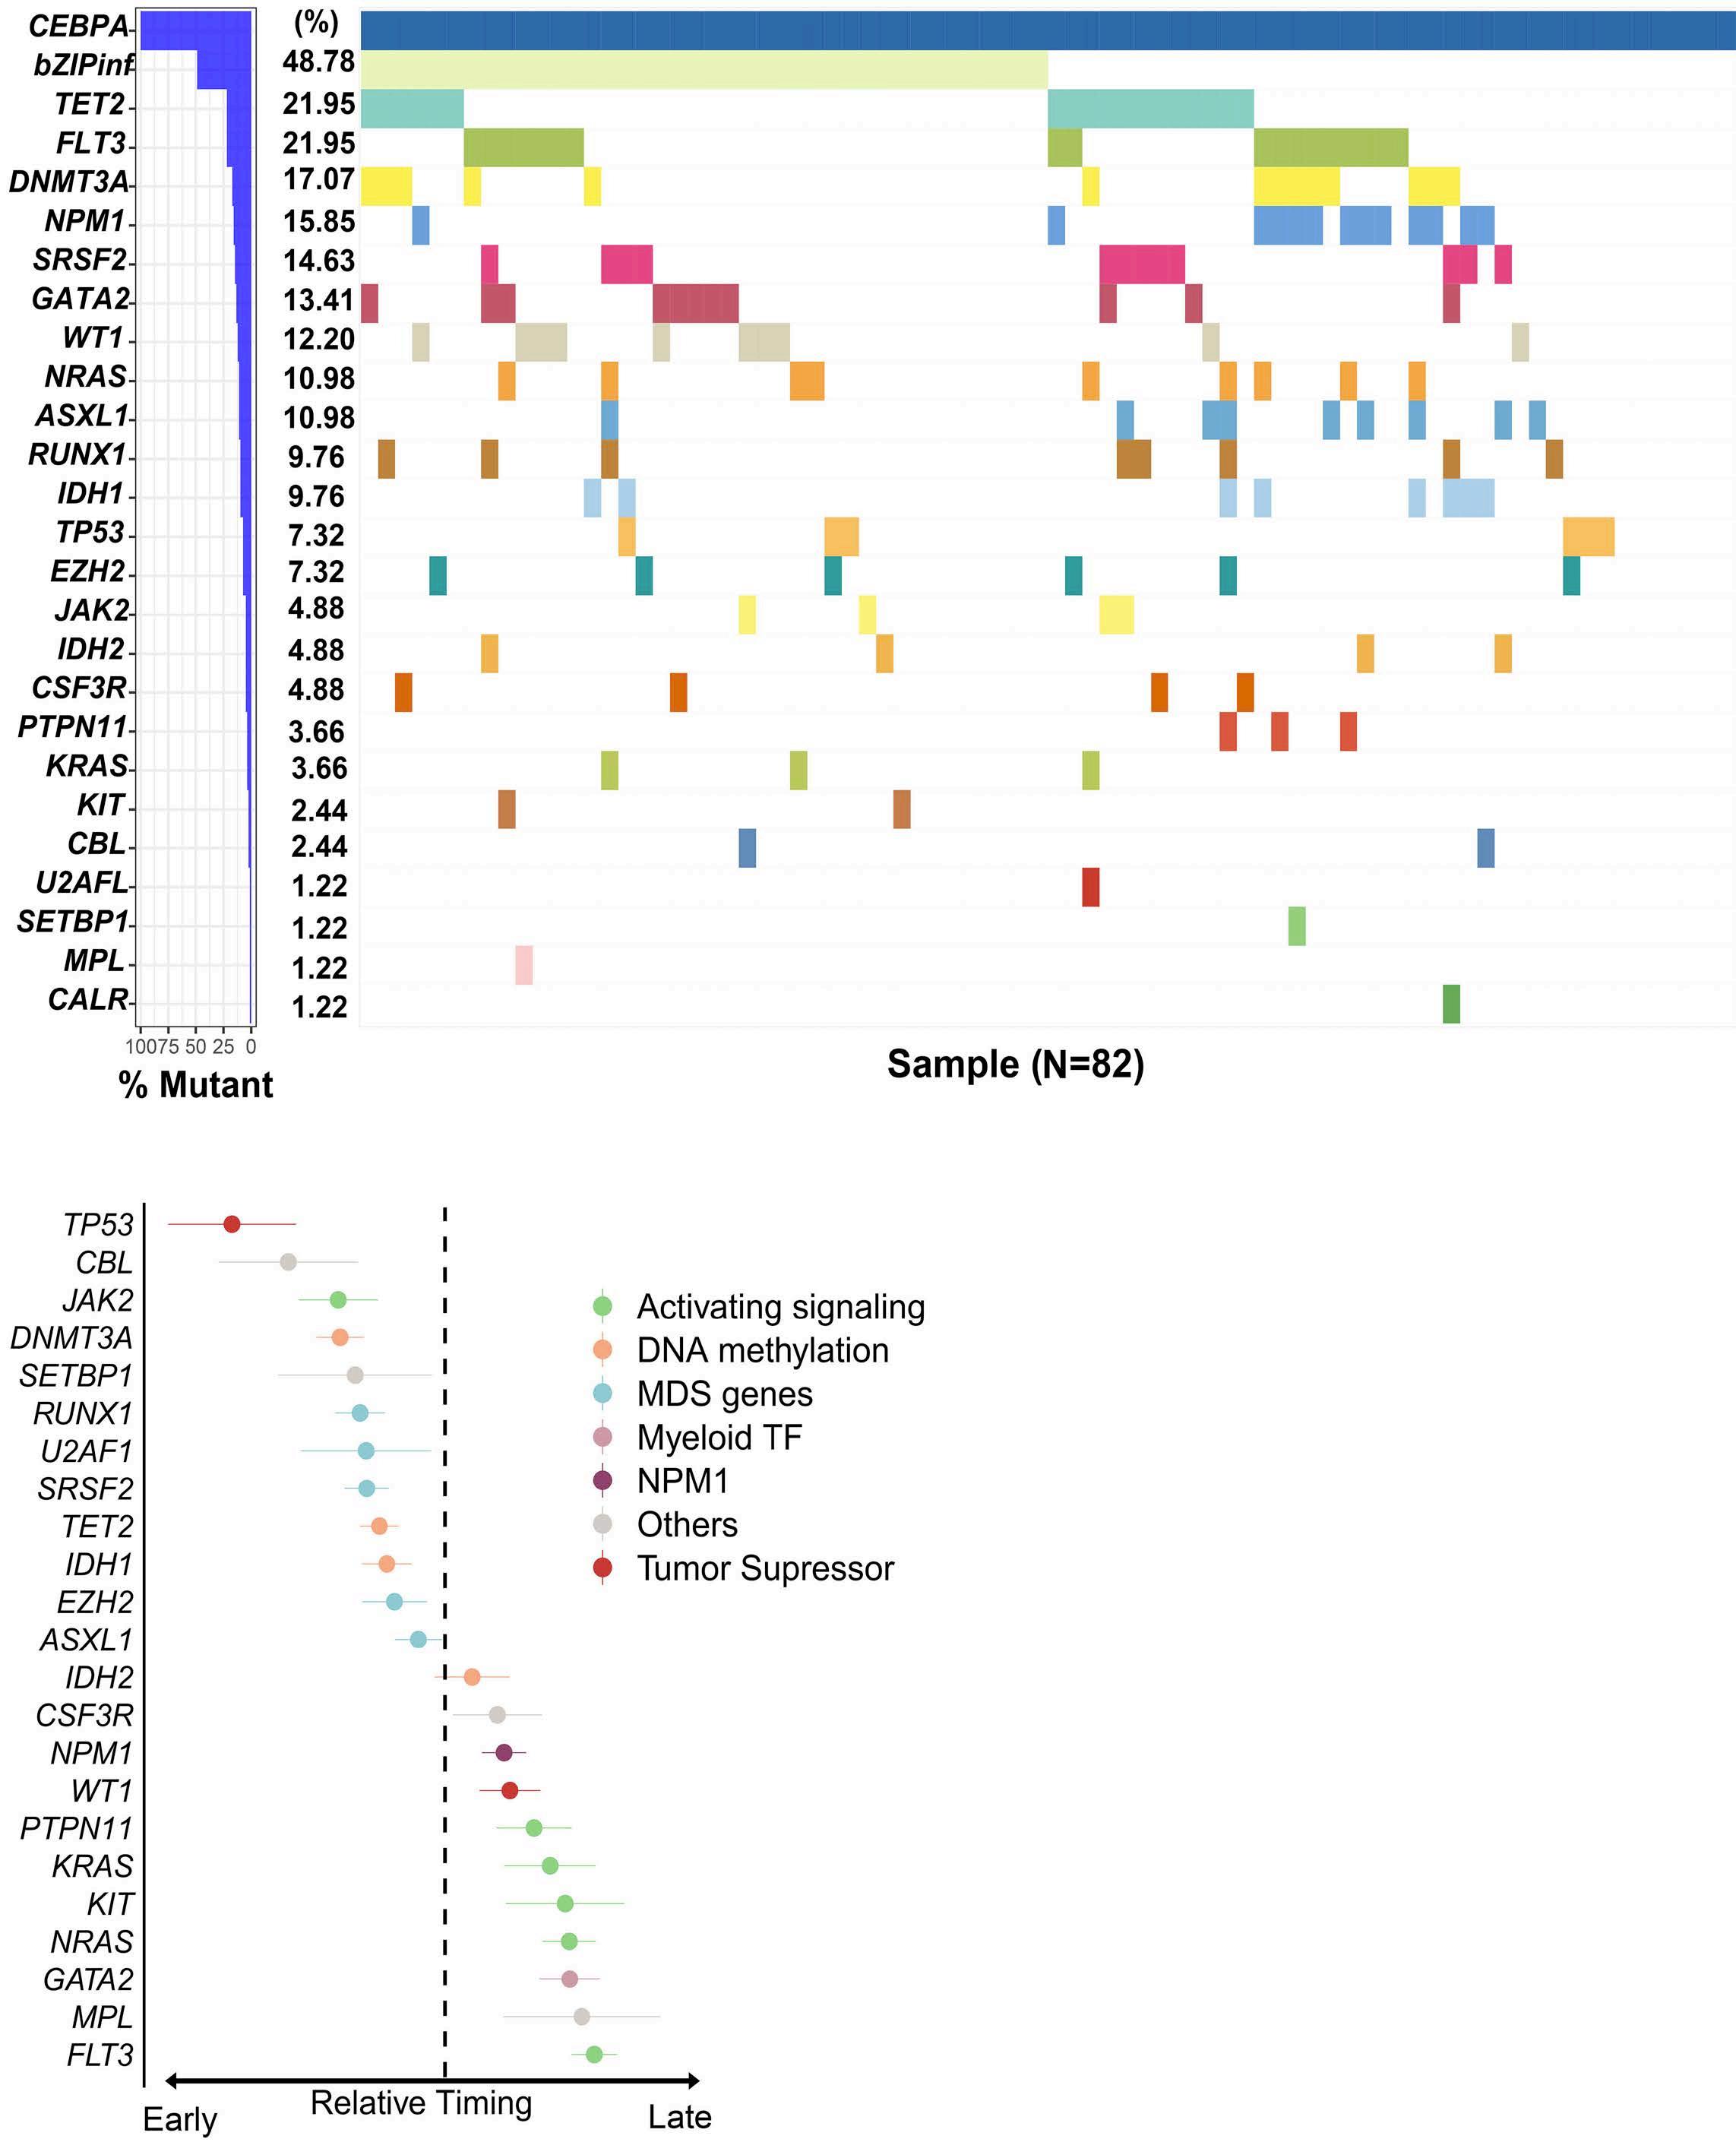
2682 Validation of mutated CEBPA bZIP as a distinct prognosis entity in acute myeloid leukemia: a study by the Spanish PETHEMA registry
E. Prados de la Torre et al.
https://doi.org/10.3324/haematol.2023.284601
2688 Benefit of phlebotomy and low-dose aspirin in the prevention of vascular events in patients with EPOR primary familial polycythemia on the island of New Caledonia
L. Boulnois et al.
https://doi.org/10.3324/haematol.2023.284658
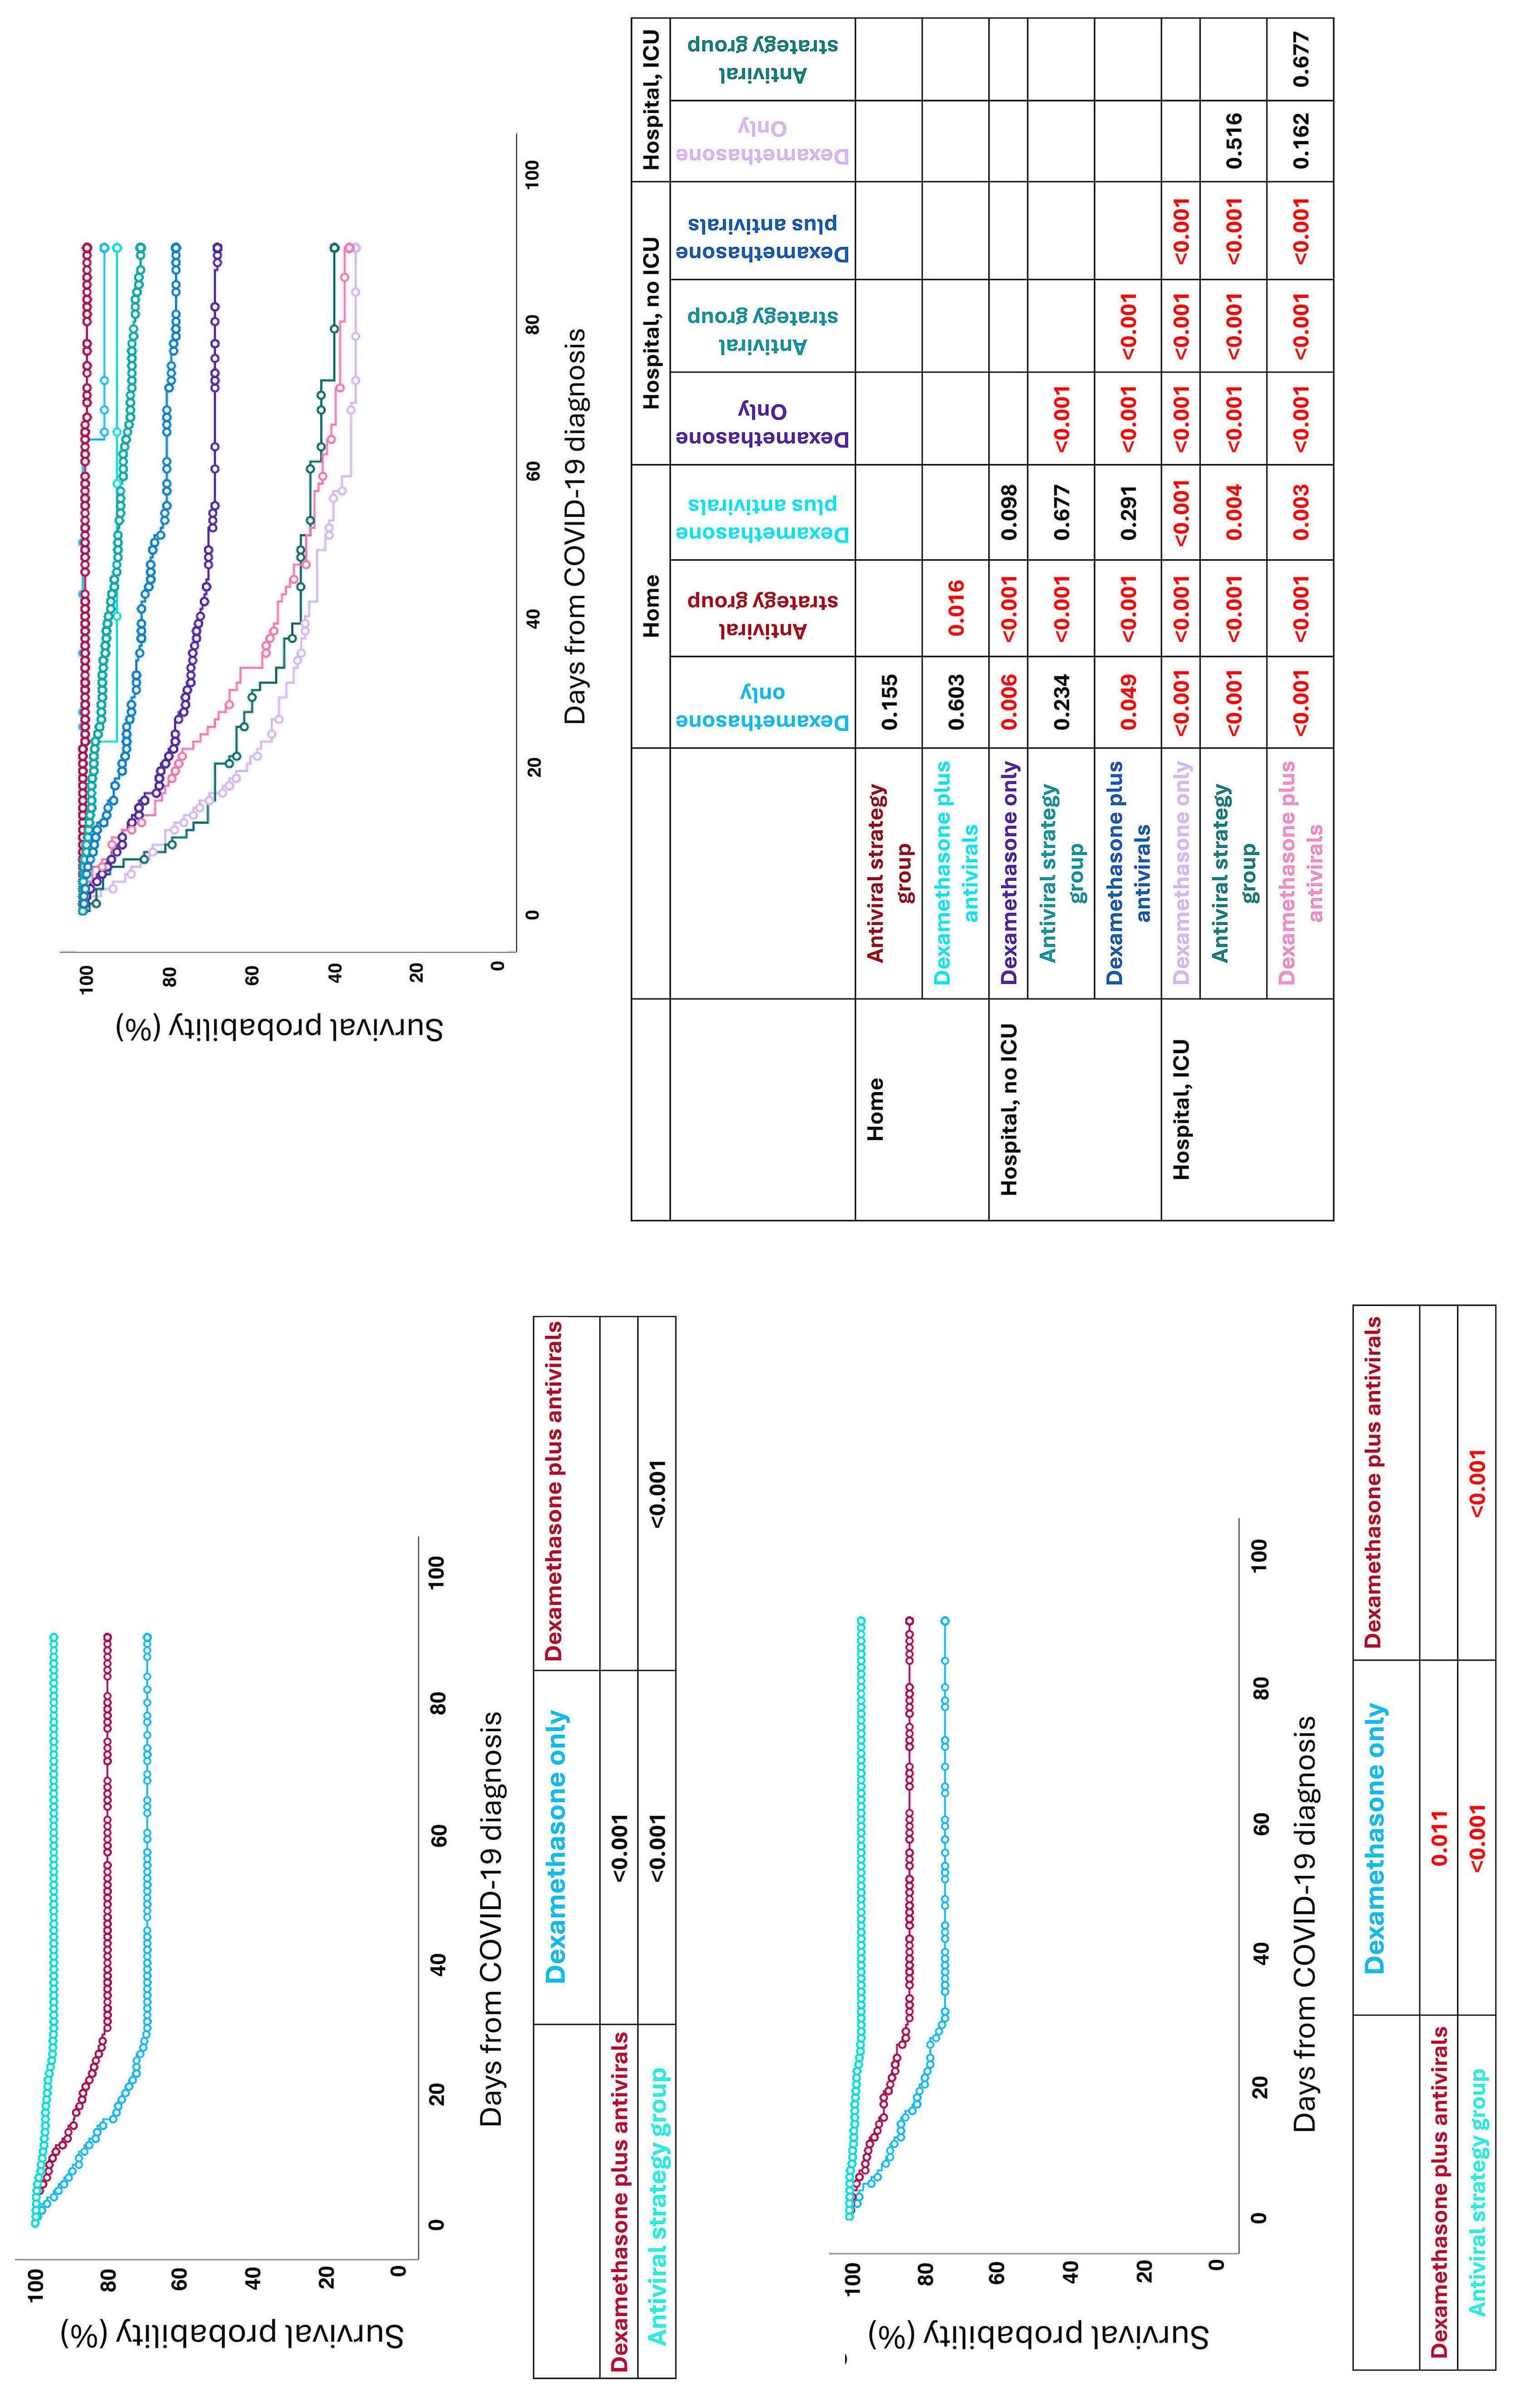
2693 Dexamethasone treatment for COVID-19 is related to increased mortality in hematologic malignancy patients: results from the EPICOVIDEHA registry
T.F. Aiello et al.
https://doi.org/10.3324/haematol.2023.284678
2701 IRF4-BLOC1S5: the first rearrangement gene identified in TEMPI syndrome
M. Zhao et al.
https://doi.org/10.3324/haematol.2023.284727
2706 Cladribine plus cytarabine plus venetoclax in acute myeloid leukemia relapsed or refractory to venetoclax plus hypomethylating agent
N. Steinauer et al.
https://doi.org/10.3324/haematol.2024.284962
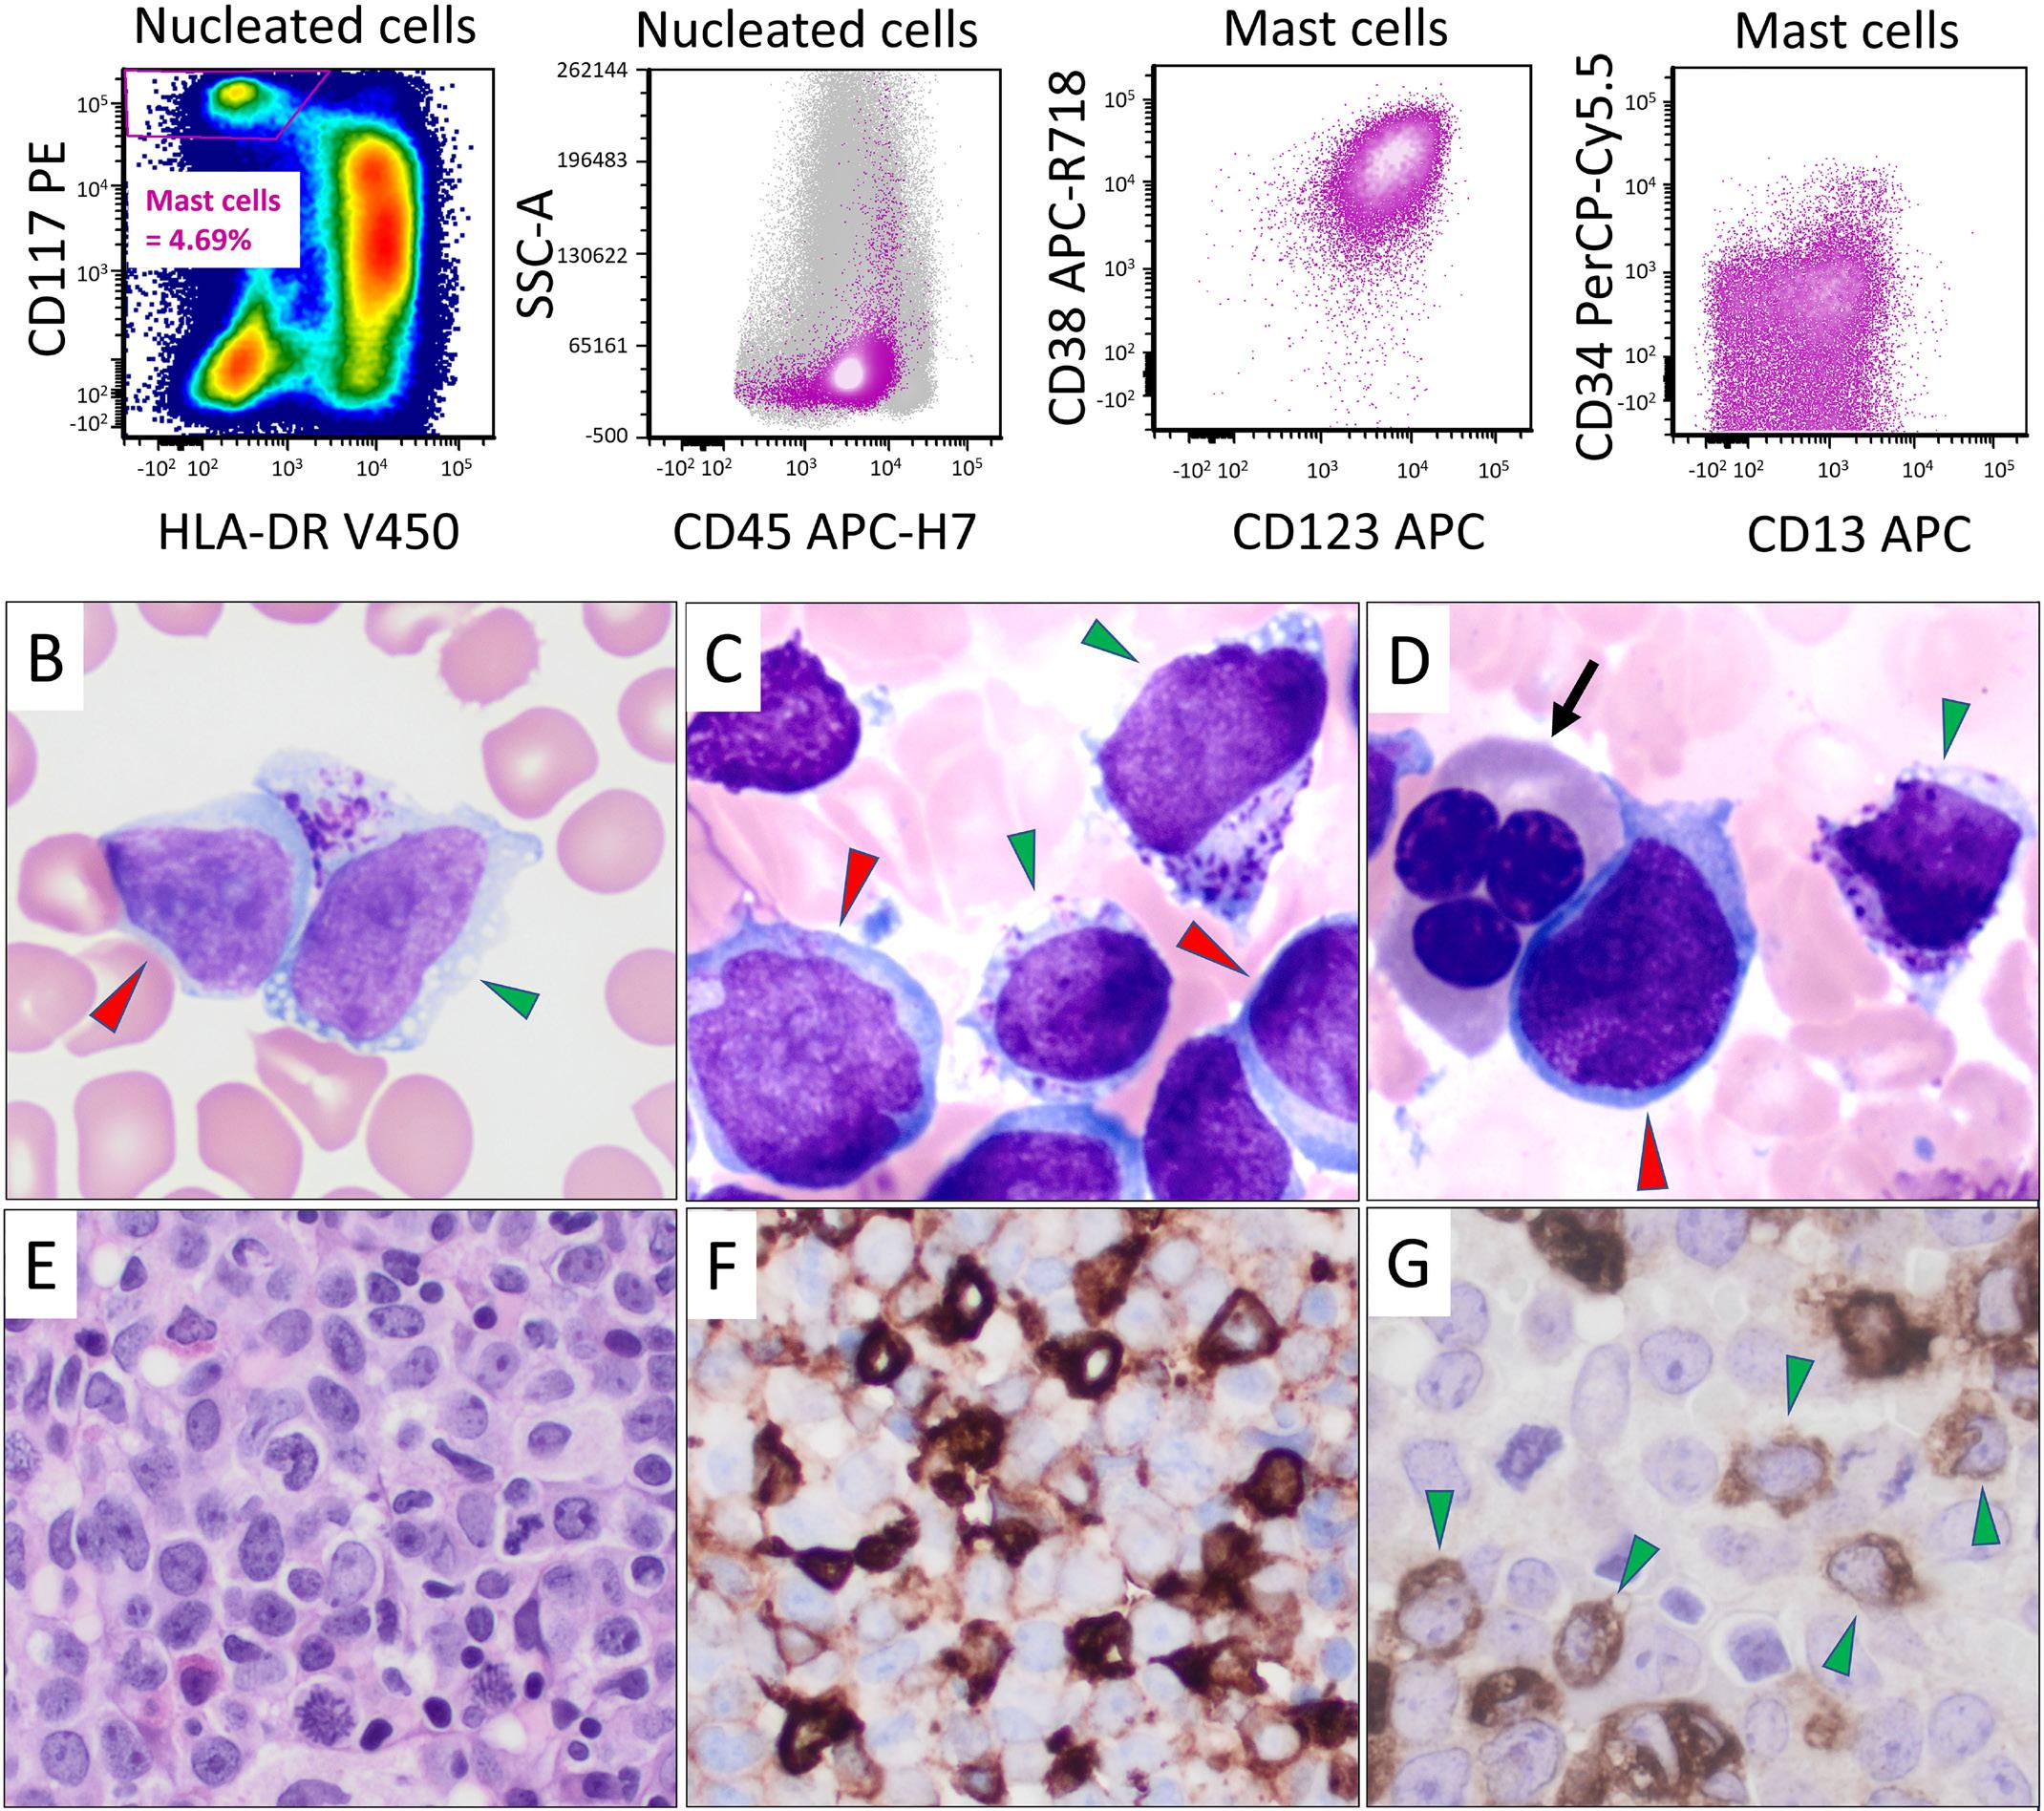
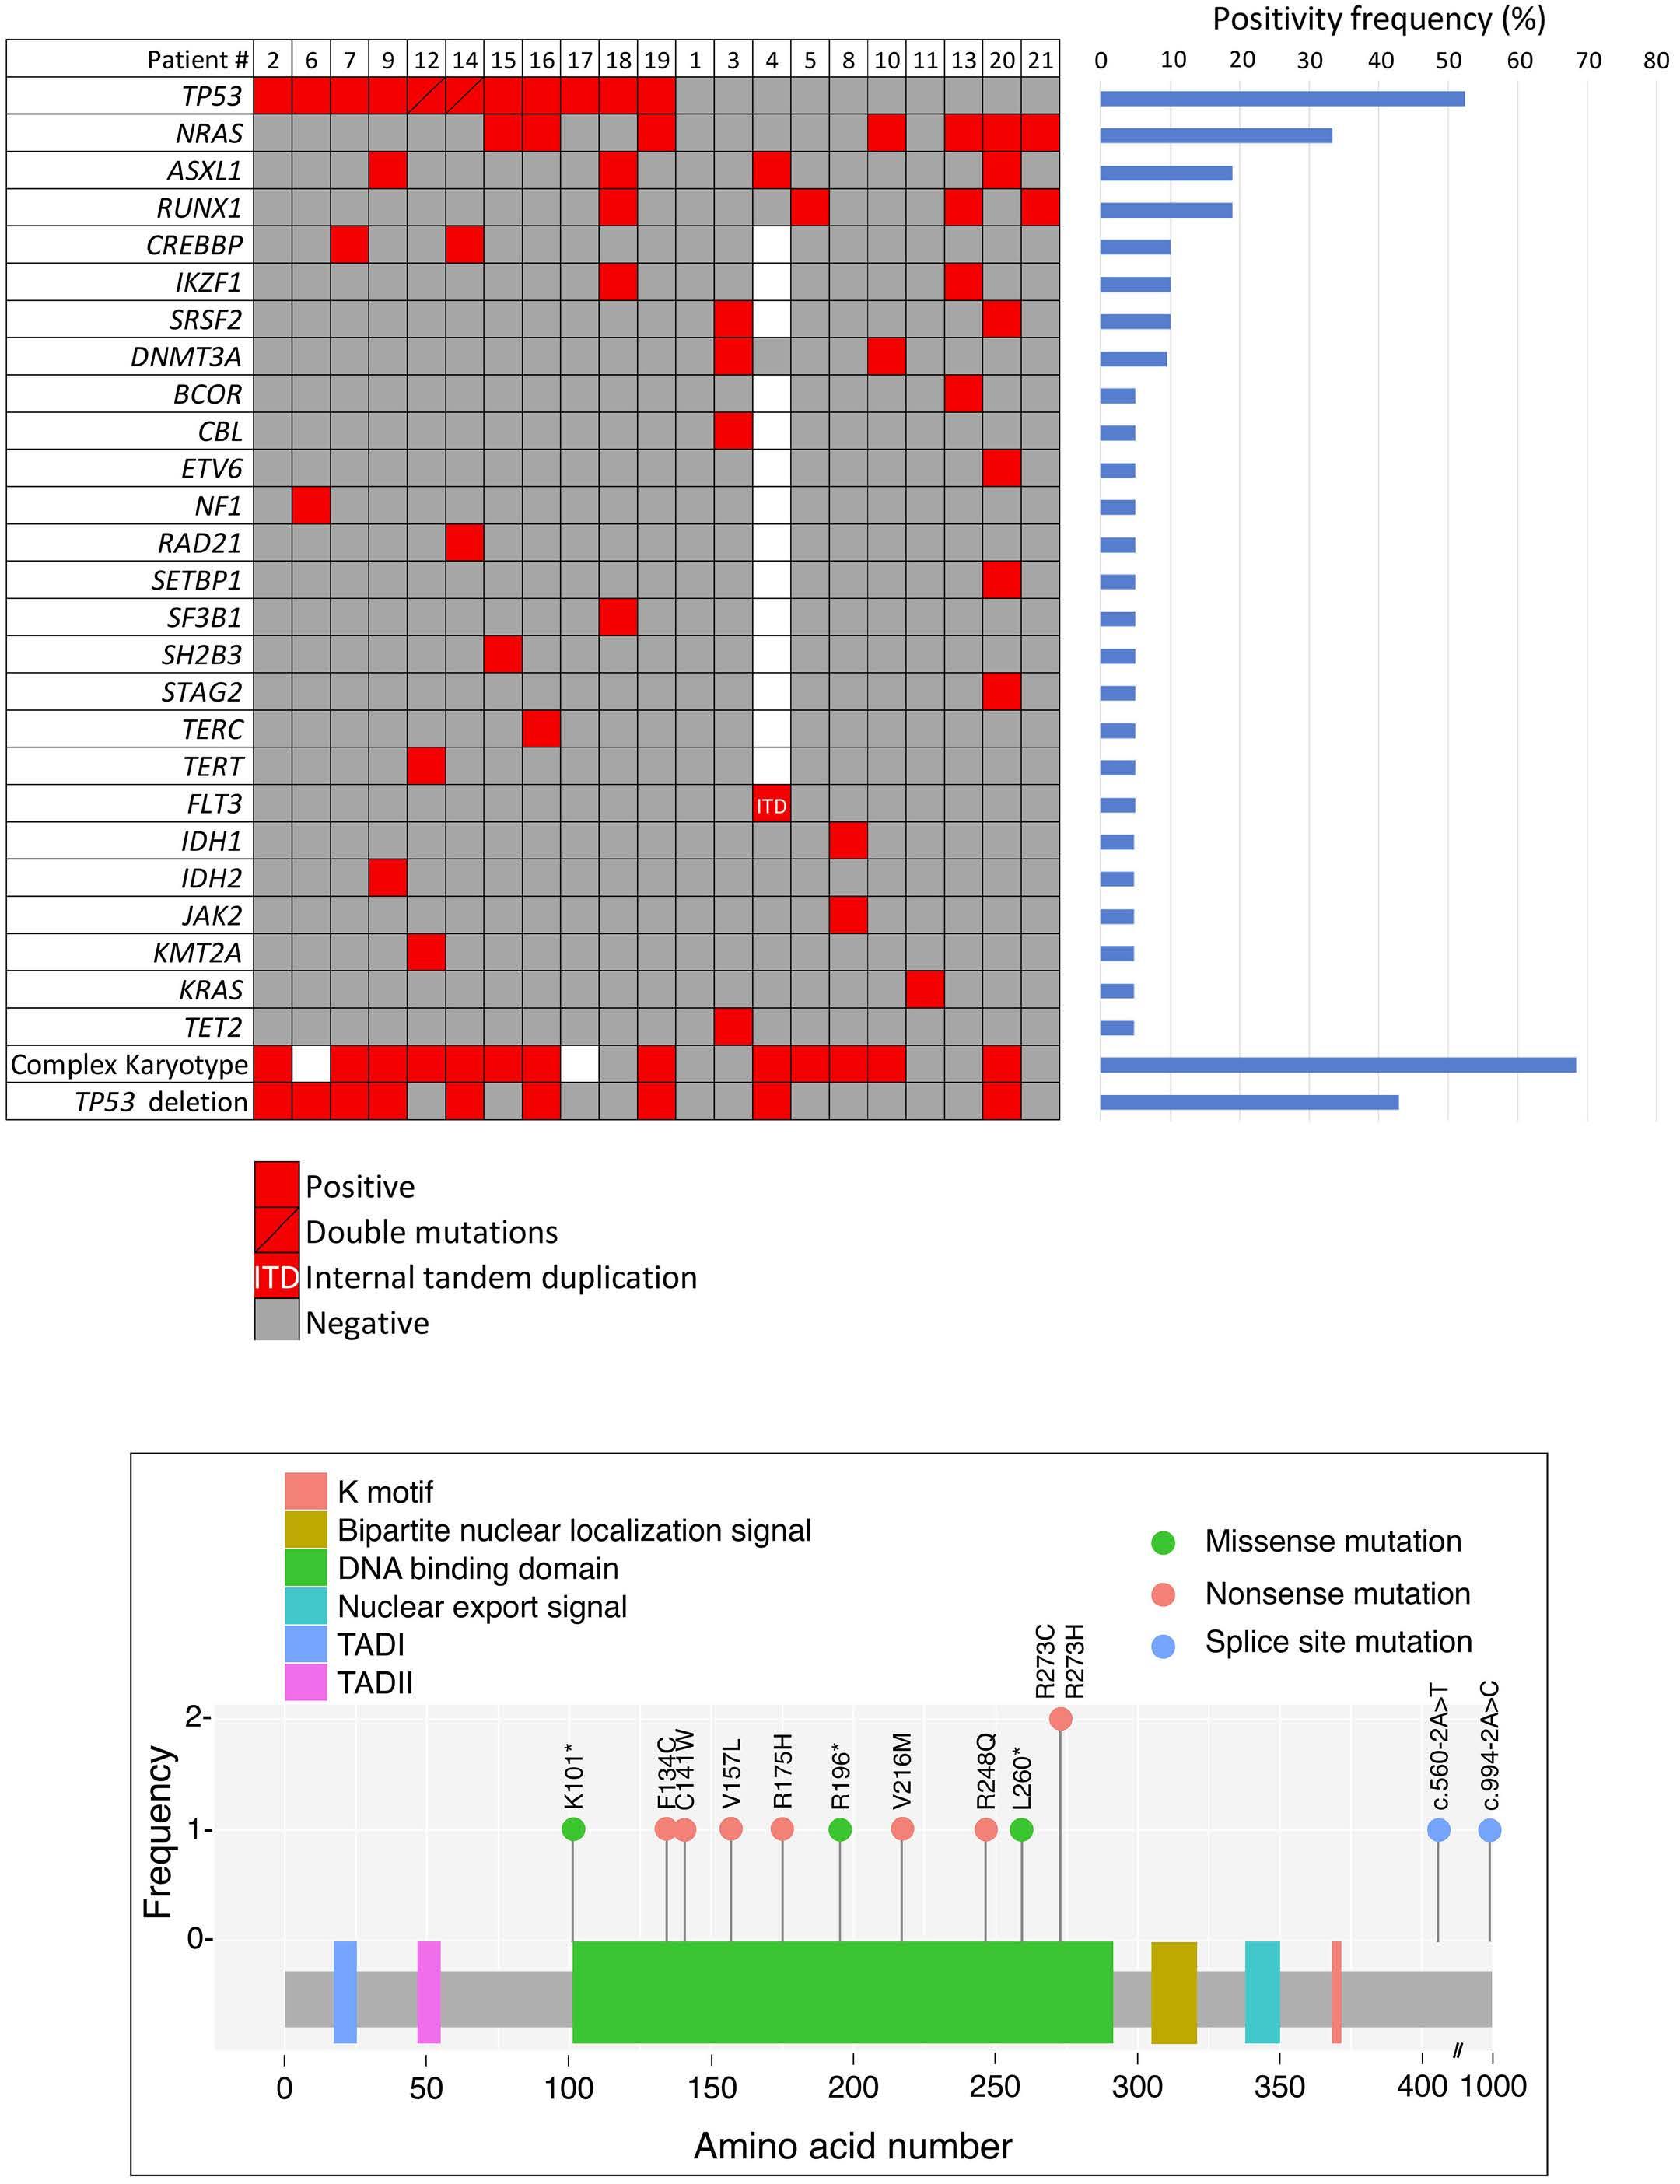
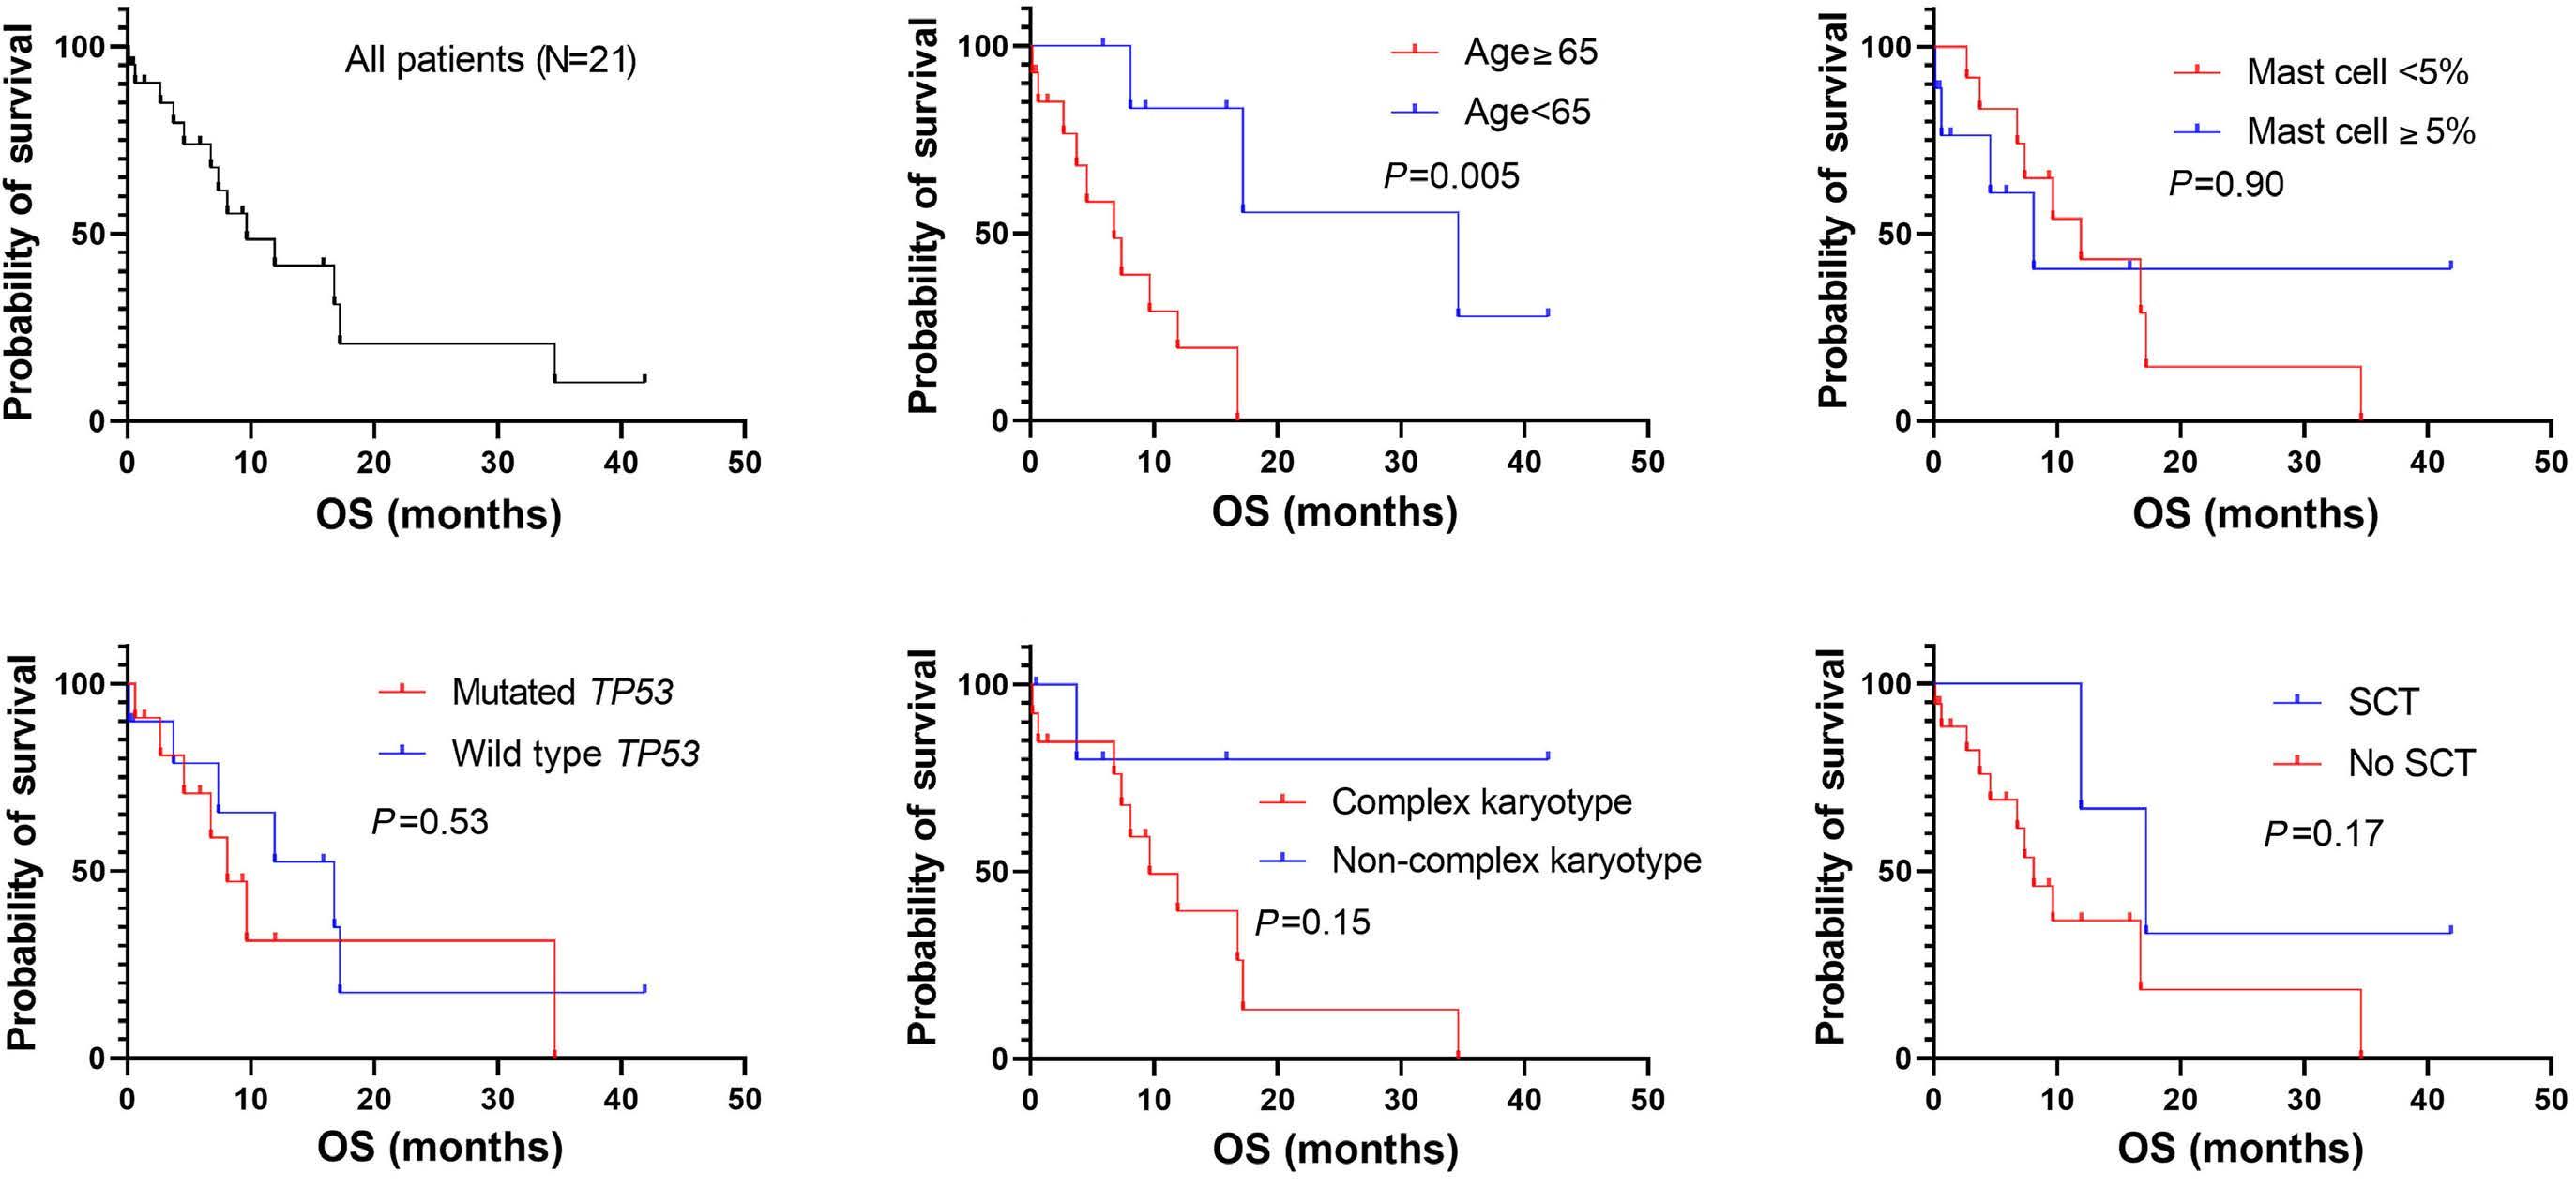
2711 Acute myeloid leukemia with mast cell differentiation is characterized by interstitial mast cells, complex karyotype, TP53 alterations and poor prognosis
D. Hwan Kim et al.
https://doi.org/10.3324/haematol.2024.284976
2716 Outcomes after chimeric antigen receptor T-cell therapy across large B-cell lymphoma subtypes
C. Bourlon et al.
https://doi.org/10.3324/haematol.2024.285010
2721 Non-myeloma light chain cast nephropathy: a multicenter retrospective study on clinicopathological characteristics
A.C. Martins et al.
https://doi.org/10.3324/haematol.2024.285031
2726 Outcome of infants with acute lymphoblastic leukemia treated with the Chinese Children’s Cancer Group Acute Lymphoblastic Leukemia 2015 study protocol
A.W.K. Leung et al.
https://doi.org/10.3324/haematol.2024.285201
2732 Hypomethylating agents are associated with high rates of hematologic toxicity in patients with secondary myeloid neoplasms developing after acquired aplastic anemia
M.P. Connor et al.
https://doi.org/10.3324/haematol.2024.285275
2738 Evaluation of the ATM L2307F germline variant in 121 Italian pedigrees with familial myeloproliferative neoplasms
O. Borsani et al.
https://doi.org/10.3324/haematol.2024.285539
Case Reports & Case Series
2741 HJV mutations causing hemochromatosis: variable phenotypic expression in a pair of twins
A. Vadivelan et al.
https://doi.org/10.3324/haematol.2023.284134
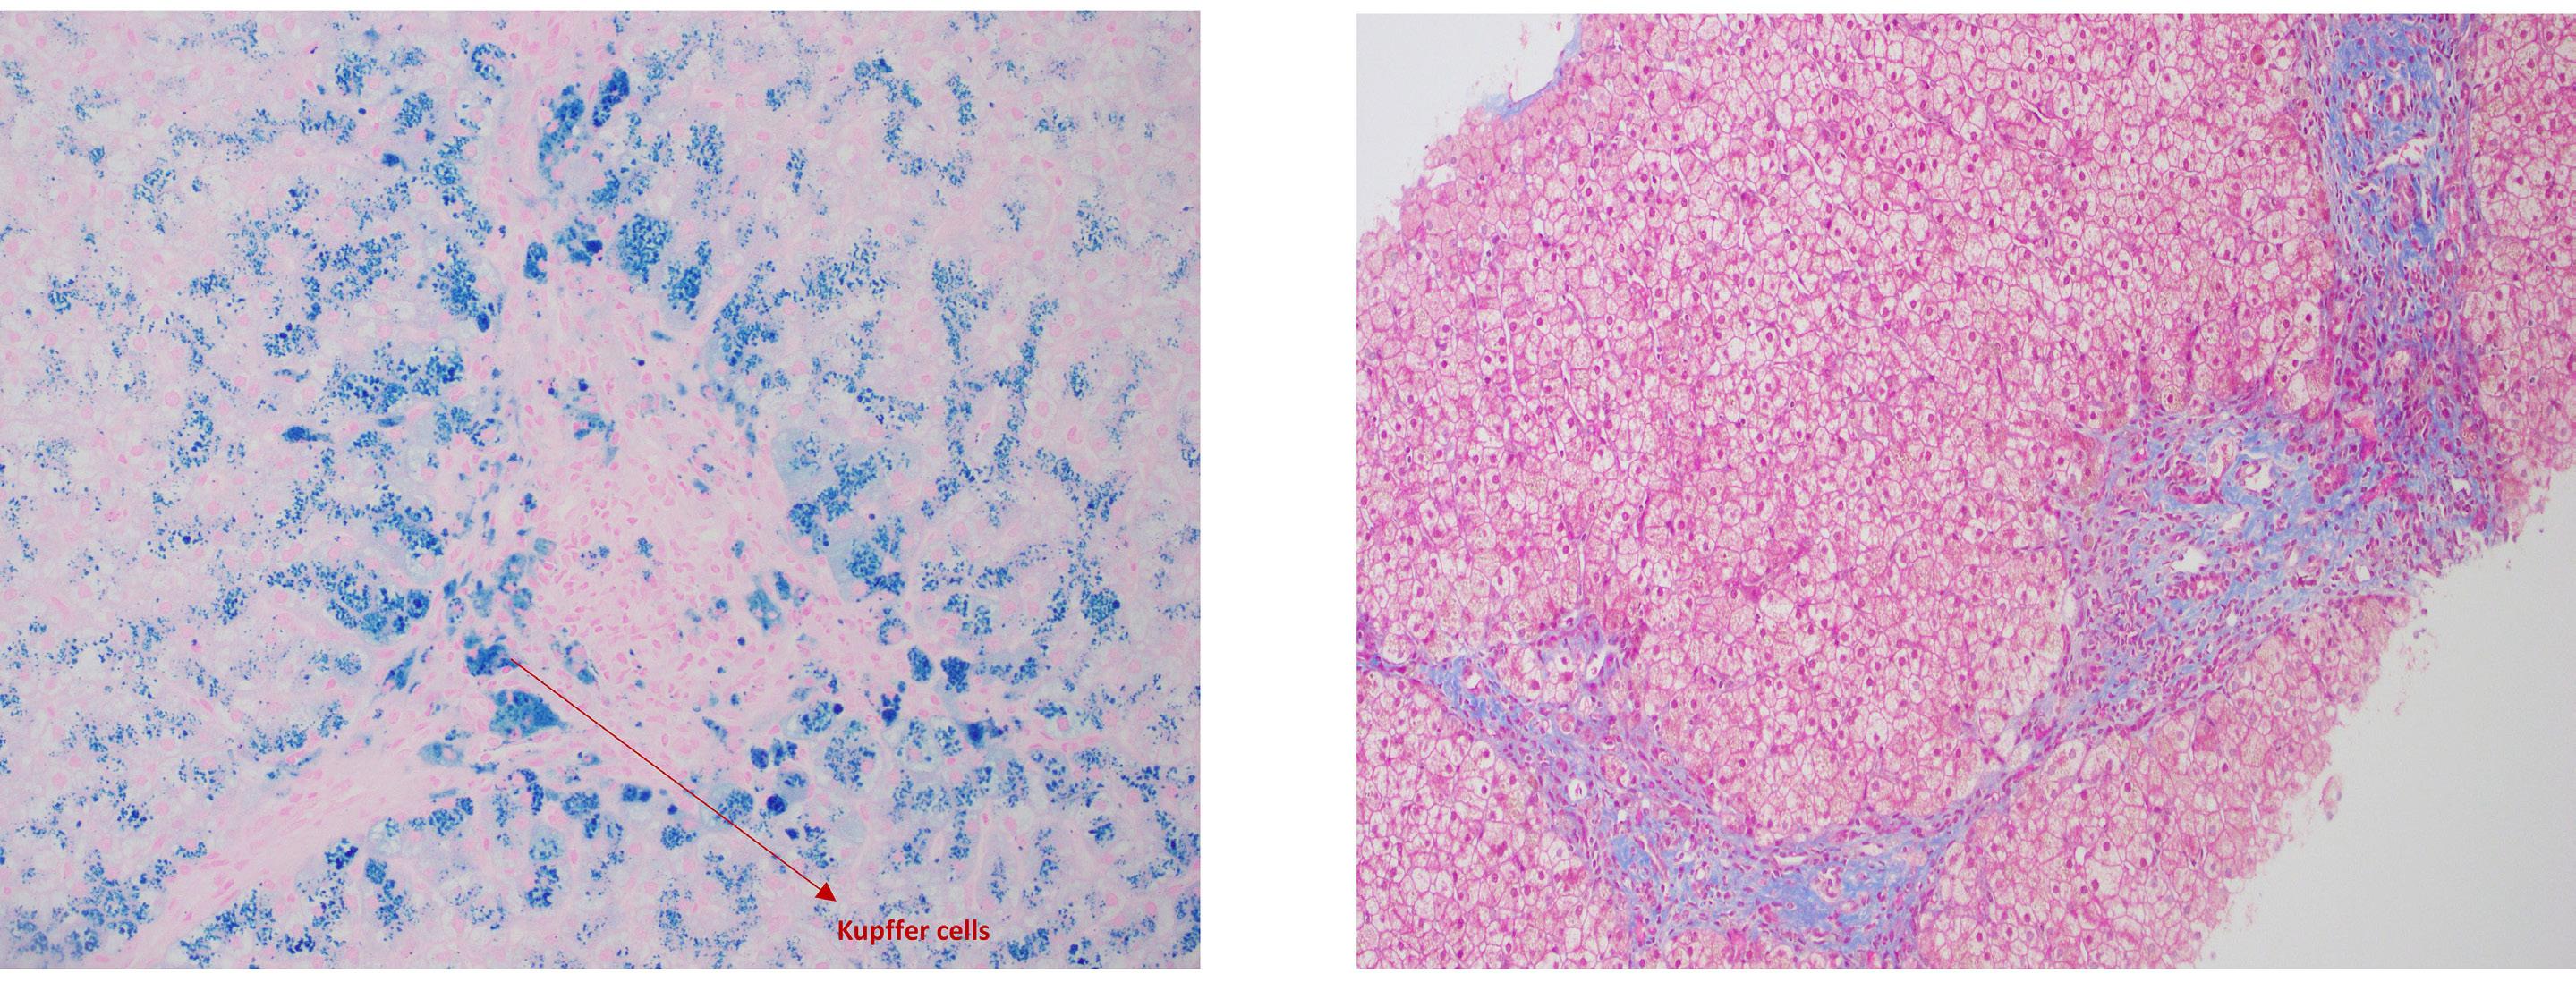
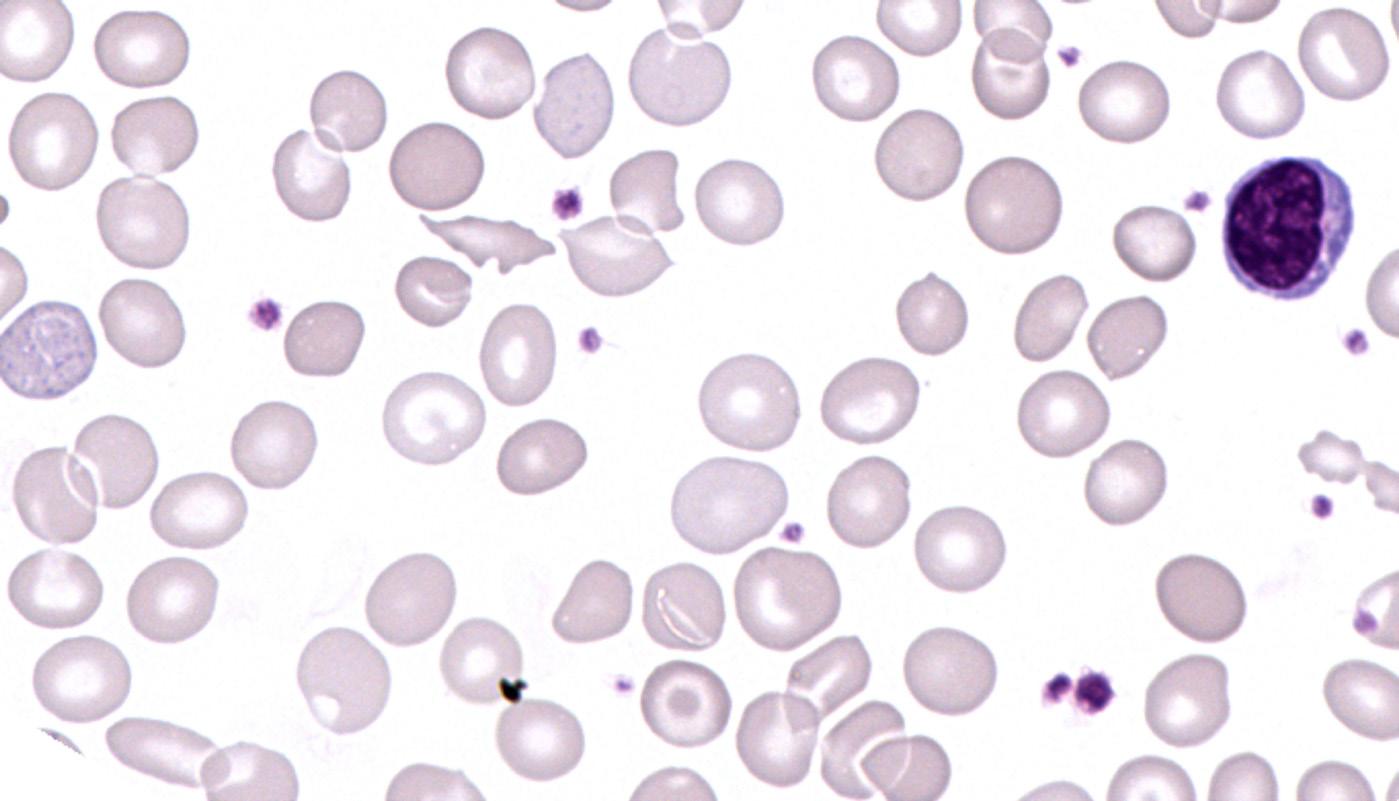
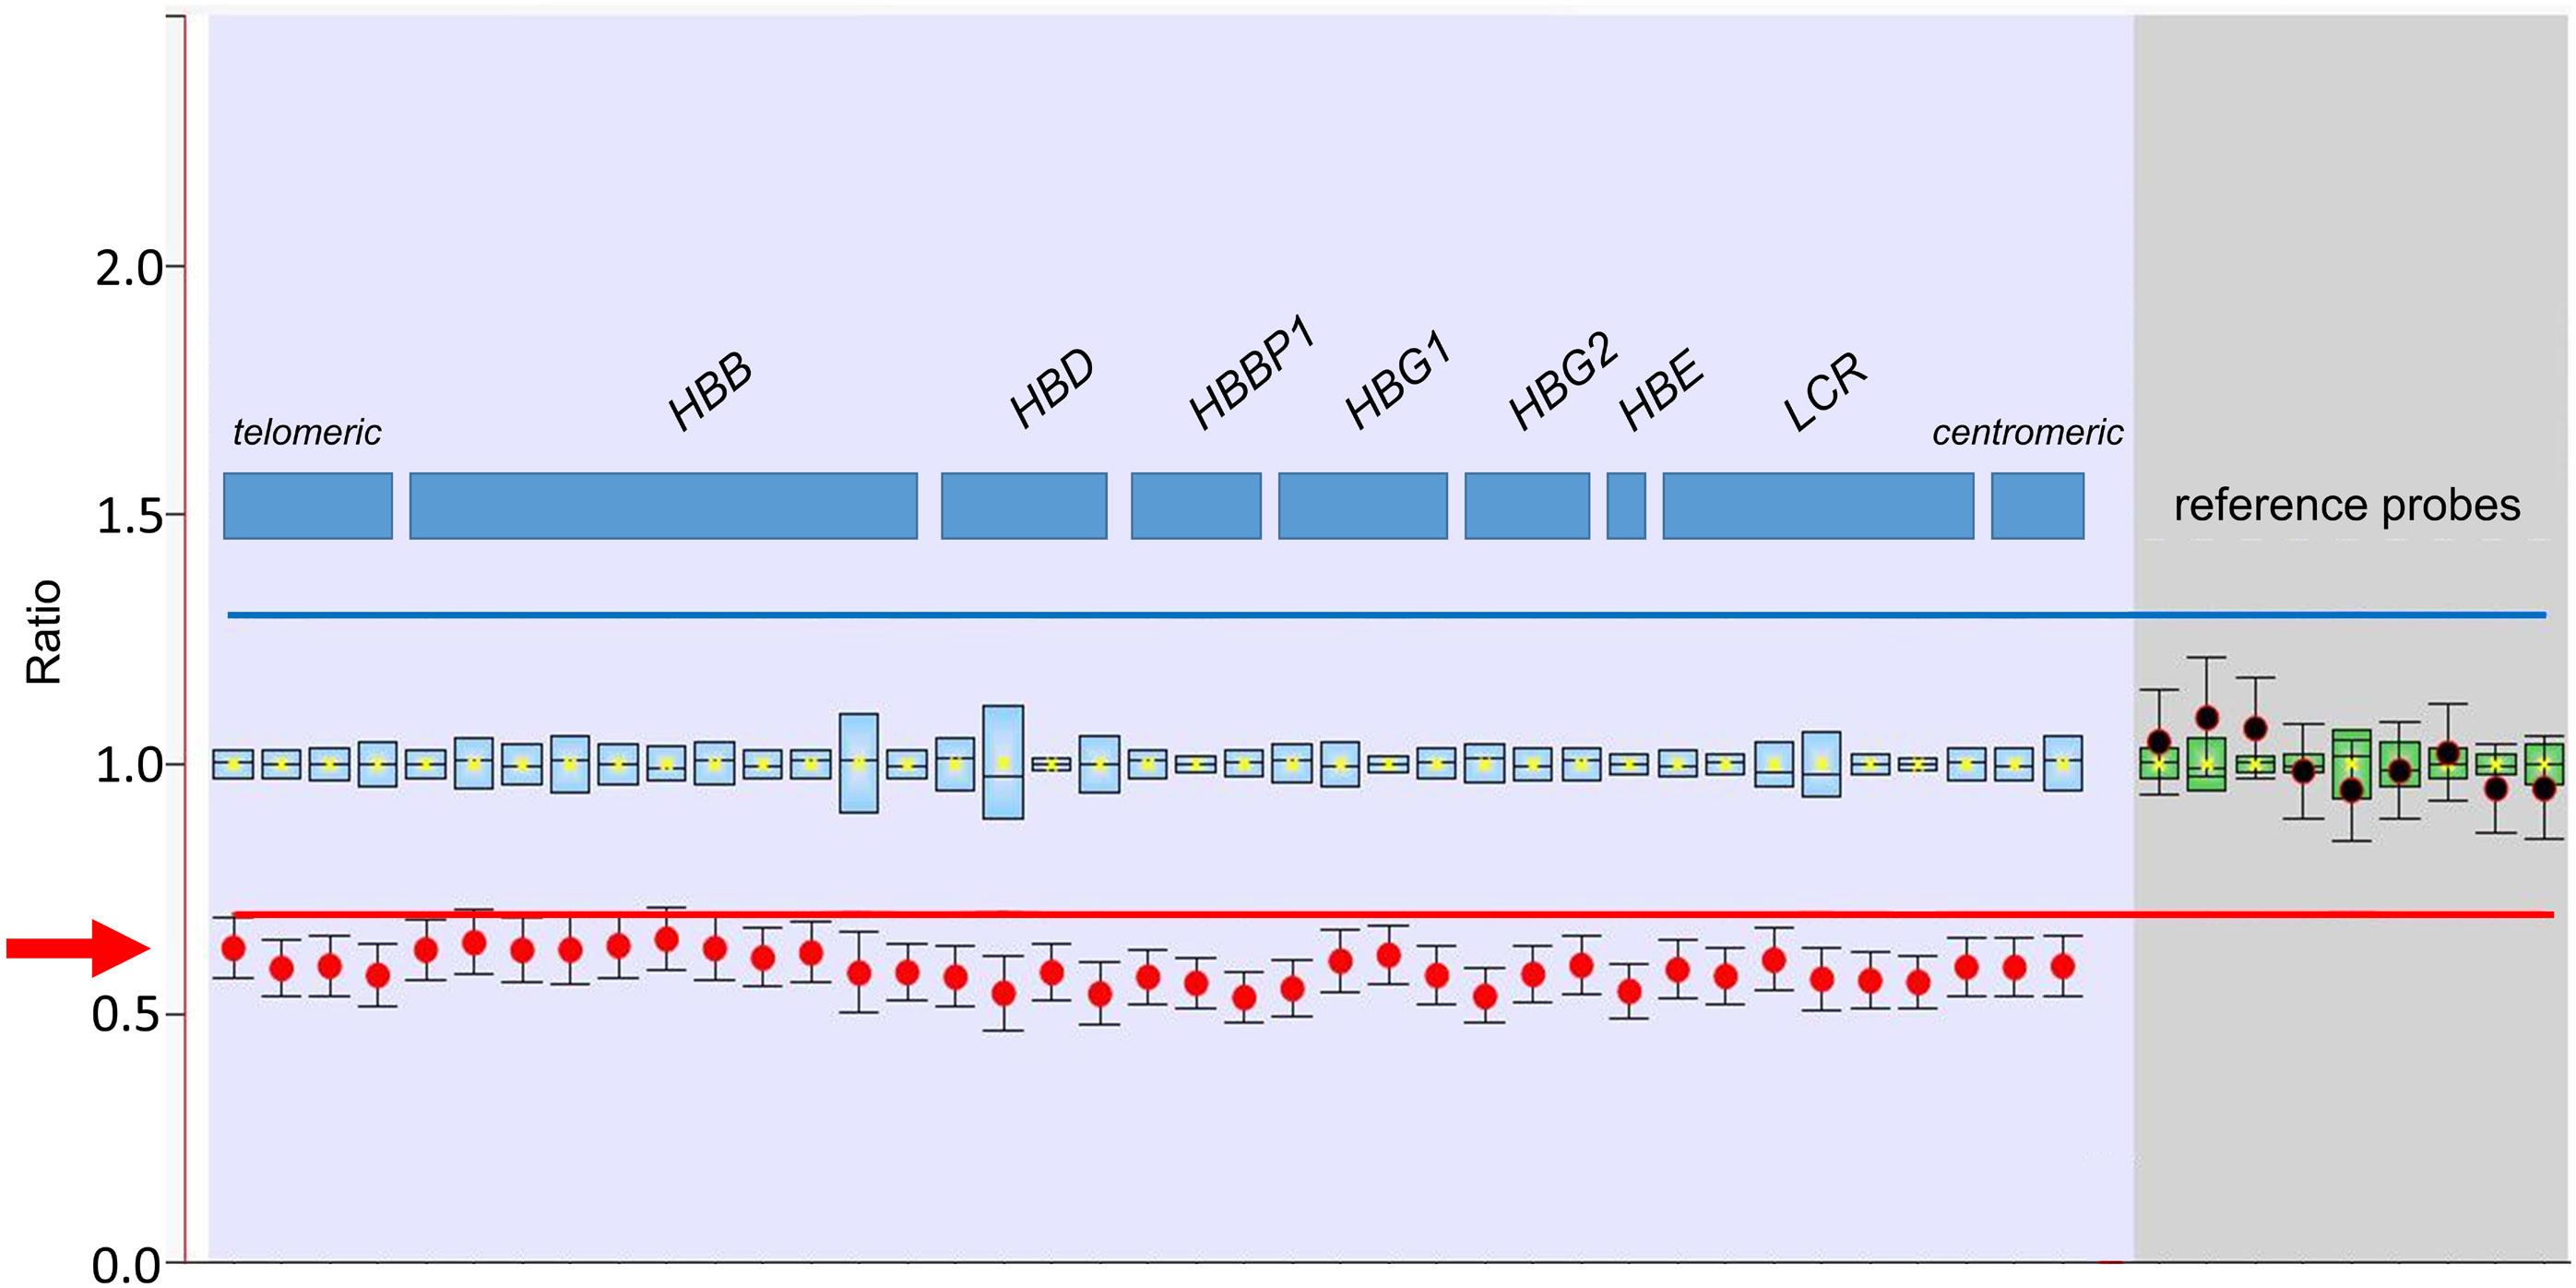
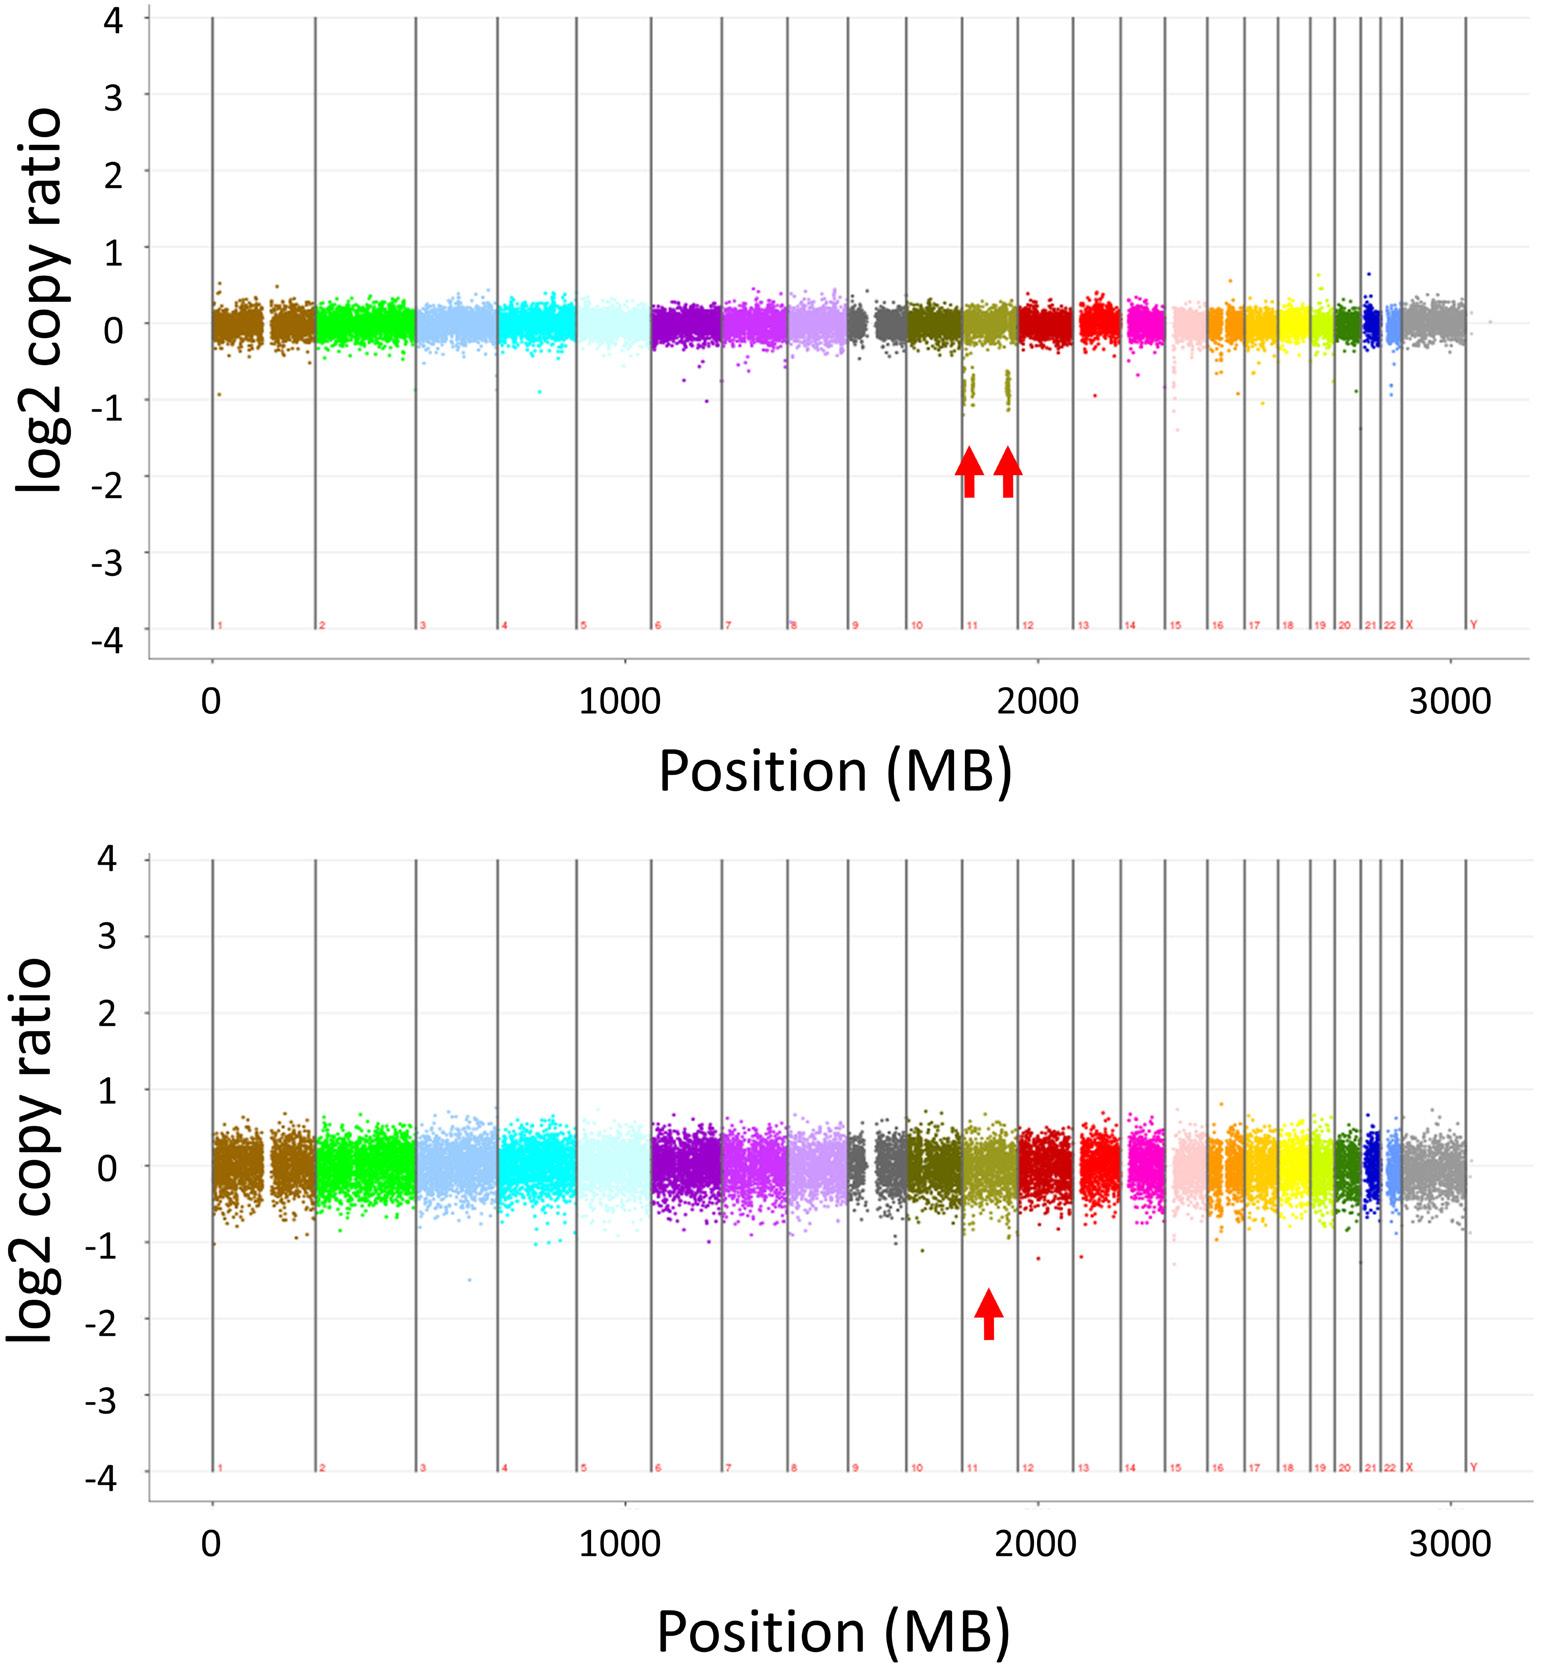
2745 Classical meets malignant hematology: a case of acquired εγδβ-thalassemia in clonal hematopoiesis
A. Piehler et al.
https://doi.org/10.3324/haematol.2024.285083
Errata Corrige
2749 Erratum to: Immunochemotherapy plus lenalidomide for high-risk mantle cell lymphoma with measurable residual disease evaluation
Annals of Internal Medicine. 1970;73(6):881-895. doi: 10.7326/0003-4819-73-6-881.
“It appears that combinations of effective drugs that act by different mechanisms and manifest different toxicities can be used effectively to increase the response rate and probably the survival of patients with sensitive tumors such as Hodgkin’s disease.”1
This is a concept that we now take for granted, but in 1970 it changed the trajectory for patients with Hodgkin lymphoma (HL). Before the use of combination chemotherapy, HL was primarily incurable and fatal. A portion of patients with early-stage disease achieved cure with radiation, but it was not until combination chemotherapy was introduced, in the form of MOPP (nitrogen mustard, vincristine, procarbazine, prednisone), that HL became a highly curable disease. MOPP was developed based on the premise that different classes of independently active antitumor agents had significant activity in HL. These classes included alkylating agents, vinca alkaloids, the methylhydrazine derivative (procarbazine), and cor-
ticosteroids. When administered alone, each drug often produced short-lived responses; however, patients who developed resistance to one type of drug often responded to a drug in a different class. Preclinical studies revealed that manipulation of doses and schedules, along with the use of effective drugs in combination, reduced rates of drug resistance and allowed for higher rates of tumor cell killing. This led to the development of the MOPP regimen (Figure 1) which initially demonstrated promising efficacy in 43 patients with advanced stage disease.1 A 20-year follow-up of a series of MOPP studies that enrolled 188 patients (including the 43 patients from the initial study) demonstrated that MOPP produced complete responses in 84% of patients, leading to 66% of patients being disease-free for over 10 years.2
MOPP is associated with significant hematologic toxicity, infertility, and the risk of secondary leukemia, however given the great strides made with this regimen at the time,
Figure 1. The MOPP regimen. Figure reproduced, with permission, from Ann Intern Med. 1970;73(6):881-895.
Combination chemotherapy in the treatment of advanced Hodgkin’s disease.
the toxicity was justified. It was initially the most widely used regimen for advanced stage HL. Thankfully, it is rare that MOPP is needed today. The Milan Cancer Institute developed ABVD (adriamycin, bleomycin, vinblastine, dacarbazine) with the intent to design a non-cross-resistant regimen that could be given as salvage after MOPP. ABVD was eventually proven to be more effective than MOPP in a Cancer and Leukemia Group B study, which compared front-line treatment with ABVD, MOPP, and ABVD alternating with MOPP (ABVD/MOPP hybrid).3 While both the ABVD and ABVD/MOPP hybrid regimens were superior to MOPP alone, ABVD was also associated with reduced my-
References
1. Devita VT Jr, Serpick AA, Carbone PP. Combination chemotherapy in the treatment of advanced Hodgkin’s disease. Ann Intern Med. 1970;73(6):881-895.
2. Longo DL, Young RC, Wesley M, et al. Twenty years of MOPP
elotoxicity, secondary leukemia, and infertility compared to MOPP. Therefore, ABVD was substituted for MOPP and is now the major backbone of modern HL regimens. Since the introduction of MOPP in 1970, there has been a major shift in HL research. The high efficacy of modern HL therapy has enabled investigators to focus not only on cure, but on balancing efficacy with short- and long-term toxicity. Although combination chemotherapy was one of the first major breakthroughs for HL, current studies are investigating ways to chip away at exposure to traditional chemotherapy through integration of novel agents and biomarker-driven therapy.
therapy for Hodgkin’s disease. J Clin Oncol. 1986;4(9):1295-1306.
3. Canellos GP, Anderson JR, Propert KJ, et al. Chemotherapy of advanced Hodgkin’s disease with MOPP, ABVD, or MOPP alternating with ABVD. N Engl J Med. 1992;327(21):1478-1484.
Rethinking paraneoplastic eosinophilia
Kathrin M. Bernt
Division of Pediatric Oncology, Children’s Hospital of Philadelphia, Department of Pediatrics, Perelman School of Medicine at the University of Pennsylvania and Abramson Cancer Center, Philadelphia, PA, USA
In this issue of Haematologica, Xu and colleagues dissect the mechanism of eosinophilia that accompanies the ETV6 fusion ACSL6::ETV6. ETV6 is a transcription factor with predominantly inhibitory activity on its target genes.1 The ETV6 locus is involved in leukemia through a variety of different mechanisms.2,3 The oldest recognized role is as a fusion partner in the t(12;21)(p13;q22) translocation, which results in the generation of ETV6::RUNX1 fusions (formerly known as TEL-AML) in acute lymphoblastic leukemia (ALL). ETV6::RUNX1 fusions are present in about 20% of ALL and enriched in patients with standard-risk features (i.e., children between 1 and 10 years of age, low white blood cell count at presentation). ETV6::RUNX1 fusion ALL has an excellent prognosis, particularly in the setting of additional low-risk criteria.4 In addition to ETV6::RUNX1, there are multiple additional ETV6 fusions in ALL with a range of different fusion partners.5 These leukemias share transcriptomic features with ETV6::RUNX1 ALL, however, they are genetically more complex, and outcomes for these patients are worse.6 Most breakpoints within ETV6 occur within the first 60 amino acids (AA) of the 450 AA long ETV6 protein. Most create a fusion gene with the 5’ part of ETV6, although detailed RNA and protein expression or functional data on these fusions are incomplete. In acute myeloid leukemia (AML), ETV6 is also found as part of fusions with a range of different fusion partners, including PDGFR β, FGFR3, ABL1, FLT3, JAK2, MN1, and ACSL6.2,7 Most kinase fusion (PDGFR, ABL1, FLT3, JAK2) fuse much of the kinase open reading frame to a small 5’ fragment of ETV6 (typically exon 5), resulting in expression of a fusion transcript and fusion protein with aberrant kinase activity. A second type of ETV6 fusion involves transcriptional regulators such as MECOM (EVI1). MECOM is a hematopoietic stem cell transcription factor that is aberrantly expressed via translocation into other loci as well, most famously the GATA2 locus. Both in-frame and out-of-frame fusion that just results in MECOM expression have been reported. A third type of fusions involves 3’ ETV6 transcripts and regulatory regions. ETV6 has a large
Correspondence: K.M. Bernt berntk@chop.edu
Received: March 4, 2024. Accepted: March 22, 2024. Early view: April 4, 2024.
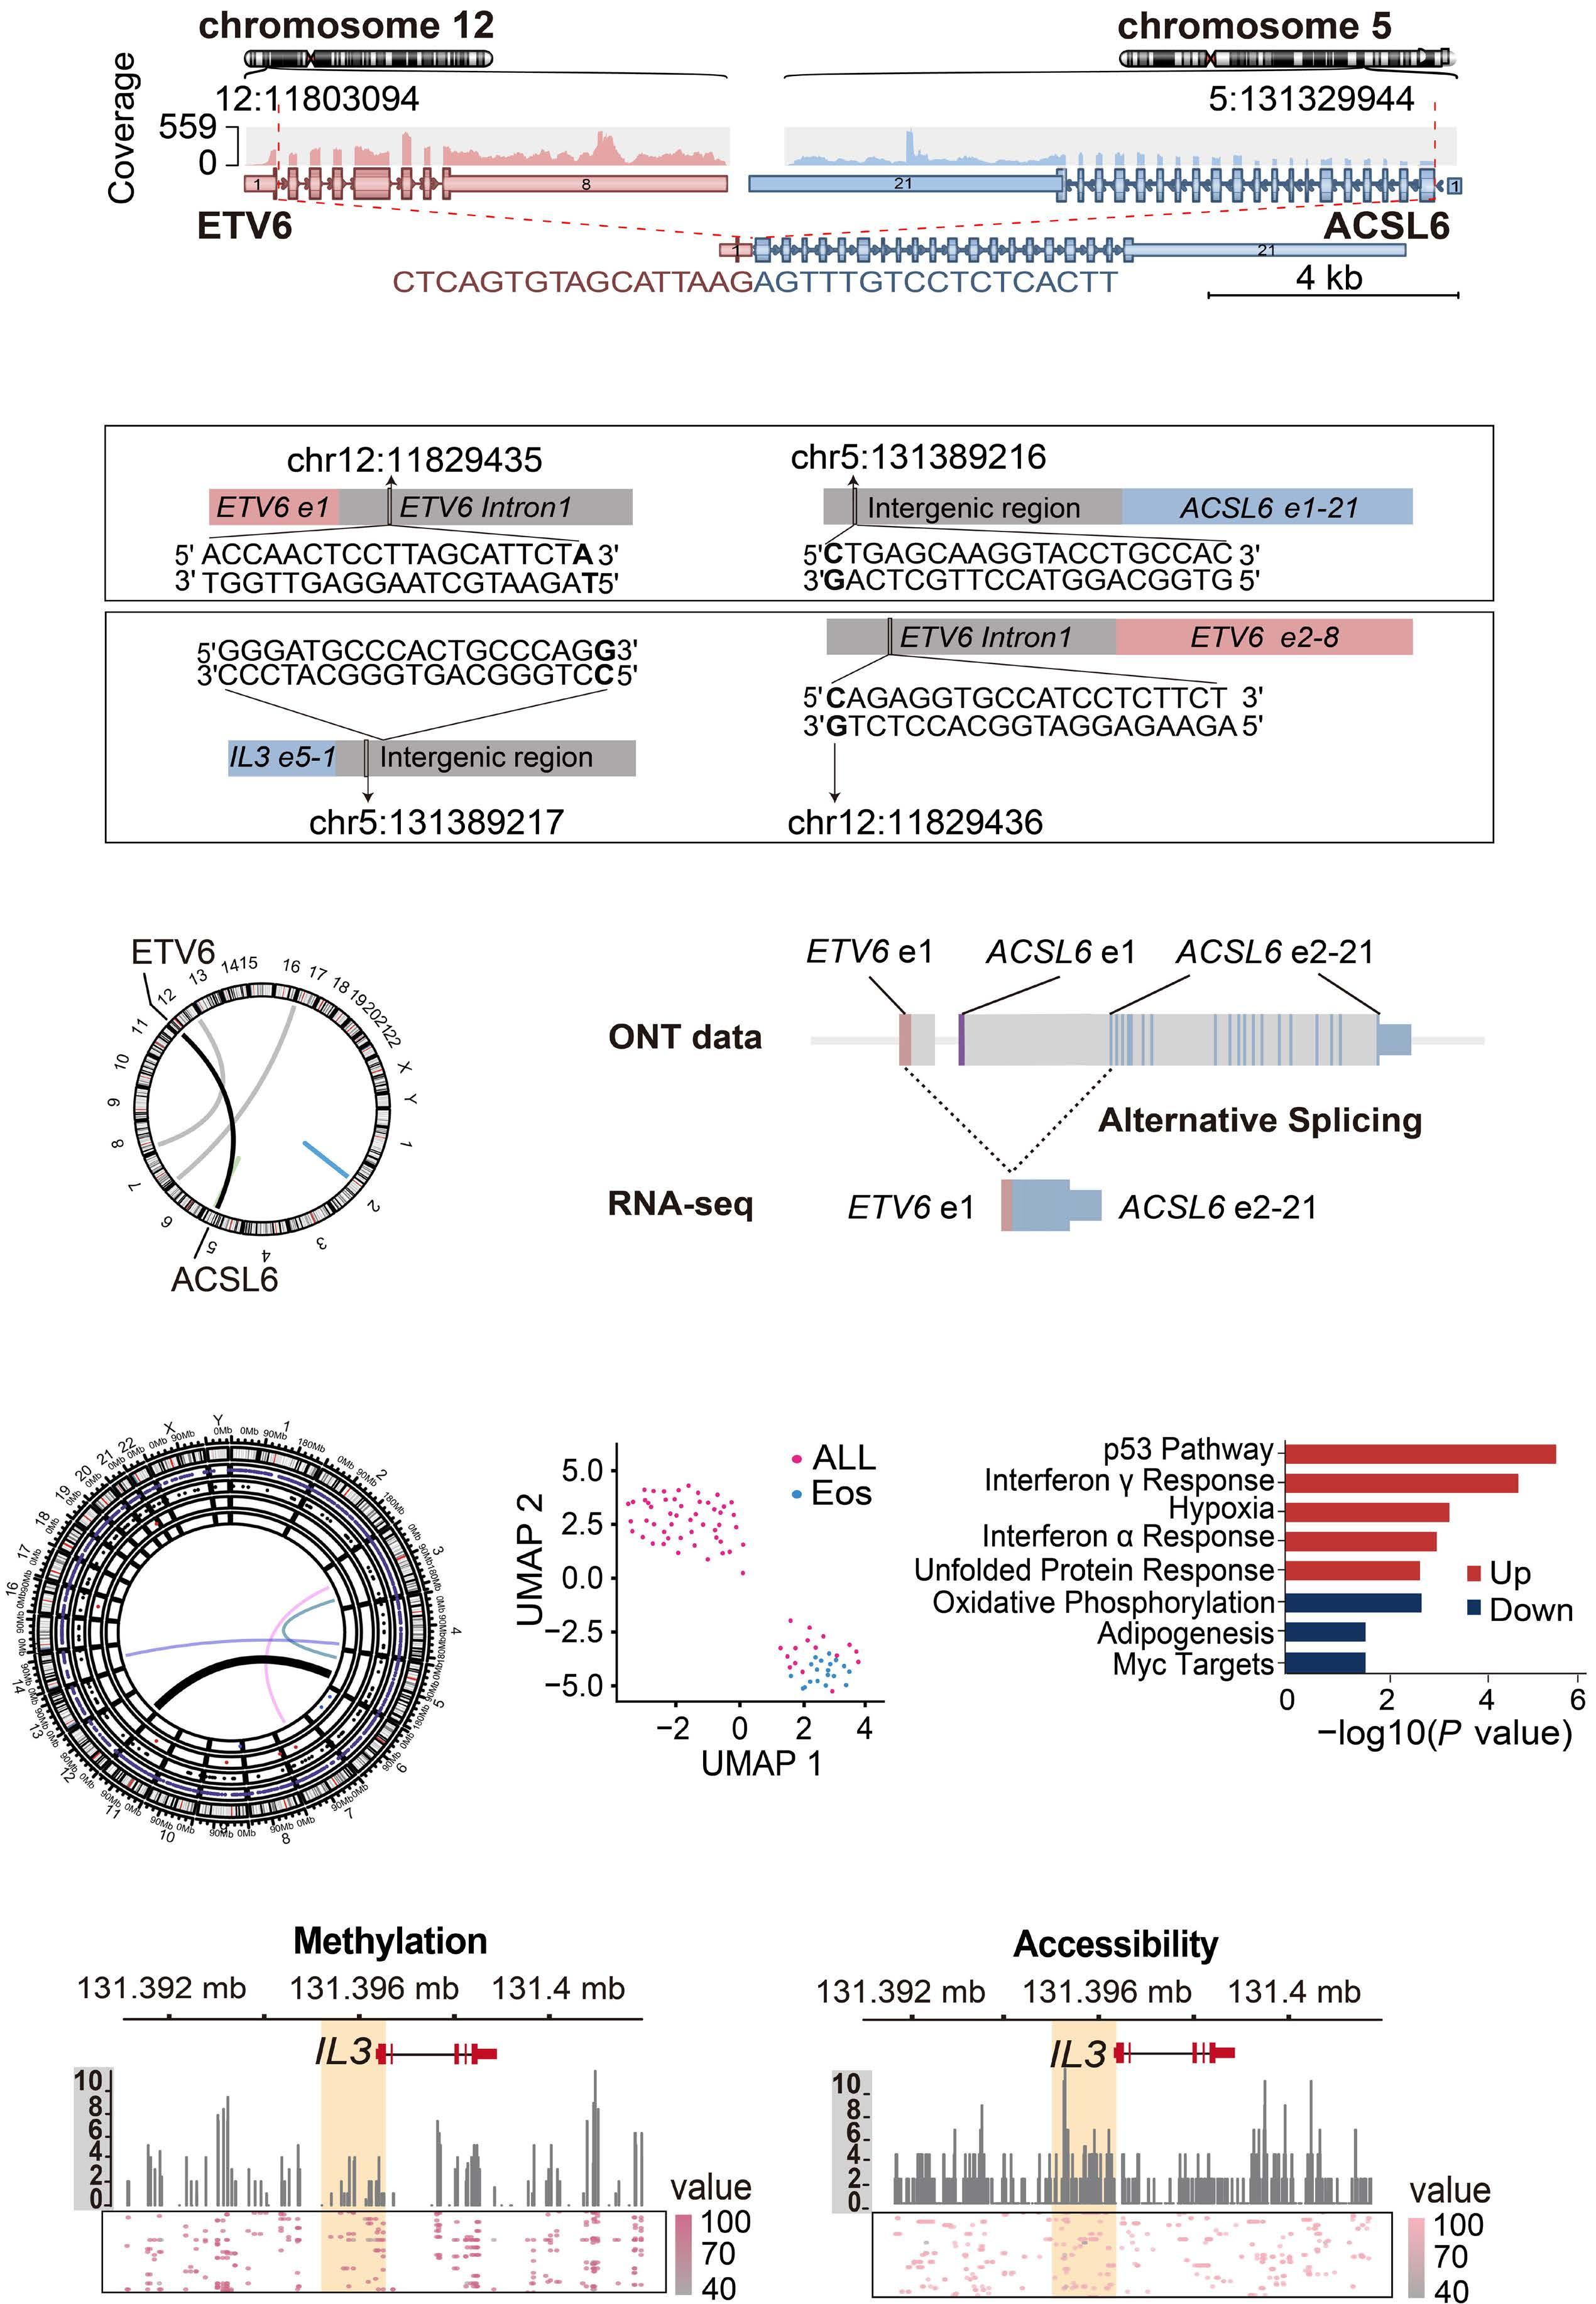
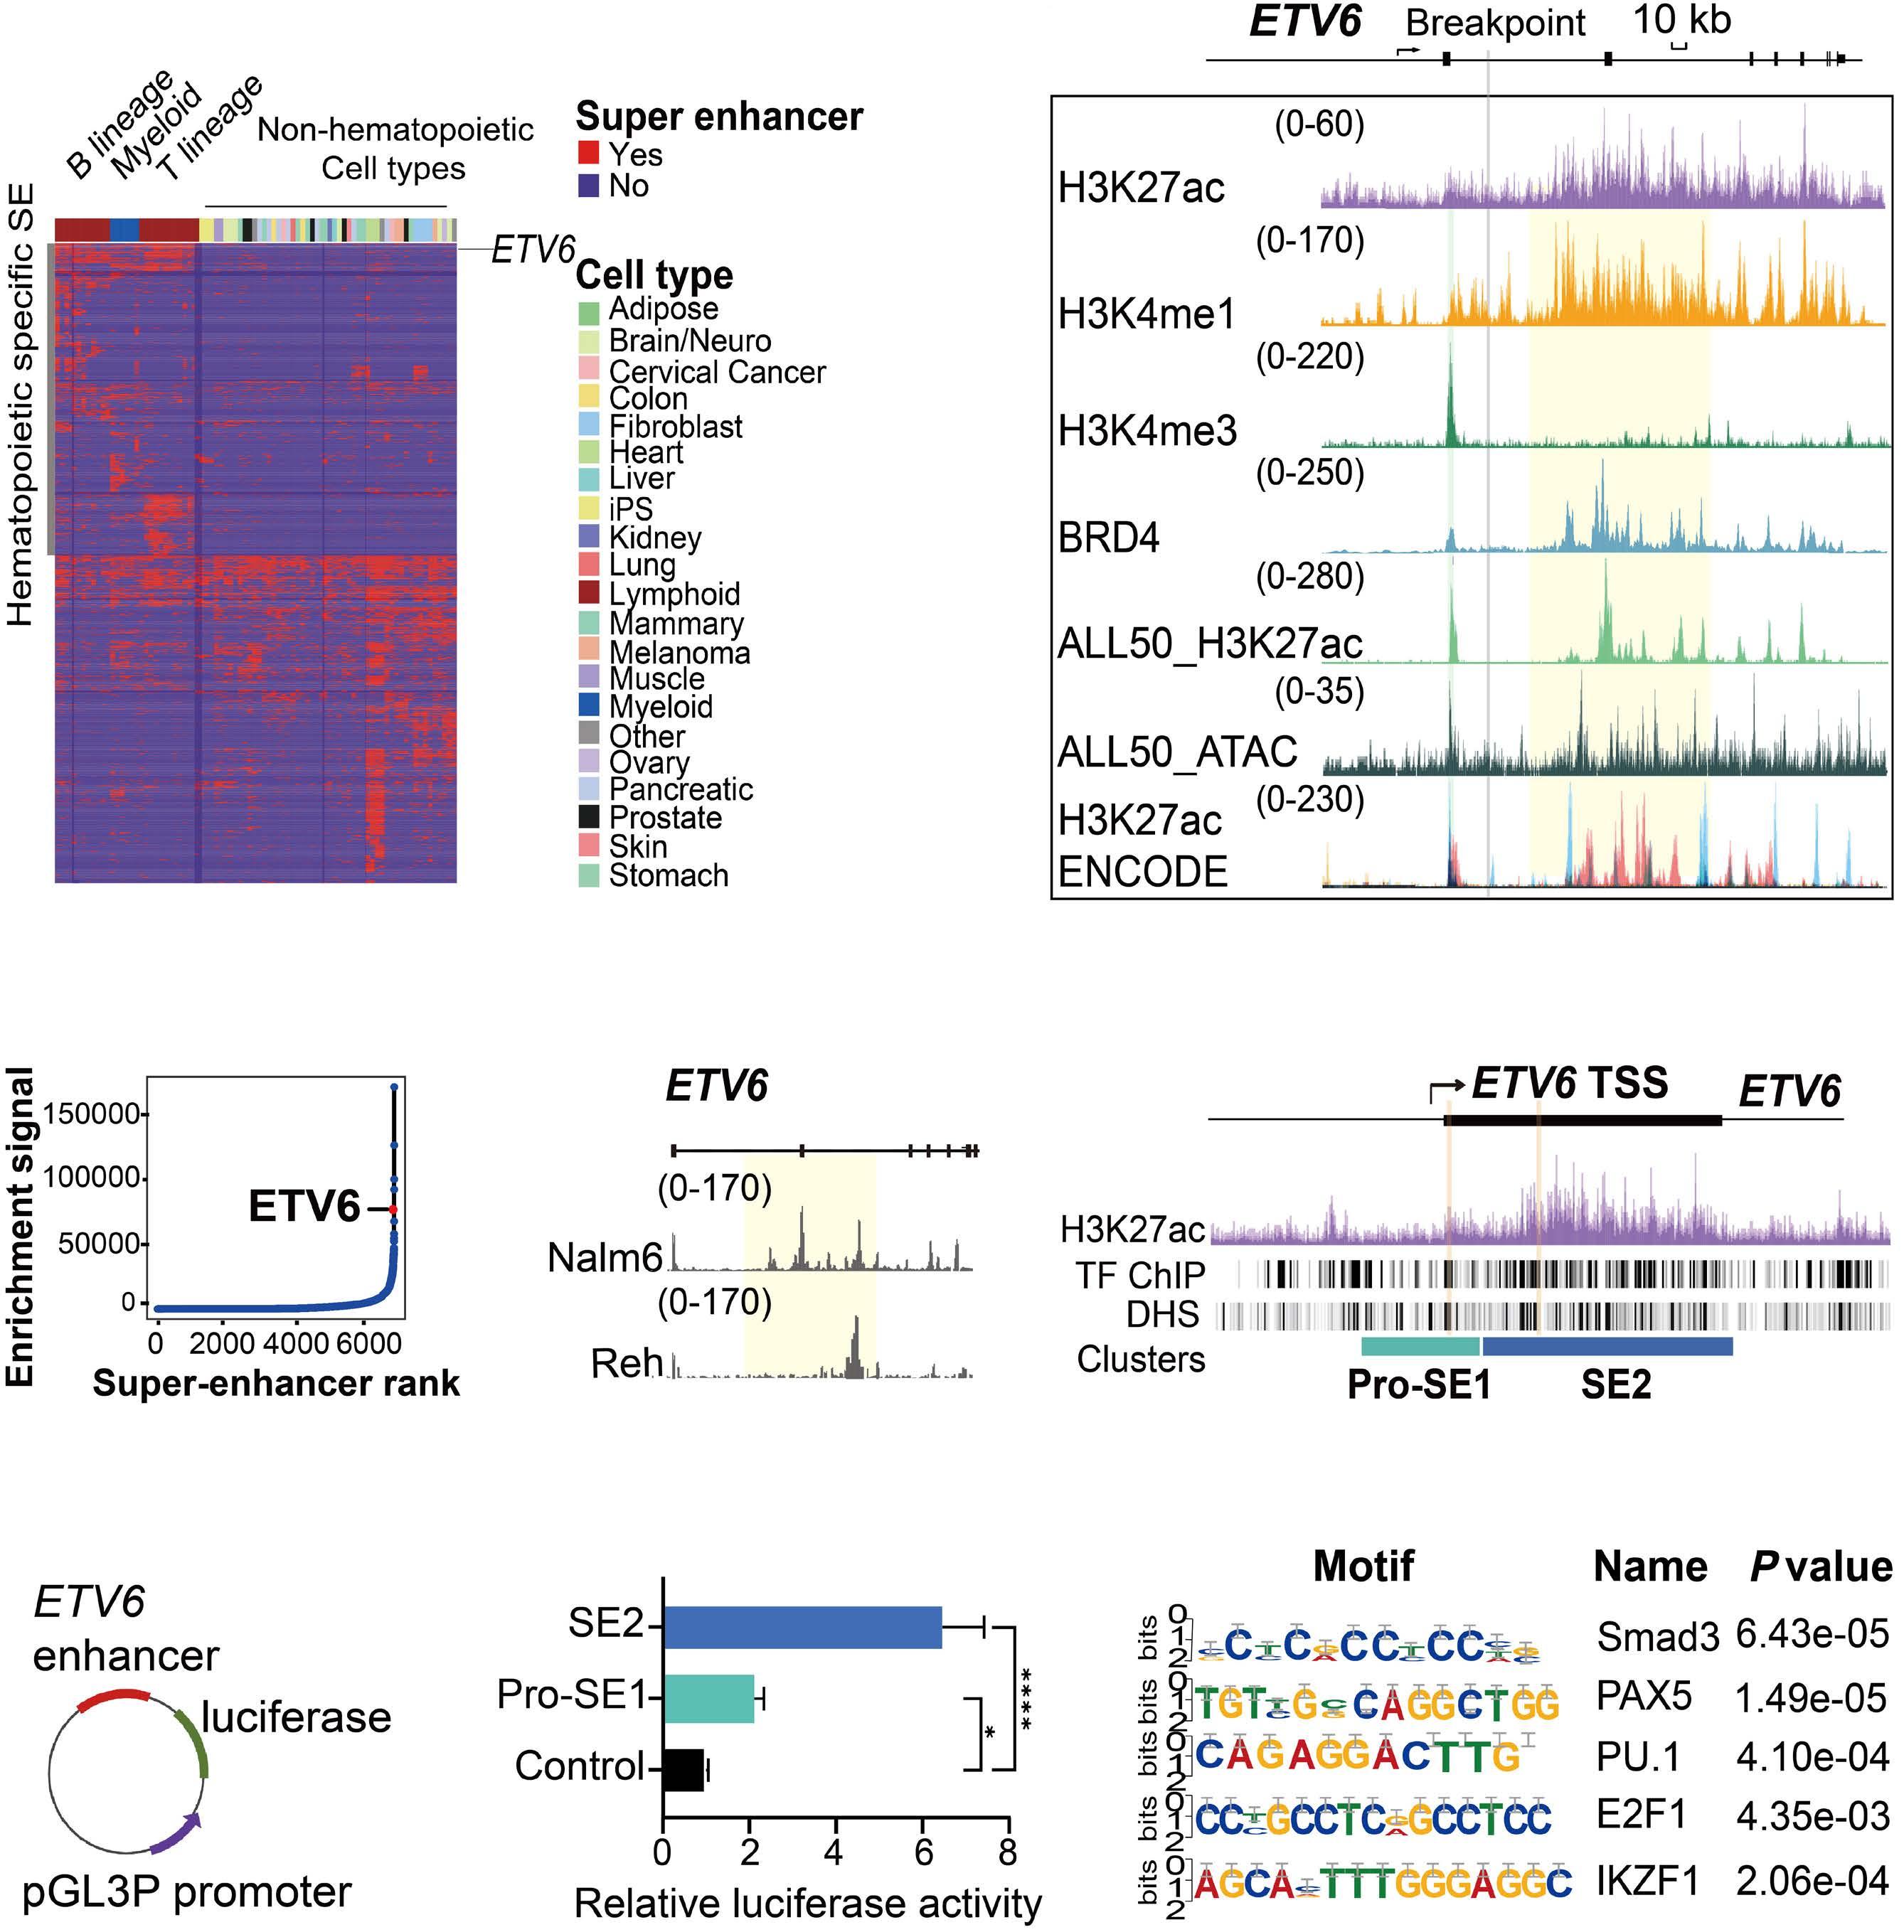
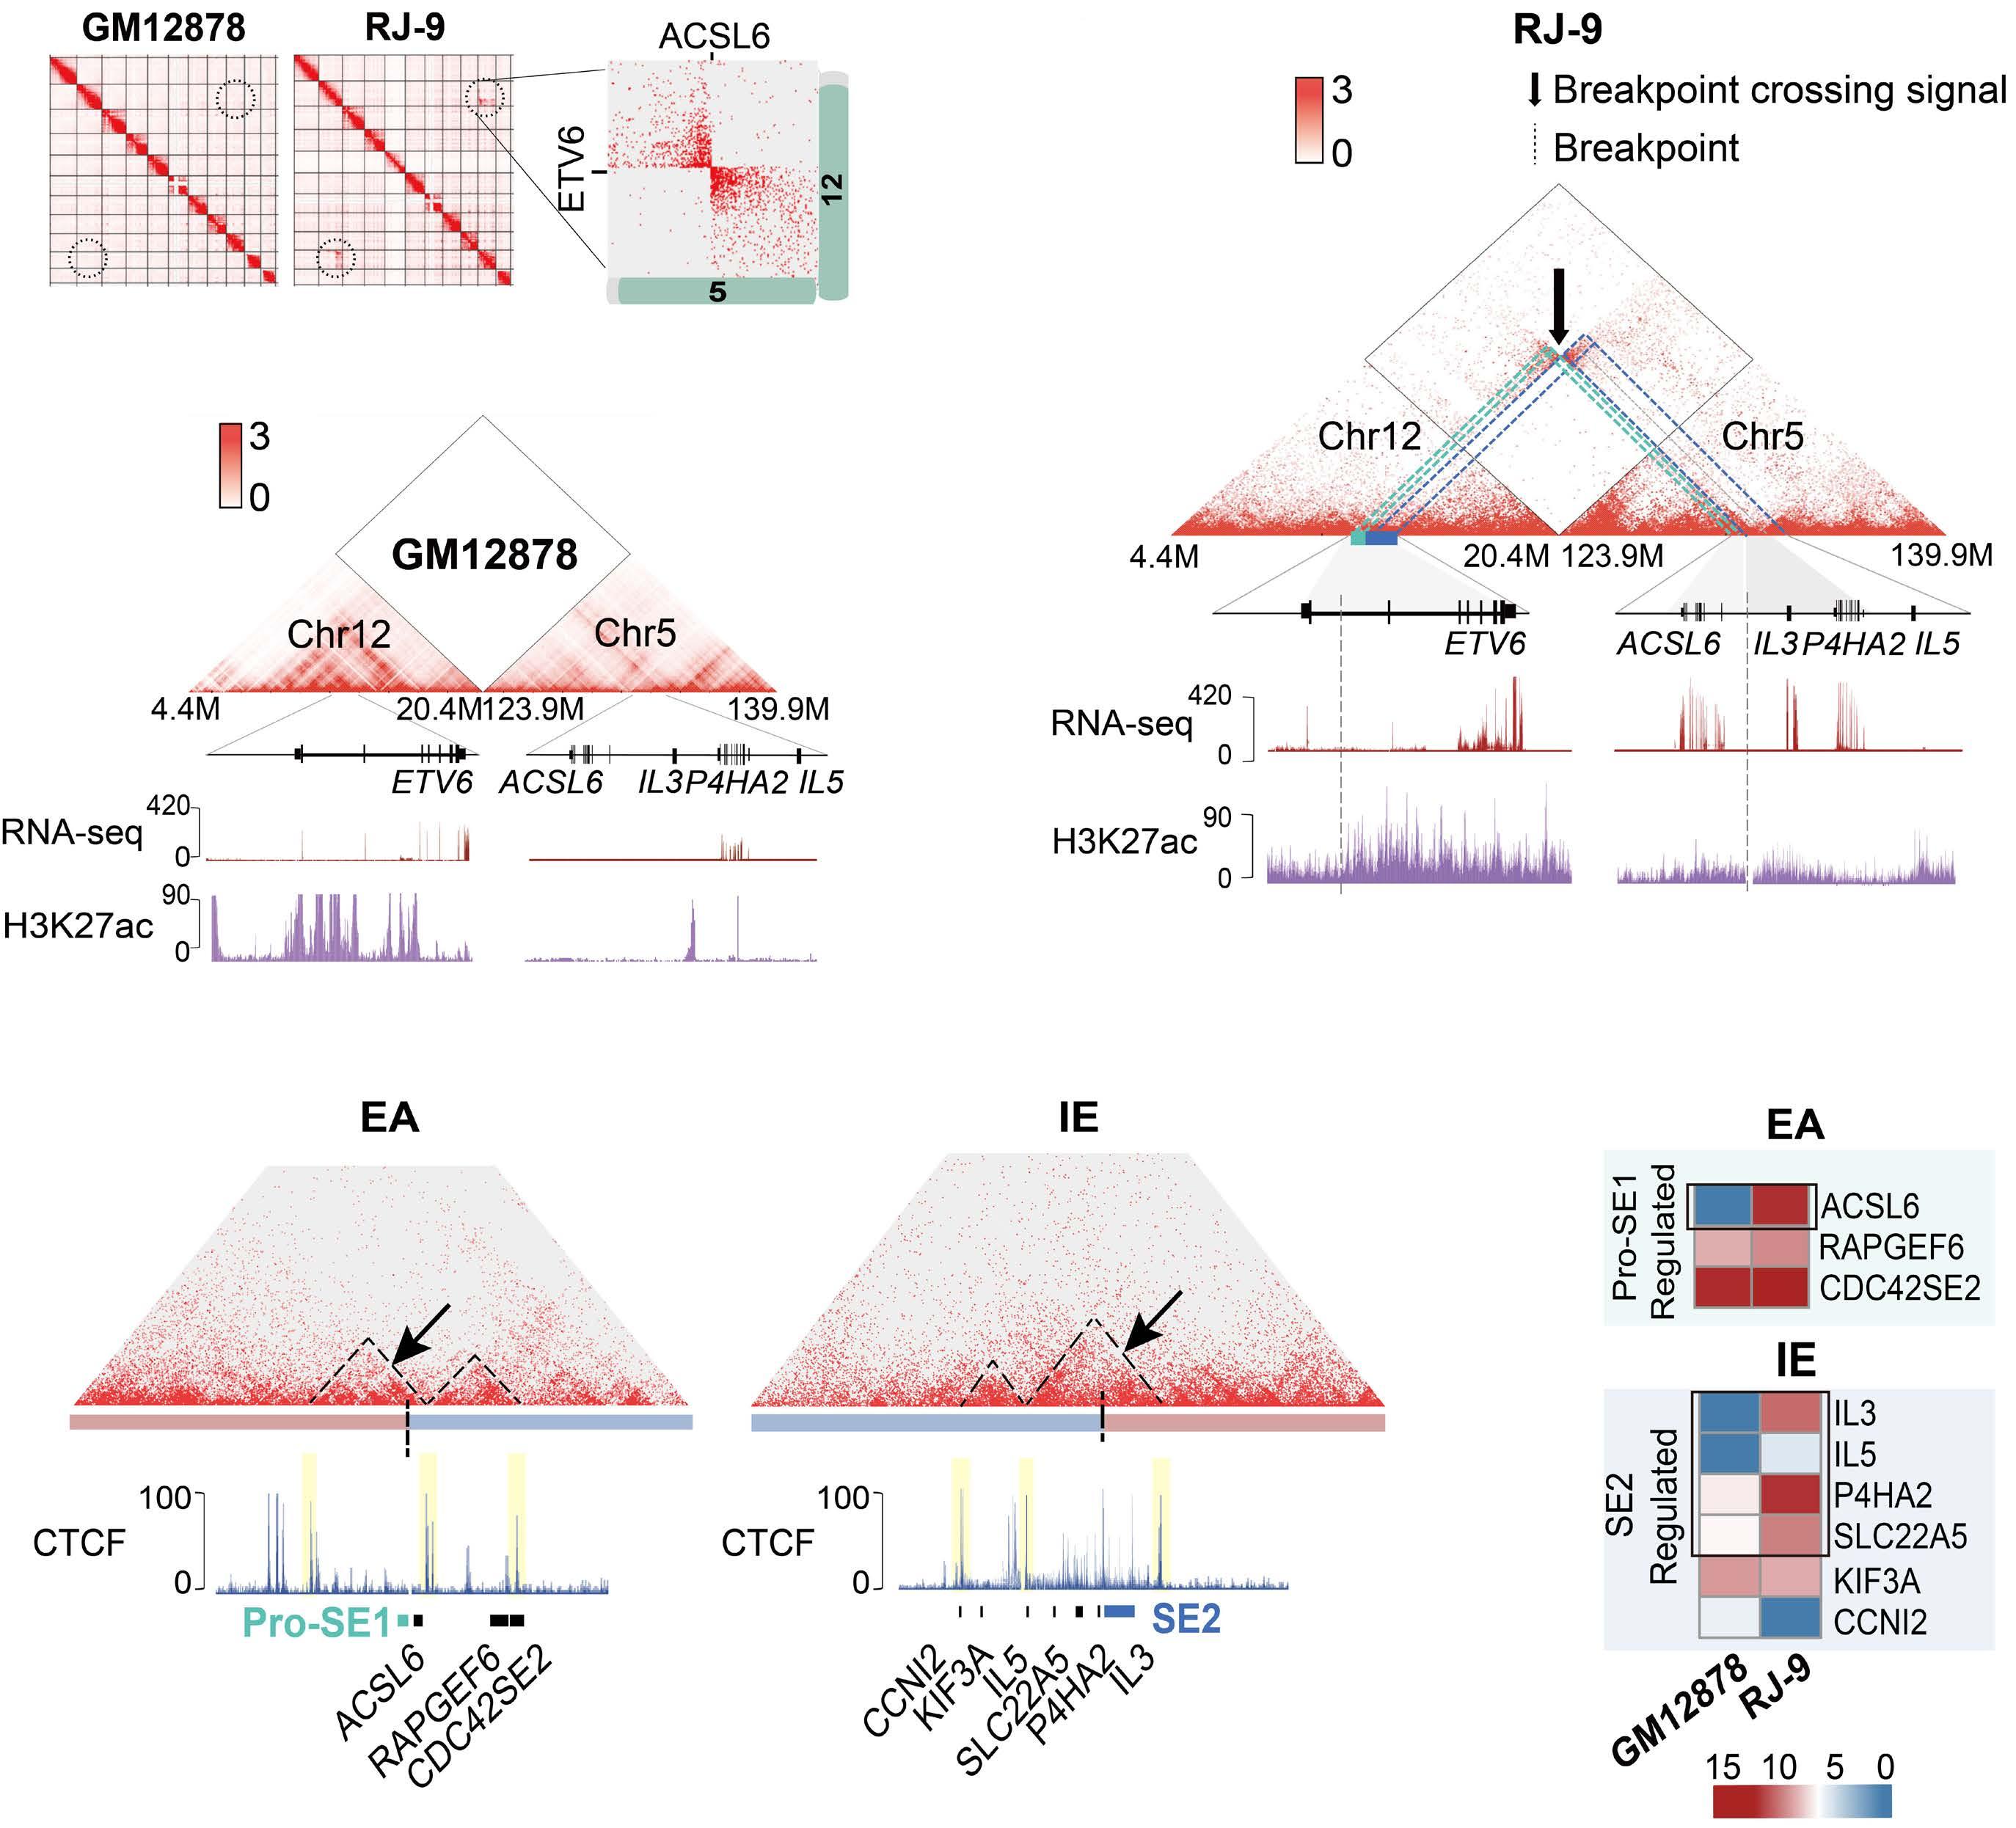
downstream super-enhancer. 5’ fusion partners can either fuse in frame to 3’ETV6 exons, or translocate out of frame with the ETV6 3’ enhancer, driving aberrant expression of the fusion partner. One of the best study examples of this type of fusion is the ETV6-MN1 fusion. Finally, several ETV6 translocations may or may not generate in-frame fusions that lack transforming ability, but lead to overexpression of the entire reading frame of adjacent genes that do transform. Examples of such fusions include CHICK2::ETV6 and the ACSL6::ETV6 fusion that is the topic of this manuscript. ACSL6::ETV6 is a rare but recurrent fusion in AML and, as in the patient described here, in ALL.1 Pronounced eosinophilia is a hallmark of these leukemias. In this study, Xu and colleagues used comprehensive genomic analysis to better understand the biological effects of this fusion event. The ACSL6::ETV6 fusion is a reciprocal translocation.1 The genomic breakpoint in ETV6 on chromosome 12 is in intron 1, and the genomic breakpoint in chromosome 5 is upstream of the ACSL6 coding frame. (Figure 1). However, on an RNA-basis, ETV6 exon 1 is fused to ACSL6 exon 2. This results in a frameshift, premature stop codon, and no expression of an ASCL6-ETV6 fusion protein. The reciprocal derivative chromosome contains the majority of the ETV6 coding frame and 3’ super-enhancer region translocated into the ACSL6 adjacent intergenic region, and no fusion RNA or protein are generated. Thus, the ACSL6::ETV6 translocation does not generate an oncogenic fusion protein, or aberrant expression of one of the direct fusion partners. Rather, it splits 5’ and 3’ ETV6 regulatory regions and perturbs the chromatin architecture of the breakpoint adjacent regions on the target chromosome 5. This results in increased expression of Interleukin 3, Interleukin 5, P4HA2 and SLC22A5, which are translocated into the vicinity of the 3’ ETV6 super-enhancer. Increased expression of IL3 and IL5 by the leukemia cells in turn result in the profound eosinophilia that accompanies ACSL6::ETV6 leukemias. The eosinophils themselves are not part of the leukemic clone.
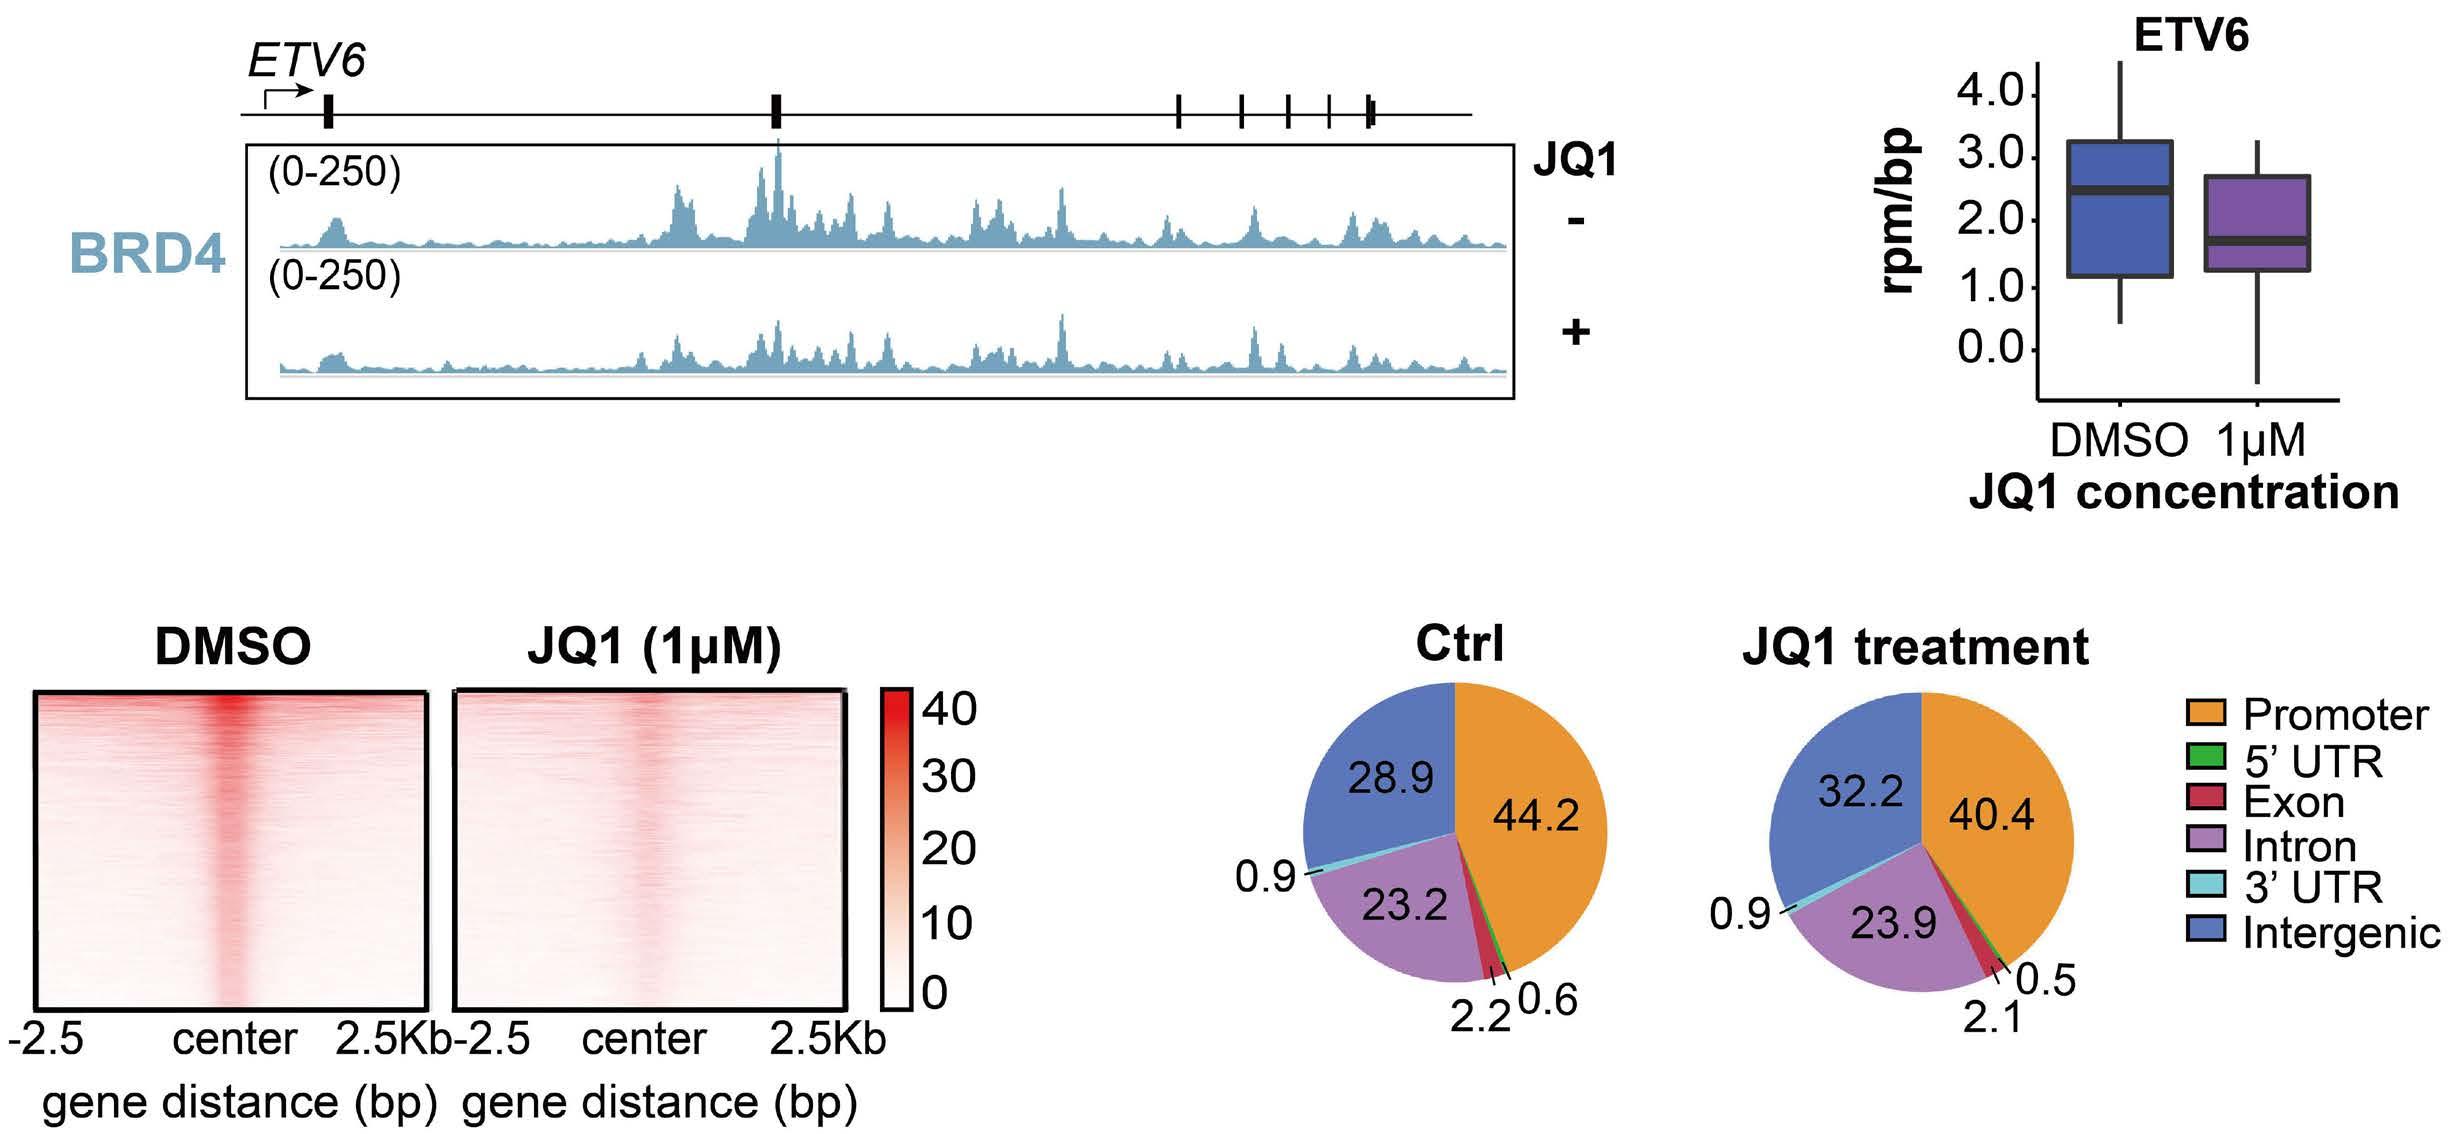
Bromodomain inhibitors have been reported to predominantly affect transcription driven by super-enhancers, and Xu and
Figure 1. The ACSL6::ETV6 fusion. (Top) In the patient with an ACSL6::ETV6 fusion acute lymphoblastic leukemia described by Xu and colleagues,1 the ETV6 breakpoint is located within Intron 1. (Center) The 5’ portion of ETV6 if fused to the intergenic region 5’ to the ACSL6 gene. The fusion event results in transcription of a fusion RNA, whereby exon 1 of ACSL6 is skipped, and ETV6 exon 1 is fused to ACSL6 exon 2. This induces a frameshift and premature stop; no ETV6-ACSL6 fusion protein is expressed. (Bottom) The reciprocal translocation places the large 3’ super enhancer of ETV6 in the vicinity of the IL5, SLC22A5, P4HA2, and IL3 genes, which are over-expressed as a result. ETV6 haploinsufficiency and IL3 overexpression likely cause or contribute to leukemic transformation. In parallel, the high levels of IL3 produced by the leukemia cells result in paraneoplastic eosinophilia.
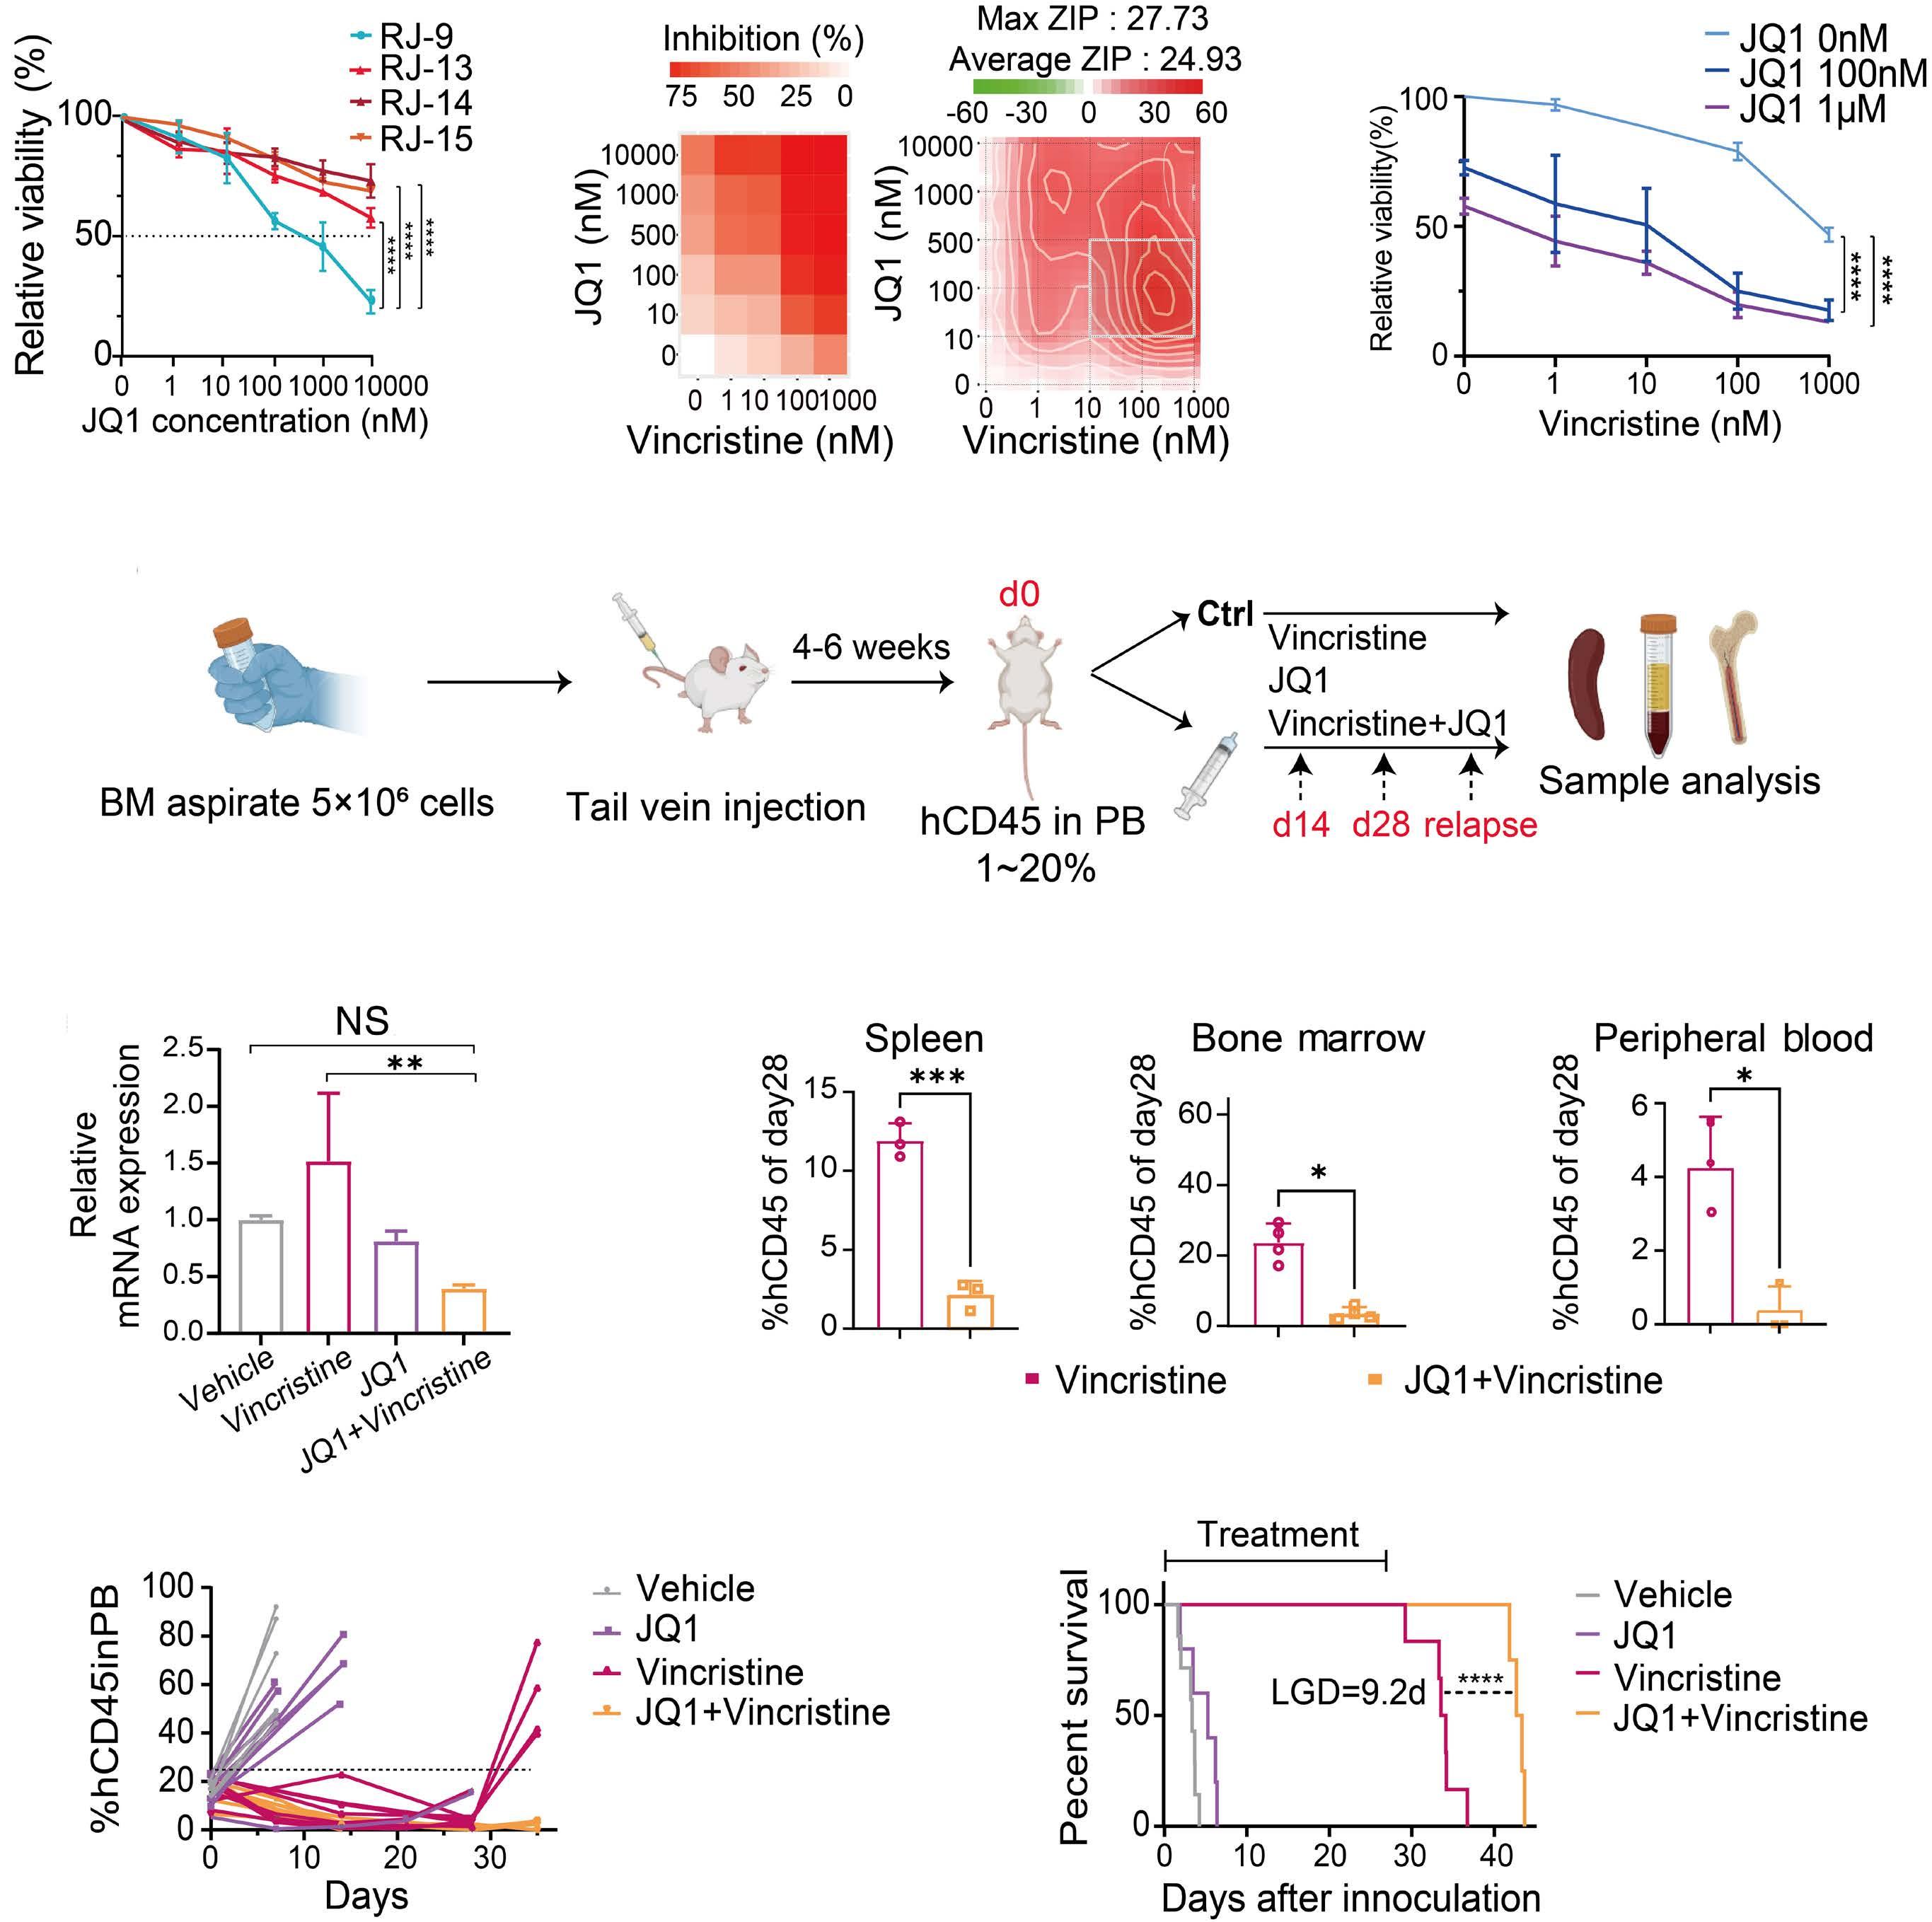
colleagues were able to show that the bromodomain inhibitor tool compound JQ1 suppressed IL3 production of ACSL6::ETV6 leukemia cells.1 Bromodomain inhibitors were first reported to exert anti-leukemic activity in 2011, and, despite multiple clinical trials, their clinical efficacy as anti-cancer drugs is still not clear. However, ACSL6::ETV6 leukemia with eosinophilia could constitute a promising application. While the elegant studies by Xu and colleagues explain the molecular reason for the paraneoplastic eosinophilia accompanying ACSL6::ETV6 fusions,1 the actual oncogenic mechanism remains unexplained. It is important to note that ETV6 inactivating mutations are common in hematopoietic malignancies, and germline inactivating mutations of ETV6 cause familial thrombocytopenia
and a predisposition to ALL. 8,9 ETV6 haploinsufficiency, therefore, is likely to contribute to the mechanism of transformation of ETV6 translocations.2,3 Furthermore, the IgH-IL3 fusion, a product of the t(5;14)(q31;q32) translocation, results in increased IL3 production, appears to be an initiating event in ALL, and is also accompanied by massive eosinophilia.10 Future functional studies will need to clarify if IL3 (and IL5) overexpression in combination with ETV6 inactivation is sufficient to initiate malignant transformation, or whether other adjacent genes such as P4HA2 also play a role.
Disclosures
The author has no conflicts of interest to disclose.
References
1. Xu W, Tian F, Tai X, et al. ETV6::ACSL6 translocation-driven super-enhancer activation leads to eosinophilia in acute lymphoblastic leukemia through IL-3 overexpression. Haematologica. 2024;109(8):2445-2458.
2. De Braekeleer E, Douet-Guilbert N, Morel F, Le Bris MJ, Basinko A, De Braekeleer M. ETV6 fusion genes in hematological malignancies: a review. Leuk Res. 2012;36(8):945-961.
3. Hock H, Shimamura A. ETV6 in hematopoiesis and leukemia predisposition. Semin Hematol. 2017;54(2):98-104.
4 Schore RJ, Angiolillo AL, Kairalla JA, et al. Outstanding outcomes with two low intensity regimens in children with low-risk B-ALL: a report from COG AALL0932. Leukemia. 2023;37(6):1375-1378.
5. Ryan SL, Peden JF, Kingsbury Z, et al. Whole genome sequencing provides comprehensive genetic testing in childhood B-cell acute lymphoblastic leukaemia. Leukemia. 2023;37(3):518-528.
6. Jeha S, Choi J, Roberts KG, et al. Clinical significance of novel
subtypes of acute lymphoblastic leukemia in the context of minimal residual disease-directed therapy. Blood Cancer Discov. 2021;2(4):326-337.
7 Zhou F, Chen B. Acute myeloid leukemia carrying ETV6 mutations: biologic and clinical features. Hematology. 2018;23(9):608-612.
8. Zhang MY, Churpek JE, Keel SB, et al. Germline ETV6 mutations in familial thrombocytopenia and hematologic malignancy. Nat Genet. 2015;47(2):180-185.
9 Noetzli L, Lo RW, Lee-Sherick AB, et al. Germline mutations in ETV6 are associated with thrombocytopenia, red cell macrocytosis and predisposition to lymphoblastic leukemia. Nat Genet. 2015;47(5):535-538.
10 Fournier B, Balducci E, Duployez N, et al. B-ALL with t(5;14) (q31;q32); IGH-IL3 rearrangement and eosinophilia: a comprehensive analysis of a peculiar IGH-rearranged B-ALL. Front Oncol. 2019;9:1374.
Targeting glycolysis to rescue 2-hydroxyglutarate immunosuppressive effects in dendritic cells and acute myeloid leukemia
Angela Maria Savino1,2 and Lucille Stuani3,4
1Tettamanti Center, Fondazione IRCCS San Gerardo dei Tintori, Monza, Italy; 2School of Medicine and Surgery, University of Milano-Bicocca, Milan, Italy; 3Institut de Recherche en Cancérologie de Montpellier (IRCM), Univ Montpellier, Institut Régional du Cancer de Montpellier (ICM), INSERM U1194, Montpellier, France and 4Equipe Labellisée Ligue Contre le Cancer, Paris, France
Correspondence: L. Stuani lucille.stuani@inserm.fr
Received: February 23, 2024. Accepted: March 7, 2024. Early view: March 14, 2024.
In this issue of Haematologica, Hammon et al.1 report their investigation of the link between the immunosuppressive effects of D-2-hydroxyglutarate (D-2HG) and metabolic reprogramming in dendritic cells and acute myeloid leukemia (AML).
The discovery that mutations in genes encoding key metabolic enzymes lead to the accumulation of oncometabolites has underscored a direct connection between altered metabolism and disease. Among the plethora of metabolites affecting tumorigenesis and the surrounding immune cell subsets, much interest has been invested in the metabolite 2-hydroxyglutarate (2HG). The enantiomer D-2HG is produced by cancer cells with gain-of-function mutations in isocitrate dehydrogenase (IDH) enzymes. While its role in tumorigenesis has been extensively described, recent studies are revealing D-2HG cell-nonautonomous functions and a key role as a regulator of immunity, through metabolic crosstalk within the tumor microenvironment. In 2018, D-2HG was shown to fine tune immune responses by affecting T-cell metabolism.2 Exogeneous D-2HG triggered destabilization of hypoxia-inducible factor 1a protein in T cells, resulting in the downregulation of the glycolytic enzymes lactate dehydrogenase A (LDHA) and pyruvate dehydrogenase kinase 1, thus decreasing lactate production. Glucose is directed to the tricarboxylic acid cycle resulting in metabolic skewing towards oxidative phosphorylation (OxPHOS), increased regulatory T-cell abundance, and reduced T helper 17 cell polarization. This is one of the strategies of AML cells to create a permissive environment promoting immune evasion. Recently, it was also reported that D-2HG reduces murine CD8+ T-cell proliferation, cytotoxicity, interferon-γ (IFNγ) signaling, and directly inhibits LDHA/B.3 Accordingly, in patients with IDH1-mutant gliomas, regions with high levels of 2HG correlate with lower lactate concentration and fewer CD8+ T
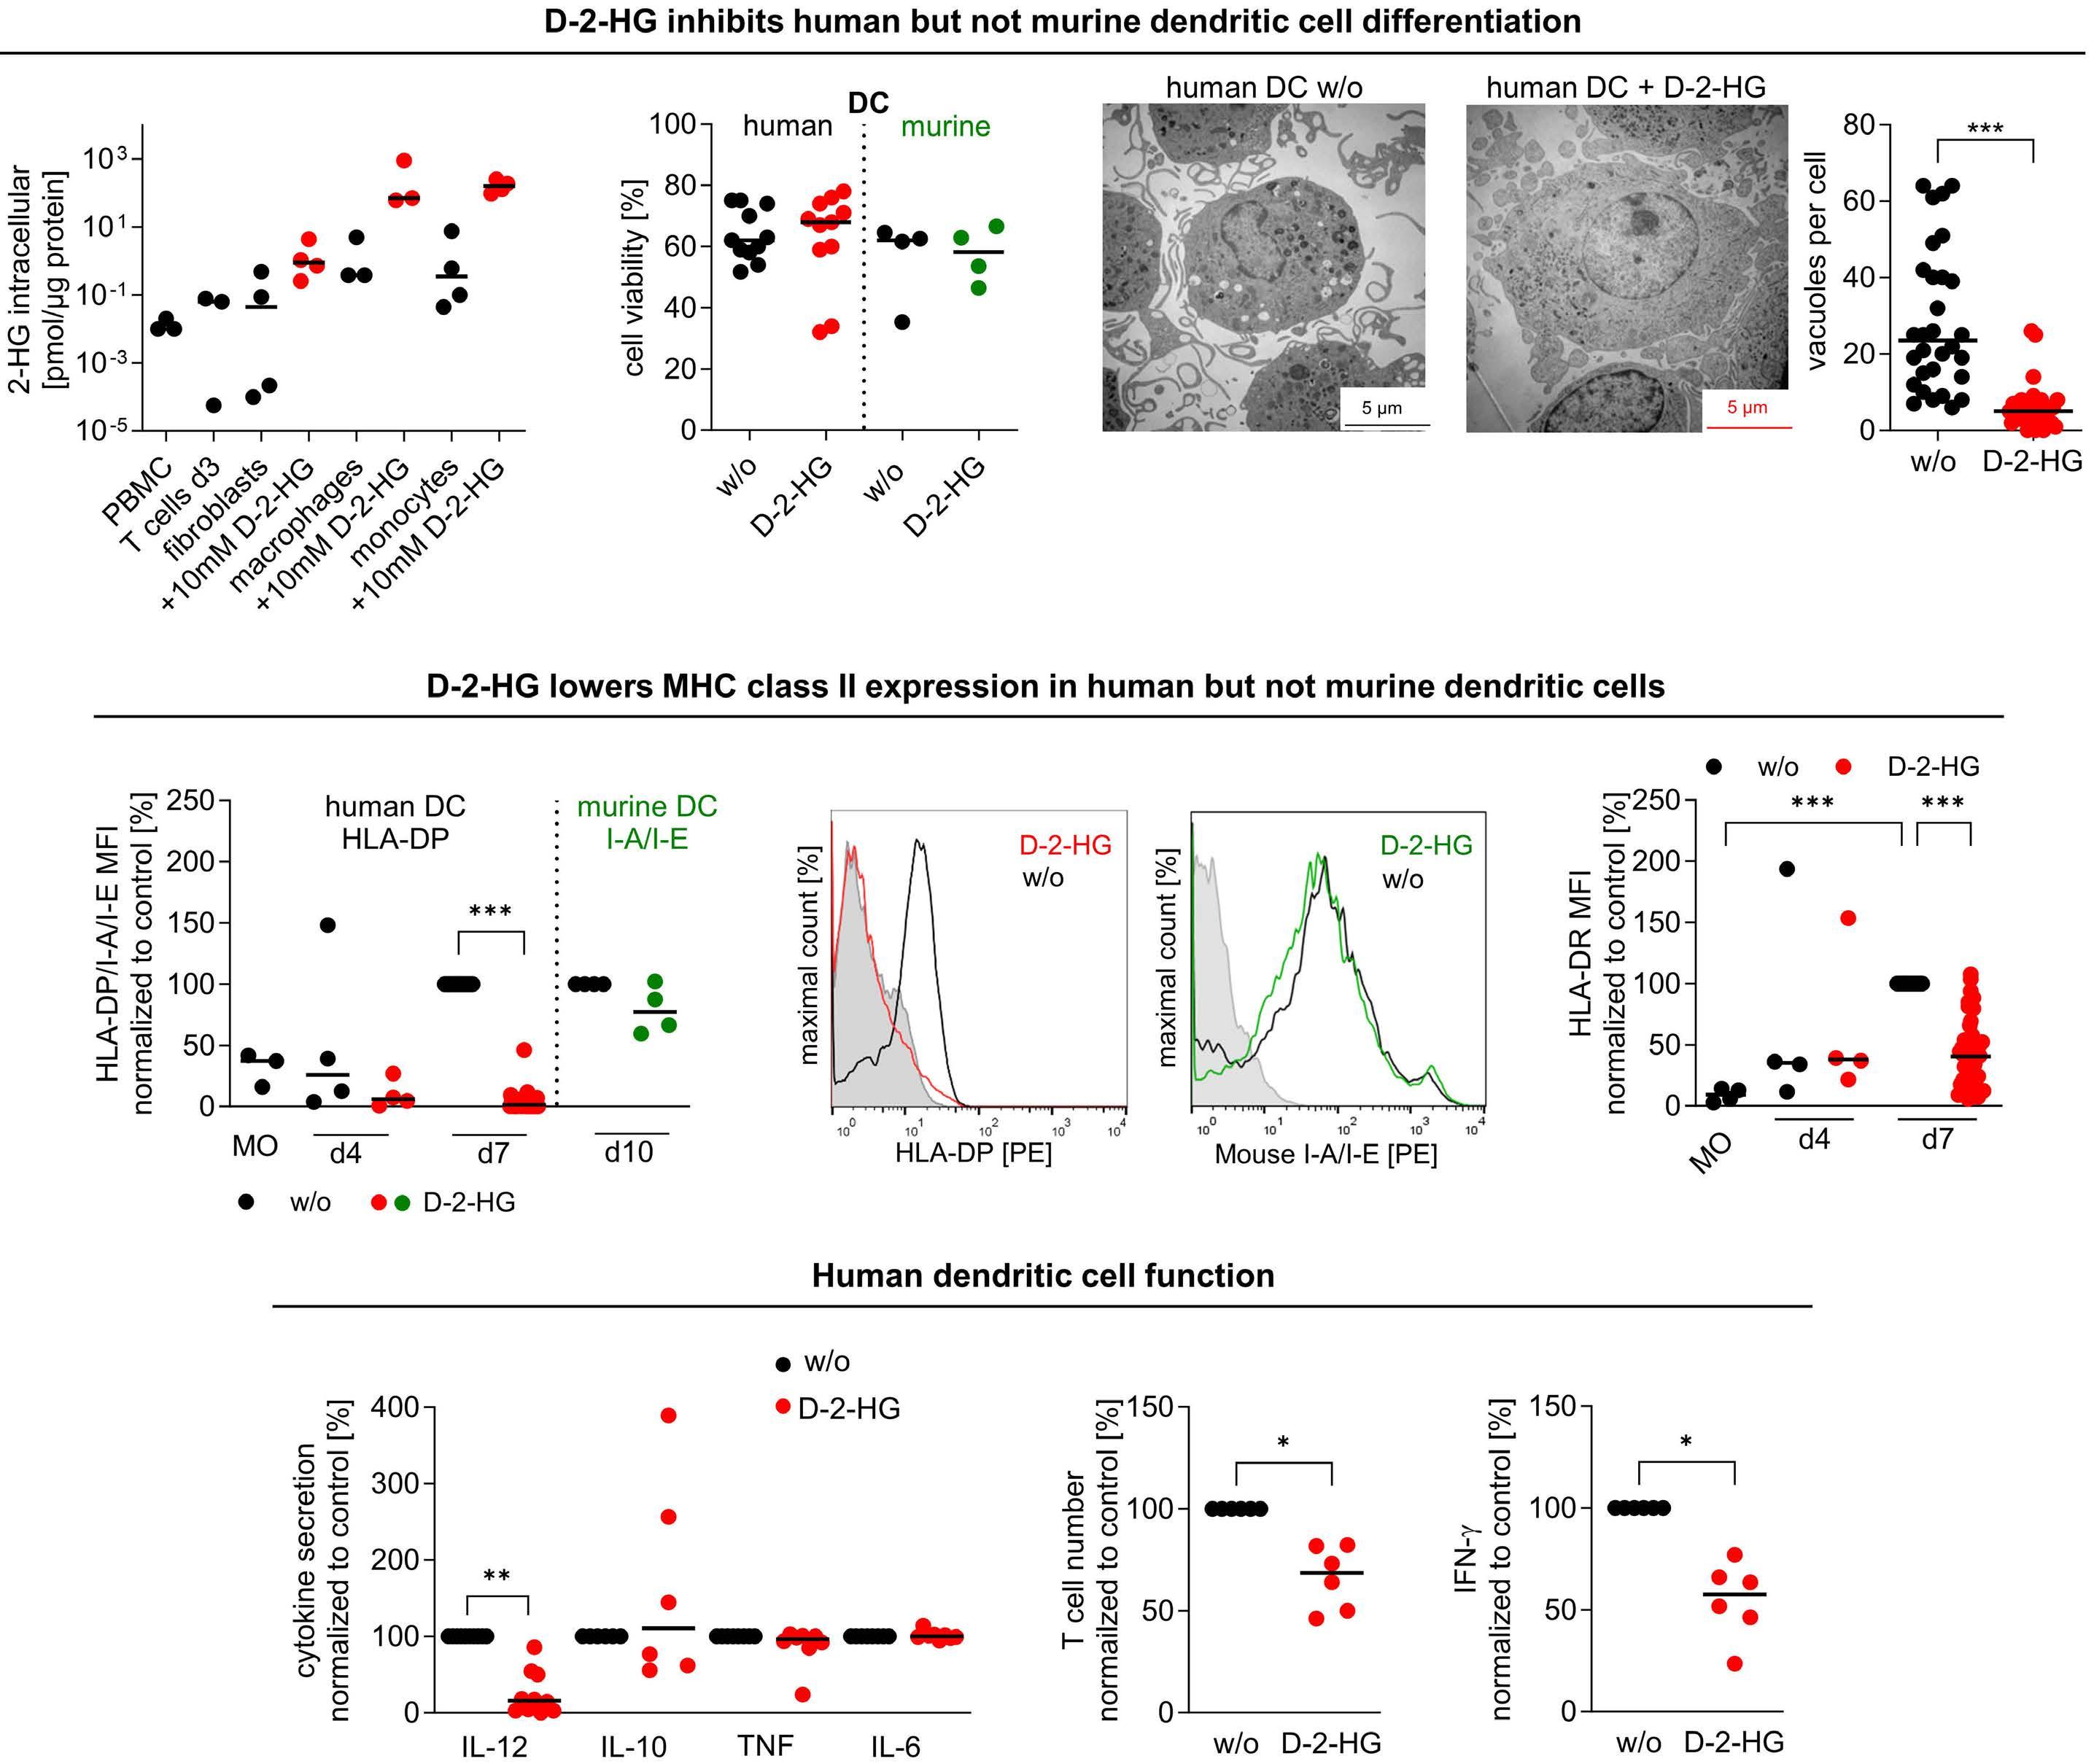
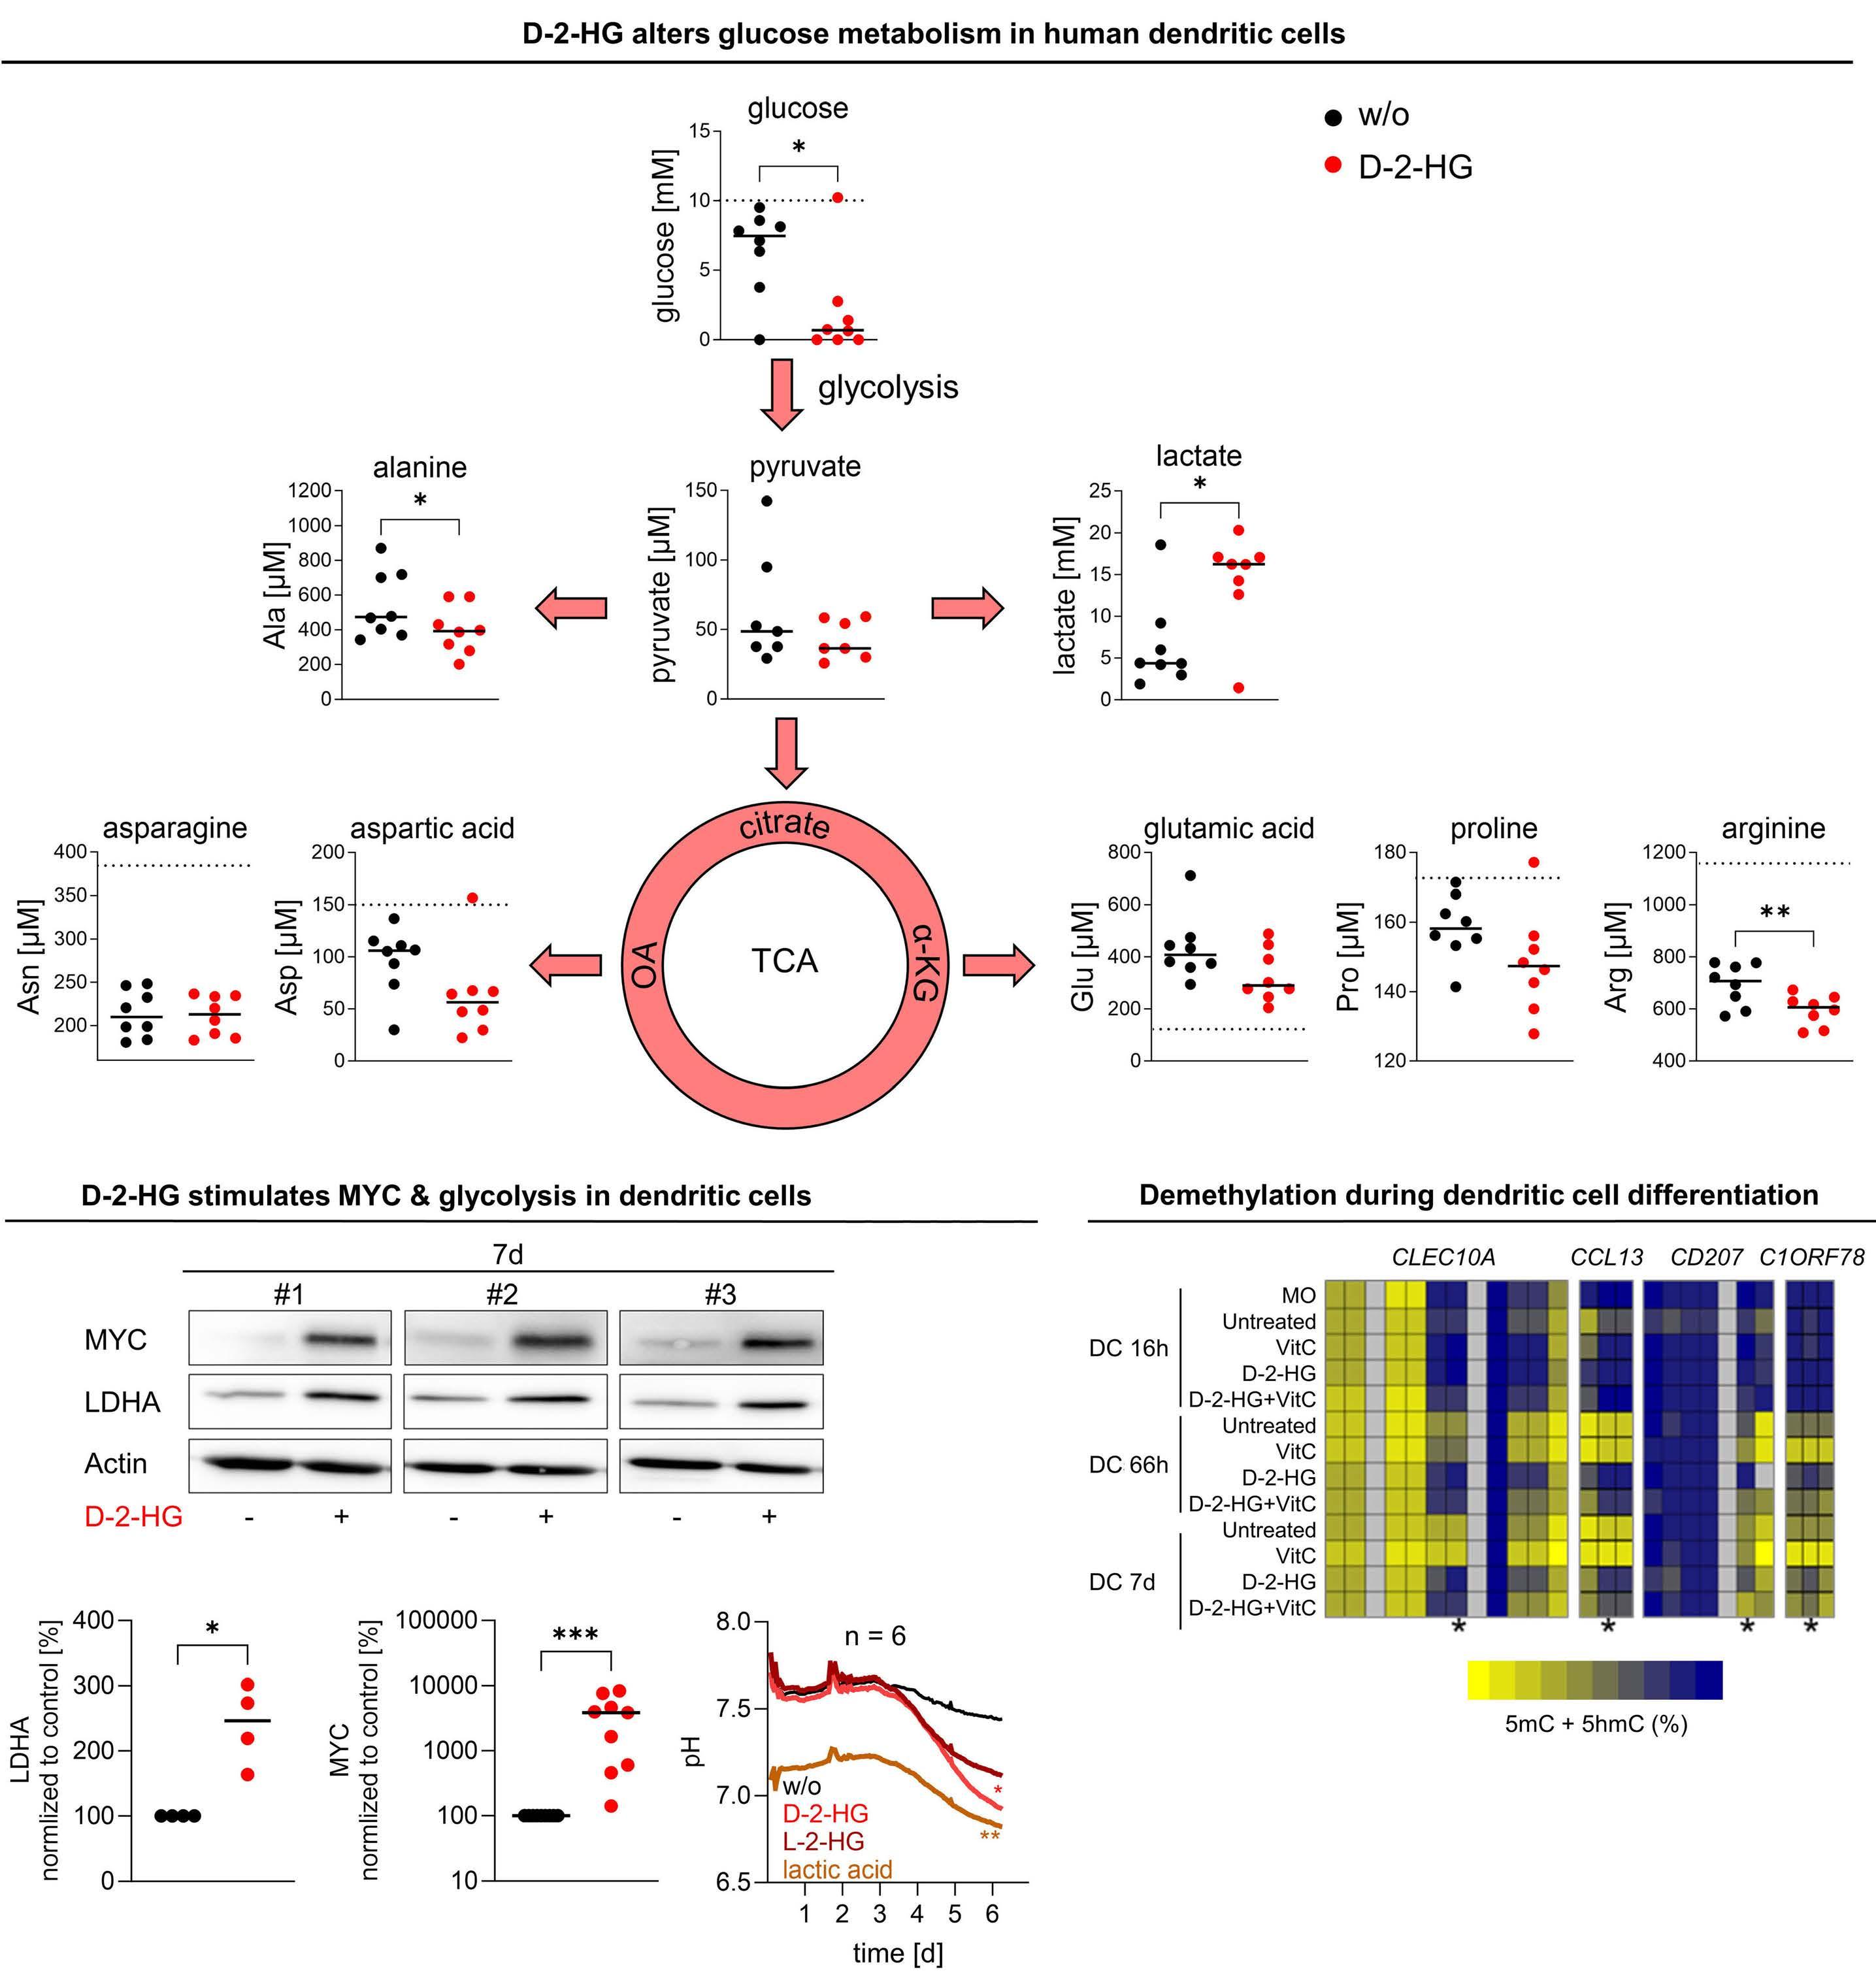
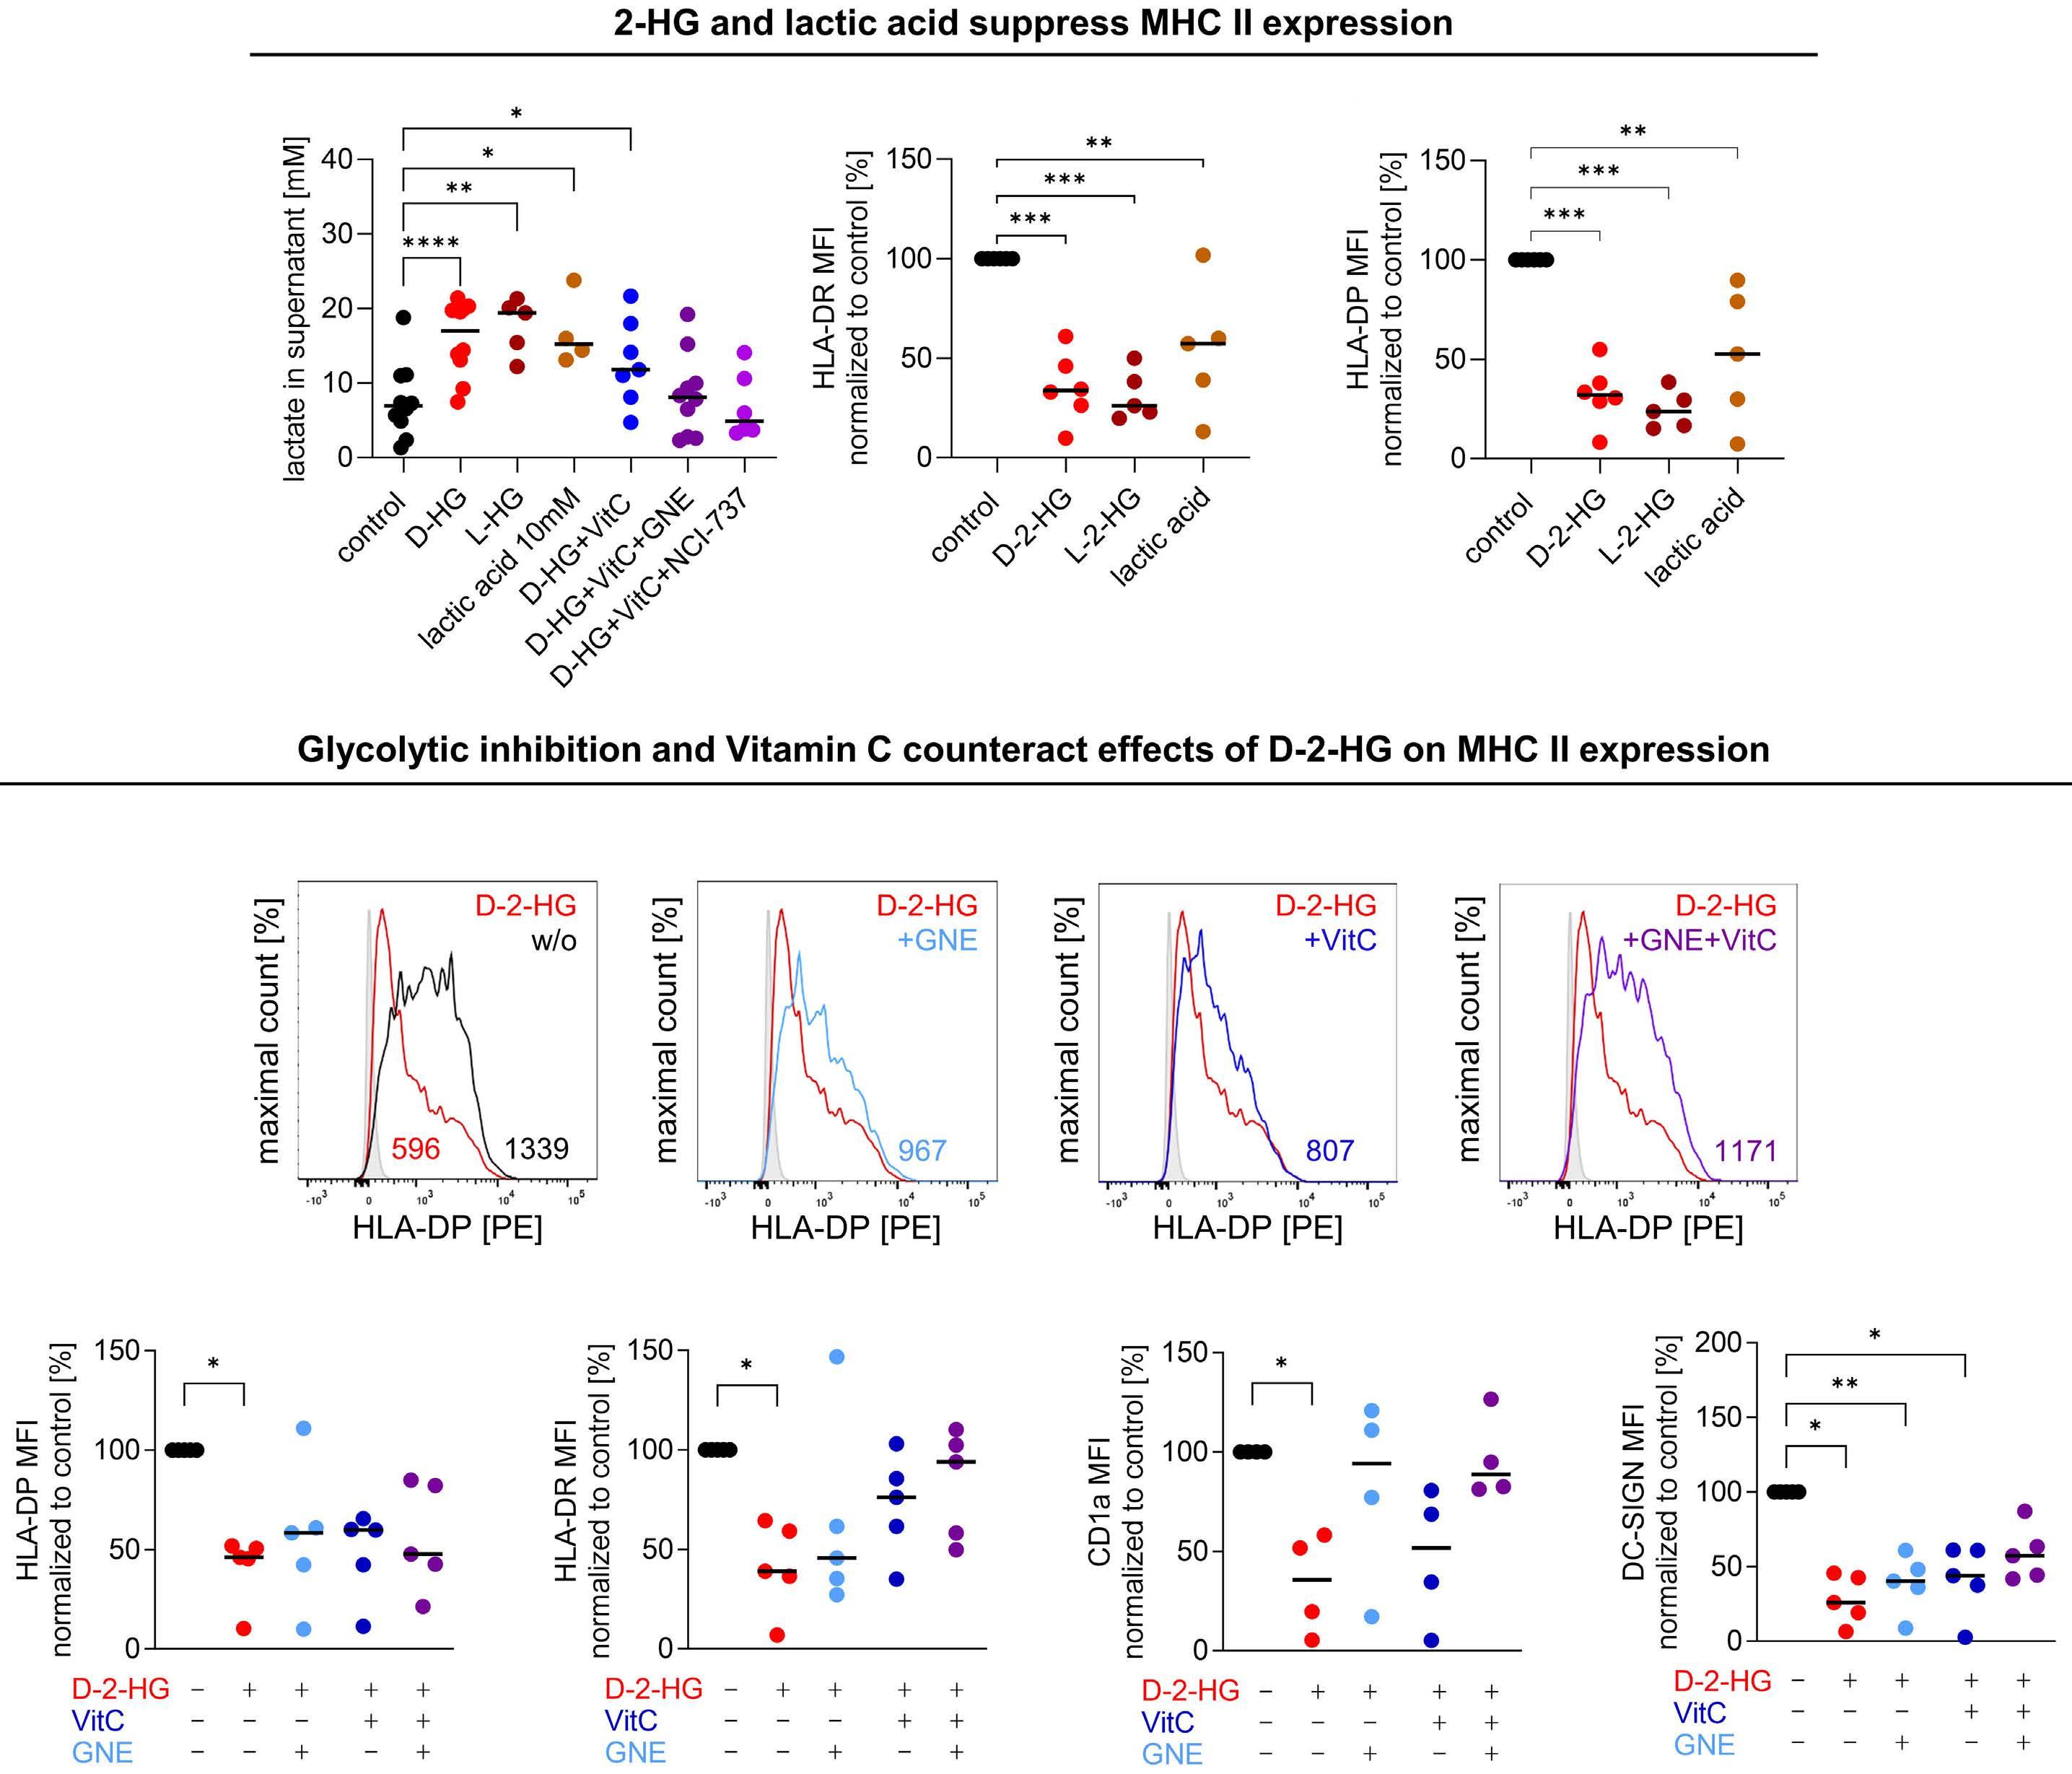
cells. LDH inhibition induced an altered NAD(H) balance, leading to an increased dependency on complex I of the electron transport chain. Therefore, CD8+ T cells treated with D-2HG displayed higher OxPHOS, while no change in glucose consumption was observed. Pharmacological inhibition of LDH recapitulated the effects of D-2HG, such as the decrease in IFNγ signaling, confirming the key role of LDH regulation and glycolysis flux in T-cell functions. Hammon et al.1 focused on another important myeloid cell population, dendritic cells, for which the link between the immunosuppressive effects of D-2HG and metabolic reprogramming had not been previously investigated. Interestingly, they showed that human monocyte-derived dendritic cells use a different mechanism compared to T cells. In dendritic cells, D-2HG led to a decrease of major histocompatibility class II (MHC II) expression (HLA-DP, HLA-DR) and function (INFγ and interleukin-12 secretion), thus reducing T-cell stimulation and favoring the immune escape of AML cells (Figure 1). Contrarily to T cells, D-2HG treatment increased glucose uptake, lactate production, LDHA expression, and delayed methylation in dendritic cells, as well as enhancing mitochondrial respiration. Treatment of dendritic cells with exogenous lactate altered the differentiation of these cells, mimicking the effect of D-2HG. Reactivation of the D-2HG target, Tet methylcytosine dioxygenase 2 (TET2), with vitamin C restored DNA demethylation and oxygen consumption but did not alter lactate levels or MHC II antigen expression. Finally, the addition of LDHA inhibitors to vitamin C decreased lactate levels and partially restored the expression of MHC II antigens and dendritic cell markers, indicating promising opportunities for a dual approach targeting metabolic dependencies and epigenetic plasticity.
Interestingly, Everts et al. previously showed that Toll-like receptor-induced activation of dendritic cells depended on
Figure 1. D-2-hydroxyglutarate-driven immune escape through metabolic reprogramming of dendritic cells and acute myeloid leukemia cells. Exogeneous D-2-hydroxyglutarate (D-2HG) treatment impairs dendritic cell differentiation leading to a decrease of major histocompatibility class (MHC) II expression and T-cell activation. Metabolically, D-2HG increases glucose uptake and lactate release, as well as mitochondrial respiration. Exogeneous D-2HG treatment also enhances glucose uptake and lactate production as well as lowering MHC II expression in IDH wild-type acute myeloid leukemia (AML) cells, leading to reduced HLADP T-cell lysis. Altogether, D-2HG drives immune escape in AML. TCA: tricarboxylic acid; IDH: isocitrate dehydrogenase; WT: wildtype; OxPHOS; oxidative phosphorylation; IFN: interferon; IL: interleukin.
the glycolytic flux towards the tricarboxylic acid cycle.4 In the study by Hammon et al.1 metabolomic analyses of the supernatant of D-2HG-treated dendritic cells did not show a significant increase of glutamine or proline uptake, leading to questioning whether the higher glucose consumption could also feed the tricarboxylic acid cycle, explaining the observed higher oxygen consumption. If this holds true, the partial rescue of differentiation could be explained by inhibiting LDH alone, without blocking the entry of pyruvate into the tricarboxylic acid cycle. Further investigations of the catabolic fates of nutrients following D-2HG treatment through isotopic profiling or genetic manipulations could help a better understanding of the link between dendritic cell activation and glycolysis adaptation. Immune escape of leukemic cells in relapsing AML patients
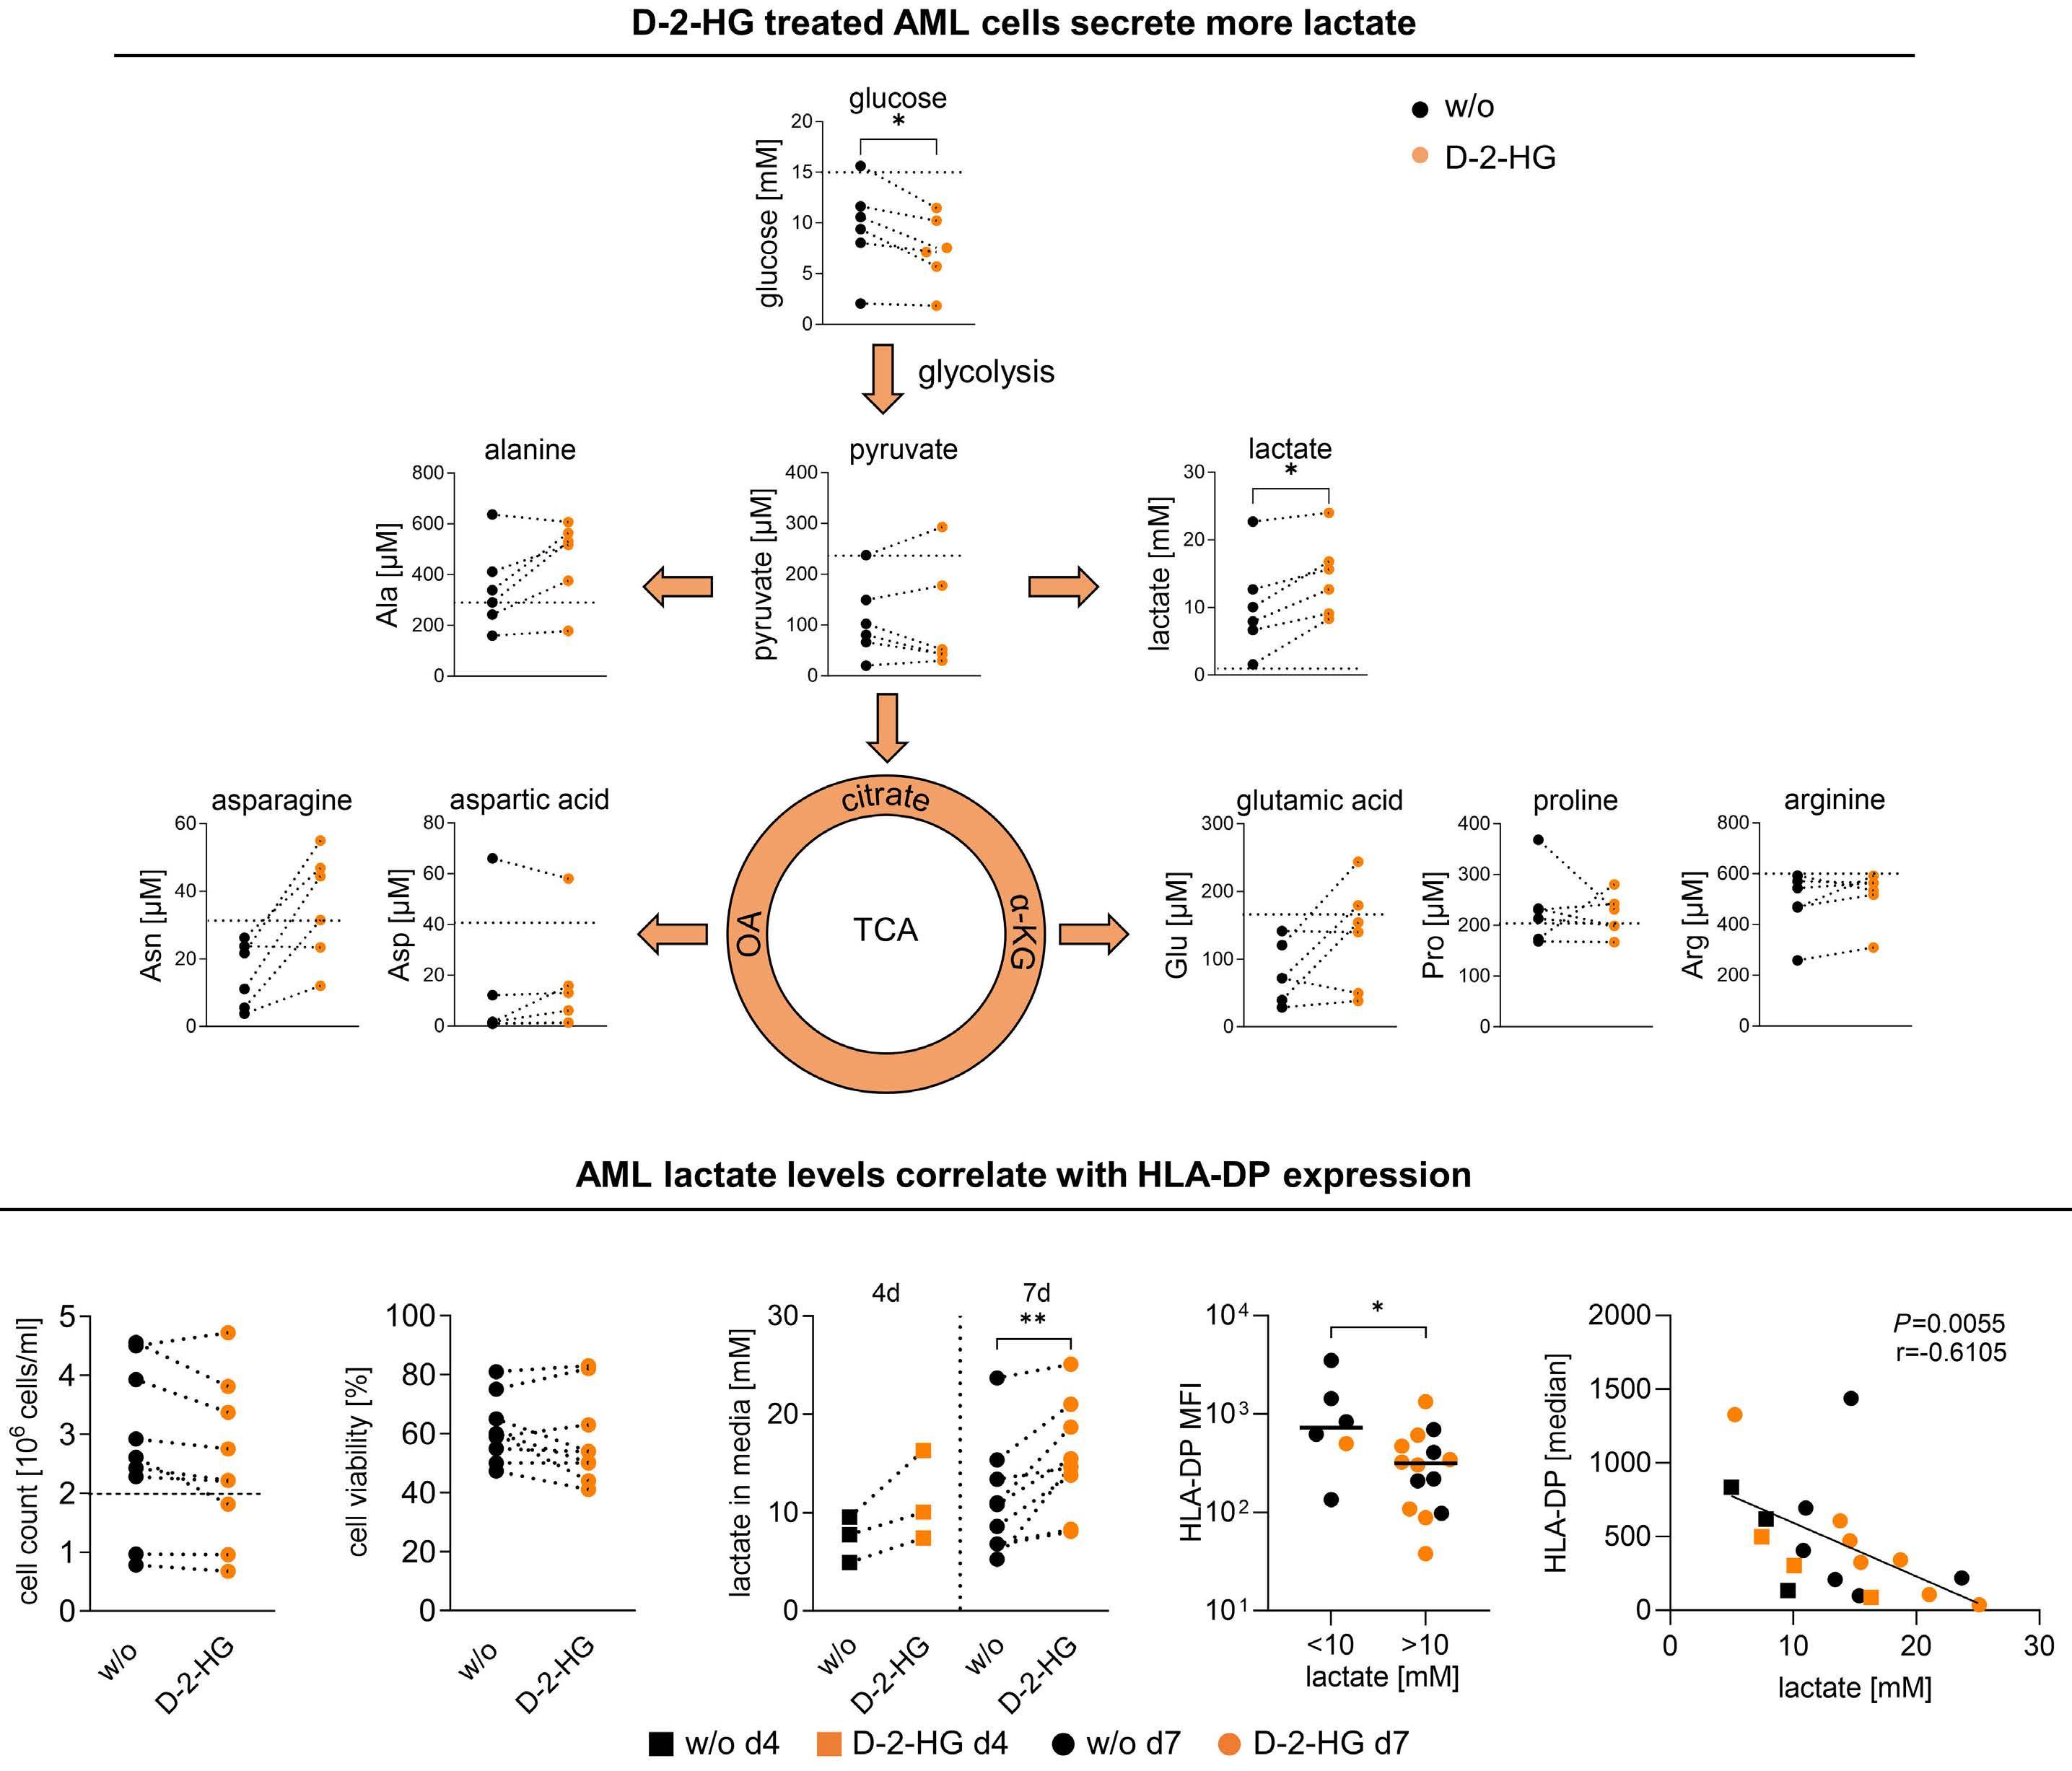
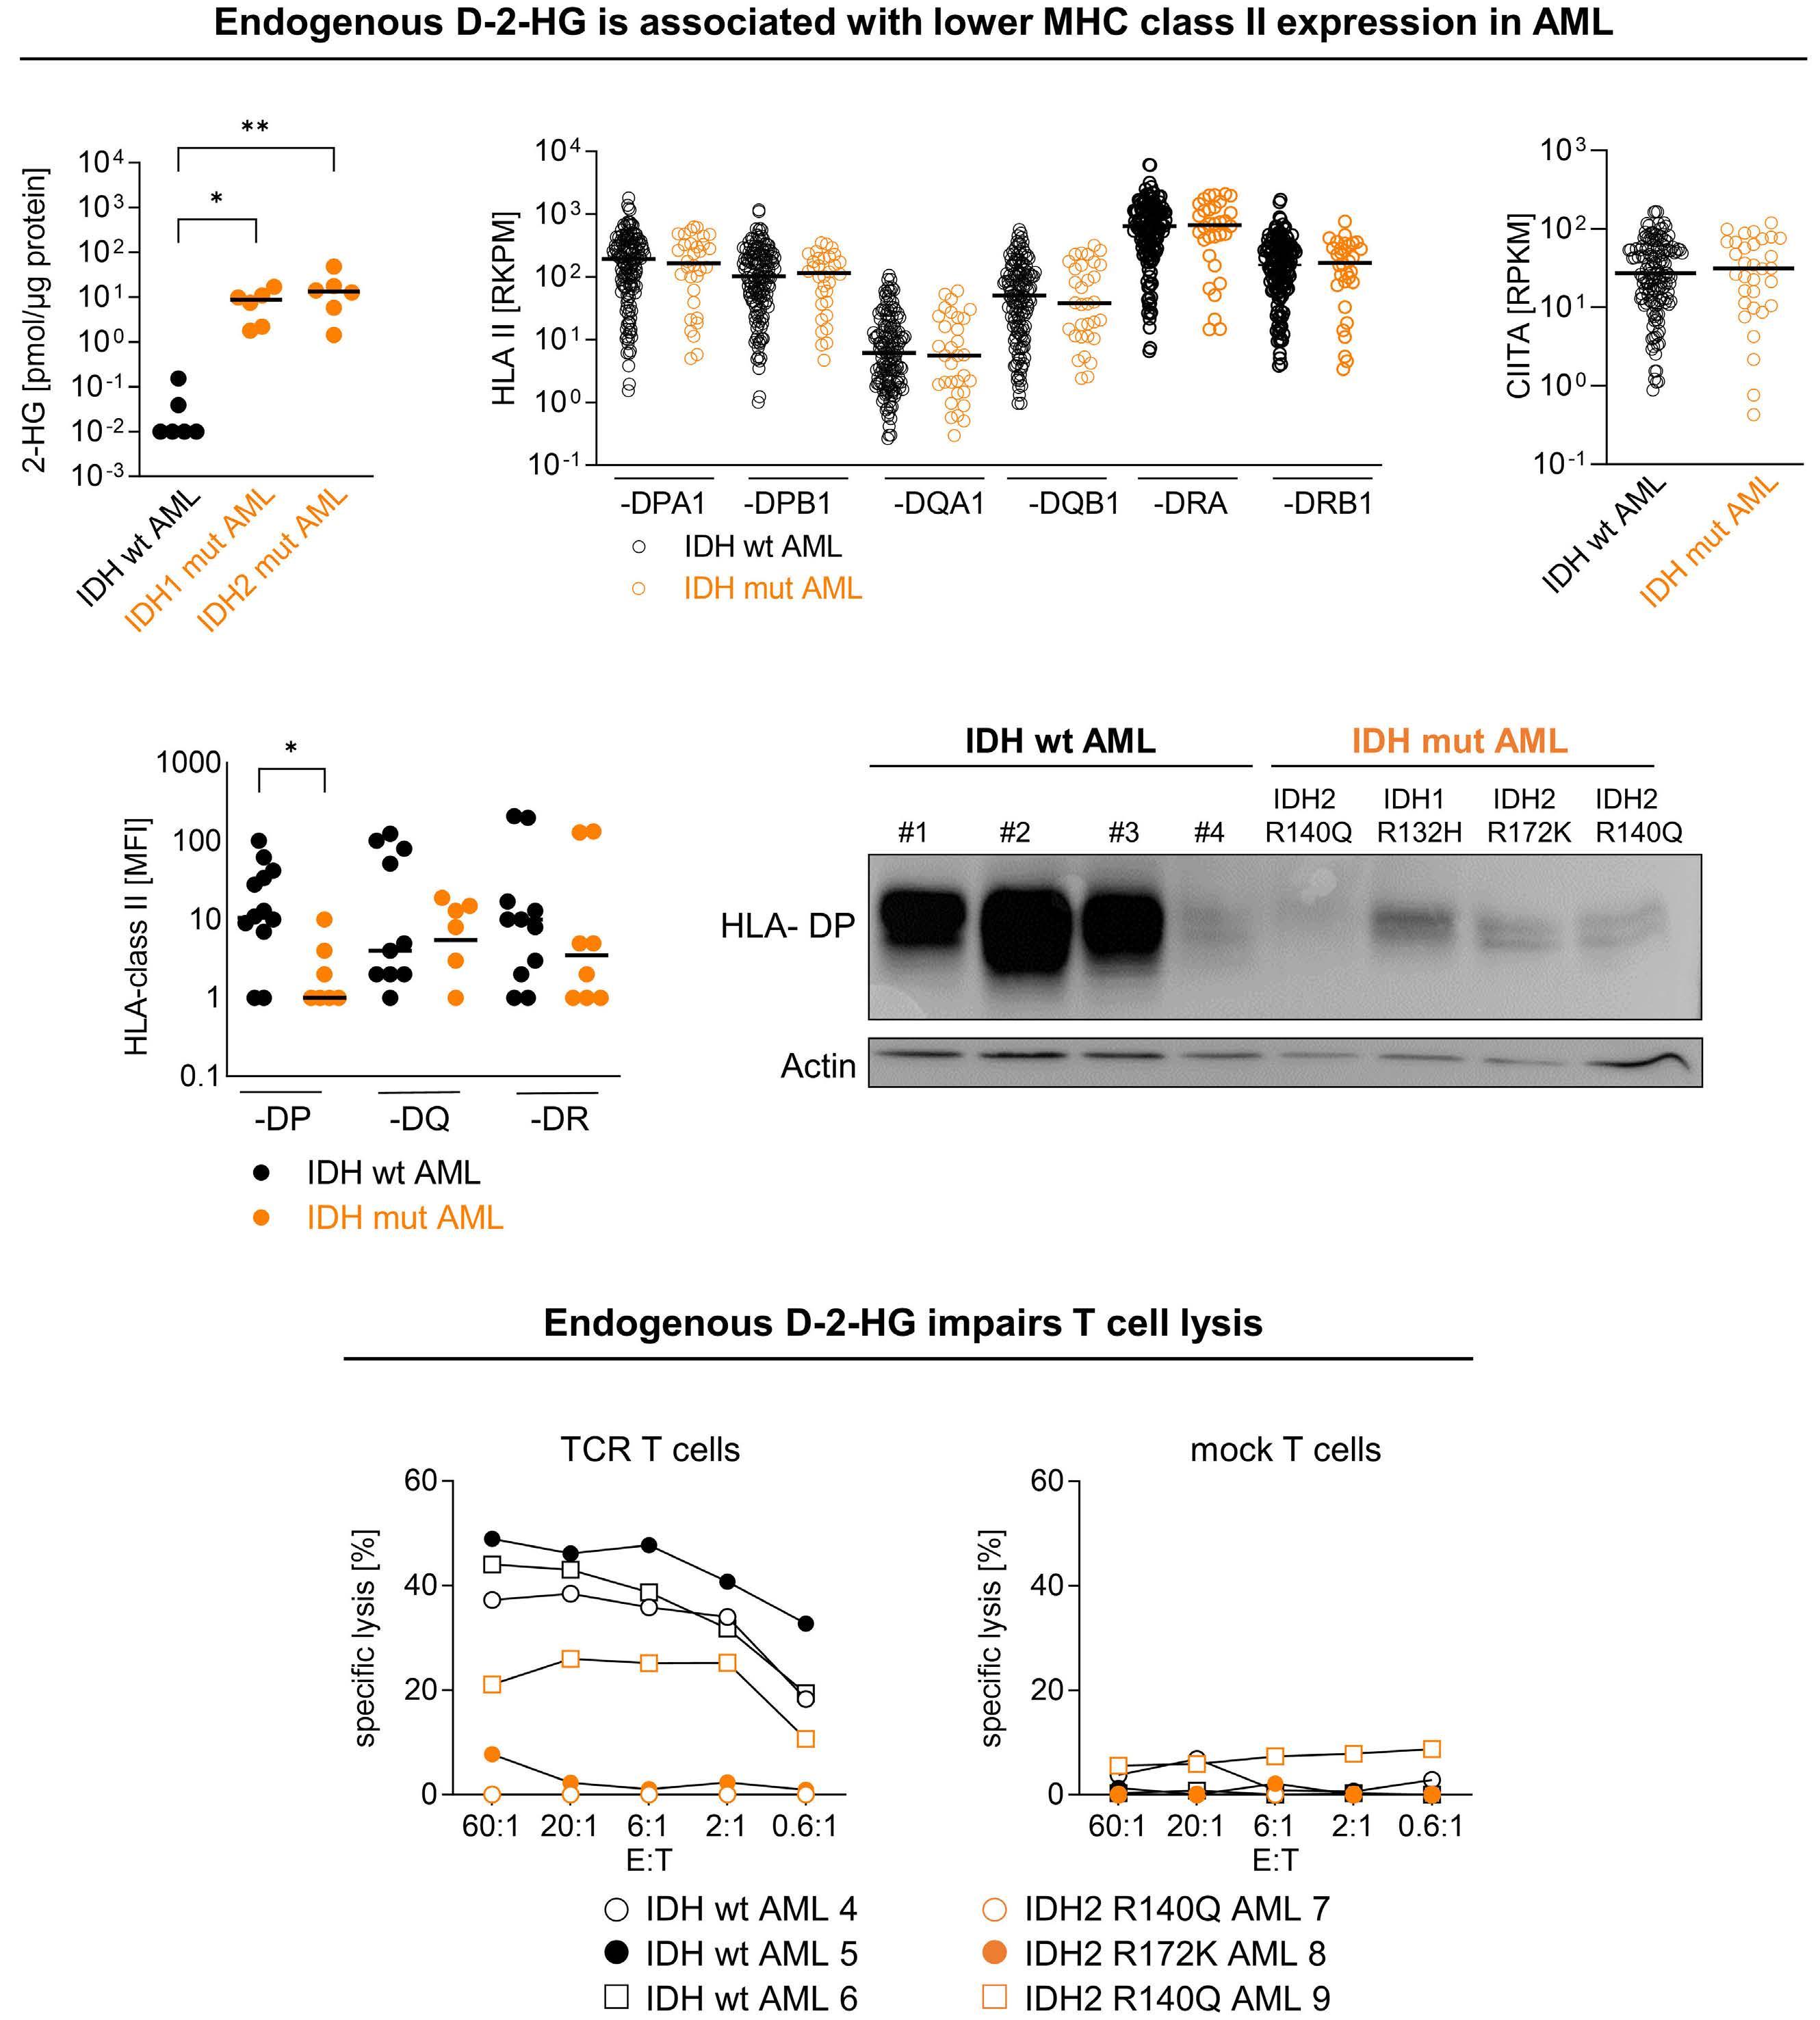
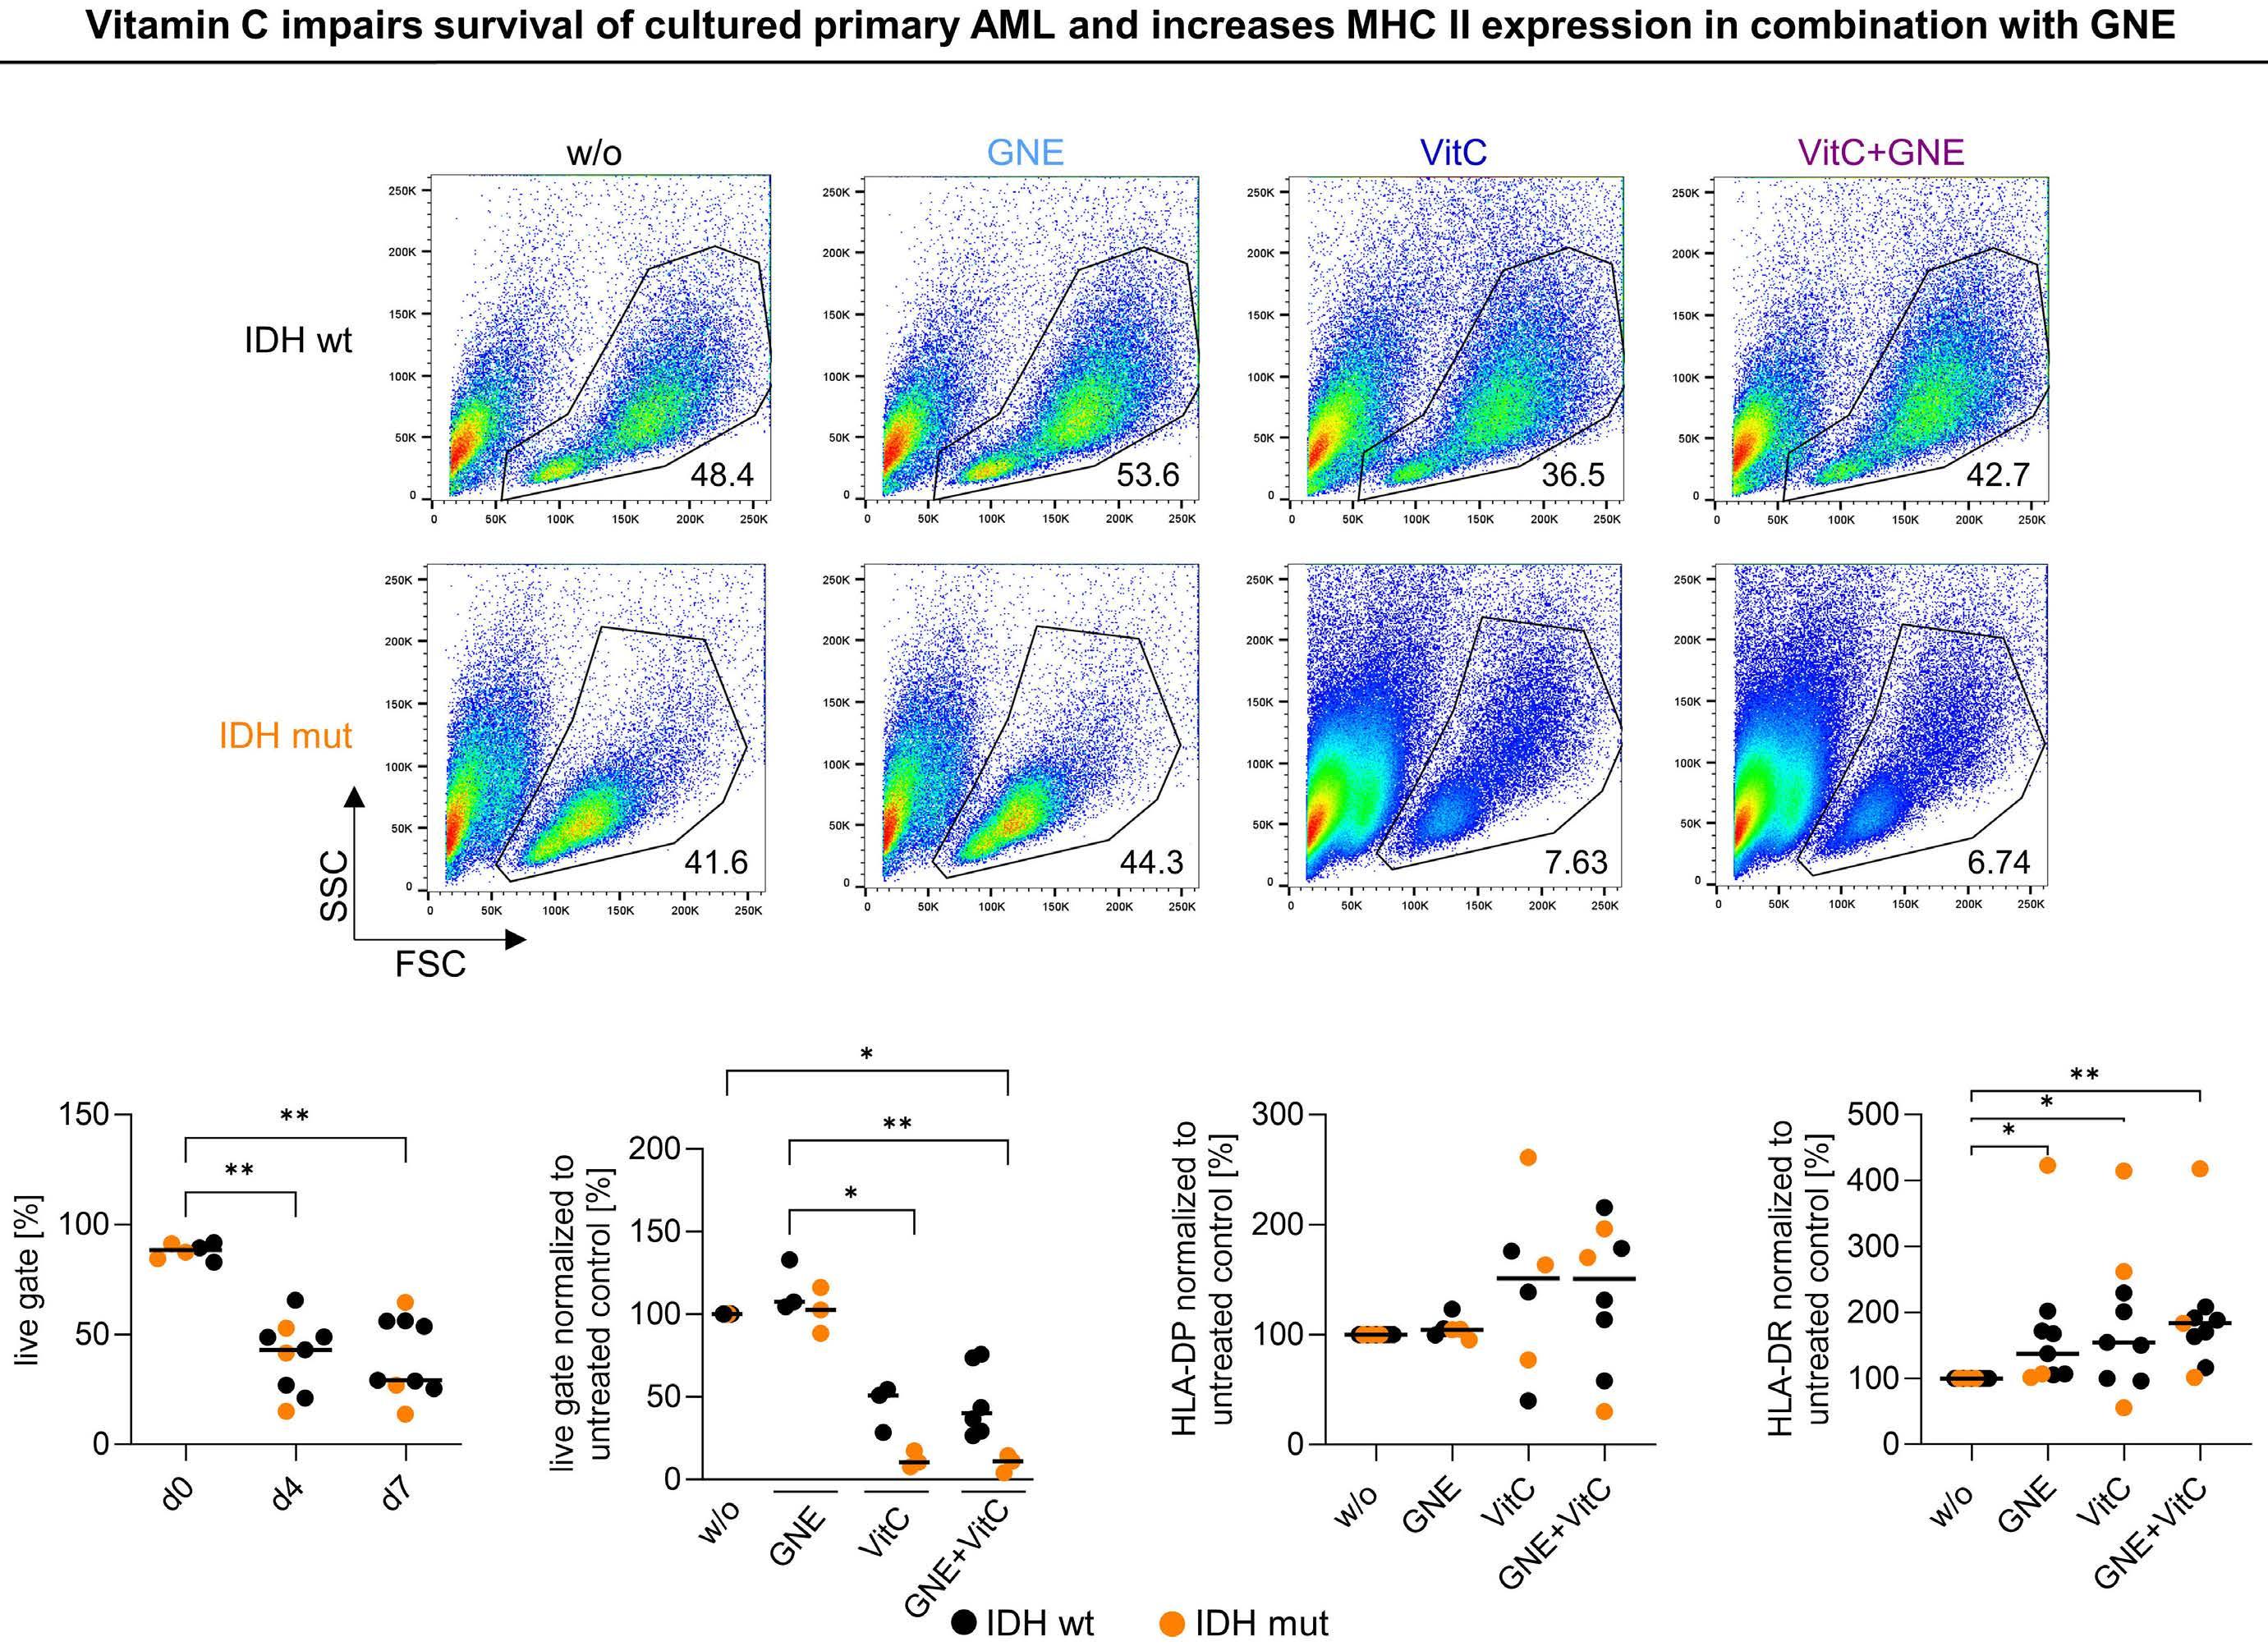
is also driven by the downregulation of MHC II genes and proteins (HLA-DP, HLA-DR).5 Thus, another interesting point is raised in the second part of the study in which the authors compared the effects of D-2HG on dendritic cells and AML cells, showing major similarities (Figure 1). Indeed, D-2HG increased glucose uptake and lactate production in primary AML blasts, and lactate concentration inversely correlated with HLA-DP or HLA-DR levels. Accordingly, lysis by HLA-DP-specific T cells was reduced in IDH-mutant AML primary cells. While the combination of LDH inhibitors and vitamin C significantly decreased AML viability, in particular in patients harboring IDH mutations, HLA-DR and HLA-DP expression was increased independently of IDH status. Nevertheless, the therapeutic effect was driven mostly by vitamin C and the potential of LDHA inhibitors
needs further investigation in the context of AML.
Of particular interest, D-2HG has been shown to decrease aerobic glycolysis in a panel of D-2HG-sensitive leukemia cells and cases of primary IDH-wildtype AML through epitranscriptomic regulation mediated by fat-mass- and obesity-associated protein (FTO).6 Inhibition of FTO by D-2HG increased global N6-methyladenosine (m6A) RNA modification and suppressed the expression of critical glycolytic genes including LDHB, leading to inhibition of the glycolytic flux with no impact on mitochondrial respiration. Low levels of FTO and hyperactivation of MYC signaling were observed in IDH-mutant AML and D-2HG-resistant cells, and led to the maintenance of glycolysis and OxPHOS following treatment with D-2HG.7 In their study published in this issue, Hammon et al.1 noted the induction of MYC expression in dendritic cells following exposure to D-2HG, suggesting that these cells may be resistant to D-2HG. Direct targeting of MYC has proven to be challenging due to its role as a transcriptional modulator. However, a strategy to attenuate its activity may become relevant for treating leukemias and simultaneously restoring dendritic cell phenotype, counteracting immune escape.
Altogether the effects of D-2HG on metabolic rewiring, in particular glycolysis and OxPHOS, are cell-type-dependent and are strictly interconnected with the tumor microenvironment. Therefore, a better understanding of the role of D-2HG in reshaping the tumor microenvironment will be
References
1. Hammon K, Renner K, Althammer M, et al. D-2-hydroxyglutarate supports a tolerogenic phenotype with lowered major histocompatibility class II expression in non-malignant dendritic cells and acute myeloid leukemia cells. Haematologica. 2024;109(8):2500-2514.
2. Böttcher M, Renner K, Berger R, et al. D-2-hydroxyglutarate interferes with HIF-1a stability skewing T-cell metabolism towards oxidative phosphorylation and impairing Th17 polarization. Oncoimmunology. 2018;7(7):e1445454.
3. Notarangelo G, Spinelli JB, Perez EM, et al. Oncometabolite D-2HG alters T cell metabolism to impair CD8+ T cell function. Science. 2022;377(6614):1519-1529.
4 Everts B, Amiel E, Huang SC-C, et al. TLR-driven early glycolytic reprogramming via the kinases TBK1-IKKε supports the anabolic demands of dendritic cell activation. Nat Immunol. 2014;15(4):323-332.
5. Christopher MJ, Petti AA, Rettig MP, et al. Immune escape of relapsed AML cells after allogeneic transplantation. N Engl J
instrumental to developing better therapeutic strategies. In that direction, decreasing D-2HG levels with IDH mutant inhibitors in gliomas, improved T-cell infiltration and anti-tumor efficacy of peptide vaccines,8 as well as activation and expansion of dendritic cells enhancing tumor regression in combination with anti-PDL1 immune checkpoint blockade.9 Moreover, some metabolic determinants of IDH-mutant AML, such as increased fatty acid oxidation, are not reversed by IDH mutant inhibitors and are thus independent.10 Improving the classification of metabolic adaptations as either D-2HG-dependent or -independent in IDH mutant-driven cancers will be critical to design more efficient clinical strategies and improve the efficacy of IDH mutant inhibitors alone or in combination.
Disclosures
No conflicts of interest to disclose.
Contributions
Both authors contributed equally.
Funding
AS is supported by a Rita Levi Montalcini career development award. LS is supported by the Association Laurette Fugain (number ALF 2021/11) and by the European Union’s Horizon 2020 Research and Innovation program under a Marie Skłodowska-Curie grant agreement (number 897140).
Med. 2018;379(24):2330-2341.
6. Qing Y, Dong L, Gao L, et al. R-2-hydroxyglutarate attenuates aerobic glycolysis in leukemia by targeting the FTO/m6A/PFKP/ LDHB axis. Mol Cell. 2021;81(5):922-939.e9.
7 Su R, Dong L, Li C, et al. R-2HG exhibits anti-tumor activity by targeting FTO/m6A/MYC/CEBPA signaling. Cell. 2018;172(1-2):90-105.e23.
8. Kohanbash G, Carrera DA, Shrivastav S, et al. Isocitrate dehydrogenase mutations suppress STAT1 and CD8+ T cell accumulation in gliomas. J Clin Invest. 2017;127(4):1425-1437.
9. Kadiyala P, Carney SV, Gauss JC, et al. Inhibition of 2-hydroxyglutarate elicits metabolic reprogramming and mutant IDH1 glioma immunity in mice. J Clin Invest. 2021;131(4):e139542.
10 Stuani L, Sabatier M, Saland E, et al. Mitochondrial metabolism supports resistance to IDH mutant inhibitors in acute myeloid leukemia. J Exp Med. 2021;218(5):e20200924.
SH2B3 alterations in a novel genetic condition, juvenile myelomonocytic leukemia, and myeloproliferative neoplasia
Charlotte M. Niemeyer and Miriam Erlacher
Division of Pediatric Hematology and Oncology, Department of Pediatrics and Adolescent Medicine, Medical Center – University of Freiburg, Faculty of Medicine, University of Freiburg Freiburg, Germany
Hematopoiesis is a highly dynamic process evolving across the human lifespan. The fetal and perinatal periods are ones of particular physiological change and evolution. During these developmental stages, constitutional genetic conditions can cause imbalances in potent regulators of maintenance and differentiation of stem and progenitor cells giving rise to specific hematologic phenotypes in neonates and young infants. A prominent example is Down syndrome with its trisomy 21-mediated perturbation of fetal hematopoiesis. Approximately 10% of newborns with Down syndrome present with transient abnormal myelopoiesis characterized by increased peripheral blood blast cells and pathognomonic somatic mutations in the transcription factor GATA1. 1 While 10% to 20% of cases transform into full-blown leukemia within the first 4 years of life, the majority of cases resolve without treatment. Another common developmental disorder, which can present with a transient myeloproliferative disease (MPD) in the first months of life, is Noonan syndrome caused by germline pathogenic variants of the RAS/mitogen-activated protein kinase (MAPK) pathway. Most of these patients with Noonan syndrome carry germline mutations in PTPN11. 2 While the mutational landscape of transient abnormal myelopoiesis in Down syndrome is at least in part elucidated, the mechanism of Noonan syndrome-associated MPD remains largely obscure.
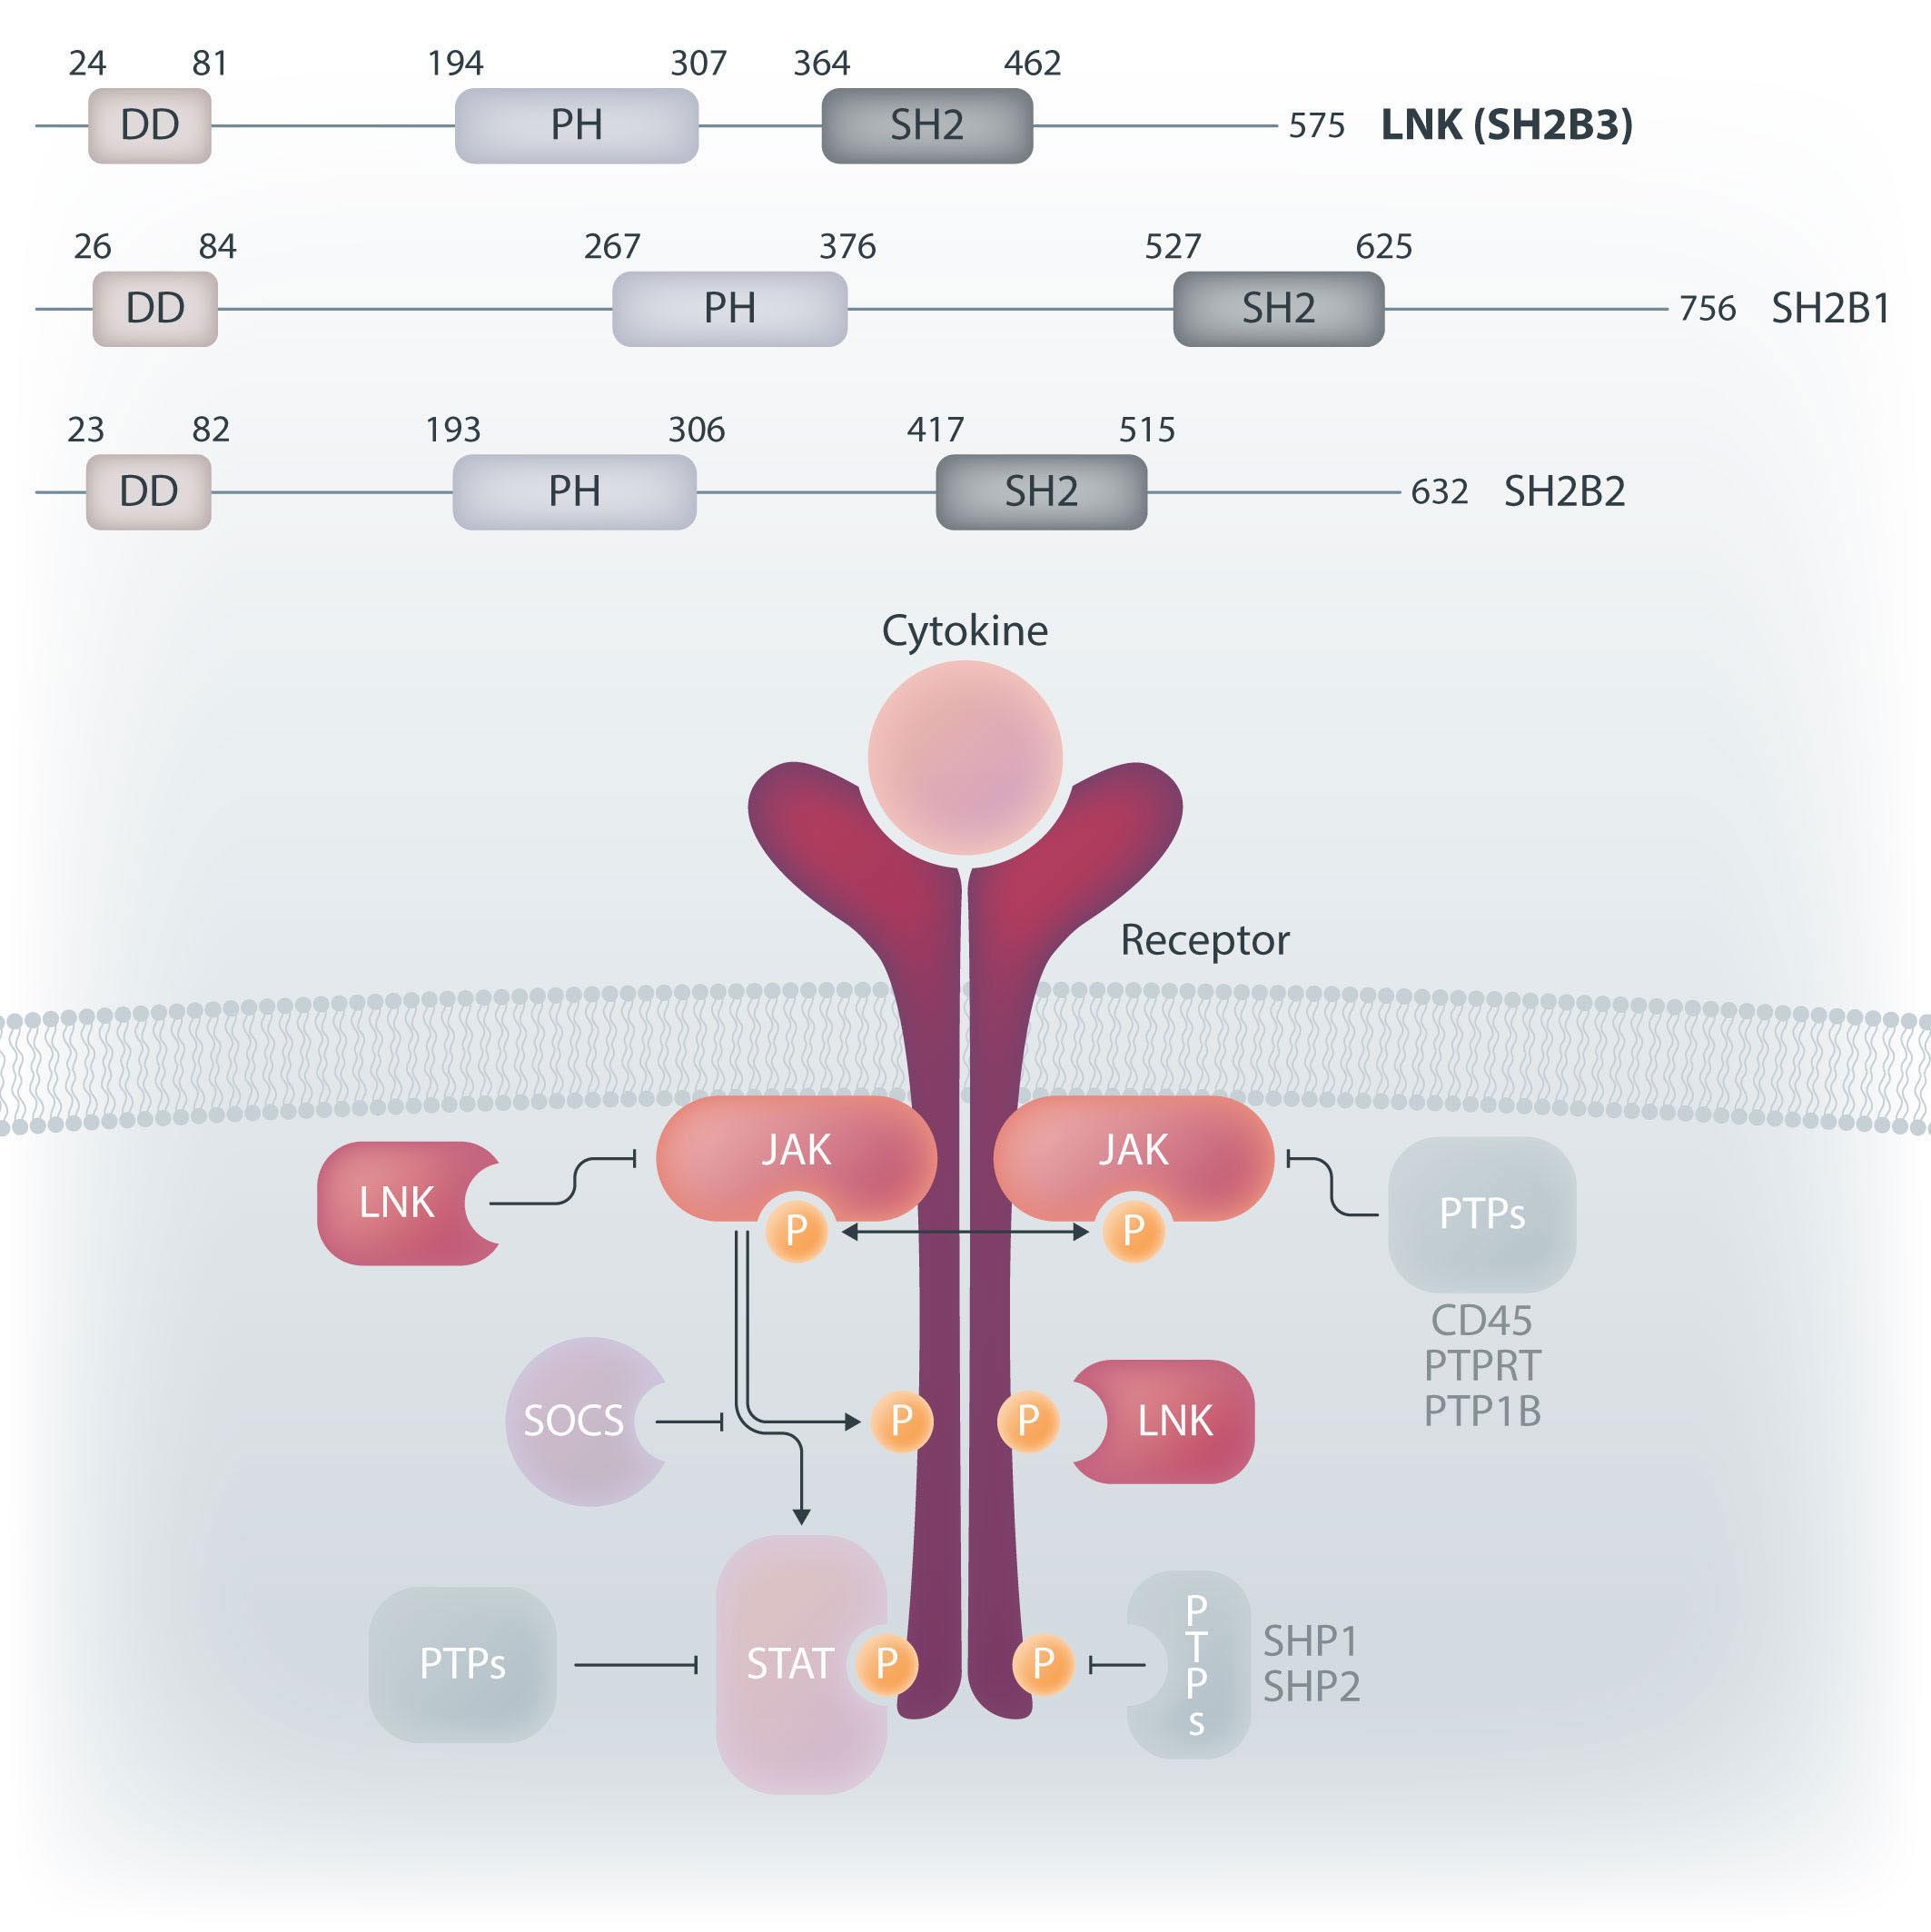
Perez-Garcia et al.3 and Blombery et al.4 have reported on another transient MPD presenting shortly after birth in patients with biallelic germline mutations in the SH2B3 gene. SH2B3 encodes the lymphocyte adapter LNK (also named SH2B3), a member of the SH2B adapter family of proteins, which also comprises APS (SH2B2) and SH2B (SH2B1) (Figure 1). SH2B proteins share a common architecture of an N-terminal dimerization domain, central pleckstrin homology (PH) domain and a C-terminal Src homology
2 (SH2) domain. LNK is widely expressed in human tissues, with the highest expression in hematopoietic cells.5 It functions as a negative regulator of multiple cytokine and growth factor receptor signaling pathways including the JAK-STAT pathway. LNK directly binds JAK via its SH2 domain and plays a particularly important role in the negative regulation of thrombopoietin and erythropoietin signaling. Lnk-deficient mice exhibit a MPD-like phenotype with splenomegaly, an expanded hematopoietic stem cell pool with enhanced stem cell renewal, increased cytokine sensitivity, and abnormal accumulation of megakaryocytes, erythrocytes and B-lymphocytes in bone marrow and/or spleen. Somatic inactivating SH2B3 mutations have been reported in a number of hematopoietic malignancies, most commonly in myeloproliferative neoplasms (MPN) and in acute lymphoblastic leukemia. LNK also acts as a potent inhibitor of JAK2V617F constitutive activity in MPN,6 which may explain the increasing frequency of loss-of function SH2B3 alterations in patients with MPN from 5-10% up to 13% in MPN leukemic transformation. Limited information is available regarding the clinical significance of germline variants.
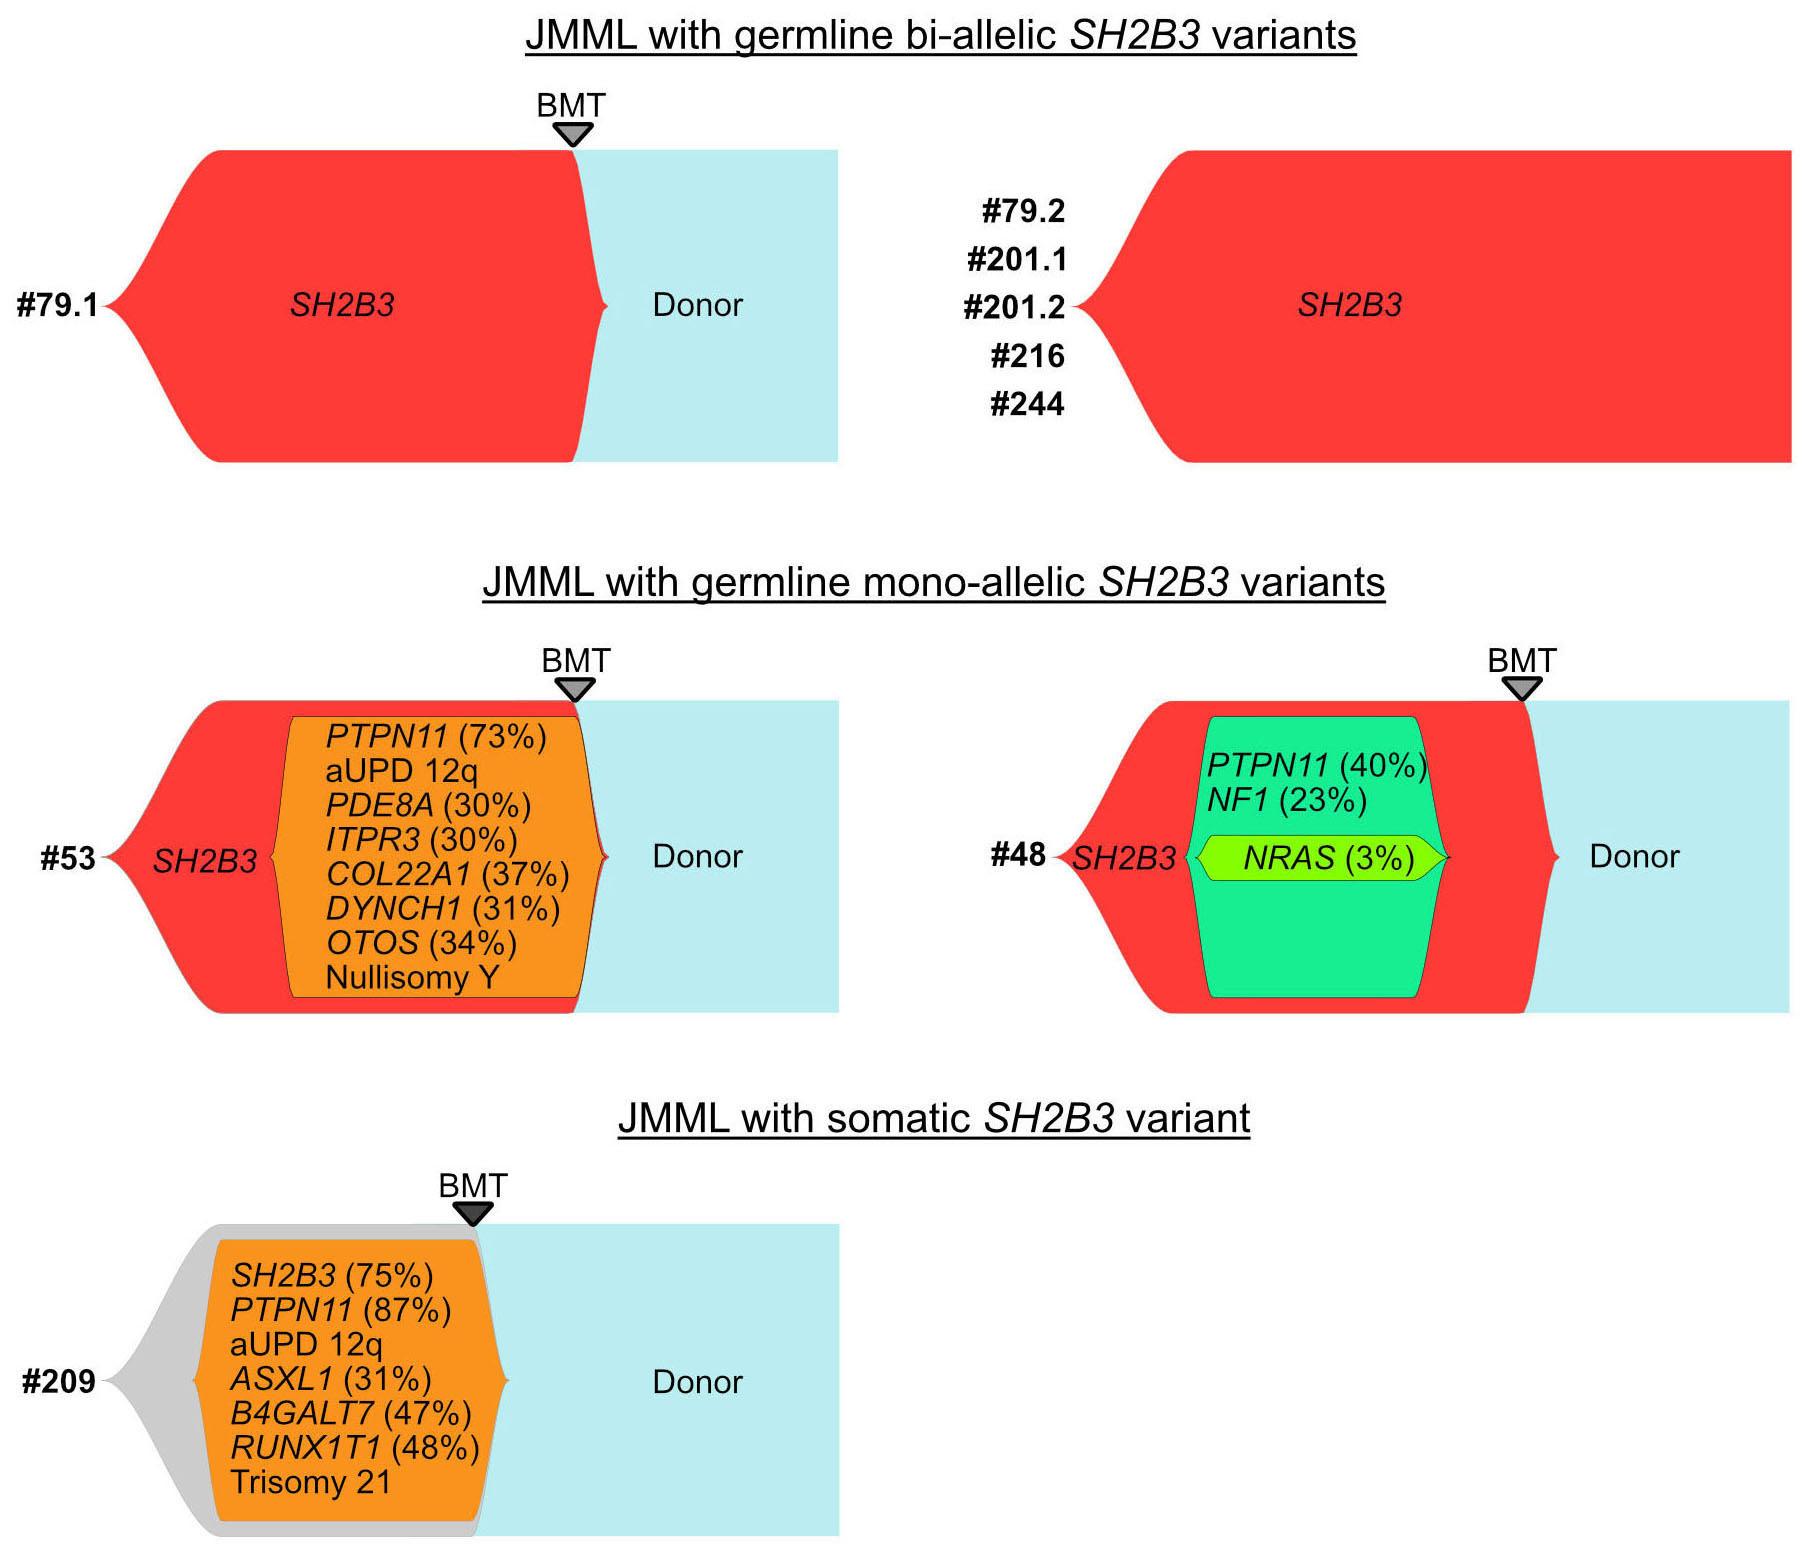
In this edition of Haematologica, two cooperative study groups from France and North America present data on germline SH2B3 alterations in patients referred to the respective reference diagnostic laboratories for juvenile myelomonocytic leukemia (JMML).7,8 JMML is a unique myelodysplastic/myeloproliferative neoplasia of early infancy characterized by constitutive activation of the RAS signal transduction pathway. Approximately 95% of patients with JMML harbor either germline events in NF1 or CBL which progress to neoplasia with acquired biallelic inactivation of the respective genes in hematopoietic cells, or heterozygous somatic gain-of-function mutations of PTPN11, NRAS, and KRAS in the absence of germline disease.9 Arfeuille et
Figure 1. LNK and the adapter family of proteins. Top. The SH2 domain-containing adapter family shares a domain architecture with an N-terminal dimerization domain, central pleckstrin homology domain and a C-terminal Src homology 2 (SH2) domain. Bottom. LNK directly binds JAK and receptors via its SH2 domain thereby inhibiting downstream signaling (shown semi-transparently). Figure adapted from Morris et al. 5 with permission. DD: dimerization domain; PH: pleckstrin homology; SH2: Src homology 2; LNK: lymphocyte adapter protein; JAK: Janus kinases; SOCS: suppressor of cytokine signaling; STAT: signal transducers and activators of transcription; PTP: protein tyrosine phosphatases.
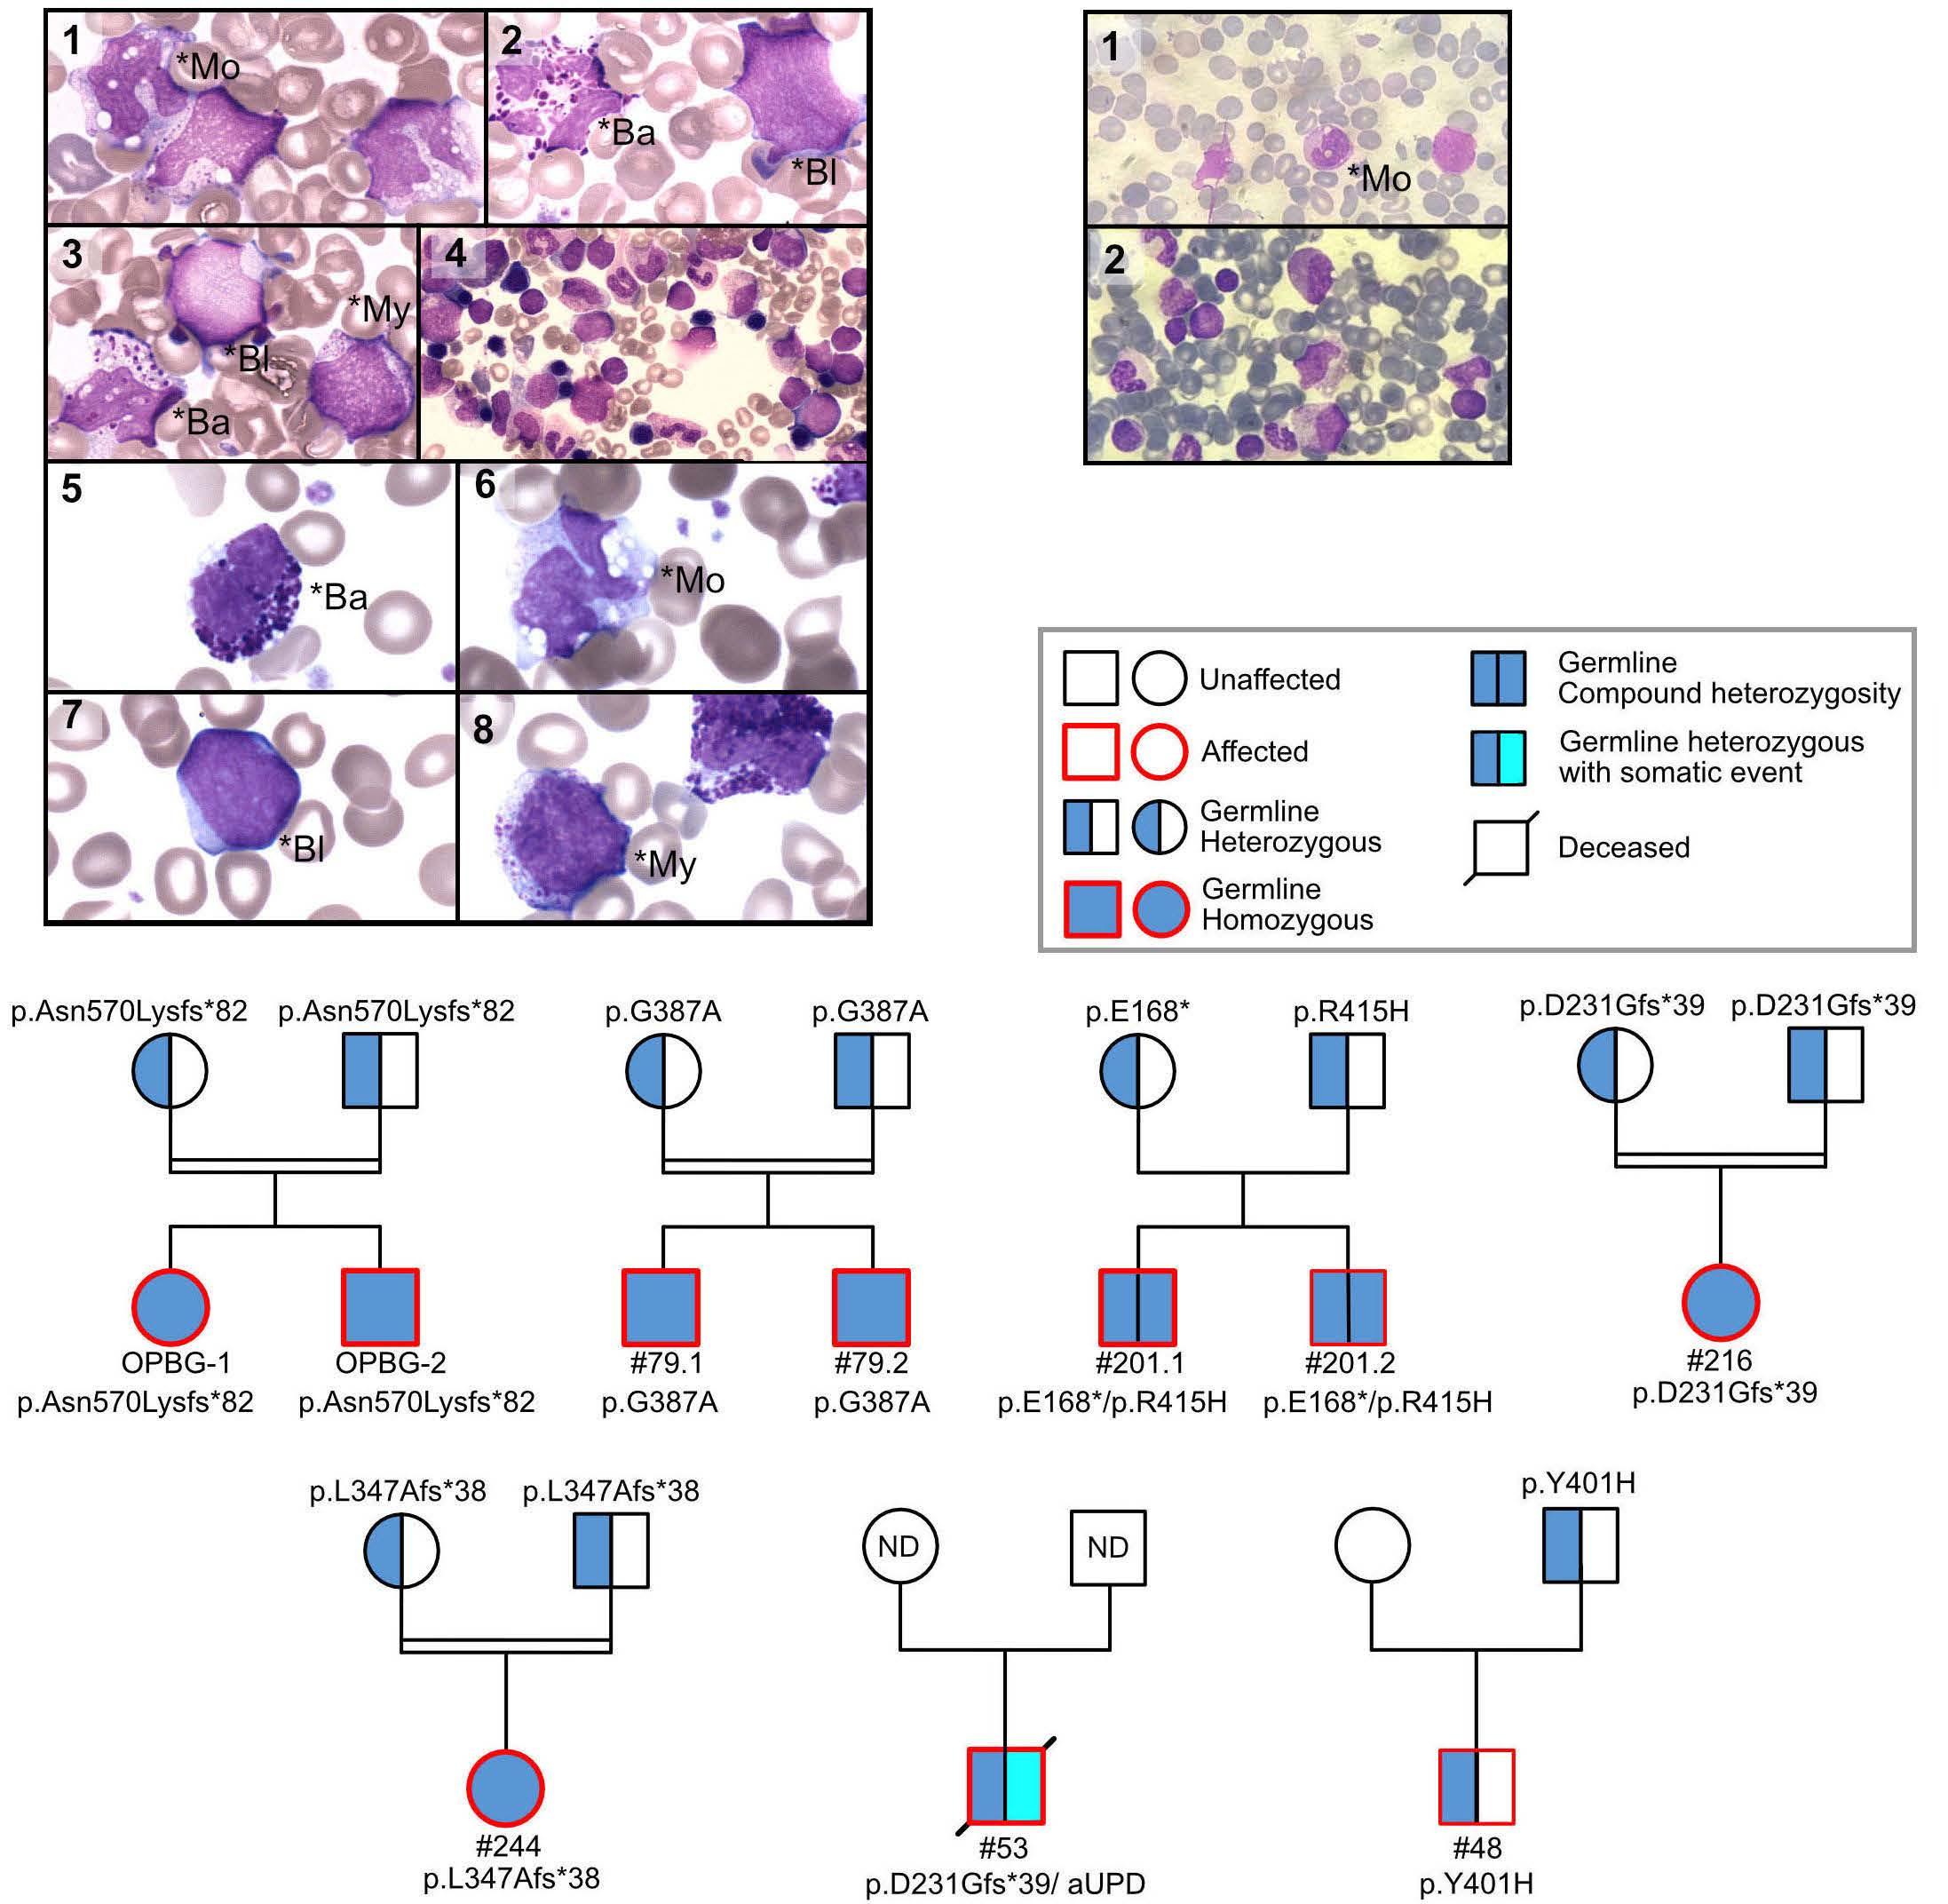
al. performed sequencing studies in two pairs of siblings suspected of having neonatal JMML but lacking RAS pathway mutations, and identified biallelic loss-of-function SH2B3 germline variants. Subsequent targeted sequencing of SH2B3 in a large cohort of consecutive French patients identified eight patients from six families carrying biallelic deleterious SH2B3 alterations. Three of the six families were consanguineous and family studies were consistent with an autosomal recessive inheritance. Wintering et al. report on two additional cases with biallelic germline conditions from North America.8 With the three kindred previously published,3,4 there is now sufficient evidence to recognize a novel genetic condition characterized by biallelic SH2B3 germline alterations. This disorder presents as a MPD in the first few months of life with clinical and hematologic features resembling JMML, normal karyotype, absence of
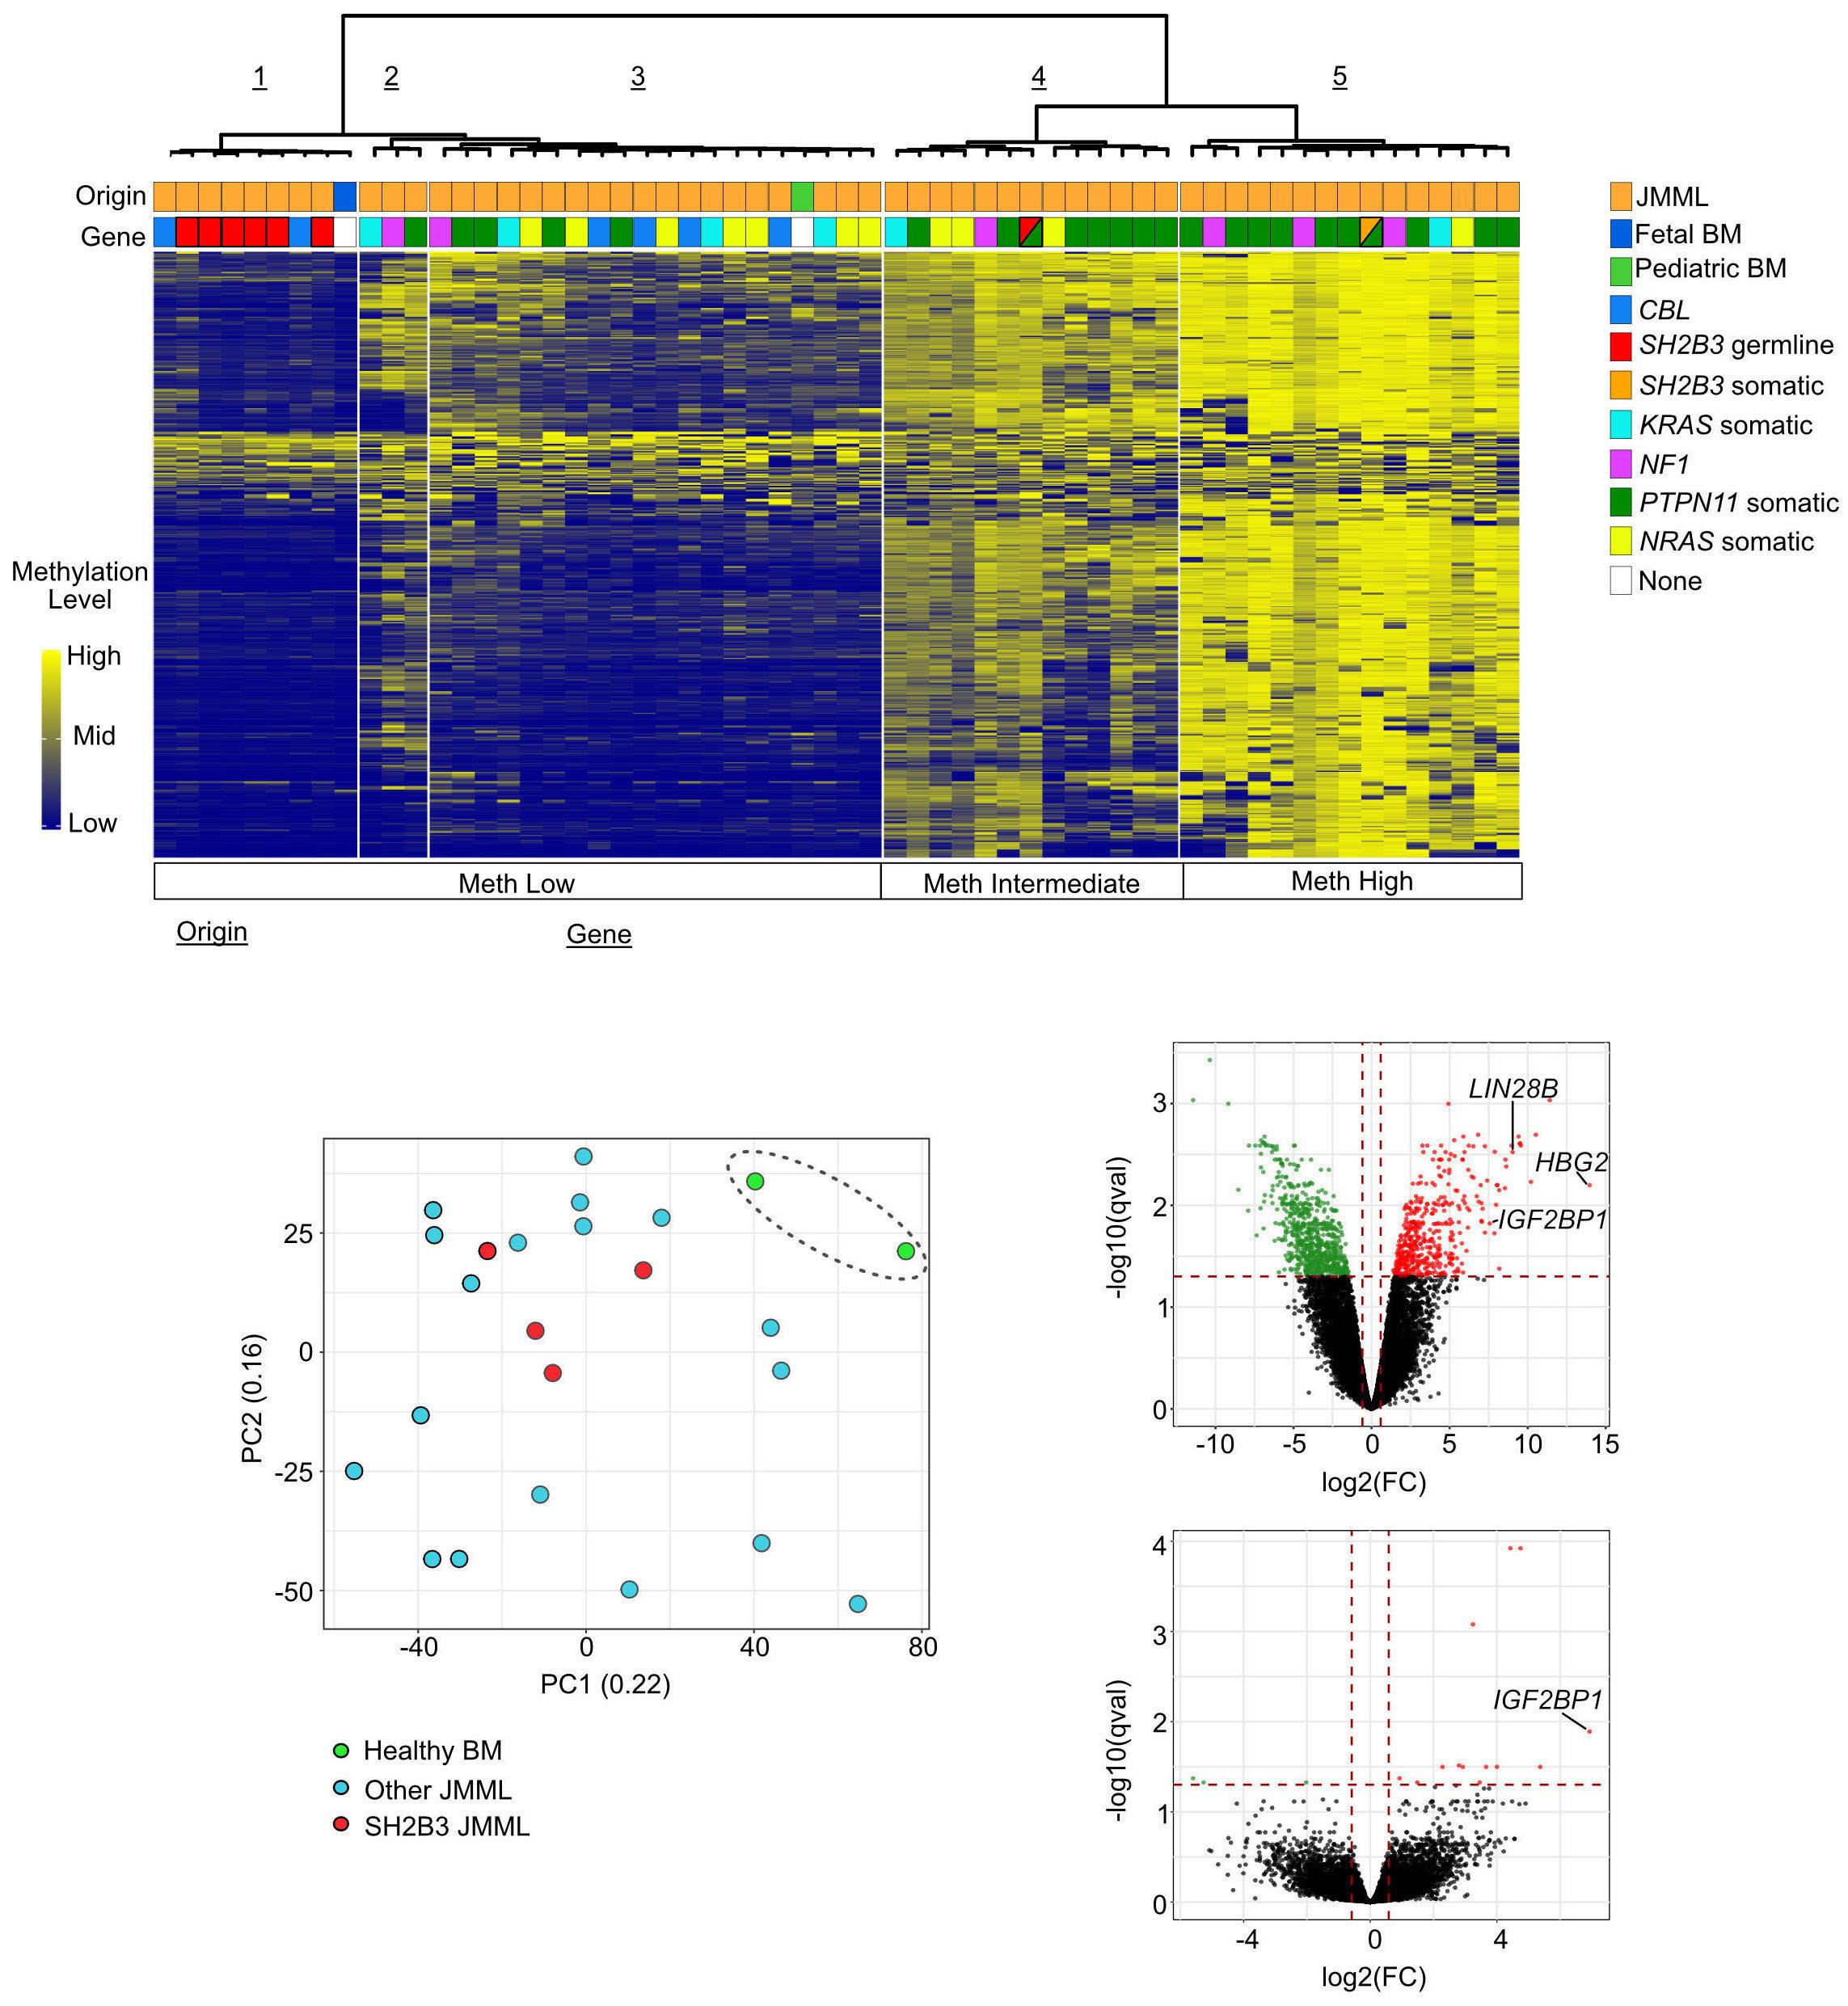
somatic mutations, and a DNA methylation pattern similar to that of fetal bone marrow. Most patients have spontaneous normalization of blood counts, while splenomegaly may persist. Following this initial phase of MPD with thrombocytopenia and a reduced number of megakaryocytes, some patients experience rapid development of megakaryocytic hyperplasia with persistent thrombocytosis.4,7 The molecular mechanism involved in this puzzling evolution is unknown; unraveling its nature may contribute to the understanding of age-specific signaling networks. Interestingly, children with biallelic SH2B3 germline alterations also appear to be at a significant risk of autoimmune diseases, such as autoimmune hypothyroidism and diabetes mellitus, later in life.3,4,7
Like other genetic disorders with MPD features occurring in the neonatal period, the novel biallelic SH2B3 germline
condition presents with transient leukoerythroblastosis, thrombocytopenia and extramedullary hematopoiesis, resembling the hematologic and clinical phenotypes observed in JMML. Thus, it is not surprising that biallelic SH2B3 germline variants accounted for almost half of the French cases suspected of being JMML that remained unresolved on the genetic level.7 Interestingly, two patients in the North American cohort presented at the age of 2 and 4 months with a monoallelic germline SH2B3 germline variant and a variant allele frequency in hematopoietic cells of 63% and 100%, respectively.8 As in biallelic cases, acquired somatic driver mutations were absent. While allogeneic hematopoietic stem cell transplantation was performed in both patients, it is tempting to speculate that monoallelic germline disease with neonatal acquisition of biallelic inactivation in hematopoietic cells may possibly run a clinical course similar to that observed in the biallelic germline disease. The adapter protein LNK lacks catalytic activity. The mechanism by which LNK negatively regulates signaling is not fully understood. LNK can promote degradation of signaling molecules such as JAK2 by recruiting the CBL E3 ubiquitin ligase thereby inactivating its target protein. CBL is one of the canonical RAS pathway genes involved in JMML. CBL deficiency enhances JAK2 signaling and upregulates RAB27B, a GTPase critical for plasma membrane localization and palmitoylation of NRAS.10 With such interplay between the RAS/MAPK and JAK/STAT signaling pathways, the presence of secondary SH2B3 mutations in patients with JMML is unsurprising. Somatic SH2B3 alterations are seen in high-risk JMML cases and are generally accompanied by other subclonal mutations; in a genetic mouse model, they have been shown to exacerbate disease severity.11 Of note, in both the French and North American cohorts, the presentation and clinical course in older children with monoallelic pathogenic SH2B3 germline variants were not different from those noted in JMML patients with somatic SH2B3 mutations.7,8 This observation is consistent with findings in MPN in adults suggesting that SH2B3 mutations, whether germline or acquired, can cooperate with acquired driver mutations in JAK2, CALR, or MPL to determine the MPN disease phenotype.12 Interestingly, both monoallelic germline disease in older children and somatic SH2B3 mutations were associated with somatic PTPN11 driver mutations.7,8 In two patients of the French cohort, acquired chromosome 12q uniparental disomy developed, resulting in copy-neutral loss of heterozygosity of both the PTPN11 and SH2B3 genes.7
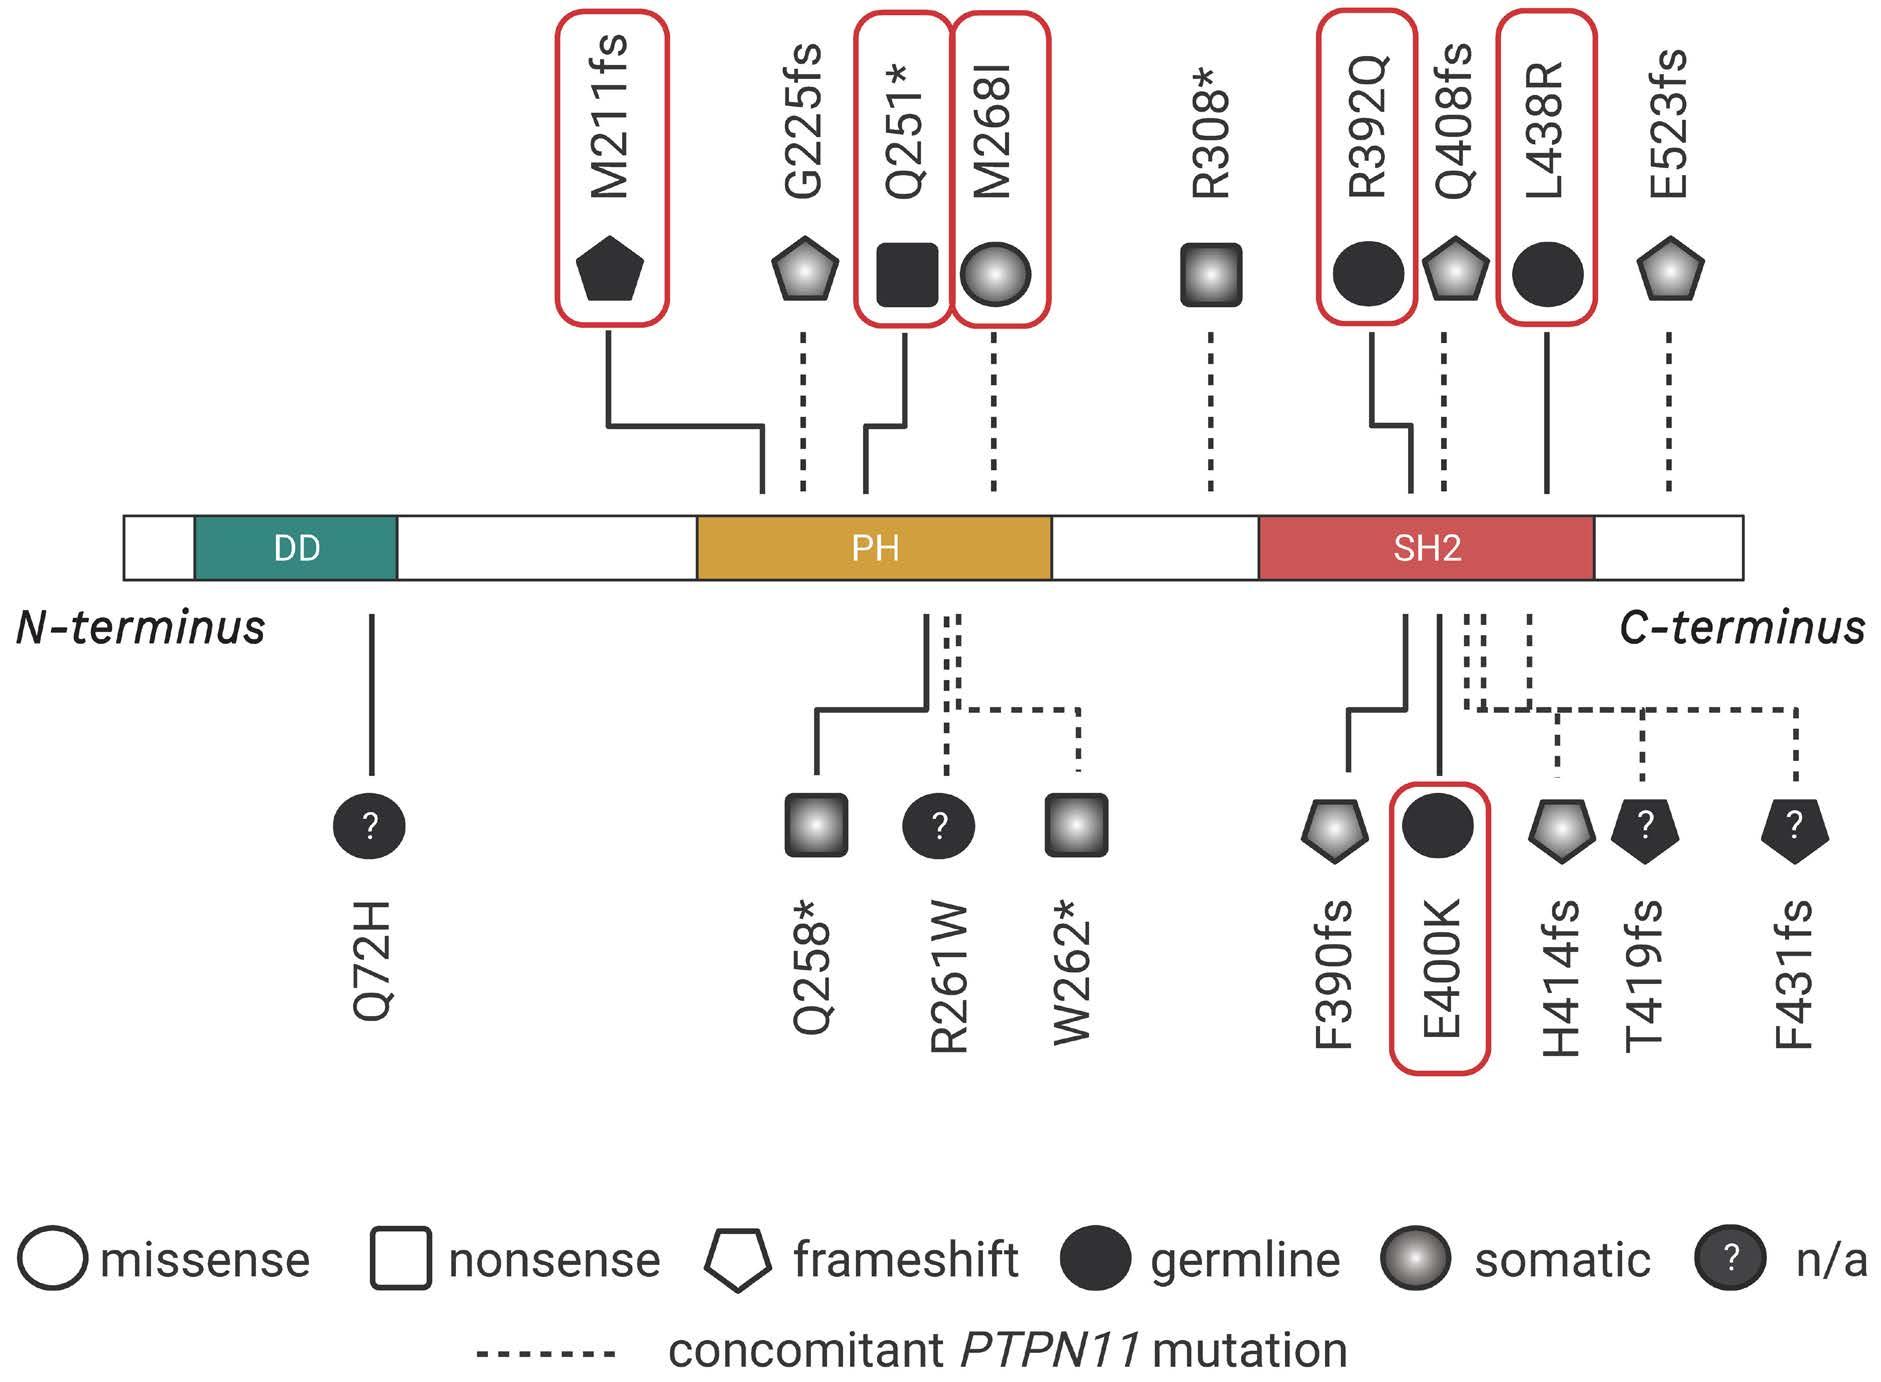
The SH2B3 variants described were missense, nonsense or frameshift and were distributed throughout the gene clustering in the PH and SH2 domains that are essential for LNK function. Modeling a frameshift variant of a gene from a patient with a biallelic germline condition in zebrafish with CRISPR-Cas9 gene editing, Blomberg et al. demonstrated that treatment of the sh2b3 crispant
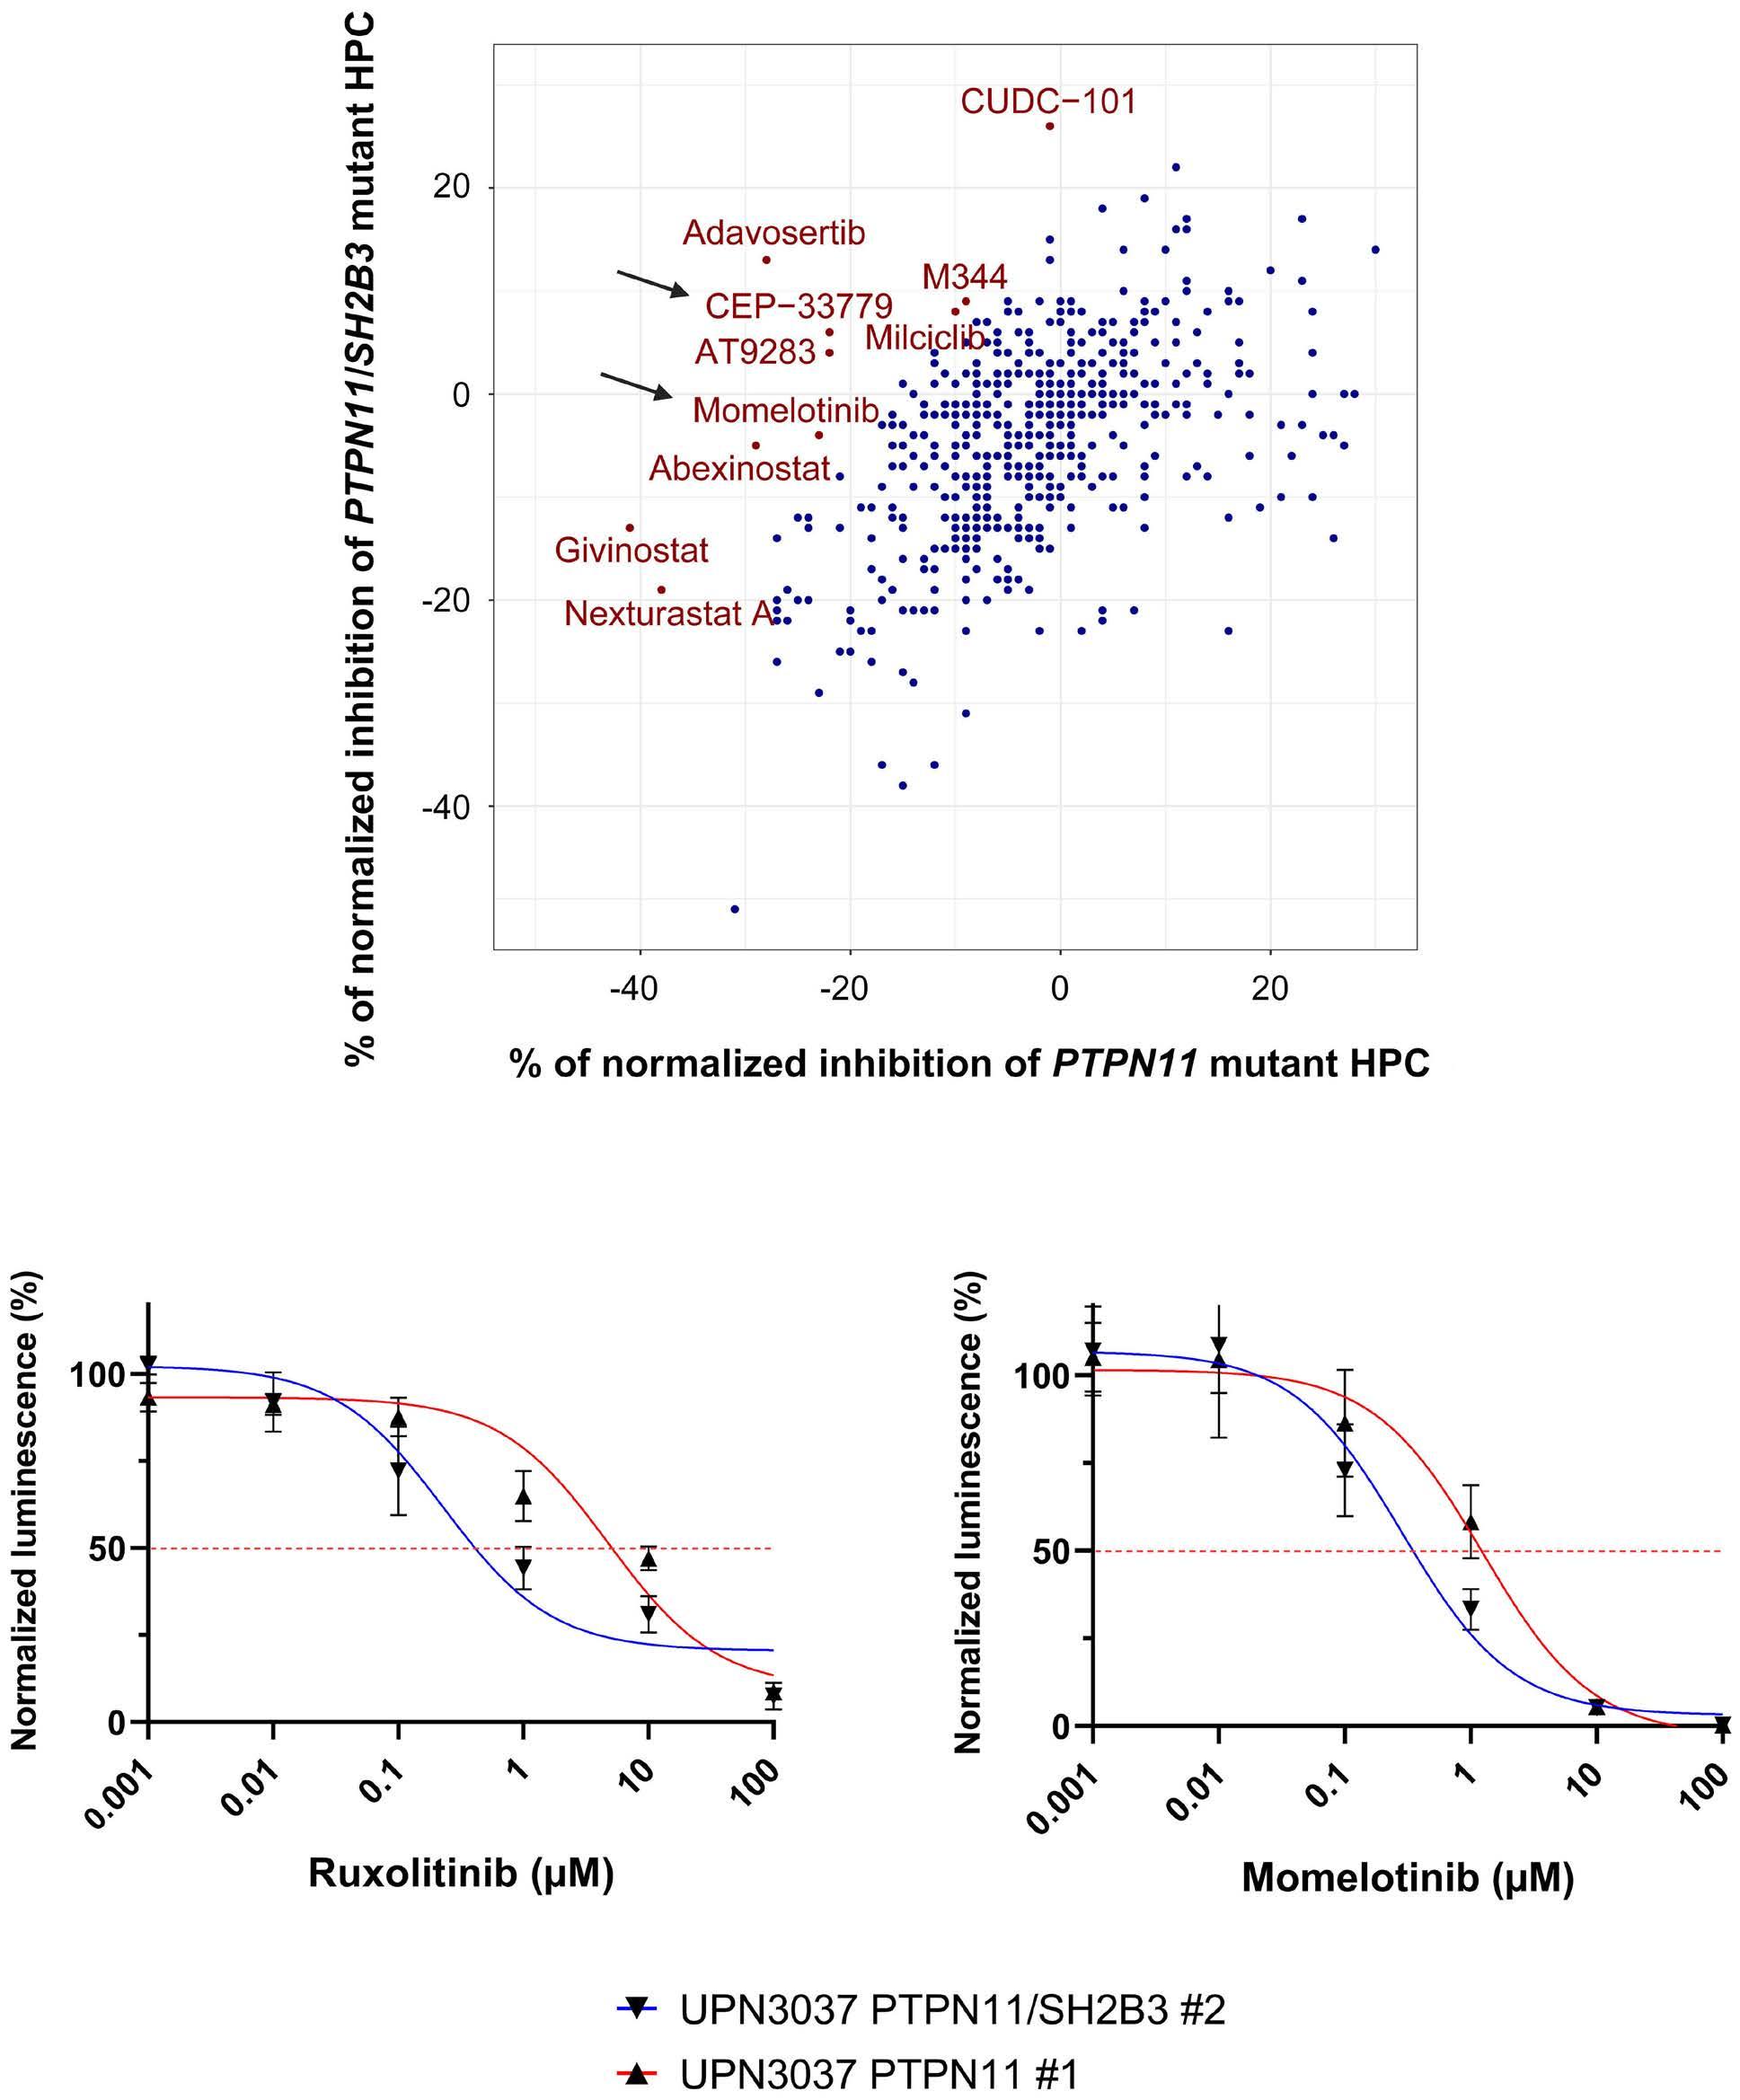
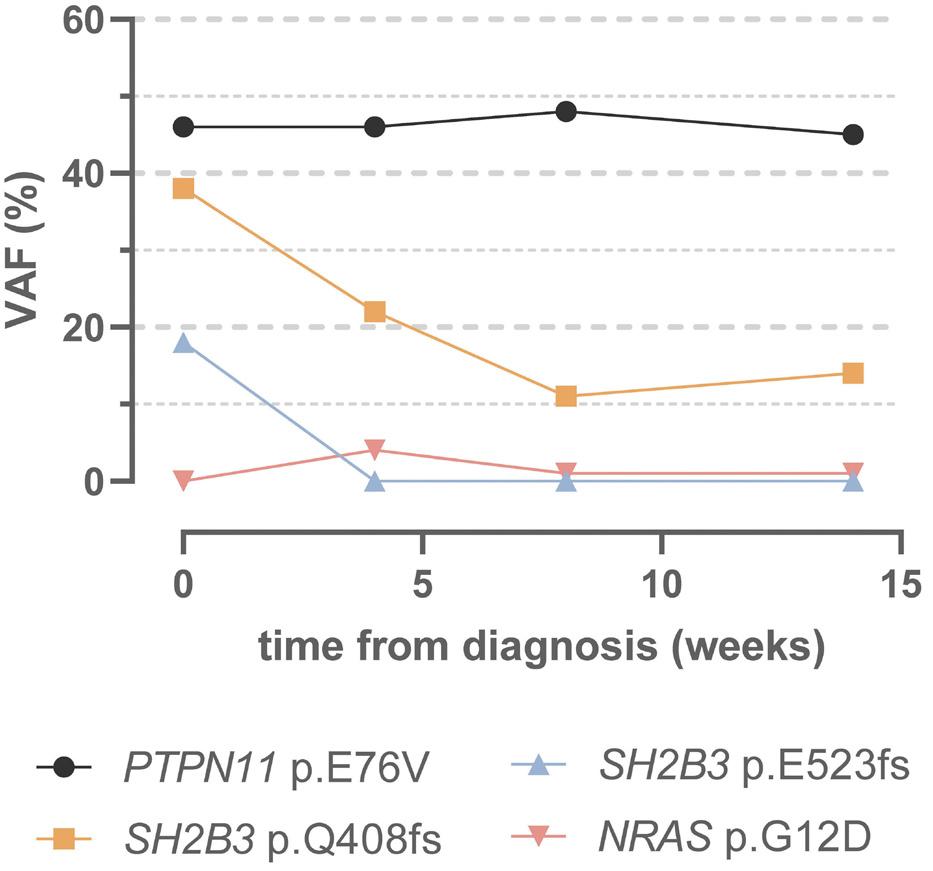
fish with the JAK inhibitor ruxolitinib could prevent the myeloproliferative phenotype.4 In this edition of Haematologica , Wintering et al. expanded the drug discovery screening methodology by using induced pluripotent stem cell-derived JMML-like hematopoietic progenitor cells (HPC). With this approach, they showed that HPC with alterations in SH2B3 were more sensitive to JAK1/2 inhibition compared to HPC not harboring mutations in SH2B3. 8 Therapy of two children with ruxolinitib led to resolution of splenomegaly in both patients. In one patient with two secondary SH2B3 mutations, the variant allele frequency of both SH2B3 variants decreased, while the size of the PTPN11-mutated clone remained unchanged and a new NRAS mutation became detectable. In the other patient with monoallelic SH2B3 germline disease and copy neutral loss of heterozygosity in hematopoietic cells, the variant allele frequency of the SH2B3 mutation remained at 100%.8
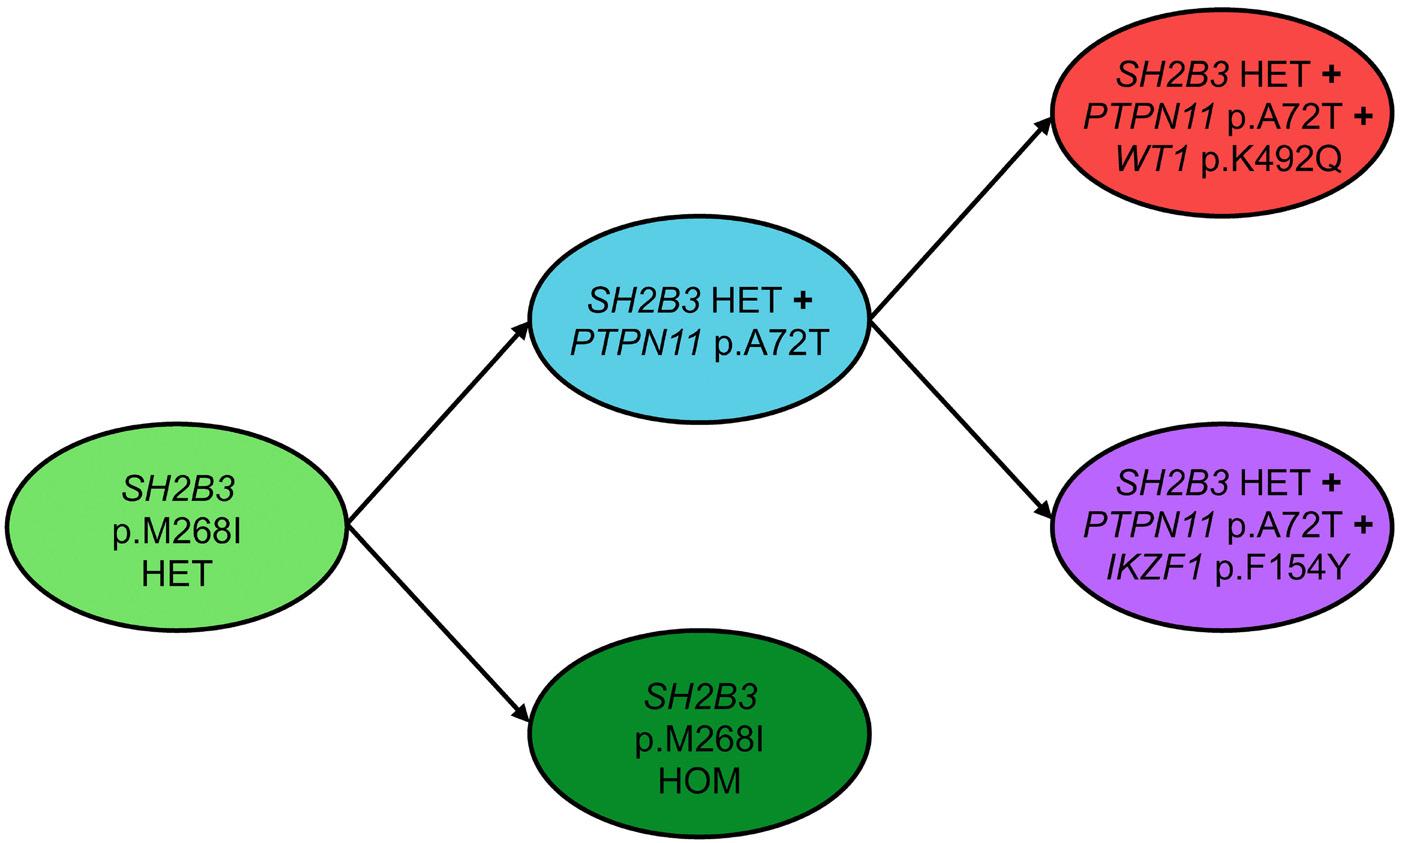
Similar to what has been reported for JAK2V617F-positive MPN,13 clonal hierarchy in cases of JMML with SH2B3 alteration is complex. SH2B3 mutations can be acquired early or late during the course of clonal evolution and are not mutually exclusive to mutations in the known canonical RAS pathway driver mutations. Multiple SH2B3 mutations in trans can arise independently, suggesting that both SH2B3 alleles are vulnerable to functionally relevant mutations. Arfeuille et al. report on difficulties in determining which lesion was the initiating driver.7 Single-cell sequencing performed by Wintering et al. revealed a heterozygous somatic SH2B3 mutation branching into a PTPN11-mutated population and a homozygous SH2B3 population.8 Little is known about clonal hematopoiesis in children, but it is conceivable that the PTPN11-driver mutation occurred on the background of pre-existing somatic mosaicism. Further insight into the regulatory function of LNK in intracellular signaling will help to decipher its role in the pathogenesis of hematologic malignancies. There is currently little evidence that SH2B3 alterations act as classical driver mutations in MPN or JMML, although their role in the phylogenetic origin of these myeloproliferative disorders remains puzzling. Biallelic SH2B3 germline disease needs to be added to the list of heterogeneous rare genetic conditions presenting as transient MPD in newborns or young infants. Whether the possible subsequent development of thrombocytosis involves an impending risk for neoplasia later in life is one of the questions suitable for a larger cohort study on individuals with SH2B3 germline disease.
Disclosures
No conflicts of interest to disclose.
Contributions
CMN and ME designed the outline of the editorial. CMN wrote the manuscript.
References
1. Roberts I. Leukemogenesis in infants and young children with trisomy 21. Hematology Am Soc Hematol Educ Program. 2022;2022(1):1-8.
2. Niemeyer CM. RAS diseases in children. Haematologica. 2014;99(11):1653-1662.
3. Perez-Garcia A, Ambesi-Impiombato A, Hadler M, et al. Genetic loss of SH2B3 in acute lymphoblastic leukemia. Blood. 2013;122(14):2425-2432.
4 Blombery P, Pazhakh V, Albuquerque AS, et al. Biallelic deleterious germline SH2B3 variants cause a novel syndrome of myeloproliferation and multi-organ autoimmunity. EJHaem. 2023;4(2):463-469.
5. Morris R, Butler L, Perkins A, Kershaw NJ, Babon JJ. The role of LNK (SH2B3) in the regulation of JAK-STAT signalling in haematopoiesis. Pharmaceuticals (Basel). 2021;15(1):24.
6. Gery S, Cao Q, Gueller S, Xing H, Tefferi A, Koeffler HP. Lnk inhibits myeloproliferative disorder-associated JAK2 mutant, JAK2V617F. J Leukoc Biol. 2009;85(6):957-965.
7 Arfeuille C, Vial Y, Cadenet M, et al. Germline bi-allelic SH2B3/ LNK alteration predisposes to a neonatal juvenile
8. Wintering A, Hecht A, Meyer J, et al. LNK/SH2B3 as a novel driver in juvenile myelomonocytic leukemia. Haematologica. 2024;109(8):2533-2541.
9 Niemeyer CM, Flotho C. Juvenile myelomonocytic leukemia: who’s the driver at the wheel? Blood. 2019;133(10):1060-1070.
10. Ren JG, Xing B, Lv K, et al. RAB27B controls palmitoylationdependent NRAS trafficking and signaling in myeloid leukemia. J Clin Invest. 2023;133(12):e165510.
11. Morales CE, Stieglitz E, Kogan SC, Loh ML, Braun BS. Nf1 and Sh2b3 mutations cooperate in vivo in a mouse model of juvenile myelomonocytic leukemia. Blood Adv. 2021;5(18):3587-3591.
12. Rumi E, Cazzola M. Advances in understanding the pathogenesis of familial myeloproliferative neoplasms. Br J Haematol. 2017;178(5):689-698.
13. Lasho TL, Tefferi A, Finke C, Pardanani A. Clonal hierarchy and allelic mutation segregation in a myelofibrosis patient with two distinct LNK mutations. Leukemia. 2011;25(6):1056-1058.
More is not always better, sometimes it is just more
Antonio Salar Silvestre
Lymphoma Unit, Department of Hematology, Hospital Clínico Universitario
In this issue of Haematologica, Stathis et al.1 report on the results of an international phase II study of chlorambucil and subcutaneous (SC) rituximab as first-line systemic treatment in extranodal marginal zone lymphomas of mucosa-associated lymphoid tissue (MALT) lymphomas. The authors conclude that, although induction with chlorambucil and SC rituximab is safe, it does not improve responses, even if the addition of maintenance with SC rituximab can prolong long-term disease control.
MALT lymphomas are considered indolent lymphomas, but recently published studies have confirmed that they have a modest but statistically significant negative impact on life expectancy.2 MALT lymphoma-specific mortality is typically very low in patients with cutaneous (now recognized as primary cutaneous marginal zone lymphoproliferative disorder in the International Consensus Classification)3 or localized gastric involvement. However, non-gastric MALT lymphomas and those with stage II-IV are associated with a higher risk of lymphoma-related mortality. Therefore, the treatment of MALT lymphoma deserves further investigation through well-designed clinical trials.
Despite the improved response rates achieved with firstline rituximab-containing regimens in MALT lymphoma, relapses still persist once the treatment is completed. For improving outcome, one strategy could be to deepen the intensity of the response with the potential elimination of residual disease through more active immunochemotherapies; another could be to control potential residual lymphoma cells by extending treatment over time with the use of maintenance therapy once a response has been achieved with prior induction therapy.
The IELSG38 is the first prospective clinical trial which specifically assessed the use of SC rituximab in MALT lymphomas. The SPARKTHERA and SABRINA trials have demonstrated that a fixed dose of 1,400 mg of SC rituximab has non-inferior pharmacokinetics and efficacy in follicular lymphoma to BSA-adjusted intravenous (IV) rituximab. Additionally, a more efficient delivery of rituximab results in greater patient satisfaction and is also time-saving for
Correspondence: A. Salar Silvestre antonio.salar2@carm.es
Received: February 7, 2024. Accepted: March 20, 2024. Early view: March 28, 2024.
them.4,5 Unfortunately, the IELSG38 trial has showed that chlorambucil plus SC rituximab did not improve the complete remission (CR) rate at end of induction (57%), which was the primary end-point, in comparison with previously observed results in the IELSG19 trial (63.4% with chlorambucil, 78.8% with chlorambucil plus IV rituximab) (Table 1).6 Reasons that might have contributed to this are the slightly greater risk in the IELSG38 patients, despite identical inclusion criteria as in the IELSG19, as well as the utilization of updated response definitions in the IELSG38. Regarding this last point, in the MALT lymphoma cohort of the GALLIUM trial,7 the CR rate with rituximab-chemotherapy was very different when evaluated by computed tomography (17.7%) compared to when positron emission tomography was used (59.4%). In any case, as the authors mentioned, selection of this primary outcome was a serious weakness. Similarly to the IELSG19, the CR rates at six months in the IELSG38 with chlorambucil plus SC rituximab differed remarkably between patients with gastric (84%) versus non-gastric (46%) MALT lymphomas. Although overall CR rates progressively improved with SC rituximab maintenance (70% at end of SC rituximab maintenance), this improvement was more relevant in patients with non-gastric MALT. Furthermore, it must be taken into account that there is great disparity in access to SC rituximab across different countries and centers. If we consider that switching from IV to SC rituximab was associated with non-inferior results regarding response or survival, it is reasonable to infer that switching from SC to IV maintenance will result in similar outcomes and might be an option for those centers where there is no access to SC rituximab.
More is not always better. But is the opposite true? In the phase II MALT2008-01 trial,8 CR rates achieved with bendamustine and IV rituximab (BR) were >95% at end of therapy, and the high efficacy of this regimen in MALT lymphomas has been confirmed by an international retrospective study including 237 patients, with a CR >80% (Table 1).9 Comparisons between these 2 studies and others, including the IELSG38, should be made with caution. But, in any case,
Virgen de la Arrixaca, Murcia, Spain
Table 1. First-line chemoimmunotherapies for mucosa-associated lymphoid tissue lymphomas.
Author,
Zucca et al., 20176 III
Salar et al., 20178
Alderuccio et al., 20229
Stathis et al., 20241
Chlorambucil/ rituximab** plus rituximab maintenance**
6 cycles of BR (i.e., 6 months of treatment) provide CR rates >80%, without observing any differences between gastric and non-gastric MALT. And to top it off, in those rapid responders, only 4 cycles of BR might be enough, thus limiting duration of treatment to only four months. The complete IELSG38 treatment program (i.e., induction plus 2 years of maintenance) provides a 5-year eventfree survival and progression-free survival (PFS) of 84% and 87%, respectively, which are both superior to those achieved in the IELSG19. It may be worth noting that more is better in the IELSG38, at least in terms of the quality of response and PFS. Patients achieving CR had more prolonged remissions and, considering the different 5-year PFS, SC rituximab maintenance may be particularly useful for patients in partial response (PR), regardless of the initial site of disease. Finally, the authors addressed the essential question of safety. In the GALLIUM study, rituximab / obinutuzumab with chemotherapy (CVP, CHOP or bendamustine) followed by rituximab / obinutuzumab maintenance for two years was associated with a higher toxicity rate than expected. In the IELSG19 trial, patients treated with the combination arm showed higher hematologic toxicities than those treated with chlorambucil or rituximab alone. As expected, hematologic toxicity was frequent in the IELSG38 trial, but not unexpected safety signals were observed during induction or maintenance. Overall, the treatment was well-tolerated. In the near future, other ongoing molecules under investigation, such as both covalent and non-covalent Bruton’s tyrosine kinase inhibitors, with activity in relapsed MALT lymphoma must be brought forward to the first line. In fact, the ongoing IELSG47/MALIBU phase II trial is exploring efficacy and safety of rituximab plus ibrutinib in untreated marginal zone lymphoma. Nonetheless, the
eagerly awaited results in MALT lymphomas are yet to be presented. Additional therapies with bispecific anti-CD20xCD3 antibodies and chimeric antigen receptor (CAR) T-cell therapy for relapsed disease represent new strategies to reach the ultimate goal of increasing the rate of cure for patients with intermediate or high-risk MALT lymphomas. In my view, chemotherapy plus rituximab remains the standard first-line approach for symptomatic MALT lymphomas requiring systemic treatment. Bendamustine as a chemotherapy backbone achieves fast and deep responses which provide prolonged PFS, although no impact on OS has yet been demonstrated. Bendamustine-containing regimens should be used with caution, not only because T-cell depletion increases the risk of infection (especially in elderly patients or in those with comorbidities), but also because it could have some impact on the few MALT lymphoma patients who may require subsequent therapies mediated by T cells, such as CAR T cells or bispecific monoclonal antibodies. Furthermore, for elderly or less fit patients, chlorambucil plus rituximab might be a sensible option, with SC rituximab maintenance in those not achieving CR with the induction. For frail or unfit patients, either monotherapy with rituximab or chlorambucil are adequate options, considering that OS is not statistically affected. Finally, I would like to acknowledge the IELSG for this major international effort due to the rarity of the disease. International networks and close collaborations are crucial to further improve treatment strategies for MALT lymphoma patients.
Disclosures
AS has received honoraria from Beigene, Incyte, Ipsen and Roche. These relationships do not raise any conflicts of interest regarding the published work.
References
1. Stathis A, Pirosa MC, Orsucci L, et al. IELSG38: phase 2 trial of frontline chlorambucil plus subcutaneous rituximab induction and maintenance in MALT lymphoma. Haematologica. 2024;109(8):2564-2573.
2. Cerhan JR, Habermann TM. Epidemiology of marginal zone lymphoma. Ann Lymphoma. 2021;5:1.
3. Campo E, Jaffe ES, Cook JR, et al. The International Consensus Classification of Mature Lymphoid Neoplasms: a report from the Clinical Advisory Committee. Blood. 2022;140(11):1229-1253.
4 Salar A, Avivi I, Bittner B, et al. Comparison of subcutaneous versus intravenous administration of rituximab as maintenance treatment for follicular lymphoma: results from a two-stage, phase IB study. J Clin Oncol. 2014;32(17):1782-1791.
5. Davies A, Merli F, Mihaljevic B, et al. Pharmacokinetics and safety of subcutaneous rituximab in follicular lymphoma (SABRINA): stage 1 analysis of a randomised phase 3 study. Lancet Oncol. 2014;15(3):343-352.
6. Zucca E, Conconi A, Martinelli G, et al. Final results of the
IELSG-19 randomized trial of mucosa-associated lymphoid tissue lymphoma: improved event-free and progression-free survival with rituximab plus chlorambucil versus either chlorambucil or rituximab monotherapy. J Clin Oncol. 2017;35(17):1905-1912.
7 Herold M, Hoster E, Janssens A, et al. Immunochemotherapy and maintenance with obinutuzumab or rituximab in patients with previously untreated marginal zone lymphoma in the randomized GALLIUM Trial. Hemasphere. 2022;6(3):E699.
8. Salar A, Domingo-Domenech E, Panizo C, et al. Long-term results of a phase 2 study of rituximab and bendamustine for mucosa-associated lymphoid tissue lymphoma. Blood. 2017;130(15):1772-1774.
9 Alderuccio JP, Arcaini L, Watkins MP, et al. An international analysis evaluating frontline bendamustine with rituximab in extranodal marginal zone lymphoma. Blood Adv. 2022;6(7):2035-2044.
Beyond adenosine triphosphate: unveiling the pleiotropic effects of pyruvate kinase activation in sickle cell anemia
Andreas Glenthøj
Danish Red Blood Cell Center, Department of Hematology, Copenhagen University Hospital - Rigshospitalet, Copenhagen, Denmark
Correspondence: A. Glenthøj andreas.glenthoej@regionh.dk
Received: March 27, 2024.
Accepted: April 8, 2024. Early view: April 18, 2024.
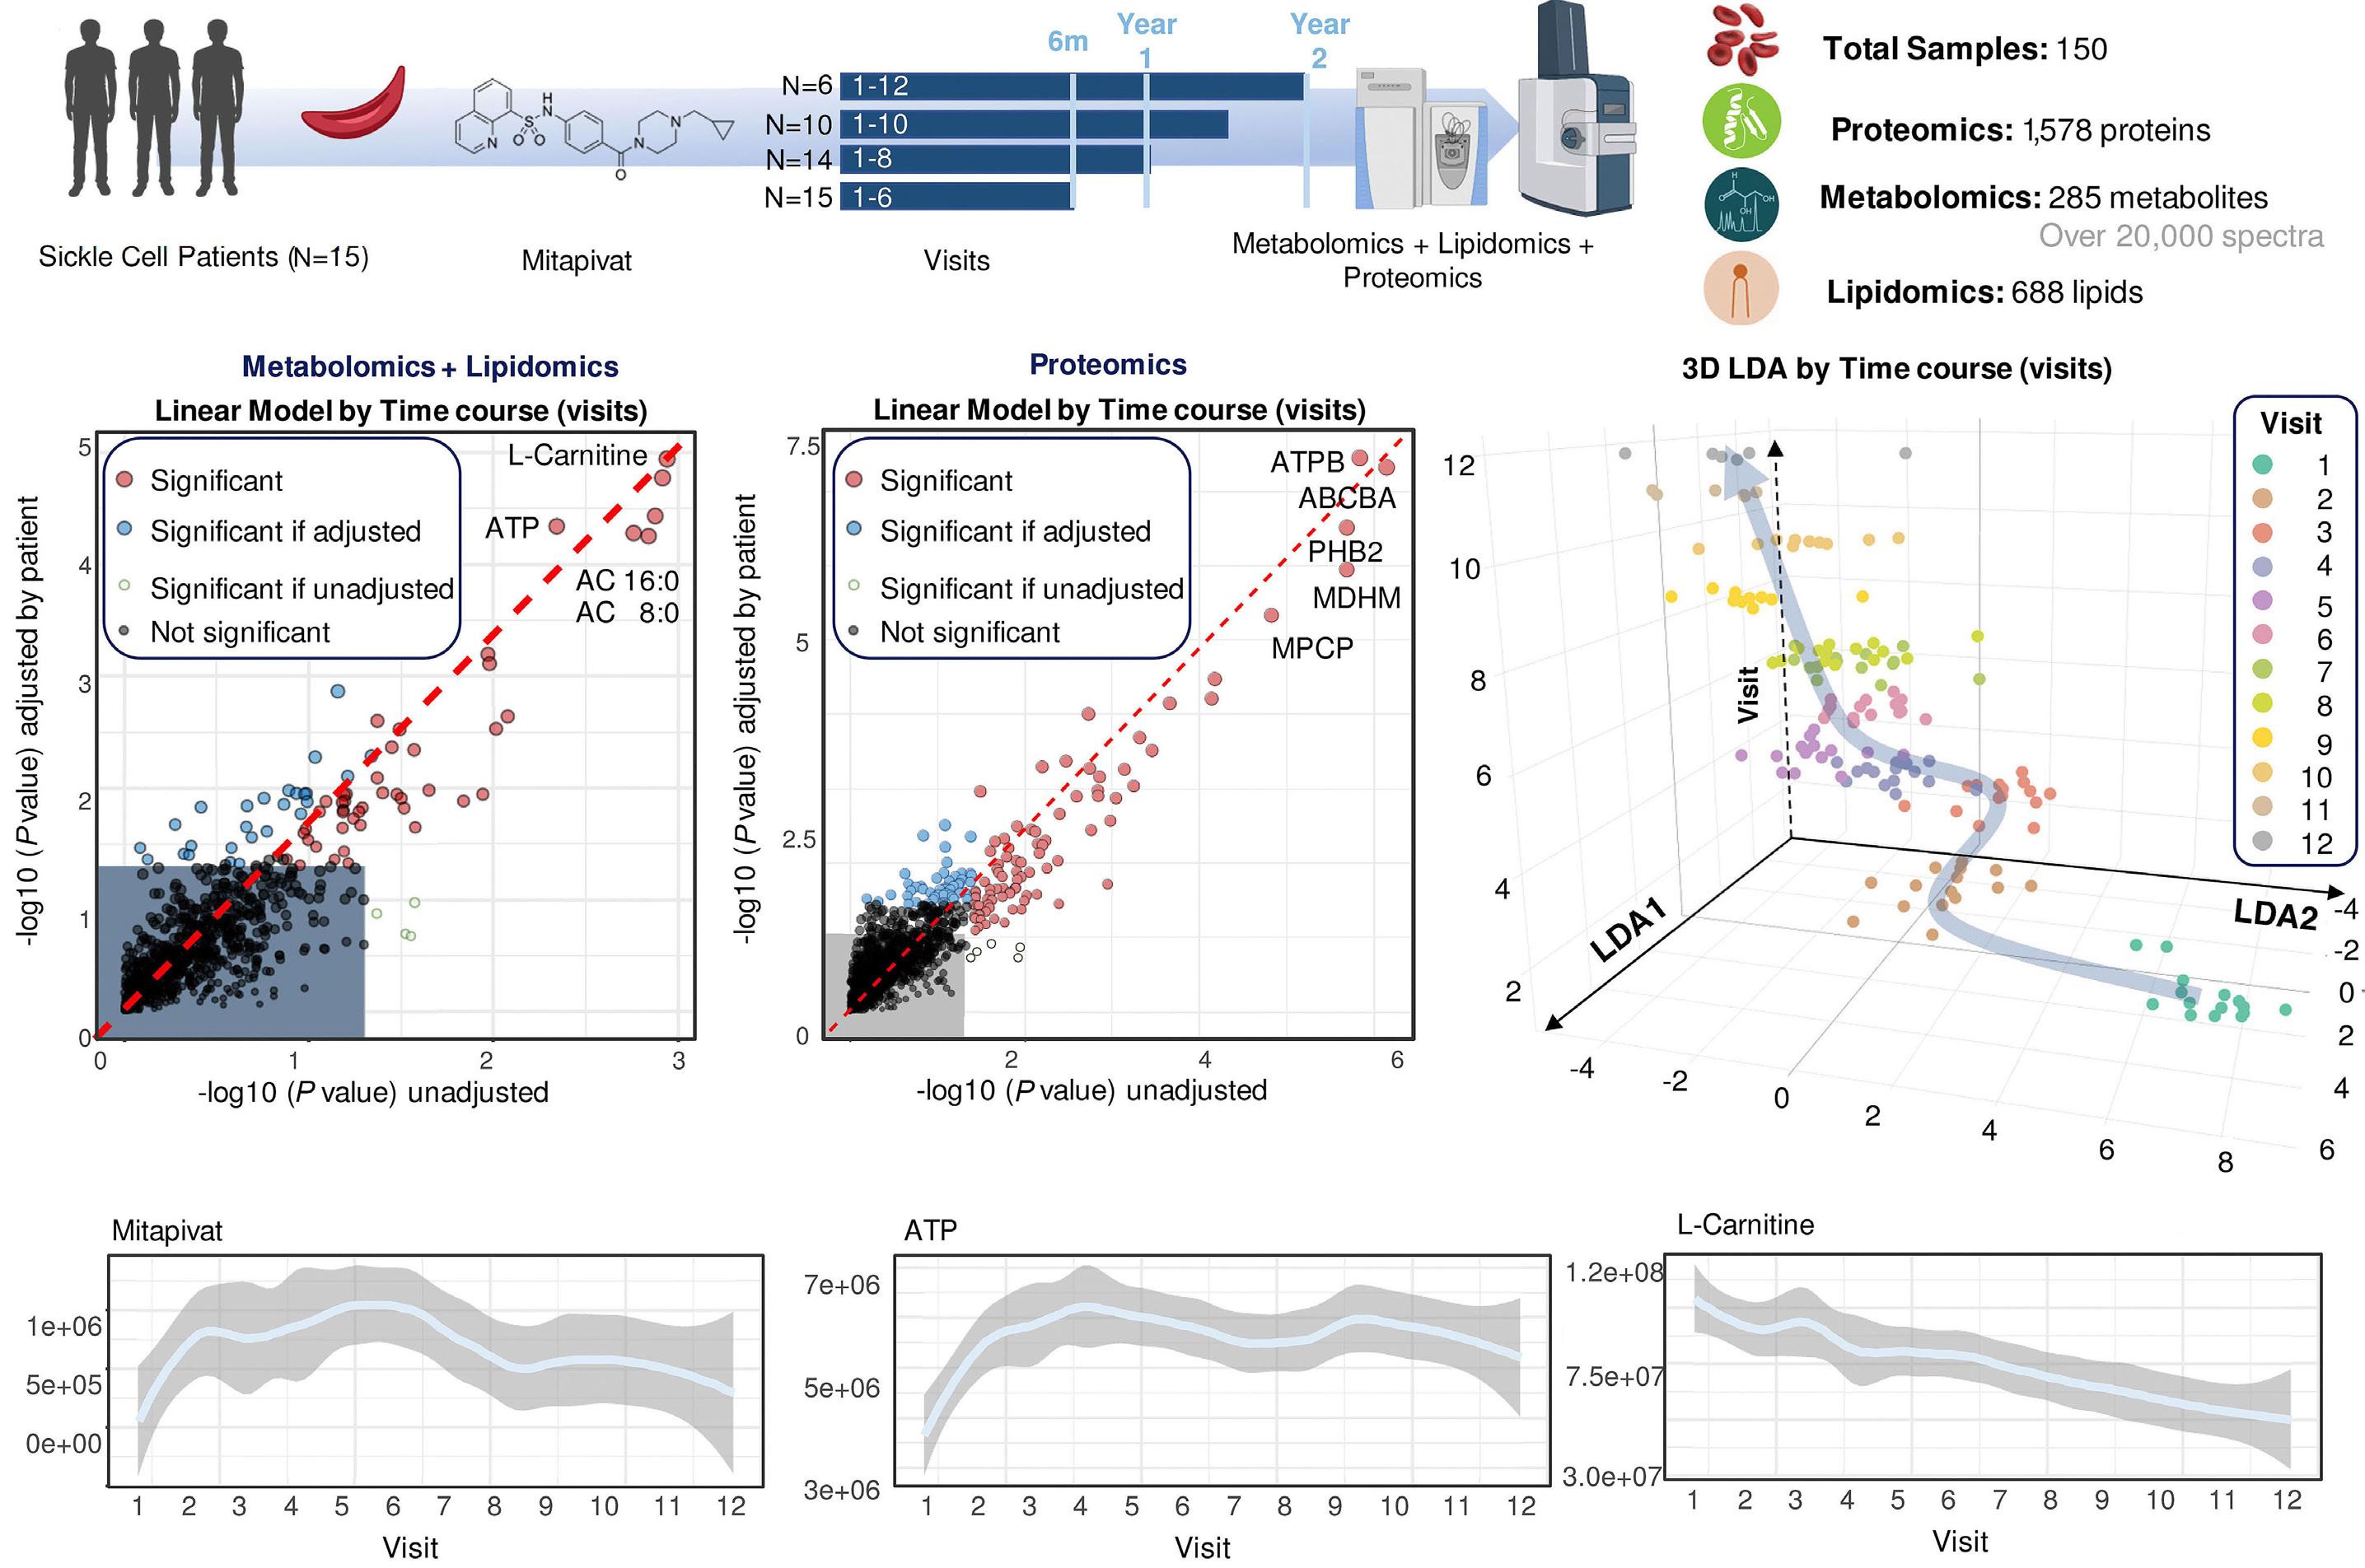
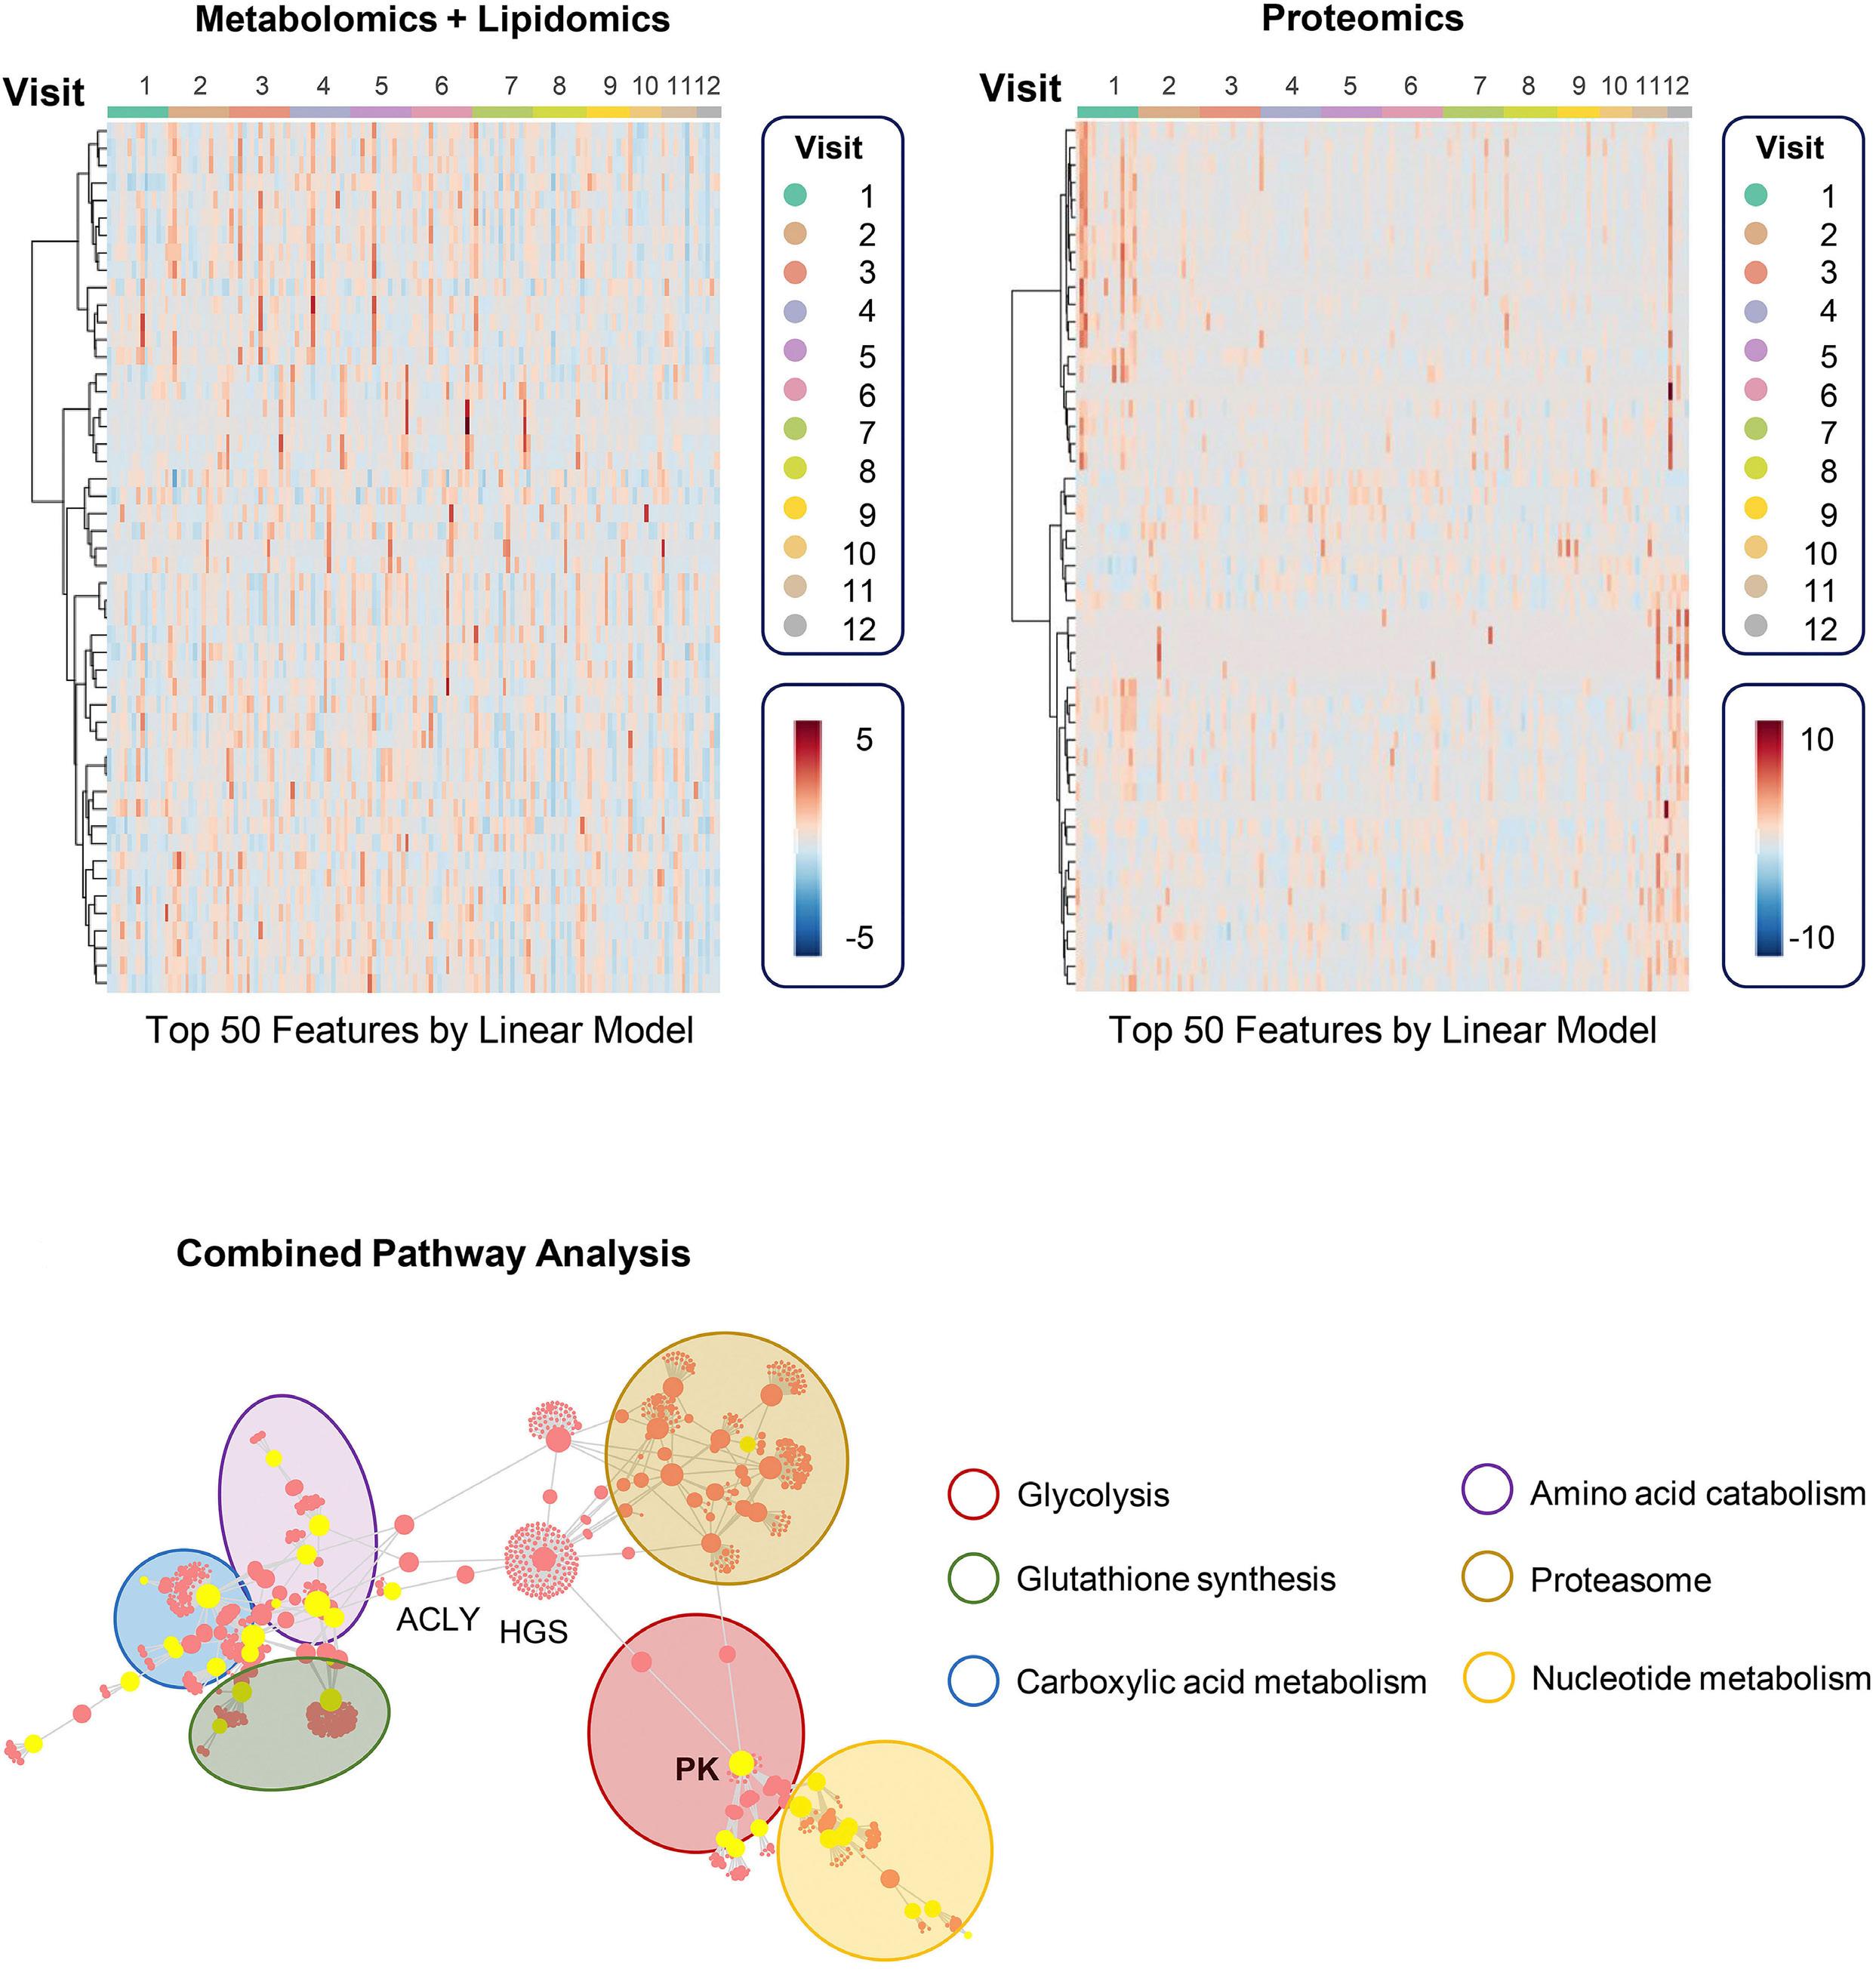
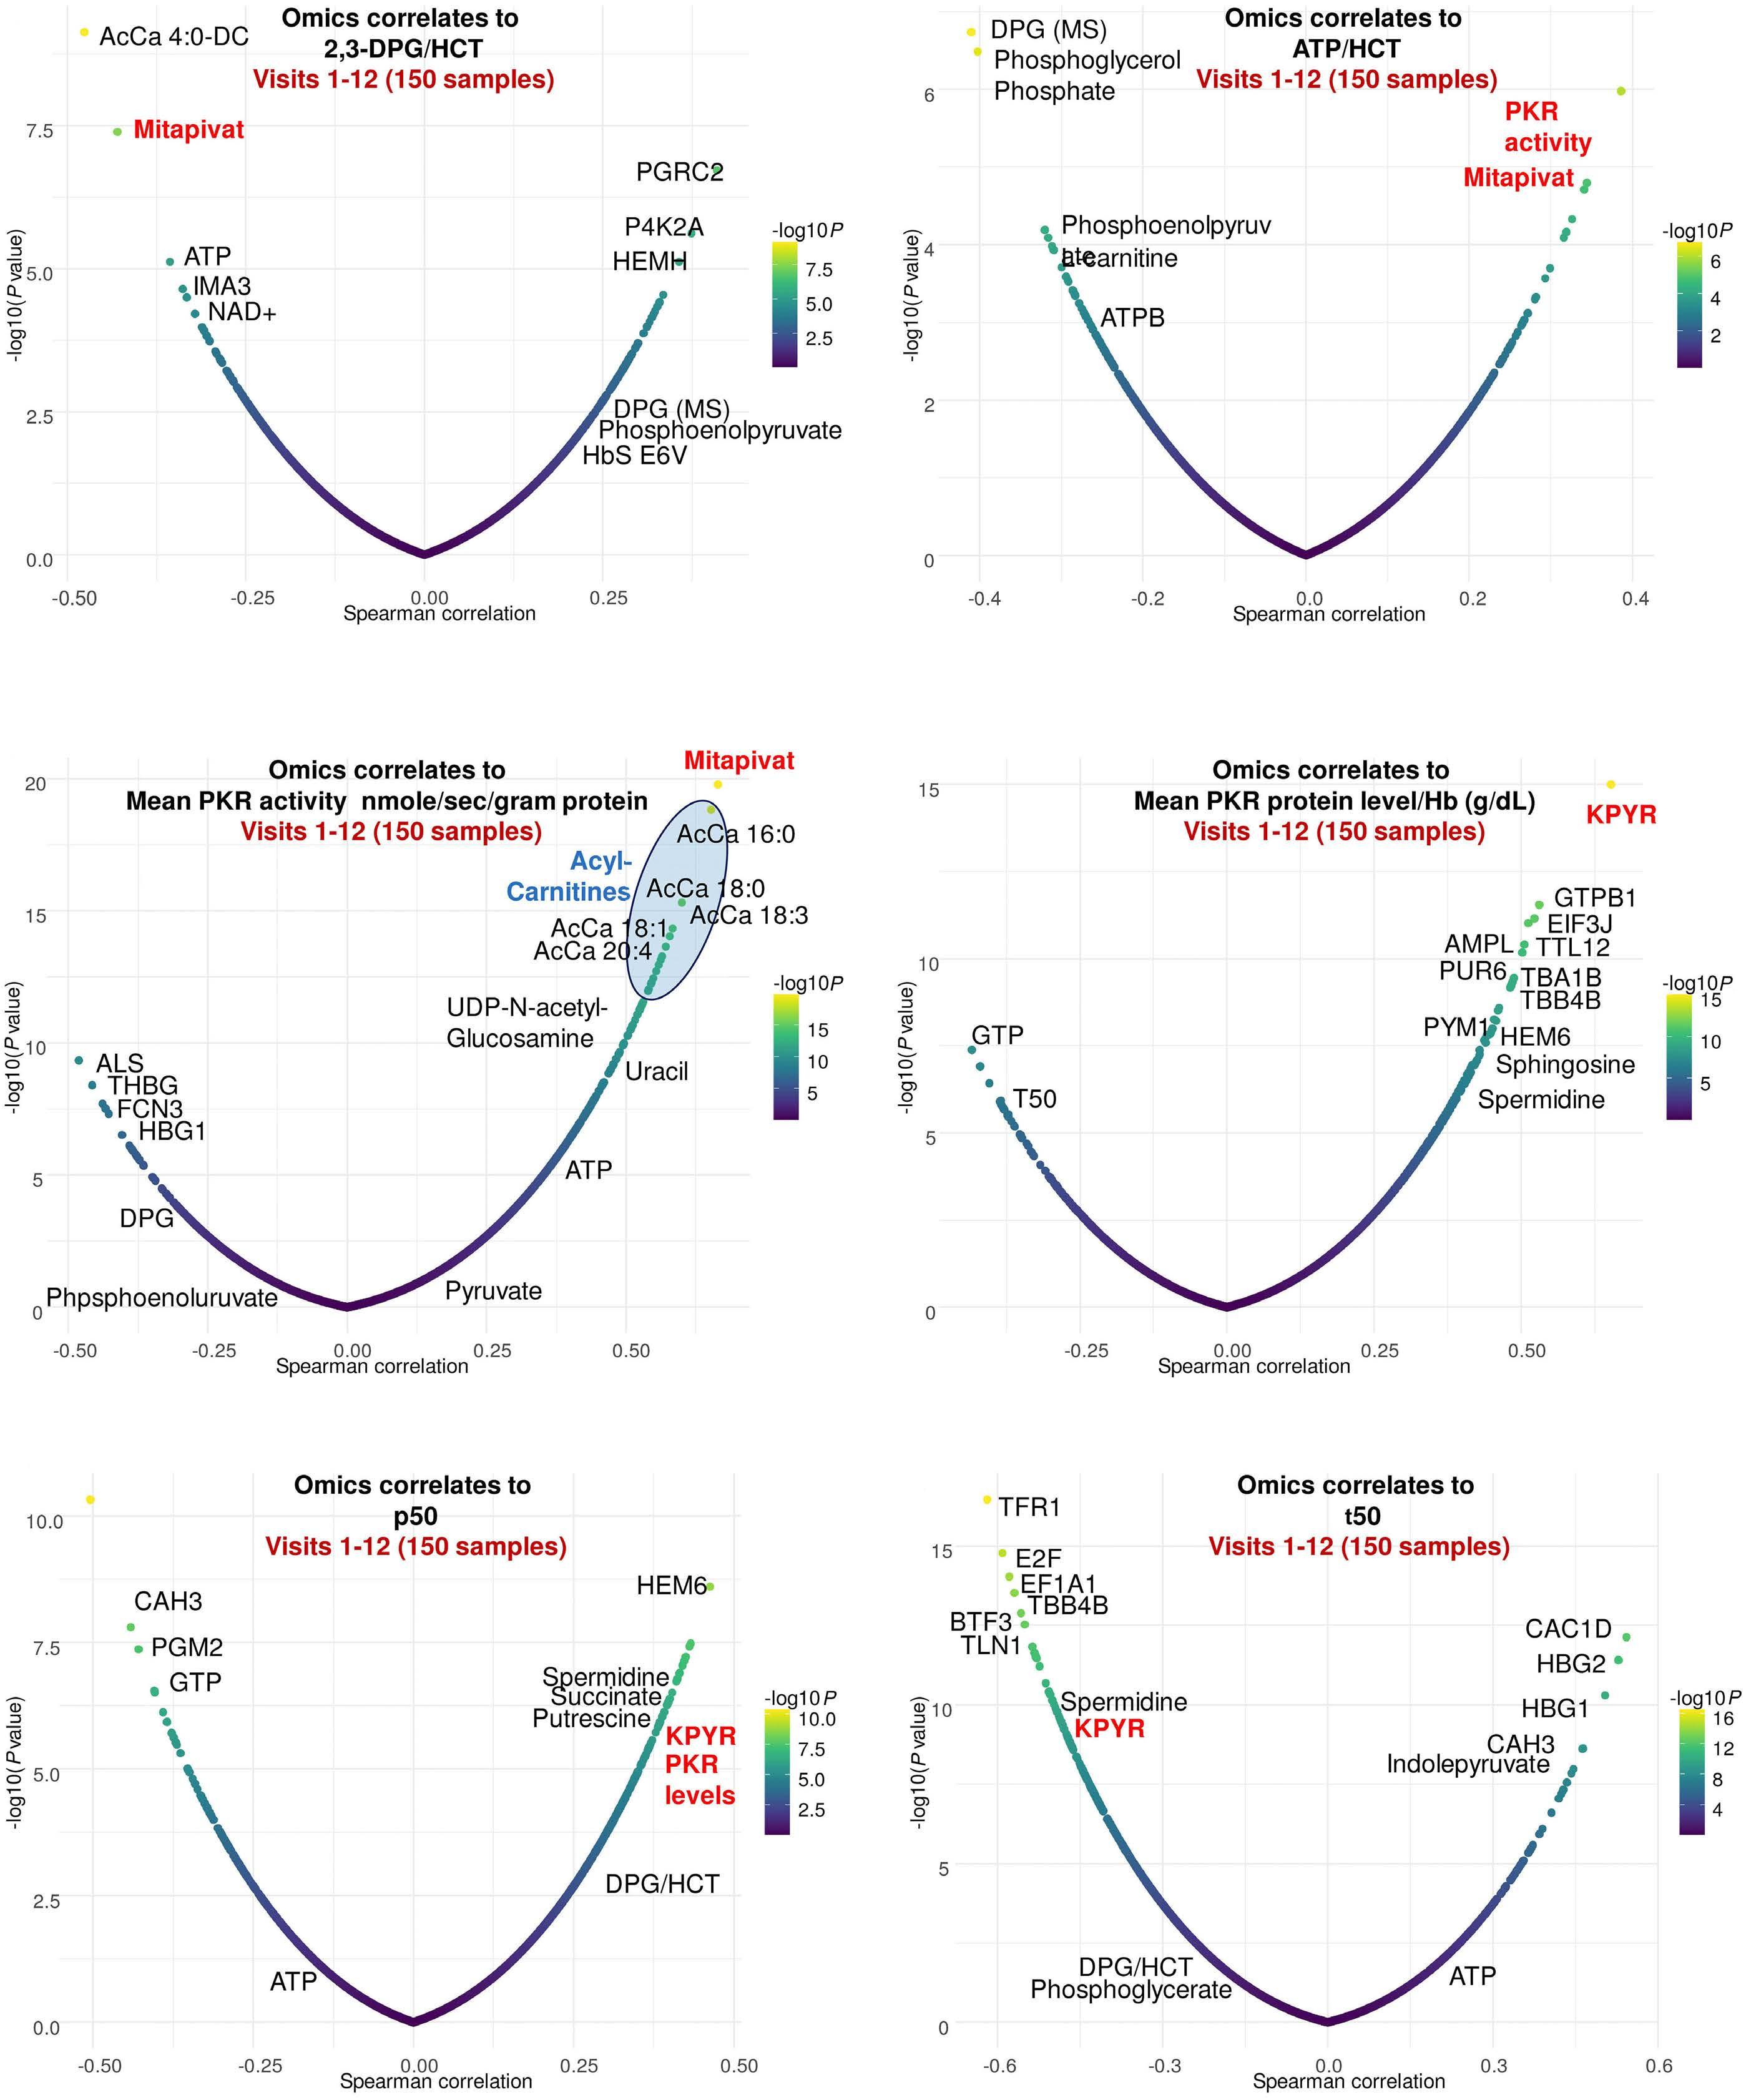
In this issue of Haematologica, D’Alessandro et al.1 describe detailed multi-omics data on 15 individuals with sickle cell anemia (SCA) treated with mitapivat, a novel oral activator of pyruvate kinase (PK).
SCA, being the most prevalent genetic hematologic disease worldwide, inflicts a devastating toll on global health, particularly affecting childhood survival rates in low-income countries. The unmet need for improved care is evident. Despite recent advancements, current treatment remains mostly limited to infectious prophylaxis, hydroxyurea, and transfusion therapy. The main global challenge lies in ensuring early diagnosis and widespread access to these critical treatments. For the foreseeable future, access to curative treatments, such as hematopoietic stem cell transplantation and gene therapy, is confined to a small fraction of young patients in high-income countries. Meanwhile, there is a critical need to develop accessible and scalable pharmacological treatment options.
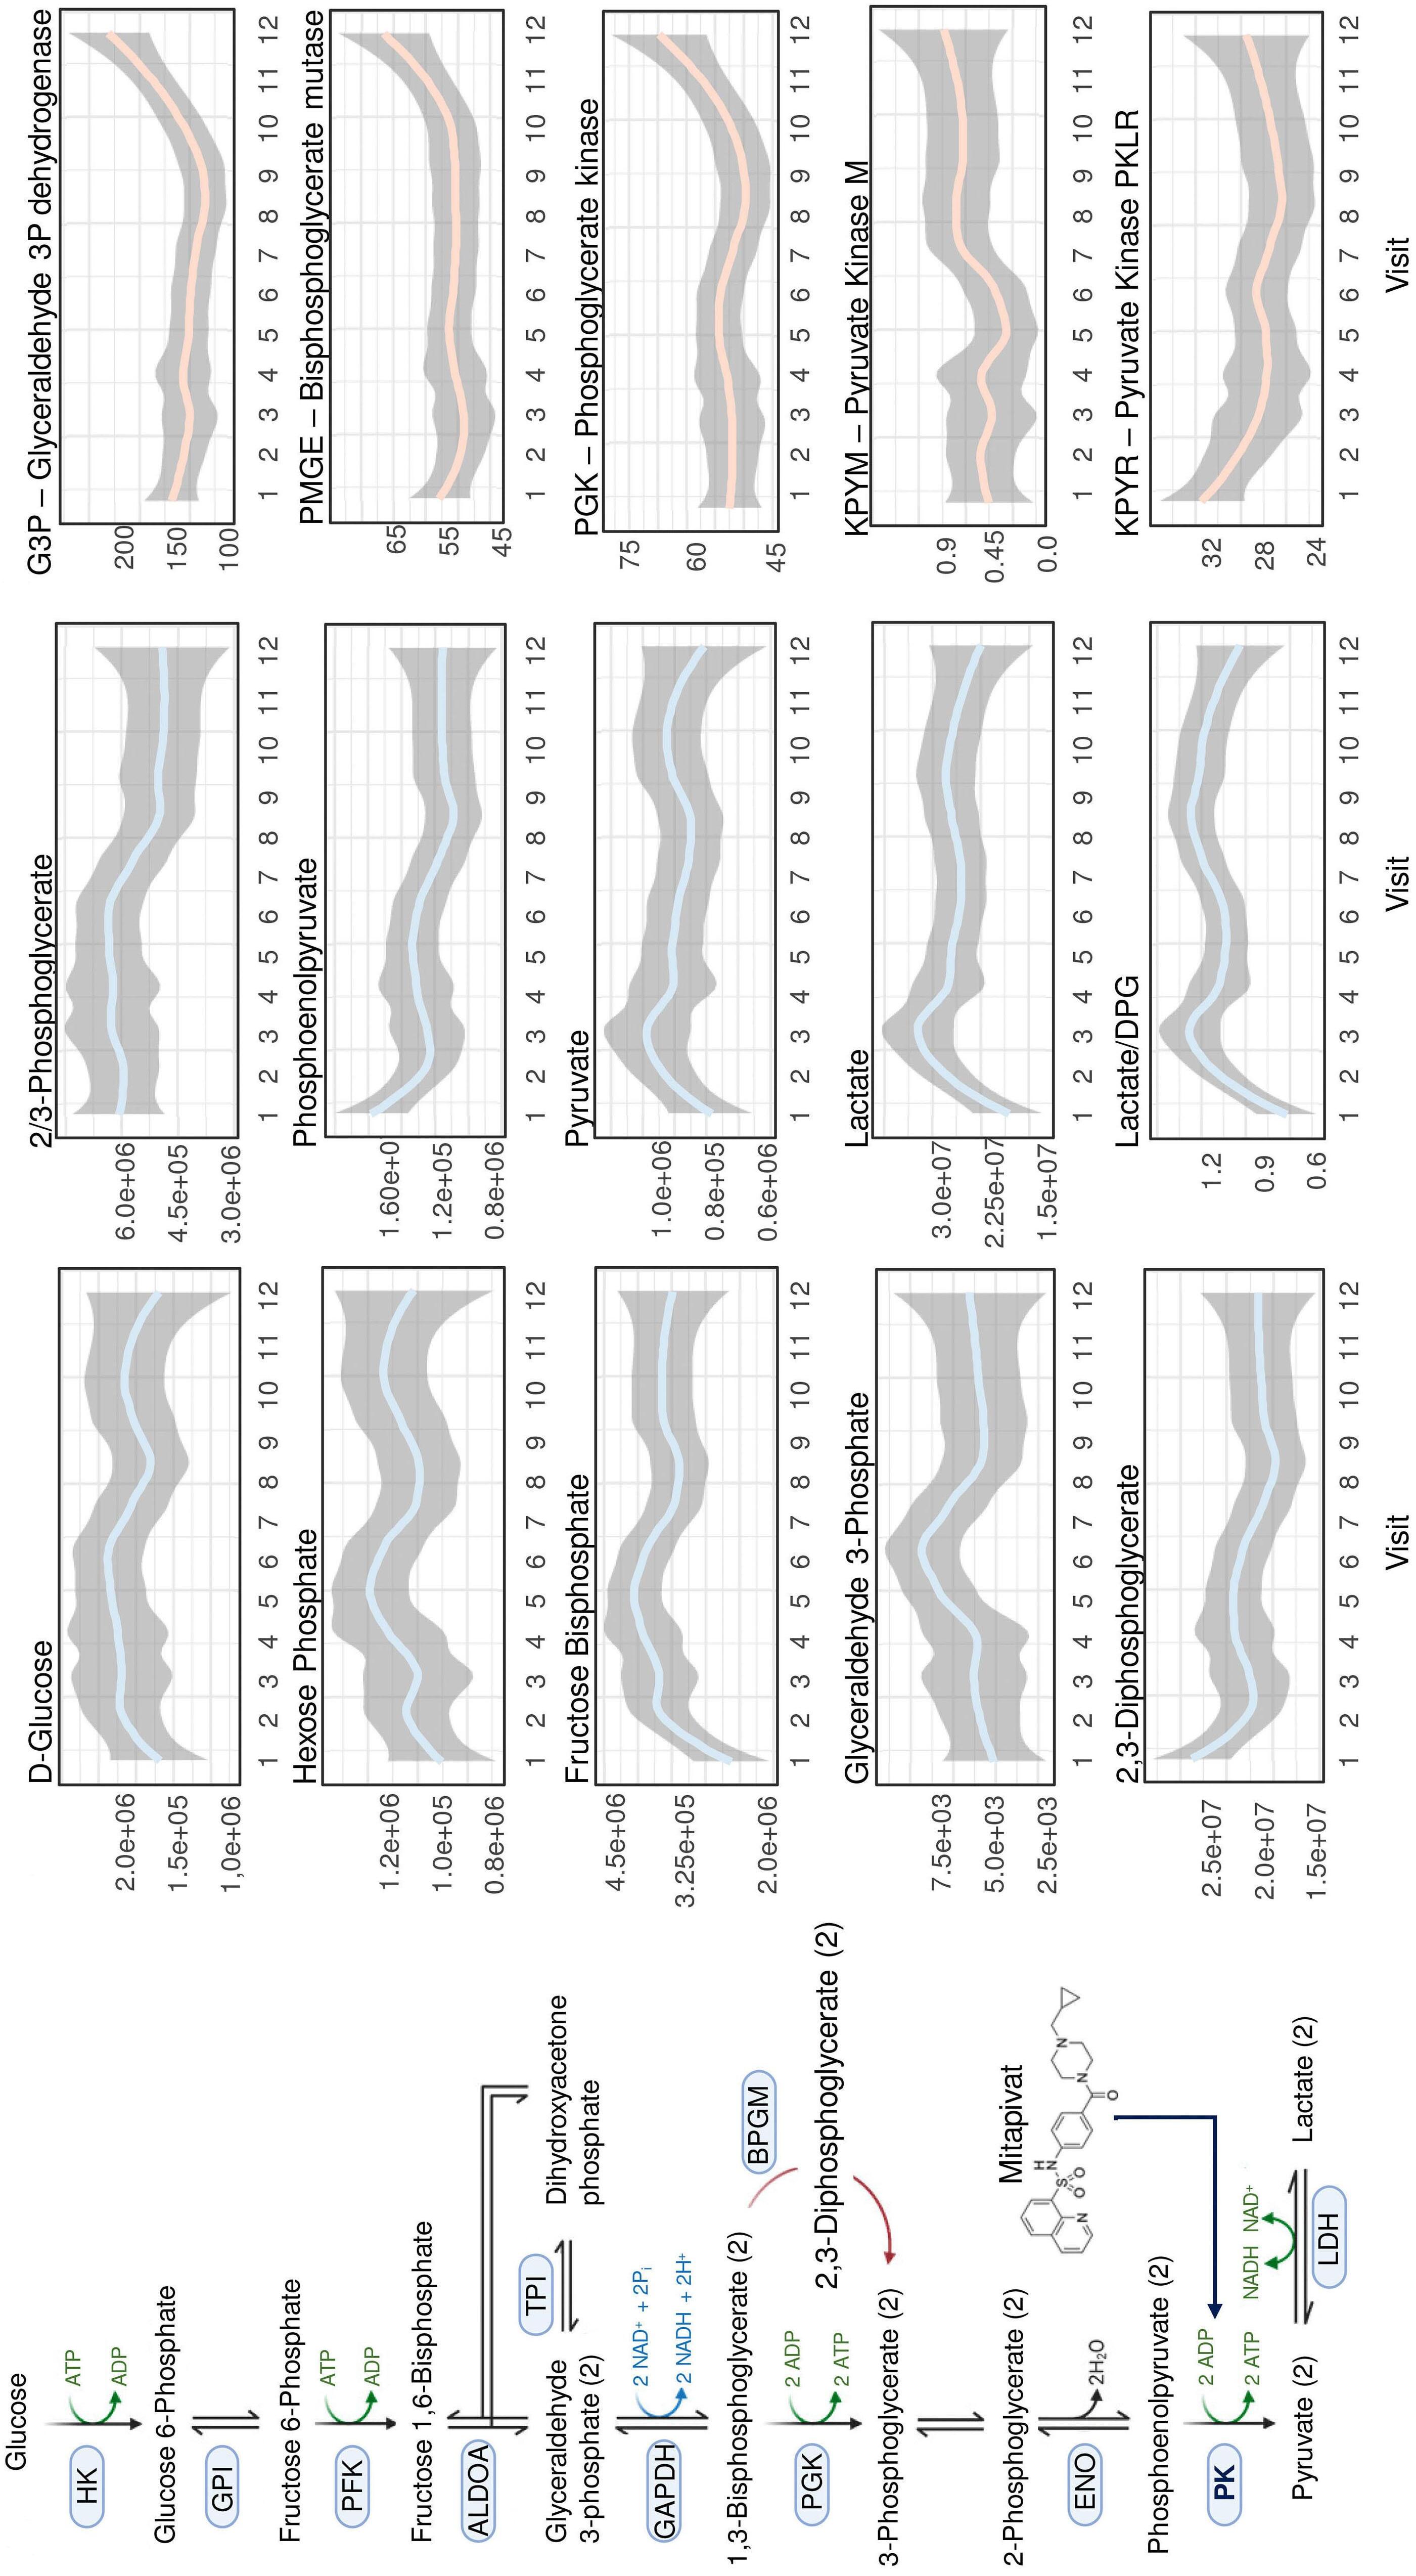
PK is the rate-limiting step of glycolysis and inhibition of PK has been extensively studied as an anti-neoplastic strategy through counteracting the Warburg effect.2 Contrarily, mitapivat activates all isotypes of PK.3 This is particularly relevant for mature red blood cells (RBC), which rely solely on glycolysis for ATP generation. Patients with PK deficiency lack the RBC specific isoform of PK (PKR) and are unable to produce sufficient ATP in RBC, resulting in lifelong hemolytic anemia. The RBC metabolome shows a buildup of glycolytic intermediates upstream of PK,4 most notably increasing 2,3-diphosphoglycerate (2,3-DPG) levels, which effectively decrease hemoglobin oxygen affinity and thereby ameliorate symptoms of anemia.5 Unsurprisingly, mitapivat can effectively treat patients with PK deficiency, although the response is heavily dependent on PKLR genotype and residual PK protein.6
Benefits of PK activation in anemias beyond PK deficiency may seem less evident. However, numerous studies have
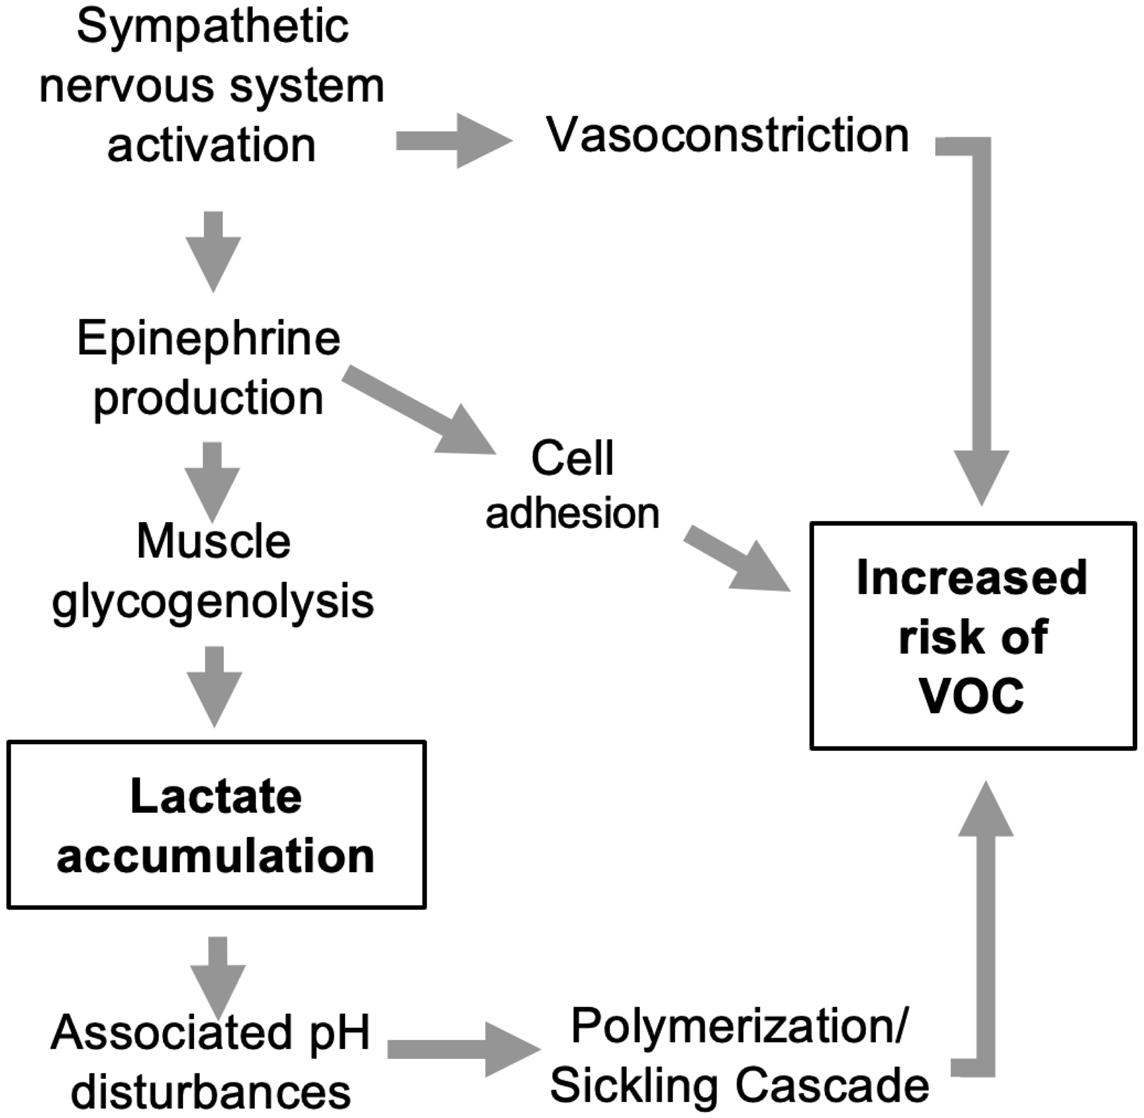
found insufficient glycolytic capacity and ATP generation in a range of hereditary anemias.7 In SCA, activating PK exerts multifaceted effects (Figure 1). It not only enhances ATP production in RBC but also reduces 2,3-DPG levels, which in turn increases the oxygen affinity of hemoglobin. As deoxygenation is a key trigger of sickling, this could also be a contributing mechanism of the action of mitapivat. Additionally, PK activation has been suggested to improve the glutathione pool and thereby have an antioxidant effect, although until now this has only been shown in a mouse model of β-thalassemia.7 Overall, PK activators constitute a promising class of drugs for the treatment of SCA. Currently, three PK activators - mitapivat, etovapivat, and AG-946 - are being used in clinical trials for SCA.
The study by D’Alessandro et al. examines mitapivat’s extensive molecular effects on SCA patients over a period of up to 2 years, utilizing metabolomics, lipidomics, and proteomics within the framework of a long-term extension phase I study (NCT04610866).
Unsurprisingly, a decrease in 2,3-DPG combined with increased ATP levels were confirmed along with improved hematologic and sickling parameters. Notably, a rise in reduced glutathione and activation of Lands cycle point to an improvement in oxidative stress, which provides some evidence to a central proposed benefit of PK activators. Less intuitive is the reported decrease in mitochondrial proteins as RBC are, at least in healthy individuals, mostly known for their absence of mitochondria. However, various recent studies have highlighted the frequent occurrence and potential negative clinical impact of mitochondrial retention in SCA. 8 In PK deficiency, patients lack the PKR isoform, but this is during early-stage erythropoiesis and is likely compensated by expression of the PKM2 isoform. Nonetheless, shortages in pyruvate or ATP in late-stage erythropoiesis might impair reticulocyte maturation and mitophagy 9 and could underlie the extreme reticulo -
Figure 1. Pyruvate kinase activation in sickle cell anemia. Pyruvate kinase catalyzes the glycolytic pathway conversion of phosphoenolpyruvate to pyruvate. This facilitates three key outcomes: (i) increased adenosine triphosphate availability for red blood cells, improving energy supply and cellular functions; (ii) decreased levels of 2,3-diphosphoglycerate, leading to increased oxygen affinity of hemoglobin, a well-known anti-sickling mechanism; and (iii) augmented antioxidant capacity and reduced reactive oxygen species, contributing to a decrease in oxidative stress within the red blood cells. 2,3-DPG: 2,3-diphosphoglycerate; ADP: adenosine diphosphate; ATP: adenosine triphosphate; RBC: red blood cells; ROS: reactive oxygen species.
cytosis measured in patients with PK deficiency after splenectomy.7 If so, replenishing pyruvate and ATP with PK activators should promote mitophagy. This seemed to be the case in a preclinical study of Townes mice – a well-known model of SCA – in which mitapivat ameliorated both mitochondrial retention and oxidative stress.10 As the authors speculate, mitochondrial proteins in RBC might play a role in SCA by promoting inflammation, adding another potential benefit of PK activation in SCA to be studied further.
One might argue that the extended lifespan of RBC in this study might lead to a decrease in mitochondrial proteins merely by reducing the fraction of reticulocytes. The authors claim that the leukocyte depletion used minimized this problem by removing most reticulocytes. This was,
however, not formally demonstrated in the study. Interestingly, mivapivat levels measured in RBC correlated with a range of measures of positive outcomes such as glycolytic activation (including higher ATP and lower 2,3DPG) and acyl-carnitines. The depleted carnitine pools found could be interpreted as a rationale for testing supplementation on top of mitapivat, but this remains speculative.
A significant and noted limitation of the study was lack of control for RBC age, which complicates the precise evaluation of mitapivat’s effects, one example being the effect on the PK enzyme itself, which decreases during the RBC lifespan. Ongoing and future studies will explore the potential of PK activation across various hemolytic anemias, hopefully adding more details to the multi-omics
effects associated with PK activation while adjusting for RBC lifespan variations during treatment. Collectively, the insights provided by D’Alessandro et al. are a significant step forward, enhancing our understanding of the complex remodeling provided by in vivo PK activation.
References
1. D’Alessandro A, Le K, Lundt M, et al. Functional and multi-omics signatures of mitapivat efficacy upon activation of pyruvate kinase in red blood cells from patients with sickle cell disease. Haematologica. 2024;109(8):2639-2652.
2. Liberti MV, Locasale JW. The Warburg effect: how does it benefit cancer cells? Trends Biochem Sci. 2016;41(3):211-218.
3. Kung C, Hixon J, Kosinski PA, et al. AG-348 enhances pyruvate kinase activity in red blood cells from patients with pyruvate kinase deficiency. Blood. 2017;130(11):1347-1356.
4 Roy MK, Cendali F, Ooyama G, Gamboni F, Morton H, D’Alessandro A. Red blood cell metabolism in pyruvate kinase deficient patients. Front Physiol. 2021;12:735543.
5. Al-Samkari H, Van Beers EJ, Kuo KHM, et al. The variable manifestations of disease in pyruvate kinase deficiency and their management. Haematologica. 2020;105(9):2229-2239.
6. Al-Samkari H, Galactéros F, Glenthøj A, et al. Mitapivat versus placebo for pyruvate kinase deficiency. N Engl J Med.
Disclosures
AG provides consultancy or advisory board services for Agios, Bristol Myers Squibb, Novartis, Novo Nordisk, Pharmacosmos, Vertex Pharmaceuticals and has received research support from Agios, Bristol Myers Squibb, Novo Nordisk, Saniona, and Sanofi.
2022;386(15):1432-1442.
7. van Dijk MJ, de Wilde JRA, Bartels M, et al. Activation of pyruvate kinase as therapeutic option for rare hemolytic anemias: shedding new light on an old enzyme. Blood Rev. 2023;61:101103.
8. Esperti S, Nader E, Stier A, et al. Increased retention of functional mitochondria in mature sickle red blood cells is associated with increased sickling tendency, hemolysis and oxidative stress. Haematologica. 2023;108(11):3086-3094.
9 van Vuren AJ, van Beers EJ, van Wijk R. A proposed concept for defective mitophagy leading to late stage ineffective erythropoiesis in pyruvate kinase deficiency. Front Physiol. 2020;11:609103.
10. Quezado ZMN, Kamimura S, Smith M, et al. Mitapivat increases ATP and decreases oxidative stress and erythrocyte mitochondria retention in a SCD mouse model. Blood Cells Mol Dis. 2022;95:102660.
Health-related quality of life in patients with hematologic malignancies treated with chimeric antigen receptor T-cell therapy: review and current progress
Emmanuelle Tchernonog,1 Aline Moignet,2 Amélie Anota,3 Sophie Bernard,4 Guy Bouguet,5 Fanny Colin,6 Catherine Rioufol,7 Loïc Ysebaert8,9 and Emmanuel Gyan10,11
1Hematology Department, University Hospital, Montpellier; 2Hematology Department, Pontchaillou University Hospital, Rennes; 3Department of Clinical Research and Innovation & Department of Human and Social Sciences, Centre Léon Bérard, Lyon; 4Hematology Department, Centre Hospitalier de la Côte Basque, Bayonne; 5Ensemble Leucémie Lymphomes Espoir (ELLyE), Paris; 6Hematology Department, Pontchaillou University Hospital, Rennes; 7Clinical Oncology Pharmacy Department, University Lyon I, EA 3738 CICLY, University Hospital, Lyon; 8Toulouse Cancer Research Center (CRCT), INSERM, CNRS, Toulouse III Paul Sabatier University, Toulouse; 9Clinical Hematology, IUCT Oncopole, Toulouse University Hospital, Toulouse; 10Hematology and Cell Therapy Department, University Hospital, Tours and 11Clinical Investigation Center, INSERM U1415, University Hospital, Tours, France
Abstract
Correspondence: L. Ysebaert Ysebaert.Loic@iuct-oncopole.fr
Received: October 19, 2023. Accepted: February 29, 2024. Early view: March 7, 2024.
Chimeric antigen receptor (CAR) T-cell therapy has transformed the care of patients with relapsed/refractory B-cell-derived hematologic malignancies. To date, six CAR T-cell therapies, targeting either CD19 or B-cell maturation antigen, have received regulatory approval. Along with the promising survival benefit, CAR T-cell therapy is associated with potentially life-threatening adverse events, including cytokine release syndrome and immune effector cell-associated neurotoxicity syndrome. While clinical trials evaluating CAR T-cell therapy consistently report the incidence of these adverse events, most trials do not collect health-related quality of life (HRQoL) data. As such, the impact of the CAR T-cell therapy process and related adverse events on the physical and psychological well-being of patients remains uncertain. HRQoL and other patient-reported outcome (PRO) assessments in patients with relapsed or refractory hematologic malignancies are of utmost importance, as individuals may have unmet needs and a high demand for tolerable therapy if a cure is not obtained. In addition, it is important to standardize methods of data collection to better assess the impact of CAR T-cell therapy on quality of life, optimize patients’ care and costs, and enable comparisons between different studies. We conducted a literature search up to June 2023 to identify the HRQoL tools used in clinical trials and in real-world studies investigating CAR T-cell therapy in patients with lymphomas or leukemias. In the present comprehensive review, we summarize the most commonly used CAR T-cell specific and non-specific HRQoL tools and discuss how the use of HRQoL and other PRO tools may be optimized.
Introduction
Chimeric antigen receptor (CAR) T-cell therapy has substantially transformed the care of patients with relapsed/ refractory B-cell-derived hematologic malignancies, including multiple myeloma, leukemias and lymphomas. To date, six CAR T-cell therapies have received regulatory approval: four targeting CD19, axicabtagene ciloleucel (axicel), brexucabtagene autoleucel (brexu-cel), lisocabtagene maraleucel (liso-cel), and tisagenlecleucel (tisa-cel); and two targeting B-cell maturation antigen, idecabtagene vic-
leucel (ide-cel) and ciltacabtagene autoleucel (cilta-cel).1-3 Although CAR T-cell therapy is given with a curative intent, it is associated with potentially life-threatening adverse events, including cytokine release syndrome (CRS) and immune effector cell-associated neurotoxicity syndrome (ICANS).4 These toxicities result from the supra-physiologic activation of the immune system following CAR T-cell infusion, which leads to the overproduction of inflammatory cytokines, and subsequently to a hyper-inflammatory state.2,5,6 In addition, long-term adverse events that may arise after CAR T-cell therapy include an increased risk of
infection, neurocognitive deficits, emergence of new or exacerbation of existing autoimmune toxicities, and development of recurrent or second primary malignancies.2 While clinical trials evaluating CAR T-cell therapy consistently report the frequency and grades of these unique toxicities, most trials do not collect health-related quality of life (HRQoL) data. In a review assessing the regularity of using HRQoL in ongoing clinical trials, Raymakers and colleagues7 examined 424 trials registered at the United States National Institutes of Health National Library of Medicine (http://clinicaltrials.gov) investigating CAR T-cell therapy in oncology. HRQoL was a primary or secondary objective in only 29 studies (6.8%), highlighting the current lack of adequate assessment of quality of life (QoL) in patients treated with CAR T-cell therapy.7 HRQoL tools assess the impact of treatment-specific adverse events on mental, emotional, social, and physical functions. Hence, due to the under-evaluation of HRQoL data, the impact of the CAR T-cell therapy process and related adverse events on the physical and psychological well-being of patients remains uncertain.6-8 Monitoring HRQoL following CAR T-cell therapy is important to aid patients through their recovery process. Indeed, it is anticipated that patients may regain function faster, feel more involved in their management plan, identify and control their symptoms via personalized interventions/actions, and utilize medical resources less frequently (i.e., shorter duration of hospitalization, fewer emergency room visits).6 Moreover, other patient-reported outcomes (PRO), which promote patients’ empowerment, have not been integrated into treatment guidelines.5,9 HRQoL and other PRO assessments in patients with relapsed or refractory hematologic malignancies are paramount, as individuals may have unmet needs and a high demand for tolerable therapy if cure is not obtained.8 It is also crucial to standardize data collection methods, including the choice of the questionnaire, measurement time, and statistical analysis, to better assess the impact of treatment on QoL, optimize patients’ care and costs, and enable comparisons between studies.10 In this context, we conducted a PubMed search to identify the HRQoL tools used in clinical trials and real-world studies investigating CAR T-cell therapy in patients with lymphomas or leukemias. In the present, comprehensive review, we summarize our findings regarding the existing HRQoL tools and discuss how the use of HRQoL and other PRO tools may be optimized.
Methods
We conducted a comprehensive literature search in PubMed up to July 2023 to identify the PRO tools used in clinical trials and real-world studies evaluating CAR T-cell anti-CD19 therapy in patients with B-cell lymphomas or leukemias. The following keywords were used ([CAR T-cell OR CAR-T]
OR axicabtagene OR brexucabtagene OR lisocabtagene OR tisagenlecleucel) AND (haematolog* OR hematolog* OR lymphoma OR leukemia OR leukaemia) AND (“quality of life” OR “patient-reported outcomes” OR HRQoL OR PRO OR PROs OR QoL), and no filters were applied. This PubMed search was complemented with a hand search of references of relevant reviews and systematic reviews.
Selected papers were restricted to those published in English and reporting studies evaluating QoL in patients with lymphomas/leukemias and receiving CAR T-cell anti-CD19 therapy. Interventional studies – single arm or randomized controlled trials – real-world studies, and qualitative studies were included. Studies evaluating CAR T-cell therapy not targeting CD19 in patients with multiple myeloma, other hematologic cancers or with solid tumors were excluded. Publications reporting only the efficacy and safety results of studies were also excluded.
The PubMed search retrieved 264 publications (Online Supplementary Figure S1). Our hand search yielded five additional relevant publications (including one paper published after the search cut-off date). Twenty-seven publications were selected, reporting data on a total of 25 studies: one validation study for a CAR T-cell specific tool, eight single-arm studies, two randomized controlled trials, ten real-world studies, and four quantitative studies.
Scales to assess health-related quality of life in chimeric antigen receptor T-cell studies: where do we stand?
CAR T-cell anti-CD19 therapy is usually administered in a single infusion. However, this treatment involves multiple phases prior to the infusion and rigorous monitoring of acute and long-term adverse events afterwards (Figure 1).2,11,12 Since CRS and ICANS develop within a few days of CAR T-cell infusion, either concomitantly or consecutively, it is suggested that HRQoL be evaluated before conditioning chemotherapy, once weekly or more frequently (twice or thrice) for the first 2 weeks after CAR T-cell infusion, and weekly for up to 1 month after the infusion.2,13 Early assessment of PRO data may aid in the identification of early toxicities related to CAR T-cell therapy such as CRS and ICANS and their impact on a patient’s QoL.9 Following this early phase, PRO collected monthly for the first year and then yearly are necessary for monitoring the long-term impact of CAR T-cell therapy and its associated adverse events and organizational burden on HRQoL.2,9
Several tools have been used in studies reporting HRQoL after CAR T-cell anti-CD19 therapy. Some of them assessed various domains in patients with cancer, regardless of cancer type, and others were disease-specific (e.g., lymphoma) or domain/symptom-specific (e.g., depression). However, the vast majority of the tools used were not specific to CAR
Figure 1. Treatment and monitoring of patients receiving chimeric antigen receptor T-cell therapy. T cells are collected from the patient through leukapheresis and modified in vitro by the addition of the chimeric antigen receptor (CAR) vector. The modified CAR T cells are later infused back after the patient has received conditioning chemotherapy during the week prior to infusing the CAR T cells. This conditioning therapy, also known as lymphodepletion therapy, typically includes fludarabine and/or cyclophosphamide. Patients who receive CAR T-cell therapy should be hospitalized for a minimum of 1 week after the infusion, as recommended by the CAR-T-cell Therapy Associated Toxicity (CARTOX) working group or benefit from equivalent monitoring depending on the different local organizations in the world. *Cytokine release syndrome and immune effector cell-associated neurotoxicity syndrome usually appear within the first 2 weeks after CAR T-cell infusion.4 CAR: chimeric antigen receptor; D: day; AE: adverse events; CRS: cytokine release syndrome; ICANS: immune effector cell-associated neurotoxicity syndrome.
T-cell therapy. In a systematic review, the European Quality of Life Five Dimension (EQ-5D), which is a standard scale for medico-economic evaluations, was the most commonly collected tool, measured in 65% of studies assessing HRQoL in patients with cancer treated with CAR T-cell therapy.7 It is worth mentioning that the EQ-5D is a non-cancer-specific scale that may also be used for other diseases or in healthy individuals (e.g., university students). Several forms of this questionnaire exist and are constituted of either three or five levels that allow the estimation of an EQ-5D index score and a visual analog scale (VAS) score.14 Of the cancer-specific scales, the most frequently used were the European Organization for Research and Treatment of Cancer Quality of Life Questionnaire-C30 (EORTC QLQ-C30), the Functional Assessment of Cancer Therapy-General (FACT-G) and FACT-Lym, which is specific for lymphoma. The main shortcoming of the generic and cancer-specific PRO is that they may generate misleading results for patients receiving CAR T-cell products, due to the complexity of this therapy and the uniqueness of its toxicities.6,15 In addition, some PRO models assess the decline or improvement in HRQoL parameters using scores of general rather than specific populations, i.e., patients with the same cancer type.9 Such an approach may jeopardize the robustness of the results and their generalizability to clinical practice settings.9 To address the shortcomings of the generic and cancer-specific tools, Wang and colleagues13 recently reported the validation of the first CAR T-cell specific HRQoL assessment
tool for use in hematologic malignancies, the MD Anderson Symptom Inventory (MDASI)-CAR module. The MDASI-CAR was developed according to guidance from the Food and Drug Administration. The MDASI-CAR tool consists of 29 items divided between 13 core and six interference items that constitute the general MDASI tool16 and ten module items that are specific to CAR T-cell therapy (Figure 2).13 Some limitations to the development of this CAR-T cell specific tool should be considered. Indeed, only 21 patients were included in the initial qualitative study that was used to generate the list of module items.15 Moreover, the validation study was conducted in a single institution, and included a limited number of patients (n=78). Furthermore, the majority of patients (68/78; 87.2%) were receiving one specific CAR T-cell product (axi-cel). The generalizability of the MDASI-CAR tool among patients with various hematologic malignancies and on different CAR T-cell therapies may be better assessed with larger multicenter longitudinal studies.13 This tool can be useful in assessing the impact of CAR T-cell therapy on the QoL of patients in the early phase after receiving the CAR T-cell infusion, but may be less effective in capturing disease-related QoL.
Table 1 presents the most frequently used non-CAR T-cell specific PRO/HRQoL tools in clinical studies assessing QoL in adults who received CAR T-cell therapy targeting CD19, and the specific MDASI-CAR tool. Of the non-specific tools, the EORTC QLQ-C30, a cancer-specific tool, and FACT-Lym evaluate many of the functions/symptoms that are assessed
Figure 2. The stepwise approach used to develop the MDASI-CAR tool. The number of items for each item set is presented in parentheses. CAR: chimeric antigen receptor; MDASI-CAR: MD Anderson Symptom Inventory-chimeric antigen receptor.
in the MDASI-CAR. The FACT-Lym is composed of the FACT-G and an additional lymphoma-specific subscale. Both EORTC QLQ-C30 and FACT-Lym cover cognitive, emotional, physical, and social/role functioning as well as some of the individual symptoms/items (fatigue, pain, disturbed sleep, lack of appetite, and nausea).
Other tools used in the identified clinical studies enrolling adult patients included those that are specific to one function or one symptom, such as the Work Productivity and Activity Impairment Questionnaire: General Health (WPAI:GH); revised Edmonton Symptom Assessment Scale (ESAS17; assessing 9 symptoms); Hospital Anxiety and Depression Scale (HADS); and Post-Traumatic Stress Checklist (PCL).18-20 In addition, the PRO version of the Common Terminology Criteria for Adverse Events (PRO-CTCAE) has been used for reporting adverse events in adult patients receiving CAR T-cell therapy.21 In the two retrieved pediatric studies, the Pediatric Quality of Life Inventory (PedsQL) (generic tool and cancer-specific tool dedicated to children), the EQ-5D and the Memorial Symptom Assessment Scale (cancer-specific) were used to assess the HRQoL of pediatric patients.22,23 Different versions of the scales were filled by different age groups, and some required a parent proxy.22,23 Of note, even though not used in the selected studies, it is important to highlight that there exists a validated pediatric version of the PRO-CTCAE tool.24
Health-related quality of life scales reported in singlearm chimeric antigen receptor T-cell studies
We retrieved a total of seven single-arm studies assessing HRQoL in patients who received CAR T-cell anti-CD19 therapy for relapsed or refractory lymphoma/leukemia through
our PubMed search.22,25-30 One additional study, the PILOT study, was published after the search cut-off date and is added to Table 2.31 All retrieved studies were performed in adult patients, except one study, ELIANA,22 a multinational, multicenter, open-label, phase II trial that enrolled patients aged 3 to 23 years who received tisa-cel (Table 2).
In the studies that assessed QoL in adult patients receiving CAR T-cell therapy at different timepoints, an anticipated initial decline in HRQoL was observed between 2 and 4 weeks after the CAR T-cell infusion, followed by improvements at later timepoints.25,27,29-31 Patients reported improvement in several or all domains of HRQoL scales, reaching baseline levels or better levels at a few months after the infusion. One of the studies showed that younger patients experienced worse mental problems, anxiety, and depression compared with elderly patients receiving CAR T-cell therapy.28 The JULIET study26 found that patients who responded to tisa-cel treatment reported a clinically meaningful improvement in all FACT subscales and in more than half of the Short Form-36 (SF-36) subscales (such as general QoL, physical, and social functioning) across all timepoints.26 A similar finding was made in TRANSCEND NHL 001,27 in which, at 1 month after infusion, a higher proportion of patients who responded to liso-cel had an improvement in EORTC QLQ-C30 global health status/QoL, fatigue, physical function, pain, and the EQ-5D5L index, in comparison with those who did not respond.27 In the ELIANA study,22 reporting HRQoL data for pediatric patients, improvements in HRQoL were observed starting 28 days after the infusion, and reached a clinically meaningful phase at 3 months after the infusion. Improvements were observed for all measures at 3 months after tisa-cel with a
mean change from enrollment of 13.3 (95% confidence interval: 8.9-17.6) and 16.8 (95% confidence interval: 9.4-24.3) for the PedsQL total score and EQ-5D VAS, respectively
(Figure 3).22 The clinical improvement was sustained at later timepoints up to 36 months after the infusion.32
Table 1. Most frequently used non-specific health-related quality of life tools and the specific MDASI CAR tool, in chimeric antigen receptor T-cell targeting CD19 therapy clinical studies enrolling adults.
Social/role functioning* (General activity, Enjoyment of life, Relations with others, Work)
Lack of appetite
Lumps or swelling in certain parts of my body (e.g., neck, armpits, or groin)
MDASI-CAR: MD Anderson Symptom Inventory-chimeric antigen receptor; CAR: chimeric antigen receptor; CD: cluster of differentiation; EQ5D: European Quality of Life Five Dimensions; SF-36: Short Form-36; PROMIS: Patient-Reported Outcomes Measurement Information System; EORTC QLQ-C30: European Organization for Research and Treatment of Cancer Quality of Life Questionnaire-C30; FACT-G: Functional Assessment of Cancer Therapy-General; FACT-Lym: Functional Assessment of Cancer Therapy-Lymphoma; Y: yes assessed; N: not assessed. *Domains.
Table 2. Single-arm clinical studies evaluating health-related quality of life after chimeric antigen receptor T-cell anti-CD19 therapy.
PRO completion rate # and/or results
Completion rate was 15/15 (100%) before the infusion and remained high at 13/15 (87%) on day 90.
Higher rates of depression (IDAS) were observed on days 14 and 28 versus day 90. Of note, depression values were maintained below the cut-off values for depressive disorders.
No statistically significant differences in scores between the different timepoints were observed regarding other symptoms (anxiety [IDAS], fatigue [FSI], pain [BPI], and sleep [PSQI]).
40 out of 52 patients who were sent the questionnaire provided QoL data, for a response rate of 76.9%.
Among the 40 patients, 19 (47.5%) reported at least one of the following: clinically meaningful (5-point difference in T score) anxiety and/or depression, and/or cognitive impairment.No difference was observed for the remaining domains in comparison with the US general population.
Completion rate decreased from 108/115 (94%) at baseline to 22/34 (65%) at month 18.Of the 108 patients with HRQoL assessments at baseline, 57 had a complete or partial response. Patients who responded to tisa-cel reported a clinically meaningful improvement in all FACT subscales and in more than half of the SF-36 subscales (such as general QoL, physical, and social functioning) across all timepoints.
MCID was 6.5 to 11.2 points for the total FACT-Lym score and ranged between 2 and 4 points for the different SF-36 domains.
Completion rate decreased from 65/68 (96%) at screening to 42/68 (62%) at month 6.
There was an initial decline in HRQoL at week 4 as observed by almost all the EQ-5D-5L scores, followed by an increase in the scores of overall health, mobility, self-care, and daily activities starting month 3.
By month 6, most patients reported a similar HRQoL or better than baseline.
Completion rate decreased from 39/49 (80%) at day 28 to 14/31 (45%) at month 12.By day 28, there was an initial decline in mobility, self-care, and daily activities in the EQ-5D-5L VAS compared to baseline, followed by a recovery to or improvement over baseline.A higher percentage of patients had scores above those recorded at baseline, starting at month 3 (anxiety or depression, daily activities, and self-care) until month 12 (all domains).
Reported PRO/ HRQoL assessment timepoints
PRO/HRQoL tool
Patient population*
ID, reference CAR T-cell therapy
Study
N=15
BPI FSI IDAS PSQI 15 days before infusion
Post-infusion: days 14, 28, and 90
Post-infusion: 1 to 5 years
PROMIS Scale v1.2 Global Health PROMIS-29 v2.1 30 additional questions †
Relapsed or refractory B-cell NHL or CLL/SLL
Median age: 61 years (range, 38 to 72)
Phase I** 25 Bispecific LV20.19
Race reported in parent study (N=22): European ancestry (N=19, 86.4%); Others (N=3, 13.6)
N=52
Relapsed or refractory NHL, CLL or ALL
Median age at questionnaire completion: 57 years (range, 26 to 76)
Phase I/II study 28 Liso-cel
Race: White (N=33, 82.5%); Asian (N=3; 7.5%); Others (N=2, 5%); Unknown (N=2, 5%)
Baseline (screening phase)
Post-infusion: months 3, 6, 12, and 18
FACT-Lym SF-36 Version 2
N=115
Relapsed or refractory DLBCL
Median age: 56 years (range, 22 to 76) Race not reported
JULIET 26,44 (Phase II) Tisa-cel
N=68
Baseline (screening phase), week 4, months 3 and 6
EQ-5D-5L
Relapsed or refractory mantle-cell lymphoma
Brexu-cel
Median age: 65 years (range, 38 to 79)
Race not reported
Baseline (screening phase) Post-infusion: day 28, months 3, 6, 9, and 12
EQ-5D-5L
N=55
Relapsed or refractory B-precursor ALL
EQ-5D-5L VAS scores after brexu-cel administration (79% at day 28; 92% at month 3; 80% at month 6; 70% at month 9; and 93% at month 12) –MCID was 7 points for
70% or more of patients had either stable or improved
EQ-5D-5L VAS.
Continued on following page.
Median age of treated patients: 40 years (range, 28 to 52) Race White (N=37, 67%); Asian (N=3, 5%); Others (N=11, 20%); Missing (N=4, 7%)
Brexu-cel
ZUMA-2
30 (Phase II)
ZUMA-3 29 (Phase II)
completion rate # and/or results
EORTC QLQ-C30 completion rate declined from 160/181 (88%) at month 1 to 25/36 (69%) at month 18.
EQ-5D-5L completion rate decreased from 165/186 (89%) at month 1 to 25/38 (66%) at month 18.
An initial decline in HRQoL was observed at month 1, followed by an improvement in EORTC QLQ-C30 global health status/QoL, fatigue, EQ-5D5L index, and VAS scores as early as month 2 and up to month 18.
A higher percentage of patients who responded to liso-cel treatment reported an improvement in EORTC QLQ-C30 global health status/QoL, fatigue, physical function, pain, and EQ-5D-5L index in comparison with those who did not respond.
MID for EORTC QLQ-C30 was a 10-point change from baseline, and that of EQ-5D-5L was 0.07 points.
Patients evaluable for HRQoL were: 56/61 (92%) for EORTC QLQ-C30, 49/61 (80%) for FACT-LymS, 55/61 (90%) for EQ-5D-5L index, and 54/61 (89%) for EQ-5D VAS
HRQoL assessment timepoints
Before infusion
Baseline Post-infusion: day 29, months 2, 3, 6, 9, 12, 18, and 24
EORTC QLQ-C30
EQ-5D-5L Version 2.1
N=269 amended to 199 ††
Relapsed or refractory LBCL
Median age: 63 years for patients completing each tool.
EORTC QLQ-C30
Race/Ethnicity: majority were White (N=155, 86%) and Not Hispanic/Latino (N=153, 85%)
Liso-cel
EQ-5D-5L Version 2.1
Race/Ethnicity: Majority were White (N=158, 85%) and Not Hispanic/Latino (N=157, 84%).
At later timepoints completion rates were 83% to 89% at day 60, 84% to 87% at day 180, and 81% to 91% at day 365.
The decrease in completion rate was mainly due to death or inadequate follow-up time.
At baseline, fatigue, social functioning, and appetite loss domains were clinically meaningfully worse than in the general population.
An initial deterioration was observed at day 1 or day 29 in most domains, followed by improvement.
Clinically meaningful deterioration from baseline was observed at day 1 for role functioning of the EORTC QLQ-C30; and clinically meaningful improvement was observed for fatigue at most post-treatment visits for the global health status/QoL at days 60 and 180, and for pain at day 29.
Clinically meaningful improvement from baseline was achieved across most post-treatment visits for FACT-LymS and at days 60 and 180 for EQ-VAS.
EORTC QLQ-C30 EQ-5D-5L Baseline (screening), before treatment (≤7 days before lymphodepletion), Day 1 (prior to liso-cel infusion), Post-infusion: Days 29, 60, 90, 180, 270, 365, 545, and 730, and at disease progression
FACT-LymS
N=61
Relapsed or refractory LBCL
Median age for the EORTC QLQ-C30 evaluable population: 74 years (range, 53 to 84)
Race for the EORTC QLQ-C30 evaluable (N=56): White (N=50, 89%); Others (N=2, 3.6%); Missing (N=4, 7%)
Liso-cel
PILOT
Through day 545, significant improvements from baseline were observed for EORTC QLQ-C30 fatigue, pain, and appetite loss, FACT-LymS, and EQ-VAS.
MID for within-group changes: for EORTC QLQ-C30 domains, two MID threshold sets were usedthe 10-point change from baseline and those proposed by Cocks and colleagues 51 (MID for improvements/deteriorations, < 10 / > -14; ≥ 10 / ≤ -14).
MID were a 3-point change from baseline for FACT-LymS, 0.08 points for the EQ-5D-5L index and 7 points for EQ-VAS.
Continued on following page.
Ethnicity for the EORTC QLQ-C30 evaluable (N=56): Not Hispanic or Latino (N=49, 87.5%); Missing (N=7, 12.5%)
Completion rate was ≥ 75% throughout the assessment period for patients who were eligible to complete PRO.
The lowest completion rate was at day 28 for both tools (43/57 [75%] for PedsQL and 44/57 [77%] for EQ-5D) and the highest at month 12 (14/14 [100%] for each).
An improvement in HRQoL starting day 28 after infusion and reaching a clinically meaningful phase by month 3 (Figure 3).
Clinically meaningful improvement was determined based on a score that is equal to or greater than the MCID, which was equivalent to 4.36 points for the total PedQL score and 7-10 points for the EQ-5D VAS.
Baseline (at enrollment) and at the following timepoints postinfusion: day 28, months 3, 6, 9, and 12.
A post-hoc analysis performed for patients with severe symptoms of CRS and neurotoxicity reported a delay in improvement 4 weeks after the infusion (day 28) compared with patients without such toxicities.
This delay was no longer evident at later timepoints at which the observed improvement in QoL was similar between the groups. Study
PedsQL version 4.0 (children’s version for ages 8 to 12 years, teens’ version for 13 to 17 years, and adults’ version for ≥ 18 years) EQ-5D questionnaires (EQ-5D-Y, youth version for ages 8 to 12 encompassing 3 levels; and European Quality of Life Five Dimension Three Level [EQ-5D-3L] for ≥ 13 years)
N=48 Relapsed or refractory B-cell ALL
Median age: 14 years (IQR, 10 to 17.5) Race: White (N=38, 79%); Other (N=10, 21%)
Tisa-cel
22 (Phase II)
ELIANA
*N is the number of patients who received chimeric antigen receptor T-cell therapy. # Completion rate is calculated based on the number of patients who filled the patient-reported outcome questionnaire out of the total number of patients who were eligible to complete the questionnaires at each timepoint (e.g., patients still in the study who did not experience progression and did not start a new antineoplastic treatment). For studies in which the total number of patients at each timepoint was not specified, the total number of patients in the study/at baseline was used as the denominator. **The phase I study reported by Knight et al. 25 (2022) was a sub-study cohort (N=15); the parent study was a phase I/Ib study (NCT03019055) reported by Shah et al. 52 (2020). † Of the 30 additional questions, four were related to cognitive function. †† The number of patients who received liso-cel was 199 after the study protocol was amended to include collection of health-related quality of life data. CAR: chimeric antigen receptor; CD: cluster of differentiation; ID: identity; PRO: patient-reported outcome; HRQoL: health-related quality of life; NHL: non-Hodgkin lymphoma; CLL: chronic lymphocytic leukemia; SLL: small lymphocytic lymphoma; BPI: Brief Pain Inventory; FSI: Fatigue Symptom Inventory; IDAS: Inventory of Depression and Anxiety Symptoms; PSQI: Pittsburgh Sleep Quality Index; liso-cel: lisocabtagene maraleucel; ALL: acute lymphoblastic leukemia; PROMIS: Patient-Reported Outcomes Measurement Information System; QoL: quality of life; US: United States; tisa-cel: tisagenlecleucel; DLBCL: diffuse large B-cell lymphoma; FACT-Lym: Functional Assessment of Cancer Therapy-Lymphoma; SF-36: Short Form-36; MCID: minimal clinically important difference; tisa-cel: tisagenlecleucel; EQ-5D-5L: European Quality of Life Five Dimension Five Level; VAS: visual analog scale; EORTC QLQ-C30: European Organization for Research and Treatment of Cancer Quality of Life Questionnaire-C30; LBCL: large B-cell lymphoma; MID: minimally important difference; FACT-LymS: Functional Assessment of Cancer Therapy-Lymphoma subscale; IQR: interquartile range; PedQL: Pediatric Quality of Life Inventory; CRS: cytokine release syndrome.
Health-related quality of life scales reported in randomized controlled trials with autologous stem cell transplantation as the standard of care
According to our search, only two randomized controlled trials, TRANSFORM and ZUMA-7, evaluating the impact of CAR T-cell therapy on HRQoL compared to standard of care have been published.18,33,34 Both were phase III, open-label, pivotal studies conducted in adults with relapsed or refractory large B-cell lymphoma as second-line therapy (Table 3).18,33 One additional randomized phase III study (BELINDA), whose HRQoL results are not published yet, included the assessment of HRQoL via SF-36 (a generic tool), FACT-Lym, and EQ-VAS as secondary outcome measures in patients with refractory or relapsed B-cell lymphoma receiving either tisa-cel or standard therapy (Clinicaltrials.gov, NCT03570892). In TRANSFORM,33 the impact of liso-cel on HRQoL was compared to that of standard care using the EORTC QLQ-C30 and the FACT-G additional lymphoma-specific subscale (FACTLymS) questionnaires at the timepoints specified in Table 3.
Of the 184 patients constituting the intent-to-treat population, the EORTC QLQ-C30 analysis set included 90 patients (48.9%) and the FACT-LymS analysis set 85 patients (46.2%). The low percentage of patients constituting each analysis set is attributed to the low completion rates at several timepoints starting from baseline; a total of 87 patients, 44 in the liso-cel group and 43 in the standard-of-care group, failed to complete the EORTC QLQ-C30 assessment at baseline, and 46 patients in each group failed to complete the FACT-
LymS assessment at baseline (Online Supplementary Figure S2). The reasons for low completion rates at baseline were related mainly to the challenges associated with telemedicine during the COVID-19 pandemic, while low rates observed later were related to other events, such as crossing over from the standard of care to the liso-cel group and initiating other antineoplastic agents. Results showed that patients who received liso-cel had clinically better scores in the EORTC QLQ-C30 global health status/QoL, cognitive function and fatigue domains than those who received standard care (Online Supplementary Figure S3). However, a greater deterioration was observed for the emotional domain of EORTC QLQ-C30 with liso-cel than with the standard of care.33
In ZUMA-7,18 EORTC QLQ-C30, EQ-5D-5L, and WPAI:GH (work and activity specific tool) version 2.0 were assessed at the timepoints specified in Table 3. Only patients who were employed at baseline were requested to answer the questions related to employment in WPAI:GH version 2.0. Of the 359 patients constituting the full analysis set, 296 (82.5%) were included in the QoL analysis set. The number of patients completing the HRQoL assessment dropped substantially over time, especially with the standard of care (Online Supplementary Figure S2). This drop was attributed to the occurrence of events (i.e., progression, death) that exclude patients from the QoL analysis set, rather than to a compliance issue. Compliance rates remained greater than 85% and 83% through 9 and 15 months after infusion, respectively. Results showed that patients reported an initial deterioration
Figure 3. Results of the ELIANA study: change from baseline in the PedsQL total score and EQ-5D visual analog scale – mixed-model repeated measure analysis. LS: least squares; 95% CI: 95% confidence interval; PedQL: Pediatric Quality of Life Inventory; EQ-5D: European Quality of Life Five Dimension; P: P value; N: number of patients with measurements at both baseline and post-baseline visits; VAS: visual analog scale. Adapted from Laetsch et al.22
Table 3. Randomized controlled trials comparing health-related quality of life after chimeric antigen receptor T-cell anti-CD19 therapy or standard of care in adult patients.
ITT set:
- Liso-cel (N=92)
median age: 60 years (IQR, 54 to 68)
- SoC (N=92) median age: 58 years (IQR, 42 to 65)
EORTC QLQ-C30 analysis set:
- Liso-cel (N=47; 51.1%)
median age: 59 years (IQR, 53 to 67)
- SoC (N=43; 46.7%)
median age: 56 years (IQR, 37 to 64)
FACT-LymS analysis set:
- Liso-cel (N=45; 48.9%)
- SoC (N=40; 43.5%)
Race not reported
FAS:
- Axi-cel (N=180)
- SoC (N=179)
QoL analysis set:
- Lisocel (N=165; 91.7%)
Age category: <65 years (N=119; 72.1%); ≥65 years (N=46; 27.9%)
ZUMA-718,34
Race: White (N=134, 81.2%); Asian (N=11, 6.7%); Black or African American (N=8, 4.8%); Other (N=46; 27.9%)
- SoC (N=131; 73.2%)
Age category: <65 years (N=89; 67.9%); ≥65 years (N=42; 32.1%)
Race: White (N=113, 86.3%); Asian (N=6, 4.6%); Black or African American (N=6, 4.6%); Other (N=6; 4.6%)
EORTC QLQ-C30
FACT-LymS
EORTC QLQ-C30
EQ-5D-5L
Baseline (randomization)
During treatment: day 29 (before liso-cel infusion or during SCT cycle 2)
Post-treatment: days 64 and 126, months 6, 9, 12, 18, 24, and 36
- Clinically meaningful change was defined as a minimum difference ranging from 5 to 30 points according to the different EORTC QLQ-C30 functioning domains and symptoms and 3 points for the FACT-LymS.
- MID between the groups ranged from 3 to 6 points for the different EORTC QLQ-C30 functioning domains and symptoms and was 3 points for FACT-LymS.
- Results of the EORTC QLQ-C30 global health status/ QoL, cognitive function and fatigue domains showed that the percentages of patients with a clinically better score or no change were higher in the liso-cel group than in the SoC group (Online Supplementary Figure S3).
- The scores of the remaining domains and FACT-LymS were comparable between treatment groups, except for the emotional domain of EORTC QLQ-C30, in which a greater deterioration was observed with liso-cel.
- Of note, CRS and ICANS were reported by only 1% and 4% of patients, respectively, and did not seem to influence the patients’ QoL.
- Results showed an initial deterioration in HRQoL outcomes at day 50 in both treatment groups.
Baseline (prior to treatment with either conditioning or salvage chemotherapy)
Post-treatment: days 50, 100, and 150, months 9, 12, 15, 18, 21, and 24
- Clinically meaningful difference was defined as having an MID of 0.06, 10 and 7 points for the EQ-5D-5L index, EORTC QLQ-C30, and EQ-5D5L VAS score, respectively.
- The same point differences were used to assess clinically meaningful change over time within the same group and between groups.
- By day 100, the scores of the EORTC QLQ-C30 global health status/QoL and physical function domain and the EQ-5D-5L VAS were statistically significantly better and clinically meaningful in the axi-cel group compared to the SoC group (data for each group-each scale; estimated difference, 18.1; P<0.0001) (Online
Supplementary Figure S3).
- The improvement observed at day 100 was sustained on day 150.
- The remaining EORTC QLQ-C30 domains, EQ-5D5L index, and WPAI:GH results were also in favor of axi-cel versus SoC.
- A similar pattern was observed in a subgroup analysis performed for patients ≥65 years old.34
ID: identity; PRO: patient-reported outcome; HRQoL: health-related quality of life; ITT: intent-to-treat; liso-cel: lisocabtagene maraleucel; SoC: standard of care; IQR: interquartile range; EORTC QLQ-C30: European Organization for Research and Treatment of Cancer Quality of Life Questionnaire-C30; FACT-LymS: Functional Assessment of Cancer Therapy-Lymphoma subscale; SCT: stem cell transplant; MID: minimally important difference; QoL: quality of life; CRS: cytokine release syndrome; ICANS: immune effector cell-associated neurotoxicity syndrome; FAS: full analysis set; axi-cel: axicabtagene ciloleucel; EQ-5D-5L: European Quality of Life Five Dimension Five Level; WPAI:GH: Work Productivity and Activity Impairment Questionnaire: General Health; VAS: visual analog scale.
in HRQoL outcomes, at 50 days after infusion, followed by an improvement at later timepoints. At 100 days after infusion, patients who received axi-cel had statistically significantly better scores of the EQ-5D-5L VAS, EORTC QLQ-C30 global health status/QoL and physical function domain compared to those who received standard of care (Online Supplementary Figure S3).18
Health-related quality of life evaluated in real-world chimeric antigen receptor T-cell studies
A total of ten real-world studies were retrieved through our PubMed search, nine of which reported PRO in adults6,19-21,35-39 and one in the pediatric population23 (Table 4). Only one of the retrieved studies compared CAR T-cell therapy to other modalities of treatment in adult patients with hematologic malignancies.21 The main objective of this study was to assess the HRQoL of patients receiving CAR T-cell therapy or stem cell transplant (SCT) (autologous or allogeneic) via the FACT-G, a cancer-specific tool (primary endpoint). Over a 6-month period, a total of 104 patients reported data on HRQoL and symptom burden during treatment. In the CAR T-cell group (n=34), PRO completion rates decreased from 100% at baseline to 44% at 6 months after infusion, mainly due to early study exit caused by disease progression, death or change in therapy (41%). Of note, 20% of patients decided not to complete the PRO at certain timepoints and 38% of patients reported QoL data for all timepoints. Results showed a deterioration in HRQoL during the first 2 weeks and an increase in the frequency and severity of adverse events, followed by improvement at later timepoints in all groups. However, the decline was less, and the improvement was faster with CAR T-cell therapy than with SCT, especially for overall QoL, and physical and functional well-being.21 Other real-world studies reported the same trends including an initial deterioration in HRQoL followed by improvement at around 3 months after the CAR T-cell infusion.6,20,36,39 Interestingly, in their longitudinal study, Johnson and colleagues20 identified worse pre-CAR T-cell therapy Eastern Cooperative Oncology Group (ECOG) performance status as a factor associated with lower pre-CAR T-cell therapy QoL, and identified worse pre-CAR T-cell therapy ECOG performance status, receipt of tocilizumab and receipt of corticosteroids for CAR T-cell toxicities as factors associated with an improved longitudinal QoL trajectory. According to the authors, it is conceivable that more aggressive management of CRS and/or ICANS leads to an improved longitudinal QoL trajectory over time.20 Ward and colleagues23 assessed HRQoL in a total of 140 pediatric patients who received treatment for hematologic malignancies (CAR T-cell or SCT). Although only 23 patients (16.4%) received CAR T-cell therapy, the value of this study in our review is that it evaluated the association between parents’ psychological well-being and their children’s HRQoL and symptoms. Results showed that parents suffer psychologically along with their children, and parental distress was associated with decreased child
HRQoL and higher symptom burden. Moreover, a relatively high proportion of parents reported suicidal ideation at all collection timepoints.23
While most single-arm studies and the randomized controlled trials did not collect PRO data during the first 2 weeks, Oswald and colleagues38 incorporated PRO as early as the first day after CAR T-cell infusion and daily for the first week, followed by weekly assessments for the first month and monthly thereafter for up to 3 months after the infusion. The study included 12 patients and several PRO, each to be filled at certain timepoints. As such, the total PRO assessments amounted to 168 for the whole study population and duration, of which 143 were completed (completion rate, 85.1%). As anticipated, the most severe symptoms were reported within the first 14 days after CAR T-cell therapy, and a deterioration in several aspects of QoL was observed during the first month. In comparison to patients with progressive disease, the authors observed that patients who responded to CAR T-cell treatment suffered more toxicities.38 Of note, the main limitations of this study, as well as several other real-world studies, are their limited sample size and their conduct in single institutions.
Health-related quality of life assessed in qualitative studies
Qualitative studies based on semi-structured interviews and focus group discussions are important to gain deeper insight into the perspectives of patients receiving CAR T-cell therapy on their treatment expectations and to better characterize symptom burden.2 Patients’ perspectives obtained from qualitative studies may help to determine the main QoL aspects affected most by CAR T-cell therapy, and as such may aid in the development of CAR T-cell specific QoL tools. Based on our PubMed search, we identified four qualitative studies assessing HRQoL in patients who received CAR T-cell therapy.5,15,40,41 In the first qualitative study,15 a total of 21 patients who received CAR T-cell anti-CD19 therapy for B-cell lymphomas were interviewed up to 12 months after infusion (13 patients within the first 3 months; 3 patients between 3 and 6 months; and 5 patients between 6 and 12 months). The patients reported the following as the most common symptoms associated with treatment: fatigue, lack of appetite, headache, chills/cold, and confusion.15 This qualitative study was useful in generating a CAR T-cell specific tool, the MDASI-CAR, which was later validated by Wang and colleagues.13 The second study included a literature review and two focus groups among a total of 18 patients.5 The literature search identified several PRO that were used in studies enrolling patients with diffuse large B-cell lymphoma who received CAR T-cell therapy, and the focus groups assessed the appropriateness of the functions/ symptoms covered by these PRO. A total of eight domains were considered as the most affected by CAR T-cell therapy and comprised pain/discomfort, fatigue, sleep, and the following functions: social, emotional, physical, cognitive, and
role.5 The third study recruited 40 patients with hematologic malignancies, 15 caregivers, and 15 clinicians specialized in CAR T-cell therapy to aid in the development of PRO specific to CAR T-cell therapy.40 Similar findings to those reported by the aforementioned studies5,15 were observed. Cognitive, social, and emotional functioning were considered affected by CAR T-cell therapy, with patients reporting fatigue, pain, bothersome gastrointestinal symptoms, and limited physical function.40 Likewise, the fourth qualitative study, which aimed to improve the services associated with CAR T-cell therapy, found that fatigue, pain, loss of appetite, and cognitive problems were reported by ten patients receiving CAR T-cell therapy and four of their caregivers.41
What have we learned from the current patient-reported outcome tools and their use?
To date, the most frequently used HRQoL tools are generic or cancer-specific which may not fully capture the effect of the CAR T-cell therapy process and its adverse events on the QoL of recipients. Patients who receive CAR T-cell therapy are required to reside within a 30-minute to 2-hour drive from the specialized treating center and are not allowed to drive for 8 weeks after receiving the CAR T-cell product.1 In addition, patients are sometimes in need of a caregiver for around a month after therapy.1 All these constraints would affect patients’ psychological status and subsequently their QoL. Only one CAR T-cell specific tool has been developed which still has some limitations and needs further validation in larger studies. Even though a CAR T-cell specific tool could adequately assess the impact of this therapy on the HRQoL of patients, cancer-specific PRO might be more suitable for identifying the impact of the disease on QoL. The studies identified in this review may not have used the optimal tool or at the optimal frequency. The vast majority of studies did not administer the PRO tools during the first 2 weeks after CAR T-cell infusion. This timeframe is crucial for the patient since it is a time of hospitalization and constant monitoring for CAR T-cell therapy specific short-term toxicities. Only one study, reported by Oswald and colleagues,38 incorporated PRO as early as the first day after infusion; however, this study had a limited sample size and thus no solid conclusions can be drawn. Another pitfall in the use of PRO in patients undergoing CAR T-cell therapy may be related to the design of HRQoL evaluations, leading to low completion rates. These low rates, as observed in the randomized controlled trials, have been attributed to the exclusion of patients who progressed or initiated treatment with other antineoplastic agents after CAR T-cell therapy or SCT and who were considered not eligible to complete the PRO rather than to patients’ compliance. Although it is difficult and ethically debatable, we believe that the assessment of QoL in
patients who do not respond to CAR-T therapy is as equally important as that of patients who do respond, to capture the impact of the disease per se. A single-arm study, TRANSCEND NHL 001,27 showed that a higher percentage of responders to CAR T-cell therapy, at 1 month after infusion, reported an improvement in QoL parameters in comparison with those who did not respond. On the other hand, the two studies that enrolled pediatric patients administered pediatric versions of the PRO that corresponded to each patient’s age.22,23 This draws attention to the necessity of several versions of the same PRO, whether generic, cancer-specific or CAR T-cell specific, to accommodate all patients’ ages and needs. Similarly, regardless of age, the availability of the tool in different languages should be encouraged as it allows patients from different populations to complete these PRO tools, thereby fulfilling any current unmet need. Furthermore, assessment of the QoL of caregivers has not received as much attention as it should. For hematologic malignancies, especially in the pediatric population, caregivers play an important role in the patients’ treatment journey. As such, the assessment of their QoL may be informative and beneficial for themselves and subsequently their patients. When the caregiver is a parent, the associated emotional and psychological burden might be detrimental. In one of the real-word studies,23 a strikingly high percentage of parents reported having suicidal ideation when caring for their children who received treatment for a hematologic malignancy.
Perspectives
While CAR T-cell therapy is an innovative treatment with promising survival benefits in patients with advanced hematologic malignancies, its administration is associated with multiple challenges including the complex procedure of manufacturing the CAR T cells, the demanding journey that the patient must go through, and the specific side effects (e.g., CRS and ICANS).1-3 For the aforementioned reasons, the assessment of HRQoL in patients receiving CAR T-cell therapy is of major relevance.8 PRO are valuable means for patients to report HRQoL as well as symptom burden and treatment toxicities.22,37 In addition, it is important to assess the indirect effect of cancer treatment on caregivers who may be overwhelmed by the processes related to any cancer treatment, including CAR T-cell therapy.23,42 As for the time of PRO assessment, given that the majority of episodes of CRS and neurotoxicity, which may affect patients’ HRQoL, develop early after CAR T-cell infusion (median onset of CRS, 2 to 5 days; neurotoxicity, 6 to 9 days), it is paramount to incorporate frequent monitoring during the first 2 weeks after infusion, preferably several times weekly.2,13,25,29,30,43,44 Although early frequent reporting of PRO would better capture the early deterioration in HRQoL, subsequent less frequent monitoring, up to the first year after CAR T-cell therapy, might be helpful in identifying other long-term toxic-
Table 4 . Real-world studies evaluating health-related quality of life after chimeric antigen receptor T-cell anti-CD19 therapy.
PRO completion rate and/or results
PRO/HRQoL assessment timepoints
PRO/HRQoL tool
Treatment (N of patients)
Patient population
Completion rates dropped from 100% at baseline to 44% at month 6, mainly due to the emergence of an event leading to study exit. Only 38% of patients reported QoL data for all timepoints.
HRQoL declined during the first 2 weeks in all groups (nadir coinciding with adverse event peak) and improved later (this deterioration did not reach clinical significance). However, the decline was less, and the improvement was faster with CAR T-cell therapy than with SCT, especially for overall QoL, and physical and functional well-being.
Baseline (any time before CAR T-cell therapy)
FACT-G (primary endpoint)
Cognitive function, assessed by Neuro-QoL, was maintained after CAR T-cell therapy
MCID were 9 points for the total FACT-G and 8 points for Neuro-QoL.
Completion rate for the MDASI CAR, PROMIS-29 and single-item HRQoL was 100%.
Completion rate for EQ-5D-5L was 96.7%.
During the first 3 months, the most severe symptoms were reported (>10% of patients scored 7/10 to 10/10) for several symptoms including fatigue, sleeping disturbance, pain, lack of energy, and tremors.
The symptoms decreased as the time from infusion increased, so symptoms reported within the first 30 days and within 30 to 90 days were more than those reported after 90 days. Pain and physical function were worse during the first 30 days. -30 days after infusion, patients with higher grades of CRS (grades 3 and 4) reported more severe symptoms compared to patients with lower grades (grade 1 and 2). Similarly, after 30 days, patients with higher grades of ICANS (grade 2 to 4) experienced more severe swelling and difficulty eating.
Continued on following page.
Hematologic malignancies
Study, reference
-CAR T-cell therapy median age: 62 years (range, 26 to 77)
Race/ethnicity: the majority were Caucasian (N=33, 97%) and Not Hispanic (N=33, 97%)
PRO-CTCAE Neuro-QoL v2 ECOG performance status (self- reported)
Three cohorts depending on treatment: -CAR T-cell therapy (N=34) -Autologous SCT (N=33) -Allogeneic SCT (N=37)
-Autologous SCT median age: 62 years (range, 42 to 74)
Sidana et al. 21 (2022)
Race/ethnicity: majority were Caucasian (N=29, 88%) and Not Hispanic (N=33, 100%)
-Allogeneic SCT median age: 60 years (range, 23 to 75)
Race/ethnicity: the majority were Caucasian (N=26, 97%) and Not Hispanic (N=36, 97%)
Relapsed or refractory hematologic malignancies (mainly B-cell lymphoid malignancies)
Once at any time during the first 12 months post- infusion
MDASI with CAR T-cell specific module* PROMIS-29 EQ-5D-5L Single-item HRQoL
All patients received CAR T-cell therapy (N=60) -Axi-cel (N=52) -Tisa-cel (N=8)
Median age: 58.9 years (range, 18.7 to 78.6)
Wang et al. 6 (2021)*
Race: White or Caucasian (N=49, 81.7%); Other (N=11, 18.3%)
Ethnicity: Not Hispanic or Latino (N=45, 75%); Hispanic or Latino (N=15, 25%)
and/or results
At baseline, all 100 patients completed the HADS, 99 completed the PHQ-9 and 98 completed the FACT-G and PCL.
By month 6, the completion rate decreased to 72%, when 72 patients completed all questionnaires.
An initial deterioration in HRQoL, as well as depression and physical symptoms, were observed early after infusion. These symptoms improved above baseline level by months 3 and 6, reaching scores similar to those reported by the general US population. Changes were clinically significant.
Baseline (between leukapheresis and CAR T-cell therapy)
Post-infusion: week 1, months 1, 3, and 6 †
FACT-G HADS PHQ-9 PCL ESAS-revised
A constant decline was observed for anxiety and PTSD over the duration of the assessment.
MID was 5 points for FACT-G and the cut-off clinical significance was 8 points for HADS (depression/anxiety) and 32 points for PCL (PTSD)
All 100 patients who received CAR T-cell therapy filled in the questionnaires.
Less than one-third of patients reported clinically significant symptoms related to anxiety, depression, or PTSD at baseline.
The majority of patients reported that they emotionally coped well and responded positively to their prognosis. Patients were glad they knew about their prognosis since it affected future decisions with regards to their disease and treatment and affected other aspects of life as well.
Once: before or at the time of CAR T-cell therapy
Better emotional coping with prognosis and adaptive response to knowing their prognosis were each associated with better QoL and less depression, anxiety, and PTSD at baseline.
The clinical significance cut-off was 8 points for HADS (depression/anxiety) and 32 points for PCL (PTSD symptoms).
Continued on following page.
Study, reference
of patients)
All patients received CAR T-cell therapy -Tisa-cel (N=34) -Liso-cel (N=16) -Axi-cel (N=13) -Ide-cel (N=12) -Brexu-cel (N=6) -Cilta-cel (N=3) -Other (N=16)
Hematologic malignancies (mainly lymphoma and multiple myeloma)
Of the 102 patients who provided baseline data, 87 (85.3%) provided data at day 14, 86 (84.3%) at day 30, 87 (85.3%) at day 60, and 72 (70.6%) at day 90.
QoL questionnaire results: compared with baseline data, physical function, pain, and fatigue improved by day 90 while anxiety worsened by that timepoint.
PRO-CTCAE results: the most severe adverse event profile, related to CAR T-cell therapy, was reported by day 14 followed by improvements observed by day 90. Symptoms that peaked and improved included fatigue, headache, dry mouth, nausea, and concentration problems. Only one symptom, muscle aches, peaked at day 14 and still persisted.
QoL questionnaires: baseline (before conditioning therapy) and day 90 post-infusion PRO-CTCAE: baseline and days 14, 30, 60, and 90 post- infusion
SF-36 ‡ PROMIS-29 ‡ PRO-CTCAE
Axi-cel (N=103)
Hematologic malignancies (patients with NHL were included in this analysis) ††
Study, reference
Of the 115 patients who provided baseline data, 86 (74.8%) provided data at day 90 and 70 (60.9%) at day 360.
No cognitive changes were observed between baseline and day 90; however, there was a deterioration in cognitive function from day 90 to day 360.
Compared to baseline, 12% and 25% of patients experienced a clinically significant deterioration in cognition at day 90 and day 360, respectively.
At day 90, worse cognitive function was associated with more severe fatigue, anxiety, and depression at baseline. No similar association was observed at day 360.
All patients received CAR T-cell therapy: -Axi-cel (N=101) -Tisa-cel (N=15) -Brexu-cel (N=2)
At day 360, patients with a higher grade of neurotoxicity ( ≥ grade 2) experienced worse cognitive impairment compared to those with lower grades.
Of note, the cognitive changes observed were mild in intensity.
For the Everyday Cognition Questionnaire, half standard deviation (0.05) was considered a clinically meaningful difference. Continued on following page.
Age: mean ± SD, 61 ± 12 years
Hoogland et al. 36 (2021) ††
Race/ethnicity: majority were White (N=90, 87%) and Not Hispanic (N=95, 93%)
Hematologic malignancies (patients with NHL who provided cognitive data were included in this analysis) ††
Mean ± SD age, 61 ± 12 years
Barata et al. 35 (2022) ††
Race/ethnicity: majority were White (N=105, 89%) and Not Hispanic (N=110, 94%)
PRO/HRQoL assessment timepoints PRO completion rate and/or results
PRO/HRQoL tool
Treatment (N of patients)
Patient population
Out of the 12 patients who were initially enrolled in the study, 10 patients had data until day 90.
Of the total 168 PRO evaluations, 143 (85.1%) were completed and of the 1,092 study days, the Fitbit was worn for 928 days (85.0%).
QoL questionnaire results: during the first 30 days, a deterioration was observed in multiple domains including physical and functional wellbeing, social roles, pain, and fatigue. Physical function deteriorated during the first month and was still mildly impaired at day 60.PRO-CTCAE results: the most severe symptoms were reported within the first 14 days after infusion.
Baseline (enrollment) Day of infusion (day 0)
Post-infusion: days 1, 2, 3, 4, 5, 6, 7, 14, 21, 30, 60, and 90 †
Demographics survey CCI FACT-G or FACT-G7 PROMIS-29 + 2 Profile v2.1 PRO-CTCAE Study-specific survey
All patients received CAR T-cell therapy (N=12)
Hematologic malignancies (mainly multiple myeloma and lymphoma) ††
Mean age, 66 years (range, 53 to 77)
Race/ethnicity: the majority were White (N=10, 83%) and Not Hispanic (N=11, 92%)
A clinically low HRQoL was defined as ≤70 points for the total FACT-G and ≤16 points for FACT G7.
The EORTC QLQ-C30 completion rate was 23/41 (56.1%)
An initial deterioration was observed in most domains (4 of 5) along with worsening of most of the cancer and emotional symptoms by day 30.
By day 90, an improvement was observed in all domains and all cancer symptoms and most of the emotional symptoms as compared to baseline.
Overall health and QoL remained stable from baseline to day 30 and improved by day 90.
A total of 27 patients were evaluable for mid-term neurological evaluation.
Anxiety and memory problems were reported most frequently at baseline (48% and 30%, respectively) and decreased over time to 30% and 11%, respectively.
Children’s HRQoL and symptoms improved after CAR T-cell therapy or SCT starting at day 30, with further improvements at days 60 and 90.
Parental distress was associated with decreased child HRQoL and higher symptom burden prior to treatment and at later timepoints.
Suicidal ideation was reported by 38.5%, 37.0%, 27.4%, and 33.6% of patients at baseline, day 30, day 60, and day 90, respectively.
*The analysis was performed depending on the time of data collection: within 30 days after infusion (N=28), within 30 to 90 days (N=13), and after 90 days (N=19). This study was an initial step in the development of a CAR T cell therapy-specific module. **Johnson et al 20 (2023) and Dhawale et al. 19 (2023) reported on the same sample of patients; however, one study was cross-sectional (Dhawale et al.)19 and the other longitudinal (Johnson et al.).20 †Not all PRO were filled at all timepoints. ††Patients recruited as part of another larger observational study. ‡HRQoL data were initially collected using the SF-36 then switched to PROMIS-29 following the coverage decisions of Medicare and Medicaid Services. The PROsetta Stone was used to convert SF-36 scores to PROMIS-29 T-scores. ‡‡Oswald et al 38 assessed the feasibility and acceptability of frequent PRO assessments and of wearing a tracker (Fitbit) to assess daily activity and sleep quality prior to CAR T-cell therapy and up to day 90 after therapy. CD: cluster of differentiation; PRO: patient-reported outcome; HRQoL: health-related quality of life scale; CAR: chimeric antigen receptor; SCT: stem cell transplant; FACT-G: Functional Assessment of Cancer Therapy-General; PRO-CTCAE: Patient-Reported Outcomes version of the Common Terminology Criteria for Adverse Events; Neuro-QoL: Quality of Life in Neurological Disorders; ECOG: Eastern Cooperative Oncology Group; QoL: quality of life; MCID: minimal clinically important differences; axi-cel: axicabtagene ciloleucel; tisa-cel: tisagenlecleucel; MDASI: MD Anderson Symptom Inventory; PROMIS-29: Patient-Reported Outcomes Measurement Information System 29; EQ-5D-5L, European Quality of Life Five Dimension Five Level; CRS: cytokine release syndrome; ICANS: immune effector cell-associated neurotoxicity syndrome; liso-cel: lisocabtagene maraleucel; ide-cel: idecabtagene vicleucel; brexu-cel: brexucabtagene autoleucel; cilta-cel: ciltacabtagene autoleucel; HADS: Hospital Anxiety and Depression Scale; PHQ-9: Patient Health Questionnaire-9; PCL: Post-Traumatic Stress Checklist; ESAS: Edmonton Symptom Assessment Scale; US: United States; PTSD: post-traumatic stress disorder; MID: minimally important difference; PAIS: Prognostic Awareness Impact Scale; NHL: non-Hodgkin lymphoma; SD: standard deviation; SF-36: Short Form-36; CCI: Charlson Comorbidity Index; DLBCL: diffuse large B-cell lymphoma; EORTC QLQ-C30: European Organization for Research and Treatment of Cancer Quality of Life Questionnaire-C30; PRMQ: Prospective and Retrospective Memory Questionnaire; MSAS: Memorial Symptom Assessment Scale; PedQL: Pediatric Quality of Life Inventory; BAI: Beck Anxiety Inventory; BDI: Beck Depression Inventory.
ities and adverse events.2 Nevertheless, frequent assessment of PRO, especially in the first few months after CAR T-cell therapy, might be logistically challenging. Thus, to increase patients’ compliance in completing PRO on a regular basis, electronic PRO assessments are encouraged.45 Other than the logistical challenge, patients with grade ≥2 ICANS may find it difficult to complete PRO questionnaires,13 therefore, proxy HRQoL data would be considered an option. Several HRQoL questionnaires have been used in both clinical trials and real-world studies of CAR T-cell therapy, the vast majority of which are not CAR T-cell specific. Recently, one PRO tool specific to CAR T-cell therapy, the MDASI-CAR, was developed and validated.13 Even though some of the non-specific tools, namely the EORTC QLQ-C30 and FACTLym, cover many elements of the MDASI-CAR tool, they fail to assess many of the module symptoms. The ability of such a specific tool to capture most functions and symptoms that are considered relevant to CAR T-cell therapy makes it a valuable tool for clinical use in the early phase after CAR T-cell infusion. At later timepoints, a disease-specific tool may be more suitable to assess the HRQoL aspects affected by the disease itself. Indeed, there is value in monitoring the QoL of non-responders to CAR T-cell therapy as well as those who respond. A cancer-specific PRO might be a better option for non-responders rather than excluding these patients from QoL assessment, and studies may conduct different analyses for each group of patients. Despite these considerations, the generalizability of MDASI-CAR to all patients with hematologic malignancies receiving this treatment and to all clinically available CAR T-cell agents still needs assessment in larger multicenter studies.13 In addition, the MDASI-CAR tool might be suitable for use in comparative studies in which only CAR T-cell agents are being compared to each other. In this respect, there is still a call to pursue the development of optimal specific tools, whether capitalizing on the MDASI-CAR or considering other tools that will address the uniqueness of CAR T-cell therapy and the limitations
of MDASI-CAR. An optimal PRO scoring would balance the need to assess all functional domains, disease-specific and CAR T-cell therapy-specific symptoms, and financial burden on the one hand, and patients’ capacities and logistics on the other hand. To that end, several requirements should be fulfilled, including in-depth learning from existing findings, multidisciplinary professionals’ involvement, patients’ and caregivers’ engagement, and rigorous validation in multicenter studies enrolling an appropriate sample of patients and caregivers that should account for the decline in the eligible individuals in the long-term HRQoL evaluation.6
Conclusions
Altogether, regular PRO assessments are crucial for patients receiving CAR T-cell therapy for hematologic malignancies. The MDASI-CAR tool opened the avenue towards the creation of optimal tools to capture the impact of CAR T-cell therapy on HRQoL in the short term, and to complement the disease-specific tools which remain valid, especially for mid- and long-term QoL evaluation. Future work should also continue to explore factors associated with QoL following CAR T-cell therapy, as these findings can guide shared decision-making between clinicians and patients as well as identify at-risk patients who may benefit from supportive care interventions aimed to decrease symptom burden during treatment. Finally, valid and reliable PRO should be integrated in clinical guidelines, as they may play a major role in improving the well-being and treatment outcomes of patients receiving CAR T-cell therapy.
Disclosures
ET has received honoraria from Gilead/Kite, Janssen, AbbVie, and AstraZeneca. AM has received honoraria from Gilead/Kite, Amgen, and Sanofi. AA has received honoraria from Gilead/ Kite, BMS, AstraZeneca, Sandoz, Ipsen, and Amgen. SB has
received honoraria from Gilead/Kite, Novartis, Incyte, and BMS. FC has received honoraria from Gilead/Kite. GB has no conflicts of interest to disclose. CR has received honoraria from Astellas, Beigene, BMS, Gilead Kite, Janssen, Pfizer, and Roche. LY has received honoraria from Beigene, Gilead/Kite, Janssen, BMS, AbbVie, Roche, and AstraZeneca, and research funding from BMS, Beigene, Janssen, and Roche. EG has received honoraria from Gilead/Kite, Sanofi, Janssen, BMS, AbbVie, Astellas, Pfizer, Recordati, Jazz Pharmaceuticals, Servier, Alexion, Roche, Incyte, and AstraZeneca, and research funding from BMS, Novartis, and Sandoz.
Contributions
All authors conceived the review, contributed to the writing, and approved the manuscript prior to its submission.
References
1. Mikhael J, Fowler J, Shah N. Chimeric antigen receptor T-cell therapies: barriers and solutions to access. JCO Oncol Pract. 2022;18(12):800-807.
2. Chakraborty R, Sidana S, Shah GL, Scordo M, Hamilton BK, Majhail NS. Patient-reported outcomes with chimeric antigen receptor T cell therapy: challenges and opportunities. Biol Blood Marrow Transplant. 2019;25(5):e155-e162.
3. Chen YJ, Abila B, Mostafa Kamel Y. CAR-T: what is next? Cancers (Basel). 2023;15(3):663.
4. NCCN. Clinical Practice Guidelines in Oncology (NCCN Guidelines) - Management of Immunotherapy-Related Toxicities. Version 2.2023. https://www.nccn.org/professionals/physician_gls/pdf/ immunotherapy.pdf. Accessed September 21, 2023.
5. Cheng R, Scippa K, Locke FL, Snider JT, Jim H. Patient perspectives on health-related quality of life in diffuse large B-cell lymphoma treated with CAR T-cell therapy: a qualitative study. Oncol Ther. 2022;10(1):123-141.
6. Wang XS, Srour SA, Whisenant M, et al. Patient-reported symptom and functioning status during the first 12 months after chimeric antigen receptor T cell therapy for hematologic malignancies. Transplant Cell Ther. 2021;27(11):930.e1-930.e10.
7 Raymakers AJN, Regier DA, Peacock SJ, Freeman CL. Healthrelated quality of life data collected in chimeric antigen receptor T-cell (CAR-T) therapy clinical trials. J Cancer Policy. 2021;30:100304.
8. Paunescu AC, Copie CB, Malak S, et al. Quality of life of survivors 1 year after the diagnosis of diffuse large B-cell lymphoma: a LYSA study. Ann Hematol. 2022;101(2):317-332.
9. Kamal M, Joseph J, Greenbaum U, Hicklen R, Kebriaei P, Srour SA, Wang XS. Patient-reported outcomes for cancer patients with hematological malignancies undergoing chimeric antigen receptor T cell therapy: a systematic review. Transplant Cell Ther. 2021;27(5):390.e1-390.e7.
10 Efficace F, Vignetti M. Quality of life and CAR-T cell therapy in children, adolescents, and young adults with haematological malignancies. Lancet Oncol. 2019;20(12):1625-1626.
11. Mohty M, Minnema MC. Lymphodepleting conditioning regimens. In: Kröger N, Gribben J, Chabannon C, Yakoub-Agha I, Einsele H, eds. The EBMT/EHA CAR-T Cell Handbook. Cham (CH): Springer; 2022.p. 131-133.
12. Zhao Z, Chen Y, Francisco NM, Zhang Y, Wu M. The application of
Acknowledgments
The authors thank Julie Nassif, PharmD, and Thomas Rohban, MD, of Partner 4 Health (Paris, France) for providing medical writing support in accordance with Good Publication Practice guidelines. The authors also thank Siham Bibi, PhD, from Kephren (Boulogne-Billancourt, France) for coordination of the project.
Funding
This review article is based on a project led by Gilead Sciences SAS around quality of life & CAR T-cell therapy in which the authors participated. Gilead Sciences SAS funded this review article by supporting the coordination of the project and the manuscript writing as well as the journal publication fees.
CAR-T cell therapy in hematological malignancies: advantages and challenges. Acta Pharm Sin B. 2018;8(4):539-551.
13. Wang XS, Srour SA, Mendoza T, et al. Development and validation of a patient-reported outcome measure to assess symptom burden after chimeric antigen receptor T-cell therapy. Br J Haematol. 2023;201(4):738-746.
14. Rabin R, de Charro F. EQ-5D: a measure of health status from the EuroQol Group. Ann Med. 2001;33(5):337-343.
15. Whisenant MS, Srour SA, Williams LA, et al. The unique symptom burden of patients receiving CAR T-cell therapy. Semin Oncol Nurs. 2021;37(6):151216.
16. Cleeland CS, Mendoza TR, Wang XS, et al. Assessing symptom distress in cancer patients: the M.D. Anderson Symptom Inventory. Cancer. 2000;89(7):1634-1646.
17 Hui D, Bruera E. The Edmonton Symptom Assessment System 25 years later: past, present, and future developments. J Pain Symptom Manage. 2017;53(3):630-643.
18. Elsawy M, Chavez JC, Avivi I, et al. Patient-reported outcomes in ZUMA-7, a phase 3 study of axicabtagene ciloleucel in second-line large B-cell lymphoma. Blood. 2022;140(21):2248-2260.
19 Dhawale TM, Johnson PC, Gaballa MR, et al. Perception of prognosis, quality of life, and distress in patients receiving chimeric antigen receptor T-cell therapy. Cancer. 2023;129(3):441-449.
20 Johnson PC, Dhawale T, Newcomb RA, et al. Longitudinal patientreported outcomes in patients receiving chimeric antigen receptor T-cell therapy. Blood Adv. 2023;7(14):3541-3550.
21. Sidana S, Dueck AC, Thanarajasingam G, et al. Longitudinal patient reported outcomes with CAR-T cell therapy versus autologous and allogeneic stem cell transplant. Transplant Cell Ther. 2022;28(8):473-482.
22. Laetsch TW, Myers GD, Baruchel A, et al. Patient-reported quality of life after tisagenlecleucel infusion in children and young adults with relapsed or refractory B-cell acute lymphoblastic leukaemia: a global, single-arm, phase 2 trial. Lancet Oncol. 2019;20(12):1710-1718.
23. Ward J, Smith J, Powers K, Hellsten M, Murray P. Parent psychological distress is associated with symptom burden and health-related quality of life in children and adolescents undergoing stem cell transplantation or chimeric antigen receptor T cell therapy. Transplant Cell Ther. 2023;29(7):462.e1-e9.
24. Reeve BB, McFatrich M, Mack JW, et al. Validity and reliability of the
pediatric patient-reported outcomes version of the Common Terminology Criteria for Adverse Events. J Natl Cancer Inst. 2020;112(11):1143-1152.
25. Knight JM, Szabo A, Arapi I, et al. Patient-reported outcomes and neurotoxicity markers in patients treated with bispecific LV20.19 CAR T cell therapy. Commun Med (Lond). 2022;2(1):49.
26. Maziarz RT, Waller EK, Jaeger U, et al. Patient-reported long-term quality of life after tisagenlecleucel in relapsed/refractory diffuse large B-cell lymphoma. Blood Adv. 2020;4(4):629-637.
27. Patrick DL, Powers A, Jun MP, Kim Y, Garcia J, Dehner C, Maloney DG. Effect of lisocabtagene maraleucel on HRQoL and symptom severity in relapsed/refractory large B-cell lymphoma. Blood Adv. 2021;5(8):2245-2255.
28. Ruark J, Mullane E, Cleary N, et al. Patient-reported neuropsychiatric outcomes of long-term survivors after chimeric antigen receptor T cell therapy. Biol Blood Marrow Transplant. 2020;26(1):34-43.
29. Shah BD, Ghobadi A, Oluwole OO, et al. KTE-X19 for relapsed or refractory adult B-cell acute lymphoblastic leukaemia: phase 2 results of the single-arm, open-label, multicentre ZUMA-3 study. Lancet. 2021;398(10299):491-502.
30 Wang M, Munoz J, Goy A, et al. KTE-X19 CAR T-cell therapy in relapsed or refractory mantle-cell lymphoma. N Engl J Med. 2020;382(14):1331-1342.
31. Gordon LI, Liu FF, Braverman J, et al. Lisocabtagene maraleucel for second-line relapsed or refractory large B-cell lymphoma: patientreported outcomes from the PILOT study. Haematologica. 2024;109(3):857-866.
32. Laetsch TW, Maude SL, Rives S, et al. Three-year update of tisagenlecleucel in pediatric and young adult patients with relapsed/refractory acute lymphoblastic leukemia in the ELIANA trial. J Clin Oncol. 2023;41(9):1664-1669.
33. Abramson JS, Johnston PB, Kamdar M, et al. Health-related quality of life with lisocabtagene maraleucel vs standard of care in relapsed or refractory LBCL. Blood Adv. 2022;6(23):5969-5979.
34 Westin JR, Locke FL, Dickinson M, et al. Safety and efficacy of axicabtagene ciloleucel versus standard of care in patients 65 years of age or older with relapsed/refractory large B-cell lymphoma. Clin Cancer Res. 2023;29(10):1894-1905.
35. Barata A, Hoogland AI, Kommalapati A, et al. Change in patients’ perceived cognition following chimeric antigen receptor T-cell therapy for lymphoma. Transplant Cell Ther. 2022;28(7):401.e1-401.e7.
36. Hoogland AI, Jayani RV, Collier A, et al. Acute patient-reported outcomes in B-cell malignancies treated with axicabtagene ciloleucel. Cancer Med. 2021;10(6):1936-1943.
37. Maillet D, Belin C, Moroni C, et al. Evaluation of mid-term (6-12 months) neurotoxicity in B-cell lymphoma patients treated with CAR T cells: a prospective cohort study. Neuro Oncol. 2021;23(9):1569-1575.
38. Oswald LB, Li X, Carvajal R, et al. Longitudinal collection of patientreported outcomes and activity data during CAR-T therapy: feasibility, acceptability, and data visualization. Cancers (Basel).
2022;14(11):2742.
39. Ram R, Grisariu S, Shargian-Alon L, et al. Toxicity and efficacy of chimeric antigen receptor T-cell therapy in patients with diffuse large B-cell lymphoma above the age of 70 years compared to younger patients - a matched control multicenter cohort study. Haematologica. 2022;107(5):1111-1118.
40 Akinola IM, Cusatis R, Pasquini MC, et al. Multi-stakeholder qualitative interviews to inform measurement of patient reported outcomes after CAR-T. Transplant Cell Ther. 2023;29(4):254.e1-254.e9.
41. Stenson CL, Vidrine J, Dewhurst F, Osborne W, Menne T, Stocker R. A qualitative service evaluation of patient and caregiver experiences of CAR-T therapy: recommendations for service development and implications for palliative care teams. Palliat Med. 2023;37(2):215-220.
42. Barata A, Hoogland AI, Hyland KA, et al. Quality of life in caregivers of patients receiving chimeric antigen receptor T-cell therapy. Psychooncology. 2021;30(8):1294-1301.
43. Abramson JS, Palomba ML, Gordon LI, et al. Lisocabtagene maraleucel for patients with relapsed or refractory large B-cell lymphomas (TRANSCEND NHL 001): a multicentre seamless design study. Lancet. 2020;396(10254):839-852.
44 Schuster SJ, Bishop MR, Tam CS, et al. Tisagenlecleucel in adult relapsed or refractory diffuse large B-cell lymphoma. N Engl J Med. 2019;380(1):45-56.
45. Efficace F, Cannella L, Sparano F, et al. Chimeric antigen receptor T-cell therapy in hematologic malignancies and patient-reported outcomes: a scoping review. Hemasphere. 2022;6(12):e802.
46. EuroQol. EQ-5D-5L User Guide. 2019 https://euroqol.org/ publications/user-guides/. Accessed September 22, 2023.
47. Hays RD, Spritzer KL, Schalet BD, Cella D. PROMIS((R))-29 v2.0 profile physical and mental health summary scores. Qual Life Res. 2018;27(7):1885-1891.
48. Aaronson NK, Ahmedzai S, Bergman B, et al. The European Organization for Research and Treatment of Cancer QLQ-C30: a quality-of-life instrument for use in international clinical trials in oncology. J Natl Cancer Inst. 1993;85(5):365-376.
49 Cella DF, Tulsky DS, Gray G, et al. The Functional Assessment of Cancer Therapy scale: development and validation of the general measure. J Clin Oncol. 1993;11(3):570-579.
50 Hlubocky FJ, Webster K, Cashy J, Beaumont J, Cella D. The development and validation of a measure of health-related quality of life for non-Hodgkin’s lymphoma: the Functional Assessment of Cancer Therapy—Lymphoma (FACT-Lym). Lymphoma. 2013;2013:147176.
51. Cocks K, King MT, Velikova G, et al. Evidence-based guidelines for interpreting change scores for the European Organisation for the Research and Treatment of Cancer Quality of Life Questionnaire Core 30. Eur J Cancer. 2012;48(11):1713-1721.
52. Shah NN, Johnson BD, Schneider D, et al. Bispecific anti-CD20, anti-CD19 CAR T cells for relapsed B cell malignancies: a phase 1 dose escalation and expansion trial. Nat Med. 2020;26(10):1569-1575.
Functional cure and long-term survival in multiple myeloma: how to challenge the previously impossible
Monika Engelhardt,1+ K. Martin Kortüm,2 Hartmut Goldschmidt3 and Maximilian Merz4+
1Department of Medicine I Hematology and Oncology, Medical Center University of Freiburg, Faculty of Medicine, Comprehensive Cancer Center Freiburg (CCCF), Freiburg; 2Department of Medicine II, University Hospital of Würzburg, Würzburg; 3University Hospital Heidelberg and the National Center for Tumor Diseases, Heidelberg and 4Department of Hematology, Cell Therapy, Infectiology and Hemostaseology, University Hospital Leipzig, Leipzig, Germany
+ME and MM contributed equally.
Abstract
Correspondence: M. Engelhardt
monika.engelhardt@uniklinik-freiburg.de M. Merz
maximilian.merz@medizin.uni-leipzig.de
Received: June 22, 2023. Accepted: February 6, 2024. Early view: February 15, 2024.
Multiple myeloma (MM) is a heterogeneous disease with survival ranging from months to decades. The goal of ‘cure’ remains elusive for most patients, but has been shown to be possible, with durable remission and a transition to a plateau phase (analogous to monoclonal gammopathy of uncertain significance/smoldering myeloma). In this review, two representative cases set the stage to illustrate how this might be possible and what still needs to be determined to achieve functional disease control over a prolonged period. Several developments have emerged, such as improved diagnostics including the definitions and use of SLiM-CRAB criteria and measurable residual disease (MRD) with whole-genome/single-cell sequencing as well as other correlates to better understand disease biology. These advances enable earlier detection, more accurate risk stratification and improved personalized treatment strategies by facilitating analysis of genetic alterations and clonal heterogeneity. Whole-genome sequencing may also identify driver mutations and modes of resistance to immunotherapies as well as other targeted therapies. Today, induction with a CD38 antibody, proteasome inhibitor, immunomodulatory drug, and dexamethasone, potentially followed by autologous stem cell transplantation and lenalidomide maintenance, can be considered standard of care for transplant-eligible (TE) patients with newly diagnosed MM (NDMM). That prolonged disease control and functional cure can be achieved in non-transplant-eligible (NTE) patients is currently emerging as a distinct possibility: data from phase III trials that incorporate a CD38 antibody into the treatment of NTE NDMM patients demonstrate impressive MRD negativity rates that appear sustained over several years. While the long-term durability of chimeric antigen receptor T cells, bi-specific antibodies and other immunotherapies are being evaluated, several clinical trials are now investigating their role in frontline treatment for TE and NTE patients. These trials will address whether chimeric antigen receptor T-cell therapy will replace autologous stem cell transplantation and whether such immunotherapies will represent a truly curative option. We conclude that while cure remains elusive, the concept of operational or functional cure provides a new benchmark to strive for and is an emerging area of active and potentially achievable clinical research for MM.
Introduction
Multiple myeloma (MM) is a complex and heterogeneous disease with survival ranging from months to decades from primary diagnosis based on a patient’s risk profile.1 However, the ultimate goal of achieving “cure” remains elusive for almost all patients. Use of the term “cure” for some cancer entities is being debated in view of the increasing survival rates in various cancers and the development of survivorship
care as an essential component of hematology/oncology. Some hematologists/oncologists prefer to use “long-term survivor” instead of “cured patient” and although patients prefer “cured”, practitioners may consider this as impossible in some settings. From conditional survival analyses, it has been shown that the risk of death from cancer is highest in the initial years after diagnosis, decreases progressively, until a time at which the risk becomes negligible, and surviving patients reach a life expectancy that may
match the sex- and age-matched general population. 2-4 Thus, conditional survival is defined as the probability of a patient surviving an additional 5 (or 10) years after already surviving a given number of years.2-4 Nowadays, patients with various cancers are expected to have increasing survival as a result of personalized treatments based on better understanding of the biology and potential response to more effective therapies. Therefore: (i) cancer patients can be defined as “cured”, when their life expectancy is the same as that of the sex- and age-matched general population; (ii) the biological characterization of a tumor and its site, stage, and disease-free interval are variables that influence the correct applicability of the word “cured”; and (iii) considering the social implications of cancer, the word “cured” in certain societies and cultural contexts could also facilitate the return of cancer patients to their personal and professional life after cancer by reducing the risk of work and insurance discrimination.5 This article will provide an overview of the current landscape of MM treatment, the concept of achieving cure in MM, and the historical perspectives that have shaped our understanding of MM treatment to date.
Data collection and methods
The panel of authors reviewed available published evidence from randomized clinical studies, meta-analyses, systematic reviews, observational studies, meetings and case reports. The Medline, Embase and Cochrane bibliographic databases were searched from manuscript conception to June 12, 2023. Potentially eligible studies written in English were sought with a combination of search terms (Online Supplementary Figure S1). Search terms were “multiple myeloma”, “cure”, “operational cure”, “minimal residual disease” and “long-term remission”. To estimate frequencies of patients attaining ‘cure’ or ‘operational cure’, the outpatient clinic of the University of Freiburg (UKF) was methodically assessed as described in Table 1A and B. Long-term remission or “cure” was defined as a stringent complete response maintained for 5 years or more, with no antimyeloma therapy, no symptoms and good quality of life. Likewise, “operational cure” was assessed for/ assigned to those patients in smoldering MM states for 5 or more years, asymptomatic with no CRAB symptoms (hypercalcemia, renal insufficiency, anemia, bone lesions), but immunofixation-positive, without anti-MM treatment and with a good quality of life (Table 1B). The term “smoldering MM” refers to the definitions in European Myeloma Network (EMN) papers,6,7 in which, after successful treatment, transformation from active myeloma to smoldering or almost non-existent myeloma, but with detection of the disease, was described. Representative patients were selected as case examples of cure and operational cure (Table 2). Moreover, due to the longer than 1.5-year en-
during discussion between the four authors of this review regarding MM patients who are “cured” or in “long-term remission”, this concept is being assessed (not only via conditional survival analyses2-4), but also in, for example, the ALCYONE, MAIA and CASSIOPEIA studies. If our definitions of “cured” and “long-term remission” are applied to MM patients, true plateaus do occur (personal communication). We therefore consider this review of a few patients who are truly cured or remain in long-term remission of value in order to advance these and subsequent analyses. The draft of this paper was generated between January 2022 and June 2023 during the course of 3-monthly meetings of the authors as representatives of the German Multiple Myeloma study groups (DSMM/GMMG), the EMN and the International Myeloma Working Group (IMWG).
Case presentation – towards functional cure
A 46-year-old woman was diagnosed with MM in June 2004. At the time of diagnosis, she had an IgG (32 g/L) lambda subtype ( l -serum free light chains: 400 mg/L), International Staging System (ISS)/Revised International Staging System (R-ISS) score of I, standard-risk cytogenetics and bone marrow infiltration by monoclonal plasma cells of 10%. Imaging (whole-body computed tomography) showed a large extramedullary mass in the pelvis, with the largest diameter measuring 7 cm. The woman’s Revised-Myeloma Comorbidity Index score 8-10 was 2/9, indicating that she was fit for intensive treatment. Due to the large extramedullary myeloma lesion in the pelvis, the bone marrow plasma cell infiltrate of 10%, positive immunofixation, and elevated IgG and l -serum free light chains at initial diagnosis, we had excluded the diagnosis of ‘solitary plasmacytoma of the pelvis and high-dose local radiotherapy as local treatment’. We thoroughly discussed this patient with the directors of the GMMG/DSMM study groups (Profs. Drs. Goldschmidt and Einsele) and, given the non-solitary nature of this IgG l -MM, had decided for systemic treatment. In 2004, the patient was enrolled in the DSMM-V study,11 given chemotherapy-based induction therapy (idarubicin-dexamethasone), and underwent stem cell mobilization and subsequent tandem autologous stem cell transplantation (ASCT). The patient did not receive any novel agents during induction, consolidation or maintenance. The treatment was successful and the patient achieved a stringent complete remission by February 2005 and has remained in stringent complete remission for over 16 years since achieving this milestone. The patient’s risk factors for MM recurrence were relatively low. She had a standard-risk cytogenetic profile, ISS/R-ISS both I and a low bone marrow infiltration. The patient’s age of 46 years at the time of diagnosis was also favorable. Additionally, the patient’s large extramedullary mass in the pelvis was successfully treated with the ASCT. Althought we cannot completely exclude that a similarly favorable result would have been achieved with high-dose radiation, the bone
Table 1A. Examples and characteristics of patients with multiple myeloma who achieved long-term remission and cure* (University of Freiburg, UKF).
Female 6/2004
2 45
Male 10/2009
3 52
Female 12/2010
Male 4/2012
IgGl, ISS/R-ISS I, SR, 10%, large EM MM pelvis (7 cm), no RI, R-MCI: 2/9=fit
IgAl, ISS/R-ISS I, SR, 20%, no RI, R-MCI: 2/9=fit
IgGk, ISS/R-ISS II, SR, 80%, no RI, R-MCI: 2/9=fit
→DSMMV+TandemTx Yes: Tandem Mel200 No sCR since 2/2005 = +18 years
DSMMXII: RAD, CE+Tandem-Tx Yes: Tandem Mel200 Yes: R sCR since 6/2010 = +13 years
VCD, IEV, Tx Yes: Mel200 No sCR since 9/2011 = +12
IgGk, ISS/R-ISS I, SR, 30%, no RI, R-MCI: 4/9=intermediate. VCD, EVC, Tx Yes: Mel200 No
5 74
Female 6/2017
Summary and median/ mean (range) 46/52 (45-74) Females: 3, Males: 2 2004-2017
k-LC, ISS/R-ISS I, unfavorable (1q, del20p), 40%, no RI, R-MCI: 5/9=intermediate.
since 9/2012 = +11 years
VRd, CE, Tx Yes: Mel140 Yes: Vd sCR since 6/2018 = +5 years
*Definition of ‘cure’: stringent complete remission for ≥5 years, no therapy, no symptoms or SLiM-CRAB criteria, immunofixation (serum and urine) negative, good quality of life. Frequency determined from a search of outpatient clinics at the University of Freiburg between 1.1.202331.3.2023 in which 190 patients with multiple myeloma were identified, of whom five were potentially cured (5/190=2.6%). ID: initial diagnosis; MM: multiple myeloma; ISS: International Staging System; CC: cytogenetics (fluorescence in situ hybridization); BM: bone marrow infiltration of plasma cells; RI: renal impairment; R-MCI: Revised Myeloma Comorbidity Index; ASCT: autologous stem cell transplantation; EM: extramedullary site of MM lesion; R-ISS: Revised International Staging System; SR: standard risk; R: lenalidomide; DSMM: German MM study group Würzburg; DSMMV: idarubicin-dexamethasone induction with tandem-transplantation in transplant-eligible patients with newly diagnosed MM; Tx: autologous stem cell transplantation; Mel200: conditioning with melphalan 200 mg/m2; sCR: stringent complete remission; RAD: lenalidomide, adriamycin, dexamethasone; LC: light chain; CE: cyclophosphamide, etoposide; VCD: bortezomib, cyclophosphamide, dexamethasone; IEV/EVC: ifosfamide, epirubicin, etoposide; VRd: bortezomib, lenalidomide, dexamethasone; Mel140: conditioning with melphalan 140 mg/m2; +: ongoing.
marrow infiltration and well-secreting IgGl -nature of her disease did seem to exclude this. While the definition of cure in MM is still debated, this patient’s prolonged remission is a strong indication that she may have achieved a functional cure from her disease. Other selected and represented patients in long-term remission are summarized in Table 1A.
Case presentation – long-term disease control
While the sustained absence of any kind of measurable disease activity is a pre-requisite for curing MM, some patients experience persistence of a very low level of detectable MM cells while either on or off treatment but remain in deep response for even decades. Disease activity in such patients resembles monoclonal gammopathy of undeter-
mined significance or low-risk smoldering MM rather than overt MM requiring therapy, and is sometimes referred to as a plateau phase. The term ‘operational or functional cure’ has been introduced to describe such monoclonal gammopathy of undetermined significance- or smoldering MM-like behavior after successful induction therapy.12 Definitions and typical features of cure, operational cure and incurable MM are displayed in Table 2.
The following history of a 52-year-old male who was diagnosed with MM in June 2003 represents a classical case of an operational cure. His clinical characteristics included an IgG kappa (k) subtype (IgG 60 g/L, k-serum free light chains: 650 mg/L), an ISS/R-ISS score of I, and standard-risk cytogenetics. The initial bone marrow biopsy revealed an infiltration rate of 50%. There was no prevalent
Table 1B. Examples and characteristics of patients with multiple myeloma who achieved a state of smoldering disease (University of Freiburg, UKF).
1 52
Male 6/2003
2 65
Male 6/2010
IgGk, ISS/R-ISS I, SR, 50%, no RI, R-MCI: 2/9=fit
IgGk, ISS/R-ISS I, SR, 20%, no RI, R-MCI: 3/9=fit
Female 4/2018 k-LC, ISS/R-ISS II, SR, 70%, RI, R-MCI: 3/9=fit
Female 7/2014
5 56 Male 6/2017
6 45 Male 2/2008
7 41 Female 6/2008
Summary and median/ mean (range) 52/54 (42-71) Females: 3, Males: 4 2003-2018
DSMMXII: RAD, CE+Tandem-Tx Yes: TandemMel200 Yes: R VGPR; SMM since 4/2011 = +12 years
VCD, C, Tx
VCD, CE, Tx
Mel140 Yes: Vd
Mel140 Yes: Vd
VCD, CE, Tx Yes: Mel200 Yes: Vd
DSMMXI: VCD, IEV, Tx
DSMMXI: VCD, IEV, Tx Yes: TandemMel200 Yes: R
SMM since 9/2018 = +5 years
SMM since 11/2014 = +8 years
SMM since 8/2017 = +6 years
SMM since 12/2014 = +8 years
VGPR; SMM since 12/2014 = +8 years
Tx: 7 Tandem-Tx: 4 Maintenance: 6 8/9 (5-19)
*Definition of smoldering multiple myeloma: transformation to smoldering state ≥5 years, very good partial remission (VGPR), no therapy, no symptoms or SLiM-CRAB criteria, immunofixation (serum and urine) positive, good quality of life. Frequency determined from a search of outpatient clinics at the University of Freiburg between 1.1.2023-31.3.2023 in which 190 patients with multiple myeloma were identified, of whom seven were in long-term VGPR (7/190=3.7%). ID: initial diagnosis; MM: multiple myeloma; ISS: International Staging System; CC: cytogenetics (fluorescence in situ hybridization); BM: bone marrow infiltration of plasma cells; RI: renal impairment; R-MCI: Revised Myeloma Comorbidity Index; ASCT: autologous stem cell transplantation; EM: extramedullary site of MM lesion; R-ISS: Revised International Staging System; SR: standard risk; DSMM: German MM study group Würzburg; DSMMV: idarubicin-dexamethasone induction with tandem-transplantation in transplant-eligible patients with newly diagnosed MM; IEV: ifosfamide, epirubicin, etoposide; Tx: autologous stem cell transplantation; Mel200: conditioning with melphalan 200 mg/m2; SMM: smoldering multiple myeloma; RAD: lenalidomide, adriamycin, dexamethasone; CE: cyclophosphamide, etoposide; R: lenalidomide; LC: light chain; VCD: bortezomib, cyclophosphamide, dexamethasone; C: cyclophosphamide; Vd: bortezomib, dexamethasone; Mel140: conditioning with melphalan 140 mg/m2; SPM: second primary malignancy; BC: breast cancer; CR: complete response/remission; + : ongoing follow-up.
renal impairment. The patient’s Revised-Myeloma Comorbidity Index score was 2/9, indicating that he was fit to undergo ASCT. He was enrolled in the DSMM-V study and received tandem ASCT without maintenance therapy. Ever since completion of the second ASCT, residual monoclonal protein in the serum, indicative of disease activity, could be detected. Nevertheless, the patient has been in longterm remission with no evidence of disease progression. In this case, the patient has been in a state of sustained very good partial response for 20 years since his initial diagnosis. While the patient has low, detectable levels of
monoclonal protein, he does not have any clinical symptoms or end-organ damage. Other representative patients with an ‘operational or functional cure’ are summarized in Table 1B.
Both cases demonstrate that even in the era before novel agents and molecular diagnostics, functional cure could be achieved for a very limited subset of patients. In our review, we summarize the changes in diagnostics and treatment of patients with MM in the last two decades that support the thesis that in the relatively near future, we will or are already achieving a higher proportion of
Table 2. Definitions of cure and functional cure and transformation in smoldering multiple myeloma.
Relevant parameters Cure >5-10 years ‘Operational cure’ Incurable
Definition
Considered less often (<10%), Sustained BM MRD-negative (NGS, NGF 10-5 – 10-6 levels) and imagingnegative (MRI, PET) for at least 1 year
Patient constitution Fit patients
Cytogenetics and disease stages
Stages of MM disease when therapy is initiated
Therapy modalities
Lines of therapy
Obtained response
Symptom evolution and QoL
Standard risk ISS I/II rather than ISS/R-ISS III
Treat at an earlier stage: SLiMCRAB + high-risk SMM states
In younger patients, receiving most active 3-4 agent therapy (PI+IMiD+CD38ab), in combination with ASCT, followed by maintenance
In older patients receiving CD38abbased therapies and novel immunotherapies
Minimal levels of MRD remain positive
Considered typical for most (>90%) MM patients
Younger and older patients Frail patients
Both ISS/R-ISS: I-III
Treat when SLiM-CRAB criteria present
ASCT, tandem-ASCT, allo-SCT, possibly CAR T cells + BITE ASCT + novel agent therapies
High-risk cytogenetics, especially del(17p) ISS/R-ISS: III
Treat when severe and multiple CRAB symptoms (i.e. 4/4) present, dense BM infiltration and unresolving organ impairment
Unable to endure multiagent MM therapy
More likely to be achieved with first-line than with later-line treatment With first-line and later relapse? With successive relapses
Achievement of sustained CR, IF-negative, MRD-negative
Sustained relief of MM symptoms and improved QoL
CR and VGPR, MRD may remain positive
Improved or stable MM symptoms and stable QoL
Only achievement of SD or PD or entirely non-responsive MM
No relief of MM symptoms and worsening QoL
MM: multiple myeloma; QoL: quality of life; BM: bone marrow; MRD: measurable residual disease; NGS/NGF: next generation sequencing/flow; MRI: magnetic resonance imaging; PET-CT: positron emission tomography-computed tomography; ISS: International Staging System; R-ISS: Revised International Staging System; SLiM-CRAB: ≥60% bone marrow plasma cell infiltration, serum free light chain ratio ≥100, >1 MRI-defined focal lesion, hypercalcemia, renal impairment, anemia, bone lesions; SMM: smoldering multiple myeloma; ASCT: autologous stem cell transplantation; allo-SCT: allogeneic stem cell transplantation; CAR: chimeric antigen receptor; BITE: bispecific antibodies; CR: complete response; IF: immunofixation; PI: proteasome inhibitor; IMiD: immunomodulatory drugs; CD38ab: CD38-antibody; VGPR: very good partial response; SD: stable disease; PD: progressive disease.
deeper and durable long-term disease control in patients with newly diagnosed MM (NDMM) patients.
Historical perspectives
The history of MM diagnostics and treatment dates back to the 19th century, when the condition was first described by Henry Bence Jones in the 1850s as a distinct entity characterized by the presence of abnormal proteins in urine.13
Despite the early discovery of monoclonal proteins in patients with bone destruction, hypercalcemia, anemia and renal insufficiency, MM remained a uniformly fatal disease with very limited treatment options until the late 1960s and early 1970s.
In the early days of MM treatment, the goal was primarily palliative, focused on managing symptoms such as bone pain and hypercalcemia. The only available treatments at the time were radiation therapy and high-dose corticosteroids, which provided temporary relief but failed to improve overall survival. In the 1960s, the introduction of
combination therapy with melphalan and prednisone was the start of a new era of MM treatment.14 This regimen provided more durable responses and improved survival, making melphalan and prednisone the standard of care for decades.
Despite these advances, the goal of MM treatment remained focused on symptom control, but provided little hope of achieving cure. However, the development of novel agents in the 1990s and 2000s marked a turning point in MM treatment. Thalidomide, a drug with anti-angiogenic properties, was found to induce responses in heavily pretreated MM patients,15 leading to its approval in 1998. This was followed by the development of bortezomib and lenalidomide, which further expanded treatment options for MM patients. With the advent of these first-generation novel therapies, the goal of MM treatment shifted from palliation to symptom control to an increasing focus on achieving much deeper responses and prolonging survival. The earlier introduction of high-dose therapy and ASCT in the 1980s and 1990s also contributed to this shift in treatment goals.16 ASCT was found to improve response rates and prolong survival in selected patients, and
it became a standard part of MM treatment for many years in younger patients, although its role is now rapidly evolving, with the option of delayed ASCT being preferred as well as even deferred in selected patients. However, the ultimate goal of achieving cure remained elusive. Despite significant progress in MM treatment, only a small percentage of patients achieve long-term disease-free survival.17 This led to the development of new treatment strategies aimed at achieving deeper and more durable responses. The concept of measurable residual disease (MRD) negativity emerged as a key goal of MM treatment, with studies showing that patients who achieved MRD negativity had improved outcomes (Figure 1).18 Thus, there are rare cases of MM patients who are cured or in long-term remission, with the incidence rates being lower than those for patients with prostate, breast or colorectal cancer. 5 Although cure and/or long-term remission occurs less frequently for MM than for other cancers, it remains important to detect via conditional survival analyses or definitions as introduced here. Since Germany (and other countries worldwide) is suffering from “post-COVID” conditions, “release of hospital capacities” – as described in the last part of our review – is gaining ever more attention in our society. Thus, alongside patients’ personal interest, there has been a growing general interest in the concept of operational cure in MM in recent
years. This refers to patients who have achieved a durable remission without ongoing therapy, even if they may still have residual disease. While true cure may remain rare, the concept of operational cure provides a new benchmark for MM treatment and is an area of active research (Tables 1 and 2).
Advances in diagnosis and prognosis
Advances in diagnosis and prognosis have brought about significant improvements for early detection and prognostication in MM, increasing the chances of achieving potential long-term disease control and/or functional cure.
Changes in diagnostic criteria and prognostic indicators
Several developments have emerged, including changes in diagnostic criteria such as the introduction of the SLiM-CRAB criteria,19 integration of prognostic indicators like MRD assessment, 20 whole-genome sequencing, and novel single-cell sequencing techniques to study the underlying disease biology. 21,22 These advances have revolutionized the field by enabling earlier detection, more accurate risk stratification, and personalized treatment strategies, ultimately enhancing the prospects of achieving long-term remission and potentially curing MM (Table 2).
Figure 1. Correlation of depth of response and survival. CR: complete remission; MRD: measurable residual disease.
Table 3. Selected, phase III trials of those in which multiple myeloma treatment was adapted according to measurable residual disease.
MIDAS (NCT-4934475) 716
MRD negativity after consolidation
Isa-KRd induction and then randomization based on MRD NGS (clonoSEQ) 10-5
PERSEUS (NCT-3710603) 690 PFS
AURIGA (NCT-3901963) 214 MRD conversion at 12 months
DRAMMATIC (NCT-4071457) 1,100 OS
OPTIMUM (NCT-3941860) 510 OS, change in FACT TOI score
University Michigan (NCT-4140162)
MASTER (NCT-3224507)
50 MRD negativity after induction
VRd vs. D-VRd + ASCT, Rm vs. DRm NGS (clonoSEQ) 10-5
ASCT vs. not upon MRD achievement N/A
MRD-negative pts to stop daratumumab after sustained MRDnegativity Daratumumab restarted at recurrence of MRD
DRm vs. Rm after ASCT NGS (clonoSEQ) 10-5 >VGPR + MRD-positivity essential for study entry N/A
DRm vs. Rm after ASCT NGS (clonoSEQ) 10-5
Rm+Ixa vs. R-placebo after ASCT NGS (clonoSEQ) 10-5
One notable advancement in the diagnosis of MM was the introduction of the SLiM-CRAB criteria by the IMWG in 2014. The traditional CRAB criteria, which include hypercalcemia, renal insufficiency, anemia and bone lesions, were initially used to identify patients with active disease requiring treatment. However, they often failed to capture early-stage myeloma or rapidly evolving disease, which could delay the initiation of appropriate therapy. The SLiM-CRAB criteria address this issue by incorporating additional parameters, such as the presence of clonal bone marrow plasma cells ≥60%, involved/uninvolved serum free light chain ratio ≥100, or >1 focal lesion on magnetic resonance imaging or positron emission computed tomography. These criteria enable the identification of asymptomatic patients at higher risk of progression and facilitate early intervention, leading to improved outcomes. 23
Implications of early detection and prognostication for achieving a functional cure
Another crucial aspect of achieving cure in MM is accurate prognostication. MRD has emerged as a treatment goal for NDMM and relapsed disease. Highly sensitive techniques, such as next-generation flow cytometry or next-generation sequencing, can detect residual malignant plasma cells and provide valuable information about disease burden and treatment response. MRD negativity, meaning the absence of detectable disease, has been associated with better outcomes and prolonged progression-free survival and overall survival. By utilizing MRD assessment, clinicians can tailor treatment strategies based on individual response, intensifying therapy for patients with persistent MRD positivity or de-escalating treatment for those achieving deep MRD negativity. This personalized approach may significantly improve the chances of achieving functional cure in MM.
Representative current trials implementing MRD testing in treatment decision-making are summarized in Table 3. Furthermore, advances in sequencing technologies, such as affordable whole-genome sequencing and multi-omic single-cell assessment of malignant plasma cell as well as non-malignant cells of the surrounding microenvironment, have transformed our understanding of the molecular landscape of MM.24-26 These techniques allow for comprehensive analysis of the genetic alterations and clonal heterogeneity present within tumor cells. Whole-genome sequencing provides a detailed view of the entire DNA sequence of a patient’s tumor, enabling the identification of potential driver mutations, therapeutic targets but also modes of resistance to targeted therapies such as chimeric antigen receptor (CAR) T cells and personalized treatment approaches. Single-cell sequencing takes this analysis a step further by characterizing the genetic and phenotypic heterogeneity within individual tumor cells. These advanced genomic techniques have provided important insights into disease progression, treatment resistance and mechanisms of relapse. By deciphering the underlying genetic complexity of MM, clinicians can develop targeted therapies and personalized treatment regimens that address the unique molecular characteristics of each patient’s disease in order to eradicate MRD. Single-cell and whole-genome sequencing approaches have been successfully used to study modes of resistance to anti-B-cell maturation antigen (BCMA) CAR T cells27,28 and to predict the response to T-cell-engaging therapies (Table 4, Figure 2).29
Nevertheless, as yet, personalized/tumor agnostic approaches in MM have largely failed: for example, in a recent study by Andreozzi et al., 30 survival intervals were comparable in the groups treated using an agnostic (“molecular-oriented”) approach or according to physicians’ choice. It should be mentioned that a weakness of this study was the limited number of patients treated with the molecular-oriented approach, and there were other challenges in MM such as the high mutational load, plasma cell heterogeneity and absence of unifying driver events.31 Widespread biomolecular techniques and improvement of treatment algorithms could nevertheless improve selection for precision medicine, a vision of personalized or molecularly-driven treatment that cancer experts are striving to achieve in MM as well.31 In addition to enhancing early detection and prognostication, these advances have also paved the way for further development of novel therapeutic approaches in MM. Precision medicine, which focuses on tailoring treatment to an individual’s unique genetic profile, has gained significant momentum with the integration of genomic technologies. The identification of specific genetic alterations and dysregulated pathways in myeloma cells has allowed the development of targeted therapies aimed at disrupting these mechanisms. For example, detection of the BRAF V600E mutation provides a therapeutic opportunity;32,33 other examples include the novel peptide drug conjugate melflufen34 and the potent cereblon E3 ligase modulator, mezigdomide.35
Treatment strategies for potentially achieving cure
Although the approval of every new agent for the treatment of NDMM challenges the continued role of ASCT, delineating transplant-eligible (TE) from transplant-ineligible (NTE) patients remains an important step to define first-line therapy in MM. The latest studies comparing novel agentbased triplet-drug regimens alone or in combination with ASCT and continued maintenance until progression still favor ASCT, especially with regard to a progression-free survival benefit.36,37 Importantly, however, to date, no overall survival benefit has been shown in the large, randomized studies with mature follow-up when compared to delaying transplant and/or keeping it in reserve. However, including a CD38 monoclonal antibody during induction therapy has led to unprecedented rates of deep remissions before and after ASCT.38-41 Results from trials investigating quadruplet induction regimens alone (Cepheus: NCT03652064) or in combination with ASCT (ISKIA: NCT04483739 and Perseus: NCT3710603) (Table 3) are now available and confirm the benefit of the latter approach.42,43 Therefore, induction therapy with a CD38 antibody in combination with a proteasome inhibitor, immunomodulatory drug and dexamethasone followed by ASCT and lenalidomide maintenance can be considered a standard of care for most TE NDMM patients today. The high rates of sustained MRD-negativity following such an intensive treatment regimen - especially in standard-risk patients – legitimizes optimism towards a higher proportion of functional cures compared to those previous reported for TE patients before the introduction of quadruplet induction regimens. There are currently several ongoing trials recruiting NDMM patients which are investigating intensive frontline therapies and MRD testing aimed at achieving functional cure, at least in standard-risk patients (Table 3). Whether or not functional cure can also be achieved in NTE patients is also currently under consideration. Data from the MAIA and ALCYONE phase III clinical trials that incorporated daratumumab into treatment of NTE, NDMM patients demonstrated encouraging MRD negativity rates even in frail patients.44-48 However, longer follow-up is needed to show whether subgroups of patients enrolled in novel frontline trials with CD38 antibodies can achieve long-term, sustained complete remission and hence potential functional cure.
Novel therapies and combination approaches with potential for cure
While ASCT has been a valuable option for TE patients, most patients with NDMM are deemed not eligible for various reasons. However, recent advances in immunotherapy, specifically CAR T-cell therapy and bispecific antibodies, offer promising alternatives that may revolutionize the treatment landscape for myeloma patients, including those who are unable to undergo ASCT. Several clinical trials investigating BCMA-targeted CAR T cells have demonstrated promising
outcomes.49-55 Early-phase studies have reported deep and durable responses, even in heavily pretreated patients with relapsed or refractory myeloma. Remarkably, some patients achieved sustained MRD negativity.51 While the long-term durability of CAR T-cell therapy in myeloma is still being evaluated, emerging evidence suggests it could provide a potential curative option, also for NTE patients. Currently,
there are several clinical trials investigating the role of CAR T-cell therapy in frontline treatment for TE and NTE patients. These trials will not only answer the question of whether CAR T-cell therapy will replace ASCT, but will also provide evidence on whether CAR-T cell therapy represents a curative option in MM. Despite the significant advances of CAR T-cell therapy, there are several unanswered questions that
Table 4. Possible changes in multiple myeloma: past, present, future and implications that may allow prolonged remission and possible cure.
MM parameters
Staging system Durie & Salmon ISS → R-ISS + SLiM-CRAB
Inclusion of moleculardetermined risks
Allowing earlier MM treatment start
MM diagnostics
Disease burden measurement
M-gradient, X-ray examination of the bone
M-gradient quantification, Sensitive imaging (WB-CT, MRI, PET-CT), Mass spectrometry, Circulating PC, tumor-DNA in PB + BM, MRD in PB + BM, Molecular diagnostics (WGS)
Treatment start With symptoms, i.e. CRAB SLiM-CRAB, In studies: HR-SMM ? Less “iceberg“ to be diminished
Therapy duration For 4-6 cycles Until progression
Defined treatment stops
With longer treatment → deeper + prolonged remission induction Stop treatment in cured patients
Therapy options Limited
Treatment-related factors
Patient-related factors
Outreach approaches
Prognosis
Therapeutic goal
Symptom control, MM- stabilization or decrease
Many options, combination partners, numerous clinical trials, IO: moAb, ADC, BITE, CAR T cells, quadruplet regimens and “5-agent combinations”
In young + fit: CR + as deep and prolonged remission as possible In elderly and unfit: disease control
Therapy lines Less often: beyond 3 6-10 not uncommon
Relapse → start of retreatment With CRAB=MM symptom recurrence
Pts constitution
With serological progression
Fit pts: being treated Unfit: BSC Fit and unfit pts defined with treatment options for both
Transplant limits <60-65 years ≥70 years, if tested fit
Center-related
Center-focused MM treatment
International exchanges, comprehensive cancer centers, IMWG/EMN consortia
Cure combinations? Almost limitless treatment options
Cure options in both young and elderly -
Cure or chronic disease transformation -
With MRD reversal from negative → positive? Less disease burden needing to be diminished
Unfit pts made fit again? -
Transplants deceasing? -
Entire worldwide exchange -
Changes in PFS + OS 3-5 years 8-10 years >10 years → cure
Much better prognosis
MM: multiple myeloma; ISS: International Staging System; R-ISS: Revised International Staging System; SLiM-CRAB: ≥60% bone marrow plasma cell infiltration, serum free light chain ratio ≥100, >1 magnetic resonance imaging-defined focal lesion, hypercalcemia, renal impairment, anemia, bone lesions; WB-CT: whole body computed tomography; MRI: magnetic resonance imaging; PET-CT: positron emission tomography-computed tomography; PC: plasma cells; PB: peripheral blood; BM: bone marrow; MRD: measurable residual disease; WGS: whole genome sequencing; HR-SMM: high-risk smoldering multiple myeloma; IO: immune oncology therapies; moAb: monoclonal antibodies; ADC: antibody drug conjugates; BITE: bispecific antibodies; CAR: chimeric antigen receptor; pts: patients; EMN/IMWG: European Myeloma Network/International Myeloma Working Group; PFS: progression-free survival, OS: overall survival.
need to be addressed in the future. Besides clinical factors that need to be defined to identify patients who might profit most from CAR T-cell therapy, there are also socioeconomic challenges that require thorough assessment. These are related to the limited availability of manufacturing slots, the substantial costs and financial burdens for individuals and healthcare systems as well as regional and racial disparities when it comes to access to CAR T-cell therapy or other higher-priced therapy options.56-59 Even if CAR T-cell treatments do provide a potentially curative option for MM patients, only a relatively small number of privileged patients in certain regions of the world with well-resourced healthcare jurisdictions can currently derive benefit from this important innovation.56,58,59 Bispecific antibodies represent another novel therapeutic approach that holds significant potential in MM treatment. Major advantages of this approach, compared to CAR T-cellbased therapies, include the immediate “off-the-shelf”
availability and the broader availability outside tertiary centers, although these treatments remain costly and still require additional hospitalization for step-up dosing. These engineered molecules simultaneously bind to tumor-associated antigens, such as BCMA, GPRC5D and FcRH5 on MM cells and CD3 on T cells, facilitating the formation of a cytotoxic immune synapse.60 By bridging cancer cells and immune cells, bispecific antibodies enhance the immune system’s ability to target and eliminate malignant plasma cells. Early clinical trials with bispecific antibodies, showing unprecedented rates of long-lasting and deep remissions in relapsed or refractory MM patients previously treated with triplet regimens, have led to the approval of teclistamab and talquetamab by the Food and Drug Administration as well as the European Medicines Agency and other bispecific antibodies are expected soon.61,62 Ongoing trials are now investigating bispecific antibodies in combination with established anti-myeloma drugs in earlier lines of treat-
Figure 2. Strategies to attain a cure or operational cure in multiple myeloma. MM: multiple myeloma; QoL: quality of life; combos: combinations; MRD: measurable residual disease; BM: bone marrow; y: year; ASCT: autologous stem cell transplantation; allo-SCT: allogeneic stem cell transplantation.
ment. Preliminary results from these clinical trials and the unprecedented rates of MRD negative remission in heavily pretreated relapsed or refractory MM patients support optimism regarding effectiveness in earlier disease. Unanswered issues regarding the use of bispecific antibodies include the optimal treatment duration and intensity and the prevention of severe side effects, especially the high rate of life-threatening infections.63 These points need to be addressed to definitively include bispecific antibodies in curative treatment strategies, since a patient who is still under continuous treatment and susceptible to potentially fatal side effects such as overwhelming infection cannot reasonably be considered cured. New strategies, including fixed duration of treatment, accompanied by a thorough program to mitigate infectious complications as one example, are clearly warranted.
Patient factors and barriers to cure
Age, fitness, and other factors that
impact treatment
While advancements in diagnostic, prognostic and treatment options have improved outcomes for many patients, individual characteristics can have an impact on the effectiveness of therapies and the overall chances
of achieving cure. Advanced age is often associated with poorer outcomes in MM.64 Older patients may have comorbidities and reduced physiological reserves, making them more susceptible to treatment-related toxicities and complications.10,64 However, it is important to note that chronological age alone should not dictate treatment decisions, as shown in numerous prospective and retrospective analyses of both ASCT and non-ASCT patients. In a study by Straka et al ., 65 patients up to the age of 70 years were randomized to no induction but upfront melphalan 140 mg/m 2 and tandem ASCT or standard induction and tandem ASCT. Various aspects of the study were noteworthy, such as the number of patients (n=434) included, their more advanced age for tandem ASCT (60-70 years), the double transplant approach, and short treatment duration (7.7 months with induction and 4.6 months without induction). On an intention-to-treat basis, median progression-free survival times in patients given or not given induction were comparable, being 21.4 and 20.0 months, respectively (P =0.36). Patients aged ≥65 years (55%) did not have an inferior outcome. Patients with low-risk cytogenetics, i.e., those without del17p13, t(4;14) or 1q21 gains, had a favorable overall survival. In another study from Germany presented by Straka at the annual meeting of the American Society of Hematology
Figure 3. Future strategies to achieve cure in 1-10% of multiple myeloma patients. MM: multiple myeloma; QoL: quality of life.
in 2022, 348 patients between the age of 60-75 years were randomly assigned to either continuous treatment with lenalidomide/dexamethasone or the same drugs given in three cycles of induction therapy followed by reduced-intensity (melphalan 140 mg/m 2) single or tandem ASCT and lenalidomide maintenance.66 While there were no significant differences in progression-free and overall survival between the two groups after a median follow-up of 68 months, encouraging median overall survival times of 87 and 96 months, respectively, were observed, highlighting that even before the introduction of anti-CD38 antibodies, elderly patients had a meaningful likelihood of experiencing long-term remission. These data also demonstrate that in certain subgroups of patients, the clinical benefit from the addition of intensive chemotherapy and ASCT may be limited. A similar observation was made in the DETERMINATION study, in which African-American patients failed to achieve the same gain in progression-free survival as others, and appeared to do better with ASCT being kept in reserve.67 Therefore, the overall health status, other pathobiological conditions, and functional age of patients should always be considered.67 Several scoring systems to quantify fitness and frailty in MM have been established in order to objectify biological health.10,64,68,69 While frail patients are usually not considered eligible for transplants, the introduction of CD38 monoclonal antibodies led to improved outcomes in this difficult-to-treat population70,71 which usually represents the largest portion of patients treated outside of clinical trials and tertiary centers, given that the median age at diagnosis of MM is approximately 70 years.72 Future studies will show whether functional cure can only be achieved in fit patients or whether adaptive and/or adoptive immunotherapy such as CAR T cells and bispecific antibodies may provide similar functionally curative options for elderly and/or frailer patients.73 Psychological and social support can also significantly impact a patient’s ability to cope with the challenges of MM treatment.74 Patients with robust support networks, exercise and fitness training,69,75,76 and access to psychological support services often adhere to treatment better, have better quality of life and potentially better treatment outcomes.77 Additionally, patients who are embedded in a stronger social support system might more readily gain access to novel therapies, including clinical trials, not least through the encouragement, advocacy and support of a caring family and friends.
The role of supportive care in achieving cure
With the increasing number of available agents to treat MM and the higher rates of deep, long-lasting remissions, supportive care remains vitally important in the management of MM, especially with the aim of long-term control and/or functional cure of the disease. Historically, symptom management such as alleviating bone pain, ad-
dressing side effects including peripheral neuropathy and improving bone health with bisphosphonates or receptor activator of nuclear factor - k B ligand (RANKL) antibodies have been at the center of supportive care in MM.78 To ensure that patients re-enter their normal life after the diagnosis and potentially curative treatment, additional areas need to be addressed. Supportive measures should include psychological counseling, exercise programs, psychotherapy, support groups, and relaxation techniques to address physical fitness, emotional distress, anxiety, depression and fears associated with the disease. Additionally, the importance of diet on general health and its effect on deep remission and follow-up treatment have been recognized in recent years.79 Beneficial effects of plant-based diets have been shown in NDMM 80 and fasting diets may be associated with improved immune function in cancer patients, making this an important and exciting area of study in MM. 81 Maintaining adequate nutrition is crucial for optimizing treatment outcomes and supporting the body’s ability to tolerate therapy. Nutritional counseling and support from dietitians can help address dietary deficiencies, manage treatment-related changes in taste or appetite, and provide guidance on maintaining a healthy diet during and after treatment. Preventing infections and managing them optimally is another highly crucial aspect of supportive care in the journey of any MM patient and particularly that towards the goal of potential functional cure for MM.63 Patients with MM are particularly susceptible to infections due to immune system dysfunction caused by the disease itself and treatment-related immunosuppression. Prophylactic measures, such as antimicrobial and antiviral agents as well as vaccinations following treatments, are mandatory (such as in the first 6 months following ASCT or CAR T-cell therapy to reduce the risk of infections and their associated complications).63 Additionally, intravenous immunoglobulin substitution therapy should be considered in most cases,82 especially in patients treated with CAR T-cell therapy and bispecific antibodies. Intravenous immunoglobulins, derived from pooled human plasma, contain antibodies that provide passive immunity against various infectious agents. For myeloma patients with hypogammaglobulinemia (e.g. IgG <400 mg/dL) or recurrent severe infections, intravenous immunoglobulins should be administered monthly and typically over at least 6 months to supplement deficient antibodies and reduce the risk of infections. Ideally, these safety measures should be implemented during the first months following a potentially curative treatment and then discontinued after recovery of the patient’s immune system. However, long-term data on immune reconstitution following CAR T-cell therapy and discontinuation of bispecific antibodies after achieving a deep and sustained remission are currently being collected and are required before definitive recommendations can be made.
Advances in genomics and personalized medicine
Deciphering the human genome cost approximately one million US dollars in 2007. The cost has now decreased to several hundred US dollars per patient. Furthermore, novel single-cell multi-omic analyses have been developed to study tens of thousands of malignant myeloma cells and non-malignant individual cells to better characterize an individual’s immune system. These developments are leading to a better understanding of outcome with novel immunotherapies to reveal modes of resistance to treatment. Examples are the pretherapeutic T-cell landscape, which is related to response to bispecific antibodies,29 and the biallelic loss of antigens such as BCMA on MM cells.27,28 Additionally, the respective genetic information may be used in the future for personalized treatment decisions based upon these findings. Examples include targeting the BRAF V600E mutation as well as the effectiveness of BCL2 inhibitors in patients with high BCL2 expression in malignant plasma cells, as often but not exclusively observed in patients harboring a (11;14) chromosomal abnormality.83 However, malignant plasma cells are not homogeneously distributed within the patient. Therefore, the emerging concept of spatial genomic heterogeneity needs to be addressed,84-87 especially when aiming to eradicate MRD and potentially cure patients with MM.88 As personalized approaches continue to evolve, the ability to translate clinical trial findings into real-world practice is likely to improve.89
Implications of curing multiple myeloma for healthcare systems and society as a whole
Introducing the goal of cure into myeloma care has obvious implications for our healthcare systems and for society in addition to profound consequences for each MM patient. The incidence and prevalence of MM has increased significantly over the last several decades.90 Given the improved diagnostic and therapeutic options now available, there are changes in strategy from the past to the future aiming for functional cure, as summarized in Table 4. Patients are now diagnosed earlier and survive longer with their disease than in the past.23 However, current treatments are applied until progression, which supposes a significant burden on healthcare resource utilization. The vision of curing MM patients and ultimately achieving a fixed duration of treatment would not only alleviate side effects but would also be more cost effective compared to continuing the application with multiple lines of therapy. In addition to this cost reduction, curing myeloma would also have implications for healthcare resource
allocation. Currently, MM requires long-term treatment and management which places a substantial burden on healthcare providers. Achieving a functional cure of MM would enable these resources to be redirected to other areas of need so easing the demands on hospital resources and reducing the needs for ongoing treatment. Furthermore, when an individual develops MM this can lead to reduced productivity and possible unemployment due to treatment-related side effects and physical limitations.4,69,91 Ultimately fostering a cure for MM would empower patients and the community, and instill positivity, so inspiring others with, not least, reinforcement of belief in the value of medical science, and its potential for overcoming great and seemingly impossible challenges.
Disclosures
ME has received clinical study support, advisory compensation, honoraria and travel support from Amgen, BMS, Janssen, GSK, Sanofi, Takeda, Pfizer, and Stemline. MK has sat on advisory boards and/or received honoraria or research support from Abbvie, BMS, GSK, Janssen, Pfizer, Sanofi and Takeda. HG has received grants from Amgen, BMS, Janssen, and Sanofi; research support for clinical studies from BMS, GSK, Janssen, Stemline, Pfizer, Sanofi, Takeda, and Novartis; and advisory board fees, honoraria and travel support from Amgen, BMS, Janssen, Sanofi, GSK, and Pfizer. MM has received advisory board fees, honoraria and research support from Amgen, BMS/Celgene, Gilead, Janssen, Stemline, Springworks, and Takeda. The authors declare no competing financial interests related to this review.
Contributions
ME and MM wrote the paper and performed the analysis as displayed in the Tables and Figures. MM, HG, MKK, and ME designed the analysis and revised the data. All authors approved and carefully corrected the paper.
Acknowledgments
The authors thank DSMM, GMMG, EMN and IMWG experts for their support and prior recommendations on this review and Prof. Dr. Ralph Wäsch (Freiburg) for critical input and support for image perfection. We thank all MM patients who participated in DSMM/GMMG/EMN and other sponsor-initiated clinical studies. The results were and are to be presented in part at the German, Austrian and Swiss Annual Hematology & Oncology Meeting (DGHO 10/2023) and 14th Freiburg Myeloma Workshop 25.10.2023. We specifically thank the Haematologica reviewers and editorial team for their enthusiastic support of this article.
Data-sharing statement
The data that support the findings of this review are available from the corresponding authors (ME, MM) upon reasonable request.
References
1. Van de Donk NWCJ, Pawlyn C, Yong KL. Multiple myeloma. Lancet. 2021;397(10272):410-427.
2. Hieke S, Kleber M, König C, Engelhardt M, Schumacher M. Conditional survival: a useful concept to provide information on how prognosis evolves over time. Clin Cancer Res. 2015;21(7):1530-1536.
3. Schumacher M, Hieke S, Ihorst G, Engelhardt M. Dynamic prediction: a challenge for biostatisticians, but greatly needed by patients, physicians and the public. Biom J. 2020;62(3):822-835.
4 Schinke M, Ihorst G, Duyster J, Wäsch R, Schumacher M, Engelhardt M. Risk of disease recurrence and survival in patients with multiple myeloma: a German Study Group analysis using a conditional survival approach with long-term follow-up of 815 patients. Cancer. 2020;126(15):3504-3515.
5. Tralongo P, Maso LD, Surbone A, et al. Use of the word “cured” for cancer patients—implications for patients and physicians: the Siracusa charter. Curr Oncol. 2015;22(1):e38-e40.
6. van de Donk NWCJ, Palumbo A, Johnsen HE, et al. The clinical relevance and management of monoclonal gammopathy of undetermined significance and related disorders: recommendations from the European Myeloma Network. Haematologica. 2014;99(6):984-996.
7 Musto P, Engelhardt M, Caers J, et al. 2021 European Myeloma Network review and consensus statement on smoldering multiple myeloma: how to distinguish (and manage) Dr. Jekyll and Mr. Hyde. Haematologica. 2021;106(11):2799-2812.
8. Engelhardt M, Dold SM, Ihorst G, et al. Geriatric assessment in multiple myeloma patients: validation of the International Myeloma Working Group (IMWG) score and comparison with other common comorbidity scores. Haematologica. 2016;101(9):1110-1119.
9. Engelhardt M, Domm A-S, Dold SM, et al. A concise revised Myeloma Comorbidity Index as a valid prognostic instrument in a large cohort of 801 multiple myeloma patients. Haematologica. 2017;102(5):910-921.
10 Engelhardt M, Ihorst G, Duque-Afonso J, et al. Structured assessment of frailty in multiple myeloma as a paradigm of individualized treatment algorithms in cancer patients at advanced age. Haematologica. 2020;105(5):1183-1188.
11. Knop S, Engelhardt M, Liebisch P, et al. Allogeneic transplantation in multiple myeloma: long-term follow-up and cytogenetic subgroup analysis. Leukemia. 2019;33(11):2710-2719.
12. Mohty M, Avet-Loiseau H, Harousseau J-L. Requirements for operational cure in multiple myeloma. Blood. 2021;138(16):1406-1411.
13. Bence Jones H. Some account of a new animal substance occurring in the urine of a patient labouring under mollities ossium. Edinb Med Surg J. 1850;74(185):357-368.
14 Alexanian R, Bergsagel DE, Migliore PJ, Vaughn WK, Howe CD. Melphalan therapy for plasma cell myeloma. Blood. 1968;31(1):1-10.
15. Singhal S, Mehta J, Desikan R, et al. Antitumor activity of thalidomide in refractory multiple myeloma. N Engl J Med. 1999;341(21):1565-1571.
16. Barlogie B, Hall R, Zander A, Dicke K, Alexanian R. High-dose melphalan with autologous bone marrow transplantation for multiple myeloma. Blood. 1986;67(5):1298-1301.
17 Usmani SZ, Hoering A, Cavo M, et al. Clinical predictors of long-term survival in newly diagnosed transplant eligible multiple myeloma - an IMWG research project. Blood Cancer J.
2018;8(12):123.
18. Munshi NC, Avet-Loiseau H, Anderson KC, et al. A large metaanalysis establishes the role of MRD negativity in long-term survival outcomes in patients with multiple myeloma. Blood Adv. 2020;4(23):5988-5999.
19 Rajkumar SV, Dimopoulos MA, Palumbo A, et al. International Myeloma Working Group updated criteria for the diagnosis of multiple myeloma. Lancet Oncol. 2014;15(12):e538-548.
20 Kumar S, Paiva B, Anderson KC, et al. International Myeloma Working Group consensus criteria for response and minimal residual disease assessment in multiple myeloma. Lancet Oncol. 2016;17(8):e328-e346.
21. Manier S, Salem KZ, Park J, Landau DA, Getz G, Ghobrial IM. Genomic complexity of multiple myeloma and its clinical implications. Nat Rev Clin Oncol. 2017;14(2):100-113.
22. Dutta AK, Alberge J-B, Sklavenitis-Pistofidis R, Lightbody ED, Getz G, Ghobrial IM. Single-cell profiling of tumour evolution in multiple myeloma - opportunities for precision medicine. Nat Rev Clin Oncol. 2022;19(4):223-236.
23. Dispenzieri A, Stewart AK, Chanan-Khan A, et al. Smoldering multiple myeloma requiring treatment: time for a new definition? Blood. 2013;122(26):4172-4181.
24. Boiarsky R, Haradhvala NJ, Alberge J-B, et al. Single cell characterization of myeloma and its precursor conditions reveals transcriptional signatures of early tumorigenesis. Nat Commun. 2022;13(1):7040.
25. Cohen YC, Zada M, Wang S-Y, et al. Identification of resistance pathways and therapeutic targets in relapsed multiple myeloma patients through single-cell sequencing. Nat Med. 2021;27(3):491-503.
26. Zavidij O, Haradhvala NJ, Mouhieddine TH, et al. Single-cell RNA sequencing reveals compromised immune microenvironment in precursor stages of multiple myeloma. Nat Cancer. 2020;1(5):493-506.
27. Da Vià MC, Dietrich O, Truger M, et al. Homozygous BCMA gene deletion in response to anti-BCMA CAR T cells in a patient with multiple myeloma. Nat Med. 2021;27(4):616-619.
28. Samur MK, Fulciniti M, Aktas Samur A, et al. Biallelic loss of BCMA as a resistance mechanism to CAR T cell therapy in a patient with multiple myeloma. Nat Commun. 2021;12(1):868.
29 Friedrich MJ, Neri P, Kehl N, et al. The pre-existing T cell landscape determines the response to bispecific T cell engagers in multiple myeloma patients. Cancer Cell. 2023;41(4):711-725.
30. Andreozzi F, Dragani M, Quivoron C, et al. Precision medicine approach based on molecular alterations for patients with relapsed or refractory multiple myeloma: results from the MM-EP1 study. Cancers. 2023;15(5):1508.
31. John L, Krauth MT, Podar K, Raab M-S. Pathway-directed therapy in multiple myeloma. Cancers. 2021;13(7):1668.
32. Andrulis M, Lehners N, Capper D, et al. Targeting the BRAF V600E mutation in multiple myeloma. Cancer Discov. 2013;3(8):862-869.
33. Giesen N, Chatterjee M, Scheid C, et al. A phase 2 clinical trial of combined BRAF/MEK inhibition for BRAFV600E-mutated multiple myeloma. Blood. 2023;141(14):1685-1690.
34. Richardson PG, Oriol A, Larocca A, et al. Melflufen and dexamethasone in heavily pretreated relapsed and refractory multiple myeloma. J Clin Oncol. 2021;39(7):757-767.
35. Richardson PG, Trudel S, Popat R, et al. Mezigdomide plus
dexamethasone in relapsed and refractory multiple myeloma. N Engl J Med. 2023;389(11):1009-1022.
36. Richardson PG, p SJ, Weller EA, et al. Triplet therapy, transplantation, and maintenance until progression in myeloma. N Engl J Med. 2022;387(2):132-147.
37. Gay F, Musto P, Rota-Scalabrini D, et al. Carfilzomib with cyclophosphamide and dexamethasone or lenalidomide and dexamethasone plus autologous transplantation or carfilzomib plus lenalidomide and dexamethasone, followed by maintenance with carfilzomib plus lenalidomide or lenalidomide alone for patients with newly diagnosed multiple myeloma (FORTE): a randomised, open-label, phase 2 trial. Lancet Oncol. 2021;22(12):1705-1720.
38. Moreau P, Attal M, Hulin C, et al. Bortezomib, thalidomide, and dexamethasone with or without daratumumab before and after autologous stem-cell transplantation for newly diagnosed multiple myeloma (CASSIOPEIA): a randomised, open-label, phase 3 study. Lancet. 2019;394(10192):29-38.
39. Voorhees PM, Kaufman JL, Laubach J, et al. Daratumumab, lenalidomide, bortezomib, and dexamethasone for transplanteligible newly diagnosed multiple myeloma: the GRIFFIN trial. Blood. 2020;136(8):936-945.
40 Costa LJ, Chhabra S, Medvedova E, et al. Daratumumab, carfilzomib, lenalidomide, and dexamethasone with minimal residual disease response-adapted therapy in newly diagnosed multiple myeloma. J Clin Oncol. 2022;40(25):2901-2912.
41. Goldschmidt H, Mai EK, Bertsch U, et al. Addition of isatuximab to lenalidomide, bortezomib, and dexamethasone as induction therapy for newly diagnosed, transplantation-eligible patients with multiple myeloma (GMMG-HD7): part 1 of an open-label, multicentre, randomised, active-controlled, phase 3 trial. Lancet Haematol. 2022;9(11):e810-e821.
42. Gay F, Roeloffzen W, Dimopoulos MA, et al. Results of the phase III randomized Iskia trial: isatuximab-carfilzomib-lenalidomidedexamethasone vs carfilzomib-lenalidomide-dexamethasone as pre-transplant induction and post-transplant consolidation in newly diagnosed multiple myeloma patients. Blood. 2023;142(Suppl 1):4.
43. Sonneveld P, Dimopoulos MA, Boccadoro M, et al. Daratumumab, bortezomib, lenalidomide, and dexamethasone for multiple myeloma. N Engl J Med. 2024;390(4):301-313.
44 Facon T, Kumar S, Plesner T, et al. Daratumumab plus lenalidomide and dexamethasone for untreated myeloma. N Engl J Med. 2019;380(22):2104-2115.
45. Facon T, Cook G, Usmani SZ, et al. Daratumumab plus lenalidomide and dexamethasone in transplant-ineligible newly diagnosed multiple myeloma: frailty subgroup analysis of MAIA. Leukemia. 2022;36(4):1066-1077.
46. San-Miguel J, Avet-Loiseau H, Paiva B, et al. Sustained minimal residual disease negativity in newly diagnosed multiple myeloma and the impact of daratumumab in MAIA and ALCYONE. Blood. 2022;139(4):492-501.
47. Mateos M-V, Dimopoulos MA, Cavo M, et al. Daratumumab plus bortezomib, melphalan, and prednisone for untreated myeloma. N Engl J Med. 2018;378(6):518-528.
48. Mateos M-V, Cavo M, Blade J, et al. Overall survival with daratumumab, bortezomib, melphalan, and prednisone in newly diagnosed multiple myeloma (ALCYONE): a randomised, openlabel, phase 3 trial. Lancet. 2020;395(10218):132-141.
49 Munshi NC, Anderson LD, Shah N, et al. Idecabtagene vicleucel in relapsed and refractory multiple myeloma. N Engl J Med. 2021;384(8):705-716.
50 Berdeja JG, Madduri D, Usmani SZ, et al. Ciltacabtagene autoleucel, a B-cell maturation antigen-directed chimeric antigen receptor T-cell therapy in patients with relapsed or refractory multiple myeloma (CARTITUDE-1): a phase 1b/2 open-label study. Lancet. 2021;398(10297):314-324.
51. Martin T, Usmani SZ, Berdeja JG, et al. Ciltacabtagene autoleucel, an anti-B-cell maturation antigen chimeric antigen receptor T-cell therapy, for relapsed/refractory multiple myeloma: CARTITUDE-1 2-year follow-up. J Clin Oncol. 2022;41(6):1265-1274.
52. Mi J-Q, Zhao W, Jing H, et al. Phase II, open-label study of ciltacabtagene autoleucel, an anti-B-cell maturation antigen chimeric antigen receptor-T-cell therapy, in Chinese patients with relapsed/refractory multiple myeloma (CARTIFAN-1). J Clin Oncol. 2023;41(6):1275-1284.
53. Mailankody S, Devlin SM, Landa J, et al. GPRC5D-targeted CAR T cells for myeloma. N Engl J Med. 2022;387(13):1196-1206.
54 San-Miguel J, Dhakal B, Yong K, et al. Cilta-cel or standard care in lenalidomide-refractory multiple myeloma. N Engl J Med. 2023;389(4):335-347.
55. Rodriguez-Otero P, Ailawadhi S, Arnulf B, et al. Ide-cel or standard regimens in relapsed and refractory multiple myeloma. N Engl J Med. 2023;388(11):1002-1014.
56. Alqazaqi R, Schinke C, Thanendrarajan S, et al. Geographic and racial disparities in access to chimeric antigen receptor-T cells and bispecific antibodies trials for multiple myeloma. JAMA Netw Open. 2022;5(8):e2228877.
57. Engelhardt M, Selder R, Pandurevic M, et al. [Multidisciplinary tumor boards: facts and satisfaction analysis of an indispensable comprehensive cancer center instrument]. Dtsch Med Wochenschr. 2017;142(9):e51-e60.
58. Engelhardt M, Brioli A, von Lilienfeld-Toal M. [Differences due to socio-economic status, genetic background and sex in cancer and precision medicine - an intersectional approach to close the care gap for marginalized groups]. Dtsch Med Wochenschr. 2023;148(9):528-538.
59 Frank B, Ihorst G, Herget G, et al. Multidisciplinary tumor board analysis: validation study of a central tool in tumor centers. Ann Hematol. 2023;102(3):603-611.
60 Moreau P, Touzeau C. T-cell-redirecting bispecific antibodies in multiple myeloma: a revolution? Blood. 2022;139(26):3681-3687.
61. Moreau P, Garfall AL, van de Donk NWCJ, et al. Teclistamab in relapsed or refractory multiple myeloma. N Engl J Med. 2022;387(6):495-505.
62. Chari A, Minnema MC, Berdeja JG, et al. Talquetamab, a T-cellredirecting GPRC5D bispecific antibody for multiple myeloma. N Engl J Med. 2022;387(24):2232-2244.
63. Ludwig H, Terpos E, van de Donk N, et al. Prevention and management of adverse events during treatment with bispecific antibodies and CAR T cells in multiple myeloma: a consensus report of the European Myeloma Network. Lancet Oncol. 2023;24(6):e255-e269.
64. Larocca A, Dold SM, Zweegman S, et al. Patient-centered practice in elderly myeloma patients: an overview and consensus from the European Myeloma Network (EMN). Leukemia. 2018;32(8):1697-1712.
65. Straka C, Liebisch P, Salwender H, et al. Autotransplant with and without induction chemotherapy in older multiple myeloma patients: long-term outcome of a randomized trial. Haematologica. 2016;101(11):1398-1406.
66. Straka C, Schaefer-Eckart K, Hertenstein B, et al. Long-term outcome of a prospective randomized trial comparing
continuous lenalidomide/dexamethasone with lenalidomide/ dexamethasone induction, MEL140 with autologous blood stem cell transplantation and single agent lenalidomide maintenance in patients of age 60-75 years with newly diagnosed multiple myeloma. Blood. 2022;140(Suppl 1):287-288.
67. Houde CA, Khan A, Jacobus SJ, et al. Treatment outcomes and prognostic factors with lenalidomide, bortezomib, and dexamethasone (RVd) alone versus Rvd plus autologous stem cell transplantation (ASCT) in African American (AA) patients (pts) with newly diagnosed multiple myeloma (NDMM) in the DETERMINATION phase 3 trial. Blood. 2023;142(Suppl 1):4762.
68. Mian H, McCurdy A, Giri S, et al. The prevalence and outcomes of frail older adults in clinical trials in multiple myeloma: a systematic review. Blood Cancer J. 2023;13(1):6.
69 Holler M, Ihorst G, Reinhardt H, et al. An objective assessment in newly diagnosed multiple myeloma to avoid treatment complications and strengthen therapy adherence. Haematologica. 2023;108(4):1115-1126.
70. Facon T, Cook G, Usmani SZ, et al. Daratumumab plus lenalidomide and dexamethasone in transplant-ineligible newly diagnosed multiple myeloma: frailty subgroup analysis of MAIA. Leukemia. 2022;36(4):1066-1077.
71. Mateos M-V, Dimopoulos MA, Cavo M, et al. Daratumumab plus bortezomib, melphalan, and prednisone versus bortezomib, melphalan, and prednisone in transplant-ineligible newly diagnosed multiple myeloma: frailty subgroup analysis of ALCYONE. Clin Lymphoma Myeloma Leuk. 2021;21(11):785-798.
72. Terpos E, Mikhael J, Hajek R, et al. Management of patients with multiple myeloma beyond the clinical-trial setting: understanding the balance between efficacy, safety and tolerability, and quality of life. Blood Cancer J. 2021;11(2):40.
73. Rajeeve S, Usmani SZ. How old is too old for CAR-T cell therapies in multiple myeloma? Transplant Cell Ther. 2023;29(6):343-344.
74. O’Donnell EK, Shapiro YN, Yee AJ, et al. Quality of life, psychological distress, and prognostic perceptions in patients with multiple myeloma. Cancer. 2022;128(10):1996-2004.
75. Möller M-D, Ihorst G, Pahl A, et al. Physical activity is associated with less comorbidity, better treatment tolerance and improved response in patients with multiple myeloma undergoing stem cell transplantation. J Geriatr Oncol. 2021;12(4):521-530.
76. Möller M-D, Gengenbach L, Graziani G, Greil C, Wäsch R, Engelhardt M. Geriatric assessments and frailty scores in multiple myeloma patients: a needed tool for individualized treatment? Curr Opin Oncol. 2021;33(6):648-657.
77 Tang L, Pan Z, Zhang X. The effect of marital status on the survival of patients with multiple myeloma. Hematology. 2022;27(1):187-197.
78. Terpos E, Zamagni E, Lentzsch S, et al. Treatment of multiple myeloma-related bone disease: recommendations from the Bone Working Group of the International Myeloma Working Group. Lancet Oncol. 2021;22(3):e119-e130.
79 Shah UA, Parikh R, Castro F, Bellone M, Lesokhin AM. Dietary and microbiome evidence in multiple myeloma and other plasma cell disorders. Leukemia. 2023;37(5):964-980.
80 Shah UA, Maclachlan KH, Derkach A, et al. Sustained minimal residual disease negativity in multiple myeloma is associated with stool butyrate and healthier plant-based diets. Clin Cancer Res. 2022;28(23):5149-5155.
81. Vernieri C, Fucà G, Ligorio F, et al. Fasting-mimicking diet is safe and reshapes metabolism and antitumor immunity in patients with cancer. Cancer Discov. 2022;12(1):90-107.
82. Sheu M, Molina Garcia S, Patel M, et al. Intravenous immunoglobulin prophylaxis is associated with decreased rate of infection-related hospitalizations in multiple myeloma patients. Hematol Oncol. 2023;41(4):718-724.
83. Gupta VA, Barwick BG, Matulis SM, et al. Venetoclax sensitivity in multiple myeloma is associated with B-cell gene expression. Blood. 2021;137(26):3604-3615.
84. Raab MS, Lehners N, Xu J, et al. Spatially divergent clonal evolution in multiple myeloma: overcoming resistance to BRAF inhibition. Blood. 2016;127(17):2155-2157.
85. Rasche L, Chavan SS, Stephens OW, et al. Spatial genomic heterogeneity in multiple myeloma revealed by multi-region sequencing. Nat Commun. 2017;8(1):268.
86. Rasche L, Schinke C, Maura F, et al. The spatio-temporal evolution of multiple myeloma from baseline to relapserefractory states. Nat Commun. 2022;13(1):4517.
87. Merz M, Merz AMA, Wang J, et al. Deciphering spatial genomic heterogeneity at a single cell resolution in multiple myeloma. Nat Commun. 2022;13(1):807.
88. Merz M, Hu Q, Merz AMA, et al. Spatiotemporal assessment of immunogenomic heterogeneity in multiple myeloma. Blood Adv. 2023;7(5):718-733.
89 Richardson PG, San Miguel JF, Moreau P, et al. Interpreting clinical trial data in multiple myeloma: translating findings to the real-world setting. Blood Cancer J. 2018;8(11):109.
90 Cowan AJ, Allen C, Barac A, et al. Global burden of multiple myeloma: a systematic analysis for the Global Burden of Disease Study 2016. JAMA Oncol. 2018;4(9):1221.
91. Scheubeck S, Ihorst G, Schoeller K, et al. Comparison of the prognostic significance of 5 comorbidity scores and 12 functional tests in a prospective multiple myeloma patient cohort. Cancer. 2021;127(18):3422-3436.
92. Mateos M-V, Nooka AK, Larson SM. Moving toward a cure for myeloma. Am Soc Clin Oncol Educ Book. 2022;42:1-12.
Efanesoctocog alfa: the renaissance of Factor VIII replacement therapy
Yesim Dargaud,1,2 Alexandre Leuci,2 Alejandra Reyes Ruiz3 and Sebastien Lacroix-Desmazes3
1French Reference Center for Haemophilia, Clinical Haemostasis Unit, Hopital Louis Pradel, Lyon; 2UR4609 Research Unit on Haemostasis and Thrombosis, University Claude Bernard Lyon 1, Lyon and 3Institut National de la Santé et de la Recherche Médicale, Centre de Recherche des Cordeliers, CNRS, Sorbonne Université, Université Paris Cité, F-75006 Paris, France
Abstract
Correspondence: Y. Dargaud ydargaud@univ-lyon1.fr
Received: December 4, 2023. Accepted: February 6, 2024. Early view: February 15, 2024.
Efanesoctocog alfa (Altuviiio,TM Sanofi-SOBI) is a B domain-deleted single-chain Factor VIII (FVIII) connected to D’D3 domain of von Willebrand Factor (vWF). Its ingenious design allows efanesoctocog alfa to operate independently of endogenous vWF and results in an outstanding 3-4 times longer half-life compared to standard and extended half-life (EHL) FVIII products. The prolonged half-life ensures sustained high levels of factor activity, maintaining normal to near-normal ranges for the majority of the week, facilitating the convenience of once-weekly administration. Efanesoctocog alfa received regulatory approval in 2023 for application in both adults and children with inherited hemophilia A in the United States and Japan. Its sanctioned use encompasses both prophylaxis and ‘on demand’ treatment for bleeding episodes. The European Medicines Agency (EMA) is currently undertaking a comprehensive review of Altuviiio.TM This comprehensive review focuses on the immunological profile of efanesoctocog alfa, a highly sophisticated new class of EHL FVIII molecule. The integration of the vWF D’D3 domain, XTEN polypeptides, and potential regulatory T-cell epitopes within various segments of efanesoctocog alfa collectively serves as a mitigating factor against the development of a neutralizing T-cell-mediated immune response. We hypothesize that such distinctive attribute may significantly reduce the risk of neutralizing antibodies, particularly in previously untreated patients. The discussion extends beyond regulatory approval to encompass the preclinical and clinical development of efanesoctocog alfa, including considerations for laboratory monitoring. The review also highlights areas that warrant further investigation to deepen our understanding of this groundbreaking therapeutic agent.
Introduction
Hemophilia A (HA) is an X-linked genetic disorder in which blood clotting ability is impaired due to a deficiency in Factor VIII (FVIII), resulting in prolonged bleeding.1 Affected individuals exhibit severe, moderate, or mild forms, categorized by circulating FVIII plasma levels.1 Bleeding severity correlates with FVIII deficiency. Joints are the primary site of bleeding, resulting in hemophilic arthropathy, characterized by irreversible joint damage, physical disability, and chronic pain.2 Prophylaxis is the sole proven method significantly reducing the risk of hemophilic arthropathy and is considered the gold standard for managing patients with frequent bleeding.3 Historical challenges, such as frequent injections and limited venous access, impeded widespread
prophylaxis use in high-income countries and posed cost barriers in middle- and low-income countries. In the past 15 years, advances in HA treatment include extended halflife FVIII (EHL-FVIII), FVIII mimetics, non-factor therapies, and gene therapy.4 Recent progress has improved patient quality of life (QoL) by reducing prophylactic injection frequency and transitioning from intravenous to subcutaneous injections. However, despite these advancements, hemophilic arthropathy remains a significant complication of hemophilia in 2023.5
Efanesoctocog alfa (Altuviiio,® BIVV001, Swedish Orphan Biovitrum AB ([SOBI]-Sanofi) is a new class of rFVIII molecule with EHL. It has been specifically designed and developed to address the limitations associated with currently available FVIII concentrates.
From standard to first-generation extended-half-life Factor VIII molecules
A decade ago, with only plasma-derived or standard half-life (SHL) recombinant FVIII (rFVIII) concentrates available for treating HA, the primary clinical concern was the risk of developing inhibitors.6 Hematologists, especially when dealing with previously untreated patients (PUP), based treatment choices on the inhibitor risk associated with the available products. Conflicting study reports on inhibitor development risk for recombinant and plasma-derived FVIII products,6-8 observations of young adults discontinuing prophylaxis, treatment burden with venous access challenges, painful injections, and the time required for intravenous infusion9 collectively contributed to adherence issues and accelerated the development of novel EHL-rFVIII molecules to improve patient compliance with long-term prophylaxis.
Strategies used to prolong the half-life of rFVIII molecules include - i) covalent attachment of rFVIII to polyethylene glycol (PEGylation) which reduces interactions with clearance receptors, thereby prolonging half-life; ii) fusing rFVIII to the crystallizable fragment (Fc) part of IgG1 immunoglobulins, delaying rFVIII degradation through recycling in FcRn-bearing cells. By contrast with EHL recombinant Factor IX molecules, which have a half-life 4 to 5 times longer than that of standard Factor IX, the application of these approaches has only been able to extend the half-life of FVIII by approximately 1.5 to 1.8 times. A comprehensive understanding of interactions between FVIII and von Willebrand Factor (vWF) is critical to appreciate the challenges posed by first-generation EHL rFVIII. Factor VIII is produced by vascular endothelial cells and hepatic sinusoidal cells.10 Most of the produced FVIII circulates bound to its chaperone protein, the large multimeric vWF11 which is synthesised by endothelial cells and megakaryocytes. Plasma vWF levels are in a 30 to 50-fold molar excess over FVIII. In the absence of vWF, FVIII is rapidly cleared from the circulation (with a half-life of 2 hours), as seen in type 3 vWD. By contrast, vWF-bound FVIII remains in the blood for 12 hours, vWF itself having a half-life of 12 to 15 hours.10
Recombinant FVIII molecules synthesized using PEGylation or fusion approaches retain their ability to bind vWF, and follow the degradation pathways of the transporter protein. As a result, their half-life remains driven by that of vWF. Therefore, PEGylated and fusion FVIII products exhibit nearly identical pharmacokinetic (PK) profiles in terms of half-life, clearance, area under the curve (AUC). They all fail to maintain high trough levels (>5%) with considerable inter-subject variation in all PK parameters, primarily influenced by blood group, particularly its impact on vWF levels.12
Receptors and cell types involved in the clearance of FVIII and vWF are not fully understood. Scavenger receptors involved in the clearance of FVIII, vWF or the FVIII/vWF
complex include low-density lipoprotein receptor-related protein-1 (LRP1), low-density lipoprotein receptor (LDLR), asialoglycoprotein receptor (ASGPR), macrophage mannose receptor type 1 (MMR/CD106), heparan sulphate protease type 1 (HSPT1), macrophage mannose receptor type 1 (MMR/ CD206), heparan sulphate proteoglycans, sialic acid-binding IgG-like lectin 5 (Siglec5), scavenger receptor class A member 5 (SCARA5), stabilin-2 (STAB2) and C-type lectin domain family 4 member M (CLEC4M).13
Structure and synthesis of efanesoctocog alfa
Type 2N vWD, characterized by normal plasma vWF but reduced FVIII levels, is associated with mutations in the D’D3 domains of vWF that interfere with FVIII binding.14 The vWF D’D3 domains alone are sufficient to stabilize FVIII in vivo 15 The development of efanesoctocog alfa (Efa) was based on the hypothesis that the half-life limitation imposed by vWF could be overcome by designing a rFVIII molecule unable to bind endogenous vWF. Efa is produced in HEK293 cells after transfection with three expression vectors:16 i) one encoding human BDD FVIII-XTEN-Fc; ii) one encoding vWF D1D2D’D3C1099A/C1142A domains-XTEN-Fc; and iii) one encoding PACE/furin (Figure 1). PACE/furin mediates the intracellular cleavage of the vWF D1D2 propeptide, while cis-addition of the vWF propeptide D1D2 ensures optimal folding of vWF D’D3 and highest affinity for FVIII. The resulting heterodimeric protein is purified by affinity chromatography on a FVIII-Select resin, followed by additional chromatographic steps. XTEN, an unstructured hydrophilic recombinant polypeptide, can be customized to any molecular weight. Fusion of XTEN to therapeutic proteins enhances their PK properties.17 Efa contains 2 XTEN polypeptides: a 288 amino acid-long XTEN is located between the A2 and a3 domains of FVIII, and a 144 amino acid-long XTEN is located between the D’D3 and Fc domains. This configuration helps reduce the in vivo clearance of the molecule. In addition, a thrombin cleavage site, the FVIII acidic region a2, was inserted between the D’D3 and Fc domains of Efa. This site allows rFVIII to be released from the D’D3 domains as soon as the first traces of thrombin are generated after coagulation activation. Finally, removal of the PPVLKRHQR sequence in the N-terminal end of FVIII a3 domain eliminates the furin cleavage site between the heavy and light chains of FVIII, favoring the production of FVIII as a single polypeptide.
Preclinical development of efanesoctocog alfa
The PK profile of Efa was evaluated in FVIII knockout (KO), double FVIII and vWF KO (DKO) mice and in non-human primates. PK studies in DKO mice showed that fusion with D’D3
Figure 1. Structure of efanesoctocog alfa. Efanesoctocog alfa (Efa) is a heterodimeric glycoprotein produced in HEK293 cells after transfection with 3 expression vectors. These vectors include a plasmid encoding a human BDD Factor VIII (FVIII)-XTEN288-crystallizable fragment (Fc) construct, a plasmid encoding von Willebrand Factor (vWF) D1D2D’D3C1099A/C1142A domains-XTEN144-Fc, and a plasmid allowing the expression of PACE/furin. The structure of Efa includes the parental recombinant Factor VIII Fc (rFVIIIFc) with a 288 aa-long XTEN (XTEN288) integrated between the FVIII A2 and a3 domains, and the vWF D’D3 domains fused to a 114 aa-long XTEN (XTEN144) and to a Fc fragment. The C1099A and C1142A mutations in D’D3 prevent dimerization of the domain. The D1D2 and D’D3 domains are separated by a furing cleavage site. The interaction between the FVIII- XTEN288-Fc and the D’D3XTEN144-Fc is maintained by the pairing of the 2 Fc fragments and the low affinity between D’D3 and the FVIII light chain. The heterodimers, thus, present with an avidity that exceeds the affinity of FVIII for endognous vWF in the patients’ blood, and the in vivo half-life of Efa is independent from that of the endogenous vWF.
domains stabilizes FVIII in the absence of endogenous vWF. Observation of the same half-life in FVIII KO and DKO mice further demonstrated the absence of interaction between Efa and endogenous vWF. The calculated half-life of Efa in mice and primates showed a 3- to 4-fold increase compared to wild-type FVIII.18 The same studies in mice reported reduced blood loss similar to that of the tail clip experiment, reflecting comparable in vivo hemostatic activity between FVIII and Efa. These preclinical experiments were complemented by an in vitro study evaluating the hemostatic properties of Efa and its in vivo hemostatic capacity in the saphenous vein bleeding model.19 No difference in efficacy was observed between wild-type FVIII and Efa in terms of fibrin polymerization and fibrin resistance to fibrinolysis in the presence of tPA. The kinetics of platelet thrombus formation in the saphenous vein model was also comparable.18
Clinical trials: establishing the efficacy and safety of efanesoctocog alfa
The 3- to 4-fold increase in half-life observed in animal models was confirmed in an open-label phase I-IIa study, in 16 adult patients with severe HA. The geometric mean
half-life of Efa was 37.6 hours for a dose of 25 IU/kg compared with 9.1 hours for standard half-life FVIII (SHL-FVIII) and 42.5 hours for a dose of 65 IU/kg compared with 13.2 hours for SHL-FVIII.20 The 8 patients who received a 65 IU/kg dose maintained a circulating FVIII level above 50% for five days. Their level of circulating FVIII was 17% at seven days and 1% 14 days after a single injection of Efa. At these time points, there was no detectable FVIII in the plasma of patients receiving the same dose of SHL-FVIII.20
A phase I repeat-dose study confirmed a mean half-life of 37-41 hours for Efa. This study also reported minimal accumulation of Efa after 4 weekly injections of 50 or 65 IU/kg. Mean AUC, obtained with doses of 65 IU/kg, was up to 7 times higher than with rFVIII (mean AUCτ 11,500 IU.h/ dL in adults/adolescents).21
In phase I and II studies, none of the patients developed anti-FVIII inhibitors nor thrombotic complications. No patient treated with Efa experienced bleeding in the seven days following injection of the drug.21
Based on these results, the 50 IU/kg dose was selected for the XTEND-1 pivotal phase III study.22 This trial involved 2 arms: a group of 133 previously treated severe HA patients
aged >12 years, receiving prophylaxis with a weekly dose of Efa 50 IU/kg for one year; a group of 26 similar patients receiving on demand treatment. Patients in the prophylaxis arm were on long-term prophylaxis before the study, while those in the ‘on demand’ arm had experienced at least 6 bleeds in the previous six months. The primary endpoint was the annual bleeding rate (ABR) in the prophylaxis arm, with secondary endpoints including ABR comparison on Efa prophylaxis and during the observation period, along with safety, PK, pain intensity, joint health, and QoL. The mean ABR and one-sided 97.5% Confidence Interval (CI) was estimated for prophylaxis treatment in patients who had at least six months of available efficacy data from both the prestudy and XTEND-1. Once-weekly doses of Efa 50 IU/ kg were well tolerated and no accumulation was observed after repeated infusions.
In the ‘prophylaxis’ group, plasma FVIII levels were maintained above 40 IU/dL for at least four days and at 15 IU/ dL at day 7 after the injection of Efa at steady state. Altogether, 65% of patients had zero bleeding episodes. The median ABR with Efa prophylaxis was 0 (range 0-1.04). The study demonstrated the superiority of Efa prophylaxis over SHL and EHL-FVIII products, with ABR decreasing from 2.96 (95% CI: 2.00-4.37) to 0.69 (95% CI: 0.43-1.11) (P<0.001). Patients on prophylaxis reported a reduction in chronic pain (P=0.03) and improvement in joint health as assessed by the Hemophilia Joint Health Score (HJHS) (P=0.01). All 45 target joints resolved in the 14 patients with target joints identified at baseline and at least 12 months of study prophylaxis. In the ‘on demand’ group B, 97% of bleeding events were successfully stopped with a single injection of Efa 50 IU/kg.
After 52 weeks of Efa prophylaxis, health-related QoL was evaluated using the Haem-A-QoL questionnaire and compared to baseline. Significant QoL improvements were noted in 7 of the 10 domains, including self-perception (P<0.0001), physical health (P=0.0001), work and school life (P=0.0038), sports and leisure (P=0.0006), treatment (P<0.0001), feeling (P=0.0078), and partnership & sexuality (P=0.0148).23 Post-treatment interviews with 29 patients indicated a significant improvement in physical activities and pain.24
The XTEND-Kids clinical trial (clinicaltrials.gov 04759131) demonstrated that once-weekly Efa administration was well tolerated and provided highly effective bleeding control and treatment in children with severe HA. Seventy-four previously treated boys participated to the study (<6 years old: N=38; 6-<12 years old: N=36). The mean half-life of Efa in children was 40.2 hours with a mean FVIII activity >40 IU/dL for three days, >15 IU/dL for approximately five days and >10 IU/dL for approximately seven days. The median (interquartile range) and mean (95% CI) ABR were 0.00 (0.001.02) and 0.89 (0.56-1.42), respectively. Most hemorrhages resolved with a single dose of 50 IU/kg. No FVIII inhibitor was detected (0%, 95% CI: 0-4.9%).25 The mean (95% CI)
ABR, spontaneous ABR and joint ABR were respectively 0.61 (0.42-0.90), 0.16 (0.08-0.31), and 0.30 (0.16-0.57). Overall, 88% of the patients had no spontaneous bleed and 84% had no joint bleed. A single dose of Efa 50 IU/kg resolved 95% of bleeds in children.26
The PK characteristics of Efa and its clinical efficacy suggest its potential use in combination with emicizumab for surgery or major breakthrough bleeding episodes, aiming to maintain elevated FVIII levels with fewer injections. Given the higher affinity of FVIII for FIX and FX compared to emicizumab, the simultaneous use of Efa with emicizumab should not pose a safety issue.
Efanesoctocog alfa also has the potential to improve the QoL for girls and women with hemophilia and symptomatic carriers. This can be achieved by effectively addressing menorrhagia through a probable single monthly injection. Efa may also be considered to sustain tolerance under emicizumab prophylaxis or induce immune tolerance in immune tolerance induction (ITI) protocols.
Efanesoctocog alfa efficacy and safety for perioperative management were assessed in the XTEND-1 phase III study, involving 11 patients (10 on prophylaxis and 1 ‘on demand’) undergoing 12 procedures, including orthopedic and other major surgeries. Eleven of the procedures involved a preoperative Efa infusion at 50 IU/kg; one procedure had no reported prophylactic preoperative dose. The median (range) number of injections of Efa was 1.0 (1-2) for days 1-3 and 2.0 (2-4) for days 4-14. After the preoperative dose, follow-up infusions were of 30-50 IU/kg every 2-3 days. The hemostatic response was considered excellent in all 12 surgeries. No patient required blood transfusion and no serious adverse event was reported.27 The clinical efficacy of Efa suggests that disconnection from endogenous vWF does not have a major impact on the hemostatic potential of the molecule. A long-term safety and efficacy study of Efa (XTEND-ed trial) in HA as well as a phase I study in adults with type 2N and 3 vWD (clinicaltrials.gov 04770935) are ongoing.
Laboratory testing
Factor VIII activity can be measured by the one-step coagulation assay (OSA) and the chromogenic assay. Discrepant results between OSA and chromogenic assays have been reported with several first-generation EHL rFVIII products. Recommendations have been published to guide laboratories on the choice of appropriate assays, as laboratory results have a direct impact on dosing in clinical management.28
During Efa development, including the pivotal phase III trial, FVIII activity was measured using an OSA with Actin FSL reagent (Siemens Healthcare). A field study comparing OSA and chromogenic assays in assessing Efa FVIII activity reported varied results with different reagents. Actin
FSL emerged as the optimal OSA reagent, while Actin FS showed a significant 2.5-fold overestimation and SynthASil exhibited underestimation. Most chromogenic kits demonstrated a 2-3-fold overestimation across all activity levels making reagents unsuitable for monitoring Efa.29 The study concluded that the activity of Efa can be reliably measured by the OSA using the majority of standard activated prothrombin time (aPTT) reagents.
Adverse events
No major safety concern or serious adverse event related to Efa were reported. Headache (20%), arthralgia (16%), falls (6%), and back pain (6%) were the most common adverse events reported in clinical trials.20-22 No serious anaphylactic or allergic reactions were observed. No inhibitor was recorded after the use of Efa in PTP. Three out of 206 subjects with pre-existing risk factors developed thrombosis during the XTEND extension study. The FDA requested increased pharmacovigilance for thromboembolic events for three years after approval.
Immunogenicity
The immunogenic profile of Eloctate, ® the parental Fcfused FVIII for Efa, was validated in clinical trials. 30 No inhibitor development was observed in previously treated patients with severe HA:31 in PUP treated with Eloctate,® a 31.1% incidence of FVIII inhibitors was reported, consistent with other FVIII products.32 The hypothesis that Efa displays a favorable immunogenic profile is suggested by the absence of inhibitor development after the use of this highly bioengineered molecule in a large number of PTP.22 The development of the anti-FVIII immune response implicates sequential events that include the capture and endocytosis of FVIII by antigen-presenting cells (APC), the processing and presentation on MHC molecules of FVIII-derived peptides to naïve FVIII-specific T cells, the activation of effector T cells, the cross-talk between activated T cells and FVIII-specific B cells leading to B-cell maturation and differentiation into plasma cells, and the production of FVIII-neutralizing IgG. We discuss here whether the peculiar structural features of Efa confer it with a favorable immunogenic profile (Figure 2).
D’D3 domains
vWF, the chaperon for FVIII in the circulation, reduces FVIII uptake by APC. Notably, vWF interferes with the binding of FVIII with the macrophage mannose receptor (CD206) and shields charged residues in the C1 and C2 domains of FVIII, thus reducing FVIII uptake in vitro33-35 and immunogenicity in preclinical models.36 However, it is unknown whether the D’D3 domains of vWF alone can resume the
protective action of the entire vWF. Conversely, the lack of the whole vWF molecule may prevent the vWF-mediated endocytosis of the vWF-FVIII complex by the scavenger receptor stabilin-2 and reduce the risk for the onset of an anti-FVIII immune response, as shown in FVIII-KO mice.37
XTEN polypeptides
XTEN polypeptides are added to therapeutic proteins to increase their hydrodynamic range, and limit their renal clearance. Increasing the hydrodynamic radius of proteins or particles may reduce their cellular uptake.17 For Efa, this could reduce the risks of endocytosis by APC and of activating T cells and initiating neutralizing immune responses. Importantly, XTEN polypeptides lack the hydrophobic residues necessary for peptide binding to MHC molecules, making them devoid of T-cell epitopes. Additionally, in Efa, neo T-cell epitopes resulting from the fusion of XTEN with the FVIII A2 and a3 domains were eliminated through mutations that do not impact FVIII function.18 The XTEN-288 is built of repeated ‘blocks’ of amino-acids: GTSESATPESGPG, SEPATSGSETP, STEPSEGSAPG, and SPAGSPTSTEEG. Repeated motifs may trigger T-cell independent immune responses, resulting in the production of low-affinity antibodies. Further investigation is required to determine if this occurs with Efa and whether the putatively induced low-affinity antibodies may affect PK or promote immune tolerance.
T-cell activation
Tregitopes are defined as epitopes that preferentially activate regulatory T cells. 38 Tregitopes exhibit promiscuous HLA-DR binding, and display TCR-facing residue homology with epitopes found in other human proteins.39 Potent Tregitopes have been identified in the Fc fragment of the human IgG and in FVIII38-40 One epitope cluster with regulatory potential is predicted in the vWF D’D3 domains (personal communication, A De Groot, EpiVax, 2023). The combination of Tregitopes present in FVIII and Fc fragments is not sufficient to confer immune tolerance to rFVIIIFc, as shown by the 31% incidence of FVIII inhibitors in naïve patients treated with Eloctate ® 32 Further investigation is needed to determine if adding the Tregitopes in D’D3 to those in rFVIIIFc can improve the tolerogenic profile of Efa.
Shielding of B-cell epitopes
The XTEN polypeptide between FVIII A2 and a3 domains, along with the D’D3 domains, might shield FVIII from interaction with antibodies. Similar to recent findings with vWF in FVIII-KO mice,41 this shielding could prevent the endocytosis of FVIII by naïve or memory FVIII-specific B cells, thereby mitigating the antigen-specific crosstalk between activated FVIII-specific T and B cells and reducing the risk for naïve or recall anti-FVIII immune responses.
Figure 2. Immunological profile of efanesoctocog alfa. A classical immune response to a T-cell-dependent extracellular antigen, such as therapeutic Factor VIII (FVIII), involves: i) the uptake of the antigen by antigen-presenting cells; ii) the processing of the antigen and presentation of antigen-derived peptides on MHC class II molecules to antigen-specific naïve CD4+ T cells; iii) the activation of the T cells; iv) a cross-talk between the activated T cells and naïve B cells that express antigen-specific B-cell receptors; and v) the differentiation of the B cells into antibody-secreting cells. The figure depicts the proposed interactions of the different moieties of efanesoctocog alfa (Efa) (i.e., FVIII, crystallizable fragments [Fc], XTEN polypeptides, and von Willebrand Factor [vWF] D’D3 domains) with the different phases of the immune response. Green arrow symbols indicate a probable effect in mellowing down immunogenicity; orange arrows indicate a possible effect on immunogenicity. Thus, cellular uptake may be reduced by the virtue of the presence of the XTEN polypeptides and the vWF D’D3 domains. XTEN polypeptides are not presented on MHCII molecules to T cells. FVIII and Fc fragments contain Tregitopes that may reduce, at least in part, the immunogenicity of the molecule, particularly if D’D3 were found to also contain Tregitopes. The XTEN polypeptides and the D’D3 domains may also reduce the binding of FVIII to the B-cell receptor of FVIII-specific naïve and memory B cells, thus reducing the T/B-cell cross-talk. IgG: immunoglobulin G.
Practical concerns and questions
Although only a single weekly infusion is required, intravenous infusion can be difficult in infants and patients with very limited venous access. In the era of subcutaneous non-factor therapies, will patients opt for intravenous treatment? In addition, several hemostatic properties of Efa require further clarification. The potential risk of thrombosis related to Efa in patients with diffuse atherosclerosis is unknown, only 3% of patients in XTEND-1 study were over 65 years of age. Questions have emerged concerning the unique PK of this molecule. Despite elevated trough levels ranging 15-17%, and an extended half-life of 43.3 hours, no accumulation was noted following repeated doses of Efa. To gain a comprehensive understanding of these findings, additional research is needed. This includes investigating FVIII antigen levels after repeated doses and assessing FVIII:C measurements
using various reagents. Moreover, comprehensive pharmacodynamic studies employing global hemostasis assays may be helpful for a more thorough analysis of the observed results. Additionally, monitoring Efa in emicizumab-treated patients and investigating inhibitors in its presence present challenges that call for new studies.
How efanesoctocog alfa compares with other HA treatments?
Efanesoctocog alfa, the first rFVIII with an EHL rate 3-4 times that of existing EHL FVIII products, achieves normal FVIII levels for at least half a week. Its unique PK properties provide hemostatic activity equivalent to emicizumab (10-15 IU/dL) just before a weekly injection. This marks the beginning of a new era in FVIII replacement thera-
py. Recent advancements in non-factor therapies, have substantially enhanced key efficacy indicators like ABR, potentially achieving zero joint bleeding. Efa, in addition to offering efficacy comparable to non-factor therapies, stands out as a ‘true’ FVIII, suitable for both prophylaxis and effective treatment of acute hemorrhagic events. Efa activity can be easily monitored by commonly available laboratory tests.29 Another notable feature of the molecule is its low PK variability, which improves the predictability of FVIII levels over time. Consequently, the use of a standard dose of 50 IU/kg reduces the need for frequent monitoring of FVIII activity.42
Patients with hemophilia have an increased rate of bone resorption and an excess of osteoporosis. FVIII may affect bone metabolism through at least two pathways, by promoting bone formation through a thrombin-mediated mitogenic effect on osteoblasts, and by interfering with the RANK/RANKL/OPG pathway. The use of FVIII prophylaxis from early childhood can maintain normal bone mineral density in individuals with severe HA.43 However, the potential impact of non-factor therapies on bone and joint health remains uncertain. Although clinically relevant improvements in the HJHS were observed in HAVEN-3, similar to XTEND-1,22,44 long-term data on the effects on bone and joint health are still needed.
Subcutaneous non-factor therapies raise concerns about patient autonomy during acute bleeding episodes. Those accustomed to factor prophylaxis can self-administer intravenous injections, but those untrained or not using intravenous injections may face treatment delays, relying on healthcare facilities. Efa, being an intravenous rFVIII, supports patient self-treatment, preserving autonomy. A recent study indirectly compared the efficacy of hemophila B gene therapy with 3 EHL-FIX molecules and showed lower bleeding rates with gene therapy compared to EHL-FIX products. In addition, more patients achieved zero bleeding with gene therapy.45 Efa stands out as the only FVIII concentrate that provides circulating FVIII levels comparable to gene therapy, facilitated by its weekly injection schedule.
These 2 therapies represent a revolutionary leap forward in the treatment of HA, surpassing the conventional threshold of >3-5 IU/dL for trough levels. They signal a shift towards normalizing FVIII levels, granting patients the opportunity to embrace a lifestyle comparable to that of the general population, engaging in everyday activities with newfound freedom.
References
1. Mannucci PM, Franchini M. Haematology clinic: haemophilia A. Hematology. 2014;19(3):181-182.
Limiting their assessment solely to ABR and its derivatives would be limiting, failing to capture the profound changes these therapies can make in patients’ daily lives. Beyond mere numerical metrics, their impact extends to tangible improvements like reduced school and work absenteeism, enhanced socio-professional integration, newfound freedom in daily and sports activities, diminished constraints associated with frequent injections, and a notable boost in self-esteem and self-confidence.
In this era of transformative therapies, it becomes imperative to forge and validate novel criteria capable of effectively measuring the life-altering influence of these treatments. Going beyond the numbers, it is about recognizing and embracing the holistic improvements that extend far beyond the confines of traditional evaluation metrics.
Disclosures
YD has been a member of the Advisory Board for Sobi, BioMarin, CSL, Novo Nordisk, Roche, and Pfizer; she has received research support to the institution from Bayer, Pfizer, CSL Behring, Octapharma, and Novo Nordisk. SLD has received a grant from Sanofi-Genentech and SOBI. AL and ARR have no conflicts of interest to disclose.
Contributions
YD and AD wrote the clinical parts on Efa and designed the corresponding figure. SLD and ARR wrote the parts on the immunogenic profile of Efa and designed the corresponding figure.
Acknowledgments
We wish to thank Annie De Groot and William Martin (Epivax; Providence, RI, USA), for performing Tregitope prediction on the D’D3 amino-acid sequence present in Efa.
Funding
SLD and ARR are supported by the Institut National de la Santé et de la Recherche Médicale (INSERM), Centre National de la Recherche Scientifique (CNRS), Sorbonne Université, Université de Paris Cité, and funded by the European Union’s Horizon 2020 research and innovation program under the Marie Sklodowska-Curie grant agreement n. 859974 (EDUC8) and by grants from Sanofi-Genentech (Waltham, MA, USA) and Swedish Orphan Biovitrum AB (Höllviksnäs, Sweden). ARR was the recipient of a fellowship from MSCA-ITN EDUC8 (n. 859974).
3. Oldenburg J. Optimal treatment strategies for hemophilia: achievements and limitations of current prophylactic regimens. Blood. 2015;125(13):2038-2044.
4 Mannucci PM. Hemophilia treatment innovation: 50 years of
progress and more to come. J Thromb Haemost. 2023;21(3):403-412.
5. Gualtierotti R, Solimeno LP, Peyvandi F. Hemophilic arthropathy: current knowledge and future perspectives. J Thromb Haemost. 2021;19(9):2112-2121.
6. Peyvandi F, Mannucci PM, Garagiola I, et al. A randomized trial of Factor VIII and neutralizing antibodies in hemophilia A. New Engl J Med. 2016;374(21):2054-2064.
7. Gouw SC, van der Bom JG, Ljung R, et al. Factor VIII products and inhibitor development in severe haemophilia A. N Engl J Med. 2013;368(3):231-239.
8. Fischer K, Carcao M, Male C, et al. Different inhibitor incidence for individual factor VIII concentrates in 1076 previously untreated patients with severe hemophilia A: data from the PedNet cohort. J Thromb Haemost. 2023;21(3):700-703.
9. Brod M , Bushnell DM, Neergaard JS, Waldman LT, Busk AK. Understanding treatment burden in hemophilia : development and validation of the Hemophilia Treatment Experience Measure (Hemo-TEM). J Patient Rep Outcomes. 2023;7(1):17.
10 Pipe SW, Montgomery RR, Pratt KP, Lenting PJ, Lillicrap D. Life in the shadow of a dominant partner: the FVIII-VWF association and its clinical implications for hemophilia A. Blood. 2016;128(16):2007-2016.
11. Vlot AJ, Koppelman SJ, van den Berg MH, Bouma BN, Sixma JJ. The affinity and stoichiometry of binding of human factor VIII to von Willebrand factor. Blood. 1995;85(11):3150-3157.
12. Carcao MD, Chelle P, Clarke E, et al. Comparative pharmacokinetics of two extended half-life FVIII concentrates (Eloctate and Adynovate) in adolescents with hemophilia A: is there a difference? J Thromb Haemost. 2019;17(7):1085-1096.
13. van der Flier A, Liu Z, Tan S, et al. FcRn rescues recombinant Factor VIII Fc fusion protein from a VWF independent FVIII clearance pathway in mouse hepatocytes. PLoS One. 2015;10(4):e0124930.
14 Mazurier C, Goudemand J, Hilbert L, Caron C, Fressinaud E, Meyer D. Type 2N von Willebrand disease: clinical manifestations, pathophysiology, laboratory diagnosis and molecular biology. Best Pract Res Clin Haematol. 2001;14(2):337-347.
15. Yee A, Gildersleeve RD, Gu S, et al. A von Willebrand factor fragment containing the D’D3 domains is sufficient to stabilize coagulation factor VIII in mice. Blood. 2014;124(3):445-452.
16. Fuller JR, Knockenhauer KE, Leksa NC, Peters RT, Batchelor JD. Molecular determinants of the factor VIII/von Willebrand factor complex revealed by BIVV001 cryo-electron microscopy. Blood. 2021;137(21):2970-2980.
17. Schellenberger V, Wang CW, Geething NC, et al. A recombinant polypeptide extends the in vivo half-life of peptides and proteins in a tunable manner. Nat Biotechnol. 2009;27(12):1186-1190.
18. Seth Chhabra E, Liu T, Kulman J, et al. BIVV001, a new class of factor VIII replacement for hemophilia A that is independent of von Willebrand factor in primates and mice. Blood. 2020;135(17):1484-1496.
19 Demers M, Aleman MM, Kistanova E, Peters R, Salas J, Seth Chhabra E. Efanesoctocog alfa elicits functional clot formation that is indistinguishable to that of recombinant factor VIII. J Thromb Haemost. 2022;20(7):1674-1683.
20 Konkle BA, Shapiro AD, Quon DV, et al. BIVV001 fusion protein as Factor VIII replacement therapy for hemophilia A. N Engl J Med. 2020;383(11):1018-1027.
Benson C. Efanesoctocog alfa for hemophilia A: results from a phase 1 repeat-dose study. Blood Adv. 2022;6(4):1089-1094.
22. von Drygalski A, Chowdary P, Kulkarni R, et al. Efanesoctocog alfa prophylaxis for patients with severe hemophilia A. N Engl J Med. 2023;388(4):310-318.
23. Wilson A, Nemes L, Quon DV, et al. Efanesoctocog alfa prophylaxis improves health-related quality of life in patients with hemophilia A: results from the XTEND-1 phase 3 study. Haemophilia. 2023;29(Suppl 1):105.
24. Wilson A, Kragh N, DiBenedetti D, et al. Patient experience with efanesoctoocg alfa: results from the xtend-1 phase 3 clinical trial exit interviews in patients with severe haemophilia A. Haemophilia. 2023;29 (Suppl 1):137.
25. Malec L, Peyvandi F, Chan A, et al. Efanesoctocog alfa prophylaxis for previously treated patients <12 years of age with severe hemophilia A. Res Pract Thromb Haemost. 2023;7(Suppl 2):1-2.
26. Malec L, Dunn A, Carcao M, et al. Treatment of bleeding episodes with efanesoctoctocog alfa in children with severe hemophilia A in XTEND-Kids phase 3 Study. Blood. 2023;142(Suppl 1):3993.
27. Klamroth R, von Drygalski A, Hermans C, et al. Perioperative management with efanesoctocog alfa in patients with haemophilia A in the phase 3 XTEND-1 study. Haemophilia 2023;29(Suppl 1):87-88.
28. Kitchen S, Tiefenbacher S, Gosselin R. Factor activity assays for monitoring extended half-life FVIII and FIX replacement therapies. Sem Thromb Haemost. 2017;43(3):331-337.
29 Pipe S, Sadeghi-Khomami A, Konkle BA, et al. A global comparative field study to evaluate the factor VIII activity of efanesoctocog alfa by one-stage clotting and chromogenic substrate assays at clinical haemostasis laboratories. Haemophilia. 2024;30(1):214-223
30 Hermans C, Mancuso ME, Nolan B, Pasi KJ. Recombinant factor VIII Fc for the treatment of haemophilia A. Eur J Haematol. 2021;106(6):745-761.
31. Mahlangu J, Powell jS, Ragni MV, et al. Phase 3 study of recombinant factor VIII Fc fusion protein in severe hemophilia A. Blood. 2014;123(3):317-325.
32. Königs C, Ozelo MC, Dunn A, et al. First study of extended half-life rFVIIIFc in previously untreated patients with hemophilia A: PUPs A-LONG final results. Blood. 2022;139(26):3699-3707.
33. Dasgupta S, Navarrete AM, Bayry J, et al. A role for exposed mannosylations in presentation of human therapeutic selfproteins to CD4+ T lymphocytes. Proc Natl Acad Sci USA. 2007;104(21):8965-8970.
34 Gangadharan B, Ing M, Delignat S, et al. The C1 and C2 domains of blood coagulation factor VIII mediate its endocytosis by dendritic cells. Haematologica. 2017;102(2):271-281.
35. Delignat S, Rayes J, Dasgupta S, et al. Removal of mannoseending glycan at Asn2118 abrogates FVIII presentation by human monocyte-derived dendritic cells. Front Immunol. 2020;11:393.
36. Delignat S, Dasgupta S, Andre S, et al. Comparison of the immunogenicity of different therapeutic preparations of human factor VIII in the murine model of hemophilia A. Haematologica. 2007;92(10):1423-1426.
37. Swystun LL, Lai JD, Notley C, et al. The endothelial cell receptor stabilin-2 regulates VWF-FVIII complex half-life and immunogenicity. J Clin Invest. 2018;128(9):4057-4073.
38. De Groot AS, Moise L, McMurry JA, et al. Activation of natural regulatory T cells by IgG Fc-derived peptide “Tregitopes.” Blood.
2008;112(8):3303-3311.
39 Moise L, Gutierrez AH, Bailey-Kellogg C, et al. The two-faced T cell epitope: examining the host-microbe interface with JanusMatrix. Hum Vaccines Immunother. 2013;9(7):1577-1586.
40 De Groot AS, Rosenberg AS, Miah SMS, et al. Identification of a potent regulatory T cell epitope in factor V that modulates CD4+ and CD8+ memory T cell responses. Clin Immunol. 2021;224:108661.
41. Oleshko O, Vollack-Hesse N, Tiede A, Hegermann J, Curth U, Werwitzke S. von Willebrand factor modulates immune complexes and the recall response against factor VIII in a murine hemophilia A model. Blood Adv. 2023;7(21):6771-6781.
42. Bioverative Therapeutics Inc. Efanesoctocog alfa US prescribing information. 2023; https://www.altuviiio.com
Accessed 7 March 2023.
43. Khawaji M, Akesson K, Berntorp E. Long-term prophylaxis in severe haemophilia seems to preserve bone mineral density. Haemophilia. 2009;15(1):261-266.
44 Kiialainen A, Niggli M, Kempton CL, et al. Effect of emicizumab prophylaxis on bone and joint health markers in people with haemophilia A without factor VIII inhibitors in the HAVEN 3 study. Haemophilia. 2022;28(6):1033-1043.
45. Klamroth R, Bonner A, Gomez K, et al. Indirect treatment comparisons of the gene therapy etranacogene dezaparvovec versus extended half-life factor IX therapies for severe or moderately severe haemophilia B. Haemophilia. 2024;30(1):75-86.
ETV6::ACSL6 translocation-driven super-enhancer activation leads to eosinophilia in acute lymphoblastic leukemia through IL-3 overexpression
Wenqian Xu,1* Feng Tian,2* Xiaolu Tai,3 Gaoxian Song,1 Yuanfang Liu,1 Liquan Fan,1 Xiangqin Weng,1 Eunjeong Yang,4 Meng Wang,5 Martin Bornhäuser,6 Chao Zhang,3 Richard B. Lock,7 Jason W.H. Wong,4 Jin Wang,1# Duohui Jing1# and Jian-Qing Mi1#
1Shanghai Institute of Hematology, State Key Laboratory of Medical Genomics, National Research Center for Translational Medicine at Shanghai, Ruijin Hospital Affiliated to Shanghai Jiao Tong University School of Medicine, Shanghai, China; 2Hebei Key Laboratory of Medical Data Science, Institute of Biomedical Informatics, School of Medicine, Hebei University of Engineering, Handan, Hebei Province, China; 3Department of Plastic and Reconstructive Surgery, Shanghai Ninth People’s Hospital, Shanghai Jiao Tong University School of Medicine, Shanghai, China; 4School of Biomedical Sciences, University of Hong Kong, Hong Kong, China; 5Songjiang Research Institute, Songjiang District Central Hospital, Institute of Autism & MOE-Shanghai Key Laboratory for Children’s Environmental Health, Shanghai Jiao Tong University School of Medicine, Shanghai, China; 6Medical Clinic I, University Hospital Carl Gustav Carus, TU Dresden, Dresden, Germany and 7Children’s Cancer Institute, Lowy Cancer Research Centre, School of Clinical Medicine, UNSW Medicine & Health, UNSW Centre for Childhood Cancer Research, UNSW Sydney, Sydney, New South Wales, Australia
*WX and FT contributed equally as first authors. #JW, DJ and J-QM contributed equally as senior authors.
Abstract
Correspondence: D. Jing jdh12262@rjh.com.cn
J. Wang jinwang@shsmu.edu.cn
J-Q. Mi jianqingmi@shsmu.edu.cn
Received: August 22, 2023.
Accepted: February 2, 2024. Early view: February 15, 2024.
ETV6::ACSL6 represents a rare genetic aberration in hematopoietic neoplasms and is often associated with severe eosinophilia, which confers an unfavorable prognosis requiring additional anti-inflammatory treatment. However, since the translocation is unlikely to produce a fusion protein, the mechanism of ETV6::ACSL6 action remains unclear. Here, we performed multi-omics analyses of primary leukemia cells and patient-derived xenografts from an acute lymphoblastic leukemia (ALL) patient with ETV6::ACSL6 translocation. We identified a super-enhancer located within the ETV6 gene locus, and revealed translocation and activation of the super-enhancer associated with the ETV6::ACSL6 fusion. The translocated super-enhancer exhibited intense interactions with genomic regions adjacent to and distal from the breakpoint at chromosomes 5 and 12, including genes coding inflammatory factors such as IL-3. This led to modulations in DNA methylation, histone modifications, and chromatin structures, triggering transcription of inflammatory factors leading to eosinophilia. Furthermore, the bromodomain and extraterminal domain (BET) inhibitor synergized with standard-of-care drugs for ALL, effectively reducing IL-3 expression and inhibiting ETV6::ACSL6 ALL growth in vitro and in vivo. Overall, our study revealed for the first time a cis-regulatory mechanism of super-enhancer translocation in ETV6::ACSL6 ALL, leading to an ALL-accompanying clinical syndrome. These findings may stimulate novel treatment approaches for this challenging ALL subtype.
Introduction
Chromosomal rearrangements are common in cancers, particularly hematologic malignancies.1 In acute lymphoblastic leukemia (ALL), their characterization has led to significant improvements in risk stratification and the development of targeted therapy.2,3 ETV6 is reported to form fusion genes with over 30 different partners, representing one of the most frequently translocated genes in ALL.4 While ETV6::RUNX1, a common ETV6 fusion in children, indicates favorable outcomes,4 other ETV6 fusions indicate poor prognosis.5,6 In addition to standard-of-care chemotherapy,
targeted therapies have been regularly applied in the clinic to inhibit the trans-regulatory activities of ETV6 partner proteins.5,7 Even though ETV6 is critical for hematopoiesis, its function in leukemogenesis may be underestimated compared to its partner proteins which play a dominant role in the dysregulation of downstream genes and pathways.7,8 Moreover, the mechanisms by which various ETV6 fusions cause malignancy remain poorly understood. ETV6::ACSL6 t(5;12)(q31;p13) is a rare ETV6 fusion, with only 17 cases reported in myeloid malignancies worldwide until 2022, and none in ALL. The prognosis of patients with ETV6::ACSL6 is usually unfavorable, with most patients surviving less than a year.9 Eosinophilia is a common complication of the disease, which often results in damage to various organs. The elevated eosinophils, in severe cases, can cause cerebral infarction and heart failure, posing life-threatening risks. This complicates the clinical care of these patients, and underscores the significance of prompt identification and treatment. Previous studies have found several pro-inflammatory mediators, including interleukin (IL)-3 and IL-5, to be up-regulated in acute myeloid leukemia (AML) with ETV6 t(5;12) translocations.10 While IL-5 is considered vital for the maturation and differentiation of eosinophils, IL-3 displays more potent effects on their functions.11 However, the mechanism of IL-3 and IL-5 upregulation in ETV6::ACSL6 is yet to be elucidated. Translocation events can induce trans- or cis-regulatory activities, altering gene expression profiles of cancer cells.12 Most previous studies focused on trans-regulatory activities of oncogenic fusion proteins.13-15 However, ETV6::ACSL6 has been shown to be associated with frameshift mutation conferring a premature stop codon, thus unlikely to be translated into a full-length protein,16 suggesting an alternative mechanism is involved. Cis-regulatory elements play critical roles in oncogenesis through structural variations (SV). This may cause ‘regulatory rearrangements’ of promoters and enhancers, leading to dysregulation of oncogenes. For example, t(8;14)(q24;q32), the most common translocation in Burkitt lymphoma, leads to MYC overexpression due to the relocation of an enhancer from chromosome (chr) 14 to its nearby region.17 Furthermore, in 2004, it was shown that the ectopic expression of the homeobox gene CDX2 resulting from the t(12;13)(p13;q12) and not the expression of the ETV6::CDX2 fusion gene resulted in AML in a murine model.18 Recently, ETV6 was also demonstrated to regulate its partner gene MN1 via super-enhancer (SE) hijacking in AML.19 However, the mechanism is yet to be extended to other ETV6 fusions as well as genes apart from its partners, and the clinical relevance of ETV6-associated SE hijacking events remains unexplored.
Coding genes of inflammatory factors, including IL-3, IL-5 and GM-CSF, are located adjacent to ACSL6 on chr5. This raises a question of whether and how ETV6::ACSL6 is involved in the dysregulation of these genes. Therefore, in this study, we used multi-omics approach to interrogate
the ETV6 translocation-induced cis-regulatory mutation and changes in the 3D genome structure in ETV6::ACSL6 ALL to decipher mechanisms of inflammatory factor dysregulation and its associated clinical syndrome eosinophilia.
Methods
Bone marrow samples from patients
Bone marrow (BM) samples from ALL patients or the healthy donor (diagnosed with thrombocytopenia, but with both BM smear and flow cytometry showing no abnormalities) were obtained under informed consent from Ruijin Hospital. Mononuclear cells were enriched by density gradient centrifugation with Ficoll solution. The use of samples was approved by the institutional review board. All relevant ethical regulations were followed in this study.
scNMT-sequencing library preparation and sequencing scNMT-sequencing (seq) libraries were prepared according to a previous protocol.20 Single cells were sorted using FACS Aria into 96-well plates containing 2.5 μl of reaction buffer: 1xM.CviPI buffer (NEB), 2 U M.CviPI (NEB), 160 μM S-adenosylmethionine (NEB), 1 U μl−1 RNasein (Thermo), 0.1% IGEPAL CA-630 (Sigma). After a 15-minute incubation at 37°C, RLT plus buffer (Qiagen) were added and samples stored at -80°C. Poly-A RNA was captured on oligo-dT and amplified cDNA was prepared according to Smart-seq2 protocols. The gDNA lysate was purified on AMPureXP beads before bisulfite-sequencing (BS-seq) libraries were prepared according to the scBS-seq protocol.21 Sequencing was carried out on a NovaSeq instrument, with a mean raw sequencing depth of 7.5 million (BS-seq) and 5 million (RNA-seq) paired-end reads per cell. BS-seq alignment and methylation/accessibility quantification was performed following a previous approach.20 Briefly, individual CpG or GpC sites of each cell were modeled using a binomial distribution, where the number of successes represented the reads supporting methylation, and the number of trials was the total read count. The CpG methylation or GpC accessibility rate for each site and cell was determined through maximum likelihood estimation. Subsequently, the rates were rounded to the nearest integer (0 or 1).
All other methods are described in detail in the Online Supplementary Appendix.
Results
Transcriptomic analysis of ETV6::ACSL6 acute lymphoblastic leukemia and its accompanied eosinophils
The ETV6::ACSL6 ALL patient is a 66-year-old male who presented to the clinic with a dry cough. The eosinophil count has consistently been greater than 1.5x10⁹/L for over
five years. The patient demonstrated elevated eosinophils (black arrow) in the peripheral blood and BM (Figure 1A). Two distinct populations of ALL cells and eosinophils were observed by flowcytometry analysis, with ALL cells exhibiting classic immunophenotype (CD19 +CD45 dimCD10+CD20-CD38dimCD58+) (Figure 1B). Monitoring of routine blood tests showed similar dynamics of cell counts in ALL
and eosinophils following induction therapy (Online Supplementary Figure S1). The karyotype revealed 46,XY,t(5;12) (q31;p13),del(11)(p15)[1]/46,XY[23]. RNA-seq was performed on the two populations individually after flow-sorting and ETV6::ACSL6 was only detected in lymphoblast, while eosinophils did not carry this fusion gene. This indicates that the eosinophil expansion seems to be reactive rather
Figure 1. ETV6::ACSL6 dysregulates the acute lymphoblastic leukemia transcriptome and induces eosinophilia. (A) Representative image of bone marrow (BM) aspiration smear of an ETV6::ACSL6 patient. Black arrow indicates eosinophils; red arrow indicates acute lymphoblastic leukemia (ALL) cells. (B) Flow cytometry analysis displays eosinophils and ALL cells from BM samples of the ETV6::ACSL6 patient. Red population refers to ALL cells. (C) Volcano plot showing up-regulated and down-regulated genes in ALL and eosinophils compared to a healthy control. Vertical dashed lines: cutoff of 1.5-fold changes; horizontal dashed lines: cutoff at P=0.05. (D) Fold changes of IL-3 and IL-5 expression in an ETV6::ACSL6 patient compared with a healthy control (N=3). RJ-9: an ETV6::ACSL6 ALL patient. *P<0.05, **P<0.01. (E and F) Hierarchical clustering of gene expression profiles of ETV6::ACSL6 ALL in comparison with eosinophils and ALL of various subtypes. (E) Shows all the genes detected. (F) Focused on genes nearby the ETV6::ACSL6 junction at chr5 and chr12. Chr5 and chr12 are each split into 2 segments: upper portion indicating genes downstream of the breakpoint and lower portion indicating genes upstream of the breakpoint. Each row corresponds to a gene. WBC: white blood cells; Eos: eosinophils; NoSignifi: not significant; HD: healthy donor.
than a clonal proliferation caused by genetic aberrations. Furthermore, analyzing gene expression profiles (GEP) from RNA-seq datasets, we found that IL-3 and IL-5 were highly expressed in ALL and eosinophils compared to the normal BM sample (Figure 1C). The result was confirmed by RT-qPCR (Figure 1D). This indicates an intrinsic correlation between inflammatory factors produced by ALL and its accompanying eosinophils with normal karyotype. Next, comparing GEP of the ETV6::ACSL6 ALL with previously published RNA-seq datasets of ALL,22,23 we found that the ETV6::ACSL6 ALL was clustered with eosinophils, mono-nuclear cells from a healthy BM, and GM12878 cells, but distinct from a well-studied ETV6 translocation, ETV6::RUNX1 fusion, suggesting a distinct mechanism of ETV6::ACSL6 in promoting malignancy transformation (Figure 1E). We further analyzed the top 10 genes that were differentially expressed (also enriched on chr5 and chr12) in the ETV6::ACSL6 ALL and other ALL subtypes. Interestingly, genes adjacent to the breakpoint of chr5 were significantly up-regulated, including P4HA2, SLC22A5, ACSL6, IL-3 and IL-5 (13 Kb, 300 Kb, 40 Kb, 7 Kb and 480 Kb from the breakpoint, respectively), while genes distant from ETV6 on chr12, such as PRH1 and APOLD1 (480 Kb and 1.1 Mb from the breakpoint, respectively), were down-regulated (Figure 1F). This indicates that the perturbations in the ALL transcriptome not only resulted from the potential intragenic SE of ETV6 promoting genes on chr5, but also from the inactivation of genes on chr12 with the deprivation of ETV6 regulation.
Multi-omics analysis of IL-3 activation in ETV6::ACSL6 acute lymphoblastic leukemia
To further delineate the genetic basis of the fusion gene, we performed long-read sequencing on ALL cells using Oxford Nanopore Technologies (ONT). Both RNA-seq (Figure 2A) and ONT-seq (Figure 2B) demonstrated a breakpoint at the first intron of ETV6. RNA-seq identified a fusion of the 1st exon of ETV6 with the 2nd exon of ACSL6 in mRNA (Figure 2A, C). However, instead of a DNA break at the ACSL6 locus, the ONT data revealed a breakpoint at the intergenic region of ACSL6 and IL-3 on chr5 (Figure 2B). These data indicate that the fusion of ETV6 to ACSL6 revealed by RNA-seq may be due to alternative splicing which skipped the 1st exon of ACSL (Figure 2D). We also detected genetic aberrations at various genomic regions, the functions of which are yet to be defined (Figure 2E, Online Supplementary Table S1, S2, Online Supplementary Figure S2).
The two derivative chromosomes in ETV6::ACSL6 ALL, i.e., an ETV6::ACSL6 (EA) strand and an IL3::ETV6 (IE) strand, are illustrated in Online Supplementary Figure S3 and verified by RT-PCR in Online Supplementary Figure S4A. Analyzing RNA-seq data, we identified a frameshift mutation leading to a premature stop codon (Online Supplementary Figure S4B). To confirm the result, we ectopically expressed a full-length EA transcript in Nalm6 (pre-B ALL) cells with
a flag peptide at the end of ACSL6 (Online Supplementary Figure S4C). As a control, a wild-type ETV6-Flag vector was also transduced, which demonstrated an overexpression of ETV6 and flag proteins (ETV6-OE) (Online Supplementary Figure S4C). However, while expression of the EA transcript was verified by PCR (Online Supplementary Figure S4D), neither a size shift of the ETV6 protein nor the expression of flag was detected (Online Supplementary Figure S4E). In summary, ETV6::ACSL6 does not give rise to a fusion protein, consistent with previous reports.6
Given the scarcity of patient samples, we performed single cell multi-omics sequencing (scNMT-seq) on ALL cells and eosinophils (Online Supplementary Figure S5A). UMAP reduction of scRNA data revealed two clusters: a majority ALL cluster expressing cancer-associated genes like ZFP36L2, SF3B1, and ARHGDIB, 24-26 and a smaller cluster comprising eosinophils and some ALL cells (Figure 2F, Online Supplementary Figure S5B). Gene set enrichment analysis (GSEA) revealed differentially expressed genes between ALL and eosinophils enriched in hypoxia, unfolded protein response, and DNA repair (p53) pathways, which are reported to be frequently activated in tumors27 (Figure 2G). Performing scNMT-seq in different subtypes showed that the IL-3 promoter (orange shading) revealed less enriched methylated-CpG and higher enriched methylated-GpC (accessibility) in the ETV6::ACSL6 ALL (RJ-9) compared to another ALL (RJ-10) with a normal karyotype (Figure 2H, Online Supplementary Figure S5C). The dot plots demonstrated CpG and GpC methylation status in each cell indicating a highly activated IL-3 in ETV6::ACSL6 ALL single cells. Moreover, eosinophils exhibited less GpC methylation (accessibility) and higher CpG methylation at the IL-3 locus than the ETV6::ACSL6 ALL cells (Online Supplementary Figure S5D). Taken together, our data suggest that the ETV6 translocation altered epigenetic features at genomic regions beyond its fusion partner at chr5. Furthermore, we extracted enrichments of methylated-CpG and -GpC at promoters for individual cells. Integrating DNA methylation (mCpG), accessibility (GpCm), and RNA transcription through multi-omics factor analysis (MOFA) revealed 3 clusters (Online Supplementary Figure S5E), highlighting the epigenetic heterogeneity. mRNA contributed less to cluster identification compared to DNA methylation and chromatin accessibility (5%, 41% and 46% variance in top 5 MOFA factors) (Online Supplementary Figure S5F). We then profiled the top 50 differentially methylated regions, identifying two leukemia cells with higher chromatin accessibility and hypomethylation in genes such as TCF12, LIN52 (Online Supplementary Figure S5G) that were reported to promote tumor progression.28,29 Enrichment analysis revealed involvement of metabolic and energetic pathways (Online Supplementary Figure S5H), suggesting a connection between metabolic perturbance with epigenetic changes in ETV6::ACSL6 ALL.
Overall, our data suggest that the ETV6 translocation in-
Continued on following page.
Figure 2. Multi-omics analysis of ETV6::ACSL6 acute lymphoblastic leukemia cells. (A) Mapping of chromosomal breakpoints by RNA-seq revealed a fusion of the first exon of ETV6 to the second exon of ACSL6. (B) DNA sequences nearby the breakpoints on chromosome (chr)12 and chr5 in ETV6::ACSL6 acute lymphoblastic leukemia (ALL) determined using Oxford Nanopore Technologies (ONT) sequencing. Breakpoints on chr12 and chr5 are indicated by the arrow, and the coordinates are showed. The sequence of 20 base pairs near the breakpoints are also displayed. IL-3 locus is located at the minus strand of the translocated chr. (C) RNA-seq data showed a fusion of ETV6 and ACSL6 genes. Black bar: ETV6::ACSL6 fusion with highest statistical confidence; gray bars: other fusion events with non-significant statistical confidence; green bar: duplication; blue bar: inversion. (D) Schematic diagram of ETV6::ACSL6 mRNA splicing. The ONT data and RNA-seq data display the fusion gene at the DNA and RNA levels, respectively. Gray bars: introns; pink bar: exon 1 of ETV6; purple bar: exon 1 of ACSL6; blue bars: exons 2-21 of ACSL6; e1: exon 1; e2-21: exon 2 to 21 of ACSL6. (E) Structural variants identified by ONT sequencing. Black bold line: ETV6::ACSL6 translocation with highest confidence (Variant Allele Frequency=0.9). The other 3 interchromosomal lines are unbalanced translocations. Purple line in the circle: insertion; black line in the circle: deletion; red line in the circle: inversion; blue line in the circle: duplication. (F) UMAP projection analysis of single-cell RNA-seq on ALL and eosinophils. Pink dots: ALL cells; blue dots: eosinophils. (G) Gene Set Enrichment Analysis of differentially expressed genes between ALL and eosinophils. (H) Left: single-cell methylation data at IL-3 loci; right: single-cell accessibility data at IL-3 loci. Since cytosines in GpC at open chromatin regions were arbitrarily methylated by adding GpC methyltransferase before bisulfite conversion, the methylated GpC is considered to represent accessible chromatin. Bar plot showing the average level of all cells detected at indicated genomic loci. Each row in the box corresponds to a single cell. Each dot represents the methylation or accessibility level of the corresponding cell (horizontally) at the corresponding genomic position (vertically). RJ-9: an ETV6::ACSL6 ALL patient.
duced critical epigenetic changes at the gene locus adjacent to the breakpoint on the 2 derivative chromosomes; however, mechanisms causing the abnormal epigenetics remain to be identified.
Chromatin structural variation induced by ETV6 superenhancer translocation
Next, we performed SE analysis to explore enhancer activities in diverse cell types. Extracting cell-type specific SE from the SEdb database, encompassing lymphoid, myeloid and other non-hematopoietic cell types, we observed distinctive blood-specific SE, notably the ETV6 locus (Figure 3A). This suggests that ETV6 serves not only as a crucial transcription factor, but also as an indispensable intragenic hematopoiesis-specific SE in both lymphoid and myeloid cells. In order to validate our findings in ETV6::ACSL6 ALL, we analyzed H3K4me1 (primed and active enhancers), H3K27ac (activated enhancers), BRD4 and p300 enrichments at the ETV6 locus (Figure 3B). Prominent enrichments of H3K27ac and H3K4me1 were identified at the ETV6 locus, with BRD4, the reader of H3K27ac, also present in this region. The enriched H3K27ac was also observed in B-ALL with normal karyotype (ALL-50 from our previous studies22) and cell lines from ENCODE database,30 suggesting the ETV6 intragenic region functions as an SE in cis-regulatory machinery. Using the ROSE algorithm,31 the 200 Kb (chr12:11718965-11902194) region was recognized as a highly-confident SE (Figure 3C). Interestingly, compared to Nalm6, an ALL cell line with ETV6::PDGFR fusion, REH with ETV6::RUNX1 showed decreased H3K27ac enrichment at the ETV6 locus (Figure 3D), indicating a diminished SE activity in REH. Therefore, the activity of the intragenic SE seems to vary in different ETV6 fusions. The ETV6 locus was split into 2 sections: Pro-SE1 (green rectangle) including the ETV6 promoter plus a minor SE on the left side; SE2 (blue rectangle) representing the major SE on the right side (Figure 3E). To verify the enhancer activities of 2 sections, we selected a 3Kb region (orange
shading) from each section based on transcription factor (TF) binding density and chromatin accessibility (DNase I Hypersensitive Site, DHS) from the ENCODE database and inserted them into a luciferase reporter vector (Figure 3F). While both Pro-SE1- and SE2-inserted vectors revealed significantly enhanced luminescence compared to control, the SE2-inserted vector demonstrated a much more prominent luminescence signal indicating an inherited SE activity (Figure 3G). Motif analysis revealed potential binding sites for TF related to lymphocyte-development / malignancy at the SE, such as Smad3, PAX5 and others (Figure 3H). Overall, the 2 sections of the ETV6 locus derived from the translocation event maintain enhancer activities, indicating their potential role in regulating ALL genes.
Super-enhancers are clusters of enhancers tightly interacting with multiple adjacent or distal genes.32 Using high-throughput chromosome conformation capture (Hi-C), we investigated mechanisms of ETV6-SE interacting with target genes on a genome-wide scale. ETV6::ACSL6 ALL displayed a butterfly morphology at the intersection of chr5 and chr12 in the Hi-C heatmap (dotted circles in Figure 4A), whereas GM12878 showed blank, confirming translocation only in RJ-9. Next, using a web-based genome browser,33 we observed strong interactions between Pro-SE1 and ACSL6, enhancing ACSL6 transcription and H3K27Ac modification in RJ-9 (green dashed lines in Figure 4B). SE2 interacted with multiple downstream genes of ACSL6, including strong interactions with IL-3, P4HA2 and a slight interaction with IL-5 (blue dashed lines in Figure 4B). Consistent with their normally silent state in lymphocytes, GM12878 displayed no active signals for these genes (Figure 4C). Hi-C contact intensities revealed the formation of new topologically associated domains (TAD) spanning the breakpoints with CTCF binding at boundaries, which constrained regulatory activities of Pro-SE1 and SE2, and restricted their target genes (Figure 4D). Neoloop finder identified 69 interchromosomal neoloops on IE and 7 on EA,34 suggesting uneven activities of Pro-SE1 and SE2 in regulating genes (Online
Figure 3. Enhancer hijacking events occur in ETV6::ACSL6 acute lymphoblastic leukemia. (A) Heatmap of super-enhancer (SE) abundance of 32 hematopoietic and 54 non-hematopoietic cell types from the ENCODE database. Red: detection of SE in the corresponding cell type; purple: not detected. Each column represents a cell type; each row represents an SE coordinate. (B) CUT&Tag profiles for epigenetic marks at the ETV6 locus in the ETV6::ACSL6 RJ-9 acute lymphoblastic leukemia (ALL), ALL50 (a normal karyotype ALL patient) and control datasets from ENCODE database. Gray line highlights the breakpoint detected by Oxford Nanopore Technologies (ONT). Green line highlights the promoter of ETV6. Yellow bar highlights the main region of ETV6SE. ENCODE: GM12878, H1-hESC, K562. (C) Ranking of SE by analyzing H3K27ac datasets of an ETV6::ACSL6 patient sample using ROSE algorithm. (D) CUT&Tag profiles of H3K27ac at the ETV6 locus in Nalm6 and REH cell lines. Nalm6: a pre-B-ALL cell line with ETV6::PDGFR translocation; REH: pre-B-ALL cell line with ETV6::RUNX1 translocation. Yellow shading highlights the ETV6-SE identified in the ETV6::ACSL6 sample. (E) ETV6 and its promoter region are separated into 2 parts by the breakpoint. Green rectangle: Pro-SE1 (Promoter and left section of ETV6); blue rectangle: SE2 (right section of ETV6). For the luciferase reporter assay, regions from both Pro-SE1 and SE2 were selected based on TF binding and DNase accessibility from ENCODE, as indicated in orange shading. (F) Schematic depicting the luciferase reporter construct. (G) Luciferase reporter assay. Selected elements in (E) were cloned into a luciferase reporter plasmid pGL3p. The fold inductions were calculated by normalizing to pGL3p control. Statistical significance was calculated using two-tailed t tests. Data represent the mean ± Standard Error of Mean of 3 biological replicates. *P<0.05, ****P<0.0001. (H) Transcription factor binding site analysis (MEME) of the ETV6 super-enhancer. The transcription factors were ranked by P value, and the top 5 transcription factors are listed.
Supplementary Figure S6). To validate the regulatory effects of the newly formed TAD, we compared gene expression profiles within and outside of the TAD. ETV6::ACSL6 ALL revealed an upregulation of genes located within the TAD compared to GM12878, whereas genes outside of the TAD did not exhibit significant expression perturbations (Figure 4E). Furthermore, the sustained activity of ETV6 was also
observed in the patient sample with ETV6::RUNX1, where the translocated ETV6 exhibited strong interactions with its partner, RUNX1. 35 In ETV6::ACSL6 ALL, among all genes that are activated due to enhancer hijacking, IL-3 and IL5 are supposed to promote eosinophilia in patients; furthermore, P4HA2, a proline hydrolase, has been shown to be associated with poor prognosis in diffuse large B-cell
Figure 4. ETV6::ACSL6 induces changes of chromatin conformation. (A) Visualization of Hi-C data with Juicebox. Dotted circles indicate an interaction between chromosome (chr)5 and chr12. RJ-9: an ETV6::ACSL6 ALL patient. (B and C) Hi-C data from ETV6::ACSL6 acute lymphoblastic leukemia (ALL) patient (RJ-9) in comparison with GM12878. Blue dotted lines refer to the interaction between SE2 with target genes, and gray shaded regions indicate the region with stronger interaction. Green dotted lines refer to interactions between Pro-SE1 and target genes. RNA-seq and H3K27ac CUT&Tag coverage are shown below the Hi-C data. Dotted lines indicate the breakpoint on chr12 and chr5. (D) Hi-C maps of rearranged ETV6::ACSL6 (EA) and IL3::ETV6 (IE). Black arrows and dashed triangles refer to newly formed topologically associated domains (TAD). Pro-SE1 and SE2 are indicated in green and blue rectangles. Pink bar: chr12; blue bar: chr5. CTCF CUT&Tag coverage is shown below the Hi-C map. Yellow shading highlights CTCF binding boundaries. Vertical dashed lines represent the breakpoint on chr12 and chr5. (E) Gene expression profiles within the newly formed TAD at EA and IE. Black boxes show genes located within the TAD involving Pro-SE1 or SE2.
lymphoma.36 Studying P4HA2 expression in our previously reported ALL patients37 by RNA-seq and qPCR, we found that patients with high expression of P4HA2 had lower survival rates (Online Supplementary Figure S7), indicating that P4HA2 dysregulation by SE2 may contribute to the poor prognosis of these patients. Overall, our data suggest that hijacking the 2 sections derived from ETV6-SE altered 3D genomic organization at new locations, triggering gene transcription exclusively in the ETV6::ACSL6 ALL and led to its unique clinical characteristics.
Bromodomain and extraterminal domain inhibitors partially reversed gene dysregulation in ETV6::ACSL6 acute lymphoblastic leukemia
The biological function of SE is often mediated by bromodomain proteins like BRD4 that recognizes highly-enriched acetylated histones at the SE. The bromodomain inhibitor JQ1 has been shown to disrupt enhancer functions, with more pronounced effect on SE.38 Performing in vitro treatment of JQ1 on a patient-derived xenograft (PDX) of the ETV6::ACSL6 ALL, 1,163 genes were significantly up-regulated and 1,925 down-regulated, including a decrease in IL-3 (fold change: 0.535887, P<0.001) and a mild decrease in IL-5 (Figure 5A, B). Notably, MYC and BCL2 were also down-regulated in agreement with previous reports on JQ1-induced gene regulation.39 GSEA revealed inhibited cytokine and Myc-targets pathways (Figure 5C). RT-qPCR confirmed that exposing cells to JQ1 decreased IL-3 expression in a time- and concentration-dependent manner (Figure 5D). Consistent with this observation, IL-3 concentration in the medium of ETV6::ACSL6 PDX cell culture decreased after JQ1 treatment; in contrast, ETV6::RUNX1 cells showed no IL-3 in the medium before and after JQ1 treatment (Figure 5E). As a control, Jurkat cells were pre-stimulated by
phytohemagglutinin and phorbol myristate acetate to activate IL3 expression and followed with JQ1 treatment for 12 hours. RT-qPCR showed a decrease of 50% in IL3 mRNA after JQ1 treatment, which was significantly lower than the IL3 decrease in the ETV6::ACSL6 ALL (Online Supplementary Figure S8). Since the IL3 expression in Jurkat cells without an SE translocation is thought to be regulated by a regular enhancer at IL3 upstream;40 this suggests a stronger dependency on BRD4 by SE. Moreover, BRD4 binding was substantially reduced at the whole-genome level and the ETV6 locus upon JQ1 treatment (Figure 5F-H). Consistent with previous reports,39 JQ1 altered the genome-wide BRD4 distribution, decreasing at promoters and increasing at intergenic regions (Figure 5 I). Therefore, JQ1 holds promise for dampening gene dysregulation in ETV6::ACSL6 ALL.
Cytotoxicity of bromodomain and extraterminal domain inhibitor treatment on ETV6::ACSL6 acute lymphoblastic leukemia in vitro and in vivo
We then assessed the cytotoxic effects of JQ1 on ETV6::ACSL6 ALL in vitro and in vivo. Treatment with JQ1 at concentrations >100nM significantly reduced cell viability in vitro, with limited effect on other genetic lesions (Figure 6A, Online Supplementary Table S3). JQ1 was then tested in combination with standard-of-care drugs against the ETV6::ACSL6 ALL. Our data demonstrated synergistic effects of JQ1 with vincristine and doxorubicin, and an additive effect with dexamethasone in vitro, with ZIP scores of 24.9, 25.0, and 6.88, respectively (Figure 6B, Online Supplementary Figure S9A). Notably, while vincristine or doxorubicin alone achieved 50-70% inhibition of cell viability, the addition of JQ1 (1 μM) substantially decreased the IC50 and reduced cell viability to around 10% (Figure 6C, Online Supplementary Figure S9B). Furthermore, we
Figure 5. Bromodomain and extraterminal domain inhibitors have the potential to reverse molecular changes caused by the ETV6 translocation. (A) A heatmap represents the relative expression levels of genes following 1μM JQ1 treatment for 24 hours (hr). Fold change of gene expression under treatment conditions over the control (DMSO) is shown. Exemplary genes are annotated. Each row corresponds to a gene. (B) Volcano plot showing up-regulated (right) or down-regulated (left) following 1μM JQ1 treatment for 24 hr compared with DMSO. (C) Gene Set Enrichment Analysis of DMSO (left) and JQ1 treatment (right). The differentially expressed genes of 2 groups were ranked according to their log10 (P value). (D) Downregulation of IL-3 RNA level by JQ1. ETV6::ACSL6 acute lymphoblastic leukemia (ALL) cells (2x10⁶ cells) were treated with JQ1 in a time and concentration dependent manner. (E) IL-3 concentration in the cell culture supernatant following 1μM JQ1 treatment for 24 hr. RJ-9: an ETV6::ACSL6 ALL patient; RJ-13: an ETV6::RUNX1 ALL patient. (F) BRD4 occupancy at the ETV6 gene locus in JQ1 and DMSO treated samples as determined by CUT&Tag. (G) BRD4 enrichment at the ETV6 locus as determined by CUT&Tag after DMSO (left) or 1μM JQ1 treatment for 24 hr. y axis shows BRD4 CUT&Tag signal in units of rpm/bp. (H) Genome-wide BRD4 binding level after 1 μM JQ1 treatment for 24 hr as identified by CUT&Tag. (I) Distribution of genomic elements associated BRD4 peaks following JQ1 treatment. Ctrl: control; BETi: bromodomain and extraterminal domain inhibitors.
tested 5 other commonly-used BET inhibitors: ABBV-744, Birabresib, I-BET151, Mivebresib and PFI-1, and observed their synergistic cytotoxicity with vincristine in treating ETV6::ACSL6 ALL (Table 1, Online Supplementary Figure S9C). Next, in vivo treatments were performed as shown in Figure 6D. RT-qPCR revealed a significant decrease in IL-3 expression following 24-hour in vivo treatment of JQ1 and vincristine (Figure 6E). The combination treatment significantly inhibited tumor growth in spleen, BM and peripheral blood at day 28, compared to single-drug treatment with vincristine or JQ1 (Figure 6F, Online Supplementary Figure S10A, B). Additionally, we observed that the spleens
Table 1. Combination index of different bromodomain and extraterminal domain inhibitors with vincristine.
of the mice in the combination group were dramatically reduced in size after 28 days of treatment compared to those treated with vincristine alone (Online Supplementary Figure S10C). One-week post-treatment, the mice treated with vincristine experienced relapse, while the combination group maintained remission for another seven days (Figure 6G). Survival analysis also showed that the combination treatment significantly prolonged the median event-free survival of mice by 9.2 days compared to vincristine alone (Figure 6H). Overall, our data suggest that combining firstline chemotherapy with JQ1 is promising to improve the treatment of ETV6::ACSL6 B-ALL patients.
Discussion
BET: bromodomain and extraterminal domain.
Chromosome translocations often lead to fusion oncogenes, generating fusion proteins interfering with signaling transduction in cancer cells. However, our study confirmed that SV can impact tumor behavior by altering gene expression through enhancer hijacking.34 In ETV6::ACSL6 leukemia, a frameshift-induced stop codon prevents protein formation, rendering the fusion protein theory insufficient for explaining eosinophilia. Furthermore, the eosinophils did not carry ETV6::ACSL6, indicating eosinophilia as a paraneoplastic
Figure 6. Effects of bromodomain and extraterminal domain inhibitors on ETV6::ACSL6 acute lymphoblastic leukemia in vitro and in vivo. (A) Cytotoxicity assay on acute lymphoblastic leukemia (ALL) patient cells with various karyotype. Cells were treated with the indicated concentrations of JQ1. Data represent the mean ± Standard Error of Mean (SEM) of 3 biological replicates. ****P<0.0001. RJ-9: ETV6::ACSL6; RJ-13: ETV6::RUNX1; RJ-14: BCR::ABL1; RJ-15: normal karyotype. (B) Synergistic effect of JQ1 and vincristine in inhibiting cell viability of RJ-9 cells. ZIP: ZIP synergy score.50 (C) Cytotoxic assay of JQ1 and vincristine at indicated concentrations. ****P<0.0001. (D) Schematic diagram of in vivo drug administration. Bone marrow (BM) cells from the ETV6::ACSL6 patient were harvested and transplanted into NSG mice, which were then treated with JQ1 (50 mg/kg, i.p., five days a week) and vincristine (0.5 mg/kg, i.p., five days a week), separately or in combination for four weeks. Leukemia burden in the peripheral blood (PB) was monitored over time until relapse. After humanely killing the mice, BM and spleens were preserved as mononuclear cells for further use. (E) RNA levels of IL-3 in different groups after in vivo treatment for 24 hours (measured via RT-PCR, N=3). NS: not significant (one-way ANOVA with all samples compared with vehicle control). (F) Assessment of leukemia burden in spleen, BM and PB in an in vivo RJ-9 PDX model after 28 days treatment with vincristine (N=4) and combination treatments of JQ1 and vincristine (N=4). Data are represented as a percentage of hCD45+ cells for each experiment and expressed as the mean ± SEM; *P<0.05, ***P<0.001 by Mann-Whitney U test. (G) Leukemia burden in the PB over time. (H) Kaplan-Meier curves for event-free survival are shown for vehicle control (N=7), vincristine (N=6), JQ1 (N=5), and combination treatments (N=4) against RJ-9 PDX in vivo. Event: % hCD45+ cells = 25%. ****P<0.0001 by Gehan-Breslow-Wilcoxon test. d: day; Ctrl: control.
syndrome. Our study identified an SE at the ETV6 locus and revealed that in ETV6::ACSL6 ALL, the ETV6 -SE was split into 2 parts, both exhibiting enhancer activities. This altered chromatin organization in derivative chromosomes, which enhanced the expression of IL-3 and other inflammatory factors, leading to eosinophilia in patients. Our study provides novel insights into cis-regulatory mutation mechanisms associated with this ALL subtype and its clinical complication.
In several ETV6 -translocation subtypes, fusion proteins were reported to play a dominant role in oncogenesis, most of which function as transcription factors or kinases.41 For instance, ETV6::RUNX1 , constituting 13% of B-ALL, was reported to mediate oncogenic activity as a transcription factor.14 However, mechanisms beyond the trans-regulation by fusion proteins have been poorly studied. In 2021, ETV6 was reported for the first time to contain an intragenic SE triggering expression of its partner gene MN1 in ETV6::MN1 AML.19 In our study, while Hi-C may not be the optimal technique for quantifying enhancer hijacking events, limiting our ability to accurately assess the interactions between regions, it is still useful for detecting new interactions from the translocated SE and target genes. The translocated ETV6 regulated not only its fusion partner ACSL6 , but also distant genes such as IL-3 , leading to a critical clinical syndrome (eosinophilia) in ALL. Our future work will extend our findings to other ETV6 fusion partners to gain a comprehensive understanding of the cis-regulatory mechanisms in ETV6 ALL subtypes.
Our data highlight cis-regulatory mutations controlling the expression of multiple genes, offering potential targets for precision therapy. IL-3, studied for over 30 years, induces proliferation of various cell types, including eosinophils and malignant hematopoietic cells like AML.42 IL-3 and GM-CSF are crucial in MYC-transduced human hematopoietic cells transitioning to AML, suggesting a crucial role of cytokines in tumorigenesis.43 Furthermore, ACSL6 and a distal gene P4HA2 were also activated by the SE translocation. ACSL6, a long-chain acyl-CoA synthetase, catalyzes long-chain fatty acids.44 Even though the function of ACSL6 in leukemia is not fully understood, its expression was shown to correlate with the prognosis of AML.45 Our preliminary studies indicated the association of P4HA2 with ALL prognosis, which aligns with previous findings in diffuse large B-cell lymphoma. 36 However, the oncogenic role of SE-induced gene overexpression in ETV6::ACSL6 ALL remains unclear, and this will be addressed in further studies. Nevertheless, according to the ‘multi-hit’ theory in oncogenesis,46 SE-induced gene dysregulation may cooperate with other genetic variations driving leukemia transformation and progression. Eosinophilia accompanying hematologic malignancies has diverse causes, including neoplastic, reactive, or idiopathic. The WHO 2022 classification includes “My-
eloid/Lymphoid neoplasms with eosinophilia” (M/LN-Eo) as a separate category, with gene rearrangements of PDGFRA, PDGFRB and others.47 In M/LN-Eo with clonal eosinophilia, gene rearrangements can be detected in eosinophils and other myeloid/lymphoid cell lineages, suggesting pluripotential hematopoietic progenitor cell origin. Conversely, reactive eosinophilia often results from tumors secreting cytokines, such as IL-3. Examples of such tumors include Hodgkin lymphoma 48 and our case of ETV6::ACSL6 ALL. Therefore, it is critical to determine different treatment strategies, considering varied causal mechanisms of eosinophilia in hematologic malignancies. Besides glucocorticoids, the conventional treatment for eosinophilia, other targeted options are being explored. Clonal eosinophilia bearing fusion genes may benefit from tyrosine kinase inhibitors,47 but the choice is limited for reactive eosinophilia, which often causes severe symptoms and hinders primary disease treatment. In ETV6::ACSL6 ALL, with eosinophilia linked to elevated IL-3, drugs targeting IL-3 pathways are considered. Furthermore, BRD4 inhibitors have achieved promising anti-tumor effects in various preclinical studies.49 Since the translocated SE conferring IL-3 elevation was highly enriched with BRD4, its inhibition significantly dampened the SE-induced gene expression, and synergized with first-line chemotherapy drugs in treating ETV6::ACSL6 ALL in vitro and in vivo . This demonstrates the potential of new therapeutic approaches for ETV6::ACSL6 ALL. Overall, our study reports for the first time that ETV6 translocation led to chromatin structural variations in ALL patients, which resulted in dysregulation of inflammatory factors conferring eosinophilia in ALL. This highlighted the crucial role of enhancer hijacking in oncogenesis and particularly its clinical complications, and provided insights into improving treatment strategies for this ALL subtype with unfavorable prognosis.
Disclosures
The authors have no conflicts of interest to disclose. Any opinions, findings, conclusions or recommendations expressed in this publication do not reflect the views of The Government of the Hong Kong SAR, the Innovation and Technology Commission or the Vetting Committee of the Mainland-Hong Kong Joint Funding Scheme of the Innovation and Technology Fund.
Contributions
DJ, JM and JW designed the study. WX performed experiments and analyzed the data. FT performed bioinformatics analysis. WX, DJ and JM interpreted the data and wrote the manuscript. XT, GS and MW assisted in performing experiments. JM, JW, YL, LF and XW interpreted the clinical data. JWHW and EY contributed to bioinformatics analysis. MB, CZ, RBL and JWHW contributed to the data interpretation and revision of the manuscript.
Acknowledgments
The authors thank Prof. Heather Lee (University of Newcastle, Australia) for assistance in establishing the single-cell technique. The authors acknowledge the ENCODE Consortium for generating DNaseI HS datasets and TF ChIP-seq datasets.
Funding
This research was funded by grants from the National Key R&D Program of China (2022YFE0200100), the Innovation Program of Shanghai Science and Technology Committee (23141903000, 21430711800), the National Natural Science Foundation of China (NSFC 82070144, 82270155, 82070227, 32271165, 82270187), the Mainland-Hong Kong Joint Funding Scheme supported by the Innovation and Technology Commission, the Government of Hong Kong SAR, China (MHP/054/21), the Ideas Grant funding of the National Health and Medical Research Council of Australia (APP1181666), and the Mobility Programme of the Joint Committee of the
References
1. Mitelman F, Johansson B, Mertens F. The impact of translocations and gene fusions on cancer causation. Nat Rev Cancer. 2007; 7(4):233-245.
2. Li JF, Dai YT, Lilljebjörn H, et al. Transcriptional landscape of B cell precursor acute lymphoblastic leukemia based on an international study of 1,223 cases. Proc Natl Acad Sci U S A. 2018;115(50):E11711-E11720.
3. Chen B, Jiang L, Zhong ML, et al. Identification of fusion genes and characterization of transcriptome features in T-cell acute lymphoblastic leukemia. Proc Natl Acad Sci U S A. 2018;115(2):373-378.
4 Rasighaemi P, Ward AC. ETV6 and ETV7: siblings in hematopoiesis and its disruption in disease. Crit Rev Oncol Hematol. 2017;116(2):106-115.
5. Zaliova M, Moorman AV, Cazzaniga G, et al. Characterization of leukemias with ETV6-ABL1 fusion. Haematologica. 2016;101(9):1082-1093.
6. Zhou MH, Gao L, Jing Y, et al. Detection of ETV6 gene rearrangements in adult acute lymphoblastic leukemia. Ann Hematol. 2012;91(8):1235-1243.
7 Bain BJ, Ahmad S. Should myeloid and lymphoid neoplasms with PCM1-JAK2 and other rearrangements of JAK2 be recognized as specific entities? Br J Haematol. 2014;166(6):809-817.
8. Zimmermannova O, Doktorova E, Stuchly J, et al. An activating mutation of GNB1 is associated with resistance to tyrosine kinase inhibitors in ETV6-ABL1-positive leukemia. Oncogene. 2017;36(43):5985-5994.
9. Su Z, Liu X, Hu W, et al. Myeloid neoplasm with ETV6::ACSl6 fusion: landscape of molecular and clinical features. Hematology. 2022;27(1):1010-1018.
10. Cools J, Mentens N, Odero MD, et al. Evidence for position effects as a variant ETV6-mediated leukemogenic mechanism in myeloid leukemias with a t(4;12)(q11-q12;p13) or t(5;12) (q31;p13). Blood. 2002;99(5):1776-1784.
11. Esnault S, Kelly EA. Essential mechanisms of differential activation of eosinophils by IL-3 compared to GM-CSF and IL-5.
Sino-German Center for Research Promotion by the NSFC and the Deutsche Forschungsgemeinschaft (M-0337). RBL is supported by a fellowship from The National Health and Medical Research Council of Australia (NHMRC Fellowship APP1157871).
Data-sharing statement
The raw sequencing data from this study have been deposited in the Genome Sequence Archive in National Genomics Data Center, Beijing Institute of Genomics (BIG), Chinese Academy of Sciences, under the accession number: HRA004277, that are publicly accessible at https://ngdc.cncb. ac.cn/gsa. We also host a UCSC browser session for easy access and viewing of genome-wide mapping at: http:// genome-asia.ucsc.edu/s/xuwenqian/RJ9_data. All other relevant data that support the conclusions of the study are available from the authors on request. Please contact jdh12262@rjh.com.cn.
Crit Rev Immunol. 2016;36(5):429-444.
12. Patel B, Kang Y, Cui K, et al. Aberrant TAL1 activation is mediated by an interchromosomal interaction in human T-cell acute lymphoblastic leukemia. Leukemia. 2014;28(2):349-361.
13. Huang Y, Mouttet B, Warnatz HJ, et al. The leukemogenic TCF3HLF complex rewires enhancers driving cellular identity and self-renewal conferring EP300 vulnerability. Cancer Cell. 2019;36(6):630-644.
14 Polak R, Bierings MB, van der Leije CS, et al. Autophagy inhibition as a potential future targeted therapy for ETV6RUNX1-driven B-cell precursor acute lymphoblastic leukemia. Haematologica. 2019;104(4):738-748.
15. Adnan-Awad S, Kim D, Hohtari H, et al. Characterization of p190-Bcr-Abl chronic myeloid leukemia reveals specific signaling pathways and therapeutic targets. Leukemia. 2021;35(7):1964-1975.
16. Yagasaki F, Jinnai I, Yoshida S, et al. Fusion of TEL/ETV6 to a novel ACS2 in myelodysplastic syndrome and acute myelogenous leukemia with t(5;12)(q31;p13). Genes Chromosomes Cancer. 1999;26(3):192-202.
18. Rawat VP, Cusan M, Deshpande A, et al. Ectopic expression of the homeobox gene Cdx2 is the transforming event in a mouse model of t(12;13)(p13;q12) acute myeloid leukemia. Proc Natl Acad Sci U S A. 2004;101(3):817-822.
19 Riedel SS, Lu C, Xie HM, et al. Intrinsically disordered Meningioma-1 stabilizes the BAF complex to cause AML. Mol Cell. 2021;81(11):2332-2348.
20 Argelaguet R, Clark SJ, Mohammed H, et al. Multi-omics profiling of mouse gastrulation at single-cell resolution. Nature. 2019;576(7787):487-491.
21. Clark SJ, Smallwood SA, Lee HJ, Krueger F, Reik W, Kelsey G. Genome-wide base-resolution mapping of DNA methylation in single cells using single-cell bisulfite sequencing (scBS-seq). Nat Protoc. 2017;12(3):534-547.
22. Jing D, Huang Y, Liu X, et al. Lymphocyte-specific chromatin
accessibility pre-determines glucocorticoid resistance in acute lymphoblastic leukemia. Cancer Cell. 2018;34(6):906-921.
23. Yu CH, Wu G, Chang CC, et al. Sequential approach to improve the molecular classification of childhood acute lymphoblastic leukemia. J Mol Diagn. 2022;24(11):1195-1206.
24. Fang F, Lu J, Sang X, et al. Super-enhancer profiling identifies novel critical and targetable cancer survival gene LYL1 in pediatric acute myeloid leukemia. J Exp Clin Cancer Res. 2022;41(1):225.
25. Han C, Khodadadi-Jamayran A, Lorch AH, et al. SF3B1 homeostasis is critical for survival and therapeutic response in T cell leukemia. Sci Adv. 2022;8(3):eabj8357.
26. Zhu J, Tian Z, Li Y, et al. ATG7 promotes bladder cancer invasion via autophagy-mediated increased ARHGDIB mRNA stability. Adv Sci (Weinh). 2021;8(22):e2104365.
27. Zhang Y, Wang S, Zhang J, et al. Elucidating minimal residual disease of paediatric B-cell acute lymphoblastic leukaemia by single-cell analysis. Nat Cell Biol. 2022;24(2):242-252.
28. Zhang Y, Yu R, Li Q, et al. SNHG1/miR-556-5p/TCF12 feedback loop enhances the tumorigenesis of meningioma through Wnt signaling pathway. J Cell Biochem. 2020;121(2):1880-1889.
29 Luo Z, Li X, Zhao Z, Yang X, Xiao S, Zhou Y. MicroRNA-146a affects the chemotherapeutic sensitivity and prognosis of advanced gastric cancer through the regulation of LIN52. Oncol Lett. 2017;13(3):1386-1392.
30 The ENCODE Project Consortium. An integrated encyclopedia of DNA elements in the human genome. Nature. 2012;489(7414):57-74.
31. Whyte WA, Orlando DA, Hnisz D, et al. Master transcription factors and mediator establish super-enhancers at key cell identity genes. Cell. 2013;153(2):307-319.
32. Hnisz D, Abraham BJ, Lee TI, et al. Super-enhancers in the control of cell identity and disease. Cell. 2013;155(4):934-947.
33. Wang Y, Song F, Zhang B, et al. The 3D Genome Browser: a web-based browser for visualizing 3D genome organization and long-range chromatin interactions. Genome Biol. 2018;19(1):151.
34. Wang X, Xu J, Zhang B, et al. Genome-wide detection of enhancer-hijacking events from chromatin interaction data in rearranged genomes. Nat Methods. 2021;18(6):661-668.
35. Mallard C, Johnston MJ, Bobyn A, et al. Hi-C detects genomic structural variants in peripheral blood of pediatric leukemia patients. Cold Spring Harb Mol Case Stud. 2022;8(1):a006157.
36. Jiang W, Zhou X, Li Z, et al. Prolyl 4-hydroxylase 2 promotes B-cell lymphoma progression via hydroxylation of Carabin.
Blood. 2018;131(12):1325-1336.
37. Gao M, Wang J, Rousseaux S, et al. Metabolically controlled histone H4K5 acylation/acetylation ratio drives BRD4 genomic distribution. Cell Rep. 2021;36(4):109460.
38. Filippakopoulos P, Qi J, Picaud S, et al. Selective inhibition of BET bromodomains. Nature. 2010;468(7327):1067-1073.
39 Lovén J, Hoke HA, Lin CY, et al. Selective inhibition of tumor oncogenes by disruption of super-enhancers. Cell. 2013;153(2):320-334.
40 Baxter EW, Mirabella F, Bowers SR, et al. The inducible tissuespecific expression of the human IL-3/GM-CSF locus is controlled by a complex array of developmentally regulated enhancers. J Immunol. 2012;189(9):4459-4469.
41. De Braekeleer E, Douet-Guilbert N, Morel F, Le Bris MJ, Basinko A, De Braekeleer M. ETV6 fusion genes in hematological malignancies: a review. Leuk Res. 2012;36(8):945-961.
42. Aldoss I, Clark M, Song JY, Pullarkat V. Targeting the alpha subunit of IL-3 receptor (CD123) in patients with acute leukemia. Hum Vaccin Immunother. 2020;16(10):2341-2348.
43. Bulaeva E, Pellacani D, Nakamichi N, et al. MYC-induced human acute myeloid leukemia requires a continuing IL-3/GM-CSF costimulus. Blood. 2020;136(24):2764-2773.
44 Rossi Sebastiano M, Konstantinidou G. Targeting long chain Acyl-CoA synthetases for cancer therapy. Int J Mol Sci. 2019;20(15):3624.
45. Chen WC, Wang CY, Hung YH, Weng TY, Yen MC, Lai MD. Systematic analysis of gene expression alterations and clinical outcomes for long-chain acyl-coenzyme A synthetase family in cancer. PLoS One. 2016;11(5):e0155660.
46. Gilliland DG, Tallman MS. Focus on acute leukemias. Cancer Cell. 2002;1(5):417-420.
47. Shomali W, Gotlib J. World Health Organization-defined eosinophilic disorders: 2022 update on diagnosis, risk stratification, and management. Am J Hematol. 2022;97(1):129-148.
48. Francischetti IMB, Alejo JC, Sivanandham R, et al. Neutrophil and eosinophil extracellular traps in Hodgkin lymphoma. Hemasphere. 2021;5(9):e633.
49 Guo J, Zheng Q, Peng Y. BET proteins: biological functions and therapeutic interventions. Pharmacol Ther. 2023;243:108354.
50 Ianevski A, Giri AK, Aittokallio T. SynergyFinder 2.0: visual analytics of multi-drug combination synergies. Nucleic Acids Res. 2020;48(W1):W488-W493.
UBTF tandem duplications in pediatric myelodysplastic syndrome and acute myeloid leukemia: implications for clinical screening and diagnosis
Juan M. Barajas,1* Masayuki Umeda,1* Lisett Contreras,1 Mahsa Khanlari,1 Tamara Westover,1 Michael P. Walsh,1 Emily Xiong,1 Chenchen Yang,2 Brittney Otero,2 Marc Arribas-Layton,2 Sherif Abdelhamed,1 Guangchun Song,1 Xiaotu Ma,3 Melvin E. Thomas 3rd,1 Jing Ma1 and Jeffery M. Klco1
1Department of Pathology, St. Jude Children’s Research Hospital, Memphis, TN; 2Mission Bio, South San Francisco, CA and 3Department of Computational Biology, St. Jude Children’s Research Hospital, Memphis, TN, USA
*JMB and MU contributed equally as first authors.
Abstract
Correspondence: J.M. Klco jeffery.klco@stjude.org
Received: November 15, 2023.
Accepted: February 19, 2024. Early view: February 29, 2024.
Recent genomic studies in adult and pediatric acute myeloid leukemia (AML) demonstrated recurrent in-frame tandem duplications (TD) in exon 13 of upstream binding transcription factor (UBTF). These alterations, which account for approximately 4.3% of AML in childhood and about 3% in adult AML aged <60 years of age, are subtype-defining and associated with poor outcomes. Here, we provide a comprehensive investigation into the clinicopathological features of UBTF-TD myeloid neoplasms in childhood, including 89 unique pediatric AML and 6 myelodysplastic syndrome (MDS) cases harboring a tandem duplication in exon 13 of UBTF. We demonstrate that UBTF-TD myeloid tumors are associated with dysplastic features, low bone marrow blast infiltration, and low white blood cell count. Furthermore, using bulk and single-cell analyses, we confirm that UBTF-TD is an early and clonal event associated with a distinct transcriptional profile, whereas the acquisition of FLT3 or WT1 mutations is associated with more stem cell-like programs. Lastly, we report rare duplications within exon 9 of UBTF that phenocopy exon 13 duplications, expanding the spectrum of UBTF alterations in pediatric myeloid tumors. Collectively, we comprehensively characterize pediatric AML and MDS with UBTF-TD, and highlight key clinical and pathologic features that distinguish this new entity from other molecular subtypes of AML.
Introduction
Pediatric acute myeloid leukemia (AML) and myelodysplastic syndrome (MDS) are characterized by unique genetic backgrounds when compared to those in adults.1-3 Recurrent tandem duplications (TD) of exon 13 of upstream binding transcription factor (UBTF) were only recently identified as potential initiating events in pediatric AML,4-7 accounting for about 4% of newly diagnosed pediatric AML. PCR-based screening covering exon 13 of UBTF also identified UBTFTD alterations in large adult AML cohorts.8,9 These studies significantly contributed to the accumulation of evidence of UBTF-TD alterations in adult AML. However, PCR-based methods potentially underestimate partial tandem duplications (PTD) extending outside the regions covered by amplicons or possible alterations not involving exon 13.9 Also, data on UBTF alterations in pediatric AML is limited to screening of relatively small cohorts,4,5 and further efforts are needed to accumulate more knowledge about the bi-
ology and clinicopathologic features of this disease entity. UBTF encodes for the UBTF/UBF protein that regulates ribosomal RNA (rRNA) transcription and nucleolar formation.10,11 We previously reported that expression of exon 13 UBTF-TD in cord blood CD34+ (cbCD34+) cells is sufficient to induce cellular proliferation, increase clonogenic activity, and it establishes a transcriptional signature that recapitulates what is observed in UBTF-TD AML patient samples.4 Our previous analyses also demonstrated that UBTF-TD do not occur with other canonical alterations in pediatric AML, but that UBTF-TD AML often harbor additional somatic mutations, such as internal tandem duplications in FLT3 (FLT3ITD) and frameshift mutations in WT1. The acquisition of these co-operating mutations can likely contribute to the stepwise progression of the disease and clonal evolution. However, our understanding of how these co-operating mutations contribute to the cellular and disease status remains to be elucidated.
To bridge these knowledge gaps, we present an extended
pediatric and young adult cohort of 89 AML and 6 myelodysplastic syndrome (MDS) samples with exon 13 UBTF-TD, showing that UBTF-TD neoplasms are strongly associated with dysplastic features and unique patterns of co-operating mutations. By leveraging bulk RNA-sequencing (RNA-seq) and single cell proteogenomics, we show that the co-occurrence of FLT3-ITD and WT1 mutations is associated with stem cell-like phenotypes. Furthermore, we identified tandem duplications within exon 9 of UBTF in 2 cases transcriptionally resembling exon 13 UBTF-TD AML. Exon 9 UBTF-TD contain analogous hydrophobic leucine-rich sequences as the exon 13 duplications and similarly induce leukemic phenotypes in cbCD34+ cells, suggesting that they likely have a shared mechanism and should be classified as the same molecular entity. These findings offer valuable insights to inform future diagnostic strategies and understanding of the molecular basis of UBTF-TD myeloid neoplasms.
Methods
Single-cell DNA sequencing and analysis
Single-cell targeted sequencing was performed using Tapestri System from Mission Bio (missionbio.com). A panel consisting of 162 PCR amplicons targeting genes commonly mutated in pediatric AML with an average size of 260bp was designed using Tapestri Designer from Mission Bio (designer. missionbio.com), as well as a manually designed amplicon targeting the UBTF exon13 TD region (Online Supplementary Table S1). Cryopreserved UBTF-TD primary AML samples were thawed and subjected to dead cell removal using the EasySepTM Dead Cell Removal Kit (STEMCELL Technologies, cat# 17899). Live cells were then subjected to the Mission Bio DNA+Protein (TotalSeq™-D Heme Oncology Protein Panel) protocol per manufacturer’s instructions (missionbio. com). Libraries were sequenced on the Novaseq platform (100M read pairs for DNA libraries and 225M read pairs for protein libraries). BAM files, loom files, h5 files, and QC metrics were produced via a customization of the Tapestri pipeline developed by Mission Bio (support.missionbio.com/ hc/en-us). Analysis of the samples was completed using the Mosaic package v.3.0.1 (missionbio.github.io/mosaic/).
Reads for the UBTF-TD and FLT3-ITD calls were isolated from bam files using the pysam python package v.0.21.0 (github.com/pysam-developers/pysam). Reads were then realigned to ITD contigs reported in previous studies4 using the BWA aligner v.0.7.15-r1140.12,13 When necessary, mutation variant allele frequencies (VAF) were adjusted using pysam.
Transcriptome analysis
Gene expression analysis was performed as previously described.1 Briefly, an RNA-seq cohort was established by integrating UBTF-TD cases with RNA-seq data in this study (N=96) and AML in other categories (N=837) and cbCD34+
cells (N=5).1 Reads from aligned RNA-seq BAM files were assigned to genes and counted using HTSeq (v.0.11.2)14 with the GENCODE human release 19 gene annotation. The count data were transformed to log2-counts per million (log2CPM) using Voom available from R package Limma (v.3.50.3).15 The top variable genes were selected using the “vst” method in Seurat package.16 The expression data were then scaled, and PCA (Principal Component Analysis) was performed on the scaled data using the top 265 variable genes. Dimension reduction was performed using UMAP (Uniform Manifold Approximation and Projection)17 with the top 100 principal components. Differential gene expression analysis was performed by Limma between groups as indicated in each figure, and we set Log2 CPM = -1 if it is < -1 based on the Log2 CPM data distribution. P values were adjusted by the Benjamini-Hochberg method to calculate the false discovery rate (FDR) using R function p.adjust. Genes with absolute fold change > 2 and FDR <0.05 were regarded as significantly differentially expressed. Gene Set Enrichment Analysis (GSEA) was performed by GSEA (v.4.2.3) using MSigDB gene sets c2.all (v.7.5.1).18 Permutations were done 1,000 times among gene sets with sizes between 15 and 1,500 genes.
Institutional Review Board approval and ethics committee
Samples from patients with MDS or AML from St. Jude Children’s Research Hospital tissue resource core facility were obtained with written informed consent using a protocol approved by the St. Jude Children’s Research Hospital Institutional Review Board (IRB). Studies were conducted in accordance with the International Ethical Guidelines for Biomedical Research Involving Human Subjects.
Statistical analysis
Details about statistical comparisons are provided in each figure legend. All the computations were performed using R or GraphPad Prism, and all P values are two-sided.
Results
UBTF
-TD in pediatric myeloid neoplasms
Our previous study described the molecular features of 27 pediatric AML cases with exon 13 UBFT-TD.4 To expand the cohort and better understand the biology, we screened RNA-seq data from pediatric and young adult MDS and AML samples and identified an additional 68 cases from available datasets and previously published studies,2,19 and routine clinical service at St. Jude Children’s Research Hospital. All 95 cases (median age = 14.0 years, range = 2.4-27.4) (Online Supplementary Figure S1A) possessed exon 13 UBTF-TD encoding a consensus hydrophobic leucine-rich ELTRLLARM amino acid motif within the duplications (Figure 1A, Online Supplementary Table S2). The duplications resulted in an
increased size of exon 13 (median size = 60 bp, range = 45-339 bp) (Figure 1B). Consistent with previous findings, UBTF-TD did not co-occur with other subtype-defining alterations and showed high VAF (median = 36.3%, range = 13.5-78.1%), further supporting our previous assertion that UBTF-TD alterations are early clonal events1,4 (Figure 1C). We further investigated the mutational background of this UBTF-TD cohort, confirming a strong association with a normal karyotype or trisomy 8 (Online Supplementary Figure S1B, C), as well as with FLT3-ITD (N=55, 57.9%) and mutations in WT1 (N=39, 41.1%), which are highly co-occurring
(Online Supplementary Figure S1D) (P=0.011, Fisher’s exact test) with 30.1% (N=29) cases harboring both alterations. In addition, 26.6% (N=25) of cases also had at least one mutation in Ras-MAPK pathway genes: NRAS (N=17, 17.9%), PTPN11 (N=5, 5.3%), RIT1 (N=5, 5.3%), NF1 (N=4, 4.2%), CBL (N=2, 2.1%), and KRAS (N=2, 2.1%). Other recurrent mutations in myeloid malignancies were rarely observed, including IDH1/ IDH2 (N=3, 3.2%), BCOR (N=2, 2.1%), and RUNX1 (N=1, 1.1%). We also screened MDS cases and identified UBTF-TD in 6 cases of pediatric MDS, all with normal karyotype; these include 3 primary pediatric MDS cases from our previously published
Figure 1. Characterization of tandem duplications in exon 13 of UBTF. (A) Genomic representation of duplicated regions (gray) from 95 cases with UBTF exon 13 duplications. A common duplicated region is outlined in red with the alignment of the resulting amino acid sequence. (B) Size assessment of exon 13 resulting from the duplicated regions and associated insertions / deletions. For partial tandem duplications (N=13) extending beyond exon 13, sizes of duplicated exon 13 with insertions or deletions are included. (C) Genomic landscape of UBTF-tandem duplication (TD) cases. Each column represents an individual patient. For each case, variant allele frequency (VAF), diagnosis, karyotype, and sex are shown.
cohort,2 classified as childhood MDS with increased blasts according to the current WHO classification.20 These 3 cases lacked a known germline predisposition (e.g., GATA2, SAMD9, SAMD9L) and had normal BM cytogenetics. Collectively, UBTF-TD was present in 3/38 (7.9%) of the primary MDS cases without a known germline predisposition, as well as 3/22 (13.6%) of all cases of childhood MDS with increased blasts. No FLT3-ITD mutations were detected in the 6 MDS cases, while WT1 mutations were present in 3 out of the 6 MDS cases, suggesting clonal evolutionary patterns initiating with UBTF-TD alterations. To address clonal evolution in UBTF-TD myeloid neoplasms, we utilized a droplet-based single cell proteogenomic platform from MissionBio (Figure 2).21 This platform en-
ables the concurrent detection of UBTF-TD alterations and somatic mutations by a custom-targeted DNA panel and cell classification using DNA-oligo conjugated antibodies targeting cell surface markers at the single cell level. In a single timepoint AML case, we found a clonal UBTF-TD alteration. A small fraction of the cells only contained the UBTF-TD alteration, whereas the major population also contained a WT1 (p.V359fs) mutation (Figure 2A, B, Online Supplementary Table S3). Distinct UBTF-TD+WT1+ minor subclones defined by NRAS (p.G12D) or FLT3 (p.V592D) were also present, representing branched evolution of the UBTFTD+WT1+ clone. We also found that cells with WT1+FLT3+ mutations were associated with high stem cell marker protein expression (CD34, CD117, or CD123) compared with
Figure 2. Clonal dynamics of UBTF tandem duplication leukemias. (A) Single-cell DNA sequencing coupled with surface marker expression of UBTF tandem duplication (TD) case at diagnosis. Heatmap depicting the presence of mutant allele (bottom) and relative protein abundance (top). (B) Schematic of clonal structure in UBTF-TD case from (A). Percentages are calculated as a proportion of total cells with a somatic mutation. (C) Single-cell DNA sequencing of a UBTF-TD case with diagnosis (left) and relapse (right) paired samples. Heatmap depicts the presence of a mutant allele and protein expression. (D) Schematic of clonal dynamics in diagnosis/relapse case from (C). Percentages are calculated as a proportion of total cells with a somatic mutation.
Figure 3. Morphological and biological assessment of UBTF tandem dupliacation myeloid neoplasms. (A) Available French-American-British (FAB) classification of UBTF tandem duplication (TD) acute myeloid leukemia (AML) (N=43). (B) Representative Wright-Giemsa staining of bone marrow (BM) aspirates and peripheral blood (PB) smears from 4 unique UBTF-TD cases. Case IDs are labeled above. SJMDS031973-childhood myelodysplastic syndromes (MDS) with increased blasts: increased erythroid cells with dysplastic morphologic features (top), dysplastic myeloid cells with salmon-colored granules, and dysplastic small megakaryocytes (bottom). SJAML033350-AML with other defined genetic alterations: characteristic blasts and myeloid precursor cells with salmon-colored granules (top) and blasts with small Auer rods (bottom). SJAML010730-AML with other defined genetic alterations: blasts with both myeloid and monocytic / monoblastic morphologic features. PB in this patient is one of the few cases in our cohort showing hyperleukocytosis with many circulating blasts (bottom). SJAML015028-AML with other defined genetContinued on following page.
ic alterations: dysplastic megakaryocytes, increased erythroid cells with dysplastic morphologic features, and blasts, many with monocytic / monoblastic morphologic features. (C) BM blast percentage for a pediatric AML cohort stratified by oncogenic driver subtypes. (D) White blood cell (WBC) counts for a pediatric AML cohort stratified by oncogenic driver subtypes. (E) WBC count and BM blast percentage among UBTF-TD cases with different WT1 and FLT3 mutation status.
the UBTF -TD-only population, whereas the WT1 +NRAS + population was characterized by low expression of these markers. In a diagnosis and relapse-paired case, we found that the identical UBTF-TD was retained through disease progression along with an FLT3 -ITD alteration (Figure 2C, D). Interestingly, a minor WT1+ (p.R375fs) subclone at diagnosis was eradicated after chemotherapy, whereas a different WT1+ (p.R353fs) clone became dominant at relapse, showing high expression of CD34, CD117, and CD123. These data collectively confirm that UBTF-TD is an early initiating event, while somatic mutations are subclonal to UBTF-TD, possibly contributing to disease progression toward subclones with unique expression profiles.
Clinical features of UBTF-TD pediatric myeloid neoplasms
UBTF-TD AML showed a variety of morphologic features associated with cellular differentiation, as evidenced by variable French-American-British (FAB) classifications (Figure 3A, Online Supplementary Table S4). Although AML with maturation (FAB M2) was the most common (19/43, 44.2%), cases with erythroid features, including FAB M6 (6/43, 14.0%), were also observed, as was also recently described for UBTF-TD AML in adults.9 Morphologic assessments also revealed that UBTF-TD cases often displayed pleomorphic blasts (Figure 3B), accompanied by background multilineage dysplasia and increased erythroid precursors. UBTF-TD AML showed lower white blood cell count (median = 10.0x10⁹/L, range = 0.6-409.4x10⁹/L) and BM blast percentage (median = 39.5%, range = 2-97%) when compared to other AML, including those with similar transcriptional profiles like AML with NUP98-rearrangements or NPM1 mutations1,4 (Figure 3C, D). FLT3-ITD, but not WT1 mutations, were associated with a higher white blood cell count (WBC) count and BM blasts in UBTF-TD AMLs (Figure 3E). Despite the presence of dysplastic features, cytogenetic studies commonly found either a normal karyotype (58/92, 63.0%) or trisomy 8 (27/92 29.3%). Myelodysplasia-related chromosomal changes or myelodysplasia-related mutations were overall rare, suggesting that UBTF-TD itself contributes to dysplastic features ( Online Supplementary Table S4 ). Considering these overall features and other recent publications,5,8,9,22,23 the majority of UBTF -TD AML (83/89, 93.3%) are best classified as “Acute myeloid leukemia with other defined genetic alterations” in the current WHO classification20 (Online Supplementary Table S4).
Transcriptional features of UBTF-TD myeloid neoplasms
We and others have previously shown that AML with UBTF-TD is characterized by high HOXA and HOXB cluster
gene expression, similar to NPM1-mutated or NUP98::NSD1 AML.1,8 To further define the unique expression profiles of UBTF-TD, we established an RNA-seq cohort consisting of various AML subtypes1 (N=837), cord blood CD34+ samples from healthy donors (N=5), and UBTF-TD AML and MDS samples (N=94: 1 UBTF-TD case did not have RNA-seq data available) (Figure 4A). Consistent with previous data, UBTFTD cases clustered with NPM1-mutated and NUP98::NSD1 AML. However, UBTF-TD samples displayed a significantly higher expression of a subset of HOXB cluster genes (e.g., HOXB8, HOXB9) compared with NUP98::NSD1 AML (Online Supplementary Figure S2A). We also observed uniquely high expression of histone genes (e.g., HIST1H4F and HIST1H1D) compared to NPM1-mutated AML (Online Supplementary Figure S2B), suggesting transcriptional mechanisms unique to UBTF -TD AML. Within UBTF -TD samples, those with FLT3-ITD and WT1 mutations showed unique distribution on the UMAP cluster (Online Supplementary Figure S2C), and each mutation group demonstrated differential gene expression against UBTF-TD samples without either mutation (Figure 4B). Co-occurrence of WT1 and FLT3-ITD was associated with stemness-related genes (e.g., CD34 and DNTT, Online Supplementary Figure S2D), and GSEA confirmed enrichment of stemness or cell cycle-related gene expression in WT1+FLT3-ITD+ UBTF-TD samples (Figure 4C). These results show the unique expression profile of UBTF-TD AML and the specific influence of additional co-operating mutations, which can likely impact patterns of clonal evolution.
Exon 9 tandem duplications in UBTF
Given the recurrent UBTF exon 13 alterations duplicating specific hydrophobic amino acid sequences, we hypothesized that UBTF alterations outside exon 13 resulting in similar amino acid sequences could be found in cases without defining alterations but with a similar expression signature. By close inspection of the UBTF gene using RNA-seq data, we found 2 pediatric AML cases without exon 13 UBTF-TD or other driver alterations that instead have in-frame tandem duplications (lengths of 78 and 153bp) in exon 9 of UBTF (TD-exon9), encoding short hydrophobic amino acid sequences (Figure 5A, B). These cases express HOXA/B cluster genes comparably to exon 13 UBTF-TD (Online Supplementary Figure S3), and one had a WT1 mutation (Online Supplementary Table S5). To test whether UBTF-TD-exon9 alterations could lead to cellular transformation, we expressed both UBTF-TD-exon9 in cbCD34+ cells using lentiviral vectors and assessed their impact on cell proliferation, clonogenic potential, and cellular morphology in comparison with control conditions and exon 13 UBTF-TD (Figure 5C, D). Colony-forming unit (CFU)
assay revealed that the expression of both UBTF-TD-exon9 increased the total colony number (Figure 5E). After the second round of replating, cells with UBTF-TD-exon9 showed an immature morphology along with erythroid features, similar to exon 13 UBTF-TD expressing cells in contrast to control conditions which displayed myeloid differentiation (Figure 5F). Furthermore, cells expressing UBTF-TD-exon9 as well as UBTF-TD-exon13 showed a proliferative advantage compared to UBTF-WT and vector controls (Figure 5G). Collectively, these data highlight a tandem duplication in UBTF exon 9 as a defining alteration functionally equivalent to exon 13 tandem duplications.
Discussion
In this study we extended our cohort of pediatric myeloid malignancies with exon 13 UBTF-TD, which now includes
95 pediatric and young adult cases. Similar to studies in adults,9 pediatric myeloid tumors with UBTF-TD have a lower BM blast infiltration and lower peripheral WBC count, suggesting a continuum of a common entity across the age spectrum. We observed that UBTF-TD neoplasms showed variable cellular morphology and differentiation, including FAB M2 (44.2%), but also cases with erythroid features. These morphological features align with findings in adult cases, which showed a high prevalence of FAB M6 and M2 cases.9 Furthermore, the presence of dysplastic features, and the observation that UBTF-TD occurs in cases of pediatric MDS, suggest that MDS and AML could be part of a continuum driven by UBTF-TD. These findings are consistent with the recognition of UBTF-TD alterations in nearly a third of pediatric patients with high-grade MDS24 and recent studies have also identified the persistence of UBTF-TD in remission samples in patients with UBTF-TD myeloid neoplasms.22 These collective data support the
Figure 4. Transcriptional characterization of UBTF tandem duplication leukemias. (A) Uniform Manifold Approximation and Projection (UMAP) of expression profiles across a cohort of UBTF tandem duplication (TD) (N=94) and pediatric AML (N=837) acute myeloid leukemia (AML) cases, adapted from a previous study.1,4 Each dot is colored by subtype-defining alterations. Black box outlines a cluster of cases with HOXA/HOXB dysregulation, which includes all UBTF-TD cases. (B) (Top) Schematic depicting the transcriptional comparison of UBTF-TD cases by mutational status. (Bottom) Venn diagram showing overlap of differentially expressed genes in FLT3-ITD only cases and FLT3-ITD+/WT1+ cases compared with cases without these mutations. (C) Gene Set Enrichment Analysis of UBTF-TD cases based on mutational status.
conclusion that UBTF-TD alterations can lead to both MDS and AML, and that UBTF-TD myeloid neoplasms should be recognized as a separate entity.
Our data also suggest that progression to AML may be promoted by the acquisition of co-operating mutations, such as FLT3-ITD. This is supported by the finding that
Figure 5. Exon 9 UBTF tandem duplications in pediatric acute myeloid leukemia. (A) Identification of UBTF tandem duplication (TD) cases with tandem duplications in exon 9 of UBTF. UBTF-TD-exon9 on the UMAP plot of the pediatric AML cohort (red circles), adapted from a previous study.1,4 (B) Schematic of UBTF protein, highlighting amino acid sequences encoded in exon 9 of UBTFWT, UBTF-TD78-exon9, UBTF-TD153-exon9. Duplications resulting in short hydrophobic sequences are labeled in red. Hydrophobic residues are underlined. (C) Experimental design to evaluate the transforming potential of UBTF-TD-exon9 mutants. (D) Immunoblot of lysates from cbCD34+ cells transduced with UBTF-TD-exon9 vectors and corresponding controls. Antibodies against HA-tag, UBTF, and β-actin were used. (E) Colony forming unit assay. Two-way ANOVA with two-sided Dunnett’s test was applied with UBTF wild-type (WT) as control. (F) Cytospins isolated from colony forming unit (CFU) assay at round 2 of replating (Wright-Giemsa Staining, 400X magnification). (G) In vitro growth curves of cbCD34+ cells expressing controls or UBTF-TD-e9 mutants. Twoway ANOVA with Dunnett’s test was applied with UBTF-WT as control.
none of the MDS cases in this cohort harbored a FLT3-ITD alteration, although this may be limited by the small size of the MDS cohort (N=6) in this study. However, the lack of FLT3 or RAS pathway variants in a subset of AML cases suggest that UBTF-TD could be sufficient for leukemic transformation in some cases. Our analyses, including single cell studies, also showed that the co-occurrence of FLT3-ITD and WT1 is strongly associated with progressive stem cell features as represented by CD34 expression or quiescent states. Thus, the patterns of mutational co-operativity likey will influence disease phenotypes. Given that exon 13 UBTF-TD has been underappreciated in AML studies using standard computational pipelines, we investigated other possible UBTF alterations in pediatric AML cases without a defined driver event and demonstrated that in-frame tandem duplications in exon 9 of UBTF are additional possible driver alterations. Although rare within cases with UBTF alterations (2/97 UBTF-TD cases, 2.1%), cases with tandem duplications in exon 9 show similar transcriptional profiles to exon 13 UBTF-TD AML. We further show that exon 9 alterations can induce leukemic changes, including hematopoietic cell growth and increased clonogenicity in cbCD34+ cells similar to exon 13 alterations. At the amino acid level, exon 9 tandem duplications contain hydrophobic amino acid sequences (LKDKFDGL) that are similar to the sequences in exon 13 tandem duplications (LTRLLARM), suggesting a shared mechanism. Importantly, PCR-based exon 13 screening could potentially underestimate PTD involving exon 13 and flanking regions or these exon 9 alterations,9 and we propose unbiased sequencing-based strategies to diagnose this entity accurately. The findings presented here will help build on our understanding of UBTF-TD myeloid neoplasms and further support its recognition as a distinct entity in future classification systems.
Disclosures
CY, BO and MA are employed by Mission Bio, Inc. All the other authors have no conflicts of interest to disclose.
Contributions
JMB is responsible for methodology, software validation, formal analysis, investigation, writing the original draft, vi-
References
1. Umeda M, Ma J, Westover T, et al. A new genomic framework to categorize pediatric acute myeloid leukemia. Nat Genet. 2024;56(2):281-293.
2. Schwartz JR, Ma J, Lamprecht T, et al. The genomic landscape of pediatric myelodysplastic syndromes. Nat Commun. 2017;8(1):1557.
3. Bolouri H, Farrar JE, Triche T Jr, et al. The molecular landscape of pediatric acute myeloid leukemia reveals recurrent structural alterations and age-specific mutational interactions. Nat Med. 2018;24(1):103-112.
sualization, project administration and funding acquisition. MU is responsible for formal analysis, investigation, writing the original draft, visualization and project administration. LC is responsible for methodology, software validation and investigation. MK is responsible for formal analysis and investigation. TW is responsible for data curation and project administration. MPW, MET and XM are responsible for investigation. EX is responsible for methodology and software validation. BO and MA-L are responsible for formal analysis. GS is responsible for data curation. JMK is responsible for study concept, project administration and supervision, and funding acquisition. SA is responsible for project administration. CY, BO and MA-L are responsible for formal analysis. JM is responsible for formal analysis and investigation. All authors reviewed and edited the manuscript.
Funding
The work was funded by the American Lebanese and Syrian Associated Charities of St. Jude Children’s Research Hospital, the Jane Coffin Childs Fund (JMB), and funds from the US NIH, including F32 HL154636 (to JMB), U54 CA243124 and R01 CA276079 (to JMK). The content, however, does not necessarily represent the official views of the NIH and is solely the responsibility of the authors. JMK holds a Career Award for Medical Scientists from the Burroughs Welcome Fund. Support was also provided by Shared Resources provided through the St. Jude Comprehensive Cancer Center (P30-CA21765), including Flow Cytometry and Cell Sorting, Comparative Pathology Core, and Genome Sequencing (Hartwell Center).
Data-sharing statement
The expression data newly generated in this study (RNA-sequencing: 3) and scDNA + protein sequencing (3) have been deposited in the European Genome-Phenome Archive (EGA) which is hosted by the European Bioinformatics Institute (EBI), under accession N. EGAS00001005760. The remaining RNA-sequencing data are available via EGA, St. Jude Cloud or TARGET/GDC as defined in Online Supplementary Table S6. Information about TARGET can be found at http://ocg. cancer.gov/programs/target. Other data generated in this study are available in the Online Supplementary Tables or upon request to the corresponding author.
4. Umeda M, Ma J, Huang BJ, et al. Integrated genomic analysis identifies UBTF tandem duplications as a recurrent lesion in pediatric acute myeloid leukemia. Blood Cancer Discov. 2022;3(3):194-207.
5. Kaburagi T, Shiba N, Yamato G, et al. UBTF-Internal tandem duplication as a novel poor prognostic factor in pediatric acute myeloid leukemia. Genes Chromosomes Cancer. 2022;62(4):202-209.
6. Stratmann S, Yones SA, Mayrhofer M, et al. Genomic characterization of relapsed acute myeloid leukemia reveals
7 Ma X, Liu Y, Liu Y, et al. Pan-cancer genome and transcriptome analyses of 1,699 paediatric leukaemias and solid tumours. Nature. 2018;555(7696):371-376.
8. Georgi JA, Stasik S, Eckardt JN, et al. UBTF tandem duplications are rare but recurrent alterations in adult AML and associated with younger age, myelodysplasia, and inferior outcome. Blood Cancer J. 2023;13(1):88.
9. Duployez N, Vasseur L, Kim R, et al. UBTF tandem duplications define a distinct subtype of adult de novo acute myeloid leukemia. Leukemia. 2023;37(6):1245-1253.
10. Sanij E, Hannan RD. The role of UBF in regulating the structure and dynamics of transcriptionally active rDNA chromatin. Epigenetics. 2009;4(6):374-382.
11. Moss T, Mars JC, Tremblay MG, et al. The chromatin landscape of the ribosomal RNA genes in mouse and human. Chromosome Res. 2019;27(1-2):31-40.
12. Li H, Durbin R. Fast and accurate long-read alignment with Burrows-Wheeler transform. Bioinformatics. 2010;26(5):589-595.
13. Li H, Handsaker B, Wysoker A, et al. The Sequence Alignment/Map format and SAMtools. Bioinformatics. 2009;25(16):2078-2079.
14 Anders S, Pyl PT, Huber W. HTSeq--a Python framework to work with high-throughput sequencing data. Bioinformatics. 2015;31(2):166-169.
15. Ritchie ME, Phipson B, Wu D, et al. limma powers differential expression analyses for RNA-sequencing and microarray studies. Nucleic Acids Res. 2015;43(7):e47.
16. Satija R, Farrell JA, Gennert D, et al. Spatial reconstruction of singlecell gene expression data. Nat Biotechnol. 2015;33(5):495-502.
17 Becht E, McInnes L, Healy J, et al. Dimensionality reduction for visualizing single-cell data using UMAP. Nat Biotechnol. 2019;37:38-44.
18. Subramanian A, Tamayo P, Mootha VK, et al. Gene set enrichment analysis: a knowledge-based approach for interpreting genome-wide expression profiles. Proc Natl Acad Sci U S A. 2005;102(43):15545-15550.
19 Fornerod M, Ma J, Noort S, et al. Integrative genomic analysis of pediatric myeloid-related acute leukemias identifies novel subtypes and prognostic indicators. Blood Cancer Discov. 2021;2(6):586-599.
20. Khoury JD, Solary E, Abla O, et al. The 5th edition of the World Health Organization Classification of Haematolymphoid Tumours: Myeloid and Histiocytic/Dendritic Neoplasms. Leukemia. 2022;36(7):1703-1719.
21. Miles LA, Bowman RL, Merlinsky TR, et al. Single-cell mutation analysis of clonal evolution in myeloid malignancies. Nature. 2020;587(7834):477-482.
22. Harrop S, Nguyen PC, Byrne D, et al. Persistence of UBTF tandem duplications in remission in acute myeloid leukaemia. EJHaem. 2023;4(4):1105-1109.
23. Barajas JM, Rasouli M, Umeda M, et al. Acute myeloid leukemias with UBTF tandem duplications are sensitive to Menin inhibitors. Blood. 2024;143(7):619-630.
24. Erlacher M, Stasik S, Yoshimi A, et al. UBTF tandem duplications account for a third of advanced pediatric MDS without genetic predisposition to myeloid neoplasia. Blood. 2022;140(Suppl 1):1355-1356.
Time from diagnosis to treatment has no impact on survival in newly diagnosed acute myeloid leukemia treated with venetoclax-based regimens
David Baden,1,2 Sven Zukunft,3 Gema Hernandez,4 Nadine Wolgast,1,2 Sophie Steinhäuser,1,2 Alexander Pohlmann,5 Christoph Schliemann,5 Jan-Henrik Mikesch,5 Björn Steffen,6 Tim Sauer,7 Maher Hanoun,8 Kerstin Schäfer-Eckart,9 Stefan W. Krause,10 Mathias Hänel,11 Hermann Einsele,12 Edgar Jost,13 Tim H. Brümmendorf,13 Sebastian Scholl,14 Andreas Hochhaus,14 Andreas Neubauer,15 Andreas Burchert,15 Martin Kaufmann,16 Dirk Niemann,17 Markus Schaich,18 Wolfgang Blau,19 Alexander Kiani,20 Martin Görner,21 Ulrich Kaiser,22 Johannes Kullmer,23 Thomas Weber,24 Wolfgang E. Berdel,5 Gerhard Ehninger,3 Carsten Müller-Tidow,7 Uwe Platzbecker,25 Hubert Serve,6 Martin Bornhäuser,3 Christoph Röllig,3 Claudia D. Baldus1,2 and Lars Fransecky1,2
1Department of Internal Medicine II, University Hospital Schleswig-Holstein, Kiel, Germany; 2University Cancer Center Schleswig-Holstein, University Hospital Schleswig-Holstein, Kiel, Germany; 3Medical Department I, University Hospital of TU Dresden, Dresden, Germany; 4TriNetX, TriNetX Europe NV, Sint-Martens-Latem, Belgium; 5Department of Medicine A, University Hospital Münster, Münster, Germany; 6Medical Department II, J.-W.-Goethe University Hospital Frankfurt, Frankfurt, Germany; 7Medical Department V, Heidelberg University Hospital, Heidelberg, Germany; 8Department of Hematology, Essen University Hospital, Essen, Germany; 9Medical Department 5, University Hospital of Paracelsus Medical University Nuremberg, Nuremberg, Germany; 10Department of Medicine 5, Uniklinikum Erlangen, Erlangen, Germany; 11Department for Internal Medicine III, Klinikum Chemnitz, Chemnitz, Germany; 12Medical Department II, University Hospital Würzburg, Würzburg, Germany; 13Department of Oncology, Hematology, Hemostaseology and Stem Cell Transplantation, University Hospital RWTH Aachen, and Center for Integrated Oncology (CIO), Aachen, Bonn, Cologne, Düsseldorf (ABCD), Aachen, Germany; 14Klinik für Innere Medizin II, Jena University Hospital, Jena, Germany; 15Department of Internal Medicine, Hematology, Oncology and Immunology, University Hospital Marburg, Marburg, Germany; 16Department of Hematology, Oncology and Palliative Medicine, Robert-Bosch-Hospital Stuttgart, Stuttgart, Germany; 17Internal Medicine, Hematology/Oncology, Palliative Medicine, Gemeinschaftsklinikum Mittelrhein, Koblenz, Germany; 18Department for Hematology, Oncology and Palliative Medicine, Rems-Murr-Klinikum, Winnenden, Germany; 19Department for Internal Medicine III, Helios Dr Schmidt Hospital Wiesbaden, Wiesbaden Germany; 20Department for Oncology and Hematology, Klinikum Bayreuth, and Comprehensive Cancer Center ErlangenEMN, Erlangen, Germany; 21Department for Hematology, Oncology and Palliative Medicine, Klinikum Bielefeld, Bielefeld, Germany; 22Medical Department II, St. Bernward Hospital, Hildesheim, Germany; 23Medical Department II, Hematology and Oncology, DIAKO Bremen, Bremen, Germany; 24Department for Internal Medicine IV, University Hospital Halle (Saale), Halle, Germany and 25Medical Department I, Hematology and Cell Therapy, University Hospital Leipzig, Leipzig, Germany
Abstract
Correspondence: D. Baden david.baden@uksh.de
Received: February 6, 2024. Accepted: April 17, 2024. Early view: April 24, 2024.
In newly diagnosed acute myeloid leukemia (AML), immediate initiation of treatment is standard of care. However, deferral of antileukemic therapy may be indicated to assess comorbidities or pretherapeutic risk factors. We explored the impact of time from diagnosis to treatment on outcomes in newly diagnosed AML undergoing venetoclax-based therapy in two distinct cohorts. By querying the Study Alliance Leukemia database and the global health network TriNetX, we identified 138 and 717 patients respectively with an average age of 76 and 72 years who received venetoclax-based first-line therapy. When comparing patients who started treatment earlier or later than 10 days after initial diagnosis, no significant difference in
median overall survival was observed - neither in the SAL cohort (7.7 vs. 9.6 months; P=0.42) nor in the TriNetX cohort (7.5 vs. 7.2 months; P=0.41). Similarly, severe infections, bleeding, and thromboembolic events were equally observed between early and later treatments, both in the overall patient groups and specific subgroups (age ≥75 years or leukocytes ≥20x109/L). This retrospective analysis indicates that delaying the start of venetoclax-based therapy in newly diagnosed AML might be a safe option for selected patients, provided that close clinical monitoring is performed.
Introduction
The diagnosis of acute myeloid leukemia (AML) is deemed a medical emergency, given that untreated cases result in dismal outcomes.1 Immediate initiation of treatment has therefore been the standard of care for newly diagnosed patients with AML since the early days of leukemia therapy.2 Deferral of treatment was an exception and may only have occurred when assessment or treatment of comorbidities was necessary. Researchers have confirmed the paradigm of immediate treatment initiation when in 2009 Sekeres et al. showed that response rates and overall survival (OS) worsened if a treatment delay of more than 5 days occurred in patients under the age of 60 years.3 However, as more and more targeted treatment approaches become available, deferral of treatment in newly diagnosed AML may be indicated to treat according to molecular analysis.4-7 A study conducted in 2013 showed comparable treatment outcomes in patients with curative intent receiving intensive chemotherapy even when treatment is postponed.8 Likewise, in a comprehensive analysis published by the Study Alliance Leukemia (SAL) in 2020 involving 2,263 patients undergoing intensive chemotherapy induction, no disparity in overall survival or other clinical outcomes was observed based on the initiation of treatment.9 Conversely, a separate Swedish study with 2,374 patients and a study from the National Cancer Database of the US with 55,985 patients noted a survival impact with treatment delays.10,11 However, results of these population-based studies may be dominated by selection of induction regimens and their relapse rates rather than by treatment delay. It is noteworthy that patients who underwent early treatment were skewed towards a younger age. A meta-analysis conducted in 2023 including these studies and others but excluding the extensive US study, found a correlation between prolonged time from diagnosis to treatment initiation (TDT) and a decreased likelihood of achieving complete remission (CR).12 Overall, the described differences in these studies were marginal and the clinical relevance of these results may be limited. We argue that the prognosis of younger or fit patients is only minimally affected, if at all, by the TDT. But as all available data was derived exclusively from AML patients who are eligible for intensive chemotherapy, we sought to expand this clinical question to elderly patients unfit for intensive therapy. The approval of venetoclax in combination with hypomethylating agents (HMA) in newly diagnosed AML in 2018 by the Food and Drug Administration represented a significant
advance in AML therapy, offering improved outcomes for elderly or frail patients not eligible for intensive chemotherapy. Although there are subtype-specific differences in the antileukemic efficacy of venetoclax, venetoclax-based therapies are indicated regardless of Wolrd Health Organization/European LekemiaNet (ELN)/International Consensus Classification.13 With the advent of targeted therapies, there are new opportunities to address genetic alterations in AML also in patients ineligible for intensive treatment, and thus increase the number of treatment options.14,15 Since a comprehensive genetic diagnosis or addressing pre-existing conditions and associated complications can take more than 7-10 days, we asked whether a prolonged TDT with venetoclax-based therapies impairs outcome in patients with newly diagnosed AML.
Methods
This study used real-world data from two independent cohorts to compare TDT in AML: the patient registry of the SAL and electronic health records (EHR) from TriNetX, LLC (“TriNetX”), a global federated health research network. Patients from both cohorts were stratified into two treatment groups: those treated within the first 9 days (TDT 0-9) and those treated from day 10 onwards (TDT ≥10). The SAL trial is registered under the name “Clinical AML Registry and Biomaterial Database of the SAL”. The SAL trial was conducted in accordance with the principles of the Declaration of Helsinki and the protocol has been approved by the ethics committees of all participating centers. The study is registered under the clinicaltrials gov. Identifier: NCT03188874. TriNetX utilizes aggregated de-identified patient records, therefore no ethics committee approval was required.
SAL registry query design
The SAL registry captures cases of adult AML, examining laboratory values, genomics, survival, and relapse for academic and clinical insights. We selected patients with newly diagnosed AML treated with venetoclax in combination with HMA or low-dose cytarabine (LDAC) between January 1, 2018, and April 15, 2023. Only patients with a follow-up of at least 6 months or death within this period were included. Data query was performed on November 28, 2023. In order to enhance data validity and specificity, patients receiving treatment >50 days after diagnosis were excluded from the analysis. Patient characteristics were analyzed using descriptive statistical
methods. The binary outcomes CR or complete remission with incomplete count recovery (CRi), early death (ED) and allocation to allogeneic hematopoietic stem cell transplant (HSCT) were expressed as a percentage and compared using the χ2 test, while for OS, event-free survival (EFS) and relapse-free survival (RFS) the Kaplan-Meier approach was used. EFS was defined as either primary treatment failure or relapse or death, RFS was calculated from the time of CR/CRi until relapse or death.
TriNetX query design
TriNetX is a healthcare network that facilitates access to EHR from currently more than 250 million patients worldwide providing data for clinical and retrospective studies.16 We searched for patients from the TriNetX database who were treated with newly diagnosed AML between January 1, 2015, and July 1, 2023, and met the following criteria: venetoclax treatment in combination with HMA or LDAC, follow-up of at least 1 year or death, no prior treatment of anthracycline/ mitoxantrone or venetoclax before diagnosis of AML, no
prior diagnosis of AML, age ≥20 years, no intensive therapy within the first 8 weeks after diagnosis and no prior HSCT. Data query on the platform was performed on October 24, 2023. Analyses were done utilizing the statistical tools provided within the TriNetX network, as only aggregated data was accessible. The baseline characteristics age and body mass index (BMI) were therefore described by means and standard deviations (SD), while the other continuous variables were described by median and interquartile range (IQR). Age and BMI were compared using Student’s t test, dichotomous variables by the χ2 test. As no statistical analyses for aggregated data other than the Student’s t test are available on the platform, no comparison could be made for median and IQR. Further details are described in the Online Supplementary Appendix.
Results
We identified a total of 855 patients (717 TriNetX, 138 SAL registry) who received first-line treatment of AML with venetoclax based regimens. The patient selection process
Patient characteristics, N (%)
Age in years, median (range)
Male
Female
Age ≥75 years
WBC
Lab. parameters, median (range)
WBC x109/L
Hemoglobin g/dL
Platelets x109/L
LDH U/L
Bone marrow blasts
AML characteristics, N % ELN2017# favorable intermediate adverse missing AML
(0.1-190)
(5.7-12.9)
(0.1-190)
(3.9-14.8)
(0.1-509)
°Bonferroni correction was used to adjust for multiple testing (P<0.0071 for significance). #Information available for 99 patients (72%). SAL: Study Alliance Leukemia; TDT: time from diagnosis to treatment; WBC: white blood cell count; BMI: body mass index; ECOG: Eastern Cooperative Oncology Group; LDH: lactate dehydrogenase; ELN2017: European LeukemiaNet 2017 risk stratification for acute myeloid leukemia; sAML: secondary acute myeloid leukemia, tAML: therapy-related acute myeloid leukemia; lab.: laboratory.
Table 1. Patient characteristics SAL registry.
is illustrated as CONSORT flow diagram (Online Supplementary Figure S1).
SAL registry
At data cutoff, a total of 8,681 newly diagnosed AML patients were registered in the SAL registry, of whom 138 received venetoclax in combination with HMA or LDAC as first line treatment and met inclusion criteria for this analysis. Of these patients, 103 received treatment within the first 9 days after diagnosis (75%, TDT 0-9), while 35 patients were treated on day 10 or later (25%, TDT ≥10) (Table 1). Median TDT was 4 days (IQR, 2-6 days) in the TDT 0-9 group and 15 days (IQR, 12-21 days) in the TDT ≥10 group, respectively (Online Supplementary Figure S2). With a median age of 77 years (range, 58-89 years), patients in the TDT 0-9 group were significantly older than in the TDT ≥10 group (median age 73 years; range, 29-86 years; P=0.007). We observed no significant difference in hemoglobin levels (8.1 g/dL vs 8.6 g/dL; P=0.49), platelet counts (38x109/L vs. 57x109/L; P=0.14), percentage of bone marrow blasts (60% vs. 45%; P=0.07) or lactate dehydrogenase (LDH) (396 U/L vs. 302 U/L; P=0.45). The percentage of patients with leukocytosis defined as white blood cell count (WBC) ≥20x109/L was similar (34% vs. 20%; P=0.12). According to the ELN2017 risk stratification, favorable, intermediate, and unfavorable genetic risks were present in 15%, 30% and 55% of patients, respectively. Patients with favorable genetic risks were only identified in the TDT 0-9 group; however, this difference was not statistically significant. Comorbidities were present to the same extent in both cohorts (91% vs. 94%; P=0.57). CR or CRi was achieved in 43 of 103 (42%) and 16 of 35 (46%) patients, respectively. The median OS was 6.7 months with a median follow-up time of 16 months in the TDT 0-9 and 12 months in the TDT ≥10 group (Table 2). HSCT was realized in 10 of 138 patients (7%). In order to determine whether very early treatment provides a survival benefit, we divided
the TDT 0-9 group along the median into a TDT 0-4 and a TDT 5-9 subgroup. No differences in OS were observed (median survival 6.1 vs. 9.5 months; P=0.2).
With an OS of 7.7 (95% confidence interval [CI]: 5.3-12) versus 9.6 (95% CI: 6.4- not reached [NR]) months, there was only a small, statistically non-significant difference between the TDT 0-9 and TDT ≥10 groups (P=0.42) (Figure 1A). Likewise, a numerical but not statistically significant difference was observed for RFS or EFS (36 vs. 14 months; P=0.33 and 6.2 vs. 5.5 months; P=0.93; Online Supplementary Figure S3). RFS at 12 months was 57% (95% CI: 42-78) and 55% (95% CI: 32-96), median EFS at 12 months was 37% (95% CI: 29-48) and 38% (95% CI: 25-59). The OS in subgroups of individuals aged ≥75 years (8.4 vs. 21 months; P=0.62) or with WBC ≥20x109/L (9.1 vs. 12 months; P=0.80) displayed no statistically significant differences between early and late treatment. The OS after 12 months was 42% (95% CI: 31-58) and 52% (95% CI: 30-88) in the patients aged ≥75 years and 46% (95% CI: 31-67) and 38% (95% CI: 14-100) in the WBC ≥20x109/L subgroup (Table 2; Online Supplementary Figure S4). Early death after 30 days occurred in 14 of 138 (10%) patients with no significant difference between the groups (11% vs. 9%; P=0.72). Hydroxyurea administration lacked consistent documentation and thus is not included in the analysis.
TriNetX cohort
At the time of analysis, there were 32,058 patients with newly diagnosed AML in the TriNetX EHR library. Of these, 717 AML patients with sufficient documentation were identified who received combination treatment with venetoclax and met the inclusion criteria. Among them, 491 patients received treatment within the first 9 days after diagnosis (68%, TDT 0-9), while in 226 patients, treatment was initiated on day 10 or later (32%, TDT ≥10). The patient population comprised 80% Whites, 6% African Americans, 2% Asians and 12% other US citizens of unknown ethnicity from 41
SAL: Study Alliance Leukemia; TDT: time from diagnosis to treatment; OS: overall survival; CI: confidence interval; WBC: white blood cell count; CR/CRi: complete remission/complete remission with incomplete count recovery; EFS: event-free survival; RFS: relapse-free survival; HSCT: allogeneic hematopoietic stem cell transplant. NR: not reached.
Table 2. Treatment outcomes SAL registry.
US-based healthcare organizations.
Mean age was 71.8±8.9 years, with very little variance between both groups (Table 3). We observed more patients with a WBC ≥20x109/L in the TDT 0-9 group (36% vs. 18%; P<0.0001) compared to TDT ≥10. Regarding sex or comorbidities, no significant differences between the two groups were present. Median TDT was 3 days (IQR, 1-5 days) in the TDT 0-9 group and 17 days (IQR, 13-25) in the TDT ≥10 group, respectively (Online Supplementary Figure S2). Median follow-up, defined as time from diagnosis to last documented visit or death was 11.0 months.
Median OS was 7.5 months in the TDT 0-9 group and 7.2 months in the TDT ≥10 group (P=0.41; Table 4; Figure 1B). This parity persisted even after using PSM to match patients for WBC and age, effectively controlling for the increased prevalence of leukocytosis in the TDT 0-9 group (7.4 vs. 7.2
months; P=0.49). Balanced across the two groups, 37 of 717 patients (5%) received HSCT for consolidation. When we queried for adverse events by selected International Classification of Disease codes (Online Supplementary Table S1) no differences between TDT 0-9 and TDT ≥10 were identified. Severe infections occurred in 244 of 717 patients (34%). We found acute kidney injury in 154 of 717 patients (21%) again without significant association to TDT (Table 5). We noted a higher 30-day death rate in the TDT 0-9 group (19%) compared to the TDT ≥10 group (10%; P=0.005). The difference was not present after matching patients for WBC and age or if 60-day early mortality was analysed (Table 4). Subgroup analyses revealed no differences in OS between the TDT 0-9 versus TDT ≥10 group in patients ≥75 years old (7.9 vs. 7.2 months; P=0.86), with WBC ≥20x109/L (4.0 vs. 4.0 months; P=0.31) or any versus no comorbidities (7.9 vs. 6.7
Figure 1. Overall survival of patients in the SAL and TriNetX cohort. (A) Overall survival (OS) of patients in the Study Alliance Leukemia (SAL) cohort calculated from diagnosis of acute myeloid leukemia (AML). Median OS was 7.7 (95% confidence interval [CI]: 5.3-12) months in the time from diagnosis to treatment (TDT) 0-9 and 9.6 (95% CI: 6.4- not reached) months in the TDT ≥10 group (P=0.42). Median follow-up time was 16 and 12 months, respectively. (B) OS of patients in the TriNetX-cohort calculated from diagnosis of AML. Median OS was 7.5 (95% CI: 5.8-8.6) months in the TDT 0-9 group and 7.2 (95% CI: 5.5-7.9) months in the TDT ≥10 group (P=0.41). Median follow-up time was 11 months in the whole cohort.
months; P=0.26) (Online Supplementary Figures S5-S7). We observed no significant differences in clinical outcomes of these subgroups such as severe infections, renal failure, heart or liver failure, bleeding, or thromboembolic events either (Online Supplementary Tables S2-S4). As with the SAL-cohort, we divided the TDT 0-9 group along the median into a TDT 0-3 and a TDT 4-9 subgroup. Again, no differences in
Table 3. Patient characteristics TriNetX.
OS or other clinical outcomes were observed (median survival 6.9 vs. 7.9 months; P=0.32). During the initial 30 days post-diagnosis, hydroxyurea was prescribed to 32% of TDT 0-9 group patients, and 13% in the TDT ≥10 group (P<0.001). In patients with leukocytosis, hydroxyurea was administered in 77% in the TDT 0-9 group and in 54% in the TDT ≥10 group (P=0.006).
Patient characteristics, N (%)
Age in years, mean ± SD
Male
Female
Age ≥75 years
WBC ≥20x109/L
Comorbidities
BMI kg/m², mean ±SD
Lab. parameters, median (IQR)
WBC x109/L
Hemoglobin g/dL
Platelets x109/L
LDH U/L
Bilirubin mg/dL
Creatinine mg/dL
Albumin g/dL
CRP mg/L*
6.4 (1.9-29.6)
8.3 (7.6-9.4)
47 (26-89)
356 (226-620)
0.6 (0.5-0.9)
0.98 (0.79-1.31)
3.4 (3.0-3.9) 40 (9-100)
3.2 (1.4-7.7)
8.5 (7.7-9.7)
53 (27-114)
264 (184-554)
0.6 (0.4-1.0) 0.92 (0.78-1.21)
3.6 (3.2-4.1) 52 (10-108)
4.6 (1.9-24.9)
8.3 (7.6-9.5)
51 (25-97)
329 (210-614)
0.6 (0.5-0.9) 0.97 (0.79-1.29)
3.5 (3.0-3.9)
42 (9-118)
°Bonferroni correction was used to adjust for multiple testing; P<0.00625 for significance; *value available for less than 30% of patients at first diagnosis. TDT: time from diagnosis to treatment; SD: standard deviation; WBC: white blood cell count; BMI: body mass index; LDH: lactate dehydrogenase; CRP: C-reactive protein; IQR: interquartile range; lab.: laboratory.
Table 4. Overall survival and early death TriNetX.
Median OS in months (95% CI)
Overall after PSM
Age ≥75 years
WBC ≥20x109/L
Comorbidities
3-year survival probability (%)
Overall after
#Early death 30 days, N % after PSM
#Early death 60 days, N % after PSM
N
7.5 (5.8-8.6)
(5.3-9.6)
(5.5, 9.1)
(2.5-5.7)
(5.8-9.7)
(5.5-7.9)
°Bonferroni correction was used to adjust for multiple testing (P<0.008 for significance), log-rank test; #calculated from start of treatment. TDT: time from diagnosis to treatment; OS: overall survival; CI: confidence interval; PSM: propensity score matching; WBC: white blood cell count; CR/CRi: complete remission/complete remission with incomplete count recovery; EFS: event-free survival; RFS: relapse-free survival; HSCT: allogeneic hematopoietic stem cell transplant.
Patients with outcome event prior to first diagnosis of acute myeloid leukemia were excluded. #Censored, less than 10 patients. TDT: time from diagnosis to treatment, CI: confidence interval.
Discussion
We examined for the first time the effect of TDT on clinical outcomes in newly diagnosed AML patients treated with venetoclax-based regimens. Both SAL and TriNetX patient cohorts were overall well balanced according to clinical parameters and patient demographics, which was mostly maintained upon stratification into short and long TDT. Although the median age was higher in the SAL TDT 0-9 group, the proportion of patients aged ≥75 years was similar across both SAL TDT groups. In the TriNetX cohort, no relevant age difference was observed, suggesting that the age disparity in the SAL cohort between TDT 0-9 and TDT ≥10 groups may be attributed to the relatively small sample size. In the SAL cohort, TDT 0-9 displayed a trend for improved RFS and EFS, with slightly shorter OS compared to the TDT ≥10 group. This observation is likely caused by a few cases with late events and again a consequence of the small sample size, impacting RFS and EFS but not OS. In the TriNetX cohort, no significant differences in OS were observed between the TDT groups, neither in the primary cohort nor in the respective subgroups.
The greater proportion of patients with leukocytosis (WBC ≥20x109/L) in the TDT 0-9 group compared to the TDT ≥10 group in the TriNetX cohort may reflect a consensus among treating physicians not to delay treatment initiation in AML with high cell turnover. In the SAL cohort, the proportion of patients with leukocytosis (WBC ≥20x109/L) did not differ between the TDT 0-9 and TDT ≥10 groups, again probably due to the lower number of patients in this cohort. As repeated WBC counts were not available for analysis, information on leukocyte dynamics was lacking. In the TriNetX cohort, overlapping survival curves suggest potential unaddressed non-proportional hazards, likely caused by sample size limitations. However, the overall lack of outcome differences in patients with WBC ≥20x109/L suggests that carefully selected individuals may tolerate elevated WBC for a few days, possibly with additional hydroxyurea treatment. The absence of disparities in survival or other clinically sig-
nificant outcomes, such as severe infections, hemorrhage, or organ failure between TDT 0-9 and TDT ≥10 groups in both the SAL and TriNetX cohorts indicates that delaying treatment does not seem to pose an elevated risk for older patients and those with comorbidities. Consistent signals of equivalence in two international cohorts imply widespread success in clinically managing patients with delayed TDT, likely reflecting good clinical practice across different regions. At the same time, the antileukemic effect of venetoclax does not appear to be affected by treatment delay. Therefore, unfavorable outcomes in unfit AML patients treated with venetoclax are likely attributed to factors beyond TDT. We found a higher early mortality (assessed after start of treatment) in the TDT 0-9 group compared to the TDT ≥10 group of the TriNetX cohort. In order to account for the impact of older age and high WBC as significant factors in early mortality, we employed PSM to match the TriNetX groups based on these variables.17-19 No statistically significant difference in early mortality was observed after the use of PSM. Furthermore, there were no discernible differences in specific clinical outcomes or treatment-related complications that would implicate antileukemic treatment as a significant factor in 30-day early mortality. Consequently, we conclude that TDT had no effect on early mortality.
Comparable to several other real-world analyses, we observed lower remission rates and OS (6.7 to 7.4 months) and a higher early death rate (10% to 16%) in both patient cohorts compared to the venetoclax pivotal study ‘VIALE-A’ (median OS 14.7 months, early death rate 7%).13 VIALE-A targeted an elderly and frail patient population, using specific inclusion and exclusion criteria to characterize the study population. These criteria are presumably applied less strictly in practice, which broadens the indication (e.g., patients with advanced kidney, liver or heart problems, chronic lung disease or advanced diabetes). Consequently, our data is in line with reported median overall survival rates of between 9 and 13 months in several real-world analyses and a meta-analysis including 1,134 patients that showed a pooled median survival time of 9.4 months.20-24 Outside of prospective, controlled,
Table 5. Rates of adverse events across the TriNetX cohort stratified according to time from diagnosis to treatment.
randomized clinical trials (RCT), it is suspected that reduced safety monitoring and bone marrow assessments as well as decreased treatment adherence may contribute to impaired prognosis as well as distortion of efficacy parameters, such as response rates, and RFS.20-23,25 While an RCT may be more useful to estimate true clinical potential of a therapeutic regimen, real-world-analyses such as our report are required to assess clinical questions for which a RCT will likely never emerge. One such clinical issue is the optimal timing of treatment initiation in patients with newly diagnosed AML. Like all analyses based on real-world data, there are several limitations to consider. While we made efforts to accommodate known risk factors, non-randomized data inherently cannot be adjusted for unknown risk factors. For example, our results suggest that patients with evidence of rapid proliferation were treated earlier. However, there is little information on other patient or disease characteristics that may have influenced physicians’ decision to start treatment at a particular time. We cannot account for instances where patients scheduled for intensive treatment received venetoclax-based therapy or vice versa, as this information is not documented in the EHR or the SAL registry. Furthermore, both SAL and TriNetX cohorts exhibit selection bias and EHR may include misdiagnoses and lack information on potential confounders. The TriNetX cohort faces sampling bias due to non-random selection, missing individuals with limited healthcare access or patients receiving treatment outside facilities of the network. We lack information on facility size, which could affect molecular diagnostics waiting times and resource limitations for severe complications. Similar to other analyses conducted on TDT, the retrospective nature of this analysis fails to account for patients that succumb to leukemia before treatment initiation.3,8-12 But as untreated AML leads to a dismal outcome, a general assumption can be made: patients untreated for an extended period after diagnosis encounter a higher before-treatment mortality rate compared to those promptly treated. However, by focusing on time from diagnosis to treatment, the analysis addresses the question whether patients receiving treatment after a specific time frame have the same benefits from this therapy as patients who are treated immediately. Based on our results, we conclude that a delay in treatment does not result in an accumulation of risk factors or diminishes therapy efficacy and, consequently, does not influence outcome. In summary, our results show for the first time that TDT has no clinically relevant impact on OS in patients with newly
References
1. Burnett AK, Milligan D, Prentice AG, et al. A comparison of low-dose cytarabine and hydroxyurea with or without all-trans retinoic acid for acute myeloid leukemia and high-risk myelodysplastic syndrome in patients not considered fit for intensive treatment. Cancer. 2007;109(6):1114-1124.
diagnosed AML treated with venetoclax-based regimen as first line therapy. Furthermore, we found no differences in terms of treatment safety, EFS or RFS. Therefore, we assume that the antileukemic activity of venetoclax-based therapies is independent of the TDT. While our data do not suggest an imperative for extensive genetic testing prior to initiating AML therapy, delaying treatment, when clinically suitable and promising, may enhance outcomes for selected patients, e.g., those harboring targetable lesions and reversible comorbidities.
Disclosures
MH received support for travel expenses by Abbvie. All other authors have no conflicts of interest to disclose.
Contributions
DB designed and performed research, analyzed data, and wrote the paper. SZ and CR performed research and analyzed data. GH performed research and provided technical support for the TriNetX platform. CDB designed research and analyzed data. LF designed and performed research, analyzed data, and wrote the paper. All authors recruited and treated patients, acquired, and interpreted the data, drafted, and reviewed the report, gave their final approval for publication, and agreed to be accountable for all aspects of the work.
Acknowledgements
The authors thank all patients and caretakers for their support of the trial, and all SAL centers for their commitment in the registry.
Funding
DB is funded by the Deutsche Forschungsgemeinschaft (DFG, German Research Foundation) - project number 413490537 within the Kiel Clinician Scientist Program in Evolutionary Medicine (CSEM). The SAL-Trial is registered under the name “Clinical AML Registry and Biomaterial Database of the Study Alliance Leukemia” and is funded by the Technical University of Dresden.
Data-sharing statement
The data sets analyzed in this study were provided by the German SAL and TriNetX. The SAL data can be obtained from the SAL on reasoned request, the TriNetX data is available to members of the global health network.
2. Burchenal JH, Murphy ML, Tan CTC. Treatment of acute leukemia. Pediatrics. 1956;18(4):643-660.
3. Sekeres MA, Elson P, Kalaycio ME, et al. Time from diagnosis to treatment initiation predicts survival in younger, but not older, acute myeloid leukemia patients. Blood. 2009;113(1):28-36.
4 Stone RM, Mandrekar SJ, Sanford BL, et al. Midostaurin plus chemotherapy for acute myeloid leukemia with a FLT3 Mutation. N Engl J Med. 2017;377(5):454-464.
5. Döhner H, Wei AH, Appelbaum FR, et al. Diagnosis and management of AML in adults: 2022 recommendations from an international expert panel on behalf of the ELN. Blood. 2022;140(12):1345-1377.
6. Arber DA, Orazi A, Hasserjian RP, et al. International Consensus Classification of myeloid neoplasms and acute leukemias: integrating morphologic, clinical, and genomic data. Blood. 2022;140(11):1200-1228.
7. Khoury JD, Solary E, Abla O, et al. The 5th edition of the World Health Organization Classification of haematolymphoid tumours: myeloid and histiocytic/dendritic neoplasms. Leukemia. 2022;36(7):1703-1719.
8. Bertoli S, Bérard E, Huguet F, et al. Time from diagnosis to intensive chemotherapy initiation does not adversely impact the outcome of patients with acute myeloid leukemia. Blood. 2013;121(14):2618-2626.
9 Röllig C, Kramer M, Schliemann C, et al. Does time from diagnosis to treatment affect the prognosis of patients with newly diagnosed acute myeloid leukemia? Blood. 2020;136(7):823-830.
10. Juliusson G, Hagberg O, Lazarevic VL, Lehmann S, Höglund M. Impact of treatment delay in acute myeloid leukemia revisited. Blood Adv. 2021;5(3):787-790.
11. Alsouqi A, Rothenberger SD, Boyiadzis M, Lontos K. Time from diagnosis to treatment is associated with survival in patients with acute myeloid leukemia: an analysis of 55,985 patients from the National Cancer Database. Br J Haematol. 2022;199(2):256-259.
12. Franco S, Geng X, Korostyshevskiy V, Karp JE, Lai C. Systematic review and meta-analysis: Prognostic impact of time from diagnosis to treatment in patients with acute myeloid leukemia. Cancer. 2023;129(19):2975-2985.
13. DiNardo CD, Jonas BA, Pullarkat V, et al. Azacitidine and venetoclax in previously untreated acute myeloid leukemia. N Engl J Med. 2020;383(7):617-629.
14 Montesinos P, Recher C, Vives S, et al. Ivosidenib and azacitidine in IDH1-mutated acute myeloid leukemia. N Engl J
Med. 2022;386(16):1519-1531.
15. Short NJ, Nguyen D, Ravandi F. Treatment of older adults with FLT3-mutated AML: emerging paradigms and the role of frontline FLT3 inhibitors. Blood Cancer J. 2023;13(1):142.
16. Palchuk MB, London JW, Perez-Rey D, et al. A global federated real-world data and analytics platform for research. JAMIA Open. 2023;6(2):ooad035.
17 Liu C-J, Hong Y-C, Kuan AS, et al. The risk of early mortality in elderly patients with newly diagnosed acute myeloid leukemia. Cancer Med. 2020;9(4):1572-1580.
18. Oberoi S, Lehrnbecher T, Phillips R, et al. Early mortality in hyperleukocytosis in patients with acute myeloid leukemia: a systematic review and meta-analysis. Blood. 2013;122(21):2647.
19 Rinaldi I, Sutandyo N, Winston K. Comparison of early mortality between leukapheresis and non-leukapheresis in adult acute myeloid leukemia patients with hyperleukocytosis: a systematic review and meta-analysis. Hematology. 2022;27(1):141-149.
20. Vachhani P, Flahavan EM, Xu T, et al. Venetoclax and hypomethylating agents as first-line treatment in newly diagnosed patients with AML in a predominately community setting in the US. Oncologist. 2022;27(11):907-918.
21. Hoff FW, Patel PA, Belli AJ, et al. Real-world outcomes of frontline venetoclax-based therapy in older adults with acute myeloid leukemia: an analysis utilizing EHR data. Leuk Lymphoma. 2023;64(6):1123-1128.
22. Ucar MA, Ozet G, Koyuncu MB, et al. Real world results of venetoclax combined with hypomethylating agents in relapsed/refractory AML. Eur Rev Med Pharmacol Sci. 2021;25(21):6557-6565.
23. Gershon A, Ma E, Xu T, et al. Early real-world first-line treatment with venetoclax plus HMAs versus HMA monotherapy among patients with AML in a predominately US community setting. Clin Lymphoma Myeloma Leuk. 2023;23(5):e222-e231.
24. Ucciero A, Pagnoni F, Scotti L, et al. Venetoclax with hypomethylating agents in newly diagnosed acute myeloid leukemia: a systematic review and meta-analysis of survival data from real-world studies. Cancers. 2023;15(18):4618.
25. Liu F, Panagiotakos D. Real-world data: a brief review of the methods, applications, challenges and opportunities. BMC Med Res Methodol. 2022;22(1):287.
Transfusion of ever-pregnant donor red blood cells and mortality of male patients
Sarah J. Valk,1,2 Camila Caram-Deelder,2 Rolf H.H. Groenwold,2 Dorothea Evers,3 Karen M.K. de Vooght,4 Daan van de Kerkhof,5 Marielle J. Wondergem,6 Nathalie C.V. Péquériaux,7 Francisca Hudig,8 Jaap Jan Zwaginga,1,9 Rutger A. Middelburg2,10 and Johanna G. van der Bom2
1Jon J van Rood Center for Clinical Transfusion Research, Sanquin/LUMC, Leiden; 2Department of Clinical Epidemiology, Leiden University Medical Center, Leiden; 3Department of Hematology, Radboudumc, Nijmegen; 4Central Diagnostic Laboratory, University Medical Center Utrecht, Utrecht; 5Department of Clinical Chemistry and Hematology, Catharina Hospital, Eindhoven; 6Department of Hematology, Amsterdam UMC, location VUmc, Amsterdam; 7Department of Clinical Chemistry and Hematology, Jeroen Bosch Hospital, ‘s Hertogenbosch; 8LabWest, Haga Teaching Hospital, The Hague; 9Department of Hematology, Leiden University Medical Center, Leiden and 10Department of Public Health and Primary Care, Leiden University Medical Center, Leiden, the Netherlands
Abstract
Correspondence: J.G. van der Bom j.g.van_der_bom@lumc.nl
Received: May 17, 2023.
Accepted: February 14, 2024. Early view: February 22, 2024.
Previous studies found exposure to red blood cell transfusions from female donors who have been pregnant reduces survival in male patients compared to exposure to male donor products, but evidence is not consistent. We postulate the previously observed association is modified by offspring sex, with an expected increased mortality risk for male patients receiving units from female donors with sons. Here, marginal structural models were used to assess the association between exposure to units from ever-pregnant donors, ever-pregnant donors with sons and ever-pregnant donors with daughters, and mortality. Clinical data were collected on first-ever transfusion recipients in the Netherlands and donor data were supplemented with information about offspring sex and date of birth. In this analysis, 56,825 patients were included, of whom 8,288 died during follow-up. Exposure to red blood cell units from ever-pregnant donors with sons was not associated with increased all-cause mortality risk among male transfusion recipients (hazard ratio [HR]=0.91, 95% confidence interval [CI]: 0.83-1.01). Exposure to ever-pregnant donors, irrespective of offspring sex, was associated with mortality in male patients aged between 18 and 50 years (ever-pregnant donors: HR=1.81, 95% CI: 1.31-2.51) compared to male donor units, but was protective in female patients. This study suggests that the observed increased mortality risk for exposure to red blood cell units from parous female donors does not depend on offspring sex. The increased risk of mortality seen in younger adult male patients is consistent with previous observations, but the underlying biological mechanism could not be identified in this study.
Introduction
Red blood cell transfusions are given to improve tissue oxygenation in patients suffering from anemia and hemorrhage. There is substantial variation in clinical practice leading to possible over-transfusion,1 and furthermore transfusions are associated with harm, such as bloodborne infections and transfusion-associated circulatory overload.2 In 2011, an association was reported between transfusions of red blood cells from female donors and increased mortality in male patients under 50 years of age.3 Later, this finding was replicated in an independent cohort. 4 This association was shown to be limited to female donors
with a history of pregnancy, and it was estimated that this association could be responsible for one potentially preventable death per day in the Netherlands.4,5 Although recent investigations from other countries have not found an effect of donor pregnancy on mortality after transfusion,6,7 differences between blood product production methods and used materials, differences between donor and patient populations, as well as differences in applied methodology could explain the discrepancies in results between studies. Evidently, transfusion practices should not be changed based on these contradictory findings, yet better understanding of the biological mechanisms that gave rise to these results might enable targeted changes to blood transfusion practice.
The observation that younger adult male patients exposed to ever-pregnant donors were at increased mortality risk compared to other patient subgroups suggests that these patients are somehow ‘sensitive’ to a component of the red blood cell product. This sensitivity could be due to the involvement of male-targeted minor histocompatibility antigens (HY-antigens) as well as the transfusion indication.8 Pregnant women have been shown to immunize against male antigens (e.g., HY-antigens) during pregnancy or delivery. At the same time, young men often receive blood for the indication of trauma, which is known to cause a transient immune suppression.9 Thus, younger male patients could be more sensitive to the effects of unintentionally transferred immune cells in red blood cell transfusions because of the indication for the transfusion. Furthermore, they could be more sensitive to immune cells primed against HY-antigens. Accordingly, we hypothesize blood products from female donors who have male offspring are harmful to young male patients. We hypothesize that the effect of exposure could become apparent early, but also later in life, as can be seen by the diverging Kaplan-Meier curves in a previous publication.4
In order to investigate this hypothesis, we aimed to first replicate the previously found association of increased mortality in male patients receiving red blood cells from female donors with a history of pregnancy. Second, we aimed to quantify the association between mortality and red blood cell transfusions from female donors who gave birth to a son or who gave birth to a daughter. Third, we aimed to investigate these associations in different age subgroups of male patients, as effect measure modification by patient age has been observed previously.3,4 Three comparisons were performed (outlined in Figure 1): i) male donors (reference) compared to ever-pregnant female donors (exposure group 1) and never-pregnant female donors (exposure group 2); ii) male donors (reference) compared to ever-pregnant female donors with male offspring (exposure group 1) and female donors without male offspring (consisting of female never-pregnant donors and female ever-pregnant donors without male offspring, exposure group 2); iii) male donors (reference) compared to ever-pregnant female donors with female offspring (exposure group 1), and female donors without female offspring (consisting of female never-pregnant donors and female ever-pregnant donors without female offspring, exposure group 2).
Methods
The ‘Mortality After Transfusion of Ever-pregnant donor Red blood cells’ (MATER) study is an observational cohort study, including data between the January 1, 2005 and January 1, 2019 from two earlier cohort studies, 3,4 supplemented with data from recent years (2015-2018)
and additional exposure information pertaining to donor pregnancy history. Patient data were collected to the ‘Risk Factors for Alloimmunization after red blood Cell Transfusions’ (R-FACT) study database (CCMO-NL29563.058.09; clinicaltrials.gov: NCT01616329 ).3,10 During the study period, all blood products underwent a leukodepletion step as part of production, and an estimated 4% of units was irradiated prior to transfusion. The need for informed consent was waived by the Medical Ethics Review Board. This large cohort of patients with transfusion data was supplemented with data from the national registration of Dutch inhabitants (Basisregistratie Personen, ‘BRP’) on registered offspring of donors. Mortality data were obtained from the hospital administration at the hospital’s end of data collection or the administrative end of study. 3,4
Although the MATER study is an observational study, we expected that the potential for confounding in this study was small. As the information about donor sex and pregnancy is not available to treating physicians, in practice red blood cell units are allocated independently of donor characteristics (notably, sex and parity of the donor). However, the logistics of the distribution of blood products depend on a number of factors that we consider to be potential confounders (Online Supplementary Figure S1 ). In brief, confounders were included because they are predictive of both the distribution of blood products in the population, and the outcome. All information on potential confounders was obtained from the hospital administration and the R-FACT study at baseline. 3,10 In order to be able to compare the effect of the different exposure categories, patients were censored at the time they received a transfusion from a different category than their previously received transfusions. This resulted in patients receiving more transfusions (and thus more likely to have a worse prognosis) being more likely to be censored, a phenomenon known as informative censoring.11 Furthermore, the possibility exists that treatment-confounder feedback by hemoglobin present in the blood product further exacerbates the already existing bias in any analysis not adjusted for informative censoring.6 In order to correct for both confounding at baseline, and the informative censoring during follow-up and treatment-confounder feedback, inverse probability weighting (IPW) was applied.12-14 Underlying disease severity of the patient and transfusion indication were not available, however, the number of transfusions was included in the IPW model and acted as a proxy for these variables. Weights were trimmed at a fixed level of 10, to reduce instability of the IPW estimator. Weighted marginal structural Cox proportional hazards models were fitted using the R packages ipw and survey.14
Analyses were stratified by patient sex and age (0-17, 1850, 51- 71 and ≥71 years), as prespecified in the statistical analysis plan and in line with previous studies.4,7 Sensitivity
Figure 1. Schematic representation of exposure groups in main analysis and sensitivity analyses. The source population for the study and the different comparisons are visually represented. Comparisons were chosen with respect to donor pregnancy and sex of the offspring, and were adapted in the sensitivity analyses as shown, to correspond to the comparator of interest. *Donors classified according to sex of the donor from blood bank records and the sex of the offspring registered in the Basisregistratie Personen (BRP). Female ever-pregnant: female donors with a history of pregnancy; female never-pregnant: female donors without a history of pregnancy.
analyses (for overview, see Online Supplementary Figure S2) were performed to: evaluate alternative statistical analyses with methods similar to earlier research (I); test assumptions about data quality (II); form an independent study cohort not previously described (III); assess the effect of excluding donors with both sons and daughters (IV); assess the effect of excluding donors with both sons and daughters and in addition excluding never-pregnant female donors (V).
Analyses were performed in Stata, version 16;15 data preparation and sensitivity analysis I), and R (version 3.6.3) and R Studio (version 2022.02.0+443) software (sensitivity analyses II-V). An extended methods section can be found in the Online Supplementary Appendix.
Results
Population
Table 1 contains donor and patient characteristics of the complete study population and the population included in the main analysis. The complete dataset contained data on 546,102 transfusions, and the donations linked to these transfusions originated from 134,046 male donors and 135,992 female donors. In total, 98,676 patients were included, and 51% (N=50,138) of the patients were female. During a median follow-up of 278 days (counted from the date of the first transfusion to the date of death, censoring or end of follow-up) 33,487 patients died (34%). From the complete study population, only 56,825 patients
Table 1. Patient and transfusion characteristics.
Characteristics
Follow-up in days, median (IQR)†
(37)
(31)
(15)
(14)
(11-2007) Person-time, sum in years
Age in years of patients, median (IQR)
0 to 17, N (%)
(14)
(11)
(17) 18 to 50, N (%)
51 to 70, N (%)
≥71, N (%)
Transfusions of red blood cell units per patient, median (IQR)
Female donor, never-pregnant, N (%)
Female donor, ever-pregnant, male offspring, N (%)
Female donor, ever-pregnant, no male offspring, N (%)
Male donor, N (%)
(12)
(38)
(37)
(2-6)
(16)
(20)
(6)
(57)
(6)
(57)
(13)
(73)
(17)
(27)
(39)
(9)
(13)
(13)
(73)
*Consists of all the follow-up time during which patients either received all their red blood cell transfusions exclusively from 1 exposure category: female donors without a history of pregnancy (never-pregnant donors), female donors with a history of pregnancy (ever-pregnant donors, with or without sons), or male donors. †Median follow-up time is defined as the median of longest time any patient is in 1 of the comparisons. Exposure categories are: female donors without a history of pregnancy (never-pregnant donors), female donors with a history of pregnancy (ever-pregnant donors, with or without sons), male donors. ‡Includes units from female donors with offspring of unknown sex. IQR: interquartile range.
could be included in the cohort for the main analysis because they received only one exposure category on their first transfusion day, of whom 51% (N=28,710) were female. From this selected population, 8,288 deaths could be included in the main analysis (15%). The median age of the complete population was 65 (interquartile range (IQR), 4676) and the median age in the main analysis was 64 years (IQR 37-76). Compared to the complete study population, patients included in the main analysis were followed-up for a shorter duration (median 278 days [IQR, 7-1,815] vs 1,226 days [IQR, 297-2,547]). Patients in the main analysis also received fewer transfusions (median 2 [IQR, 1-2] transfusions versus three [IQR, 2-6] transfusions) and were more likely to receive transfusions from male donors (73%) compared to the complete population (57%). Linkage of donor records resulted in complete exposure information (99.7% for comparison 1, 99.3% for comparison 2 and 3). Of note, male patients on average had a substantially shorter length of follow-up than female patients, which was more pronounced in the ever-pregnant and never-pregnant exposure arm (Online Supplementary Table S1).
Donor and patient characteristics for the populations included in the sensitivity analyses can be found in Online Supplementary Table S2. In Online Supplementary Table S3, the study population restricted to patients aged 18 years and older is described. Absolute standardized mean differences (SMD) were calculated to assess balance after
weighting for baseline factors for comparison 1 (Online Supplementary Figures S3-5). Balance was sufficient after weighting for all baseline characteristics (SMD <0.1), for the population comparing ever-pregnant donor exposure to male donors.
No increased risk of mortality after exposure to ever-pregnant donor units
Results for the three comparisons in the main analysis are reported in Figure 2. Exposure to female donors who have previously been pregnant compared to male donors was not associated with mortality (hazard ratio [HR]=0.96, 95% confidence interval [CI]: 0.88-1.04) in male patients (Figure 2). Exposure to ever-pregnant donors with sons and ever-pregnant donors with daughters was not associated with mortality in this analysis (comparison 2: HR= 0.91, 95% CI: 0.83-1.01); comparison 3: HR=0.94, 95% CI: 0.85-1.03). Blood products from never-pregnant female donors were protective (HR=0.88, 95% CI: 0.78-0.98) in male patients, compared to exposure to male donors. No other significant associations were observed.
For female patients, exposure to blood products from ever-pregnant donors was associated with decreased mortality compared to exposure to male donor units (HR=0.91, 95% CI: 0.83-0.99). Exposure to units from female donors with sons was not associated with mortality (HR= 0.93, 95% CI: 0.84-1.03) and exposure to units from ever-pregnant donors
Figure 2. Mortality hazard ratio of male and female transfusion recipients of male, ever-pregnant (with sons or daughters) and never-pregnant female donor red blood cell products. Exposure to ever-pregnant donor red blood cell products compared to male donor exposure is not associated with mortality in the complete population of male patients, nor in the complete population of female transfusion recipients. Offspring sex is not predictive of patient mortality, with hazard ratios (HR) similar in size and direction for both male and female offspring sex. Female ever-pregnant: female donors with a history of pregnancy; female never-pregnant: female donors without a history of pregnancy.
with daughters was associated with decreased mortality, compared to male donor unit exposure (HR=0.85, 95% CI: 0.76-0.95). No significant associations were observed for exposure to blood products from never-pregnant donors, female donors without sons and female donors without daughters.
For reasons of conciseness, the remainder of the Results section will focus on male patients only. For the main analysis, restricted to patients aged 18 years and older, HR were 0.99 (95% CI: 0.92-1.09) for male patients exposed to ever-pregnant donors, HR=0.98 (95% CI: 0.88-1.08) for exposure to ever-pregnant donors with sons and HR=0.99 (95% CI: 0.89-1.10) for exposure to ever-pregnant donors with daughters (Online Supplementary Table S4), all compared to exposure to male donors as reference. Exposure to never-pregnant female donors was significantly associated with decreased mortality (HR=0.87, 95% CI: 0.78-0.98). No other significant associations were observed.
Association between exposure to ever-pregnant donors and mortality in younger adult male patients
Results for the analysis stratified by age for male patients are reported in Table 2. In male patients aged between 18 and 50 years, receiving units from ever-pregnant donors was associated with mortality (HR=1.81, 95% CI: 1.31-2.51). Receiving units from ever-pregnant female donors with
sons was similarly associated with mortality in this subgroup, with a HR of 1.86 (95% CI: 1.27-2.71), and exposure to units from ever-pregnant female donors with daughters was also associated with mortality (HR 1.58, 95% CI: 1.05-2.37)). There was a significant interaction of exposure with age in the exposure groups of ever-pregnant donors, ever-pregnant donors with sons and ever-pregnant donors with daughters (P value of 0.0001 [comparison 1]; P=0.001 [comparison 2]; P=0.020 [comparison 3]).
Results for female patients can be found in Online Supplementary Table S5 . No significant associations were observed. The fully independent cohort of patients included after September 1, 2015 showed a similar magnitude and direction of the association between exposure to ever-pregnant donors and mortality for male (Online Supplementary Table S6 ) and female patients ( Online Supplementary Table S7).
Sensitivity analyses
Sensitivity analyses were performed to verify the previously described assumptions about the data and the used methods, and the results were in agreement with the main result showing robustness of the methods to changes in these assumptions. Results for the sensitivity analyses can be found in the Online Supplemental Appendix (I, Online Supplementary Table S8-10, and II-V, Online Supplementary Table S11).
Table 2. Mortality hazard ratio of male transfusion recipients exposed to red blood cell transfusions from female (never-pregnant with male offspring or ever-pregnant with male offspring) versus male donors stratified by patient age.
Female, everpregnant with daughters
Female, neverpregnant with daughters 37
*For the trend in interaction across the 4 presented categories of patient age. HR: hazard ratio; CI: confidence interval. Female ever-pregnant: female donors with a history of pregnancy; female never-pregnant: female donors without a history of pregnancy, ref.: reference.
Discussion
In this study of donor characteristics and transfusion recipient mortality, the observed mortality of male patients after exposure to ever-pregnant donor units was not explained by donor offspring sex. In the subgroup of male patients aged between 18 and 50 years, exposure to red blood cell products from ever-pregnant donors, regardless of the donor’s offspring sex, was significantly associated with worse outcomes after transfusion (HR=1.86, 95% CI: 1.27-2.71). The association in the complete population of female patients was actually in the direction of moderate protection; an unexpected finding which we cannot explain (HR=0.91, 95% CI: 0.83-0.99). A small, statistically significant association was observed between exposure to never-pregnant donors and mortality in male patients, a finding which is also not expected from our hypothesis (HR=0.88, 95% CI: 0.78-0.98). Independent replication of any observed associations - other than those prespecified as the intended target of the study in the prespecified statistical analysis plan - is a prerequisite for them to not be considered the consequence of random variability. Evidence on the topic of donor sex, pregnancy and patient outcomes has been conflicting. The finding presented here, that ever-pregnant donor exposure was associated with mortality in younger males, is consistent with a previous publication from our research group, and constitutes an independent replication of those earlier findings.3,4 A recent publication16 on a large pragmatic randomized controlled trial investigating donor sex found an increased risk of mortality after female donor exposure in patients aged 20-29 years, although the population was small and not stratified by patient sex. Other large observational studies, performed in the United States, Sweden and Denmark, have not shown any association with donor sex, donor pregnancy history and mortality.6,7,17
Analyses using traditional methods (sensitivity analysis I) were used to evaluate the magnitude and direction of bias due to informative censoring.18 Indeed, in the single-transfusion cohort investigating exposure to ever-pregnant donors, potential bias in the direction of harm from ‘rare’ exposure was visible in these most selective, most censored analyses (HR=1.14, 95% CI: 1.02-1.28). This, as opposed to the main analysis, with a HR of 0.96 (95% CI: 0.88-1.04). We postulate previous work could have suffered more from this bias, due to missing data in the pregnancy history of the donor necessitating more frequent censoring of patient follow-up. Treatment-confounder feedback, with more transfusions given to patients receiving blood from female donors through lower hemoglobin concentration in products donated by female donors as compared to male donors, is a potential cause of bias here.6 If chosen as exposure, any variable which affects the hemoglobin dose of the product may lead to bias if not accounted for correctly, because the hemoglobin dose of the product affects (in part) the
time to next transfusion, and the number of transfusions is associated with underlying disease severity. As women have a lower normal level of hemoglobin compared to men, treatment-confounder feedback should be accounted for in the analyses. It is recommended that future investigations of blood product characteristics that relate to hemoglobin-raising capacity, e.g., product storage and any traits related to red blood cell storage and stress hemolysis,19 incorporate measures to counteract this methodological artefact.
One of the strengths of this study is the large cohort of real-world data that was used and analyzed using appropriate methods. By pooling together into combined exposure groups the subgroups of ever-pregnant donors with both sons and daughters, and never-pregnant donors (depending on the comparison made), the main analysis had a large sample size. Expected challenges with regards to data quality and appropriateness of used methods were thoroughly investigated using sensitivity analyses, and these results were consistent with the main analysis. Thereby, these challenges were adequately addressed.
Limitations of the study include the granularity of the data, as the data were organized per day. This necessitated the exclusion of patients receiving transfusions from multiple categories on their first transfusion day, which could have led to bias and limited generalizability to patient populations requiring multiple transfusions early in the treatment course. Second, findings presented here are applicable to the study population of transfusion recipients between 2005 and 2019 in six hospitals in the Netherlands who received a median of two transfusions, and may not be generalizable to other settings, especially those with higher disease burden. Third, the use of inverse-probability weighted methods was only possible with larger intervals following the initial 4-week follow-up that was analyzed by transfusion day owing to sparse multivariable data, and this interval-censoring is a potential source of bias. Fourth, multiple comparisons were made but no adjustments for multiple testing were applied. However, all comparisons were prespecified and no post hoc analysis were included. Fifth, pregnancies resulting in miscarriages and stillbirths are not reported to the BRP and could, therefore, not be included in this study. Sixth, we did not have access to indication of the transfusion and underlying disease severity and were unable to assess balance for these factors after weighting. These limitations are mitigated by using multiple control conditions (e.g., never-pregnant donors and never-pregnant donors with daughters) and the inclusion of separate analyses for the fully independent cohort. The aforementioned methodological limitations apply to the full population, and would not explain the repeated observation of increased mortality in younger adult male patients. The association between mortality and exposure to ever-pregnant donors in male patients aged between 18 and 50 years was also present in the pop -
ulation included after September 2015, which was not previously described in other publications, and thereby constitutes an independent replication of this previously observed finding ( Online Supplementary Table S10 for male patients; Online Supplementary Table S11 for female patients). Methodological explanations were sought, and we hypothesized these male patients received multiple transfusions on their first day due to their transfusion indication, excluding them from the analysis and potentially introducing bias. However, after examining the frequency of exclusion due to mixture of exposures on the first day, this was not different between male and female patients for the different exposure categories ( Online Supplementary Table S12 ). Additional investigations of weights distribution, patient characteristics and censoring can be found in the Online Supplementary Appendix ( Online Supplementary Tables S13-15 ).
If some male patients are indeed sensitive to blood products from ever-pregnant female donors, there should be a biological rationale. Male patients could be sensitive to external stimuli due to their transfusion indication, as they more often receive large volumes of blood products in a short time frame, in a trauma setting. Micro-chimerism has been detected following transfusions for trauma indications, with reports of long-term engraftment of donor cells, but evidence is conflicting.20 An explanation of the observed mortality in these patients, not related to sex of the offspring, is immunization of the female donor against inherited paternal human leukocyte antigens (IPA) of the fetus. However, the exact mechanisms underlying the observed increase in mortality following transfusions from ever-pregnant female donors in young men are incompletely understood and may be multifactorial.
To conclude, in this large observational cohort study, exposure to donors with male offspring is not associated with mortality. In young adult male patients, blood products from ever-pregnant female donors are consistently
References
1. Shander A, Fink A, Javidroozi M, et al. Appropriateness of allogeneic red blood cell transfusion: The International Consensus Conference on Transfusion Outcomes. Transfus Med Rev. 2011;25(3):232-246.
2. Carson JL, Triulzi DJ, Ness PM. Indications for and adverse effects of red-cell transfusion. N Engl J Med. 2017;377(13):1261-1272.
3. Middelburg RA, Briet E, van der Bom JG. Mortality after transfusions, relation to donor sex. Vox Sang. 2011;101(3):221-229.
4 Caram-Deelder C, Kreuger AL, Evers D, et al. Association of blood transfusion from female donors with and without a history of pregnancy with mortality among male and female transfusion recipients. JAMA. 2017;318(15):1471-1478.
5. Altman DG, Andersen PK. Calculating the number needed to treat for trials where the outcome is time to an event. BMJ.
associated with mortality, which continues to be a concern. However, more research, specifically on transfusion indications and causes of death, is needed to understand the clinical relevance of this repeated observation. Transfusion policy changes which could be considered in the future (e.g., irradiation, matching for patient subgroups) must be based on a solid understanding of the underlying biological mechanism.
Disclosures
JJZ is in the scientific advisory council of Novartis, Amgen and Sanofi, and received a speaker’s fee. All other authors have no conflicts of interest to disclose.
Contributions
SJV, CCD, RAM, RHHG and JGvdB designed the study. SJV, DE, KMKdV, DvdK, MJW, NCVP, FH, JJZ and JGvdB collected the data. SJV, CCD, RHHG and JGvdB analyzed and interpreted the data and wrote the manuscript. All authors revised and approved the final manuscript.
Acknowledgments
We thank the Scientific Committee at the Department of Clinical Epidemiology of the LUMC for their methodological support. We thank the blood donors at Sanquin Blood Supply and the patients from the six hospitals who contributed their data to the study.
Funding
This research was funded by Sanquin Research (grant PPOC-18-03, www.sanquin.nl).
Data-sharing statement
Individual participant data will not be shared. Requests for access to the data can be made to the corresponding author. All procedures relating to data management and analyses were stored and are available on request.
1999;319(7223):1492-1495.
6. Zhao J, Sjölander A, Edgren G. Mortality among patients undergoing blood transfusion in relation to donor sex and parity: a natural Experiment. JAMA Inter Med. 2022;182(7):747-756.
7 Edgren G, Murphy EL, Brambilla DJ, et al. Association of blood donor sex and prior pregnancy with mortality among red blood cell transfusion recipients. JAMA. 2019;321(22):2183-2192.
8. Valk SJ, Caram-Deelder C, Zwaginga JJ, van der Bom JG, Middelburg RA. Donor sex and recipient outcomes. VOXS. 2020;15(1):142-150
9 Faist E, Schinkel C, Zimmer S. Update on the mechanisms of immune suppression of injury and immune modulation. World J Surg. 1996;20(4):454-459.
10 Evers D, Middelburg RA, de Haas M, et al. Red-blood-cell alloimmunisation in relation to antigens’ exposure and their
immunogenicity: a cohort study. Lancet Haematol. 2016;3(6):e284-292.
11. Edgren G, Rostgaard K, Hjalgrim H. Methodological challenges in observational transfusion research: lessons learned from the Scandinavian Donations and Transfusions (SCANDAT) database. Vox Sang. 2017;12(1):191-195.
12. Robins JM, Finkelstein DM. Correcting for noncompliance and dependent censoring in an AIDS Clinical Trial with inverse probability of censoring weighted (IPCW) log-rank tests. Biometrics. 2000;56(3):779-788.
13. Robins JM. Information recovery and bias adjustment in proportional hazards regression analysis of randomized trials using surrogate markers. J Am Stat Soc. 1993;3:24-33.
14 van der Wal WM, Geskus RB. ipw: an R package for inverse probability weighting. J Stat Softw. 2011;43(13):1-23.
15. StataCorp. Stata Statistical Software: Release 16. College
Station, TX: StataCorp LLC; 2019.
16. Chassé M, Fergusson DA, Tinmouth A, et al. Effect of donor sex on recipient mortality in transfusion. N Engl. Med. 2023;388(15):1386-1395.
17 Edgren G, Ullum H, Rostgaard K, et al. Association of donor age and sex with survival of patients receiving transfusions. JAMA Intern Med. 2017;177(6):854-860.
18. Hernán MA, Robins JM. Causal inference: what if.: Boca Raton: Chapman & Hall/CRC; 2020.
19 Kanias T, Lanteri MC, Page GP, et al. Ethnicity, sex, and age are determinants of red blood cell storage and stress hemolysis: results of the REDS-III RBC-Omics study. Blood Adv. 2017;1(15):1132-1141.
20 Jackman RP, Utter GH, Lee TH, et al. Lack of persistent microchimerism in contemporary transfused trauma patients. Transfusion. 2019;59(11):3329-3336.
Mutual regulation of CD4+ T cells and intravascular fibrin in infections
Tonina T. Mueller,1,2* Mona Pilartz,1* Manovriti Thakur,1* Torben LangHeinrich,1 Junfu Luo,1 Rebecca Block,1 Jonathan K.L. Hoeflinger,1 Sarah Meister,1 Flavio Karaj,1 Laura Garcia Perez,3 Rupert Öllinger,4 Thomas Engleitner,4 Jakob Thoss,1 Michael Voelkl,1 Claudia Tersteeg,5 Uwe Koedel,6 Alexander Zigman Kohlmaier,1 Daniel Teupser,1 Malgorzata Wygrecka,7 Haifeng Ye,8 Klaus T. Preissner,9 Helena Radbruch,10 Sefer Elezkurtaj,11 Matthias Mack,12 Philipp von Hundelshausen,13 Christian Weber,13 Steffen Massberg,2 Christian Schulz,2 Roland Rad,4 Samuel Huber,3 Hellen Ishikawa-Ankerhold2# and Bernd Engelmann1#
1Institut für Laboratoriumsmedizin, Klinikum der Universität München, Ludwig-MaximiliansUniversität (LMU), Munich, Germany; 2Medizinische Klinik I, Klinikum der Universität München, LMU, Munich, Germany; 31. Medizinische Klinik und Poliklinik, Universitätsklinikum Hamburg-Eppendorf, Hamburg, Germany; 4Institut für Molekulare Onkologie und Funktionelle Genomik, Technische Universität München, Munich, Germany; 5Laboratory for Thrombosis Research, KU Leuven Campus Kulak Kortrijk, Kortijik, Belgium; 6Neurologische Klinik, Klinikum der Universität München, LMU, Munich, Germany; 7Center for Infection and Genomics of the Lung (CIGL), Justus-Liebig-Universität, Giessen, Germany; 8Institute of Regenerative Biology and Medicine, Helmholtz-Zentrum München, Munich, Germany; 9Institute of Biochemistry, Justus-Liebig-Universität, Giessen, Germany; 10Institut für Neuropathologie, Charité - Universitätsmedizin, Berlin, Germany; 11Institut für Pathologie, Charité - Universitätsmedizin, Berlin, Germany; 12Medizinische Klinik II, University of Regensburg, Regensburg, Germany and 13Institut für Prophylaxe und Epidemiologie der Kreislaufkrankheiten, Ludwig-Maximilians-Universität, Munich, Germany
*TTM, MP and MT contributed equally as first authors. #HI-A and BE contributed equally as senior authors.
Innate myeloid cells especially neutrophils and their extracellular traps are known to promote intravascular coagulation and thrombosis formation in infections and various other conditions. Innate myeloid cell-dependent fibrin formation can support systemic immunity while its dysregulation enhances the severity of infectious diseases. Less is known about the immune mechanisms preventing dysregulation of fibrin homeostasis in infection. During experimental systemic infections local fibrin deposits in the liver microcirculation cause rapid arrest of CD4+ T cells. Arrested T-helper cells mostly represent Th17 cells that partially originate from the small intestine. Intravascular fibrin deposits activate mouse and human CD4+ T cells which can be mediated by direct fibrin-CD4+ T-cell interactions. Activated CD4+ T cells suppress fibrin deposition and microvascular thrombosis by directly counteracting coagulation activation by neutrophils and classical monocytes. T-cell activation, which is initially triggered by IL-12p40- and MHC-II-dependent mechanisms, enhances intravascular fibrinolysis via LFA-1. Moreover, CD4+ T cells disfavor the association of the thrombin-activatable fibrinolysis inhibitor (TAFI) with fibrin whereby fibrin deposition is increased by TAFI in the absence but not in the presence of T cells. In human infections thrombosis development is inversely related to microvascular levels of CD4+ T cells. Thus, fibrin promotes LFA-1-dependent T-helper cell activation in infections which drives a negative feedback cycle that rapidly restricts intravascular fibrin and thrombosis development.
Introduction
Inflammation and thrombosis are closely coupled responses to infections.1 Innate immune cells such as neutrophils
and monocytes are quintessential activators of fibrin formation and mediators of thrombosis during systemic immune processes. Through expulsion of neutrophil extracellular traps (NET) neutrophils promote thrombosis
via different mechanisms that help to initiate and stabilize developing thrombi.2 Monocytes trigger fibrin formation by activating the NLRP3 inflammasome and subsequent release of tissue factor (TF) through pyroptosis.3 During systemic infections activation of intravascular coagulation promotes the formation of microvascular thrombi that can restrict the dissemination and survival of bacteria.4 Innate immune cell-controlled coagulation activation inside the microvasculature can thus participate in antimicrobial defense, analogous to the protective function of coagulum formation in evolutionarily ancient organisms.5 So far, it is only incompletely known whether immune cells apart from innate leukocytes, especially cells of the lymphocyte lineage, participate in controlling intravascular coagulation and microvascular thrombosis during infections.
Aberrant fibrin generation and dysregulated micro- and macrovascular thrombosis can be detrimental consequences of innate immune responses to severe infections. Pathological thrombosis in connection with inflammation critically aggravates the morbidity and mortality of SARSCoV-2 infections6 and sepsis.7 Hence, it is of particular interest to dissect the endogenous mechanisms that restrict intravascular fibrin generation in infection. Endothelial cells are known to be critical protectors against excessive fibrin deposition in the microcirculation such as via production of anticoagulant molecules including activated protein C and local stimulation of fibrinolysis. Here we identify close bidirectional connections between CD4+ T cells and microvascular fibrin homeostasis in vascular infection. Local fibrin deposits are shown to promote the arrest and LFA-1-dependent activation of CD4+ T cells in the microcirculation. Activated T-helper cells rapidly restrict innate myeloid-cell driven thrombosis at and, favored by T-cell migration, distant from their arrest sites by stimulating fibrinolysis and disabling fibrinolysis inhibition.
Methods
Mice
Male and female WT, plg-/- and f12-/- mice (10-14 weeks old, age-matched) were infected with E. coli (3.2 x10⁸) or S. pneumoniae (1x10⁸) via tail vein injection. Rivaroxaban (Santa Cruz) was injected at 3 mg/kg body weight 4 hours (h) before infection. Cell depletion and neutralization was performed as described in the Online Supplementary Appendix. All animal experiments were approved by the local authorities (Regierung von Oberbayern).
Kaede experiments
The small intestine of kaede x Il17aKatushka mice was surgically exposed to photoconvert the accessible cells (dorsal and ventral) with BlueWave LED Prime UVA (Dymax) for
two-times 30 seconds. Twenty-four h later mice were infected with E. coli.8 Flow cytometry was performed as described in the Online Supplementary Appendix.
Isolation and migration of CD4+ T cells
For intravital imaging or adoptive transfer experiments mouse CD4+ T cells were isolated from spleen of uninfected C57BL/6J donor mice. Blood was collected from healthy human donors as approved by the local ethics committee of the Medical Faculty of LMU Munich. Human CD4+ T cells were isolated from peripheral blood according to the manufacturer´s instructions (CD4+ T Cell Isolation Kit, 130096-533, Miltenyi Biotec). Cells were incubated on fibrin or poly-L-ornithine-coated microscopic glass slides with a-human CD3 antibody (5 μg/mL, HIT3a, Biolegend) and a-human CD28 antibody (5 μg/mL, CD28.2, Biolegend) or treated with either an immunoglobulin G (IgG) control or an anti-human LFA-1 antibody (20 μg/mL, BioXCell). Isolated CD4+ T cells were fixed, blocked and incubated with AF647-labeled aCD69 antibody (1 μg/mL, Biolegend) and Dapi (1 μg/mL, Sigma Aldrich). For each experiment at least ten visual fields (225x225 μm) per donor were analyzed by confocal microscopy.
Immunohistochemistry
Murine livers and lungs were collected and fixed with neutral buffered 4% paraformaldehyde (PFA) at 4˚C for 1 h, dehydrated in 30% sucrose for 24 h at 4˚C and embedded in Tissue Tek; 10 μm cryosections were fixed in 4% PFA, washed and blocked with 2% bovine serum albumin solution or with 10% goat serum (Sigma Aldrich). For permeabilization, 0.1-0.3% Triton-X 100 was added. Tissue sections were incubated with unlabeled or labeled primary antibodies for 1 h at room temperature or overnight at 4°C. The labeling of primary antibodies was performed according to the manufacturer´s instructions (A20181, Thermo Fisher Scientific).
Tissue samples from the lung of patients with acute respiratory distress syndrome caused by infections with SARS-CoV-2 (N=12) or influenza virus (N=8) were obtained from autopsies. SARS-CoV-2 or influenza infections were diagnosed by PCR ante mortem. Mean age was 78.7±2.6 (SARS-CoV-2) and 68.1±5.5 years (influenza); 41.7% (SARSCoV-2) and 37.5% (influenza) of the patients were female, respectively (Online Supplementary Figure S6A).
Plasmin formation by mouse and human T-helper cells
In order to analyze the fibrinolytic activity of different immune cells, plasmin formation was determined. For clot preparation, plasminogen (1 mg/mL, Sigma Aldrich) and fibrinogen (2.5 mg/mL, Sigma Aldrich) (1:80 volume/volume [vol/vol]) were mixed and thrombin was added (4 U/ml; 3:1 vol/vol, Sigma Aldrich). The suspension was incubated for 1 h at 37°C in 96-well plates. Afterwards chromogenic substrate S-2251 (1.5 mmol/L, Diapharma) and T-helper cells
(mouse: 100,000 cells/well, human: 100,000 cells/well) were added. In the case of human T-helper cells, T cells were activated on fibrin-coated 96 well plates in the presence of aCD3 and aCD28 antibodies as described above, and plasmin formation registered in situ. The optical density (A405) was determined every 5 to 10 minutes to measure the protease activity of the generated plasmin.
RNA sequencing
CD4+ T cells were isolated from the liver of uninfected and infected wild-type (WT) mice as described above. Library preparation for bulk-sequencing of poly(A)-RNA was done largely as described previously.9
Results
CD4+ T cells restrict intravascular fibrin deposition in early systemic infections
In order to identify the immune cells regulating intravascular coagulation during systemic infections with E. coli we imaged nucleated cells arrested in the liver microcirculation, the major site of bacterial colonization. Neutrophils (Ly6G+), classical (Ly6C+Ly6G-) and non-classical monocytes (CX3CR1+Ly6C-), CD4+ T cells and B cells (CD19+) were recruited to the liver microcirculation with different kinetics (Figure 1A). T-helper cells represented largely Th17 cells (RORγT+) and regulatory T cells (Foxp3+; Treg) and lower amounts of Th2 cells, while B cells were mostly B1a cells (CD5+) (Figure 1A; Online Supplementary Figure 1A).
Since the role of T-helper cells in systemic infections and coagulation is incompletely defined and T-helper cells were recruited as abundantly as myeloid cells we analyzed their transcriptomic profiles. Unbiased analyses of the mRNA expressions of liver-resident CD4+ T cells indicated the enrichment of genes predicted to be involved in innate immune responses (Figure 1B; confirming pro-inflammatory functions of T-helper cells10). Remarkably, the gene cluster with the second highest enrichment score represented T-cell genes implicated in blood coagulation. Among the coagulation genes regulators of fibrinolysis predominated during early infection (Figure 2A).
Microvascular fibrin deposition was highest 3 h after infection (Online Supplementary Figure S1B). Analyses of fibrin formation in systemic blood at the same time point indicated no change in coagulation time or other parameters compared to non-infected controls (Online Supplementary Figure S1C). tPA levels in systemic blood were increased by infection consistent with increased fibrinolysis (Online Supplementary Figure S1D). Imaging of coagulation proteins in the microcirculation showed that basic mediators of fibrinolysis (plasminogen, tPA, uPA, uPAR) were associated with CD4+ T cells at the peak of fibrin formation (Figure 2B). TF, the initiator protein of coagulation, was mostly associated with classical monocytes and neutrophils (Figure
2B11-13). Overall, CD4+ T cells represented the immune cell with the highest association of fibrinolysis activators (Figure 2B). Comparisons between different T-helper cell subtypes indicated that most of the Th17 cells and part of the Treg and Th2 cells were positive for the plasminogen activator uPA (Online Supplementary Figure S1E).
Next, we investigated whether T-helper cell-regulated fibrin deposition. Depletion of T-helper cells strongly reduced circulating CD4+ T cells (Online Supplementary Figure S1F). Moreover, arrest of CD4+ T cells in the liver microcirculation was completely abolished by depletion of CD4+ T cells (from 5.2 to 0.07 CD4+ T cells/visual field). CD4+ T-cell depletion sharply increased fibrin deposition in microvessels of the liver and the lung (Figure 3A, B). Particularly, the absence of CD4+ T-cell enhanced microvascular thrombosis (Figure 3A). Also, fibrin deposition and thrombus formation occasionally observed in larger vessels were increased after CD4+ T-cell depletion (Figure 3C). Aspartate aminotransferase and alanine aminotransferase, indicators of liver tissue damage, were largely unchanged in early infection both in the presence and absence of T cells (Online Supplementary Figure S1G). Thus CD4+ T cells inhibited fibrin deposition and development of thrombosis during systemic infection.
In contrast to the changes by T-helper loss, depletion of neutrophils (which reduced circulating neutrophils by 93%) decreased fibrin deposition (Online Supplementary Figure S2A). Moreover, intravascular fibrin was reduced in the absence of classical monocytes (Online Supplementary Figure S2A). Thus CD4+ T cells rapidly suppress fibrin deposition during initial fibrin formation and thereby counteract procoagulant neutrophils and classical monocyte. In advanced stages of venous thrombosis and under non-infectious conditions, neutrophils and CD4+ T cells especially Treg14 cooperatively enhance resolution of venous thrombosis.15 Depletion of Treg only slightly increased fibrin deposition in early systemic infection (Online Supplementary Figure S2B). This suggested that other T-cell subtypes such as Th17 cells contributed predominantly to restrict fibrin deposition and indicated that under infectious conditions CD4+ T cells acted as direct antagonists of innate myeloid cells. Similar to E. coli infection, infection with the Gram-positive S. pneumoniae triggered microvascular fibrin generation in the liver and the lung (Figure 3D). CD4+ T-cell depletion also amplified fibrin deposition in streptococcal infection (Figure 3D).
CD4+ T cells stimulate fibrinolysis in early infection
In order to dissect the activity of T-cell-associated fibrinolysis activators CD4+ T cells were isolated from uninfected and infected mice and analyzed for their ability to support formation of plasmin ex vivo. T cells from infected mice and, less so, from uninfected mice, promoted plasmin formation (Figure 4A). Moreover, isolated human T-helper cells supported plasmin formation which was enhanced by T-cell receptor (TCR)-dependent T-cell activation (Online Supplementary Figure S2C16). Next, activated mouse CD4+ T cells
Continued on following page.
Figure 1. Microvascular recruitment of immune cells during systemic infection. (A) Identities and kinetics of arrested immune cells (1-6 hours [h]) in mice infected with E. coli (3-6 h) in the liver. (B) Unbiased DAVID cluster analysis of significant altered genes (adjusted P<0.05) in uninfected (0 h) and infected (3 h and 18 h) mice. Boxes indicate different mice. Dots refer to different visual fields (A) analyzed from 3-9 animals per group. In violin plots, box plots indicate 25th and 75th percentiles and median is marked by bold lines (A). P values were calculated by one-way ANOVA (A). *P<0.05, **P<0.01, ***P<0.001, ****P<0.0001.
were adoptively transferred into factor VIIa-supplemented mice (to enhance fibrin levels). Activated T cells decreased fibrin deposition which was prevented by pretreatment of the cells with fibrinolysis inhibitor EACA (Online Supplementary Figure S2D). Furthermore, neutralization of uPA in vivo, which was preferentially associated with T cells (Figure 2B), enhanced fibrin deposition in control mice, but not in T-helper cell-depleted mice (Figure 4B).
Since CD4+ T cells promoted fibrinolysis during the initial increase in fibrin deposition, we studied the involvement of thrombin-activatable fibrinolysis inhibitor (TAFI) which connects coagulation to fibrinolysis.17,18 Neutralization of TAFI activity by anti-TAFI antibody that specifically targets activated TAFI did not affect fibrin deposition in control mice consistent with earlier work.19 Yet, anti-TAFI antibody suppressed fibrin formation in CD4+ T-cell-depleted mice
Figure 2. CD4+ T cells express and attract major fibrinolysis regulators. (A) Heatmap showing mRNA expression levels of T-helper cell genes implicated in negative regulation of coagulations of uninfected (0 hours [h]) or infected mice (3 h, 18 h). Boxes indicate different mice. (B) Associations of tissue factor (TF), uPA, uPAR, PLG and PAI-1 with arrested immune cells in mice infected with E. coli (3-6 h) in the liver (last graph showing percentage of myeloid cells and CD4+ T cells). Dots refer to different visual fields (B) analyzed from 3-6 animals per group. In violin plots, box plots indicate 25th and 75th percentiles and median is marked by bold lines (B). P values were calculated by one-way ANOVA (B). *P<0.05, **P<0.01, ***P<0.001, ****P<0.0001.
Figure 3. Suppression of intravascular fibrin and microvascular thrombosis by T-helper cells. (A-D) Representative images of liver microcirculation (A, left) and macrovasculature (C) and quantifications of microvascular fibrin deposition and microthrombi in the liver or lung (A, B, D) after infection with E. coli (A-C) or after infection with S. pneumoniae (D) in T-helper cell-depleted mice (aCD4, 1 hour [h] [A], 3 h [B, C], 6 h [D]). Values indicate intravascular fibrin-covered area as percentage of total intravascular area in the liver (A, B, D) or of intravascular fibrin-covered area per visual field in the lung (B, D). Dotted lines indicate vessel walls. Scale bar, 10 μm (A) or 20 μm (C). Dots refer to different visual fields (A) analyzed from 3 animals per group or the mean of at least 5 visual fields per animal (B, D). In violin plots, box plots indicate 25th and 75th percentiles and median is marked by bold lines (A). P values were calculated by unpaired two-tailed t test (A, B, D). *P<0.05, **P<0.01, ****P<0.0001. A405: optical density.
(Figure 4C). Inhibition of TAFI by CPI (also preferentially inhibiting activated TAFI) confirmed that activated TAFI-regulated fibrin deposition in the absence but not in presence of T-helper cells (Figure 4D).
Imaging of the TAFI localization in the microcirculation of control mice indicated a higher association of TAFI with CD4+ T cells compared to other types of leukocytes (Figure 4E). Apart from its cellular association, TAFI was mainly associated with fibrin deposits 20 (Figure 3F, G). Together,
this is consistent with regulation of fibrinolysis on both cellular and fibrin surfaces. 21 After CD4 + T-cell depletion, TAFI co-localized almost exclusively with the increased fibrin-covered areas (Figure 4F, G). The extent of TAFI association with fibrin was enhanced in CD4 + T-cell-depleted mice (Figure 4F). Thus, CD4 + T cells prevented fibrinolysis inhibition by TAFI which could be mediated in part by their ability to reduce the association of TAFI with fibrin.
Continued on following page.
Figure 4. Thrombin-activatable fibrinolysis inhibitor increases fibrin deposition in absence of CD4+ T cells. (A) Plasmin formation by CD4+ T cells from uninfected and infected (3 hours [h]) mice. (B-D) Microvascular fibrin-rich area in liver microcirculation after aCD4 and aUPa treatment (B), thrombin-activatable fibrinolysis inhibitor (TAFI) neutralization (C) or CPI injection (D). (E) Association of TAFI with leukocytes (CD45+) and T-helper cells (CD45+ CD3+) 3 h after infection. (F) TAFI co-localization with CD4+ T cells (3 h, immunoglobulin G [IgG]) or other immune cell-rich thrombi (aCD4, 3 h). (G) Association of TAFI with fibrin deposits in vicinity of CD4+ T cells (control) or T-cell-free immune cell thrombi (CD4+ T-cell depletion). Dots indicate different animals (BE, G) or mean value from 3 independent samples (A). Data shown as means ± standard error of the mean. P values calculated by two-Way ANOVA (A, C) or unpaired two-tailed t test (B, D, E, G). P values calculated compared to control group (A). *P<0.05, **P<0.01, ***P<0.001, ****P<0.0001.
Intravascular fibrin promotes T-cell arrest and activation
Since CD4+ T cells partially co-localized with fibrin and components of the coagulation system affect T-cell recruitment,22 we next investigated whether fibrin contributed to T-cell arrest. In mice deficient for coagulation factor XII (f12-/-), in which fibrin deposition was inhibited compared to control mice (Online Supplementary Figure S3A), arrest of CD4+ T cells was strongly reduced compared to WT mice (Figure 5A).
In mice treated with rivaroxaban, an inhibitor of coagulation factor Xa that suppressed fibrin formation, arrest of T cells, particularly of Th17 cells, was lowered (Online Supplementary Figure S3B, C). Conversely, in plasminogen-deficient mice (plg-/-) with increased fibrin deposition (from 8.2±0.3% [WT] to 22.8±3.0% fibrin-covered area [plg-/-]; N=3 mice/group, P<0.05), immobilization of CD4+ T cells and especially of Th17 cells were augmented (Figure 5B).
T cells recovered at the peak of fibrin formation highly expressed genes involved in T-cell activation (Online Supplementary Figure S3D). Notably, CD4+ T cells co-localizing with fibrin expressed the activation markers CD69 and CD38 (Figure 5C). Besides their presence in microvessels, activated CD4+ T cells were detected in association with thrombi in larger vessels (Online Supplementary Figure S3E).
Rivaroxaban decreased the levels of arrested CD69+ T cells substantially (Figure 5D). Furthermore, T-cell activation was decreased in f12-/- mice compared to WT mice (Figure 5E). Rivaroxaban also reduced IFNγ+T cells which are another sign of early T-cell activation (Figure 5F).
The high percentages of CD69+ T cells in early infection could suggest that T-cell activation may be mediated at least in part by TCR-independent cytokine (or “bystander”) activation.23 In order to check the contribution of TCR-dependent and/or -independent T-cell activation, we prevented TCR-dependent T-cell activation with anti-MHC-II antibody. We also used anti-IL-12p40 antibody to inhibit IL-12- and IL23-mediated T-cell activation thus preventing in particular cytokine-mediated activation of Th17 cells.24 MHC-II inhibition reduced the amount of activated T cells (Figure 5F). Moreover, anti-IL-12p40 antibody decreased T-cell activation (Figure 5F). Particularly, the levels of activated T cells (CD69+ IFNγ+) co-localizing with fibrin were decreased by neutralizing MHC-II or IL-12p40 inhibition (Online Supplementary Figure 3F). Thus early CD4+ T-cell activation by fibrin was supported by TCR- and cytokine-dependent mechanisms.
LFA-1 mediates T-helper cell migration and fibrindependent T-cell activation
We next analyzed the source and intravascular movements of the T cells regulating coagulation. In order to investigate their intestinal origin,25 we photoconverted cells in the small intestine of Kaede mice by UV light to emit red fluorescence instead of green fluorescence (Online Supplementary Figure S4A).26 Twenty-four h later systemic infection was induced with E. coli. Photoconverted T-helper cells were detected in the infected livers and to a lesser extent in the lungs (Online Supplementary Figure S4B). Most of the intestine-derived T-helper cells in the liver represented Th17 cells.
We used multi-photon intravital microscopy to track the movements of CMTPX-labeled CD4+ T cells inside the liver microvasculature. We observed a rapid arrest of part of the circulating T cells while other T cells crawled unidirectionally along the vessel wall or performed alternating movements with and against the blood flow (Figure 6A, B; Online Supplementary Video S1). Real-time imaging of T-helper cell movements showed that neutralization of the major T-cell integrin LFA-127 with anti-LFA-1 decreased the unidirectional T-cell crawling along the vessel wall (Figure 6C). In contrast, suppression of fibrin formation by rivaroxaban did not alter T-cell migration (Online Supplementary Figure S5A; Online Supplementary Video S2). Moreover, neutralization of LFA-1 did not change T-cell arrest (Figure 6C). In contrast, it decreased T-cell activation substantially, especially activated T cells that were fibrin-associated (Figure 6D; Online Supplementary Figure 5B).
Next, we studied the role of fibrin for T-cell activation in human CD4+ T cells in vitro. T cells adhering to poly-L- ornithine-coated surfaces where activated via the TCR. The increase in CD69 expression thus observed was unaffected by inhibition of LFA-1 (Figure 6E). Fibrin-coated surfaces noticeably enhanced activation of T cells. T-cell activation by fibrin was largely suppressed by LFA-1 inhibition (Figure 6E). Contrary to the effect of fibrin on T-cell activation, fibrin did not affect migration of human T cells (Figure 6F), agreeing with the in vivo observations (Online Supplementary Figure S4C). Inhibition of LFA-1 markedly decreased the fibrinolytic activity of the activated T cells (Online Supplementary Figure S5C). Thus, LFA-1 mediated both T-cell migration and T-cell activation-dependent fibrinolysis which allowed CD4+ T cells most likely to inhibit fibrin deposition both at and distant from sites of T-cell arrest.
Microvascular CD4+ T cells and thrombosis in human infections
Pulmonary thrombosis is a deleterious consequence of aberrant immune activation in severe infections including SARS-CoV-2 infection.28,29 We analyzed autopsies from patients with SARS-CoV-2 infections and compared them with autopsies from patients with influenza virus infections (Online Supplementary Figure S6A). CD4+ T cells were visu-
alized in different vascular beds of the lung to explore their potential role in thrombosis. The number of CD4+ T cells detected in microvessels and larger vessels in patients with SARS-CoV-2 infections was lower compared to patients infected with influenza virus (Figure 7A, B). Thrombotic vessel occlusions were massively increased and pulmonary thrombi tended to be elevated in SARS-CoV-2 infections compared to influenza virus infection (Figure 7C; Online
5. Fibrin critically drives arrest of T-helper cells. (A, B) CD4+ T cells or CD4+ RORγt+ cells (B) arrested in liver microvessels in f12-/- mice (6 hours [h]) (A) or plg-/- mice (3 h) (B) infected with E. coli. (C) Percentage of activated T-helper cells (defined as CD38+ or CD69+) in fibrin-negative (-) or fibrin-positive (+) areas (3 h). (D, E) T-helper cell activation in the liver microcirculation of rivaroxaban-treated wild-type (WT) mice (D) and f12-/- mice (3 h) (E). (F) Percentage of interferon (IFN)γ+ T-helper cells in rivaroxaban-treated mice. (G) Percentage of T-helper cell activation in mice treated with aMHC-II or aIL12p40-antibody prior to infection with E. coli (3 h). In violin plots, box plots indicate 25th and 75th percentiles and median is marked by bold lines (A, B). A minimum of 3 biological replicates was analyzed (A-G) and dots indicate different animals (C-G). Scale bar, 10 μm (C). Data shown as means ± standard error of the mean. P values calculated by unpaired two-tailed t test (A-G). *P<0.05, **P<0.01, **P<0.01.
Figure
Supplementary Figure S6B). TAFI strongly co-localized with fibrin-rich thrombi in SARS-CoV-2 infections (Figure 7D) but barely with intraluminal immune cells. Thus, the enhanced fibrin depositions and TAFI localizations in human infections with strongly reduced microvascular T-cell levels resembled the changes in T-cell-depleted mice. Overall, thrombosis formation in lung vessels during viral infections exhibited an inverse association with microvascular CD4+ T-cell levels (Figure 7E).
Discussion
Innate immune cells including monocytes and neutrophils critically promote intravascular fibrin formation and thereby favor the development of different types of micro- and macrovascular thrombosis.1-5 They initiate coagulation via the TF-initiated extrinsic pathway of coagulation and propagate fibrin generation by formation of NET. Due to the potentially deleterious consequences of thrombotic vessel occlusions
Figure 6. Fibrin activates T-helper cells via LFA1. (A, B) Time lapse showing intravascular unidirectional (A) and back-forward (B) crawling of CMTPX-labeled CD4 + T cells (magenta) by multi-photon intravital imaging (1-6 hours [h], E. coli). Dragon tails visualize the last hundreds of cell movements. Scale bar, 10 μm. (C) Effect of aLFA-1 antibody on unidirectional migration and arrest of T-helper cells in the liver microcirculation analyzed by multi-photon intravital imaging (1-6 h). (D) Percentages of activated CD4+ T cells arrested in microvessels after treatment with aLFA-1 antibody (3 h). (E) Effect of aLFA-1 antibody on activation of isolated human CD4+ T cells in vitro on poly-L-ornithine- or fibrin-coated surfaces. (L) Migration of isolated human CD4+ T cells on fibrin- versus poly-L-ornithine-coated surfaces. Lines indicate covered distance by single cells. Speed of cell movements is color coded. Dots indicate different animals (D), different videos (C) analyzed in at least 3 animals per group, or isolated cells from different donors (E). Scale bar, 10 μm (A, B) or 20 μm (F). Data shown as means ± standard error of the mean. P values calculated by Mann-Whitney test (C), unpaired two-tailed t test (D) or two-way ANOVA (E). *P<0.05, **P<0.01.
Figure 7. Thrombosis development in human infections is negatively associated with T-cell arrest. (A, B) CD4+ T cells in pulmonary vessels with diameter <50 μm (A) or 50-500 μm (B) in patients with SARS-CoV- 2 or influenza virus infections in post-mortem histological analysis of human lung samples with pulmonary infections. (C) Representative image of thrombus in pulmonary vessels of a patients with severe influenza virus (left) or SARS-CoV-2 infection (right). Scale bar, 20 μm. (D) Association of thrombin-activatable fibrinolysis inhibitor (TAFI) with leukocyte-free thrombi during SARS-CoV-2 infection. (E) Correlation between pulmonary thrombosis and intravascular T-helper cells. Scale bar, 20 μm. Dots indicate different patients (A, B, E). Values given as mean ± standard error of the mean. P values calculated by unpaired two-tailed t test (A, B) or Pearson’ correlation with 95% confidence interval (E). **P<0.01, ***P<0.001.
intravascular coagulation needs to be maintained in a homeostatic balance thus disfavoring pathological thrombosis. Although endothelial cells can efficiently protect against excessive intravascular fibrin generation, their anticoagulant and profibrinolytic functions are often compromised during infections, especially at sites of thrombus formation, or they may even be converted into procoagulant mediators.30 This suggests that additional mechanisms are required to prevent excessive intravascular fibrin and development of thrombosis in infections.
Our study shows that mutual interactions between CD4+ T cells and fibrin establish an efficient negative feedback cycle suppressing intravascular fibrin and microvascular thrombosis during infections. Since T-helper cells curtail fibrin deposition during the initial rise in fibrin formation they act as direct antagonists of procoagulant innate myeloid cells, especially counteracting neutrophil dependent fibrin formation. It is well possible that increases in pro-inflammatory cytokines such as IL-1β, TNFa or IL-6 as induced by systemic infection contribute to regulate the inhibitory and enhancing effects of T-helper cells and innate myeloid cells, respectively, on intravascular fibrin deposition.
Intravital imaging and immunohistochemistry analyses reveal that fibrin deposits drive the arrest and LFA-1-de-
pendent activation of CD4+ T cells. The arrested T cells mostly represent Th17 cells that are recruited at least in part from the intestine, a major site of residence of Th17 cells. T-helper cell activation appears to require direct fibrin-LFA-1 interactions and is in part mediated by IL12p40, a component of both IL-12 and IL-23 that preferentially targets Th17 cells,24 as well as by MHC-II-dependent mechanisms.
Activation and migration of CD4+ T cells in turn suppresses fibrin deposition throughout the vasculature by neutralization of TAFI-induced fibrinolysis inhibition and direct stimulation of fibrinolysis. During early infection, CD4+ T cells are indeed the major intraluminal carriers of fibrinolysis regulators including plasminogen and their activators. T-helper cell-dependent inhibition of TAFI is shown to be related to the ability of the T cells to prevent the association of TAFI with fibrin, a prerequisite for TAFI-dependent cleavage of C-terminal lysine residues in fibrin32 and subsequent fibrinolysis inhibition. This mechanism could contribute to explain why (at presumably normal T-cell levels) TAFI deficiency does not result in substantial changes in fibrin formation and thrombosis development.19
Dysregulations of coagulation are characteristics of severe SARS-CoV-2 infections and might sustain in part long-term
sequelae of Covid-19 infections.33-35 Since activated CD4+ T cells promote fibrinolysis and their loss increases intravascular fibrin via TAFI, the inverse relations between T-cell arrest and thrombosis observed here suggest that also in human infections CD4+ T cells might protect from pathological thrombosis. Consequently, lymphopenic conditions, a common feature of fatal infections and other diseases,36-38 critically dysregulate thrombosis per se. The opposing effects of neutrophils versus CD4+ T cells, the major circulating lymphocyte fraction in human blood, suggest why increased neutrophil/lymphocyte ratios (for example39) predispose for different types of pathological thrombosis.
Disclosures
No conflicts of interest to disclose.
Contributions
TTM, MP, MT, TL, JKLH, SMe, RB, FK, LGP, RÖ, TE, JL, MV, HY, HI-A performed experiments and evaluated data. TTM, HI-A, and BE analyzed data. CW, AZK, KTP, SH, SM contributed to interpretation and presentation of data. CS, HI-A, BE coordinated and supervised the study. CT, MWy, HR, SE, PvH, CS, DT, RR, SH, MM, SM, DT, UK provided resources. BE and SM secured funding. BE conceived
References
1. Iba T, Levy JH. Inflammation and thrombosis: roles of neutrophils, platelets and endothelial cells and their interactions in thrombus formation during sepsis. J Thromb Haemost. 2018;16(2):231-241.
2. Van Bruggen S, Martinod K. The coming of age of neutrophil extracellular traps in thrombosis: where are we now and where are we headed? Immunol Rev. 2023;314(1):376-398.
3. Wu C, Lu W, Zhang Y, et al. Inflammasome activation triggers blood clotting and host death through pyroptosis. Immunity. 2019;50(6):1401-1411.
4 Engelmann B, Massberg S. Thrombosis as an intravascular effector of innate immunity. Nat Rev Immunol. 2013;13(1):34-45.
5. Opal SM, Esmon CT. Bench-to-bedside review: functional relationships between coagulation and the innate immune response and their respective roles in the pathogenesis of sepsis. Crit Care. 2002;7(1):23-38.
6. Bonaventura A, Vecchié A, Dagna L, et al. Endothelial dysfunction and immunothrombosis as key pathogenic mechanisms in COVID-19. Nat Rev Immunol. 2021;21(5):319-329.
7 van der Poll T, van de Veerdonk FL, Scicluna BP, Netea MG. The immunopathology of sepsis and potential therapeutic targets. Nat Rev Immunol. 2017;17(7):407-420.
8. Tomura M, Yoshida N, Tanaka J, et al. Monitoring cellular movement in vivo with photoconvertible fluorescence protein “Kaede” transgenic mice. Proc Natl Acad Sci USA. 2008;105(31):10871-10876.
9 Lechner, M., Engleitner, T., Babushku, T. et al. Notch2-mediated plasticity between marginal zone and follicular B cells. Nat Commun. 2021;12(1):1111.
10 Kedl RM, White JT. Foreign antigen-independent memory-
the study and wrote the manuscript with the help of all other authors.
Acknowledgments
We are grateful to Susanne Pfeiler, Pia Vornewald, Dominic van den Heuvel, Daniel Setzensack, Meike Miller, Anna Titova, Arwa Obaid, Wolfgang Wilfert, Lusine Saroyan and Anastasios Giannou for their contributions at different stages of the study. We would like to kindly thank the Bioimaging Core Facility of the Biomedical Center of LMU Munich, especially Steffen Dietzel, for advice and help. We are grateful to Paul Declerck, Michael Ploug and Thomas Bugge for their helpful advice as well as for providing antibodies. We thank the German Center for Lung Research (DZL) for providing tissue sections from autopsies.
Funding
The study was supported by grants from the Deutsche Forschungsgemeinschaft SFB1321 (to BE and SM), SFB1123 (to SM and BE) and SFB 914 (to HI-A, SM and CS).
Data-sharing statement
Please direct all requests for materials and correspondence to the corresponding authors.
phenotype CD4+ T cells: a new player in innate immunity? Nat Rev Immunol. 2018;18(3):1.
11. Skendros P, Mitsios A, Chrysanthopoulou A, et al. Complement and tissue factor–enriched neutrophil extracellular traps are key drivers in COVID-19 immunothrombosis. J Clin Invest. 2020;130(11):6151-6157.
12. Schechter ME, Andrade BB, He T, et al. Inflammatory monocytes expressing tissue factor drive SIV and HIV coagulopathy. Sci Transl Med. 2017;9(405):eaam5441.
13. Antoniak S, Mackman N. Multiple roles of the coagulation protease cascade during virus infection. Blood. 2014;123(17):2605-2613.
14 Shahneh F, Grill A, Klein M, et al. Specialized regulatory T cells control venous blood clot resolution through SPARC. Blood. 2021;137(11):1517-1526.
15. Nicklas JM, Gordon AE, Henke PK. Resolution of deep venous thrombosis: proposed immune paradigms. Int J Mol Sci. 2020;21(6):2080.
16. Loef EJ, Sheppard HM, Birch NP, Dunbar PR. Plasminogen and plasmin can bind to human T cells and generate truncated CCL21 that increases dendritic cell chemotactic responses. J Biol Chem. 2022;298(7):102112.
17 Sillen M, Declerck PJ. Thrombin activatable fibrinolysis inhibitor (TAFI): an updated narrative review. Int J Mol Sci. 2021;22(7):3670.
18. Nesheim M, Wang W, Boffa M, Nagashima M, Morser J, Bajzar L. Thrombin, thrombomodulin and TAFI in the molecular link between coagulation and fibrinolysis. Thromb Haemost. 1997;78(01):386-391.
19 Nagashima M, Yin Z-F, Zhao L, et al. Thrombin-activatable fibrinolysis inhibitor (TAFI) deficiency is compatible with murine
life. J Clin Invest. 2002;109(1):101-110.
20 Satoh T, Satoh K, Yaoita N, et al. Activated TAFI promotes the development of chronic thromboembolic pulmonary hypertension: a possible novel therapeutic target. Circ Res. 2017;120(8):1246-1262.
21. Chapin JC, Hajjar KA. Fibrinolysis and the control of blood coagulation. Blood Rev. 2015;29(1):17-24.
22. Ryu JK, Petersen MA, Murray SG, et al. Blood coagulation protein fibrinogen promotes autoimmunity and demyelination via chemokine release and antigen presentation. Nat Commun. 2015;6(1):8164.
23. Lee H, Jeong S, Shin E-C. Significance of bystander T cell activation in microbial infection. Nat Immunol. 2022;23(1):13-22.
24. Mills KHG. IL-17 and IL-17-producing cells in protection versus pathology. Nat Rev Immunol. 2023;23(1):38-54.
25. Stockinger B, Omenetti S. The dichotomous nature of T helper 17 cells. Nat Rev Immunol. 2017;17(9):535-544.
26. Krebs CF, Reimers D, Zhao Y, et al. Pathogen-induced tissueresident memory T H 17 (T RM 17) cells amplify autoimmune kidney disease. Sci Immunol. 2020;5(50):eaba4163.
27. Walling BL, Kim M. LFA-1 in T Cell Migration and differentiation. Front Immunol 2018;9:952.
28. Ackermann M, Verleden SE, Kuehnel M, et al. Pulmonary vascular endothelialitis, thrombosis, and angiogenesis in Covid-19. N Engl J Med. 2020;383(2):120-128.
29 Afzali B, Noris M, Lambrecht BN, Kemper C. The state of complement in COVID-19. Nat Rev Immunol. 2022;22(2):77-84.
30 Yau JW, Teoh H, Verma S. Endothelial cell control of thrombosis. BMC Cardiovasc Disord. 2015;15:130.
31. Cooper AM, Khader SA. IL-12p40: an inherently agonistic cytokine. Trends Immunol. 2007;28(1):33-38.
32. Wang W, Boffa MB, Bajzar L, Walker JB, Nesheim ME. A study of the mechanism of inhibition of fibrinolysis by activated thrombin-activable fibrinolysis inhibitor. J Biol Chem. 1998;273(42):27176-27181.
33. Morrow AJ, Sykes R, McIntosh A, et al. A multisystem, cardiorenal investigation of post-COVID-19 illness. Nat Med. 2022;28(6):1303-1313.
34 Couzin-Frankel J. Clues to long COVID. Science. 2022;376(6599):1261-1265.
35. Al-Aly Z, Bowe B, Xie Y. Long COVID after breakthrough SARSCoV-2 infection. Nat Med. 2022;28(7):1461-1467.
36. Moss P. The T cell immune response against SARS-CoV-2. Nat Immunol. 2022;23(2):186-193.
37. Drewry AM, Samra N, Skrupky LP, Fuller BM, Compton SM, Hotchkiss RS. Persistent lymphopenia after diagnosis of sepsis predicts mortality. Shock. 2014;42(5):383-391.
38. Zidar DA, Al-Kindi SG, Liu Y, et al. Association of lymphopenia with risk of mortality among adults in the US general population. JAMA Netw Open. 2019;2(12):e1916526.
39 Hu J, Cai Z, Zhou Y. The association of neutrophil-lymphocyte ratio with venous thromboembolism: a systematic review and meta-analysis. Clin Appl Thromb Hemost. 2022;28:10760296221130061.
D-2-hydroxyglutarate supports a
tolerogenic
phenotype with
lowered major histocompatibility class II expression in non-malignant dendritic cells and acute myeloid leukemia cells
Kathrin Hammon,1,2* Kathrin Renner,1-3* Michael Althammer,1 Florian Voll,2 Nathalie Babl,1 Sonja-Maria Decking,3 Peter J. Siska,1 Carina Matos,1 Zugey Elizabeth Cárdenas Conejo,1 Karina Mendes,1° Friederike Einwag,1 Heiko Siegmund,4 Sabine Iberl,1 Raffaela S. Berger,5 Katja Dettmer,5 Rebecca Schoenmehl,6 Christoph Brochhausen,4,6 Wolfgang Herr,1 Peter J. Oefner,5 Michael Rehli,1,2 Simone Thomas1,2# and Marina Kreutz1,2#
1Department of Internal Medicine III, University Hospital Regensburg, Regensburg; 2LITLeibniz Institute for Immunotherapy, Regensburg; 3Department of Otorhinolaryngology, University Hospital Regensburg, Regensburg; 4Institute of Pathology, University of Regensburg, Regensburg; 5Institute of Functional Genomics, University of Regensburg, Regensburg and 6Institute of Pathology, University Medical Center Mannheim, University Heidelberg, Mannheim, Germany
*KH and KR contributed equally as first authors. #ST and MK contributed equally as senior authors.
°Current affiliation: Universidade Católica Portuguesa, Center for Interdisciplinary Research in Health (CIIS), Institute of Health Sciences (ICS), Viseu, Portugal
Abstract
Correspondence: M. Kreutz marina.kreutz@ukr.de
Received: May 25, 2023.
Accepted: January 11, 2024. Early view: January 18, 2024.
D-2-hydroxyglutarate (D-2-HG) accumulates in patients with acute myeloid leukemia (AML) with mutated isocitrate dehydrogenase (IDH) and in other malignancies. D-2-HG suppresses antitumor T-cell immunity but little is known about potential effects on non-malignant myeloid cells. Here we show that D-2-HG impairs human but not murine dendritic cell differentiation, resulting in a tolerogenic phenotype with low major histocompatibility class II expression. In line with this, IDH-mutated AML blasts exhibited lower expression of HLA-DP and were less susceptible to lysis by HLA-DP-specific T cells. Interestingly, besides its expected impact on DNA demethylation, D-2-HG reprogrammed metabolism towards increased lactate production in dendritic cells and AML. Vitamin C accelerated DNA demethylation, but only the combination of vitamin C and glycolytic inhibition lowered lactate levels and supported major histocompatibility complex class II expression. Our results indicate an unexpected link between the immunosuppressive metabolites 2-HG and lactic acid and suggest a potentially novel therapeutic strategy with combinations of anti-glycolytic drugs and epigenetic modulators (hypomethylating agents) or other therapeutics for the treatment of AML.
Introduction
Heterozygous somatic mutations in isocitrate dehydrogenase (IDH) were originally identified in patients with glioma and acute myeloid leukemia (AML), but they are also detected in patients with other tumor entities.1 Mutated IDH1 and IDH2 gain neomorphic function to convert a-ketoglutarate (a-KG) to the oncometabolite D-2-hydroxyglutarate (D-2-HG), which accumulates in tumor tissues as well as in sera of patients.2 In tumor tissues of glioma patients 2-HG
levels range from 5-35 mM,3 whereas levels in sera of AML patients range from 2-300 μM.4 Despite the absence of IDH mutations, elevated 2-HG levels have also been described in other tumor entities. In breast cancer, MYC overexpression triggers glutamine uptake and glutaminolysis resulting in 2-HG accumulation,5 whereas in renal cell carcinoma,6 the L-enantiomer of 2-HG accumulates due to reduced expression of its degrading enzyme L-2-HG dehydrogenase. Moreover, other enzymes such as malate dehydrogenase and lactate dehydrogenase (LDH) can catalyze the conversion
of a-KG to 2-HG under hypoxic and/or acidic conditions, a process termed “enzyme promiscuity”.7 In some cancer entities, D-2-HG accumulation is associated with worse prognosis, whereas an IDH mutation is a favorable prognostic marker in glioma.1,2,5 The current view is that the structural similarity between D-2-HG and a-KG causes competition and inhibition of a-KG-dependent enzymes, such as Jumonji-C domain histone demethylases. D-2-HG also inhibits the ten-eleven translocation (TET) family of 5-methylcytosine hydroxylases, a family of enzymes involved in the first step of active DNA demethylation.8 IDH1 or IDH2 mutated AML display global DNA hypermethylation and expression of mutated IDH2 in mouse myeloid progenitor cells in vitro increases DNA methylation while inhibiting their differentiation.9 Despite its effects on epigenetic programming, expression of mutated IDH1 alone does not cause murine leukemic transformation but promotes leukemogenesis only in cooperation with an additional driver, such as HoxA9.10 In contrast, it has been shown by others that D-2-HG, but not its L-enantiomer, is sufficient to promote leukemogenesis in a human and murine cell-based model.11 Collectively, these data suggest that IDH mutations and D-2-HG accumulation dysregulate the epigenetic machinery, which in turn disturbs differentiation. Besides myeloid cells, endogenously produced 2-HG also affects DNA methylation and differentiation of murine lymphoid cells.12 In primary human T cells, however, Bunse et al. demonstrated that gene expression but not the methylation pattern changed after D-2-HG treatment,13 indicating differences in D-2-HG susceptibility between murine and human immune cells. The same group recently demonstrated IDH-dependent immunosuppression related to D-2-HG-induced metabolic changes in tryptophan degradation by tumor-associated macrophages.14
Here, we investigated the differentiation of another important population of myeloid cells, namely dendritic cells (DC). In contrast to published data on murine DC differentiation,15 we describe the inhibition of human DC differentiation by D-2-HG via induction of MYC, accelerated glycolysis and reprogramming of the epigenetic machinery. Our data suggest that D-2-HG might influence cell differentiation by both induction of epigenetic changes and modulation of cellular metabolism.
Methods
Primary cells and ethics statement
Peripheral blood mononuclear cells were isolated from leukapheresis products or leukocyte reduction system cones of healthy donors by density gradient centrifugation over Ficoll/ Hypaque. Primary AML blasts were isolated by density gradient centrifugation over Ficoll/Hypaque from peripheral blood of leukemia patients at initial diagnosis of AML, before they had started leukemia therapy. Human CD34+ hematopoietic
stem and progenitor cells were isolated from stem cell leukapheresis products of healthy donors after the donors had been stimulated with granulocyte colony-stimulating factor. The studies were conducted in accordance with the Declaration of Helsinki. All donors gave their informed consent to participation in the study and the protocols were approved by the Ethics Committee of the University Hospital Regensburg (permission numbers 05-097, 17-587-101, 13101-0240, 13-101-0238, and 10-101-0099).
Monocyte isolation and macrophage generation
Mononuclear cells from healthy donors were separated by leukapheresis, followed by density gradient centrifugation over Ficoll/Hypaque. Monocytes were isolated from mononuclear cells by countercurrent centrifugal elutriation in a J6M-E Beckmann centrifuge with a large chamber and a JE-5 rotor at 2,500 rpm and a flow rate of 110 mL/min in Hanks’ balanced salt solution with 2% human plasma. Elutriated monocytes were >80% pure as determined by morphology and CD14 expression. For the generation of monocyte-derived human macrophages, purified monocytes were cultured on teflon foils (Biofolie 25, Heraeus Hanau, Germany) for 7 days at a cell density of 1x10⁶ cells/ mL in RPM1 1640 supplemented with 2% pooled human AB group serum.
Dendritic cell generation
Bone marrow-derived murine DC were generated as described previously16 in the presence or absence of 20 mM D-2-HG.
For the generation of human DC, monocytes were seeded in RPMI supplemented with 10% fetal calf serum, glutamine (2 mM), penicillin (100 U), streptomycin (100 μg/mL), interleukin 4 (150 U/mL), and granulocyte-macrophage colony-stimulating factor (230 U/mL) at a concentration of 1x10⁶/well in a 24-well plate in 1 mL of medium or 7x10⁶ in a T25 culture flask in 10 mL medium. D-2-HG was added once, immediately after seeding the cells, for the whole period of culture. Cells were cultured for 7 days to generate immature DC. Where indicated, the culture medium was supplemented with D-2-HG (10 mM, 20 mM), the LDHA inhibitor GNE140 (1 μM, starting on day 2) or pyrazole-based LDHA/B inhibitor NCI-73717 (0.1 μM, starting on day 2) and vitamin C (2 mM), respectively. Maturation of DC was induced by the addition of 100 ng/mL lipopolysaccharide on day 7. DC expressing mutated IDH were generated by in-vitro transcribed RNA electroporation as described elsewhere.18 In brief, the coding DNA region of wild-type IDH2 including a HIS tail was synthesized by GeneArt and inserted into the pGEM4Z-64A vector for in vitro mRNA transcription. With a QuikChange Site-Directed Mutagenesis Kit, site-directed mutagenesis was performed to change the nucleotide responsible for the exchange of arginine to glutamine in the amino acid sequence of IDH2 (IDH2 R140Q). Both constructs were used to electroporate DC for T-cell stimulation.
Acute myeloid leukemia cell culture
Primary AML blasts were thawed and cultured in AIM-V medium (GIBCO) supplemented with 10% pooled human serum, 50 ng/mL stem-cell factor (PeproTech, Rocky Hill, NJ, USA), 50 ng/mL granulocyte colony-stimulating factor (Hospira, Lake Forest, IL, USA) with or without 20 mM D-2HG (Sigma/Merck, Darmstadt, Germany), 2 mM vitamin C (Sigma/Merck) and 1 μM GNE140 (1 μM, Selleckchem, Housten, TX, USA) from day 0, at a density of 2x10⁶ cells/ mL for 7 days.
Cell numbers and viability
Cell numbers, cell size and viability were determined using either a Neubauer chamber or a CASY cell analyzer. Cells were resuspended and 50 μL of the cell suspension were mixed with the same volume of trypan blue. This solution was transferred into a Neubauer chamber and the contents of two large squares were counted.
The CASY cell analyzer system (Casy® Model TT, OLS Omni Life Science, Bremen, Germany) obtains signals when a cell passes in a low-voltage field through the system’s high-precision measuring pore. The system was used according to the manufacturer’s instructions.
Other methods
The mixed lymphocyte reaction and T-cell assays are described in the Online Supplementary Methods, together with detailed information on the metabolite analyses. The Online Supplementary Methods also provides information on transmission electron microscopy, as well as protocols for protein isolation, sodium dodecylsulfate polyacrylamide gel electropheresis and western blotting.
Oxygen consumption, oxygen concentration and pH
Mitochondrial respiratory activity was determined by high-resolution respirometry as described elsewhere.19 Online-measurement of oxygen concentration and determination of pH values in cell cultures were performed as detailed in the Online Supplementary Methods.
Flow cytometry, antibodies, MitoSox, and cytokine measurements
Details are described in the Online Supplementary Methods
Colony-forming cell assay
The colony-forming cell assay was performed as described previously20 and detailed in the Online Supplementary Methods.
The Cancer Genome Atlas data analysis
AML RNA sequencing data (normalized expression values per gene, displayed as reads per kilo base per million mapped reads) and available clinical information were downloaded from The Cancer Genome Atlas data portal (https://portal. gdc.cancer.gov). Normalized transcription levels of major
histocompatiblity complex (MHC) class II a and β chain genes (HLA-DP, -DQ and -DR) and class II MHC transactivator (CIITA) were compared in AML blasts expressing wild-type or mutated IDH.
DNA methylation analysis
Methylation analysis was done as previously described.21 Analyzed amplicons and gene regions are listed in Online Supplementary Table S1.
Statistical
analysis
The statistical analyses were performed with Graphpad Prism, version 9 (La Jolla, CA, USA). Sample sizes are given in the respective figure legends. Comparisons between groups were made using the appropriate statistical methods depending on Gaussian distribution and number of groups and variables (Friedman test, Wilcoxon test, Kruskal-Wallis test, Mann-Whitney and one-way analysis of variance). Differences were considered statistically significant for P values of <0.05 (*P<0.05, **P<0.01, ***P<0.001).
Results
D-2-hydroxyglutarate alters the morphology of human but not murine dendritic cells
High D-2-HG levels are detected in tumor tissues and it is known that immune cells can take up exogenous D-2-HG, which may limit their anti-tumor potential.13 We measured endogenous 2-HG levels in peripheral blood mononuclear cells, T cells, monocytes, macrophages and fibroblasts by liquid chromatography-tandem mass spectrometry. T cells, fibroblasts and myeloid cells (i.e., monocytes and macrophages) exhibited higher levels of endogenous 2-HG compared to peripheral blood mononuclear cells, and these levels could be further increased by supplementation with D-2-HG, demonstrating that the cells had a capacity for active uptake of this metabolite (Figure 1A).
We, therefore, investigated whether high exogenous D-2HG levels might alter monocyte to DC differentiation over a 7-day culture period with interleukin-4 and granulocyte-macrophage colony-stimulating factor. It has been reported that D-2-HG does not affect murine DC differentiation.15 Here, we compared differentiation of human blood monocytes into DC with differentiation of murine (C57BL/6) bone marrow cells to bone marrow-derived DC. D-2-HG did not affect the viability of either murine or human DC (Figure 1B), but cell yields measured by CASY cell counting technology were slightly lower for murine bone marrow-derived DC treated with D-2-HG (Online Supplementary Figure S1A). Interestingly, electron microscopy revealed profound changes in cell morphology with significantly decreased numbers of vacuoles and impaired dendrite formation in D-2-HG-treated human DC compared to untreated controls (Figure 1C, Online Supplementary Figure S1B). Bright
Figure 1. D-2-hydroxyglutarate inhibits human dendritic cell differentiation. (A) Intracellular levels of 2-hydroxyglutarate (2-HG) were analyzed by liquid chromatography tandem mass spectrometry in peripheral blood mononuclear cells (N=3), T cells (after 3 days of culture, N=3), fibroblasts (N=4), monocytes (N=4) and macrophages (N=3 after 7 days) from healthy donors incubated with or without 10 mM D-2-HG (20 h). (B) Viability of dendritic cells (DC) from humans (N=11 donors) and mice (N=4 mice) were analyzed after 7 (human DC) or 10 (murine DC) days of culture. (C) Transmission electron microscopy of DC cultured for 7 days in the presence or absence of 10 mM D-2-HG. One representative experiment out of four is shown at a magnification of 10,000x. Vacuoles of ten cells per donor and condition (N=40 for control and D-2-HG treatment) were counted. (D) Untreated human monocytes (N=3) and monocyte-derived DC cultured with or without 20 mM D-2-HG were analyzed on day 4 (N=4) and 7 (N=31). Murine DC (N=4) were cultured for 10 days with or without 20 mM D-2-HG. HLA-DP (human) or I-A/I-E (murine) cell surface expression was analyzed by flow cytometry and normalized to the expression of the control (monocyte-derived DC at day 7 of culture, without D-2-HG). (E) Representative histogram of HLA-DP (human) or I-A/I-E (murine) expression analyzed by flow cytometry. (F) HLA-DR surface expression on untreated monocytes (N=4) before the start of culture in comparison to the expression on DC on days 4 (N=3) and 7 (N=46) of culture (with and without 20 mM D-2-HG) as determined by flow cytometry. (G) Levels of cytokines (interleukin-12 [N=10]), interleukin-10 [N=6], tumor necrosis factor [N=8] and interleukin-6 [N=8]) were determined by enzyme-linked immunosorbent assay (ELISA) in supernatants of DC stimulated with lipopolysaccharide (100 ng/mL) for 24 h. (H) Human CD4 T cells (105) were stimulated with DC (104) from an allogeneic donor differentiated in the presence or absence of 20 mM D-2-HG. On day 7 of the mixed lymphocyte reaction, T-cell proliferation (N=6) was measured by cell counting. (I) Interferon-γ secretion of T cells (N=6) was analyzed in supernatants of day 5 cultures by ELISA and normalized to control. Symbols represent individual donors analyzed in independent experiments and horizontal bars mark median values. For two-group comparisons a Mann-Whitney test or Wilcoxon test was used. For multiple-group comparisons the Kruskal-Wallis and post-hoc Dunn test were performed. P<0.05 was considered statistically significant (*P<0.05, ***P<0.01, ***P<0.001). PBMC: peripheral blood mononuclear cells; w/o: without; MO: monocytes; MFI: mean fluorescence intensity; IL: interleukin; TNF: tumor necrosis factor; IFN: interferon.
field microscopic analysis of murine bone marrow-derived DC revealed no changes in cell morphology between cells treated with D-2-HG or untreated controls (Online Supplementary Figure S1B).
To assess whether D-2-HG could also affect early myeloid progenitor cells, we analyzed the impact of D-2-HG on differentiation of human CD34+ hematopoietic stem and progenitor cells in colony-forming cell (CFC) assays. After plating defined numbers of CD34+ cells, burst-forming units and colony-forming units (CFU) were scored on day 14. D-2-HG treatment resulted in a considerably lower number of CFC when compared to control (median 5.0 vs. 14.5 CFC/100 CD34+ cells; P=0.057) and colonies were smaller in size (Online Supplementary Figure S1C, D). Of note, D-2-HG resulted in a marked reduction of CFU-granulocyte-macrophage myeloid progenitors (3.8% vs. 33.9%), while the proportion of CFU-erythroid (45.5% vs. 89.1%) increased (Online Supplementary Figure S1C, D).
D-2-hydroxyglutarate limits MHC class II expression in human but not murine dendritic cells and impairs T-cell stimulation
To further evaluate the effects of D-2-HG on human and murine DC differentiation, we analyzed cell surface expression of the MHC class II antigen HLA-DP and its murine equivalent in immature human and murine DC. Upregulation of HLA-DP during human monocyte to DC differentiation was significantly blocked in D-2-HG-treated cells (P<0.001) (Figure 1D, E). In contrast to human DC, surface expression of the HLA-DP analog I-A/I-E was not significantly impaired on murine bone marrow-derived DC (P=0.25) (Figure 1D, E). Based on these results we analyzed the expression of other MHC class II molecules on human DC. In line with the findings for HLA-DP, the expression of HLA-DQ and -DR was also significantly reduced on day 7 after D-2-HG treatment (Figure 1F, Online Supplementary Figure S1E). Surface expression of MHC class I molecules also decreased during D-2-HG treatment but the decrease did not reach statistical significance (Online Supplementary Figure S1F). Furthermore, D-2-HG prevented upregulation of other DC markers such as CD1a and DC-SIGN (Online Supplementary Figure S1G, H). CD14, a monocyte marker that is downregulated during DC differentiation, was lost after 4 days even in the presence of D-2-HG (Online Supplementary Figure S1I). Next, we analyzed the cytokine profile of D-2-HG-treated DC. DC were activated with lipopolysaccharide for 24 h and cytokine levels were measured in culture supernatants. Similar to the already described short-term effects of D-2HG,22 interleukin-12 production was significantly reduced by D-2-HG after 7 days (84%, P=0.002), whereas interleukin-10 secretion was increased in three out of six donors. Tumor necrosis factor and interleukin-6 production was not influenced by D-2-HG treatment (Figure 1G). Interestingly, in line with low interleukin-12 secretion and MHC class II expression, D-2-HG-treated DC were less efficient stimu-
lators in an allogeneic mixed lymphocyte reaction with CD4 T cells, resulting in significantly lower T-cell proliferation (70% that of controls) and interferon-γ secretion (reduced by approximately 45%) (Figure 1H, I). Overall, D-2-HG affected the morphology and maturation of human DC, correlating with an impaired ability to stimulate T cells.
D-2-hydroxyglutarate reprograms metabolism and DNA demethylation during dendritic cell differentiation
Metabolic processes are crucial for activation and differentiation of immune cells and metabolic changes also occur during DC differentiation. DC exhibit a marked increase in the number of mitochondria and respiration compared to monocytes, whereas oxidative phosphorylation (OXPHOS) is reduced when DC become activated during maturation.23 We therefore hypothesized that D-2-HG might block DC differentiation and function via metabolic alterations. To verify this, we measured the levels of amino acids, glucose, pyruvate, and lactate in cell culture supernatants of DC differentiated in the presence or absence of D-2-HG. Treatment with D-2-HG resulted in accelerated glucose metabolism with significantly lower glucose (median 7.5 mM vs. 0.77 mM) and higher lactate (median 4.4 mM vs. 16.2 mM) levels in DC culture supernatants (Figure 2A). Thus, D-2-HG might contribute to the recently reported strong glycolytic activity of myeloid cells in the tumor environment.24 In addition, D-2-HG-treated DC produced significantly less alanine (median 473.1 μM vs 392.5 μM) and consumed more arginine (median 707.6 μM vs. 606.6 μM) (Figure 2A). The concentrations of essential amino acids were not altered by D-2-HG treatment (Online Supplementary Figure S2A).
In line with higher lactate levels, the expression of LDH subunit A (LDHA) was increased (Figure 2B, C). LDH is transcriptionally regulated by MYC25 and MYC expression increased in the presence of D-2-HG during DC culture and was significantly upregulated on day 7 (Figure 2B, D). This was accompanied by a significant drop in pH after 3-5 days of culture in the presence of D-2-HG (Figure 2E). A similar trend was observed with the L-enantiomer L-2-HG. At the end of the 2-HG-treated DC culture, acidification was comparable to that of DC cultures supplemented with 10 mM lactic acid (Figure 2E). In addition, D-2-HG and L-2-HG did not change oxygen consumption (Online Supplementary Figure S2B).
As D-2-HG is produced by mutated IDH, we analyzed DC expressing mutated IDH1 R132H and IDH2 R140Q upon RNA transfection by high-resolution respirometry. Basic oxygen consumption (ROUTINE respiration) of DC expressing mutated IDH1 and IDH2 was increased compared to that of DC expressing wild-type IDH1 and IDH2 (Online Supplementary Figure S2C). To compare the effects of D-2-HG produced endogenously or added exogenously, we also analyzed D-2HG-treated DC by high-resolution respirometry. ROUTINE respiration was significantly higher in DC treated for 7 days with D-2-HG (P=0.001) (Online Supplementary Figure S2D). Higher mitochondrial activity can result in elevated produc-
Figure 2. D-2-hydroxyglutarate induced changes in amino acid and glucose metabolism. (A) Concentrations of metabolites in supernatants of dendritic cells (DC, N=8) cultured with or without 20 mM D-2-hydroxyglutarate (D-2-HG) measured on day 7 of culture. Dashed lines indicate the concentrations in RPMI medium. (B) Western blot analysis of lactate dehydrogenase A (LDHA) and MYC in DC cultured with or without 20 mM D-2-HG for 7 days. (C, D) Scatter plots showing the summary and quantification of actin-normalized LDHA (C) and MYC (D) signals relative to the control. (E) pH values were monitored in the absence or presence of 20 mM D-2-HG or L-2-HG or 10 mM lactic acid every 5 minutes for 7 days by PreSens technology; the mean values of six independent experiments are shown. (F) Bisulfite-converted DNA of DC was analyzed by MassARRAY Epityper analysis. Four loci showing active DNA demethylation during monocyte-derived DC differentiation (CLEC10A, CCL13, CD207, C10ORF78) were analyzed. Data represent the mean of three different donors and are presented as heatmaps. The methylation ratio (including 5-methylcytosine and 5-hydroxymethylcytosine, which cannot be distinguished after bisulfite treatment) at single CpG dinucleotides (individual boxes) is indicated by shades of yellow to blue (yellow: no methylation, dark blue: 100% methylation). Gray boxes indicate CpG that were not
Continued on following page.
detected by matrix-assisted laser desorption/ionization time of flight (MALDI-TOF) mass spectrometry. A bar plot presentation of representative CpG (marked with asterisks) indicating active demethylation is shown in Online Supplementary Figure S2H and methylation ratios of all single CpG units for individual donors are provided in Online Supplementary Table S1. (A-E) Symbols represent individual donors analyzed in independent experiments and horizontal bars mark median values. For two-group comparisons, the Mann-Whitney test was used; in (E) two-way analysis of variance and a post-hoc Tukey test were performed. P<0.05 was considered statistically significant (*P<0.05, ***P<0.01, ***P<0.001). w/o: without; Ala: alanine; Asn: asparagine; Asp: aspartic acid; OA: oxaloacetate; TCA: tricarboxylic acid cycle; a-KG: a-ketoglutarate; Glu: glutamic acid; Pro: proline; Arg: arginine; DC: dendritic cells; MO: monocytes; VitC: vitamin C; 5mC: 5-methylcytosine; 5hmC: 5-hydroxymethylcytosine.
tion of reactive oxygen species. However, no significant change in the formation of reactive oxygen species was observed (Online Supplementary Figure S2E). In summary, D-2-HG treatment led to higher glycolytic and respiratory activity of DC.
Mitochondria are involved in epigenetic modulation, as they generate acetyl-CoA and sustain S-adenosylmethionine production used for the acetylation and methylation of histones and DNA, respectively. Loss of DNA methylation occurs during differentiation of human monocytes into DC and is linked to the expression of TET2.21 It is known that D-2-HG blocks key enzymes of DNA demethylation such as TET-family 5-methylcytosine hydroxylases.8 We therefore investigated the impact of D-2-HG on DNA demethylation during DC differentiation in the absence or presence of vitamin C, a cofactor of TET2 known to increase its activity. We observed a pattern of delayed demethylation of D-2-HG-treated DC at loci that normally become demethylated during DC differentiation, such as CLEC10A, CCL13, CD207 and C10ORF78 (Figure 2F). Vitamin C accelerated demethylation of all genes analyzed and partially counteracted the inhibitory effect of D-2-HG on methylation and ROUTINE respiration (Figure 2F, Online Supplementary Figure S2F). As expected, the methylation status of two loci that were not changed during differentiation (MMP7 and HOXB1) was also not modulated by D-2-HG (Online Supplementary Figure S2G, H). These data indicate that D-2-HG delays DNA demethylation during monocyte to DC differentiation, which may contribute to its strong impact on differentiation.
Modulating dendritic cell metabolism with vitamin C and lactate dehydrogenase inhibitors
Culture medium of DC treated with either D-2-HG or L-2HG exhibited a lowered pH and we therefore compared lactate levels in the corresponding supernatants. Lactate was elevated in culture supernatants of DC treated with both enantiomers (Figure 3A) and both enantiomers lowered HLA-DR and HLA-DP expression of DC (Figure 3B, C).
To clarify a possible role of lactic acid in the regulation of MHC class II molecules, we supplemented DC cultures with 10 mM lactic acid, which significantly reduced HLA-DR and HLA-DP expression (Figure 3B, C) in line with a comparable extracellular pH in DC cultures supplemented with either 2-HG or lactic acid (Figure 2E).
As vitamin C partially rescued the D-2-HG-induced delay in demethylation during DC differentiation, we investigated whether vitamin C treatment would be able to rescue the
metabolic phenotype and DC marker expression. Vitamin C reduced the elevated ROUTINE respiration in HG-treated DC cultures (Online Supplementary Figure S2F) but lactate levels in supernatants were still higher than those in the DC control (Figure 3A). Nevertheless, DC marker expression was partially restored (Figure 3D-K).
Next we tried to counteract the suppressive effect of D-2-HG by treating DC with the selective LDHA inhibitor GNE140 (1 μM).26 Combined treatment with GNE140 and vitamin C resulted in a significant decrease in lactate levels (Figure 3A). The viability of DC was diminished by vitamin C treatment, but not by D-2-HG and GNE140 (Online Supplementary Figure S3A). GNE140 or vitamin C alone increased the D-2-HG-impaired expression of MHC class II, CD1a and DC-SIGN and combined treatment with vitamin C and GNE140 raised the expression levels almost back to control levels for HLA-DR (94%) and CD1a (89%) (Figure 3H-K). HLA-DP and DC-SIGN expression was improved and no longer significantly decreased, but did not reach control levels. Similar effects were found with the pyrazole-based LDHA/B inhibitor NCI-737 (0.1 μM) in combination with vitamin C. NCI-737 lowered lactate secretion Figure3A and partially reverted MHC class II expression (Online Supplementary Figure S3B-E). Overall, LDH inhibition was able to strengthen the effects of vitamin C and led to a consistent improvement of MHC class II expression in human DC.
Exogenous D-2-hydroxyglutarate treatment inversely regulates lactate production and MHC class II expression in primary IDH wild-type acute myeloid leukemia cells
As D-2-HG strongly affected the metabolism of monocyte-derived DC, we asked whether this also held true for primary AML blasts. We, therefore, measured amino acid and glucose metabolite levels in the supernatants of IDH wild-type AML cells cultured in the presence of D-2-HG. D-2-HG significantly elevated glucose metabolism and increased lactate levels in AML cells (lactate 8.99 mM vs. 14.1 mM), in line with the effects observed in DC (Figure 4A). Induction of lactate production and secretion in AML blasts was not as pronounced as in DC, likely a consequence of the already much higher basal supernatant levels of lactate of AML cells compared to DC. In contrast to DC, we observed no alterations in amino acid levels (Figure 4A, Online Supplementary Figure S4A). The effects of D-2-HG on DC and AML cells are summarized in the heatmap in Online Supplementary Figure S4B; metabolite levels were
normalized to medium concentration (1 equals the medium concentration). Cell count and cell viability were not affected by D-2-HG treatment (Figure 4B, C). Again, lactate levels in supernatants of AML cells treated with D-2-HG for 7 days were significantly higher (Figure 4D). As lactic acid
has been reported to alter cell differentiation and function predominantly at concentrations higher than 10 mM,27 we analyzed HLA-DP (Figure 4E, F) and HLA-DR expression (Online Supplementary Figure S4C, D) relative to the lactate level in AML supernatants. Here, MHC class II expression
Figure 3. Vitamin C and lactate dehydrogenase inhibitor treatment counteract D-2-hydroxyglutarate-induced effects. (A) Scatter plot showing lactate level in supernatants of dendritic cells (DC) treated with 20 mM D-2-hydroxyglutarate (D-2-HG) or L-2-hydroxyglutarate (L-2-HG) or 10 mM lactic acid (started on day 0), 1 mM vitamin C (VitC, started on day 0) plus the lactate dehydrogenase inhibitor GNE140 (1 µM, started on day 2), and 1 mM VitC plus the lactate dehydrogenase inhibitor NCI-737 (0.1 µM, started on day 2) for 7 days. (B) HLA-DR and (C) HLA-DP expression on DC treated for 7 days with D-2-HG, L-2-HG or 10 mM lactic acid was analyzed by flow cytometry. (D-G) Representative histograms of HLA-DP expression in DC treated with D-2-HG and inhibitors (1 mM Vit C, 1 µM GNE140) as indicated in the Figure. Numbers indicate median fluorescence intensity values. (H) HLADP (N=5), (I) HLA-DR (N=5), (J) CD1a (N=4) and (K) DC-SIGN (N=4) surface expression on DC cultured with D-2-HG and inhibitors (1 mM VitC, 1 µM GNE140) as indicated in the Figure and analyzed by flow cytometry. Symbols represent individual donors analyzed in independent experiments and horizontal bars mark median values. For multiple-group comparisons, one way analysis of variance and a post-hoc Dunnett, Friedman or Dunn test were performed. P<0.05 was considered statistically significant (*P<0.05, **P<0.01, ***P<0.001, ****P<0.0001). MFI: mean fluorescence intensity; GNE: GNE140.
was significantly lower in samples with lactate concentrations above 10 mM than in samples with lower lactate levels, irrespectively of D-2-HG treatment and culture time (median HLA-DP 315 vs. 728, HLA-DR 3,175 vs. 7,299, respectively) (Figure 4E, Online Supplementary Figure
S4C). Additionally higher lactate concentrations strongly correlated with lower HLA-DP (r = -0.6105, P=0.0055) and HLA-DR (r = -0.7068, P =0.0005) expression (Figure 4F, Online Supplementary Figure S4D).
In summary, D-2-HG is a strong inducer of glycolytic ac-
Figure 4. Primary acute myeloid leukemia blasts treated with exogenous D-2-hydroxyglutarate show altered metabolism and MHC class II expression. (A) Scatter plots showing concentrations of metabolites in supernatants of acute myeloid leukemia (AML) cells cultured with or without 20 mM D-2-hydroxyglutarate (D-2-HG) measured on day 7 of culture (N=6). Dashed lines indicate the respective concentrations in the culture medium without cells. (B) Cell yield (dashed line indicates starting cell counts) and (C) viability of AML blasts (N=9) after 7 days of culture with or without 20 mM D-2-HG. (D) Lactate levels (4 days, N=3; 7 days, N=9) of isocitrate dehydrogenase (IDH) wild-type AML cells cultured with or without 20 mM D-2-HG. (E) HLA-DP surface expression of IDH wild-type AML blasts cultured for either 4 or 7 days separated by lactate concentrations below and above 10 mM. (F) Correlations of lactate concentration and HLA-DP expression are shown. AML samples cultured without D-2-HG are displayed in black, samples treated with D-2-HG are shown in orange; samples after 4 days are shown as squares and those after 7 days as dots (<10 mM N=6, >10 mM N=14). For two-group comparisons a Wilcoxon test or Mann-Whitney U test was performed. P<0.05 was considered statistically significant (*P<0.05, **P<0.01). (F) Spearman rank correlation coefficient was calculated. w/o: without; Ala: alanine; Asn: asparagine; Asp: aspartic acid; OA: oxaloacetate; TCA: tricarboxylic acid cycle; a-KG: a-ketoglutarate; Glu: glutamic acid; Pro: proline; Arg: arginine; MFI: mean fluorescence intensity.
B
tivity and lactate production not only in non-malignant myeloid cells but also in primary AML cells and it suppresses MHC class II expression.
IDH-mutated acute myeloid leukemia blasts accumulate 2-hydroxyglutarate, express lower HLA-DP levels and are less susceptible to T-cell-mediated lysis To evaluate the impact of endogenously produced D-2-HG on MHC class II expression, we analyzed primary AML blasts expressing mutated or wild-type IDH. First, we determined the endogenous levels of 2-HG in patients’ AML cells. As expected, 2-HG levels were significantly higher in IDH1- and IDH2-mutated blasts than in wild-type cells (wild-type 0.001 vs. IDH1-mutated 8.67 vs. IDH2-mutated 13.43) (Figure 5A).
Analysis of The Cancer Genome Atlas RNA sequencing data revealed no significant differences between IDH-mutated and wild-type AML blasts regarding HLA-DP, -DQ and -DR a and β gene expression or the central regulator of CIITA (Figure 5B, C). However, on the protein level, expression of HLA-DP (10.5 vs. 1.0) was significantly lower in IDH-mutated blasts, while that of HLA-DQ (4 vs. 5.5) and HLA-DR (10 vs. 3.5) was not altered (Figure 5D). In line with the lower levels of surface HLA-DP, overall HLA-DP protein expression was diminished in AML blasts as analyzed by western blot (Figure 5E).
HLA-DP is an important allo-antigen that stimulates graft-versus-leukemia effects.28 Frequent HLA-DP mismatches between patients and donors make HLA-DP targeted therapy clinically attractive for patients undergoing hematopoietic stem cell transplantation and we previously showed that HLA-DPB1-specific T cells are able to specifically target allogeneic mismatched antigens on AML blasts.29 Hence, we performed a T-cell-mediated AML killing assay to study the immune escape of IDH-mutated HLA-DPB1*04:01+ AML blasts using T cells expressing an HLA-DPB1*04:01-specific T-cell receptor upon RNA electroporation.30 In line with the significantly decreased HLA-DP protein expression, HLA-DP-specific lysis of IDH mutated AML blasts by T-cell receptor-modified T cells was clearly reduced when compared to that of IDH wild-type AML blasts (Figure 5F, G).
Vitamin C impairs the survival of acute myeloid leukemia cells and a combination of vitamin C and GNE140 upregulates MHC class II expression
As GNE140 and vitamin C treatment partially rescued MHC class II expression on D-2-HG-treated DC, we analyzed whether GNE140 and vitamin C treatment would also increase MHC class II expression on primary AML cells. Culture of AML cells for 4 to 7 days, even without treatment, reduced cell survival, but vitamin C and co-treatment with GNE140 further diminished the number of living cells, especially in IDH-mutated AML (Figure 6A-C, Online Supplementary Figure S5A-C). HLA-DP expression of cultured living AML cells tended to be higher, and HLA-DR was significantly increased after 7 days of treatment with GNE140/vitamin C (Figure 6D, E). These data suggest that MHC class II ex-
pression is linked to glucose metabolism and lactate levels not only in non-malignant DC but also in AML cells.
Discussion
Mutated IDH1 and IDH2 enzymes convert a-KG to the structurally similar D-2-HG, which competitively inhibits several ketoglutarate-dependent dioxygenases and, thereby, limits histone and DNA demethylation, which is known to impair hematopoietic differentiation.9,11 DNA methylation analysis during the differentiation of human monocytes to DC also revealed a delayed demethylation pattern in DC in the presence of D-2-HG. Vitamin C, a co-factor of Fe2+ and a-KG-dependent dioxygenases, is known to improve TET2 activity31 and Gerecke et al. combined an IDH1 inhibitor with vitamin C to increase demethylation in HCT116 cells carrying a heterozygote IDH1 R132H mutation.32 In our experiments, vitamin C could only partially revert the effect of D-2-HG on DC, which might be related to the D-2-HGinduced and persistent glycolytic phenotype with elevated MYC expression and lactate levels.
Beyond epigenetic modifications, several studies have demonstrated that exogenous or endogenous D-2-HG or L-2-HG has a strong impact on (tumor) cell metabolism. Both 2-HG enantiomers inhibited ATP synthase (complex V) in human glioblastoma and other neuronal cells.33,34 In addition, primary AML blasts with IDH1/2 mutations exhibited lower cytochrome c oxidase activity (complex IV).35 In contrast, our own data showed that overexpression of IDH1 R132H and IDH2 R140Q resulted in a higher oxygen consumption rate. Furthermore, exogenous D-2-HG treatment also increased basal respiration of monocyte-derived DC. Similar results have been reported for primary human T cells, where 2-HG treatment shifted metabolism from aerobic glycolysis towards respiration,36 indicating that non-transformed cells might react differently from malignant hematopoietic cells with an already altered metabolism. However, in a recently published study, IDH1-mutated AML cells also showed higher OXPHOS,37 which has been described for other tumor entities harboring an IDH1 mutation.38 Besides OXPHOS, decreased glycolysis and downregulation of LDHB were demonstrated in the NOMO-1 leukemia cell line and patients’ IDH wild-type AML cells after incubation with 2-HG, whereas in NB4 leukemia cells glycolysis was supported.39 In glioma, LDHA seems to be silenced by promoter methylation in IDH-mutated tumors which in turn should result in limited glycolysis.40 These results suggest that effects of 2-HG on OXPHOS and glycolysis are both context- and cell type-dependent. Our own data show that exogenous D-2-HG promotes not only OXPHOS but also glycolysis. Accelerated glycolysis in an early phase of differentiation disturbed development from monocytes to DC and limited MHC class II expression. The metabolic shift to glycolysis and the related production of
Figure 5. Endogenous D-2-hydroxyglutarate produced by mutated IDH reduces MHC class II protein expression in primary acute myeloid leukemia blasts. (A) Intracellular levels of 2-hydroxyglutarate (2-HG) were analyzed by liquid chromatography tandem mass spectrometry in acute myeloid leukemia (AML) blasts with wild-type isocitrate dehydrogenase (IDH) (N=6), mutated IDH1 (N=6) or mutated IDH2 (N=6). (B) Transcription levels of MHC class II a and β chain genes (HLA-DP, -DQ and -DR) of AML blasts expressing wild-type or mutated IDH were analyzed in RNA-sequencing data from The Cancer Genome Atlas (TCGA), including wild-type (N=155) and IDH-mutated (N=35) AML blasts from different patients at primary AML diagnosis. (C) CIITA expression data of AML exported from TCGA (for numbers see above). (D) Surface expression of HLA class II molecules (HLA-DP [wild-type N=14, mutated N=8], -DQ [wild-type N=11, mutated N=8] and –DR [wild-type N=11, mutated N=8]) on primary AML blasts expressing mutated or wild-type IDH analyzed by flow cytometry. (E) Total HLA-DP expression of AML blasts expressing mutated (N=4) or wild-type (N=4) IDH was evaluated by western blot analysis. Specific IDH mutations are depicted. (F) Primary HLA-DPB1*04:01+ AML blasts expressing wild-type (black symbols) or mutated IDH (orange symbols) were analyzed for their recognition by CD8 T cells expressing an HLA-DPB1*04:01-specific T-cell receptor upon RNA electroporation in a standard 5 h [51Cr] release assay at
Continued on following page.
the indicated effector (T cell)-to-target (AML blast) ratios. Specific lysis of IDH wild-type (N=3) and IDH2 mutated (N=3) AML blasts is shown. (G) As a control, CD8 T cells were electroporated without RNA (mock). (A-D) Symbols represent individual donors analyzed in independent experiments and horizontal bars mark median values. For two-group comparisons a Mann-Whitney test was used and for multiple-group comparisons a Kruskal-Wallis and post-hoc Dunn test were performed. P<0.05 was considered statistically significant (*P<0.05, **P<0.01). wt: wild-type; mut: mutated; RKPM: reads per kilo base per million mapped reads; TCR: T-cell receptor; E:T: effector-to-target cell ratio.
Figure 6. Vitamin C impairs survival of cultured primary acute myeloid leukemia cells and increases MHC class II expression in combination with GNE140. Primary cultured AML cells expressing wild-type (black) and mutant isocitrate dehydrogenase (IDH) (orange) were analyzed before (d0) and after 4 and 7 days of culture in the absence or presence of 2 mM vitamin C (VitC) and 1 µM GNE140, a lactate dehydrogenase inhibitor. (A) Representative FACS plots with live gating on primary cultured AML with or without treatment on day 7. (B) Summarized data on viability kinetics of untreated AML cells expressing wild-type (black) and mutant IDH (orange). (C) Percentage of living cells and (D) HLA-DP and (E) HLA-DR levels in the presence of 2 mM VitC and 1 µM GNE140 on day 7, normalized to the percentage of living, untreated cells. For multiple-group comparisons, a Kruskal-Wallis or Friedman test and post-hoc Dunn test were performed. P<0.05 was considered statistically significant (*P<0.05, **P<0.01). wt: wild-type; mut: mutated; w/o: without; GNE: GNE140; VitC: vitamin C.
lactic acid could inhibit DC in a paracrine fashion, as lactic acid directly blocks DC differentiation.27 However, in a later phase of DC differentiation, glycolysis seems to be of crucial importance and is a prerequisite for DC migration.41 The balance between OXPHOS and glycolysis is under the control of transcription factors such as MYC or hypoxia inducible factor-1a (HIF-1a).42 Interestingly, previous papers have already linked single nucleotide polymorphisms at
8q24.21 with MYC deregulation and greater risk of IDH-mutant glioma formation.43
O’Neill and colleagues found that endogenous 2-HG levels increased in lipopolysaccharide-activated murine macrophages and supported a highly glycolytic metabolic state through activation of the transcription factor HIF-1a. 44 In our experiments, DC expressed almost no HIF-1a (data not shown), but upregulated MYC after exposure to exogenous
D-2-HG, which was also accompanied by high glycolytic activity and low MHC class II expression. In line with this, tolerogenic DC induced by dexamethasone treatment showed higher MYC expression associated with elevated interleukin-10 secretion.45 An interplay between MYC and 2-HG metabolism has been reported by Qiu and colleagues. Here, MYC induced the transcription of L/D-2-hydroxyglutarate dehydrogenase, which can degrade 2-HG.46 Thus, it is tempting to speculate that MYC is increased by D-2-HG to reduce intracellular 2-HG levels and, thereby, limit the negative effects of 2-HG on DC. D-2-HG-treated DC upregulated MYC expression around day 4, suggesting that MYC could be responsible for LDHA induction and the observed accelerated glycolytic activity, as LDHA is a known c-MYC-responsive gene.25 On the other hand, LDHA activity itself and concomitant acidification might induce MYC, given that a low pH value stabilizes the deubiquitinase ubiquitin carboxyl-terminal hydrolase 28 (USP28), which leads to deubiquitination of MYC and MYC protein stabilization.47 However, applying different types of glycolytic inhibitors we could not consistently block the upregulation of MYC (data not shown).
The higher MYC levels in D-2-HG-treated DC may also partially explain the lower MHC class II expression, since MYC-overexpressing cells exhibit lower MHC class II expression, which also reduces immune recognition of B-cell lymphomas.48 The relevance of 2-HG for regulation of MHC class II expression is underlined by our finding that AML blasts with mutated IDH and high endogenous levels of 2-HG exhibit low MHC class II expression. It is well known that solid tumors, as well as AML blasts, induce immune escape by downregulation of their MHC molecules49 and expression of MHC class II molecules is lower in relapsed AML.50 Our data may in part explain the downregulation of MHC class II expression in IDH-mutated AML blasts and other malignancies with D-2HG accumulation, resulting in decreased T-cell recognition and immune control. In line, T-cell infiltration was improved by an IDH1 inhibitor in a glioma mouse model.51 Recently, Friedrich et al. described D-2-HG-dependent activation of the kynurenine pathway and tryptophan degradation leading to re-education of tumor-infiltrating macrophages.14 In lipopolysaccharide/interferon-stimulated human macrophages D-2-HG also reduced HLA-DR expression and an IDH inhibitor partially reversed low HLA-DR expression on macrophages in a murine model. Interestingly, similar results were obtained by Kadiyala et al. in an IDH1 R132H-mutated glioma mouse model in which IDH inhibitor treatment resulted in higher DC infiltration and upregulation of MHC class II molecules.52 IDH-related D-2-HG production seems to represent a metabolic strategy to lower MHC class II expression and suppress the anti-tumor response.
The expression of MHC class II molecules is not only important for recognition of solid tumors, but also necessary for immune control of AML. Previous studies analyzing the impact of HLA-DP mismatch constellations between patients and donors demonstrated an important role of
HLA-DP for the graft-versus-leukemia effect but also its role in immune escape.28,29,50,53,54
When testing allo-HLA-DP β chain-specific T cells with primary AML blasts, we observed low HLA-DP expression and poor T-cell recognition in a group of patients with mutated IDH. Further studies revealed that exogenous D-2-HG also stimulated glycolysis and reduced MHC class II expression in wild-type AML cells. However, in contrast to monocytes and monocyte-derived DC, the basal glycolytic activity was much higher in AML blasts. Enhanced glycolysis is a common feature in AML and a predictor of poor prognosis.55 Glycolysis also leads to leukemia-derived lactic acid secretion, which interferes with T-cell activity and proliferation.56 Therefore, targeting glycolysis and acidification is discussed as a novel strategy not only for AML, as altered glucose metabolism is closely associated with therapeutic resistance.
We tested whether glycolytic inhibition could counteract the effects of D-2-HG and rescue MHC class II expression during differentiation of monocytes to DC and in AML blasts. As expected, the LDH inhibitor GNE140 reduced lactate secretion and supported MHC class II, CD1a and DC-SIGN expression in DC and MHC class II expression in primary AML blasts. Hence, the effect of D-2-HG on the epigenetic landscape of differentiating monocytes likely contributes to the altered phenotype observed. Epigenetic modulators, histone deacetylase inhibitors, and DNA methyltransferase inhibitors can increase MHC class II expression on ovarian cancer cells.57 As vitamin C partly rescued the of D-2-HG effects on DNA methylation and normalized respiration, we combined vitamin C with the LDH inhibitor GNE140. The co-treatment with vitamin C and GNE140 had positive effects on CD1a and MHC class II expression in DC, but did not fully normalize their levels of expression. Similar results were obtained with another LDH inhibitor (NCI-737) that targets both LDHA and LDHB in DC. In addition, vitamin C and GNE140 administration supported MHC class II expression in AML cells. However, cell count was severely diminished by vitamin C. Similar data have shown that pharmacological concentrations of vitamin C kill cancer cells but not normal cells.58 DNA methyltransferase inhibitors might further support MHC class II expression, and thereby improve antitumor immunity in AML with IDH mutations. As IDH inhibitors have been shown to limit therapy response to radiotherapy, PARP inhibitors or chemotherapy, it might be a new treatment option to target 2-HG-induced metabolic alterations in IDH-mutated tumor cells instead of using IDH inhibition.59,60 In summary, exogenous D-2-HG inhibits the differentiation of DC and induces a tolerogenic phenotype with low MHC class II expression as a result of epigenetic and metabolic reprogramming. A similar phenotype was found in primary AML blasts with mutated IDH and endogenous D-2-HG production. The combination of LDH inhibitors with the antioxidant/epigenetic modulator vitamin C could partially rescue the effect of D-2-HG in DC and supported MHC class II expression in AML blasts. We suggest a combina-
tion of anti-glycolytic drugs with epigenetic modulators or chemotherapy for the treatment of both solid tumors and leukemia that accumulate D-2-HG in order to stimulate the immune response and prevent immune escape.
Disclosures
No conflicts of interest to disclose.
Contributions
MK, ST, MR, and KR conceived the study. KR was responsible for the methodology. KH, MA, FV, RS, NB, KM, ZECC, HS, SI, KD, RSB, and FE conducted the investigations. KH, NB, KM, SI, HS, SMD, and KR were responsible for the visualization. MK and ST acquired funds and MK was the project administrator. MK, KR, ST, MR, and KD supervised the study. MK, ST, and KH wrote the original draft of the paper. MK, NB, ST, MR, KR, KH, KM, ZECC, CB, KD, PJO, PJS, WH, and CM contributed to writing, revising and editing the manuscript.
References
1. Dang L, Yen K, Attar EC. IDH mutations in cancer and progress toward development of targeted therapeutics. Ann Oncol. 2016;27(4):599-608.
2. Molenaar RJ, Radivoyevitch T, Maciejewski JP, van Noorden CJF, Bleeker FE. The driver and passenger effects of isocitrate dehydrogenase 1 and 2 mutations in oncogenesis and survival prolongation. Biochim Biophys Acta. 2014;1846(2):326-341.
3. Dang L, White DW, Gross S, et al. Cancer-associated IDH1 mutations produce 2-hydroxyglutarate. Nature. 2009;462(7274):739-744.
4 Janin M, Mylonas E, Saada V, et al. Serum 2-hydroxyglutarate production in IDH1- and IDH2-mutated de novo acute myeloid leukemia: a study by the Acute Leukemia French Association group. J Clin Oncol. 2014;32(4):297-305.
5. Terunuma A, Putluri N, Mishra P, et al. MYC-driven accumulation of 2-hydroxyglutarate is associated with breast cancer prognosis. J Clin Invest. 2014;124(1):398-412.
6. Shim E-H, Livi CB, Rakheja D, et al. L-2-hydroxyglutarate: an epigenetic modifier and putative oncometabolite in renal cancer. Cancer Discov. 2014;4(11):1290-1298.
7 Ye D, Guan K-L, Xiong Y. Metabolism, activity, and targeting of Dand L-2-hydroxyglutarates. Trends Cancer. 2018;4(2):151-165.
8. Waitkus MS, Diplas BH, Yan H. Biological role and therapeutic potential of IDH mutations in cancer. Cancer Cell. 2018;34(2):186-195.
9. Figueroa ME, Abdel-Wahab O, Lu C, et al. Leukemic IDH1 and IDH2 mutations result in a hypermethylation phenotype, disrupt TET2 function, and impair hematopoietic differentiation. Cancer Cell. 2010;18(6):553-567.
10 Chaturvedi A, Araujo Cruz MM, Jyotsana N, et al. Mutant IDH1 promotes leukemogenesis in vivo and can be specifically targeted in human AML. Blood. 2013;122(16):2877-2887.
11. Losman J-A, Looper RE, Koivunen P, et al. (R)-2hydroxyglutarate is sufficient to promote leukemogenesis and its effects are reversible. Science. 2013;339(6127):1621-1625.
Acknowledgments
We thank Chi Van Dang for providing the LDH inhibitor 737 obtained from NIH NCATS. We acknowledge the excellent technical assistance of Gabriele Schönhammer, Monika Wehrstein, Johanna Raithel and Carina Urban. We also thank all members of the FACS Core Facility at the Leibniz Institute for Immunotherapy for their technical support.
Funding
This study was supported by funds from the Deutsche Forschungsgemeinschaft (DFG, German Research Foundation), project number 324392634 - TRR 221 (to ST and MK); DFG KFO 262 projects P9 and CP (to ST, MK, PJO, and KD) and Else Kröner-Fresenius Foundation project number 2018_A73 (to PJS).
Data-sharing statement
Data are available on reasonable request. All data relevant to the study are included in the article or uploaded as Online Supplementary Information.
12. Tyrakis PA, Palazon A, Macias D, et al. S-2-hydroxyglutarate regulates CD8+ T-lymphocyte fate. Nature. 2016;540(7632):236-241.
13. Bunse L, Pusch S, Bunse T, et al. Suppression of antitumor T cell immunity by the oncometabolite (R)-2-hydroxyglutarate. Nat Med. 2018;24(8):1192-1203.
14 Friedrich M, Sankowski R, Bunse L, et al. Tryptophan metabolism drives dynamic immunosuppressive myeloid states in IDH-mutant gliomas. Nat Cancer. 2021;2(7):723-740.
15. Zhang L, Sorensen MD, Kristensen BW, Reifenberger G, McIntyre TM, Lin F. D-2-hydroxyglutarate is an intercellular mediator in IDH-mutant gliomas inhibiting complement and T cells. Clin Cancer Res. 2018;24(21):5381-5391.
16. Lutz MB, Kukutsch N, Ogilvie AL, et al. An advanced culture method for generating large quantities of highly pure dendritic cells from mouse bone marrow. J Immunol Methods. 1999;223(1):77-92.
17. Rai G, Brimacombe KR, Mott BT, et al. Discovery and optimization of potent, cell-active pyrazole-based inhibitors of lactate dehydrogenase (LDH). J Med Chem. 2017;60(22):9184-9204.
18. Thomas S, Klobuch S, Besold K, et al. Strong and sustained effector function of memory- versus naïve-derived T cells upon T-cell receptor RNA transfer: implications for cellular therapy. Eur J Immunol. 2012;42(12):3442-3453.
19 Gnaiger E, Steinlechner-Maran R, Méndez G, Eberl T, Margreiter R. Control of mitochondrial and cellular respiration by oxygen. J Bioenerg Biomembr. 1995;27(6):583-596.
20 Grassinger J, Khomenko A, Hart C, et al. Safety and feasibility of long term administration of recombinant human granulocytecolony stimulating factor in patients with amyotrophic lateral sclerosis. Cytokine. 2014;67(1):21-28.
21. Klug M, Schmidhofer S, Gebhard C, Andreesen R, Rehli M. 5-Hydroxymethylcytosine is an essential intermediate of active DNA demethylation processes in primary human monocytes. Genome Biol. 2013;14(5):R46.
22. Ugele I, Cárdenas-Conejo ZE, Hammon K, et al. D-2hydroxyglutarate and L-2-hydroxyglutarate inhibit IL-12
secretion by human monocyte-derived dendritic cells. Int J Mol Sci. 2019;20(3):742.
24. Reinfeld BI, Madden MZ, Wolf MM, et al. Cell-programmed nutrient partitioning in the tumour microenvironment. Nature. 2021;593(7858):282-288.
25. Shim H, Dolde C, Lewis BC, et al. c-Myc transactivation of LDH-A: implications for tumor metabolism and growth. Proc Natl Acad Sci U S A. 1997;94(13):6658-6663.
26. Boudreau A, Purkey HE, Hitz A, et al. Metabolic plasticity underpins innate and acquired resistance to LDHA inhibition. Nat Chem Biol. 2016;12(10):779-786.
27. Gottfried E, Kunz-Schughart LA, Ebner S, et al. Tumor-derived lactic acid modulates dendritic cell activation and antigen expression. Blood. 2006;107(5):2013-2021.
28. Laghmouchi A, Hoogstraten C, van Balen P, Falkenburg JHF, Jedema I. The allogeneic HLA-DP-restricted T-cell repertoire provoked by allogeneic dendritic cells contains T cells that show restricted recognition of hematopoietic cells including primary malignant cells. Haematologica. 2019;104(1):197-206.
29 Herr W, Eichinger Y, Beshay J, et al. HLA-DPB1 mismatch alleles represent powerful leukemia rejection antigens in CD4 T-cell immunotherapy after allogeneic stem-cell transplantation. Leukemia. 2017;31(2):434-445.
30 Klobuch S, Hammon K, Vatter-Leising S, et al. HLA-DPB1 reactive T cell receptors for adoptive immunotherapy in allogeneic stem cell transplantation. Cells. 2020;9(5):1264.
31. Blaschke K, Ebata KT, Karimi MM, et al. Vitamin C induces Tet-dependent DNA demethylation and a blastocyst-like state in ES cells. Nature. 2013;500(7461):222-226.
32. Gerecke C, Schumacher F, Berndzen A, Homann T, Kleuser B. Vitamin C in combination with inhibition of mutant IDH1 synergistically activates TET enzymes and epigenetically modulates gene silencing in colon cancer cells. Epigenetics. 2020;15(3):307-322.
33. Fu X, Chin RM, Vergnes L, et al. 2-Hydroxyglutarate inhibits ATP synthase and mTOR signaling. Cell Metab. 2015;22(3):508-515.
34. Kölker S, Pawlak V, Ahlemeyer B, et al. NMDA receptor activation and respiratory chain complex V inhibition contribute to neurodegeneration in d-2-hydroxyglutaric aciduria. Eur J Neurosci. 2002;16(1):21-28.
35. Chan SM, Thomas D, Corces-Zimmerman MR, et al. Isocitrate dehydrogenase 1 and 2 mutations induce BCL-2 dependence in acute myeloid leukemia. Nat Med. 2015;21(2):178-184.
36. Böttcher M, Renner K, Berger R, et al. D-2-hydroxyglutarate interferes with HIF-1a stability skewing T-cell metabolism towards oxidative phosphorylation and impairing Th17 polarization. Oncoimmunology. 2018;7(7):e1445454.
37. Stuani L, Sabatier M, Saland E, et al. Mitochondrial metabolism supports resistance to IDH mutant inhibitors in acute myeloid leukemia. J Exp Med. 2021;218(5):e20200924.
38. Navis AC, Niclou SP, Fack F, et al. Increased mitochondrial activity in a novel IDH1-R132H mutant human oligodendroglioma xenograft model: in situ detection of 2-HG and a-KG. Acta Neuropathol Commun. 2013;1:18.
39 Qing Y, Dong L, Gao L, et al. R-2-hydroxyglutarate attenuates aerobic glycolysis in leukemia by targeting the FTO/m6A/PFKP/ LDHB axis. Mol Cell. 2021;81(5):922-939.e9.
40 Chesnelong C, Chaumeil MM, Blough MD, et al. Lactate dehydrogenase A silencing in IDH mutant gliomas. Neuro Oncol. 2014;16(5):686-695.
41. Guak H, Al Habyan S, Ma EH, et al. Glycolytic metabolism is
essential for CCR7 oligomerization and dendritic cell migration. Nat Commun. 2018;9(1):2463.
42. Goetzman ES, Prochownik EV. The role for Myc in coordinating glycolysis, oxidative phosphorylation, glutaminolysis, and fatty acid metabolism in normal and neoplastic tissues. Front Endocrinol (Lausanne). 2018;9:129.
43. Oktay Y, Ülgen E, Can Ö, et al. IDH-mutant glioma specific association of rs55705857 located at 8q24.21 involves MYC deregulation. Sci Rep. 2016;6:27569.
44 Williams NC, Ryan DG, Costa ASH, et al. Signaling metabolite L-2-hydroxyglutarate activates the transcription factor HIF-1a in lipopolysaccharide-activated macrophages. J Biol Chem. 2022;298(2):101501.
45. García-González PA, Maggi J, Schinnerling K, et al. Regulation of tolerogenic features on dexamethasone-modulated MPLAactivated dendritic cells by MYC. Front Immunol. 2019;10:1171.
46. Qiu Z, Lin A-P, Jiang S, et al. MYC regulation of D2HGDH and L2HGDH influences the epigenome and epitranscriptome. Cell Chem Biol. 2020;27(5):538-550.e7.
47. Cui B, Luo Y, Tian P, et al. Stress-induced epinephrine enhances lactate dehydrogenase A and promotes breast cancer stem-like cells. J Clin Invest. 2019;129(3):1030-1046.
48. God JM, Cameron C, Figueroa J, et al. Elevation of c-MYC disrupts HLA class II-mediated immune recognition of human B cell tumors. J Immunol. 2015;194(4):1434-1445.
49 Masuda K, Hiraki A, Fujii N, et al. Loss or down-regulation of HLA class I expression at the allelic level in freshly isolated leukemic blasts. Cancer Sci. 2007;98(1):102-108.
50 Christopher MJ, Petti AA, Rettig MP, et al. Immune escape of relapsed AML cells after allogeneic transplantation. N Engl J Med. 2018;379(24):2330-2341.
51. Kohanbash G, Carrera DA, Shrivastav S, et al. Isocitrate dehydrogenase mutations suppress STAT1 and CD8+ T cell accumulation in gliomas. J Clin Invest. 2017;127(4):1425-1437.
52. Kadiyala P, Carney SV, Gauss JC, et al. Inhibition of 2-hydroxyglutarate elicits metabolic reprogramming and mutant IDH1 glioma immunity in mice. J Clin Invest. 2021;131(4):e139542.
53. Fleischhauer K, Shaw BE. HLA-DP in unrelated hematopoietic cell transplantation revisited: challenges and opportunities. Blood. 2017;130(9):1089-1096.
54 Toffalori C, Zito L, Gambacorta V, et al. Immune signature drives leukemia escape and relapse after hematopoietic cell transplantation. Nat Med. 2019;25(4):603-611.
55. Chen W-L, Wang J-H, Zhao A-H, et al. A distinct glucose metabolism signature of acute myeloid leukemia with prognostic value. Blood. 2014;124(10):1645-1654.
56. Uhl FM, Chen S, O’Sullivan D, et al. Metabolic reprogramming of donor T cells enhances graft-versus-leukemia effects in mice and humans. Sci Transl Med. 2020;12(567):eabb8969.
57 Turner TB, Meza-Perez S, Londoño A, et al. Epigenetic modifiers upregulate MHC II and impede ovarian cancer tumor growth. Oncotarget. 2017;8(27):44159-44170.
58. Chen Q, Espey MG, Krishna MC, et al. Pharmacologic ascorbic acid concentrations selectively kill cancer cells: action as a pro-drug to deliver hydrogen peroxide to tissues. Proc Natl Acad Sci U S A. 2005;102(38):13604-13609.
59 Molenaar RJ, Botman D, Smits MA, et al. Radioprotection of IDH1-mutated cancer cells by the IDH1-mutant inhibitor AGI5198. Cancer Res. 2015;75(22):4790-4802.
60 Molenaar RJ, Radivoyevitch T, Nagata Y, et al. IDH1/2 mutations sensitize acute myeloid leukemia to PARP inhibition and this is reversed by IDH1/2-mutant inhibitors. Clin Cancer Res. 2018;24(7):1705-1715.
K. Hammon
Outcome of primary hemophagocytic lymphohistiocytosis: a report on 143 patients from the Italian Registry
Francesco Pegoraro,1,2 Aurora Chinnici,2,3 Linda Beneforti,2,3 Michele Tanturli,4 Irene Trambusti,2,5 Carmela De Fusco,6 Concetta Micalizzi,7 Veronica Barat,8 Simone Cesaro,9 Stefania Gaspari,10 Fabiola Dell’Acqua,11 Alessandra Todesco,12 Fabio Timeus,13 Maurizio Aricò,14 Claudio Favre,2 Annalisa Tondo,2 Maria Luisa Coniglio2 and Elena Sieni2 for the AIEOP Histiocytosis Working Group#
1Department of Health Sciences, University of Florence, Florence; 2Pediatric Hematology Oncology, Meyer Children’s Hospital IRCCS, Florence; 3Department of Neurosciences, Psychology, Drug Research and Child Health (NEUROFARBA), University of Florence, Florence; 4Department of Experimental and Clinical Biomedical Sciences “Mario Serio”, University of Florence, Florence; 5Department of Clinical and Experimental Medicine, University of Pisa, Pisa; 6Pediatric Oncology, AORN Santobono-Pausilipon, Pausilipon Hospital, Naples; 7Pediatric Hematology Oncology, IRCCS Istituto Giannina Gaslini, Genova; 8Pediatric Hematology Oncology, Stem Cell Transplantation and Cell Therapy Division, A.O. Città della Salute e della Scienza-Ospedale Infantile Regina Margherita, Turin; 9Pediatric Hematology Oncology, Department of Mother and Child, Azienda Ospedaliera Universitaria Integrata, Verona; 10Pediatric Hematology Oncology, Cellular and Gene Therapy, Bambino Gesù Children’s Hospital, IRCCS, Rome; 11Department of Pediatrics, Fondazione MBBM, University of Milano-Bicocca, Monza; 12Pediatric Hemato Oncology, University of Padua, Padua; 13Pediatrics Department, Chivasso Hospital, Chivasso and 14Pediatrics, S. Spirito Hospital, Azienda Sanitaria Locale Pescara, Pescara, Italy
#An appendix with all contributing AIEOP Histiocytosis Working Group members can be found at the end of the manuscript.
Abstract
Correspondence: E. Sieni elena.sieni@meyer.it
Received: July 19, 2023.
Accepted: February 12, 2024. Early view: February 22, 2024.
Primary hemophagocytic lymphohistiocytosis (pHLH) is a severe, life-threatening hyperinflammatory syndrome caused by defects in genes of the granule-dependent cytotoxic pathway. Here we investigated the clinical presentation and outcome in a large cohort of 143 patients with pHLH diagnosed in the last 15 years and enrolled in the Italian registry. The median age at diagnosis was 12 months (interquartile range, 2-81), and 92 patients (64%) fulfilled the HLH-2004 criteria. Of 111 patients who received first-line combined therapy (HLH-94, HLH-2004, Euro-HIT protocols), 65 (59%) achieved complete response and 21 (19%) partial response. Thereafter, 33 patients (30%) reactivated, and 92 (64%) received hematopoietic stem cell transplantation, 78 of whom (85%) survived and were alive at a median follow-up from diagnosis of 67 months. Thirty-six patients (25%) died before hematopoietic stem cell transplantation and 14 (10%) after. Overall, 93 patients (65%) were alive after a median follow-up of 30 months. Unadjusted predictors of non-response were age <6 months and high ferritin and bilirubin levels, while predictors of pre-transplant and overall mortality were high ferritin and bilirubin levels. At multivariable analysis, high levels of ferritin predicted non-response, while high levels of bilirubin predicted pre-transplant and overall mortality. Despite recent advances in therapeutic management, pHLH remains a life-threatening condition with significant early mortality. Liver dysfunction is the main predictor of poor prognosis.
Introduction
Primary hemophagocytic lymphohistiocytosis (pHLH) is a rare and severe genetic syndrome first described in 1952.1 It encompasses different monogenic disorders caused in most cases by defects in genes of the granule-dependent cytotoxic pathway of natural killer (NK) or CD8 T cells, which were first described in the late ‘90s.2-6 Before that, the diagnosis of pHLH relied on the presence of clinical and laboratory criteria, the demonstration of deficient NK-cell
function, and the anamnestic finding of familial recurrence of the syndrome. Since the “genetic era”, pHLH is classified as follows, based on the detected mutation: familial hemophagocytic lymphohistiocytosis (FHL), defined by biallelic mutations of PRF1 (FHL2), UNC13D (FHL3), STX11 (FHL4), or STXBP2 (FHL5); pigmentary disorders associated with HLH, defined by mutations of RAB27A (Griscelli syndrome type 2, GS2), LYST (Chediak-Higashi syndrome, CHS), or AP3B1 (Hermansky-Pudlak syndrome type 2, HPS2); X-linked lymphoproliferative disease (XLP), caused by mutations of SH2D1A (XLP1) or XIAP (XLP2). Other HLH-associated syndromes include gain-of-function mutations of NLRC4, CDC42 heterozygous mutations, Epstein-Barr virus (EBV) susceptibility diseases other than XLP, primary immune deficiencies, and inborn errors of metabolism.7,8
The clinical presentation of pHLH is indistinguishable from that of secondary HLH, and includes fever, cytopenias, and hepatosplenomegaly in most cases. Involvement of the central nervous system (CNS) and multiorgan failure (typically affecting the liver) are also common. Typical laboratory abnormalities include low fibrinogen, high triglycerides, and abnormal elevation of ferritin and soluble IL2 receptor (sIL2R). Moreover, before genetic testing is performed, pHLH in patients with FHL2-5 or pigmentary disorders can be postulated based on the demonstration by flow cytometry of impaired either intracytoplasmic perforin or surface CD107a expression by NK and CTL cell.9
Hematopoietic stem cell transplantation (HSCT) is the only curative treatment for pHLH. A chemotherapy regimen based on the combination of etoposide and dexamethasone has been developed in two consecutive trials promoted by the Histiocyte Society as a bridge to HSCT,10,11 and is now considered the standard of care for the disease. Alternative therapeutic strategies include an immunotherapeutic approach based on antithymocyte globulin (ATG) and methylprednisolone12 and, more recently, biologic drugs such as alemtuzumab,13 emapalumab,14 and ruxolitinib.15 Nevertheless, pHLH remains a difficult-to-treat disease with high early mortality and long-term disabilities. In the last decades, there has been a rapid evolution of diagnostic strategies, allowing more rapid genetic diagnosis in patients with HLH syndrome. However, many aspects of the syndrome, in terms of presentation and outcome of the genetic forms, remain to be understood. Herein, we analyzed a large cohort of patients with pHLH diagnosed in the last 15 years and enrolled in the Italian HLH registry, to analyze their clinical presentation and long-term outcome. In addition, we sought to identify predictors of poor response and of early and late mortality.
Methods
Study population
Clinical data and biologic samples from patients who re-
ceived a diagnosis of HLH16 are collected in the Italian HLH registry held at the Meyer Children’s Hospital in Florence, Italy. For the purposes of the present study, we retrieved the registry data on patients who received a genetic diagnosis of pHLH in the last 15 years. Data on genetic testing are reported in the Online Supplementary Appendix. Patients diagnosed after 2007 were eligible for study inclusion if they had available data on clinical and laboratory presentation, and outcome, with a minimum follow-up duration of 12 months. Patients referred to our laboratory from other countries or with unavailable follow-up data were excluded. Although most patients included in the registry were infants or children, also adults were considered for study inclusion if they met the inclusion criteria.
Data collection
Baseline data included demographics, family history, and clinical features of patients at diagnosis. The complete laboratory assessment, as recommended by the HLH2004 diagnostic criteria (full blood count, liver enzymes, triglycerides, fibrinogen, ferritin, sIL2) was also included. Follow-up data included information on treatment received (including HSCT), response to treatment, disease reactivation, sequelae, and the status at the last follow-up. All these data were pseudo-anonymized, collected in dedicated forms, and stored in an electronic, password-protected database. Response to first-line treatment was categorized as complete response (CR), partial response (PR), and non-response (NR). Details on outcome definition are provided in the Online Supplementary Appendix
Statistical analysis
Continuous variables were presented as median and interquartile range (IQR) while categorical variables as absolute number and percentage. For continuous variables, multiple-group comparisons were performed by the Kruskal-Wallis test, while for two-group comparisons the Mann–Whitney U test was used. For the analysis of frequency, statistical analyses were performed using χ2 test, if applicable, or Fisher’s exact test with the associated odds ratio (OR). For each OR, a 95% confidence interval (95% CI) was applied. For tables larger than 2X2, Fisher’s exact test with hybrid approximation and Monte Carlo simulation were used to compute the P value. For time-to-event (survival analysis) we designed Kaplan-Meier curves with the log-rank test. In addition, the Cox proportional hazards regression model was used for multivariate analysis. For multivariate analyses, we also applied generalized linear models (binomial and Gaussian family). Some continuous variables were binarized by drawing a ROC curve using the maximum sum of sensitivity and specificity to obtain an optimal threshold or applying a threshold based on relevant clinical values. Two-sided P<0.05 was considered significant. Statistical analysis was performed using R software version 4.2.2.
Ethics statement
The study was conducted in accordance with the Declaration of Helsinki and its later amendments.17 Written informed consent was obtained for all patients included in the registry.
Results
Three hundred and eighty-one patients with pHLH were included in the Italian HLH registry. Of them, 116 were excluded because they were diagnosed before 2007, 42 because they were not followed in a national center, 63 because of insufficient follow-up data, 12 because they had received a post mortem diagnosis, and five because of a revision of the genetic diagnosis. Finally, 143 patients were included in the study (Table 1).
Patients’ characteristics at diagnosis
The baseline characteristics of the 143 included patients are detailed in Table 1. The median age at diagnosis was 12 months (interquartile range [IQR], 2-81). While most patients were diagnosed before the second year of life, 14 patients (10%) were older than 14 years at diagnosis and 11 (8%) were adults. Around two thirds of patients were males (N=88, 62%). They were in most cases of Caucasian origin (N=113, 79%), while the remaining patients originated from North Africa (N=12, 8%), the Indian subcontient (N=9, 6%), Latin America, Middle East and sub-Saharan Africa (N=3, 2%, for each of them). Thirty patients (21%) had related parents, and 38 (27%) had familial disease.
Ninety-two patients (64%) fulfilled the HLH-2004 criteria at diagnosis.16 A hundred and twenty-eight patients (90%) had fever, 120 (84%) splenomegaly, and 84 (59%) hepatomegaly.
CNS involvement (defined as neurological impairment and/ or abnormalities at magnetic resonance imaging or cerebrospinal fluid analysis) was reported in 49 patients (34%).
At least bilinear cytopenia was found in 97 patients (68%): the median hemoglobin level was 8 g/dL (IQR, 7.7-10), the median neutrophil count 7.6x10⁹/L (IQR, 0.33-1.72), and the median platelet count 48x109/L (IQR, 24-100). Seventy-two patients (50%) had liver enzyme abnormalities: the median aspartate and alanine aminotransferase values were 164 and 132 U/L (IQR, 66-386 and 56-279, respectively), and the median value of total bilirubin 1.1 mg/dL (IQR, 0.5-2.9).
The median values of ferritin, triglycerides, and fibrinogen were 2,538 ng/mL (IQR, 1,061-11,550), 278 mg/dL (IQR, 185428), and 121 mg/dL (IQR, 80-228), respectively. Infectious triggers were detected in 42 patients (29%) and mostly consisted of EBV (N=21, 50%) and cytomegalovirus (N=4, 10%). Four patients were asymptomatic and were diagnosed based on familial screening.
Genetic diagnosis
The genetic diagnoses of the 143 patients are reported in Figure 1. Forty-seven patients (33%) had FHL2, 41 (29%)
FHL3, two (1%) FHL4, 15 (11%) FHL5, 12 (8%) XLP1, nine (6%) XLP2, eight (6%) CHS, and nine (6%) GS2. We found
Table 1. Demographics and clinical characteristics at diagnosis.
Charactersitics
Age in months, median (IQR)
Female sex, N (%)
Ethnic origin, N (%)
Caucasian
Sub-Saharan African North African Middle East, Arabic Indian subcontinent Latin American
(2-81)
(38)
(79)
(2)
(8) 3 (2)
HLH-2004 criteria, N (%)
, N (%)
N (%)
(90)
(34)
g/dL, median (IQR)
x109/L, median (IQR)
(24-100) Fibrinogen mg/dL, median (IQR)
Triglycerides mg/dL, median (IQR)
(185-428) Ferritin ng/mL, median (IQR)
(1,061-11,550) ALT UI/L, median (IQR) 132 (56-279)
*Central nervous system (CNS) involvement is defined by the presence of at least 1 of the following: i) neurological symptoms; ii) magnetic resonance imaging abnormalities; iii) CSF abnormalities; #others include C. difficile, E. coli, Dengue, Leishmania, M. pneumonia, SARS-CoV-2, RSV and VZV. IQR: interquartile range; ANC: absolute neutrophil count; PLT: platelets; ALT: alanine transaminases; AST: aspartate transaminases; EBV: Epstein-Barr virus; CMV: cytomegalovirus; HHV6: human herpesvirus-6; NA: not available.
differences in baseline characteristics depending on the genetic diagnosis (Online Supplementary Table S1; Online Supplementary Figure S2) in terms of sex, age at diagnosis, consanguinity, and severity of clinical presentation (including the prevalence of complete HLH criteria, hematologic abnormalities, ferritin and ALT values, and infectious triggers). In particular, patients with XLP had higher age and lower rates of hematologic involvement at diagnosis (higher platelet and neutrophil count, lower rates of cytopenia). When we analyzed the distribution of the genetic diagnosis in three age groups (0-6 months, 7-24 months, and >24 months; Online Supplementary Figure S1), the proportion of patients with FHL2 and FHL3 remained stable in the three age groups, while most patients with XLP were older than 2 years, and patients with FHL5, CHS, and GS2 were typically younger.
Response to treatment
Thirteen patients (9%) did not receive any treatment, either for the rapidly fatal outcome (N=5), a mild clinical presentation (N=3), or the absence of symptoms (N=5). First-line therapies in the 130 treated patients included chemotherapy according to the HLH-9410 and HLH-200411 trials in 29 (22%) and 75 (58%) patients, respectively, while seven patients (5%) were included in the Euro-HIT trial (EUDRACT2011-002052-14). The 19 remaining patients (15%) received steroid-based therapy (Figure 2; Online Supplementary Table S2).
Figure 1. Distribution of the genetic diagnoses in the 143 patients. FHL2: familial hemophagocytic lymphohistiocytosis type 2; FHL3: familial hemophagocytic lymphohistiocytosis type 3; FHL4: familial hemophagocytic lymphohistiocytosis type 4; FHL5: familial hemophagocytic lymphohistiocytosis type 5; GS2: Griscelli syndrome type 2; CHS: Chediak-Higashi syndrome; XLP1: X-linked lymphoproliferative disease type 1; XLP2: X-linked lymphoproliferative disease type 2; GS2: Griscelli syndrome type 2.
Figure 2. Flow-chart of treatment and outcome. HSCT: hematopoietic stem cell transplantation.
The overall response rate to chemotherapy was 78% (86/111; Figure 2). CR was documented in 65 of 111 patients and PR in 21 additional patients (Online Supplementary Table S2). In 11 of these patients, additional treatment was required: rituximab in four patients with EBV infection, ATG, ruxolitinib, and infusion of maternal NK cells in two each, and tacrolimus in one. Twenty-five of 111 patients (22%) did not respond to chemotherapy: one received emapalumab as salvage therapy and was successfully transplanted, the remaining 24 patients (including 4 patients who responded to re-intensification therapy but reactivated), died at a median follow-up of 1 month (IQR, 0-3) (Figure 2). Among patients who received a steroid-based treatment, 16 of 19 (84%) responded (11 CR, 5 PR), and five died. Of note, all these five patients had severe central nervous system (CNS) involvement at diagnosis. Eight patients were not treated either because they refused treatment (N=1), were asymptomatic (the 4 patients diagnosed due to familial screening), or paucisymptomatic (N=3); these latter patients were transplanted and were alive at a median follow-up of 28 months (IQR, 23-67) (Figure 2).
No significant differences in terms of response to treatment or survival were detected depending on the received therapeutic protocol (Online Supplementary Table S2), but patients who responded to first-line treatment had older age, higher platelets, and lower ferritin values at diagnosis (Figure 3).
Reactivation
Thirty-three of 100 (33%) patients who responded to treatment reactivated, at a median time from diagnosis of 6 months (IQR, 3-11). Of them, 23 patients responded to first-line chemotherapy and then reactivated at a median time from diagnosis of 5.5 months (IQR, 2.5-9): one child died for abrupt disease progression without receiving treatment, while six received frontline HSCT and were all alive at last follow-up except for one patient that died for disease progression despite HSCT (Figure 2). The remaining 16 patients received additional treatment, including chemotherapy according to HLH-2004 (alone in 8, associated with alemtuzumab, ATG, and ruxolitinib in 1 each) and emapalumab (5 patients; Online Supplementary Table S3).
Figure 3. Clinical and laboratory features at baseline and outcome. HSCT: hematopoietic stem cell transplantation.
Nine of them were transplanted and eight survived, while six of the seven patients who did not receive HSCT died (Figure 2). In four patients, after initial non-response to chemotherapy, partial disease control was obtained after re-intensification treatment, but they rapidly reactivated: two received HSCT but all four eventually died at a median time from diagnosis of 4.5 months (IQR, 2-6; Online Supplementary Table S3; Figure 2). Six patients reactivated after steroid treatment and received second-line treatment, and four of them were transplanted; all six were alive after a median follow-up duration of 61 months (IQR, 32-64). The reactivation-free survival of the study cohort is reported in Figure 4. No differences in reactivation-free survival were found according to the genetic diagnosis and the study period (Online Supplementary Figures S3-5).
Transplantation
Ninety-two of 143 patients (64%) received HSCT, at a median time from diagnosis of 5 months (IQR, 4-8.5). Four of them required a second HSCT for graft loss, and one an additional third transplant. Among the 92 transplanted patients, 78 patients (85%) survived and were alive at a median time of 67 months (IQR, 34-106) from diagnosis and 56 months (IQR, 25-97) from HSCT (Figure 4). Of the 14 patients who died after HSCT, three were transplanted due to treatment failure and died from disease progression, and 11 for transplant-related mortality. Patients who were able to receive HSCT were older and had higher platelet counts and lower bilirubin values at diagnosis (Figure 3). Interestingly, 15 patients (10%) did not receive HSCT and were alive at a median follow-up duration of 34 months (IQR, 13-55; Online Supplementary Table S4). Ten patients responded to first-line treatment, including four patients
who reactivated and then responded to second-line treatment. Five patients did not receive any treatment: four were diagnosed due to familial screening and remained disease-free through follow-up, while one patient with isolated CNS disease refused treatment and was lost after follow-up at 14 months.
Survival
Ninety-three patients (65%) were alive at the last follow-up (Figure 4). The median follow-up duration was 30 months (IQR, 6-74) in the whole cohort and 57 months (IQR, 2997) for patients alive at the last follow-up. Among the 50 patients who died, five (10%) did not receive treatment because they died within day 30 from diagnosis, and five (10%) received only steroids (median time to death 1 month; IQR, 1-6). The remaining 40 patients received chemotherapy (9 HLH-94, 28 HLH-2004, and 3 Euro-HIT). Among these 40 patients, 16 died after initial response to first-line treatment (9 for transplant-related mortality, 6 after disease reactivation, and 1 for severe CNS disease), while 24 did not respond and died at a median time from diagnosis of 1 month (IQR, 0-3) for disease progression (Figure 2). Thirty-six patients of 143 (25%) died before receiving HSCT (Figure 4). Causes of death included disease progression leading to multi-organ failure in 32 of 50 patients (64%, following HSCT in 3 patients), transplant-related events in 11 (22%), infections in five (10%) and severe CNS sequelae in two (4%) (Online Supplementary Table S5). Interestingly, of the ten patients with PRF1 A91V mutations (for which exist conflicting data on pathogenicity), three died before HSCT and three received HSCT for active HLH. When evaluating survival, either at HSCT or at the last follow-up, according to the genetic diagnosis, we found no
significant difference ( Online Supplementary Figure S3). Similarly, no difference in survival was found when analyzing patients with XLP compared to patients with FHL and pigmentary disorders (Online Supplementary Figure S4), nor between the first and the second study period (2007-2014 vs. 2015-2022); however, a trend toward better post-transplant survival was noticed in the last period (Online Supplementary Figure S5). No significant difference was found in baseline characteristics of patients alive and dead at the last follow-up, while patients who died before HSCT had lower platelet counts and higher bilirubin values at diagnosis, compared to those who received HSCT (Figure 3).
Predictors of non-response and mortality
At unadjusted analysis, predictors of non-response were age <6 months, high ferritin values (>5,000 ng/mL), and
high bilirubin levels (>2 mg/dL) at diagnosis. Predictors of pre-transplant and overall mortality were high ferritin and bilirubin levels at diagnosis (Table 2). At multivariable analysis, high ferritin values were confirmed as predictors of non-response (overall response [OR] 5.66, 95% CI: 1.12-42.4; P=0.049), while bilirubin levels >2 mg/dL were confirmed as predictors of pre-transplant (OR 4.89, 95% CI: 1.39-18.6; P=0.014) and overall mortality (OR 2.98, 95% CI: 1.02-8.86; P=0.045; Table 3).
Sequelae
Sequelae were reported in 31 of 143 patients (22%). In 11 of 92 transplanted patients (12%) sequelae were transplant-related (chronic graft-versus-host disease in 7; endocrine, vascular, and immunologic in 1 each); three had malignancies (lymphoma, acute lymphoblastic leukemia, and gastric cancer); two had a nutritional impairment, following col-
HLH: hemophagocytic lymphohistiocytosis; FHL2: familial hemophagocytic lymphohistiocytosis type 2; FHL3: familial hemophagocytic lymphohistiocytosis type 3; FHL4: familial hemophagocytic lymphohistiocytosis type 4; FHL5: familial hemophagocytic lymphohistiocytosis type 5; XLP1: X-linked lymphoproliferative disease type 1; XLP2: X-linked lymphoproliferative disease type 2; GS2: Griscelli syndrome type 2; CHS: Chediak-Higashi syndrome; CNS: central nervous system; ANC: absolute neutrophil count; PLT: platelets; ALT: alanine transaminases; AST: aspartate transaminases; ULN: upper level of normal; OR: odds ratio; CI: confidence interval; HSCT: hematopoietic stem cell transplantation; NA: not applicable.
Table 2. Unadjusted analysis of predictors of non-response, pre-transplant mortality, and overall mortality.
ectomy in one and requiring long-term parenteral nutrition in both (these patients had XLP2 and FHL4, respectively); two had liver function impairment, requiring liver transplant in one of them, two had chronic kidney disease, and one pulmonary hypertension; two patients had peripheral nervous system impairment, while six patients had CNS complications (paresis in two, and intellectual delay and epilepsy in one each; the remaining two patients had fatal spastic tetraplegia). Finally, one patient had prolonged hypogammaglobulinemia and one osteoporosis.
Discussion
Primary HLH is a severe condition that carries a high burden of early mortality and long-term complications. The clinical course of pHLH can be misleading, and its management is critical.8 In this study, we describe the presentation and investigate the long-term outcome of a large cohort of patients with pHLH and identify predictors of non-response and mortality.
In historic cohorts, most pHLH patients were diagnosed within the first year of age, but in recent years the rate of diagnosis in older children - or even in adults - has increased.18,19 Similarly, in our cohort, only half the patients were younger than 1 year at diagnosis, and 10% of them were adolescents or adults. This data is probably due to the improvement of familial screening but also reflects an increased awareness of this condition outside the pediatric domain. Moreover, compared to previous studies,7 we report a higher rate of XLP, accounting for around 12% of patients in our cohort. These patients were older at diagnosis and had less hematologic involvement at presentation. Thus, unsurprisingly, the proportion of patients presenting with the traditional combination of HLH-related symptoms was lower compared to data from an older international cohort20 and from large international HLH studies.11,21 With regard to treatment, two large international trials coordinated by the Histiocyte Society11,21 have defined the standard of care, providing the first, marked improvement of survival of patients with HLH. Yet, HLH-2004 did not provide any further improvement compared with HLH-94, with
mortality rate remaining up to about 35%. Thus, HLH-94 remained the standard of care. In our study, most patients received one of the two standard chemotherapy regimens, HLH-94 or HLH-2004. Not surprisingly, overall survival and early mortality rates did not differ from the study results, to which those patients largely contributed. Two more recent Turkish studies on pHLH reported higher mortality rates, of 63%22 and 81%.19 Compared to the HLH-94 and HLH-2004 studies, we found a lower rate of post-transplant mortality (15% vs. 34% and 30%, respectively), which probably partially reflects the improvement of transplant procedures and supportive care in more recent years.
A minority of patients received novel treatments (i.e., emapalumab, ruxolitinib, and alemtuzumab) at reactivation, and these molecules were effective in most cases. However, we were unable to properly evaluate their impact due to the limited number of treated patients. In contrast, patients not responding to first-line treatment experienced adverse outcomes in almost all cases, even those few patients who were able to receive second-line treatment (only 1 patient was successfully rescued using emapalumab). This subgroup of patients is more likely to benefit from alternative treatments.
Thus, early identification of a subset of HLH patients at highest risk who could benefit from alternative therapeutic approaches remains of interest. Data from the HLH-94 study indicated that jaundice, edema, and kidney function abnormalities were associated with early mortality.21 Additional analysis of the same study reported bilirubin >50 μmol/L, hyperferritinemia, and CSF pleocytosis as adjusted predictors of early mortality.23 More recently, a monocentric Turkish study identified hepatic involvement as associated, at unadjusted analysis, with inferior 5-year survival in patients with pHLH younger than 2 years.19 In the present study, we analyzed predictors of non-response to first-line treatment, and of pre-transplant and overall mortality in patients with pHLH. Younger age at diagnosis was significantly associated with non-response, while higher ferritin values were associated with non-response, pre-transplant, and overall mortality. Of note, the ferritin cut-off of 2,000 ng/mL previously used by Trottestam et al 23 did not reach statistical significance in our cohort, probably depending
Table 3. Multivariable analysis of predictors of non-response, pre-transplant mortality, and overall mortality.
on the different study population (HLH vs. pHLH). Moreover, bilirubin values >2 mg/dL were significantly associated with all three outcomes. At multivariable analysis, liver dysfunction, demonstrated by hyperbilirubinemia, was confirmed as a reliable predictor of early and overall mortality, and high burden of inflammation, suggested by hyperferritinemia, predicted non-response to first-line treatment. In contrast, we did not confirm the association between CNS involvement and outcome, while data on kidney function were not analyzed.
HSCT is considered the only curative treatment for pHLH. In previous studies, the finding of pHLH patients surviving without HSCT was anecdotic (2/168 in the HLH-2004 study, both harboring a p.Ala91Val PRF1 mutation; and none in the 60 pHLH patients enrolled in the HLH-94 study). Unexpectedly, 15 patients (10%) in the present series were alive at a median follow-up of 34 months without receiving HSCT. Out of them, four were asymptomatic and diagnosed due to familial screening: they neither developed HLH nor received HLH-directed treatments, at a time to last follow-up ranging from 12 to 105 months. One patient with isolated CNS disease refused treatment, while the remaining ten patients responded to first line HLH-directed treatment and remained disease free after 13 to 86 months. Overall, our study included a large pHLH cohort, diagnosed over the last 15 years, allowing us to depict an updated picture of the genetic subtype distribution and the outcome of patients with pHLH in Italy. However, we must acknowledge that this study has limitations. First, to include such a large number, an extended time interval is embraced during which medical and transplant practices have changed. However, since the second therapeutic study HLH-2004 has not shown a significant improvement in treatment results, accumulation of the two cohorts should not result in a significant bias in outcome and prognostic investigation. When looking at diagnostic studies, the diagnostic criteria have remained unchanged, but we selected patients based on genetic diagnoses. It has to be acknowledged that a minority of the included patients had mutations with a debatable pathogenicity, but in these cases the genetic diagnosis was supported by abnormal functional studies and/or stringent clinical criteria (HLH-2004). These patients were clinically managed as pHLH and were therefore included in the analyses of the present study. Of note, we also included ten patients harboring homozygous or compound heterozygous A91V PRF1 mutations, whose pathogenicity is still debated. However, while four of them
2. Barbosa MDFS, Nguyen QA, Tchernev VT, et al. Identification of the homologous beige and Chediak-Higashi syndrome genes.
were alive without HSCT, three received HSCT for active HLH and three died before being able to be transplanted. Although it increases the heterogeneity of the cohort, we believe that reporting these patients could support clinical management in these ambiguous cases.
In conclusion, pHLH is a rare and very severe inheritable condition that still carries an invariably dismal prognosis, if not rapidly and appropriately identified and treated. Patients failing to achieve disease control with first-line treatment remain at highest risk of fatal outcome. These patients usually present with high levels of ferritin and bilirubin, and an early shift to alternative approaches including new agents, appears warranted. For patients achieving disease control allowing HSCT, improved transplant skills may offer a higher chance of cure. Identification of the small subset of patients with pHLH with potential to maintain disease control after initial therapy even without HSCT, may profit from a careful, pin-point analysis, maybe supported also by an accurate genotype-phenotype study.
Disclosures
No conflicts of interest to disclose.
Contributions
FP and ES conceived the work and wrote the manuscript. FP, AC, LB, and MLC collected and analyzed the data. IT, CDF, CM, VB, SC, SG, FDA, AT, MA, FT, CF, AT, and ES followed the patients. AC, LB, and MLC performed diagnostic testing. MT performed the statistical analyses.
Funding
Part of this work was supported by a research fellowship funded by the Associazione Italiana Ricerca Istiocitosi (AIRI) O.N.L.U.S.
Data-sharing statement
Data will be shared upon appropriate request to the corresponding author.
3. Coffey AJ, Brooksbank RA, Brandau O, et al. Host response to EBV infection in X-linked lymphoproliferative disease results from mutations in an SH2-domain encoding gene. Nat Genet.
1998;20(2):129-135.
4 Nichols KE, Harkin DP, Levitz S, et al. Inactivating mutations in an SH2 domain encoding gene in X-linked lymphoproliferative syndrome. Proc Natl Acad Sci USA. 1998;95(23):13765-13770.
5. Sayos J, Wu C, Morra M, et al. The X-linked lymphoproliferativedisease gene product SAP regulates signals induced through the co-receptor SLAM. Nature. 1998;395(6701):462-469.
6. Stepp SE, Dufourcq-Lagelouse R, Le Deist F, et al. Perforin gene defects in familial hemophagocytic lymphohistiocytosis. Science. 1999;286(5446):1957-1959.
7 Cetica V, Sieni E, Pende D, et al. Genetic predisposition to hemophagocytic lymphohistiocytosis: report on 500 patients from the Italian registry. J Allergy Clin Immunol. 2016; 137(1):188-196.
9 Chinnici A, Beneforti L, Pegoraro F, Trambusti I, Tondo A, Favre C, et al. Approaching hemophagocytic lymphohistiocytosis. Front Immunol. 2023;14:1210041.
10 Henter JI, Samuelsson-Horne A, Aricó M, et al. Treatment of hemophagocytic lymphohistiocytosis with HLH-94 immunochemotherapy and bone marrow transplantation. Blood. 2002;100(7):2367-2373.
11. Bergsten E, Horne A, Aricó M, et al. Confirmed efficacy of etoposide and dexamethasone in HLH treatment: long-term results of the cooperative HLH-2004 study. Blood. 2017;130(25):2728-2738.
12. Mahlaoui N, Ouachee-Chardin M, de Saint Basile G, et al. Immunotherapy of familial hemophagocytic lymphohistiocytosis with antithymocyte globulins: a single-center retrospective report of 38 patients. Pediatrics. 2007;120(3):e622-628.
13. Marsh RA, Allen CE, McClain KL, et al. Salvage therapy of refractory hemophagocytic lymphohistiocytosis with alemtuzumab. Pediatr Blood Cancer. 2013;60(1):101-109.
14 Locatelli F, Jordan MB, Allen C, et al. Emapalumab in children with primary hemophagocytic lymphohistiocytosis. N Engl J Med. 2020;382(19):1811-1822.
15. Zhang Q, Zhao YZ, Ma HH, et al. A study of ruxolitinib responsebased stratified treatment for pediatric hemophagocytic lymphohistiocytosis. Blood. 2022;139(24):3493-3504.
16. Henter JI, Horne A, Aricó M, et al. HLH-2004: Diagnostic and therapeutic guidelines for hemophagocytic lymphohistiocytosis. Pediatr Blood Cancer. 2007;48(2):124-131.
17 World Medical Association. World Medical Association Declaration of Helsinki: ethical principles for medical research involving human subjects. JAMA. 2013;310(20):2191-2194.
18. Sieni E, Cetica V, Piccin A, et al. Familial hemophagocytic lymphohistiocytosis may present during adulthood: clinical and genetic features of a small series. PLoS One. 2012;7(9):e44649.
19 Beken B, Aytac S, Balta G, et al. The clinical and laboratory evaluation of familial hemophagocytic lymphohistiocytosis and the importance of hepatic and spinal cord involvement: a single center experience. Haematologica. 2018;103(2):231-236.
20 Aricò M, Janka G, Fischer A, et al. Hemophagocytic lymphohistiocytosis. Report of 122 children from the International Registry. FHL Study Group of the Histiocyte Society. Leukemia. 1996;10(2):197-203.
21. Trottestam H, Horne A, Aricò M, et al. Chemoimmunotherapy for hemophagocytic lymphohistiocytosis: long-term results of the HLH-94 treatment protocol. Blood. 2011;118(17):4577-4584.
22. Bayram C, Tahtakesen TN, Arslantaş E, et al. Prognostic factors and long-term outcomes in 41 children with primary hemophagocytic lymphohistiocytosis: report of a single-center experience and review of the literature. J Pediatr Hematol Oncol. 2023;45(5):262-266.
23. Trottestam H, Berglöf E, Horne A, et al. Risk factors for early death in children with haemophagocytic lymphohistiocytosis. Acta Paediatr. 2012;101(3):313-318.
Prognostic impact of SF3B1 mutation and multilineage dysplasia in myelodysplastic syndromes with ring sideroblasts: a Mayo Clinic study of 170 informative cases
Michelle A. Elliott,1 Kebede H. Begna,1 Christopher C. Hook,1 William J. Hogan,1 Animesh Pardanani,1 Mark R. Litzow,1 Rhett P. Ketterling,2 Naseema Gangat,1 Daniel A. Arber,3 Attilio Orazi,4 Rong He,2 Kaaren Reichard2 and Ayalew Tefferi1
1Division of Hematology, Department of Medicine and Laboratory Medicine, Mayo Clinic, Rochester, MN; 2Division of Hematopathology, Department of Medicine and Laboratory Medicine, Mayo Clinic, Rochester, MN; 3University of Chicago, Chicago, IL and 4Department of Pathology, Texas Tech University Health Sciences Center, El Paso, TX, USA
Abstract
Correspondence: A. Tefferi tefferi.ayalew@mayo.edu
Received: November 21, 2023.
Accepted: February 29, 2024. Early view: March 7, 2024.
The revised 4th edition of the World Health Organization (WHO4R) classification lists myelodysplastic syndromes with ring sideroblasts (MDS-RS) as a separate entity with single lineage (MDS-RS-SLD) or multilineage (MDS-RS-MLD) dysplasia. The more recent International Consensus Classification (ICC) distinguishes between MDS with SF3B1 mutation (MDS-SF3B1) and MDS-RS without SF3B1 mutation; the latter is instead included under the category of MDS not otherwise specified. The current study includes 170 Mayo Clinic patients with WHO4R-defined MDS-RS, including MDS-RS-SLD (N=83) and MDS-RSMLD (N=87); a subset of 145 patients were also evaluable for the presence of SF3B1 and other mutations, including 126 with (87%) and 19 (13%) without SF3B1 mutation. Median overall survival for all 170 patients was 6.6 years with 5- and 10-year survival rates of 59% and 25%, respectively. A significant difference in overall survival was apparent between MDS-RS-MLD and MDS-RS-SLD (P<0.01) but not between MDS-RS with and without SF3B1 mutation (P=0.36). Multivariable analysis confirmed the independent prognostic contribution of MLD (hazard ratio=1.8, 95% confidence interval: 1.1-2.8; P=0.01) and also identified age (P<0.01), transfusion need at diagnosis (P<0.01), and abnormal karyotype (P<0.01), as additional risk factors; the impact from SF3B1 or other mutations was not significant. Leukemia-free survival was independently affected by abnormal karyotype (P<0.01), RUNX1 (P=0.02) and IDH1 (P=0.01) mutations, but not by MLD or SF3B1 mutation. Exclusion of patients not meeting ICC-criteria for MDS-SF3B1 did not change the observations on overall survival. MLD-based, as opposed to SF3B1 mutation-based, disease classification for MDS-RS might be prognostically more relevant.
Introduction
The entity of refractory anemia with ring sideroblasts (MDS-RS) has been well codified for several decades.1 According to the 2016/17 World Health Organization (WHO) classification system (revised 4th edition; WHO4R),2 myelodysplastic syndrome with ring sideroblasts (MDS-RS) was listed as a subcategory of MDS, primarily characterized by the presence of ≥15% ring sideroblasts, in bone marrow (BM) erythroid precursors; additional diagnostic criteria included the absence of ≥5% BM myeloblasts, among nucleated BM cells, or ≥1% peripheral blood (PB) myeloblasts, among PB leukocytes, Auer rods, and diagnostic criteria for MDS with isolated del(5q); of note, the presence of SF3B1 mutation was used to lower the
diagnostically required ring sideroblasts threshold to 5%.
The new 2022 International Consensus Classification (ICC2022) of Myeloid Neoplasms and Acute Leukemias, which represents revision of the WHO4R document, considered SF3B1 mutation over and above ring sideroblasts in defining a more homogeneous group and have thus replaced the term MDS-RS with MDS- SF3B1 ;3 diagnostic criteria for the latter required the presence of SF3B1 mutation (≥variant allele frequency [VAF] 10%), absence of multi-hit TP53 or RUNX1 mutation, absence of isolated del(5q), -7/ del(7q), abn3q26.2, or complex karyotype, and absence of BM/PB myeloblasts ≥5%/2%, but did not include ring sideroblast percentage. MDS-RS without SF3B1 mutation has accordingly been relocated to the subcategory of MDS-not otherwise specified (MDS-NOS), regardless
of the percentage of BM ring sideroblasts. MDS-NOS, according to ICC-2022, includes MDS with single lineage (SLD), multilineage (MLD), or no dysplasia.3 The rationale stated for these changes included the assumption that genetic risk stratification superseded the effect from morphologic distinction between MDS-RS-SLD (Figure 1) and MDS-RS-MLD (Figure 2). The current study examined these assumptions in a retrospective cohort of 170 patients with WHO4R-defined MDS-RS, in the context of presenting features and impact on survival.
Methods
The current study was approved by the Mayo Clinic institutional review board. Study patients were selected from institutional databases based on retrospective review of clinical and laboratory information and confirmation of MDS-RS diagnosis, according to WHO4R criteria.2 Conventional methods were used for cytogenetic and next-generation sequencing (NGS) studies. Targeted exome sequencing included the following genes: TET2 , ASXL1 , DNMT3A, IDH1, IDH2, TP53, SRSF2, SF3B1, SH2B3, NPM1, FLT3, U2AF1, ZRSR2, JAK2, CSF3R, MPL, MFSD11, CEBPA, SETBP1, ZRSR2, RUNX1, IKZF1, CALR, KRAS, NRAS, CBL, PTPN11, STAG2, BCOR, and GATA2, and was performed on diagnostic BM specimens. Wright-Giemsa stain was used
to stain PB and BM smears. Prussian blue iron stain was used to detect iron reserves and siderotic granulation in BM smears. The characteristics of dysplasia were classified using established criteria.4 Dysplasia in more than 10% of cells involving two or three lineages was described as MLD whereas dysplasia in more than 10% of erythroid-lineage cells was characterized as SLD. Erythroblasts with at least five siderotic granules encompassing at least a third of the nuclear circumference were classified as ring sideroblasts. Treatment administered was at the discretion of the treating physician and in concert with standard practice and included erythropoiesis stimulating agents (ESA), often as first-line and several other drugs, often as second- or third-line treatment, including luspatercept (N=41), lenalidomide (N=26), and hypomethylating agents (HMA; N=38). Non-parametric tests were used to compare the distributions of continuous variables, whereas the χ2 test was used to compare the distributions of nominal variables. The time from diagnosis to death or last follow-up was used to calculate overall survival. Leukemia-free survival was calculated from the time of diagnosis to the date of leukemia transformation, death or the last day of follow-up. For univariate comparisons, the Kaplan–Meier approach was utilized in time-to-event analysis. For univariate and multivariate analysis of overall and leukemia-free survival, the Cox proportional hazard regression model was utilized. P value ≤0.05 was consid-
Figure 1. Myelodysplastic syndrome with ring sideroblasts and single lineage dysplasia. (A, B) The bone marrow aspirate smear and core biopsy, respectively, demonstrate progressive maturation of the granulocytic and erythroid series with erythroid hyperplasia. Erythroid dysplasia is not striking and scattered late-stage nucleated red blood cells show coarsely basophilic stippling which corresponds with ring sideroblasts (A). There is no dysplasia in the granulocytic and megakaryocytic series and no increase in blasts. Wright-Giemsa stain, magnification 1,000x (A); hematoxylin and eosin stain, magnification 600x (B). (C) Iron stain reveals increased ring sideroblasts. Prussian-blue stain, magnification 1,200x.
ered significant. JMP Pro 16.0.0 software package, SAS Institute, Cary, NC was utilized for all analyses.
Results
Figure 2. Myelodysplastic syndrome with ring sideroblasts and multilineage dysplasia. (A) The bone marrow aspirate smear showed scattered dyserythropoietic cells (block arrow) characterized by nuclear budding, multinucleation or nuclear contour irregularities. The megakaryocytes also display dysplastic morphology characterized by small forms with monolobated or 2 separate distinct nuclear lobes (arrow); Wright-Giemsa stain, magnification 1,000x. (B) The bone marrow core biopsy is hypercellular with disruption of the normal tight erythroid colonies an increased dysplastic megakaryocytes (arrows); hematoxylin and eosin stain, magnification 600x. (C) Iron stain reveals numerous ring sideroblasts; Prussian-blue stain, magnification 1,200x.
Phenotypic and genotypic comparisons between myelodysplastic syndrome with ring sideroblasts multilineage and myelodysplastic syndrome with ring sideroblasts single lineage Online Supplementary Table S1 outlines the presenting clinical and laboratory features, along with postdiagnosis events, in 170 Mayo Clinic patients with WHO4R-defined MDS-RS (median age 73 years; range, 41-94; males 67%): 87 (51%) were classified as MDS-RS-MLD (median age 74 years; range, 47-94; males 71%) and 83 (49%) as MDS-RSSLD (median age 72; range, 41-89; males 63%); there was no significant difference between the two morphologic variants in age and sex distribution. Patients with MDSRS-MLD, compared to those with MDS-RS-SLD, were more likely to display lower leukocyte count (median 4.4x10⁹/L vs. 5.6x10⁹/L; P<0.01), lower absolute lymphocyte count (ALC; median 1.2x10⁹/L vs. 1.6x10⁹/L; P<0.01), lower absolute neutrophil count (ANC; median 2.6x10⁹/L vs. 3x10 9/L; P =0.06), and lower platelet count (median 202x109/L vs. 275x109/L). Patients with MDS-RS-MLD were also more likely to display neutropenia (ANC <1x10⁹/L in 10% vs. 2%; P=0.02); lymphopenia (ALC <1.2x10⁹/L 47% vs. 31%; P=0.04), and thrombocytopenia (platelets <100x109/L in 18% vs. 4%; P<0.01); a non-significant association for MDS-RS-MLD was also apparent for a lower hemoglobin level (P=0.19) and a higher incidence of transfusion need at diagnosis (P=0.19). Although not at a significant level, MDS-RS-SLD was associated with higher percentage of BM ring sideroblasts (P=0.11; Online Supplementary Table S1). BM and PB blast percentages were similar between the two morphologic cohorts; BM median 1 (range, 0-4) and PB median 0 (range, 0-1) (Online Supplementary Table S1). Cytogenetic information was available in 166 patients of whom 121 (73%) displayed normal karyotype, nine (5%) loss of Y chromosome only, eight (5%) sole trisomy 8, seven (4%) sole del(20q), five (3%) complex karyotype, three (2%) -7/7q- abnormality, and 13 (8%) other abnormalities. The frequency of abnormal karyotype other than LOY was 31% in MDS-RS-MLD versus 12% in MDS-RS-SLD (P<0.01); as depicted in Online Supplementary Table S1 , the significant difference in abnormal karyotype distribution was mostly attributed to complex/-7/7q- abnormalities seen in eight (10%) of the 84 evaluable patients with MDS-RS-MLD and none of the 82 evaluable patients with MDS-RS-SLD (P<0.01). NGS information was available in 145 patients; mutational frequencies were 87% for SF3B1, 25% for TET2, 19% for DNMT3A , 11% for ASXL1 , 5% for SRSF2 , 5% for TP53, and 2% each for IDH1 and CSF3R; as depicted in Online Supplementary Table S1 and unlike the case with karyotype, there were no significant differences between
the two morphologic groups of MDS-RS in regard to the distribution of these mutations.
Phenotypic and genotypic comparisons between SF3B1-mutated and -unmutated myelodysplastic syndrome with ring sideroblasts NGS information, including SF3B1 mutational status, was available in 145 of the 170 study patients. Online Supplementary Table S2 outlines presenting features stratified by the presence or absence of SF3B1 mutation, including 126 (87%) with and 19 (13%) without the mutation. SF3B1 mutation was more likely to be associated with higher leukocyte ( P <0.01), neutrophil ( P <0.01), lymphocyte (P=0.03), monocyte (P=0.02), and platelet (P<0.01) counts and less likely to be associated with neutropenia (P=0.02), lymphopenia (P<0.01), or thrombocytopenia (P<0.01). Unlike the case with SLD versus MLD morphologic variants of MDS-RS, differences in karyotype distribution between SF3B1-mutated and -unmutated MDS-RS cases were not as pronounced while NGS-derived mutation distribution revealed significant clustering of wild-type SF3B1 with SRSF2 (26% vs. 2% mutational frequency in SF3B1-mutated cases; P<0.01), TP53 (16% vs. 3%; P=0.04), RUNX1 (10% vs. 25; P<0.01), IDH1 (16% vs. 0%; P<0.01), and U2AF1 (10% vs. 0%; P=0.01) mutations (Online Supplementary Table S2 ). In addition, borderline significance was apparent for higher prevalence of normal karyotype in SF3B1-mutated cases (79% vs. 58%) and that of complex karyotype in patients with wild-type SF3B1 (16% vs. 2%; Online Supplementary Table S2).
Impact of multilineage or SF3B1 mutation on overall and leukemia-free survival in revised 4th edition of the World Health Organization-defined myelodysplastic syndrome with ring sideroblasts
At a median follow-up of 5.2 years (range, 0.1-12.6) for living patients, 104 (61%) deaths, eight (5%) leukemic transformations, and seven (5%) allogeneic hematopoietic stem cell transplantations (AHSCT) were documented (Online Supplementary Table S1). There were significantly more deaths among patients with MDS-RS-MLD versus MDS-RS-SLD (72% vs. 49%; P<0.01; Online Supplementary Table S1) while this was not the case during comparison of SF3B1-mutated versus wild-type cases (63% vs. 47%; P =0.2; Online Supplementary Table S2 ). Median overall survival for all 170 patients was 6.6 years with 5- and 10-year survival rates of 59% and 25%, respectively (Figure 3A); the corresponding figures for MDS-RS-SLD were 7 years, 67%, and 31%; for MDS-RS-MLD, 5.5 years, 52%, and 17% (Figure 3B); for MDS-RS with SF3B1 mutation 6.8 years, 64%, and 26%; and MDS-RS with wild-type SF3B1 9.7 years, 52% and 0% (Figure 3C). Figure 3B reveals a significant difference in overall survival between MDSRS-MLD and MDS-RS-SLD (hazard ratio [HR]=1.7, 95% confidence interval [CI]: 1.14-2.5; P<0.01) while such was
not the case when comparing MDS-RS with and without SF3B1 mutation (P=0.36; Figure 3C).
The difference in overall survival between MDS-RS-MLD and MDS-RS-SLD was confirmed by multivariable analysis that included, individually, SF3B1 mutational status, age, ANC <1x10⁹/L, ALC <1.2x10⁹/L, platelets <100x109/L, red cell transfusion need at diagnosis, abnormal karyotype, and TP53 mutation; significance was also sustained (HR=1.8, 95% CI: 1.1-2.8; P =0.01) in an all-inclusive multivariable analysis that included SF3B1 mutational status, karyotype, transfusion need at diagnosis, age, ANC, ALC, and platelet count, with the later four entered as continuous variables; additional independent risk factors in the latter analysis included age (P<0.01), transfusion need at diagnosis (P<0.01), and abnormal karyotype ( P<0.01) and the results were not influenced by the addition of mutation information in the multivariable model: SF3B1 (P=0.48); TP53 (P=0.22); SRSF2 (P=0.97); IDH1 (P=0.93); RUNX1 (P=0.47); or U2AF1 (P=0.22).
There was borderline significance for a shorter leukemia-free survival in patients with MDS-RS-MLD versus MDS-RS-SLD (HR=3.3, 95% CI: 0.7-16.2; P =0.15) while a significant difference was apparent when comparing cases with wild-type versus mutated SF3B1 (HR=8.2, 95% CI: 1.1-58.7; P=0.03). However, the latter significance was lost during multivariable analysis that included other mutations that clustered with SF3B1 mutation including RUNX1 (HR=53.7), IDH1 (HR=54.9), and TP53 (HR=22.4); no other mutation or clinical variable (e.g., age, transfusion need, neutrophil, lymphocyte, or platelet count) displayed additional prognostic significance for leukemia-free survival. Furthermore, RUNX1 (P=0.02) and IDH1 (P=0.01), but not TP53 (P=0.35) mutations retained their significance for shortened leukemia-free survival when karyotype was added to the multivariable model with abnormal karyotype showing additional prognostic contribution (P<0.01).
Re-analysis of survival impact after exclusion of patients not meeting International Consensus Classification-2022 criteria for myelodysplastic syndromes with SF3B1 mutation
In order to address the confounding effect of revised criteria for diagnosis of MDS-SF3B1,3 we repeated the above outlined analyses after limiting the study population to patients with available NGS information (N=145) and excluding those with complex (N=5) or -7/7q- (N=3) cytogenetic abnormalities, multi-hit TP53 (N=2) or RUNX1 (N=5) mutations, and SF3B1 VAF ≥10% (N=3). After these adjustments, 130 patients were evaluable for further analysis with 63 MDS-RS-MLD and 67 MDS-RS-SLD cases; and 115 with and 15 without SF3B1 mutation. In univariate analysis, overall survival was similar between patients with and without SF3B1 mutation (P=0.92) but significantly worse in those with MLD compared to SLD (P=0.04). Multivariable analysis for overall survival demonstrated the significant difference
Figure 3. Overall survival among 170 patients with myelodysplastic syndrome with ring sideroblasts. (A) All patients; (B) all 170 patients stratified by single lineage versus multilineage dysplasia; and (C) a subset of 145 patients with information on SF3B1 mutation available.
in overall survival between MDS-RS-MLD and MDS-RS-SLD was independent of age, karyotype, and transfusion-need at diagnosis, with all four variables remaining significant: P=0.02, P<0.01, P<0.01, and P<0.01, respectively. A similar analysis for leukemia-free survival was handicapped by the small number of informative cases that included only three incidents of leukemic transformation with one of the three harboring TP53 mutation (P=0.08).
Impact of multilineage dysplasia or SF3B1 mutation on treatment response
Accurate treatment information was available for luspatercept (N=41), revlimid (N=26), and hypomethylating agents (N=38). These drugs were often used after failure of prior therapy with ESA, which was historically mentioned in 121 patients, including 64 (74%) with MDS-RS-MLD and 57 (69%) with MDS-RS-SLD (P=0.48). Overall anemia response rates were 17% (7/41 patients) for luspatercept, 19% (5/26 patients) for revlimid, and 45% (17/38 patients) for HMA; the corresponding response rates in patients with MDS-RSMLD versus MDS-RS-SLD were 16% (5/31 patients) versus 20% (2/10 patients) for luspatercept (P=0.78), 25% (4/16 patients) versus 10% (1/10 patients) for revlimid (P=0.33), and 46% (12/26 patients) versus 42% (5/12 patients) for HMA (P=0.8). A similar analysis comparing SF3B1-mutated versus wild-type patients showed luspatercept response
in 13% (4/31 patients) versus 17% (1/6 patients; P =0.8), revlimid response in 26% (5/19 patients) versus 0% (0/3 patients; P=0.2), and HMA response in 32% (8/25 patients) versus 50% (3/6 patients; P=0.4), respectively. Similar data on treatment response to ESA were not available.
Discussion
The presence of ring sideroblasts in low-risk MDS has traditionally been considered as a marker of favorable prognosis in terms of both overall and leukemia-free survival, despite progressive anemia and red cell transfusion need in the majority of cases.4-6 In a recently published natural history study of 138 patients with low-risk MDS with ≥5% ring sideroblasts, 65% of patients became red cell transfusion-dependent in their first 5 years of study enrollment with 42% deaths and 14% leukemic progressions reported during the same period.6 In our own previously published series of 76 patients with WHO4R-defined MDS-RS and followed for a median of 33 months, median overall survival was 46 months and leukemic transformation rate 3%.5 In the current study, we have expanded our WHO4R-defined MDS-RS patient population to 170 cases and the follow-up period to 5.2 years, in living patients; median overall survival was 6.6 years with 5-year and
10-year survival rates of 59% and 25%, respectively (Figure 3A); the incidence of leukemic transformation was 5%. Most cases of MDS-RS are associated with an SF3B1 mutation,7 which is now considered a characteristic feature of the disease in whose presence diagnosis of MDS-RS can be made with BM ring sideroblast percentage >5% rather than the ≥15% threshold otherwise required.3 WHO4R classification also considered the number of lineages exhibiting morphologic dysplasia, in order to subclassify MDS-RS into two morphologic subcategories: MDS-RSMLD and MDS-RS-SLD. 2 It is to be recalled that MDSRS-SLD was previously recognized as refractory anemia with ringed sideroblasts (RARS) and MDS-RS-MLD as refractory cytopenia with multi-lineage dysplasia (RCMD), according to the 2008 WHO classification system (4th edition).8 Microscopically, MDS-RS-SLD exhibits increased BM erythroid precursors associated with erythroid-lineage dysplasia, without associated dysplasia in granulocytes or megakaryocytes (i.e., <10% dysplastic forms; Figure 1).
MDS-RS-MLD also exhibits erythroid-lineage dysplasia but also ≥10% dysplastic forms in granulocyte (e.g., nuclear hypolobulation) or megakaryocyte (e.g., micro-megakaryocytes, nuclear hypolobulation) lineages (Figure 2).2
ICC-2022 considered SF3B1 mutation over and above ring-sideroblasts in defining a more homogeneous group of low-risk MDS and have thus replaced the term MDS-RS with MDS-SF3B1 3 MDS-RS cases without SF3B1 mutations are now included in the ICC category of MDS-NOS, which also includes the subcategories of MDS-NOS with unilineage, multilineage, or no dysplasia, regardless of the percentage of BM ring sideroblasts.3 By contrast, the proposed 5 th edition of the WHO classification (WHO5) considers the distinction between SLD and MLD optional.9 The rationale stated for the ICC-2022 changes included the assumption that genetic risk stratification superseded the effect from morphologic distinction between MDSRS-SLD and MDS-RS-MLD.4 In support of this assumption, Malcovati et al. found similar survival between SF3B1-mutated MDS patients with SLD versus MLD (P=0.4) while the same group of patients stratified by BM blast percentage at 5% resulted in significantly different survival (P<0.01).10 In the same study, the authors showed significantly longer survival for SF3B1-mutated versus unmutated cases in a spectrum of MDS subcategories, including RARS and RCMD-RS, with the exception of those with excess blasts.10 In contrast to the aforementioned study by Malcovati et al., we have, in the past, repeatedly failed to demonstrate an independent prognostic effect from SF3B1 mutations in the context of WHO4R-defined MDS-RS. In the first (published in 2012) of several related work in MDS-RS, we examined the phenotypic and prognostic relevance of BM ring sideroblast percentage in an otherwise loosely-defined MDS-RS (MDS without excess blasts and RS% ≥1%);11 we reported direct correlation of ring sideroblast percentage with age, platelet count, transfusion need
and SF3B1 mutational frequency and inverse correlation with hemoglobin level, multilineage dysplasia and high-risk karyotype; more importantly, ring sideroblast percentage did not affect overall or leukemia-free survival. In a similar work published the same year (2012), we examined the prognostic interaction between SF3B1 mutation, morphology, and karyotype in MDS patients with ≥15% ring sideroblasts, regardless of BM blast content;12 in the particular study, SF3B1 mutations did not display MLD-independent prognostic value, which was otherwise suggested in univariate analysis. Similarly, in a 2018-published study of 76 patients with MDS-RS, 5 including 57 with MDS-RS-SLD and 19 with MDS-RS-MLD, we reported higher frequency of SF3B1 and DNMT3A mutations in the latter with no difference in overall survival, which was otherwise adversely affected by the presence of ASXL1 or absence of SF3B1 mutation. In a more recent communication,13 we reported similar survival in SF3B1-mutated MDS and SF3B1-mutated MDS/MPN, which otherwise shared similar mutational landscape, with the exception of higher frequency of JAK2 mutations in the latter.
The current manuscript includes the largest (N=170) single institutional cohort of WHO4R-defined MDS-RS with the objective to clarify the phenotype and genotype correlates of multilineage dysplasia and its impact on long-term survival, in the context of SF3B1 mutation and karyotype. The key observation from the current study was in regard to the independent prognostic relevance of MLD to overall survival in WHO4R-defined MDS-RS. In our contemporary study population, we were able to confirm the adverse survival impact of MLD in the context of other risk factors, including age, transfusion need at time of diagnosis, abnormal karyotype with or without inclusion of complex/-7/7q- abnormalities, previously recognized high-risk mutations, lymphopenia, neutropenia, and thrombocytopenia. By contrast, we were not able to demonstrate prognostic contribution from SF3B1 mutation, regardless of whether or not more recent criteria3 for its diagnosis were applied. This was despite the fact that wild-type SF3B1 was associated with adverse disease features, including high-risk mutations, thrombocytopenia, lymphopenia, and neutropenia (Online Supplementary Table S2). Of note, MLD was also associated with some of these adverse features and, more importantly, with adverse karyotype ( Online Supplementary Table S1 ), but still showed an independent adverse effect on overall survival. In addition to MLD, our study highlights the prominent prognostic contribution from abnormal karyotype, both in terms of overall and leukemia-free survival, an effect that was mostly attributed to complex karyotype and -7/7q- abnormalities. The latter observation is in line with the ICC-2022 criteria for diagnosis of MDS-SF3B1, which requires exclusion of cases with the specific cytogenetic abnormalities.3 However, in the current study, abnormal karyotype other than complex karyotype or
-7/7q- abnormalities remained prognostically significant for overall survival, independent of other risk factors. On the contrary, we were not able to demonstrate prognostic relevance for SF3B1 or other mutations, in regard to overall survival. The current study also found RUNX1, IDH1, and TP53 mutations to show prognostic relevance in regard to leukemia-free survival, again in line with ICC-2022 diagnostic criteria for MDS-SF3B1, which requires exclusion of cases with multihit TP53 and RUNX1 mutations.2 The latter were also reported by others to be associated with leukemic progression in low-risk MDS.14
Recent developments in the treatment of MDS-RS include the introduction of new drugs, such as luspatercept.15 In the original phase III study of luspatercept versus placebo in transfusion-dependent patients with very low/low/ intermediate-risk MDS-RS who were either refractory or unlikely to respond to treatment with ESA,15 red blood cell transfusion-free period of at least 4 months was documented in 28% of study patients during weeks 1 through 48. In the particular study, response to luspatercept was not influenced by SF3B1 VAF or the total number of baseline somatic mutations.15 Similar observations regarding the lack of mutation impact on luspatercept treatment response in MDS-RS has been made by others.16 In a more recent phase III study of luspatercept versus epoetin a in transfusion-dependent and ESA-naïve patients with very low/low/intermediate risk MDS (regardless of ring sideroblast percentage), response to luspatercept was more likely in the presence of SF3B1 mutation but whether the same can be said in the context of MDS-RS is uncertain.17 In our own retrospective experience on the use of luspatercept in MDS-RS, neither SF3B1 nor other mutations appeared to effect treatment response.18 Taken together, it is reasonable to question the value of SF3B1 or other mutations in predicting treatment response to currently approved drugs in MDS-RS.
References
1. Bennett JM, Catovsky D, Daniel MT, et al. Proposals for the classification of the myelodysplastic syndromes. Br J Haematol. 1982;51(2):189-199.
2. Arber DA, Orazi A, Hasserjian R, et al. The 2016 revision to the World Health Organization classification of myeloid neoplasms and acute leukemia. Blood. 2016;127(20):2391-2405.
3. Arber DA, Orazi A, Hasserjian RP, et al. International Consensus Classification of Myeloid Neoplasms and Acute Leukemias: integrating morphologic, clinical, and genomic data. Blood. 2022;140(11):1200-1228.
4 Mufti GJ, Bennett JM, Goasguen J, et al. Diagnosis and classification of myelodysplastic syndrome: International Working Group on Morphology of myelodysplastic syndrome (IWGM-MDS) consensus proposals for the definition and enumeration of myeloblasts and ring sideroblasts. Haematologica. 2008;93(11):1712-1717.
5. Mangaonkar AA, Lasho TL, Finke CM, et al. Prognostic
Based on the observations from the current study, it is reasonable to conclude that MLD remains a powerful morphologic marker of aggressive disease in WHO4R-defined MDS-RS and is characterized peripherally by trilineage cytopenias and prognostically by shortened survival. These observations are in line with previous reports on the subject matter19,20 but are now confirmed in a contemporary patient population that accounted for confounding influence from karyotype and mutations, including SF3B1. The current study also underscored the limited value of the SF3B1 mutation as a prognostic marker, in the context of WHO4R-defined MDS-RS, even after adjustments made to comply with criteria used in ICC-2022 for the diagnosis of MDS-SF3B1. 3 These findings are consistent with those previously published by us12 as well others.21 Taken together, these observations support the retention of MLD as a disease classifier in WHO4R-defined MDS-RS and suggest additional studies to clarify the role of SF3B1 mutation in a similar capacity, especially considering its promiscuity across the spectrum of myeloid neoplasms, with or without ring sideroblasts.21,22
Disclosures
No conflicts of interest to disclose
Contributions
AT designed the study, performed analyses and wrote the paper. FF and MA collected data. AM, MP, AA, MAE, KHB, CCH, WJH, AP, MRL and NG contributed patients. RK reviewed cytogenetic studies. DAA, AO, RH and KR provided pathological expertise. All authors reviewed and approved the final draft.
Data-sharing statement
Data will be shared by email request addressed to the corresponding author.
interaction between bone marrow morphology and SF3B1 and ASXL1 mutations in myelodysplastic syndromes with ring sideroblasts. Blood Cancer J. 2018;8(2):18.
6. Buckstein R, Chodirker L, Mozessohn L, et al. A natural history of lower-risk myelodysplastic syndromes with ring sideroblasts: an analysis of the MDS-CAN registry. Leuk Lymphoma. 2022;63(13):3165-3174.
7 Migdady Y, Barnard J, Al Ali N, et al. Clinical outcomes with ring sideroblasts and SF3B1 mutations in myelodysplastic syndromes: MDS clinical research consortium analysis. Clin Lymphoma Myeloma Leuk. 2018;18(8):528-532.
8. Vardiman JW, Thiele J, Arber DA, et al. The 2008 revision of the World Health Organization (WHO) classification of myeloid neoplasms and acute leukemia: rationale and important changes. Blood. 2009;114(5):937-951.
9. Khoury JD, Solary E, Abla O, et al. The 5th edition of the World Health Organization classification of haematolymphoid
tumours: myeloid and histiocytic/dendritic neoplasms. Leukemia. 2022;36(7):1703-1719.
10 Malcovati L, Stevenson K, Papaemmanuil E, et al. SF3B1-mutant MDS as a distinct disease subtype: a proposal from the International Working Group for the Prognosis of MDS. Blood. 2020;136(2):157-170.
11. Patnaik MM, Hanson CA, Sulai NH, et al. Prognostic irrelevance of ring sideroblast percentage in World Health Organizationdefined myelodysplastic syndromes without excess blasts. Blood. 2012;119(24):5674-5677.
12. Patnaik MM, Lasho TL, Hodnefield JM, et al. SF3B1 mutations are prevalent in myelodysplastic syndromes with ring sideroblasts but do not hold independent prognostic value. Blood. 2012;119(2):569-572.
13. Mangaonkar AA, Lasho TL, Finke C, et al. SF3B1-mutant myelodysplastic syndrome/myeloproliferative neoplasms: a unique molecular and prognostic entity. Haematologica. 2022;107(5):1189-1192.
14 Falantes JF, Marquez-Malaver FJ, Carrillo E, et al. SF3B1, RUNX1 and TP53 mutations significantly impact the outcome of patients with lower-risk myelodysplastic syndrome. Clin Lymphoma Myeloma Leuk. 2022;22(12):e1059-e1066.
15. Fenaux P, Platzbecker U, Mufti GJ, et al. Luspatercept in patients with lower-risk myelodysplastic syndromes. N Engl J Med. 2020;382(2):140-151.
16. Fattizzo B, Marchetti A, Zaninoni A, et al. Immunomodulatory
cytokines and clonal dynamics in low-risk myelodysplastic syndromes patients treated with luspatercept. Am J Hematol. 2023;98(11):e345-e348.
17 Platzbecker U, Della Porta MG, Santini V, et al. Efficacy and safety of luspatercept versus epoetin alfa in erythropoiesisstimulating agent-naive, transfusion-dependent, lower-risk myelodysplastic syndromes (COMMANDS): interim analysis of a phase 3, open-label, randomised controlled trial. Lancet. 2023;402(10399):373-385.
18. Farrukh F, Chetram D, Al-Kali A, et al. Real-world experience with luspatercept and predictors of response in myelodysplastic syndromes with ring sideroblasts. Am J Hematol. 2022;97(6):e210-e214.
19 Germing U, Strupp C, Giagounidis A, et al. Evaluation of dysplasia through detailed cytomorphology in 3156 patients from the Dusseldorf Registry on myelodysplastic syndromes. Leuk Res. 2012;36(6):727-734.
20. Swerdlow SH, Campo E, Harris NL, et al. WHO Classification of tumours of haematopoietic and lymphoid tissues. WHO revised 4th edition. Lyon: IARC; 2017.
21. Jafari PA, Sadeghian MH, Miri HH, et al. Prognostic significance of SF3B1 mutations in patients with myelodysplastic syndromes: a meta-analysis. Crit Rev Oncol Hematol. 2020;145:102832.
22. Cilloni D, Itri F, Bonuomo V, Petiti J. SF3B1 Mutations in hematological malignancies. Cancers (Basel). 2022;14(19):49.
LNK/SH2B3 as a novel driver in juvenile myelomonocytic leukemia
Astrid Wintering,1 Anna Hecht,2 Julia Meyer,1 Eric B. Wong,1 Juwita Hübner,1 Sydney Abelson,1 Kira Feldman,1 Vanessa E. Kennedy,3 Cheryl A.C. Peretz,1,4 Deborah L. French,5 Jean Ann Maguire,5 Chintan Jobaliya,5 Marta Rojas Vasquez,6 Sunil Desai,6 Robin Dulman,7 Eneida Nemecek,8 Hilary Haines,9 Mahmoud Hammad,10 Alaa El Haddad,10 Scott C. Kogan,11 Zied Abdullaev,12 Farid F. Chehab,13 Sarah K. Tasian,14,15 Catherine C. Smith,3,4 Mignon L. Loh16# and Elliot Stieglitz1,4#
1Department of Pediatrics, Benioff Children’s Hospital, University of California San Francisco, San Francisco, CA, USA; 2Department of Hematology/Oncology, Technical University of Munich, Munich, Germany; 3Division of Hematology/Oncology, Department of Medicine, University of California San Francisco, San Francisco, CA, USA; 4Helen Diller Comprehensive Cancer Center, University of California San Francisco, San Francisco, CA, USA; 5Center for Cellular and Molecular Therapeutics, The Children’s Hospital of Philadelphia, Philadelphia, PA, USA; 6Department of Pediatrics, University of Alberta, Edmonton, Canada; 7Pediatric Hematology and Oncology, Pediatric Specialists of Virginia, Fairfax, VA, USA; 8OHSU Knight Cancer Institute, Oregon Health and Science University, Portland, OR, USA; 9Children’s of Alabama, University of Alabama Hospital, Birmingham, AL, USA; 10National Cancer Institute, Cairo University, Cairo, Egypt; 11Department of Laboratory Medicine, University of California San Francisco, San Francisco, CA, USA; 12Laboratory of Pathology, Center for Cancer Research, National Cancer Institute, National Institutes of Health, Bethesda, MD, USA; 13Institute for Human Genetics, University of California San Francisco, San Francisco, CA, USA; 14Division of Oncology and Center for Childhood Cancer Research, Children’s Hospital of Philadelphia, Philadelphia, PA, USA; 15Department of Pediatrics and Abramson Cancer Center, University of Pennsylvania Perelman School of Medicine, Philadelphia, PA, USA and 16Ben Towne Center for Childhood Cancer Research, Seattle Children’s Research Institute, and the Department of Pediatrics, Seattle Children’s Hospital, University of Washington, Seattle, WA, USA
#MLL and ES contributed equally as senior authors.
Abstract
Correspondence: E. Stieglitz elliot.stieglitz@ucsf.edu
M. Loh
mignon.loh@seattlechildrens.org
Received: June 21, 2023.
Accepted: December 19, 2023. Early view: December 28, 2023.
Mutations in five canonical Ras pathway genes (NF1, NRAS, KRAS, PTPN11 and CBL) are detected in nearly 90% of patients with juvenile myelomonocytic leukemia (JMML), a frequently fatal malignant neoplasm of early childhood. In this report, we describe seven patients diagnosed with SH2B3-mutated JMML, including five patients who were found to have initiating, loss-of-function mutations in the gene. SH2B3 encodes the adaptor protein LNK, a negative regulator of normal hematopoiesis upstream of the Ras pathway. These mutations were identified to be germline, somatic or a combination of both. Loss of function of LNK, which has been observed in other myeloid malignancies, results in abnormal proliferation of hematopoietic cells due to cytokine hypersensitivity and activation of the JAK/STAT signaling pathway. In vitro studies of induced pluripotent stem cell-derived JMML-like hematopoietic progenitor cells also demonstrated sensitivity of SH2B3-mutated hematopoietic progenitor cells to JAK inhibition. Lastly, we describe two patients with JMML and SH2B3 mutations who were treated with the JAK1/2 inhibitor ruxolitinib. This report expands the spectrum of initiating mutations in JMML and raises the possibility of targeting the JAK/STAT pathway in patients with SH2B3 mutations.
Introduction
Juvenile myelomonocytic leukemia (JMML) is a rare and aggressive overlapping myelodysplastic/myeloproliferative disorder in toddlers with a median age at onset of approximately 2 years.1 Outcomes range from spontaneous remission in some patients to aggressive disease and transformation to acute myeloid leukemia in others. Most patients undergo hematopoietic cell transplantation (HCT) with curative intent. At diagnosis, a high white blood cell count with circulating immature myeloid cells, a peripheral monocytosis, nucleated red blood cells, thrombocytopenia, elevated fetal hemoglobin, and splenomegaly are typically observed. Fever, cough, bloody stools, and failure to thrive may also be present. Bone marrow aspirates must display fewer than 20% blasts and can have varying degrees of abnormal erythro-, myelo- and megakaryo-poiesis. Historically, laboratory features including hypersensitivity of myeloid progenitor cells to granulocyte-macrophage colony-stimulating factor (GM-CSF) in colony-forming assays or hyperphosphorylation of STAT5 of CD38-positive cells were used to establish a diagnosis of JMML.2 Currently, next-generation sequencing is considered standard-ofcare and allows for an accurate diagnosis as nearly all patients with JMML (~95%) have mutations detected in the Ras/MAPK signaling pathway genes including CBL, KRAS, NF1, NRAS, RRAS, RRAS2, and PTPN11 3-6 The vast majority of these driver mutations are mutually exclusive and can be acquired in a germline and/or somatic configuration. One consequence of these mutations is hyperactivation of the Ras/MAPK pathway, including Raf/MEK/ERK. Secondary mutations at a lower allele frequency are often found outside the canonical Ras pathway and include alterations in transcription factors, epigenetic regulating genes, and the spliceosome complex. These additional mutations contribute to disease progression and predict poor outcome.3,5 In addition to the commonly mutated genes listed above, oncogenic fusion proteins that lead to hyperactive Ras signaling,7-10 as well as mutations in other genes encoding for proteins upstream of the Ras pathway (e.g. FLT3) have been described in rare patients.10,11 One of these upstream proteins is the lymphocyte adaptor protein LNK that is encoded by the SH2B3 gene on chromosome 12q24.12. We previously identified seven patients with secondary mutations in SH2B3 in a genomic characterization of 100 patients with JMML.3 Herein, we report seven new patients, including five with initial mutations in SH2B3 and two with secondary SH2B3 mutations. We also show that SH2B3-mutated induced pluripotent stem cell (iPSC)-derived JMML-like hematopoietic progenitor cells (HPC) are sensitive to JAK inhibitors, including ruxolitinib and momelotinib. Importantly, we describe two patients with SH2B3-mutated JMML treated with ruxolitinib who experienced clinical responses, highlighting the potential relevance of this precision medicine approach in JMML.
Methods
Primary patients’ samples
The patients’ guardians provided informed consent to this study which was reviewed and approved by the institutional review board of the University of California San Francisco (institutional review board number: 10-0421) in accordance with the Declaration of Helsinki. Genomic DNA from peripheral blood, bone marrow or buccal swabs was extracted using standard protocols. DNA samples were sequenced using a custom amplicon-based targeted sequencing approach. Methylation profiles were analyzed according to previously published protocols12 and annotated according to the international, consensus definition.13 Additional details are described in the Online Supplementary Methods.
Generation of induced pluripotent stem cells
Primary JMML and control samples were obtained at Benioff Children’s Hospital at the University of California San Francisco or received from other pediatric institutions via a locally-approved institutional review board research protocol. Ficoll-purified mononuclear cells from bone marrow were reprogrammed by using the Sendai virus expressing doxycycline-regulated OCT4, KLF4, MYC, and SOX2 as previously described at the Children’s Hospital of Philadelphia.14 All iPSC studied fulfilled standard pluripotency criteria, including expression of endogenous pluripotency markers, silencing of Sendai virally-encoded reprogramming genes, and formation of all three germ-cell layers. A list of iPSC generated for this study can be found in Online Supplementary Table S1.
Differentiation of induced pluripotent stem cells to hematopoietic progenitor cells
Control and JMML iPSC were differentiated by culturing cells in serum-free media with sequential combinations of cytokines (all growth factor reagents from R&D Systems) to support multipotent hematopoietic progenitor formation as previously described.15 Additional details are described in the Online Supplementary Methods.
Cell viability assay
The half-maximal inhibitory concentration (IC50) for each kinase inhibitor was determined by performing luminescence-based Cell Titer Glo assays (Promega) according to the manufacturer’s protocol with readout at 72 hours (h). Each agent (ruxolitinib, momelotinib, tofacitinib) was tested at three different times with each concentration tested in triplicate.
Induced pluripotent stem cell-derived hematopoietic progenitor cell drug discovery screen
A small molecule discovery screen was performed, in collaboration with the University of California San Francisco Small Molecule Discovery Center, in HPC collected on day 10 of monolayer differentiation from iPSC carrying mutations.
Five thousand HPC were plated into each well of a 384-well assay plate in 50 µL of HPC-propagating media and treated with the compound library of approximately 2,000 bioactive substances at 125 nM for 72 h in triplicate. The effect on viability was measured using Cell Titer Glo assays as above. Percent inhibition was calculated relative to positive and negative controls with the negative control equivalent to 0% inhibition (no compound added) and the positive control equivalent to 100% inhibition (no cells added). Percent inhibition of each mutant line was then compared to the percent inhibition of the wild-type/non-mutant (WT) control. Additionally, hits against single-mutant HPC were compared with hits against double-mutant HPC. Statistical analyses and graphic data display were performed with R (version 3.6).
Single-cell DNA and protein sample preparation, sequencing, and data analysis
Unsorted mononuclear cells from patient UPN2861 at the time of diagnosis were analyzed using a single-cell microfluidic approach with molecular barcode technology. Details of this approach, including generation of the phylogenetic tree, are described in the Online Supplementary Methods (including Online Supplementary Table S5).
Results
SH2B3 mutations frequently co-occur with PTPN11
In patients who met criteria for JMML we identified germline and/or somatic mutations in SH2B3 that resulted in a truncated LNK protein or affected the biologically import-
ant SH2 domain (Figure 1, Online Supplementary Figure S2). Molecular and clinical characteristics of the seven patients reported for the first time are summarized in Tables 1 and 2, respectively. Including previously reported cases,3 seven of 14 patients with SH2B3-mutated JMML also harbored somatic PTPN11 mutations.
To investigate the cooperative nature of SH2B3 and PTPN11 mutations, we generated iPSC-derived HPC with one or both mutations. To confirm that HPC recapitulate JMML, we performed colony-formation assays at increasing doses of GM-CSF. While WT HPC formed almost no colonies in the absence of GM-CSF, PTPN11-mutant and PTPN11/SH2B3-mutant HPC formed significantly more colonies ( P=0.0004 for WT vs. PTPN11 and P<0.0001 for WT vs. PTPN11/SH2B3) (Online Supplementary Figure S3A). Mutant HPC derived from iPSC showed spontaneous proliferation independent of GM-CSF, an important hallmark of JMML. Elevated signaling of STAT5 and ERK, another characteristic of JMML cells, was also observed in HPC, more prominently in the PTPN11/SH2B3 double-mutant HPC (Online Supplementary Figure S3B).
Drug discovery screen identified JAK inhibitors with differential effects on cell proliferation depending on mutational background
In an independent high-throughput drug discovery screen performed using single- and double-mutant iPSC-derived JMML-like HPC, we identified multiple JAK1/2 inhibitors
Figure 1. Schematic overview of SH2B3 including the location of both primary and secondary mutations described in juvenile myelomonocytic leukemia. The top row shows the mutations of the seven novel patients reported here; the bottom row shows the location of the mutations previously reported by our group.3 Mutations that are considered to initiate juvenile myelomonocytic leukemia are highlighted in red boxes. Alterations that co-exist with a PTPN11 mutation are displayed with a dashed line. DD: dimerization domain; PH: pleckstrin homology domain; SH2; Src homology 2 domain; n/a: not available.
among the top ten compounds that showed a greater inhibition of PTPN11/SH2B3-mutant HPC compared to PTPN11-mutant HPC (Figure 2A, Online Supplementary Table S2).
SH2B3-mutant hematopoietic progenitor cells are more sensitive to JAK inhibitor therapy To validate the drug discovery screen, we analyzed cell
proliferation of iPSC-derived HPC with different mutational backgrounds after exposure to various JAK inhibitors, including ruxolitinib, momelotinib, and tofacitinib. HPC with alterations in SH2B3 were more sensitive to chemical JAK inhibition compared to HPC not harboring mutations in SH2B3. This finding was observed for all JAK inhibitors but was most striking for ruxolitinib (Figure 2B).
Table 1. Molecular characteristics of the seven patients with SH2B3 mutations.
Table 2. Clinical characteristics of the seven patients with SH2B3 mutations.
Single-cell sequencing revealed the phylogenetic origin in a patient with concomitant SH2B3 and PTPN11 mutations
We identified a patient with a PTPN11 p.A72T mutation at an unusually high variant allele frequency (VAF) (83%) along with a SH2B3 p.M268I mutation (VAF 86%). This previously healthy 4-year-old male (UPN2861) was diagnosed with JMML after presenting with petechiae and splenomegaly and a complete blood count showing leukocytosis (white blood cell count 501x109/L), severe thrombocytopenia (platelet count 13x109/L), and monocytosis (absolute monocyte count >8x10⁹/L). Fetal hemoglobin was elevated at 65% and cytogenetic and fluorescence in situ hybridization (FISH) analyses were normal. To determine the sequence of mutational acquisition, single-cell sequencing was performed, which revealed that a somatic SH2B3 p.M268I was the initial mutation, and then branched into a PTPN11 p.A72T population and a homozygous SH2B3 p.M268I population
(Figure 3, Online Supplementary Table S3).
Homozygous or heterozygous SH2B3 mutations in the germline can lead to juvenile myelomonocytic leukemia
Recognizing that mutations in SH2B3 can initiate JMML, we screened additional JMML patients without any known driver mutation. A male (UPN3426) with consanguineous parents was born at a gestational age of 33 weeks by Cesarean section because of intrauterine growth retardation and was found to have intracranial and intrahepatic calcifications, hepatosplenomegaly, and thrombocytopenia as well as leukocytosis with monocytosis. An extensive infectious disease workup was negative. Bone marrow examination (Online Supplementary Figure S1C, D) revealed 9% myeloblasts and cytogenetic analysis demonstrated a normal male karyotype. A diagnosis of JMML was established. The patient developed progressive splenomegaly, portal hypertension and transfusion dependency and was started on low-dose
Figure 2. SH2B3-mutated hematopoietic progenitor cells are more sensitive to JAK inhibitor therapy. (A) Linear regression plot of a high throughput drug discovery screen comparing drug inhibition of PTPN11/SH2B3 double-mutant hematopoietic progenitor cells (HPC) versus PTPN11 single-mutant HPC. The top ten hits that inhibited growth of double-mutant HPC to a greater extent than that of single-mutant HPC include two JAK inhibitors: momelotinib and CEP-33779. (B) Cell viability assay readout 72 hours after exposing two different induced pluripotent stem cell-derived HPC lines to ruxolitinib or momelotinib. Data for tofacitinib are not shown. HPC: hematopoietic progenitor cells.
cytarabine and 6-mercaptopurine. Symptoms improved and both medications were eventually discontinued by 20 months of life. The patient has since developed thrombocytosis (platelet counts 800-1,200x109/L) and continues to have splenomegaly but is otherwise asymptomatic and thriving. Next-generation sequencing identified a germline SH2B3 p.L438R mutation (VAF 100%) in the patient and both parents were found to be heterozygous germline carriers of the same mutation.
A female (UPN3436) with consanguineous parents was born at term via Cesarean section and was found to have low birth weight and hepatosplenomegaly. She was admitted because of neonatal jaundice. At the age of 4 months, she presented with recurrent fever and diarrhea. A complete blood count demonstrated leukocytosis, anemia and thrombocytopenia. An extensive infectious and metabolic disease workup was negative. Bone marrow examination revealed dysmegakaryopoiesis with 4% blasts (Online Supplementary Figure S1E, F). A diagnosis of JMML was established and the patient underwent HCT. Next-generation sequencing of a peripheral blood sample revealed a SH2B3 p.R392Q mutation (VAF 100%). Sanger sequencing of a buccal swab demonstrated the same homozygous SH2B3 mutation. Parental DNA was not available for testing.
A 2-month-old female (UPN1744) presented with leukocytosis, thrombocytopenia and splenomegaly. A peripheral blood smear demonstrated circulating myeloid precursor cells and a bone marrow aspirate was consistent with JMML. She was treated briefly with low-dose cytarabine before receiving a 4/6 human leukocyte antigen-matched unrelated cord blood transplant after conditioning with busulfan, cyclophosphamide, melphalan and anti-thymocyte globulin. The patient developed chronic graft-versus-host disease of the skin but is currently alive and well with no signs of disease 14 years after the transplant. Next-generation sequencing of the peripheral blood identified a SH2B3 p.Q251* mutation (VAF 63%). Sanger sequencing of T cells confirmed the same heterozygous mutation in the germline. Parental DNA was not available for testing.
Ruxolitinib led to resolution of splenomegaly in a patient with secondary SH2B3 mutations
A previously healthy, 5-year-old female (UPN3037) presented with fever, leukocytosis, monocytosis, thrombocytopenia and splenomegaly. Fetal hemoglobin was elevated at 63.3% and bone marrow examination showed 6% atypical myeloid blasts. Cytogenetic and FISH analyses were normal. DNA sequencing detected a primary mutation in PTPN11 p.E76V (VAF 46%) and two secondary SH2B3 mutations including p.Q408fs (VAF 38%) and p.E523fs (VAF 18%). The diagnosis of JMML was established and the patient was started on ruxolitinib treatment at a dose of 50 mg/m2 by mouth twice a day. Ten days into ruxolitinib monotherapy, the patient’s white blood cell count and monocytosis had decreased and abdominal ultrasound showed resolution of splenomegaly.
Bone marrow examination following 10 days of ruxolitinib monotherapy revealed that the VAF of the SH2B3 mutation at p.Q408fs had decreased to 22%, while the SH2B3 mutation at p.E523fs was no longer detectable. However, the PTPN11 p.E76V mutation was unchanged, and a new NRAS p.G12D mutation was detected at a VAF of 4% (Figure 4). Fludarabine 30 mg/m2 daily for 5 days and cytarabine 2 g/m2 daily for 5 days were added to ruxolitinib, but the patient experienced progressive disease. The patient was then treated sequentially with trametinib and azacitidine but progressed after each treatment. The girl received a haploidentical HCT from her mother following a condition-
Figure 3. Phylogenetic tree in a patient with juvenile myelomonocytic leukemia. The phylogenetic tree at diagnosis in patient UPN2861 was inferred from single-cell sequencing and single-cell inference of tumor evolution (SCITE), a probabilistic model using a flexible Markov-chain Monte Carlo algorithm.37 A heterozygous SH2B3 p.M268I was the initiating mutation, which then branched into a PTPN11 population and a homozygous SH2B3 population. The PTPN11 population finally branched into WT1 and IKZF1 clones. HET: heterozygous; HOM: homozygous.
Figure 4. Molecular response of patient UPN3037 who harbored a PTPN11 and two SH2B3 mutations at diagnosis. Following 10 days of ruxolitinib monotherapy, the SH2B3 mutation at codon 523 was no longer detectable, and the allele frequency of the SH2B3 mutation at codon 408 decreased from 38% to 11%. VAF: variant allele frequency.
ing regimen with busulfan, cyclophosphamide, thiotepa, anti-thymocyte globulin and total body irradiation. She relapsed by day +90 and subsequently received a paternal haploidentical HCT. She developed idiopathic pulmonary syndrome and died of respiratory failure in a molecular remission from JMML at day +60.
Ruxolitinib as a bridge to hematopoietic stem cell transplantation in a patient with SH2B3-mutated juvenile myelomonocytic leukemia
A 4-month-old male (UPN3160) was diagnosed with JMML after presenting with anemia, leukocytosis with peripheral monocytosis, 5% circulating myeloblasts, and hepatosplenomegaly. A bone marrow biopsy revealed myeloid hyperplasia (Online Supplementary Figure S1A) and cytogenetic and FISH analyses were normal. DNA sequencing revealed a SH2B3 p. M211fs*57 mutation at 50% VAF in the germline and 100% VAF in the tumor due to copy neutral loss of heterozygosity from 12q21.1 to 12q24.33. The germline mutation was discovered to be maternally inherited. A diagnosis of JMML was made and the patient was started on 6-mercaptopurine, but splenomegaly persisted. The patient was then started on ruxolitinib monotherapy at a dose of 15 mg/ m2 by mouth twice daily which led to complete resolution of splenomegaly, but no change in the VAF of the SH2B3 mutation, which remained at 100%. The patient continued on single-agent ruxolitinib as a bridge to HCT and is now in a molecular remission 2 years after the transplant.
Discussion
LNK is a member of the SH2-B family of adaptor proteins that share three functional domains: a dimerization domain at the N terminus, a central pleckstrin homology (PH) domain and a C-terminal Src homology 2 (SH2) domain. LNK is mainly expressed in hematopoietic cells, particularly in hematopoietic stem cells.16 Most of the protein remains in the cytoplasm, specifically in the perinuclear region.17,18 However, the PH domain allows for binding to the plasma membrane via interaction with membrane phospholipids. The SH2 domain is responsible for most of the biological effects of LNK through interaction with phosphorylated signaling partners including cytokine and tyrosine kinase receptors (EPO, TPO, SCF) and kinases (JAK2).19,20 The generation of LNK-deficient mice elucidated the role of LNK in hematopoiesis: Lnk-/- mice developed features of myeloproliferative disease including splenomegaly, increased numbers of myeloid progenitors and extramedullary hematopoiesis.16,21 A significant accumulation of pro- and pre-B cells was also noted in Lnk-/- mice, demonstrating a role of LNK as a negative regulator in B-lymphopoiesis.22 These findings are thought to be caused (at least in part) by the hypersensitivity of Lnk-/- progenitors to several cytokines, with increased activation of STAT3, STAT5, AKT and
MAPK signaling pathways.23
It is therefore not surprising that mutations in SH2B3 have been identified in a variety of hematologic malignancies.24 Mutations in SH2B3 have been reported in 5-7% of patients with myeloproliferative neoplasms across all subtypes25-27 and increase up to 13% upon leukemic transformation.28 SH2B3 mutations have also been described in lymphoid malignancies, albeit at a much lower frequency.27,29 In a previous study of 100 patients with JMML, we identified the first seven patients with SH2B3 mutations.3 While six of the previously reported patients harbored secondary SH2B3 mutations in addition to known JMML driver mutations such as NF1 or PTPN11, one patient had a germline heterozygous SH2B3 mutation without additional somatic mutations (Online Supplementary Table S4). Here, we present five patients with initial mutations and two patients with secondary mutations in SH2B3 (Table 1). Due to the absence of other disease-driving alterations in patients UPN3426, UPN3436, and UPN3160 as well as a lower allele frequency for the NF1 mutation in UPN1744 (Table 1), we presume that SH2B3 mutations initiated JMML in these four patients. Phylogenetic analysis of a sample from UPN2861 using single-cell DNA sequencing determined that the initiating mutation was in SH2B3, which then branched into discrete subclones, one of which acquired a secondary PTPN11 mutation. Methylation profiling showed a low methylation signature for patients UPN3426, UPN3436, and UPN3160 harboring a germline SH2B3 mutation. Patients UPN2861, UPN3037 and UPN2823, who had multiple mutations present at diagnosis, were categorized as having high methylation signatures. These data are consistent with previous reports that altered methylation frequently accompanies the presence of secondary mutations.5,13,30 Several groups have functionally validated SH2B3 mutations and demonstrated that point mutations in the PH domain impair translocation to the plasma membrane and thus reduce its regulatory function,18 while mutations in the SH2 domain affect the interaction with JAK/STAT and result in a more severe phenotype.19,20 The mutations identified here result in a truncated protein (patients UPN3160, UPN2823 and UPN1744) or affect the biologically important SH2 domain (patient UPN3426) (Figure 1). Interestingly, copy-neutral loss of heterozygosity of SH2B3 in patient UPN3160 associated with uniparental isodisomy is a mechanism that has been observed commonly in other cancers and specifically in JMML with CBL and NF1 mutations.31,32
In general, there is remarkable similarity between SH2B3-mutated JMML and CBL-mutated JMML. Both are associated with germline mutations (including heterozygous germline mutations without any somatic events), can occur in the context of a constitutional syndrome, can lead to upregulation of the JAK-STAT pathway, can be associated with copy-neutral loss of heterozygosity in the tumor, and is often manifested by a spontaneously remitting form of JMML. SH2B3-mutated JMML also shares similarities with
myeloproliferative disorders seen in infants with Noonan syndrome, most commonly caused by germline mutations in PTPN11. Both can present in the context of a constitutional syndrome and can manifest with a transient myeloproliferative disorder of infancy. Although limited by very small numbers, the severity of the myeloproliferation in our cohort appeared to differ based on whether the SH2B3 mutations were germline or somatic and whether the former were monoallelic or biallelic. In general, germline mutations were associated with less aggressive disease compared to somatic mutations. Larger studies will be required to validate these initial findings and to determine their exact classification as a myeloproliferative disorder, myeloproliferative neoplasm/ myelodysplastic syndrome or JMML.
A schematic overview of all SH2B3 mutations identified in JMML to date is highlighted in Figure 1. We observed a striking association between SH2B3 and PTPN11 with seven of 14 patients harboring both mutations ( Online Supplementary Figure S4). Of note, SH2B3 and PTPN11 are located in close proximity at 12q24.12 and 12q24.13, respectively. We observed copy neutral loss of heterozygosity causing elevated VAF in SH2B3 and PTPN11 above what is typically observed in cases with PTPN11 mutations alone.
To model the cooperative nature of these mutations, we engineered iPSC-derived HPC with one or both mutations and observed increased pSTAT5 and pERK signaling in the cells with both mutations compared to one alone. Since in vitro data showed that loss of LNK results in increased JAK/STAT signaling, we hypothesize that this cohort of patients may benefit from JAK inhibitor therapy. Our data from iPSC-derived JMML-like HPC show that those cells with secondary SH2B3 mutations are more sensitive to JAK inhibitors, including ruxolitinib and momelotinib, which are approved by the Food and Drug Administration and European Medicine Agency or under clinical investigation in adults with myeloproliferative neoplasms.33-35 It is important to note that our iPSC data highlight the efficacy of ruxolitinib in SH2B3-mutated JMML but cannot provide insight into the potential relevance of the sequence to acquisition of each mutation. Our findings are consistent with those of a previous study in iPSC which also demonstrated that JAK inhibitor therapy could be beneficial in CBL-mutated JMML.36 Following a 10-day course of treatment with ruxolitinib, patient UPN3037, who harbored a PTPN11 and two SH2B3 alterations at diagnosis, had a decrease in white blood cell count and improved splenomegaly. Importantly, the SH2B3 p.E523fs mutation was no longer detectable and the SH2B3 p.Q408fs allele frequency was reduced from 38% to 11% (Figure 4) while the patient was receiving ruxolitinib monotherapy. However, ruxolitinib did not have any appreciable effect on the initiating PTPN11 mutation and the patient experienced progressive disease. Additionally, patient UPN3160 experienced a rapid resolution of splenomegaly after one cycle of ruxolitinib monotherapy and this treatment served as a bridge to HCT.
We have previously reported on a JMML patient with a heterozygous germline SH2B3 mutation.3 Here, we have shown that heterozygous germline SH2B3 mutations can become homozygous in hematopoietic cells due to copy-neutral loss of heterozygosity and that homozygous germline SH2B3 mutations can all converge on causing JMML. Lastly, we identified a patient with PTPN11 and SH2B3-mutated JMML who, we have now shown using-single cell sequencing, had an initiating somatic mutation in SH2B3.
In summary, this report expands the spectrum of driver mutations in JMML that lead to MAPK activation to include SH2B3, and highlights JAK/STAT inhibition as a possible targeted treatment for these patients.
Disclosures
No conflicts of interest to disclose.
Contributions
AW performed experiments, analyzed data, and wrote the manuscript. AH performed experiments, analyzed data, and edited the manuscript. JM performed experiments and the bioinformatic analysis. FC helped with the bioinformatic analysis; EBW, JH, SA, and KF performed experiments. VEK, CACP, DLF, CJ, and JAM performed experiments and analyzed data. JM, JH, MRV, SD, RD, EN, FFC, SKT, HH, MH, AEH, SCK, and CCS analyzed data. MLL and ES designed and supervised the project and edited the manuscript. All authors contributed to and approved the final version of the manuscript.
Acknowledgments
The authors acknowledge the patients and their families for consenting to a JMML research study. We would like to thank Brian Lockhart and Dr. Gerald Wertheim at the Children’s Hospital of Philadelphia for assistance with patients’ specimens.
Funding
This work was supported by National Institutes of Health, National Heart, Lung, and Blood Institute grant K08HL135434 (ES); National Institutes of Health, National Cancer Institute grants 1U54CA196519 (MLL, ES); 1R37CA266550 (MLL, ES); the Pediatric Cancer Research Foundation (ES); the Frank A. Campini Foundation (ES); the Leukemia and Lymphoma Society grant R6511-19 (MLL); the Coco Laziridis Foundation for JMML Research (SKT); and the German Cancer Aid (AW). SKT is a Scholar of the Leukemia & Lymphoma Society and holds the Joshua Kahan Endowed Chair in Pediatric Leukemia Research at the Children’s Hospital of Philadelphia. MLL is the Aldarra Foundation, June and Bill Boeing, Founders, Endowed Chair of Pediatric Oncology.
Data-sharing statement
Data are available for download from dbGaP: https://www. ncbi.nlm.nih.gov/projects/gap/cgi-bin/study.cgi?study_ id=phs002504.v1.p1.
References
1. Locatelli F, Niemeyer CM. How I treat juvenile myelomonocytic leukemia. Blood. 2018;125(7):1083-1091.
2. Emanuel PD, Bates LJ, Castleberry RP, Gualtieri RJ, Zuckerman KS. Selective hypersensitivity to granulocyte-macrophage colony-stimulating factor by juvenile chronic myeloid leukemia hematopoietic progenitors. Blood. 1991;77(5):925-929.
3. Stieglitz E, Taylor-Weiner AN, Chang TY, et al. The genomic landscape of juvenile myelomonocytic leukemia. Nat Genet. 2015;47(11):1326-1333.
4. Caye A, Strullu M, Guidez F, et al. Juvenile myelomonocytic leukemia displays mutations in components of the RAS pathway and the PRC2 network. Nat Genet. 2015;47(11):1334-1340.
5. Murakami N, Okuno Y, Yoshida K, et al. Integrated molecular profiling of juvenile myelomonocytic leukemia. Blood. 2018;131(14):1576-1586.
6. Wintering A, Dvorak CC, Stieglitz E, Loh ML. Juvenile myelomonocytic leukemia in the molecular era: a clinician’s guide to diagnosis, risk-stratification, and treatment. Blood Adv. 2021;5(22):4783-4793.
7 Buijs A, Bruin M. Fusion of FIP1L1 and RARA as a result of a novel t(4;17)(q12;q21) in a case of juvenile myelomonocytic leukemia. Leukemia. 2007;21(5):1104-1108.
8. Morerio C, Acquila M, Rosanda C, et al. HCMOGT-1 is a novel fusion partner to PDGFRB in juvenile myelomonocytic leukemia with t(5;17)(q33;p11.2). Cancer Res. 2004;64(8):2649-2651.
9 Byrgazov K, Kastner R, Dworzak M, et al. A novel fusion gene NDEL1-Pdgfrb in a patient with JMML with a new variant of TKI-resistant mutation in the kinase domain of PDGFRβ. Blood. 2014;124(21):613.
10. Chao AK, Meyer JA, Lee AG, et al. Fusion driven JMML: a novel CCDC88C–FLT3 fusion responsive to sorafenib identified by RNA sequencing. Leukemia. 2020;34(2):662-666.
11. Gratias EJ, Liu YL, Meleth S, Castleberry RP, Emanuel PD. Activating FLT3 mutations are rare in children with juvenile myelomonocytic leukemia. Pediatr Blood Cancer. 2005;44(2):142-146.
12. Behnert A, Meyer J, Parsa J-Y, et al. Exploring the genetic and epigenetic origins of juvenile myelomonocytic leukemia using newborn screening samples. Leukemia. 2022;36(1):279-282.
13. Schönung M, Meyer J, Nöllke P, et al. International consensus definition of DNA methylation subgroups in juvenile myelomonocytic leukemia. Clin Cancer Res. 2020;27(1):158-168.
15. Mills JA, Paluru P, Weiss MJ, Gadue P, French DL. Hematopoietic differentiation of pluripotent stem cells in culture. Methods Mol Biol. 2014;1185:181-194.
16. Velazquez L, Cheng AM, Fleming HE, et al. Cytokine signaling and hematopoietic homeostasis are disrupted in Lnk-deficient mice. J Exp Med. 2002;195(12):1599-1611.
17. Li Y, He X, Schembri-King J, Jakes S, Hayashi J. Cloning and characterization of human Lnk, an adaptor protein with pleckstrin homology and Src homology 2 domains that can inhibit T cell activation. J Immunol. 2000;164(10):5199-5206.
18. Gery S, Gueller S, Chumakova K, Kawamata N, Liu L, Koeffler HP. Adaptor protein Lnk negatively regulates the mutant MPL, MPLW515L associated with myeloproliferative disorders. Blood. 2007;110(9):3360-3364.
19 Tong W, Zhang J, Lodish HF. Lnk inhibits erythropoiesis and Epo-dependent JAK2 activation and downstream signaling pathways. Blood. 2005;105(12):4604-4612.
20 Bersenev A, Wu C, Balcerek J, Tong W. Lnk controls mouse hematopoietic stem cell self-renewal and quiescence through direct interactions with JAK2. J Clin Invest. 2008;118(8):2832-2844.
21. Takaki S, Morita H, Tezuka Y, Takatsu K. Enhanced hematopoiesis by hematopoietic progenitor cells lacking intracellular adaptor protein, Lnk. J Exp Med. 2002;195(2):151-160.
22. Takaki S, Sauer K, Iritani BM, et al. Control of B cell production by the adaptor protein lnk. Definition of a conserved family of signal-modulating proteins. Immunity. 2000;13(5):599-609.
23. Takizawa H, Eto K, Yoshikawa A, Nakauchi H, Takatsu K, Takaki S. Growth and maturation of megakaryocytes is regulated by Lnk/Sh2b3 adaptor protein through crosstalk between cytokine- and integrin-mediated signals. Exp Hematol. 2008;36(7):897-906.
24. Maslah N, Cassinat B, Verger E, Kiladjian JJ, Velazquez L. The role of LNK/SH2B3 genetic alterations in myeloproliferative neoplasms and other hematological disorders. Leukemia. 2017;31(8):1661-1670.
25. McMullin MF, Cario H. LNK mutations and myeloproliferative disorders. Am J Hematol. 2016;91(2):248-251.
26. Gundabolu K, Dave BJ, Alvares CJ, et al. The missing LNK: evolution from cytosis to chronic myelomonocytic leukemia in a patient with multiple sclerosis and germline SH2B3 mutation. Case Rep Genet. 2022:2022:6977041.
27. Perez-Garcia A, Ambesi-Impiombato A, Hadler M, et al. Genetic loss of SH2B3 in acute lymphoblastic leukemia. Blood. 2013;122(14):2425-2432.
28. Pardanani A, Lasho T, Finke C, Oh ST, Gotlib J, Tefferi A. LNK mutation studies in blast-phase myeloproliferative neoplasms, and in chronic-phase disease with TET2, IDH, JAK2 or MPL mutations. Leukemia. 2010;24(10):1713-1718.
29 Zhang J, Ding L, Holmfeldt L, et al. The genetic basis of early T-cell precursor acute lymphoblastic leukaemia. Nature. 2012;481(7380):157-163.
30 Stieglitz E, Mazor T, Olshen AB, et al. Genome-wide DNA methylation is predictive of outcome in juvenile myelomonocytic leukemia. Nat Commun. 2017;8(1):1-8.
31. Stephens K, Weaver M, Leppig KA, et al. Interstitial uniparental isodisomy at clustered breakpoint intervals is a frequent mechanism of NF1 inactivation in myeloid malignancies. Blood. 2006;108(5):1684-1689.
32. Le DT, Kong N, Zhu Y, et al. Somatic inactivation of Nf1 in hematopoietic cells results in a progressive myeloproliferative disorder. Blood. 2004;103(11):4243-4250.
33. Xu L, Feng J, Gao G, Tang H. Momelotinib for the treatment of myelofibrosis. Expert Opin Pharmacother. 2019;20(16):1943-1951.
34. Griesshammer M, Sadjadian P. The BCR-ABL1-negative myeloproliferative neoplasms: a review of JAK inhibitors in the therapeutic armamentarium. Expert Opin Pharmacother. 2017;18(18):1929-1938.
35. Pardanani A, Vannucchi AM, Passamonti F, Cervantes F, Barbui T, Tefferi A. JAK inhibitor therapy for myelofibrosis: critical assessment of value and limitations. Leukemia. 2011;25(2):218-225.
36. Tasian SK, Casas JA, Posocco D, et al. Mutation-specific signaling profiles and kinase inhibitor sensitivities of juvenile myelomonocytic leukemia revealed by induced pluripotent stem cells. Leukemia. 2018;33(1):181-190.
37. Jahn K, Kuipers J, Beerenwinkel N. Tree inference for single-cell data. Genome Biol. 2016;17:86.
Germline bi-allelic SH2B3/ LNK alteration predisposes to a neonatal juvenile myelomonocytic leukemia-like disorder
Chloé Arfeuille,1,2 Yoann Vial,1,2 Margaux Cadenet,1,2 Aurélie Caye-Eude,1,2 Odile Fenneteau,3 Quentin Neven,4 Adeline A. Bonnard,1,2 Simone Pizzi,5 Giovanna Carpentieri,5 Yline Capri,6 Katia Girardi,7 Lucia Pedace,7 Marina Macchiaiolo,8 Kamel Boudhar,9 Monia ben Khaled,10 Wadih Abou Chahla,11 Anne Lutun,12 Mony Fahd,4 Séverine Drunat,1 Elisabetta Flex,13 Jean-Hugues Dalle,4 Marion Strullu,2,4 Franco Locatelli,7,14 Marco Tartaglia5 and Hélène Cavé1,2
1Département de Génétique, Unité de Génétique Moléculaire, Hôpital Robert Debré, Assistance Publique des Hôpitaux de Paris (AP-HP), Paris, France; 2INSERM UMR_S1131, Institut de Recherche Saint-Louis, Université Paris-Cité, Paris, France; 3Service d’Hématologie Biologique, Hôpital Robert Debré, Assistance Publique des Hôpitaux de Paris (AP-HP), Paris, France; 4Service d’Onco-Hématologie Pédiatrique, Hôpital Robert Debré, Assistance Publique des Hôpitaux de Paris (AP-HP), Paris, France; 5Molecular Genetics and Functional Genomics, Bambino Gesù Children’s Hospital IRCCS, Rome, Italy; 6Département de Génétique, Unité de Génétique Clinique, Hôpital Robert Debré, Assistance Publique des Hôpitaux de Paris (AP-HP), Paris, France; 7Department of Hematology/Oncology and Cell and Gene Therapy, Bambino Gesù Children’s Hospital IRCCS, Rome, Italy; 8Rare Diseases and Medical Genetics, Bambino Gesù Children’s Hospital IRCCS, Rome, Italy; 9Service de Réanimation Néonatale, Hôpital Central de l’Armée, Alger, Algeria; 10Faculty of Medicine, University of Tunis El Manar and Pediatric Immunohematology Unit, Bone Marrow Transplantation Center Tunis, Tunis, Tunisia; 11Service d’Hématologie Pédiatrique, Centre Hospitalier Universitaire de Lille, Lille, France; 12Service d’Hématologie Pédiatrique, Centre Hospitalier Universitaire d’Amiens, Amiens, France; 13Department of Oncology and Molecular Medicine, Istituto Superiore di Sanità, Rome, Italy and 14Department of Pediatrics, Catholic University of the Sacred Heart, Rome, Italy
Abstract
Correspondence: Hélène Cavé helene.cave@aphp.fr
Received: July 13, 2023.
Accepted: November 7, 2023. Early view: November 16, 2023.
Juvenile myelomonocytic leukemia (JMML) is a rare, generally aggressive myeloproliferative neoplasm affecting young children. It is characterized by granulomonocytic expansion, with monocytosis infiltrating peripheral tissues. JMML is initiated by mutations upregulating RAS signaling. Approximately 10% of cases remain without an identified driver event. Exome sequencing of two unrelated cases of familial JMML of unknown genetics and analysis of the French JMML cohort identified 11 patients with variants in SH2B3, encoding LNK, a negative regulator of the JAK-STAT pathway. All variants were absent from healthy population databases, and the mutation spectrum was consistent with a loss of function of the LNK protein. A stoploss variant was shown to affect both protein synthesis and stability. The other variants were either truncating or missense, the latter affecting the SH2 domain that interacts with activated JAK. Of the 11 patients, eight from five families inherited pathogenic bi-allelic SH2B3 germline variants from their unaffected heterozygous parents. These children represent half of the cases with no identified causal mutation in the French cohort. They displayed typical clinical and hematologic features of JMML with neonatal onset and marked thrombocytopenia. They had a hypomethylated DNA profile with fetal characteristics and did not have additional genetic alterations. All patients showed partial or complete spontaneous clinical resolution. However, progression to thrombocythemia and immunity-related pathologies may be of concern later in life. Bi-allelic SH2B3 germline mutations thus define a new condition predisposing to a JMML-like disorder, suggesting that JAK pathway deregulation is capable of initiating JMML, and opening new therapeutic options.
Introduction
Juvenile myelomonocytic leukemia (JMML) is a rare, aggressive myeloproliferative neoplasm affecting in -
fants and young children. It is characterized by excessive granulomonocytic proliferation in bone marrow (BM) and peripheral blood (PB) leading to splenomegaly, leukocytosis with precursors in PB, monocytosis, infiltration of
peripheral tissues with histiocytes and normal or moderately increased blast count.1,2
The natural course of JMML is generally rapidly fatal. The only potentially curative treatment is BM transplantation. However, the disease is characterized by a highly heterogeneous course, with a third of patients progressing to acute leukemia, while about 10% have indolent forms or even spontaneous resolutions. 3
JMML arises from hematopoietic stem or myeloid progenitor cells.4-6 It is initiated by abnormal activation of RAS signaling, leading to in vitro hypersensitivity of myeloid progenitors to granulocyte-macrophage colony-stimulating factor.7 RAS pathway hyperactivation is due to mutations in genes encoding RAS proteins ( NRAS, KRAS ) or regulators ( PTPN11, NF1 or CBL ), 8,9 which define genetic and clinical subgroups. More rarely, activating mutations affecting other small G proteins (RRAS, RRAS2, RIT1) 10 have also been described, as well as fusions causing activation of genes coding for transducers upstream of the RAS pathway.11,12
A particular feature of JMML is its frequent occurrence in the context of a predisposing genetic syndrome, including Noonan syndrome, neurofibromatosis type 1 and CBL syndrome, which are due to a constitutional upregulation of the RAS-MAPK pathway (the so-called RASopathies).13-16 The identification of an activating mutation affecting the RAS pathway confirms the diagnosis of JMML in over 90% of cases.17 Nevertheless, there are still a small number of patients in whom no mutation has been identified (e.g., 5% in the French JMML cohort).
SH2B3 (OMIM 605093) encodes LNK (lymphocyte adaptor protein), an SH2-domain adaptor protein that acts as a negative regulator of intracellular signaling promoted by cytokines and growth factors activating the JAK-STAT pathway.18 Earlier work suggested that Lnk negatively regulates normal hematopoietic stem and progenitor cell expansion and self-renewal.19,20 Somatic SH2B3 variants have been reported in some JMML cases 21 and Sh2b3 -/mice develop a myeloproliferative neoplasm.22,23 Germline mono-allelic,24-27 or more rarely bi-allelic28,29 LNK lossof-function mutations have been previously identified in various hematologic diseases.
Here we provide evidence that bi-allelic germline inactivating variants in SH2B3 underlie a disease predisposing to a JMML-like disorder. We report 11 patients with SH2B3-associated JMML, including eight from five families who inherited bi-allelic pathogenic germline SH2B3 variants. SH2B3 -associated JMML represents a new specific entity characterized by extremely early onset, probable persistence of fetal features, and partial or complete spontaneous clinical resolution. JMML in this group of patients is clearly distinct from other forms of JMML as a whole, but also from the disease associated with germ-line mono-allelic or somatic mutations of SH2B3 that have previously been reported.
Methods
Patients
The study included 234 patients with JMML referred to the French reference laboratory between 1995 and 2023, and one family with two probands from the Bambino-Gesù Children’s Hospital (OPBG) in Rome, Italy.
The diagnosis of JMML was based on clinical and hematologic findings, centrally reviewed cytomorphological examination of PB and BM smears, and genetic screening of genes known to initiate JMML or differential diagnoses (Wiskott-Aldrich syndrome, GATA2, osteopetrosis). Absence of BCR::ABL1 and KMT2A rearrangements was checked. In patients with no RAS-related variant, the presence of rare fusions involving FLT3, ALK, and PDGFRA/B was assessed by RNA-sequencing analysis. Karyotyping was performed using standard procedures. All patients fulfilled the World Health Organization’s criteria for JMML.
Ethical approval
The study was approved by the institutional review board of “Hôpitaux Universitaires Paris Nord Val-de-Seine” in Paris (Ref: 00006477) and the OPBG in Rome (Ref: 1702_ OPBG_2018), in accordance with the Helsinki declaration.
Samples
BM or PB samples were obtained from the patients at the time of diagnosis of JMML and from the patients’ parents. Mononuclear cells were isolated on a Ficoll gradient (Eurobio). The constitutional origin of the variant(s) was assessed using skin-derived fibroblasts. Healthy controls used for methylation and RNA-sequencing assays were males of 9, 10 and 12 years of age. The fetal BM sample was obtained from the product of a spontaneous abortion at 15 weeks of gestation. Online Supplementary Figure S1 shows the analyses performed in patients.
Genome-wide DNA array analysis
Genomic DNA samples were analyzed by single-nucleotide polymorphism array technologies using the Genome-Wide GeneChip Human SNP Array 6.0 (Affymetrix), and/or high-density array comparative genomic hybridization.12
Whole-exome sequencing and whole-genome sequencing
Target enrichment was performed using the SureSelect Human All Exon V4+UTRs or SureSelect AllExon V5 (Agilent Technologies, Santa Clara, CA, USA), and captured regions were sequenced with a HiSeq2000 or NextSeq500 instrument (Illumina, San Diego, CA, USA), as previously described.12,33 Details are provided in the Online Supplementary Material
Sequencing the mRNA of mononucleated cells
Libraries were prepared with NEBNext Ultra II Directional
RNA Library Prep Kit, according to the supplier’s recommendations. Paired-end 100-bp read sequencing was performed on a NovaSeq platform. Image analysis and base calling were performed using Illumina Real Time Analysis (3.4.4) with default parameters. The bioinformatic pipeline is described in the Online Supplementary Information. Unsupervised analyses of gene expression and differential expression were conducted using the Galileo tool (IntegraGen), as described in the Online Supplementary Information
DNA methylation (capture enzymatic methyl sequencing)
Libraries were prepared using the Twist Targeted Methylation sequencing protocol system (Twist Bioscience) according to the guidelines and subjected to paired-end sequencing with 100-bp reads on a Novaseq 6000 platform (Online Supplementary Information). An unsupervised classification based on the 1,000 most variant 100 bp tiles was generated using hierarchical clustering (cosine distance, Ward method) in R software.
Further information
More details on the methods are provided in the Online Supplementary Material.
Results
Exome sequencing in two families segregating JMML identifies homozygous mutations in SH2B3
Trio exome sequencing was undertaken in proband #79.1 from the French JMML cohort, who suffered a syndromic neonatal JMML with no identified mutation. The analysis revealed the presence of a homozygous variant (c.1160G>C, p.Gly387Ala) in SH2B3 in the affected child. A review of the child’s records confirmed that he met the consensus clinical and hematologic criteria for the diagnosis of JMML, with hepatosplenomegaly, massive monocytosis (14×109/L), blasts, circulating myeloid precursors and thrombocytopenia (platelet count, 21×109/L) (Figure 1A; Online Supplementary Table S1). The BM smear showed hypercellularity associated with a decreased number of megakaryocytes. Spontaneous in vitro growth of myeloid progenitors was positive. The child’s brother (#79.2), born a few years later, also presented with neonatal JMML (Figure 1). Genetic analysis showed that he had inherited the familial SH2B3 mutation in a bi-allelic pattern. Independently, whole-exome sequencing was performed in a family having two siblings diagnosed with an unclassified neonatal-onset syndromic JMML at the OPBG (Rome, Italy). The proband, #OPBG-2, was diagnosed at the age of 1 month, with elevated leukocyte counts, monocytosis (4.2×10⁹/L), thrombocytopenia (platelet count, 41×109/L) and 3% myeloblasts (Figure 1B; Online Supplementary Ta-
ble S1). Immature monocytes and mild dysgranulopoiesis were observed in PB. Hypercellular BM, with granulocytic expansion, and 7% blasts, were consistent with a diagnosis of JMML. Similarly, his 5-year-old sister, #OPBG-1, had been diagnosed with JMML in the first days of life. Following delivery, she had splenomegaly and respiratory difficulties, which necessitated 24 h intubation. Her blood count showed leukocytosis (white blood cell count, 56×109/L), anemia (hemoglobin, 11.8 g/dL), and thrombocytopenia (platelet count, 35×109/L) (Online Supplementary Table S1). She experienced spontaneous resolution under active surveillance. Hypersensitivity of myeloid progenitor cells to granulocyte-macrophage colony-stimulating factor was observed in both children. Whole-exome analysis revealed the presence of a homozygous frameshift variant (c.1709dupA, p.Asn570LysfsTer82) in SH2B3 in both siblings.
Targeted sequencing of SH2B3 in the whole French JMML cohort
SH2B3 sequencing was then extended to the 234 patients of the French JMML cohort. Filtering out variants with a frequency >10-4 in the general population (GnomAD Non cancer v.2.1.1 database), at least one variant was identified in nine of the 234 (3.8%) patients, including six of the 12 (50%) mutation-negative cases ( Online Supplementary Figure S2). Searching for mutations in patients’ fibroblasts and/or in their parents revealed that, in eight of the nine patients, the SH2B3 variants identified were germline. Of these eight patients, six (from 4 families) carried bi-allelic SH2B3 variants (Figure 1C). In the remaining two patients, the germline SH2B3 variant was mono-allelic. Whole-genome sequencing was performed and ruled out an alteration of the second SH2B3 allele.
Variant segregation in six families showed that germline variants were always inherited from unaffected heterozygous parents (Figure 1C). In four families, all affected children inherited bi-allelic SH2B3 variants, consistent with an autosomal recessive transmission of JMML predisposition. Three of these families were consanguineous. In family #48, the mono-allelic germline SH2B3 variant in the affected child was inherited from the unaffected father. Only one of the 234 patients (#209) had an exclusively somatic SH2B3 variant.
Assessing variant pathogenicity
Including the Italian family, a total of seven different SH2B3 variants were identified. Among them, three were truncating (frameshift indels or stop codon), three were missense, and one caused protein elongation with a divergent C-terminus (Table 1; Figure 2A). Each variant was found as a single occurrence except p.Asp231Glyfs*39, which was found in two unrelated patients. All changes were predicted to be deleterious; none was referenced in the general population (Table 1) and, importantly, no homozygous truncating variant was referenced in gnomAD.
Based on the bi-allelic occurrence of variants, a loss-offunction effect was postulated as a functional consequence of the mutations identified. In line with this hypothesis, transient transfection experiments performed in 293T
cells documented a dramatically reduced stability of the p.Asn570Lys*82 LNK mutant as compared to the wild-type protein (Figure 2B). Besides this effect at the protein level, assessment of SH2B3 mRNA levels by real-time polymerase
Figure 1. Patients’ cytomorphological data and pedigrees. (A, B) May-Grünwald-Giemsa-stained smears showing cytomorphological features at diagnosis patients with of juvenile myelomonocytic leukemia (JMML). (A) Patients #79.1 (A1-4) and #79.2 (A5-8). (B) Patient #OPBG (B1, 2). Peripheral blood smears (A1-3; A5-8; B1) show monocytes (*Mo), myeloid precursors (*My), dysmorphic basophils (*Ba) and undifferentiated myeloid blasts (*Bl). Bone marrow smears (A4; B2) show hypercellularity with myeloid blasts and discrete signs of dysgranulopoiesis. The erythrocyte lineage is decreased and the megakaryocytic lineage is absent. (C) Pedigrees of patients with germline SH2B3 variants. All children, but none of the heterozygous parents, had JMML. Germline variants (dark blue) were either bi-allelic (full circle/square; families 1 to 4) or mono-allelic (half circle/square; families 5 and 6) in the affected child. Somatic alteration is indicated in light blue. aUPD: acquired uniparental isodisomy; JMML: juvenile myelomonocytic leukemia; ND: not done.
Table 1. Germline and somatic SH2B3 variants identified in patients with juvenile myelomonocytic leukemia (NM_005475.3).
Structural damage
Structural damage/ impaired target binding and reduced ability to inhibit signaling (Morris, Nat Com 2021)
Decreased transcript stability/processing and protein stability (this study)
COSMIC: Catalog of Somatic Mutations in Cancer; MAF: minor allele frequency; REVEL: rare exome variant ensemble learner; CADD: Combined Annotation Dependent Depletion; NA: not applicable.
Figure 2. SH2B3 variants and consequences on the LNK protein. (A) Lollipop plot showing the distribution of SH2B3/LNK variants over a schematic representation of the LNK protein. The PH domain enables interaction with cell membrane phospholipids and the SH2 domain binds to the phosphorylated tyrosines of target proteins. (B, C) A disease-causing SH2B3 stoploss frameshift mutation affects RNA and protein stability. (B) Protein stability was assessed in 293T cells transiently transfected with wild-type Xpress-tagged SH2B3 and mutant carrying the c.1709dupA (p.Asp570Lysfs82) mutation. After transfection (48 h), cells were treated with cycloheximide (20 μg/mL) for the indicated time or left untreated. Protein levels were assessed by immunoblotting, using an anti-Xpress monoclonal antibody. GAPDH levels are shown to document equal loading of total proteins from cell lysates. Western blot from a representative experiment of three performed is shown. (C) Quantitative polymerase chain reaction analysis performed on RNA extracted from fibroblasts taken from patients and controls shows a significant decrease of SH2B3 expression level indicating RNA decay of the allele carrying the SH2B3 variant. Data in the graph indicate fold change of SH2B3 in patients’ fibroblasts over that in control cells (WT), set as 1. GAPDH was used as an endogenous control. Histograms show mean values ± standard deviation of three independent experiments, each performed in triplicate. The analysis of expression was performed calculating the fold change using the 2−ΔΔCt formula and the results were statistically analyzed by PRISM7, using a two-tailed unpaired t test with the Bonferroni correction. ***P<0.001. (D) Three-dimensional structure of the SH2 domain of the LNK protein with the JAK2 phosphopeptide pY813 modeled from crystallographic data in the report from Morris et al 36 (PDB:7R8W). The position of variant amino acids was determined by structural homology between mouse and human SH2 domains. aa: amino acids; CHX: cycloheximide; WT: wild-type.
B D C
chain reaction in primary fibroblasts obtained from patient #OPBG-2 and an unaffected control provided evidence of a significantly reduced amount in the former, which was suggestive of reduced stability of the transcript carrying the variant (Figure 2C). Overall, these findings indicate a disruptive impact in terms of transcript stability/processing and protein stability. Similarly, all missense variants were found to target the SH2 domain, which mediates binding to phosphorylated JAK and contains only rare polymorphisms in the general population (Online Supplementary Figure S3). All three variants were predicted to damage the structure of the SH2 domain of the LNK protein (Figure 2D), likely resulting in a decreased capacity to bind its JAK2 target. Collectively, these findings are consistent with a loss of function of SH2B3 as a driver mechanism underlying JMML.
Hematologic and clinical features of patients with SH2B3 mutations
All patients presented with splenomegaly, high monocyte
counts and hematologic data meeting the updated World Health Organization’s consensus criteria for the diagnosis of JMML31 (Online Supplementary Table S1). Patients with bi-allelic germline mutations (n=8) had higher counts of white blood cells (P<0.001), monocytes (P=0.045) and lymphocytes (P=0.004) than those with mono-allelic/somatic (n=3) variants or patients from the whole JMML cohort (Table 2). This also held true when these patients were compared to patients with Noonan syndrome-associated JMML (Table 2) or with any of the genetic subgroups of JMML taken separately.9 Notably, all patients with SH2B3 alterations but one displayed marked thrombocytopenia and the median platelet count was significantly lower than in the whole JMML cohort (28×109/L vs. 64×109/L; P=0.02), with frequent lack of megakaryocytes in patients’ BM (Online Supplementary Table S1). BM cellularity was normal or increased, with predominant granulocytic proliferation. Mild dysplastic features were observed in about half of the patients. Blast cells were moderately elevated but lower
Table 2. Clinical and hematologic features of patients with SH2B3-mutated juvenile myelomonocytic leukemia (JMML) in comparison with patients with Noonan syndrome-JMML47 (Strullu et al., updated) and with the whole French JMML cohort (excluding patients with Noonan syndrome).
Peripheral blood
Hemoglobin concentration, g/dL, median (range)
Platelet count ×109/L , median (range)
WBC count ×109/L, median (range)
Monocyte count ×109/L, median (range)
Lymphocyte count ×109/L, median (range)
Myeloid precursors in peripheral blood, N of patients
In patients with bi-allelic germline mutations, JMML onset was neonatal. Most patients (5/6) were not transplanted and had spontaneous resolution. In striking contrast, the median age of onset of JMML with mono-allelic germline or somatic SH2B3 variants was 3.8 years, which is later than patients with bi-allelic germline SH2B3 variants. The former had a markedly more severe course compared to the latter, and have all undergone transplantation.
Longitudinal follow-up of patients with bi-allelic SH2B3 germline variants shows that after an initial period of thrombocytopenia associated with profound impairment of the megakaryocytic lineage, the children’s platelet counts increased rapidly, reaching above-normal levels in several of them, with even thrombocytosis in patient #79.2 (Online Supplementary Figure S4).
Genetic makeup of SH2B3 mutated JMML
To determine the mutational makeup of JMML associated with SH2B3 variants, genome-wide DNA array analysis and high-depth sequencing of recurrently mutated genes in JMML were carried out. Whole-genome sequencing was also performed on patients with available germline samples (Online Supplementary Figure S1). All patients with bi-allelic SH2B3 variants had a normal karyotype and none had deleterious variants in known JMML drivers. Extensive genetic analysis did not evidence any other germline or somatic pathogenic or likely pathogenic variant or copy number alteration (Figure 3).
In contrast, patients with a mono-allelic germline SH2B3 variant acquired several additional somatic variants. Regardless of their germline or somatic status, mono-allelic SH2B3 mutations were systematically associated with a PTPN11 mutation (Figure 3).
Figure 3. Clonal architecture of SH2B3 mutated juvenile myelomonocytic leukemia. Patients with a bi-allelic germline mutation of SH2B3 (red clones) (#79, #201, #216, #244) all have a monomorphic profile with no additional genetic alterations. Only patient #79.1 received a bone marrow transplant (upper panel). Patients with a germline mono-allelic SH2B3 mutation (#53, #48) and/or somatic SH2B3 mutation (orange clones) acquired several additional somatic mutations. Patient #53 had a somatic PTPN11 variant and patient #48 had somatic variants of PTPN11 and NF1, whose order of appearance could not be inferred from the allelic frequencies. Both patients underwent bone marrow transplantation (middle panel). In patient #209, the allelic frequency of the somatic SH2B3 variant was consistent with its presence in the full leukemia clone. Multiple other somatic alterations were acquired, including a driver somatic mutation in PTPN11. Here again, all potentially driver mutations were present at variant allele frequencies consistent with early co-occurrence during the course of the disease and order or appearance could not be determined (lower panel). JMML: juvenile myelomonocytic leukemia; BMT: bone marrow transplant; aUPD: acquired uniparental isodisomy.
Notably, two patients (#53; #209) with a mono-allelic SH2B3 truncating variant and a PTPN11 mutation subsequently acquired chromosome 12q uniparental disomy (12q21.1-q24.31 and 12q13.2-q24.31, respectively), resulting in copy-neutral loss of heterozygosity of the SH2B3 variants, but also of PTPN11, which is located on chromosome 12q24.13, close to SH2B3 (12q24.12). Such a pattern of events is rarely found in patients with PTPN11 mutations, which have a gain-of-function behavior, but is a typical mechanism for the complete inactivation of tumor suppressor genes. In our patients, it leads to the bi-allelic loss of function of LNK. Taken together, this supports the view that the loss of function of SH2B3 is a driving event in JMML in these cases as well. It is likely that the proximity to PTPN11 is the reason why a copy-neutral loss of heterozygosity is privileged over a simple deletion of SH2B3 in these cases.
DNA methylation profiling
DNA methylation was also analyzed. A reference group of 54 cases of JMML of known genetic groups and two samples (one postnatal BM, one prenatal BM) from healthy subjects were used for comparison. As expected, hierarchical clustering of reference samples delineated three main groups, corresponding to methylation-low, intermediate and high JMML subtypes. The patients with a mono-allelic germline (#53) or somatic (#209) SH2B3 mutation clustered within the intermediate and hypermethylated groups, respectively. In contrast, samples with bi-allelic germline SH2B3 variants defined a distinct cluster (cluster 1) with the strongest hypomethylation pattern (Figure 4A). Interestingly, the prenatal BM clustered with the SH2B3 cluster whereas the postnatal BM clustered in cluster 3 (Figure 4A). Altogether, methylation profiling is consistent with the idea that JMML with bi-allelic germline SH2B3 mutations represents a specific entity that may be linked to prenatal features, in line with the neonatal presentation.
RNA sequencing of JMML mononucleated cells
Total RNA sequencing was performed on mononuclear cells obtained at diagnosis from four patients with bi-allelic germline SH2B3 mutations. The gene expression profile was compared to that of 17 reference JMML samples and two postnatal BM samples from healthy subjects. Principal component analysis showed that the four SH2B3 cases clustered within the group of JMML samples (Figure 4B). Analysis of differential gene expression between SH2B3 JMML and postnatal BM samples evidenced 447 genes overexpressed, compared with 717 genes underexpressed, in SH2B3 JMML cases (Figure 4C). Interestingly, the oncofetal transcript LIN28B and its two targets HBG2 and IGF2BP1 were among the most overexpressed genes in SH2B3 JMML samples. When compared with other JMML cases, the number of overexpressed genes fell to only 13, with the oncofetal transcript IGF2BP1 ranking first (Figure 4D).
Discussion
SH2B3 encodes the lymphocyte adaptor protein LNK, a member of the SH2B adaptor family of proteins. LNK is predominantly expressed in hematopoietic stem and progenitor cells and is a key negative regulator of numerous cytokine and growth factor receptors.36
We show here that bi-allelic germline loss-of-function SH2B3 mutations represent a new disease predisposing to a JMML-like disorder with autosomal recessive inheritance. In our cohort, it accounted for 50% of JMML cases with unsolved genetics, and all cases experienced spontaneous resolution, in line with a hypomethylated DNA pattern indicative of a favorable prognosis.37
JMML-associated germline SH2B3 mutations were frameshift or missense targeting the SH2 domain. The SH2 domain is required for LNK to bind to the phosphorylated tyrosine (pY813) of JAK2 or JAK3 when activated in response to cytokines. Variants targeting the SH2 domain have been reported to cause severe disruption to LNK function.20 All variants were thus consistent with loss of function of the protein. Deficiency of LNK leads to increased JAK/STAT signaling in a cytokine-independent manner, 36 and mice deficient in LNK were demonstrated to have a variety of hematopoietic phenotypes, including expansion of the hematopoietic stem and progenitor cell compartment,19,38 which is consistent with JMML.5,6 It is now known that LNK controls the expansion of hematopoietic stem cells and myeloid progenitors predominantly by modulating the thrombopoietin signaling pathway.20 Indeed, thrompoietin, which was initially identified as the cytokine that stimulates megakaryopoiesis and platelet production, has also been shown to be a major regulator of hematopoietic stem cell self-renewal and quiescence.20
Both germline and somatic LNK loss-of-function mutations have been previously identified in a range of hematologic diseases.24 Heterozygous SH2B3 germline variants, some of which are relatively common in the general population, have been associated with a low penetrance increased risk of myeloproliferative neoplasms25 and idiopathic erythrocytosis.26,27 Homozygous pathogenic variants, by contrast, are absent from reference population databases and have scarcely been described in patients. The first case reported was that of a consanguineous family in which two siblings carrying D231Profs*38 presented with growth retardation, mild developmental delay and autoimmune disorders. 28 Although this was not explicitly presented as a JMML, the proband developed a phenotype very similar to that of our patients with high white blood cell count, <20% blasts, thrombocytopenia, and no megakaryocytes in BM at 4 weeks old. Blood cell counts normalized without intervention by the age of 14 months; however, the boy then developed liver cirrhosis alike to one of our patients.
More recently, two unrelated patients with homozygous germline loss-of-function SH2B3 variants R148Profs*40
Figure 4. DNA methylation pattern and gene expression profiling suggest persistence of fetal cues in juvenile myelomonocytic leukemia with bi-allelic germline SH2B3 variants. (A) DNA methylation analysis of patients with SH2B3 variants (N=8) and reference juvenile myelomonocytic leukemia (JMML) of known genetic groups (i.e., PTPN11 somatic, NRAS somatic, KRAS somatic, NF1 or CBL) (N=54). Unsupervised hierarchical clustering based on the 1,000 most variant 100 bp tiles identified three main DNA methylation subgroups (low, intermediate, high). JMML with bi-allelic SH2B3 germline mutations defines a subgroup of hypomethylated JMML (cluster 1), whereas JMML with either mono-allelic or somatic SH2B3 mutations cluster in the intermediate (cluster 4) or high (cluster 5) methylation groups. (B-D) Gene expression profile analyses of mononucleated cells of JMML with bi-allelic SH2B3 germline alteration (N=4) in comparison with other types of JMML (N=17) and bone marrow samples from healthy subjects. Principal component analysis (B) and volcano plots showing differential gene expression between JMML with bi-allelic SH2B3 germline alteration and healthy bone marrow (C) or other types of JMML (D). A qval threshold of ≤0.05 and a minimum fold-change of 1.5 were used to define differentially expressed genes. JMML: juvenile myelomonocytic leukemia; BM: bone marrow; Meth: methylation; PC: principal component; FC: fold change.
and V402M with developmental delay, hepatosplenomegaly, myeloproliferation and autoimmune disorders were described.29 Paradoxically, unlike other patients, a major thrombocytosis with megakaryocytic hyperplasia was noted in the BM of these patients. Similarly, even though our patients initially presented with pronounced thrombocytopenia they progressed after spontaneous resolution of JMML towards having thrombocytosis. This could therefore represent two successive phases of the same disease. How LNK-deficient patients progress from a major defect in platelet production to excess production is unclear. The effect of LNK loss on megakaryopoiesis may be age-dependent.39,40 Indeed, the role of thrombopoietin appears to be different in fetal hematopoietic stem cells, which have a high capacity for proliferation and self-renewal for up to 6 months after birth, and in adult hematopoietic stem cells, which are maintained quiescent.41 In this respect, it is interesting to note that all JMML in patients with bi-allelic germline SH2B3 mutations had a neonatal onset and retained fetal characteristics, such as a DNA methylation pattern resembling that of fetal BM and expression of the oncofetal transcripts LIN28B and IGF2BP1. 42 The progressive loss of this fetal context may then explain the spontaneous regression of JMML and the switch to thrombocytosis. RASopathies may be associated with immune disease,43 and the combination of spontaneously resolving forms of JMML associated with a propensity to subsequently develop immune-related disorders is particularly reminiscent of what is observed in patients with CBL syndrome.16 Interestingly, LNK recruits the CBL E3 ubiquitin ligase via its tyrosine residue at position 572 and thus inactivates JAK2 by degradation via the proteasome.44 This functional link has recently been extended to RAS activation. Indeed, JAK2 stabilization induced by loss of function of CBL dramatically enhances palmitoylation of NRAS, thereby activating the RAS-MAPK signaling pathway and promoting myeloid leukemogenesis.45 Such interplay between the JAK-STAT and RAS-MAPK signaling pathways highlights how the loss of LNK could induce JMML whose pathogenesis is considered to be strictly linked to activation of the RAS pathway.46 Besides immune-hematologic defects, several of our patients, as well as those reported in the literature,28,29 had multiple extra-hematologic disorders suggestive of a syndromic presentation. However, these signs were inconstant and differed widely from one patient to another, even within a family. It is therefore difficult to incriminate loss of SH2B3 function in these associated features, which could simply result from the increased risk of autosomal recessive disorders in a context of consanguinity.
Our analysis also identified JMML patients with mono-allelic SH2B3 variants. Regardless of their germline or somatic status, these patients had a strikingly different presentation than that of patients with bi-allelic germline variants, with a later age of onset and a much more severe clinical course requiring BM transplantation. In line
with the clinical presentation, the mutational make-up and DNA methylation profile of patients with SH2B3 mutations differed greatly depending on the allelic pattern. Unlike patients with bi-allelic germline SH2B3 mutation, for whom this alteration seems to represent the only initiating driver of the JMML-like disorder, patients with mono-allelic germline or somatic SH2B3 variants presented with multiple somatic alterations, systematically including a somatic variant in PTPN11, although we could not determine which lesion was the initiating driver.
In conclusion, our findings show that SH2B3 can act as a driver in JMML in two ways, highlighting the importance of deregulation of the JAK-STAT pathway in this disease. On the one hand, mono-allelic SH2B3 alterations, either germline or somatic, drive a severe ‘classical’ JMML associated with frequent loss of heterozygosity and additional somatic mutations. On the other hand, bi-allelic germline variants of SH2B3 define a singular recessive clinical entity associated with a predisposition to develop a neonatal JMML-like disorder. This new entity is estimated to account for half of the cases of JMML that remained unresolved on the genetic level. Its biology and clinical course distinguish it clinically from cases of JMML associated with somatic or constitutional mono-allelic pathogenic SH2B3 variants. The absence of secondary somatic changes is reminiscent of the JMML-like disorder seen in some patients with Noonan syndrome. However, apart from the neonatal presentation, none of the unique hematologic features of patients with germline SH2B3 bi-allelic mutations is shared with Noonan syndrome-JMML.47 Furthermore, all of our cases had a favorable outcome, which is less common in Noonan syndrome-JMML.47 This, together with the immunological landscape, makes them clinically more similar to patients with CBL syndrome. Indeed, strikingly, all previously reported patients were also described to develop autoimmune disorders (thyroiditis, hepatitis) at a later age.28,29 Similarly, although their follow-up is still short, one of the present patients developed autoimmune thyroiditis and another presented with a severe liver disorder requiring transplantation. Thus, in addition to the JMML-like disorder, this disease seems to cause serious immune disorders, which should be monitored to favor prompt management and effective care.
Disclosures
No conflicts of interest to disclose.
Contributions
CA designed the experiments, produced and analyzed data, and wrote the manuscript. YV, MC, ACE, AAB, SP, and GC produced and analyzed data. OF reviewed cytological data. YC, PD, KG, LP, MM, LB, KB, MbK, WAC, AL, MF, and JHD conducted clinical assessments. QN collected and reviewed clinical data. SD and EF supervised functional analyses. MS and FL coordinated and reviewed clinical data. MT supervised the genomic analyses, coordinated the project, raised funds,
and wrote the manuscript. HC designed and coordinated the project, supervised analyses and data collection, raised funds, and wrote the manuscript. All authors reviewed the manuscript.
Acknowledgments
We are profoundly grateful to the patients and families for their participation in the research. We thank Stacey Foulane and Aldjia Assous for help with analyses and clinical data collection, respectively. We also thank Dr Bruno Cassinat (Laboratoire de Biologie Cellulaire, Hôpital Saint-Louis) for in vitro culture of myeloid progenitors. Finally, we thank the
References
1. Chang TY, Dvorak CC, Loh ML. Bedside to bench in juvenile myelomonocytic leukemia: insights into leukemogenesis from a rare pediatric leukemia. Blood. 2014;124(16):2487-2497.
2. Locatelli F, Niemeyer CM. How I treat juvenile myelomonocytic leukemia. Blood. 2015;125(7):1083-1090.
3. Locatelli F, Nöllke P, Zecca M, et al. Hematopoietic stem cell transplantation (HSCT) in children with juvenile myelomonocytic leukemia (JMML): results of the EWOG-MDS/ EBMT trial. Blood. 2005;105(1):410-419.
4 Lapidot T, Grunberger T, Vormoor J, et al. Identification of human juvenile chronic myelogenous leukemia stem cells capable of initiating the disease in primary and secondary SCID mice. Blood. 1996;88(7):2655-2664.
5. Caye A, Rouault-Pierre K, Strullu M, et al. Despite mutation acquisition in hematopoietic stem cells, JMML-propagating cells are not always restricted to this compartment. Leukemia. 2020;34(6):1658-1668.
6. Louka E, Povinelli B, Rodriguez-Meira A, et al. Heterogeneous disease-propagating stem cells in juvenile myelomonocytic leukemia. J Exp Med. 2021;218(2):e20180853.
7. Emanuel PD, Bates LJ, Castleberry RP, Gualtieri RJ, Zuckerman KS. Selective hypersensitivity to granulocyte-macrophage colony-stimulating factor by juvenile chronic myeloid leukemia hematopoietic progenitors. Blood. 1991;77(5):925-929.
8. Lasho T, Patnaik MM. Juvenile myelomonocytic leukemia - a bona fide RASopathy syndrome. Best Pract Res Clin Haematol. 2020;33(2):101171.
9 Niemeyer CM. JMML genomics and decisions. Hematology. 2018;2018(1):307-312.
10. Flex E, Jaiswal M, Pantaleoni F, et al. Activating mutations in RRAS underlie a phenotype within the RASopathy spectrum and contribute to leukaemogenesis. Hum Mol Genet. 2014;23(16):4315-4327.
11. Niemeyer CM, Flotho C. Juvenile myelomonocytic leukemia: who’s the driver at the wheel? Blood. 2019;133(10):1060-1070.
12. Caye A, Strullu M, Guidez F, et al. Juvenile myelomonocytic leukemia displays mutations in components of the RAS pathway and the PRC2 network. Nat Genet. 2015;47(11):1334-1340.
13. Kratz CP, Niemeyer CM, Castleberry RP, et al. The mutational spectrum of PTPN11 in juvenile myelomonocytic leukemia and Noonan syndrome/myeloproliferative disease. Blood. 2005;106(6):2183-2185.
14. Tartaglia M, Niemeyer CM, Fragale A, et al. Somatic mutations in PTPN11 in juvenile myelomonocytic leukemia, myelodysplastic
CRB-K of the Robert Debré Hospital (CRB-K, BB-0033-00076).
Funding
This work was supported, in part, by grants from AIRC (IG21614 and IG-28768), EJP-RD (NSEuroNet), and the Italian Ministry of Health (RF-2021-12374963).
Data-sharing statement
Whole-genome sequencing, RNA-sequencing and DNA methylation data are deposited in the Sequence Read Archive (SRA) (https://www.ncbi.nlm.nih.gov/sra) with access number SUB13849483.
syndromes and acute myeloid leukemia. Nat Genet. 2003;34(2):148-150.
15. Pérez B, Mechinaud F, Galambrun C, et al. Germline mutations of the CBL gene define a new genetic syndrome with predisposition to juvenile myelomonocytic leukaemia. J Med Genet. 2010;47(10):686-691.
16. Niemeyer CM. RAS diseases in children. Haematologica. 2014;99(11):1653-1662.
17 Stieglitz E, Taylor-Weiner AN, Chang TY, et al. The genomic landscape of juvenile myelomonocytic leukemia. Nat Genet. 2015;47(11):1326-1333.
18. Oh ST, Simonds EF, Jones C, et al. Novel mutations in the inhibitory adaptor protein LNK drive JAK-STAT signaling in patients with myeloproliferative neoplasms. Blood. 2010;116(6):988-992.
19 Takaki S, Morita H, Tezuka Y, Takatsu K. Enhanced hematopoiesis by hematopoietic progenitor cells lacking intracellular adaptor protein, Lnk. J Exp Med. 2002;195(2):151-160.
20 Bersenev A, Wu C, Balcerek J, Tong W. Lnk controls mouse hematopoietic stem cell self-renewal and quiescence through direct interactions with JAK2. J Clin Invest. 2008;118(8):2832-2844.
21. Morales CE, Stieglitz E, Kogan SC, Loh ML, Braun BS. Nf1 and Sh2b3 mutations cooperate in vivo in a mouse model of juvenile myelomonocytic leukemia. Blood Adv. 2021;5(18):3587-3591.
22. Bersenev A, Wu C, Balcerek J, et al. Lnk constrains myeloproliferative diseases in mice. J Clin Invest. 2010;120(6):2058-2069.
23. Oh ST. When the brakes are lost: LNK dysfunction in mice, men, and myeloproliferative neoplasms. Ther Adv Hematol. 2011;2(1):11-19.
24. Maslah N, Cassinat B, Verger E, Kiladjian J-J, Velazquez L. The role of LNK/SH2B3 genetic alterations in myeloproliferative neoplasms and other hematological disorders. Leukemia. 2017;31(8):1661-1670.
25. Coltro G, Lasho TL, Finke CM, et al. Germline SH2B3 pathogenic variant associated with myelodysplastic syndrome/ myeloproliferative neoplasm with ring sideroblasts and thrombocytosis. Am J Hematol. 2019;94(9):E231-E234.
26. McMullin MF, Wu C, Percy MJ, Tong W. A nonsynonymous LNK polymorphism associated with idiopathic erythrocytosis. Am J Hematol. 2011;86(11):962-964.
27. Spolverini A, Pieri L, Guglielmelli P, et al. Infrequent occurrence of mutations in the PH domain of LNK in patients with JAK2 mutation-negative “idiopathic” erythrocytosis. Haematologica.
2013;98(9):e101-102.
28. Perez-Garcia A, Ambesi-Impiombato A, Hadler M, et al. Genetic loss of SH2B3 in acute lymphoblastic leukemia. Blood. 2013;122(14):2425-2432.
29 Blombery P, Pazhakh V, Albuquerque AS, et al. Biallelic deleterious germline SH2B3 variants cause a novel syndrome of myeloproliferation and multi-organ autoimmunity. EJHaem. 2023;4(2):463-469.
30. Arber DA, Orazi A, Hasserjian R, et al. The 2016 revision to the World Health Organization classification of myeloid neoplasms and acute leukemia. Blood. 2016;127(20):2391-2405.
31. Khoury JD, Solary E, Abla O, et al. The 5th edition of the World Health Organization classification of haematolymphoid tumours: myeloid and histiocytic/dendritic neoplasms. Leukemia. 2022;36(7):1703-1719.
32. Elghetany MT, Cavé H, De Vito R, Patnaik MM, Solary E, Khoury JD. Juvenile myelomonocytic leukemia; moving forward. Leukemia. 2023;37(3):720-722.
33. Motta M, Pannone L, Pantaleoni F, et al. Enhanced MAPK1 function causes a neurodevelopmental disorder within the RASopathy clinical spectrum. Am J Hum Genet. 2020;107(3):499-513.
34 Rentzsch P, Schubach M, Shendure J, Kircher M. CADD-spliceimproving genome-wide variant effect prediction using deep learning-derived splice scores. Genome Med. 2021;13(1):31.
35. Ioannidis NM, Rothstein JH, Pejaver V, et al. REVEL: an Ensemble method for predicting the pathogenicity of rare missense variants. Am J Hum Genet. 2016;99(4):877-885.
36. Morris R, Butler L, Perkins A, Kershaw NJ, Babon JJ. The role of LNK (SH2B3) in the regulation of JAK-STAT signalling in haematopoiesis. Pharmaceuticals (Basel). 2021;15(1):24.
37. Schönung M, Meyer J, Nöllke P, et al. International consensus definition of DNA methylation subgroups in juvenile
myelomonocytic leukemia. Clin Cancer Res. 2021;27(1):158-168.
38. Velazquez L, Cheng AM, Fleming HE, et al. Cytokine signaling and hematopoietic homeostasis are disrupted in Lnk-deficient mice. J Exp Med. 2002;195(12):1599-1611.
39 Nakamura-Ishizu A, Suda T. Multifaceted roles of thrombopoietin in hematopoietic stem cell regulation. Ann N Y Acad Sci. 2020;1466(1):51-58.
40 Buza-Vidas N, Antonchuk J, Qian H, et al. Cytokines regulate postnatal hematopoietic stem cell expansion: opposing roles of thrombopoietin and LNK. Genes Dev. 2006;20(15):2018-2023.
41. Pietras EM, Passegué E. Linking HSCs to their youth. Nat Cell Biol. 2013;15(8):885-887.
42. Helsmoortel HH, Bresolin S, Lammens T, et al. LIN28B overexpression defines a novel fetal-like subgroup of juvenile myelomonocytic leukemia. Blood. 2016;127(9):1163-1172.
43. Bader-Meunier B, Cavé H, Jeremiah N, et al. Are RASopathies new monogenic predisposing conditions to the development of systemic lupus erythematosus? Case report and systematic review of the literature. Semin Arthritis Rheum. 2013;43(2):217-219.
44 Lv K, Jiang J, Donaghy R, et al. CBL family E3 ubiquitin ligases control JAK2 ubiquitination and stability in hematopoietic stem cells and myeloid malignancies. Genes Dev. 2017;31(10):1007-1023.
45. Ren J-G, Xing B, Lv K, et al. RAB27B controls palmitoylationdependent NRAS trafficking and signaling in myeloid leukemia. J Clin Invest. 2023;133(12):e165510.
46. Kotecha N, Flores NJ, Irish JM, et al. Single-cell profiling identifies aberrant STAT5 activation in myeloid malignancies with specific clinical and biologic correlates. Cancer Cell. 2008;14(4):335-343.
47. Strullu M, Caye A, Lachenaud J, et al. Juvenile myelomonocytic leukaemia and Noonan syndrome. J Med Genet. 2014;51(10):689-697.
Imatinib treatment and longitudinal growth in pediatric patients with chronic myeloid leukemia: influence of demographic, pharmacological, and genetic factors in the German CML-PAED cohort
Sophie Stiehler,1* Stephanie Sembill,1,2* Oliver Schleicher,1,3 Michaela Marx,4 Manfred Rauh,1 Manuela Krumbholz,1,2 Axel Karow,1,2 Meinolf Suttorp,5 Joachim Woelfle,4 Carlo Maj6 and Markus Metzler1,2
1Pediatric Oncology and Hematology, Department of Pediatrics and Adolescent Medicine, University Hospital Erlangen, Friedrich-Alexander-Universität, Erlangen-Nürnberg; 2Comprehensive Cancer Center Erlangen-EMN (CCC ER-EMN), Erlangen; 3Department of Gynecology and Obstetrics, University Hospital Erlangen, Friedrich-Alexander-Universität, Erlangen-Nürnberg; 4Pediatric Endocrinology, Department of Pediatrics and Adolescent Medicine, University Hospital Erlangen, Friedrich-Alexander-Universität, Erlangen-Nürnberg; 5Pediatric Hemato-Oncology, Medical Faculty, Technical University Dresden, Dresden and 6Center for Human Genetics, University of Marburg, Marburg, Germany
*SSt and SSe contributed equally as first authors.
Abstract
Correspondence: S. Sembill stephanie.sembill@uk-erlangen.de
Received: November 15, 2023.
Accepted: March 5, 2024. Early view: March 14, 2024.
In children and adolescents, impaired growth due to tyrosine kinase inhibitor therapy remains an insufficiently studied adverse effect. This study examines demographic, pharmacological, and genetic factors associated with impaired longitudinal growth in a uniform pediatric cohort treated with imatinib. We analyzed 94 pediatric patients with chronic myeloid leukemia (CML) diagnosed in the chronic phase and treated with imatinib for >12 months who participated in the Germany-wide CML-PAEDII study between February 2006 and February 2021 (clinicaltrials gov. Identifier: NCT00445822). During imatinib treatment, significant height reduction occurred, with medians of -0.35 standard deviation score (SDS) at 12 months and -0.76 SDS at 24 months. Cumulative height SDS change (Δ height SDS) showed a more pronounced effect in prepubertal patients during the first year but were similar between prepubertal and pubertal subgroups by the second year (-0.55 vs. -0.50). From months 12 to 18 on imatinib, only 18% patients achieved individually longitudinal growth adequate to the growth standard (Δ height SDS ≥0). When patients were divided into two subgroups based on median Δ height SDS (classifier Δ height SDS > or ≤-0.37) after 1 year on imatinib therapy, cohort 1 (Δ height SDS ≤-0.37) showed younger age at diagnosis, a higher proportion of prepubertal children, but also better treatment response and higher imatinib serum levels. Exploring the association of growth parameters with pharmacokinetically relevant single nucleotide polymorphisms, known for affecting imatinib response, showed no correlation. This retrospective study provides new insights into imatinib-related growth impairment. We emphasize the importance of optimizing treatment strategies for pediatric patients to realize their maximum growth potential.
Introduction
The development of tyrosine kinase inhibitors (TKI) has fundamentally improved the treatment outcome in chronic myeloid leukemia (CML) and expanded the therapeutic repertoire in numerous additional malignancies where tyrosine kinases are frequently identified as a disease driver. Adverse effects are related to the off-target effects of each agent and therefore vary between currently available TKI. A unique
adverse effect in childhood and adolescence is the impact on growth. Based on a few human and animal studies, multifactorial causative mechanisms are postulated: disruption of the GH/IGF1 axis,1,2 alteration of bone metabolism impacting bone remodeling,3 and disturbance of processes within the growth plate.4 In the majority of CML patients in adulthood, this specific adverse side effect is not focused on, although an influence on bone remodeling has been observed here as well.5,6 However, for pediatric CML patients and their parents,
growth within the familial target height range plays a major role for social and psychological reasons.
For the first-generation TKI imatinib, which has been used as monotherapy in the majority of pediatric patients in chronic phase CML (CML-CP), declining growth parameters in pre- and pubertal children have been described in small cohort studies.7-12 Previously, it has been postulated that the second-generation TKI dasatinib and nilotinib affect longitudinal growth to a lesser extent. However, long-term results demonstrated a comparable growth impairment in pediatric CML patients.13-15 In conclusion, TKI as single-agent therapy in children and adolescents lead to a significant reduction in individual growth rates. Age at treatment initiation and pubertal status were identified as influencing factors in the majority of studies.7,8,12 In contrast, some studies showed no association between these parameters and found reduced height SDS over time.9,11 Factors influencing longitudinal growth include age, ethnic composition of the study population, nutritional status, and TKI dose level. The different composition of the study cohorts with regards to these factors is possibly the reason for the partially different observations in previous studies.16
In the present investigation, we therefore examined long-term growth data from a large uniform cohort of pediatric patients with CML-CP diagnosed in the German CML-PAED trial and subsequent registry. We evaluated associations of changes in height SDS with age, pubertal status, molecular response, and imatinib trough serum levels. Our study aimed to obtain a better estimation of the impact of the different influencing factors on the impairment of longitudinal growth.
Methods
Study design and patients
This retrospective study was conducted based on data collected in the CML-PAED II trial and subsequent registry. CMLPAED-II was an investigator-initiated, academic-supported, multicenter, open-label, single-arm phase III clinical trial that recruited from March 2004 to December 2015 and registered at EUDRACT-2007-001339-69 and clinicaltrials gov. Identifier: NCT00445822. The study was performed in accordance with the Declaration of Helsinki. Written informed consent was obtained from the patients’ legal guardians and, if applicable, from the children and adolescents after an age-appropriate written informed consent. Approval was obtained from the ethics committees of the medical faculties of the Technical University of Dresden and for the subsequent register from the Friedrich-Alexander University of Erlangen (ethical votes EK282 122 006, EK 236_18 B). From February 2006 to February 2021, 164 children and adolescents with newly diagnosed CML aged 0-16 years were consecutively registered. Of these patients, 94 had been treated with imatinib for more than 12 months and were less than 16 years old at diagnosis and were therefore eligible for this study. Data on age, sex, height and
body weight were prospectively collected by the participating centers at the time of diagnosis and during treatment with imatinib as part of the registry. Furthermore, we evaluated the parameters of treatment response as well as imatinib trough plasma levels. The study population was divided into prepubertal and pubertal cohorts according to age (prepubertal: aged 1-8 years for female cases, aged 1-10 years for male cases; pubertal: aged 9-16 years for female cases, aged 11-16 years for male cases).
Height and growth evaluation
Height, growth velocity, weight, and body mass index (BMI) were expressed as SDS calculated according to the German standards17,18 using Growth Analyser software, Electronic Patient Record System 4.1, version 1.6 (Growth Analyser BV, Rotterdam, the Netherlands, growthanalyser.org [2018]). Individual growth during imatinib therapy was assessed by the cumulative change in height SDS (Δ height SDS) from the start of imatinib treatment to the annual follow-up time points.
Imatinib trough plasma level determination
Drug concentrations were determined in an accredited and certified laboratory using high-performance liquid chromatography (HPLC) coupled with tandem mass spectrometry (MS/MS), as previously described.19 The detection threshold for imatinib was 100 ng/mL. For a trough level, the interval between intake of imatinib and blood sampling is defined between 20-26 hours.
Quantification of BCR::ABL1 transcript levels
BCR::ABL1 transcript levels were quantified and standardized to the international scale (IS) using the Xpert BCR-ABL Ultra system (Cepheid), with a detection threshold of MR4.5.
Statistical analysis
Statistical analysis was performed using SPSS version 28.0.0.0 statistical package (SPSS IBM corp., New York, USA, www.ibm.com [2021]) and GraphPad Prism, Version 9.3.1 (GraphPad Software. San Diego, California USA, www. graphpad.com [2022]). We compared the growth parameters, i.e., height SDS, Δ height SDS, and BMI SDS, at the time of diagnosis with the values obtained at 3, 6, 12, 18, and 24 months using the one-way ANOVA test. Data distribution was tested by longnormality test. In order to elucidate parameters associated with poorer growth under imatinib treatment we divided the cohort into two subgroups, classified by median Δ height SDS after 12-18 months of therapy. Kolmogorov-Smirnov test was used to determine data distribution. Non-normally distributed data are shown as a median and interquartile range, compared using the Mann-Whitney test. Categorical variables were compared with Pearson χ 2 and Fisher´s exact tests. Statistical tests were two-sided and the significance level was defined as P<0.05. Parameters reaching a statistical
trend in univariate analysis (i.e., P<0.1) or of high clinical relevance were included in multivariate models. We conducted stepwise forward multivariable logistic regression models to identify factors associated with poorer longitudinal growth.
Genotyping
DNA samples were available from all but one of the included patients. For the present study, we performed genotyping with either present or imputed polymorphisms using the Illumina Global Screening Array-24 version 3.0.20 Quality control (QC) was performed using the PLINK toolkit (https://www.cog-genomics.org/plink/2.0/ accessed on 30 July 2021). The QC process included sex verification, variant QC (removing variants with call rates <98%, deviations from Hardy-Weinberg equilibrium with P<1×10⁻¹⁰, and minor allele frequencies <0.01), sample QC (removing samples with call rates <98%), and managing familial relationships (removing individuals related up to the 3rd degree using KING). Genotyping data were phased using Eagle (v. 2.4.1) and imputed using Minimac (v. 4) with the 1000 Genomes Project Phase 3 data as the reference panel.21-23 We utilized Plink to apply linear regression models with respect to height SDS to investigate potential genetic associations
between pharmacogenetic variants and longitudinal growth due to treatment in a cohort of 67 post-QC genetically European samples, which had both genotype and phenotype data available. The analysis was adjusted for the first ten principal components, sex, and pubertal status. Ancestry estimation was performed using data from the 1000 Genomes Project Phase 3, assigning individuals to the most closely matching reference super- and subpopulations based on their positions in the ten principal component spaces as performed in other analyses.24-26
Results
Demographic and clinical characteristics at diagnosis
Of the 164 children and adolescents registered in the period from February 2006 to February 2021, 94 (57%) patients were diagnosed in the chronic phase, and treated with imatinib for ≥12 months, and >3 subsequent datasets on height evaluation were available. Thirty-eight (40%) patients were female and 56 (60%) were male. Ancestry analysis was possible in 93 (99%) patients; we identified 85 (92%) patients with European ethnicity, four (4%) with South Asian ethnicity, three (3%) with African ethnicity,
Figure 1. Study flow chart. Screening 164 chronic myeloid leukemia (CML) cases 1-16 years of age at diagnosis, we identified 94 patients who were eligible for this study. The distribution of female and male patients as well as prepubertal and pubertal cases is indicated. *Prepubertal: aged 1-8 years for female cases, aged 1-10 years for male cases. **Pubertal: aged 9-16 years for female cases, aged 11-16 years for male cases. AFR: African; EAS: Eastasian; EUR: European; SAS: Southasian; mo: months; TKI: tyrosine kinase inhibitors.
and one (1%) with East Asian ethnicity. The study cohort and the excluded patients are presented in Figure 1. The median age at diagnosis was 12 years (range, 3-16 years). Thirty-four (36%) patients could be assigned to the prepubertal subgroup and sixty (64%) to the pubertal subgroup. Other clinical and demographic characteristics did not differ significantly between the two subgroups. Concerning the auxological data collected, the eight patients of non-European ethnicity were not identified as outliers, growth over time, expressed as height SDS values of the two study cohorts are demonstrated in Online Supplementary Figure S1. The following analyses were performed for the entire study cohort (N=94) if not otherwise indicated. BMI SDS was calculated for 90 patients in our cohort at baseline, and 87 patients (97%) were between -2 and +2 standard deviation (SD) at diagnosis. The majority of patients did not have any significant individual change in BMI during imatinib treatment. After 24 months, only two (2.2%) patients had a decrease of more than 1 SD, indicating that nutritional status did not significantly impact growth parameters in our cohort (see Online Supplementary Figure S2).
Development of growth parameters during imatinib treatment
At the time point of diagnosis the overall median height SDS of the 94 patients was -0.04 (range, -2.47 to 3.01). Height SDS significantly decreased over time on imatinib treatment, after 12 months with a median height SDS of -0.35 (range, -3.03 to 2.74) and after 24 months of -0.76 (range, -3.31 to 2.60). The data were not uniformly available for all patients at all time points. To address potential bias
due to different cohort compositions at each time point, we compared the same 76 patients at baseline and after 12 months of imatinib treatment. Height SDS were also significantly lower in this group (diagnosis: 0.05; after 12 months: -0.35; P<0.0001). The growth data over time and the results of the paired analysis are shown in Figure 2A-C. Children and adolescents who were more markedly affected by growth restriction during the course of imatinib therapy (defined as a decrease in Δ height SDS surpassing 0.5) showed a uniform distribution of height SDS at diagnosis. Growth restriction affected both tall and short patients (Figure 2D). A significant decrease was also seen assessing the cumulative change in mean height SDS in our cohort over time on imatinib treatment with median Δ height SDS after 12 months of -0.35 (range, -1.59 to 0.44) and after 24 months of -0.53 (range, -1.91 to 0.94). Comparing the two subgroups of prepubertal and pubertal patients, the decline after 12 months of therapy was more pronounced in the prepubertal group, with median Δ height SDS -0.61 versus -0.30 (P=0.012). However, after 24 months of therapy, there was no difference in median Δ height SDS (-0.55 vs. -0.50) between the two subgroups (Table 1; Figure 3). Furthermore, the age-related height velocity SDS could be calculated. For 85% of the patients, at least one height velocity SDS was available in the observation period of 2 years. In the first month of therapy, the median height velocity SDS was below the comparative value of the age-matched reference group (-1.86, month 6). In the following months, however, the median height velocity SDS increased (-0.82, month 24), but remained lower than in the age-matched population
Figure 2. Changes in absolute height standard deviation score over time on imatinib treatment and paired analysis. (A) The box-and-whisker plot shows the median, first, and third quartiles; whiskers extend to the 95th and 5th percentile. Statistical analysis was performed using one-way ANOVA. (B) The violin plots show the median, first, and third quartiles and the width represents the frequency of the obtained values. Overall, the median height standard deviation score (SDS) decreased from -0.04 at therapy start to -0.76 after 24 months of treatment. (C) Paired analysis; height SDS at the start of imatinib therapy and 12 months later (N=76). Overall, the median height SDS decreased from 0.05 at therapy start to -0.35 after 12 months in the paired cohort (P<0.001). (D) Individual courses of height SDS for 32 patients with growth restriction exceeding 0.5 standard deviations over time on imatinib treatment.
(Online Supplementary Figure S3).
Factors associated with cumulative change in height standard deviation score after 12-18 months of imatinib therapy
For the following analyses, we identified 87 (93%) patients on imatinib treatment and a calculable Δ height SDS in the time interval from 12 to 18 months. Only 16 children (18%) showed individually longitudinal growth adequate to the growth standards defined as Δ height SDS ≥0. A decrease in cumulative height SDS surpassing 0.5 SD was observed in 32 children (37%), including four (5%) patients
with a decrease of >1 SD after 12-18 months on imatinib treatment. We next divided the patients into two groups according to the median Δ height SDS (classifier Δ height SDS ≤-0.37=cohort 1 or >-0.37=cohort 2). Age at diagnosis proved to be the most significant factor between the two subgroups with younger patients in cohort 1 exhibiting more pronounced growth retardation. In line with age, the proportion of prepubertal children (47.7%) was significantly higher in cohort 1. Children in cohort 1 also showed significantly better treatment response, with lower median BCR::ABL1 transcript levels (0.046% vs. 0.190%) and as a consequence a larger proportion (65.9% vs. 39.5%) achieving a major mo-
A B C
Figure 3. Δ Height standard deviation score over time on imatinib treatment. The box-and-whisker plot shows the median, first, and third quartiles; whiskers extend to the 95th and 5th percentile. Results for (A) whole cohort, (B) prepubertal (girls aged 1-8 years, boys aged 1-10 years) and (C) pubertal (girls aged 9-16 years, boys aged 11-16) patients are depicted. Δ Height standard deviation score (SDS) was determined by subtraction of each annual time point to height SDS at diagnosis.
Table 1. Cumulative changes in Δ height standard deviation score over time on imatinib treatment.
Prepubertal cohort
Pubertal cohort
*Intra-group comparision to Δ height standard deviation score (SDS) at diagnosis. Δ Height SDS was determined by subtraction of each annual time point to height SDS at diagnosis. Min: minimum; Max: maximum.
lecular response at time point 12 months after diagnosis. When comparing the two subgroups in terms of serum imatinib levels, which were available in 29 patients (cohort 1: N=17, cohort 2: N=12), children in cohort 1 had significantly higher imatinib levels (median: 1,570 ng/mL vs. 961 ng/ mL). The results of the analysis are summarized in Table 2. Multivariable modeling showed independent association of inferior longitudinal growth with younger age at therapy initiation (odds ratio [OR]=0.533, 95% confidence interval [CI]: 0.387-0.733; P<0.001), prepubertal status (OR=14.35, 95% CI: 1.781-115.58; P=0.012) and the achievement of a major molecular response after 12-18 months of therapy (OR=5.395, 95% CI: 1.766-16.478; P=0.003). In order to investigate the association with imatinib serum levels, we repeated analyses in patients with available data (N=29). This showed independent association of inferior longitudinal growth with higher imatinib serum levels (OR=1.008, 95% CI: 1.000-1.015; P=0.045), in addition to younger patient age (OR=0.295, 95% CI: 0.089-0.973; P=0.045).
Genotyping
Higher imatinib levels are in principle the result of either higher intake (implying better therapeutic adherence) or slower excretion (based on pharmacokinetic metabolism). We investigated the association of growth parameters with single nucleotide variants reported to influence the metabolism of imatinib.27-43 Among the 34 candidate pharmacogenetic variants available, six variants showed a nominal association, although they did not survive multiple correction. The identified associated variants are as follows: rs150929 (gene=ABCA3, effect allele=T; β=-1.85, se=0.36, P=6.9x10⁻³), rs1800682 (gene=FAS, effect allele= G; β=0.98, se =0.30, P=0.014), rs12505410 (gene=ABCG2, effect allele=G; β=-0.90, se=0.30, P=0.017), rs2231142 (gene=ABCG2, effect allele=T; β=1.53, se=0.51, P=0.020), rs724710 (gene= cBIM, effect allele=T; β=0.87, se=0.33, P=0.034), and rs2228001 (gene=XPC, effect allele= G; β=-0.81, se=0.33, P=0.043). Although previous studies have shown a signif-
icant impact on imatinib metabolization for the investigated polymorphisms, we could not observe a significant impact of candidate pharmacogenetic variants on growth in our highly homogeneous cohort. The genotyping results and the respective references are summarized in Online Supplementary Table S1.
Discussion
Previous research has highlighted the potential risk for growth impairment during imatinib treatment. However, conflicting findings exist regarding the impact of age and pubertal status at the start of therapy. Boddu et al. and Millot et al. did not identify age and pubertal status to be significant factors affecting growth rates.9,11 However, in most other studies, starting therapy before puberty was associated with inferior growth.7,8,12 In a recent meta-analysis, Gupta et al. examined the effect of imatinib on height in relation to pubertal status, drawing data from four studies and 115 participants. The analysis did not reveal any significant differences in height SDS between the two subgroups. It should be noted, however, that the merged data included different definitions of puberty across studies, and thus the prepubertal age group showed considerable heterogeneity.16 To our knowledge, our study includes the largest patient population followed over 24 months and, in addition, the cohort is distinctive for its particularly consistent composition specified by genotyping and as a representative sample of a population-based study. This improves the estimation of influencing factors such as ethnicity and nutritional status in contrast to previous studies and the degree of transferability to the entirety of patients with pediatric CML. Limitations of our study include the lack of utilizing the mid-parental target height to correct for familial genetic height potential, and defining pubertal status based on chronological age instead of Tanner stages. Our data indicate that prepubertal status represents a
IR: interquartile range; 25th-75th percentile. Δ Height standard deviation score (SDS) was determined by subtraction of each annual time point to height SDS at diagnosis; dx: diagnosis, IS: international scale; MMR: major molecular response.
Table 2. Characteristics of patients 12-18 months after diagnosis classified by median Δ height standard deviation score.
significant factor influencing longitudinal growth in the first year of treatment. This effect became insignificant after 24 months of treatment. Previous studies have argued that this effect is related to the growth spurt of the prepubertal subgroup and the resulting catch-up growth. However, we observed a decrease in longitudinal growth within the pubertal group over the longer observation period. It can only be speculated why this effect becomes evident later in older patients. A possible explanation could be the lower adherence to therapy in this age group, which could play a role especially at the initiation of therapy. Overall, the growth parameters we observed at 24 months were comparable to those reported in the meta-analysis conducted by Gupta et al.. 16 Their analysis showed a diminishing impact on standardized mean height differences in studies with more than 3 years of follow-up, attributed to catch-up growth and growth spurts. Our patient sample was not large enough to confirm or reject this trend after 3 years of follow-up. Still, it remains unclear whether TKI-induced impairment of longitudinal growth is caused by growth retardation, acceleration, or endocrinological disruptions involving a disturbed GH/IGF1 axis. Multiple mechanisms likely contribute and accumulate to produce unique outcomes in each individual, resulting in significant variability within the patient group.
Some of the individual factors relate to the pharmacokinetics of imatinib and could in principle be delineated trough plasma-level measurements and pharmacogenetic analyses.28-30,32,38,40,44 Thus, we examined, for the first time, the potential impact of imatinib trough plasma levels and treatment response on growth parameters. Our results suggest that patients with lower growth rates had higher trough plasma levels of imatinib, resulting in a better therapeutic response. This underscores that exposure to imatinib is responsible for the effect on growth. In addition, we aimed to test whether polymorphisms reported in previous studies in adults linked with imatinib pharmacokinetics or treatment response are also associated with pediatric growth parameters in our cohort.28-30,32,38,40 None of the polymorphisms were significantly associated with growth parameters. Despite the limited size of our cohort and the expected limitations in the statistical power, we analyzed all data in an exploratory manner because the majority of the described associations were identified and reported as significant in comparably sized or even smaller adult cohorts. Due to the potential complexity of the underlying polygenic architecture and the presence of possible epistatic interaction effects, a larger sample size would be necessary to conduct a more comprehensive analysis of genotype/phenotype associations, which may also encompass the influence of rare variants with larger functional effects. The precise role of tyrosine kinase inhibition in the complex process of longitudinal growth requires a more comprehensive exploration, and an experimental modeling approach to verify the underlying mechanisms.
In conclusion, 18% of patients were not affected by growth problems at all, 45% showed a decrease in individual growth parameters not surpassing 0.5 SD and 37% experienced growth stunting in the range of below -0.5 SD (determined by Δ height SDS). Even if the final height is still within the normal range with a loss of -1 SD in the population, the individual psychosocial effects are nevertheless serious for most patients. Our data suggest that not only prepubertal patients are affected, but also the pubertal subgroup during the course of therapy. Over a longer observation period, Gupta et al. were able to show in their meta-analysis that there is a potential for catch-up growth,16 which is also reflected in our results on height velocity. Therefore, the practical consequence is that, especially for younger patients and those with growth potential, all measures must be taken to achieve the best possible conditions for individual growth. This includes the following measures: longitudinal growth potential should be assessed by standardized repeated assessment of bone age before starting TKI therapy and during the follow-up under treatment. Optimal therapy adjustment, if necessary with early switch to an alternative TKI to achieve the criteria for safe TKI discontinuation as soon as possible, should be aimed for in all patients, especially in individuals who are more severely affected by growth retardation. However, the data meanwhile available on the adverse drug effects of the second-generation TKI dasatinib and nilotinib indicate that the initially hypothesized weaker effect on growth has not been confirmed and that, with a longer observation period, approximately the same effects as with imatinib can be observed.45-47 Other options that are discussed include initiation of early intermittent therapy48,49 or possible TKI dose reduction.50 It should be noted, however, that potential catch-up growth for these approaches has not yet been systematically investigated. Nonetheless, achieving these goals requires high treatment adherence. In order to encourage patients, our study and previous research suggest that patients with moderate to severe growth restriction typically have delayed growth but have the potential to catch up. In the future, studies will need to evaluate the factors that affect growth more specifically and identify high-risk patients in the early stages to contribute to enhancing therapeutic strategies.
Disclosures
No conflicts of interest to disclose.
Contributions
SSt and SSe designed the research study, performed the research, analyzed the data, and wrote the paper. MM and CM analyzed the data and wrote the paper. AK, OS, MMa, MR, MK, MS and JW performed the research and reviewed the paper. All authors have read and agreed to the published version of the manuscript.
Acknowledgment
We would like to thank all patients and their families for their willingness to provide their valuable data for studies on this rare disease. We also thank all the nurses and physicians caring for these patients for their data collection. The present work was performed by SSt in fulfillment of the requirements for obtaining the degree “Dr. med.” at Friedrich-Alexander-Universität Erlangen-Nürnberg (FAU), Germany.
Funding
The study was supported by the Interdisciplinary Center for
References
1. Ulmer A, Tabea Tauer J, Glauche I, Jung R, Suttorp M. TK inhibitor treatment disrupts growth hormone axis: clinical observations in children with CML and experimental data from a juvenile animal model. Klin Padiatr. 2013;225(3):120-126.
2. Narayanan KR, Bansal D, Walia R, et al. Growth failure in children with chronic myeloid leukemia receiving imatinib is due to disruption of GH/IGF-1 axis. Pediatr Blood Cancer. 2013;60(7):1148-1153.
3. Vandyke K, Fitter S, Dewar AL, Hughes TP, Zannettino AC. Dysregulation of bone remodeling by imatinib mesylate. Blood. 2010;115(4):766-774.
4 Vandyke K, Dewar AL, Fitter S, et al. Imatinib mesylate causes growth plate closure in vivo. Leukemia. 2009;23(11):2155-2159.
5. Berman E, Nicolaides M, Maki RG, et al. Altered bone and mineral metabolism in patients receiving imatinib mesylate. N Engl J Med. 2006;354(19):2006-2013.
6. Vandyke K, Fitter S, Drew J, et al. Prospective histomorphometric and DXA evaluation of bone remodeling in imatinib-treated CML patients: evidence for site-specific skeletal effects. J Clin Endocrinol Metab. 2013;98(1):67-76.
7. Shima H, Tokuyama M, Tanizawa A, et al. Distinct impact of imatinib on growth at prepubertal and pubertal ages of children with chronic myeloid leukemia. J Pediatr. 2011;159(4):676-681.
8. Bansal D, Shava U, Varma N, Trehan A, Marwaha RK. Imatinib has adverse effect on growth in children with chronic myeloid leukemia. Pediatr Blood Cancer. 2012;59(3):481-484.
9. Millot F, Guilhot J, Baruchel A, et al. Growth deceleration in children treated with imatinib for chronic myeloid leukaemia. Eur J Cancer. 2014;50(18):3206-3211.
10. Sabnis HS, Keenum C, Lewis RW, et al. Growth disturbances in children and adolescents receiving long-term tyrosine kinase inhibitor therapy for Chronic Myeloid Leukaemia or Philadelphia Chromosome-positive Acute Lymphoblastic Leukaemia. Br J Haematol. 2019;185(4):795-799.
11. Boddu D, Thankamony P, Guruprasad CS, Nair M, Rajeswari B, Seetharam S. Effect of imatinib on growth in children with chronic myeloid leukemia. Pediatr Hematol Oncol. 2019;36(4):189-197.
12. Cai Y, Liu C, Guo Y, et al. Long-term safety and efficacy of imatinib in pediatric patients with chronic myeloid leukemia: single-center experience from China. Int J Hematol. 2021;113(3):413-421.
13. Hijiya N, Maschan A, Rizzari C, et al. A phase 2 study of nilotinib in pediatric patients with CML: long-term update on growth
Clinical Research (IZKF) at the University Hospital of the University of Erlangen-Nürnberg (Laboratory Rotation, to SSe). The continuous financial support in data collection by “Sonnenstrahl e.V. Dresden - Förderkreis für krebskranke Kinder und Jugendliche” (Dresden, Germany), “Schornsteinfeger helfen krebskranken Kindern e.V.” (Dörfles-Esbach, Germany), and the “Madeleine-Schickedanz-Kinderkrebs-stiftung” (Fürth, Germany) is highly acknowledged.
Data-sharing statement
The data supporting the results of this study are available upon reasonable request from the corresponding author.
retardation and safety. Blood Adv. 2021;5(14):2925-2934.
14. Patterson BSJ, Gore L, Zwaan CM, Sacchi M, Sy O, Hijiya N. Growth rate and endocrine effects of dasatinib therapy observed in a retrospective analysis of a phase 2 clinical trial for pediatric patients with chron-ic myeloid leukemia in chronic phase (CML-CP). HemaSphere. 2019;3(S1):161.
15. Hijiya N, Maschan A, Rizzari C, et al. The long-term efficacy and safety of nilotinib in pediatric patients with CML: a 5-year update of the DIALOG study. Blood Adv. 2023;7(23):7279-7289.
16. Gupta P, Banothu KK, Haldar P, Gupta AK, Meena JP. Effect of imatinib mesylate on growth in pediatric chronic myeloid leukemia: a systematic review and meta-analysis. J Pediatr Hematol Oncol. 2023;45(5):227-234.
17 Reinken L, van Oost G. [Longitudinal physical development of healthy children 0 to 18 years of age. Body length/height, body weight and growth velocity]. Klin Padiatr. 1992;204(3):129-133.
18. Kromeyer-Hauschild K, Wabitsch M, Kunze D, et al. Perzentile für den Body-mass-Index für das Kindes- und Jugendalter unter Heranziehung verschiedener deutscher Stichproben. Monatsschrift Kinderheilkunde. 2001;149(8):807-818.
19. Klawitter J, Zhang YL, Klawitter J, Anderson N, Serkova NJ, Christians U. Development and validation of a sensitive assay for the quantification of imatinib using LC/LC-MS/MS in human whole blood and cell culture. Biomed Chromatogr. 2009;23(12):1251-1258.
20 Verlouw JAM, Clemens E, de Vries JH, et al. A comparison of genotyping arrays. Eur J Hum Genet. 2021;29(11):1611-1624.
21. Das S, Forer L, Schönherr S, et al. Next-generation genotype imputation service and methods. Nat Genet. 2016;48(10):1284-1287.
22. Auton A, Brooks LD, Durbin RM, et al. A global reference for human genetic variation. Nature. 2015;526(7571):68-74.
23. Loh PR, Danecek P, Palamara PF, et al. Reference-based phasing using the Haplotype Reference Consortium panel. Nat Genet. 2016;48(11):1443-1448.
24. Privé F, Aschard H, Carmi S, et al. Portability of 245 polygenic scores when derived from the UK Biobank and applied to 9 ancestry groups from the same cohort. Am J Hum Genet. 2022;109(1):12-23.
25. Byun J, Han Y, Gorlov IP, Busam JA, Seldin MF, Amos CI. Ancestry inference using principal component analysis and spatial analysis: a distance-based analysis to account for population substructure. BMC Genomics. 2017;18(1):789.
26. Maj C, Staerk C, Borisov O, et al. Statistical learning for sparser fine-mapped polygenic models: the prediction of LDL-
cholesterol. Genet Epidemiol. 2022;46(8):589-603.
27. Guillem V, Amat P, Cervantes F, et al. Functional polymorphisms in SOCS1 and PTPN22 genes correlate with the response to imatinib treatment in newly diagnosed chronic-phase chronic myeloid leukemia. Leuk Res. 2012;36(2):174-181.
28. Zheng Q, Cao J, Hamad N, et al. Single nucleotide polymorphisms in apoptosis pathway are associated with response to imatinib therapy in chronic myeloid leukemia. J Transl Med. 2016;14:82.
29 Augis V, Airiau K, Josselin M, Turcq B, Mahon FX, Belloc F. A single nucleotide polymorphism in cBIM is associated with a slower achievement of major molecular response in chronic myeloid leukaemia treated with imatinib. PLoS One. 2013;8(11):e78582.
30. Lakkireddy S, Aula S, Kapley A, Gundeti S, Kutala VK, Jamil K. Association of DNA repair gene XPC Ala499Val (rs2228000 C>T) and Lys939Gln (rs2228001 A>C) polymorphisms with the risk of chronic myeloid leukemia: A case-control study in a South Indian population. J Gene Med. 2021;23(7):e3339.
31. Kim DH, Kong JH, Byeun JY, et al. The IFNG (IFN-gamma) genotype predicts cytogenetic and molecular response to imatinib therapy in chronic myeloid leukemia. Clin Cancer Res. 2010;16(21):5339-5350.
32. Kim DH, Sriharsha L, Xu W, et al. Clinical relevance of a pharmacogenetic approach using multiple candidate genes to predict response and resistance to imatinib therapy in chronic myeloid leukemia. Clin Cancer Res. 2009;15(14):4750-4758.
33. Delord M, Rousselot P, Cayuela JM, et al. High imatinib dose overcomes insufficient response associated with ABCG2 haplotype in chronic myelogenous leukemia patients. Oncotarget. 2013;4(10):1582-1591.
34 Jaruskova M, Curik N, Hercog R, et al. Genotypes of SLC22A4 and SLC22A5 regulatory loci are predictive of the response of chronic myeloid leukemia patients to imatinib treatment. J Exp Clin Cancer Res. 2017;36(1):55.
35. Angelini S, Soverini S, Ravegnini G, et al. Association between imatinib transporters and metabolizing enzymes genotype and response in newly diagnosed chronic myeloid leukemia patients receiving imatinib therapy. Haematologica. 2013;98(2):193-200.
36. Takahashi N, Miura M, Scott SA, et al. Influence of CYP3A5 and drug transporter polymorphisms on imatinib trough concentration and clinical response among patients with chronic phase chronic myeloid leukemia. J Hum Genet. 2010;55(11):731-737.
37. Dulucq S, Bouchet S, Turcq B, et al. Multidrug resistance gene (MDR1) polymorphisms are associated with major molecular responses to standard-dose imatinib in chronic myeloid leukemia. Blood. 2008;112(5):2024-2027.
38. de Lima LT, Bueno CT, Vivona D, et al. Relationship between
SLCO1B3 and ABCA3 polymorphisms and imatinib response in chronic myeloid leukemia patients. Hematology. 2015;20(3):137-142.
39 Barratt DT, Cox HK, Menelaou A, et al. CYP2C8 genotype significantly alters imatinib metabolism in chronic myeloid leukaemia patients. Clin Pharmacokinet. 2017;56(8):977-985.
40 Au A, Aziz Baba A, Goh AS, et al. Association of genotypes and haplotypes of multi-drug transporter genes ABCB1 and ABCG2 with clinical response to imatinib mesylate in chronic myeloid leukemia patients. Biomed Pharmacother. 2014;68(3):343-349.
41. Yamakawa Y, Hamada A, Shuto T, et al. Pharmacokinetic impact of SLCO1A2 polymorphisms on imatinib disposition in patients with chronic myeloid leukemia. Clin Pharmacol Ther. 2011;90(1):157-163.
42. Kassogue Y, Quachouh M, Dehbi H, Quessar A, Benchekroun S, Nadifi S. Functional polymorphism of CYP2B6 G15631T is associated with hematologic and cytogenetic response in chronic myeloid leukemia patients treated with imatinib. Med Oncol. 2014;31(1):782.
43. Kong JH, Mun YC, Kim S, et al. Polymorphisms of ERCC1 genotype associated with response to imatinib therapy in chronic phase chronic myeloid leukemia. Int J Hematol. 2012;96(3):327-333.
44 Suttorp M, Bornhäuser M, Metzler M, Millot F, Schleyer E. Pharmacology and pharmacokinetics of imatinib in pediatric patients. Expert Rev Clin Pharmacol. 2018;11(3):219-231.
45. de Bruijn CMA, Millot F, Suttorp M, et al. Discontinuation of imatinib in children with chronic myeloid leukaemia in sustained deep molecular remission: results of the STOP IMAPED study. Br J Haematol. 2019;185(4):718-724.
46. Millot F, Suttorp M, Ragot S, et al. Discontinuation of imatinib in children with chronic myeloid leukemia: a study from the International Registry of Childhood CML. Cancers (Basel). 2021;13(16):4102.
47. Shima H, Kada A, Tanizawa A, et al. Discontinuation of tyrosine kinase inhibitors in pediatric chronic myeloid leukemia. Pediatr Blood Cancer. 2022;69(8):e29699.
48. Malagola M, Iurlo A, Abruzzese E, et al. Molecular response and quality of life in chronic myeloid leukemia patients treated with intermittent TKIs: first interim analysis of OPTkIMA study. Cancer Med. 2021;10(5):1726-1737.
49 Giona F, Malaspina F, Putti MC, et al. Results and outcome of intermittent imatinib (ON/OFF schedule) in children and adolescents with chronic myeloid leukaemia. Br J Haematol. 2020;188(6):e101-e105.
50 Naqvi K, Jabbour E, Skinner J, et al. Long-term follow-up of lower dose dasatinib (50 mg daily) as frontline therapy in newly diagnosed chronic-phase chronic myeloid leukemia. Cancer. 2020;126(1):67-75.
IELSG38: phase II trial of front-line chlorambucil plus subcutaneous rituximab induction and maintenance in mucosa-associated lymphoid tissue lymphoma
Anastasios Stathis,1,2* Maria Cristina Pirosa,1,3* Lorella Orsucci,4 Pierre Feugier,5 Monica Tani,6 Hervé Ghesquières,7 Gerardo Musuraca,8 Francesca Gaia Rossi,9 Francesco Merli,10 Romain Guièze,11 Emmanuel Gyan,12 Guido Gini,13 Dario Marino,14 Remy Gressin,15 Franck Morschhauser,16 Federica Cavallo,17 Francesca Palombi,18 Annarita Conconi,19 Benoît Tessoulin,20 Hervé Tilly,21 Manuela Zanni,22 Maria Giuseppina Cabras,23 Enrico Capochiani,24 Catello Califano,25 Melania Celli,26 Alessandro Pulsoni,27 Francesco Angrilli,28 Ubaldo Occhini,29 René-Olivier Casasnovas,30 Guillaume Cartron,31 Liliana Devizzi,32 Corinne Haioun,33 Anna Marina Liberati,34 Roch Houot,35 Michele Merli,36 Giuseppe Pietrantuono,37 Francesca Re,38 Michele Spina,39 Francesco Landi,1 Franco Cavalli,3 Francesco Bertoni,1,2,3 Davide Rossi,1,2,3 Nicoletta Ielmini,3 Elena Borgo,40 Stefano Luminari,10,41# Emanuele Zucca1,2,3,42# and Catherine Thieblemont43#
Correspondence: A. Stathis anastasios.stathis@eoc.ch
Received: August 14, 2023.
Accepted: February 12, 2024. Early view: February 22, 2024.
1Oncology Institute of Southern Switzerland, EOC, Bellinzona, Switzerland; 2Università della Svizzera Italiana, Faculty of Biomedical Sciences, Lugano, Switzerland; 3Institute of Oncology Research, Bellinzona, Switzerland; 4S.C. Ematologia, AOU Città della Salute e della Scienza di Torino, Turin, Italy; 5Department of Clinical Hematology, Nancy University Hospital, INSERM 1256, Nancy, France; 6U.O. Ematologia, Dipartimento Oncologia e Ematologia, Ospedale Santa Maria delle Croci, Ravenna, Italy; 7Hematology Department, Hospices Civils de Lyon, CHU Lyon-Sud, Pierre-Bénite, France; 8Hematology Unit, IRCCS Istituto Scientifico Romagnolo per lo Studio dei Tumori (IRST) “Dino Amadori”, Meldola, Italy; 9Hematology-BMT Center, Fondazione IRCCS Ca’ Granda Ospedale Maggiore Policlinico, University of Milan, Milano, Italy; 10AUSL-IRCCS of Reggio Emilia, Reggio Emilia, Italy; 11Service d’Hématologie Clinique et de Thérapie Cellulaire, CHU Estaing, ClermontFerrand, France; 12Hématologie et Thérapie Cellulaire, CIC Inserm U1415, Centre Hospitalier Universitaire de Tours, Tours, France; 13Hematology, Department of Clinical and Molecular Sciences, Marche Polytechnic University, Ancona, Italy; 14Oncology 1 Unit, Istituto Oncologico Veneto IOV-IRCCS, Padova, Italy; 15Institute for Advanced Biosciences, INSERM U1209/CNRS UMR 5309/Grenoble Alpes University, Grenoble, France; 16Université de Lille, CHU Lille, Department of Hematology, Lille, France; 17Division of Hematology, Department of Molecular Biotechnologies and Health Sciences, University of Torino/AOU Città della Salute e della Scienza di Torino, Turin, Italy; 18Hematology and Stem Cell Transplant Unit, IRCCS, National Cancer Institute, Istituto Regina Elena, Rome, Italy; 19Division of Hematology, Ospedale degli Infermi, Biella, Italy; 20Hématologie Clinique, CHU de Nantes, INSERM CRCINA Nantes-Angers, NeXT Université de Nantes, Nantes, France; 21Department of Hematology and U1245, Centre Henri Becquerel, Rouen, France; 22Hematology Unit, Antonio e Biagio e Cesare Arrigo Hospital, Alessandria, Italy; 23Ospedale Oncologico, Ematologia e CTMO, Cagliari, Italy; 24Hematology Unit, Azienda USL Toscana NordOvest, Center for Translational Medicine, Livorno, Italy; 25Hematology Unit, P.O. A. Tortora, Pagani, Italy; 26Hematology Unit, Ospedale degli Infermi, Rimini, Italy; 27Department of Translational and Precision Medicine, Sapienza University, Rome, Italy; 28Unità Operativa Semplice Dipartimentale Centro Diagnosi e Terapia Linfomi, Presidio Ospedaliero, Pescara, Italy; 29Unità Operativa di Ematologia, Ospedale San Donato, AUSL Toscana Sud-Est, Arezzo, Italy; 30Department of Hematology, University Hospital F. Mitterrand and INSERM 1231, Dijon, France; 31Hématologie Clinique, CHU Montpellier, UMR 5535 Montpellier, France; 32Hematology Unit, Fondazione IRCCS, Istituto Nazionale dei Tumori, Milan, Italy; 33Lymphoid Malignancies Unit, Hôpital Henri Mondor, AP-HP, Créteil, France; 34SC Oncoematologia, Azienda Ospedaliera Santa Maria, Università degli Studi di Perugia, Terni, Italy; 35Department of Clinical Hematology, University Hospital of Rennes, Rennes, France; 36Division of Hematology, University Hospital, Ospedale di Circolo e Fondazione Macchi ASST Sette Laghi, University of Insubria, Varese, Italy; 37Hematology Unit, Centro di Riferimento Oncologico della Basilicata IRCCS Rionero in Vulture, Italy; 38Hematology and BMT Center, Azienda Ospedaliera Universitaria, Parma, Italy; 39Division of Medical Oncology, Centro di Riferimento Oncologico IRCCS, Aviano, Italy; 40FIL, Fondazione Italiana Linfomi ONLUS, Alessandria, Italy; 41CHIMOMO Department, University of Modena and Reggio Emilia, Reggio Emilia, Italy; 42Medical Oncology, University Hospital and University of Bern, Bern, Switzerland and 43APHP - Service d’HématologieOncologie, Hôpital Saint Louis, Université de Paris-Diderot, Paris, France
*AS and MCP contributed equally as first authors. #SL, EZ and CT contributed equally as senior authors.
Abstract
The IELSG38 trial was conducted to investigate the effects of subcutaneous (SC) rituximab on the complete remission (CR) rate and the benefits of SC rituximab maintenance in patients with extranodal marginal zone lymphoma (MZL) who received front-line treatment with chlorambucil plus rituximab. Study treatment was an induction phase with oral chlorambucil 6 mg/m2/day on weeks 1-6, 9-10, 13-14, 17-18, and 21-22, and intravenous rituximab 375 mg/m2 on day 1 of weeks 1-4, and 1,400 mg SC on weeks 9, 13, 17, and 21. Then, a maintenance phase followed with rituximab administered at 1,400 mg SC every two months for two years. Of the 112 patients enrolled, 109 were evaluated for efficacy. The CR rates increased from 52% at the end of the induction phase to 70% upon completion of the maintenance phase. With a median follow-up of 5.8 years, the 5-year event-free, progression-free, and overall survival rates were 87% (95% CI: 78-92), 84% (95% CI: 75-89), and 93% (95% CI: 86-96), respectively. The most common grade ≥3 toxicities were neutropenia (33%) and lymphocytopenia (16%). Six patients experienced treatment-related serious adverse events, including fever of unknown origin, sepsis, pneumonia, respiratory failure, severe cerebellar ataxia, and fatal acute myeloid leukemia. The trial showed that SC rituximab did not improve the CR rate at the conclusion of the induction phase, which was the main endpoint. Nevertheless, SC rituximab maintenance might have facilitated long-term disease control, potentially contributing to enhanced event-free and progression-free survival.
Introduction
Extranodal marginal zone B-cell lymphoma (MZL) of mucosa-associated lymphoid tissue (MALT) lymphoma accounts for approximately 8% of lymphomas. The stomach is the most frequent site of localization, but MALT lymphomas can occur at any extranodal site.1,2 The clinical course is usually indolent, with median survival exceeding ten years.1 However, patients with high-risk baseline features3,4 and those with relapse or progression within two years from the initiation of the first systemic treatment have a significantly shorter survival.5-7 Rituximab combinations with chemotherapy (chlorambucil or bendamustine)8-10 are generally considered valid front-line treatment options.11 In particular, a 6-month combination regimen of rituximab and chlorambucil was evaluated in the largest phase III randomized study ever conducted in patients with MALT lymphoma (IELSG19 trial), showing the superiority of the combination over either agent alone in terms of response rates, eventfree survival (EFS), and progression-free survival (PFS).8 Following these results, we designed the IELSG38 phase II trial, to investigate whether the activity of a 6-month combination of intravenous (IV) rituximab with oral chlorambucil could be retained using the subcutaneous (SC) administration of rituximab and potentially enhanced by adding a 2-year maintenance treatment. Here we present the results of this trial.
Methods
Study design and eligibility criteria
IELSG38 was a single-arm, open-label, multicenter phase II clinical trial sponsored by the International Extranodal Lymphoma Study Group (IELSG), and conducted in collaboration with the Fondazione Italiana Linfomi (FIL) and the
Lymphoma Study Association (LYSA).
Patients with MALT lymphoma either de novo, or relapsed following local therapy (i.e., surgery and/or radiotherapy) were eligible. Patients with primary H. pylori-positive gastric MALT lymphoma treated with antibiotics were also eligible if they had endoscopic and histologic evidence of disease progression at any time after H. pylori eradication or stable disease with persistent lymphoma at ≥1 year after eradication or had relapsed without reinfection after a prior remission.
Other inclusion criteria included measurable or evaluable disease according to the revised response criteria for malignant lymphoma.12 The main exclusion criteria were evidence of histologic transformation, prior chemotherapy or anti-CD20 monoclonal antibody, central nervous system (CNS) involvement, active hepatitis C virus (HCV) or hepatitis B virus (HBV) infection, and history of human immunodeficiency virus (HIV) infection.
The study procedures were in accordance with the principles of the Declaration of Helsinki. The Ethics Committee of the participating centers approved the study and all patients provided written informed consent. The study was registered at clinicaltrials.gov 01808599.
Patients were staged with computed tomography (CT); positron emission tomography (PET) was allowed in addition to CT scans. Bone marrow biopsy was recommended but not mandatory. Esophagogastroduodenoscopy and/or colonoscopy with multiple mucosal biopsies were carried out in case of gastrointestinal involvement. Electrocardiogram and standard laboratory exams (including viral serologies) were performed at the screening. Antibiotic and antiviral prophylaxis were administered as per local guidelines. Treatment consisted of an induction (analogous to the regimen previously used in the IELSG19 trial8) and a maintenance phase with SC rituximab. During induction, patients received oral (PO) chlorambucil 6 mg/m2 daily for 42 con-
secutive days (weeks 1-6) and intravenous (IV) rituximab 375 mg/m2 on days 1, 8, 15 and 22. After restaging (weeks 7-8), patients with complete remission (CR), partial remission (PR), or stable disease (SD) received daily chlorambucil 6 mg/m2 PO for 14 consecutive days (d1-14) every 28 days (one cycle) for up to 4 cycles in combination with SC rituximab 1,400 mg on day 1 every 28 days for 4 cycles. After the induction phase, patients were restaged, and those with at least SD underwent maintenance treatment with rituximab 1,400 mg SC every two months for two years (see Online Supplementary Appendix, Online Supplementary Figure S1).
Study endpoints and clinical assessment
The study endpoints were defined according to the revised response criteria for malignant lymphoma.12 Primary end point was investigator-assessed CR rate at the end of induction. Secondary endpoints included investigator-assessed overall response rate (ORR), duration of response, PFS, EFS, and OS for all patients.12
Toxicity analysis was carried out using NCI Common Terminology Criteria for Adverse Events (CTCAE v4.03).13
Disease restaging for efficacy assessment was performed during weeks 7-8 and at the end of induction (weeks 25-26), then every year during maintenance. Following the revised response criteria for malignant lymphoma,12 responses at radiologically measurable lesions were assessed by CT; PET uptake was not used for response definition. In case of intestinal involvement, response had to be confirmed by absence of lymphoma in post-treatment endoscopic biopsy. The histological response of gastric lymphomas was evaluated according to the scoring system of the Groupe d’Etude des Lymphomes de l’Adulte (GELA).14 Cutaneous involvement was assessed by clinical examination, biopsy of normal-appearing skin was not required to assign a complete response. At the completion of trial therapy, patients were followed every four months during the first two years, then every six months for three years, and annually up to ten years from study entry. All patients who received at least one dose of therapy were included in the safety analysis, while the efficacy analysis comprised only patients without any major protocol violation that could affect the assessment of the study regimen activity.
Sample size calculation and statistical considerations
Sample size estimation was based on the primary endpoint (CR rate at the end of induction). The number of required patients was calculated, with a=0.05 (one-sided test) and 90% power, to show a CR rate higher than that in the chlorambucil alone arm of the previous IELSG19 study (H0=65%) and at least as high as in the chlorambucil plus IV rituximab arm (H1=78%) of the same study. Moreover, the required sample size had to retain the 90% power (with a=0.05, two-sided) to detect clinically relevant improvements of 15% in 5-year EFS and PFS in comparison
with those observed in the IELSG19 trial (68% and 72%, respectively).8
In a post-hoc analysis, the impact of early relapse was estimated on OS calculated from disease progression, in patients with progression of disease within 24 months of treatment initiation (POD24), and from 24 months after start of treatment in those without using the same methodology adopted in a prior analysis of the IELSG19 study cohort.5 The median follow-up was computed by the reverse Kaplan-Meier method.15 Survival curves were estimated by the Kaplan-Meier method,16 and differences were evaluated using the log-rank test.17 Binomial exact 95% confidence intervals (95%CI) were calculated for proportions. Associations were analyzed by using the χ2 or the Fisher’s exact test, as appropriate. Cox proportional hazard models were used for multivariable analysis and the estimation of hazard ratios (HR). Statistical analysis was performed by using the Stata/SE 17.0 software package (StataCorp, College Station, TX, USA).
Results
Between January 2014 and March 2016, 112 patients were enrolled in 38 sites in Switzerland, Italy, and France. A central histology review was not planned. The clinical cut-off date for the primary analysis was November 15, 2021. Median age at diagnosis was 66 years (range 32-86); 53% were males. An Eastern Cooperative Oncology Group (ECOG) performance status score PS=0 was registered in 80% of patients. Over half of patients (56%) had stage III-IV disease. According to the Mucosa-Associated Lymphoid Tissue International Prognostic Index (MALT IPI), 30% of patients had low risk, 40% intermediate and 30% high risk. Primary lymphoma localization was non-gastric in 68% and gastric in 32% of treated patients. The most frequent sites of involvement were stomach in 36 patients (32%), 16 each for lung and orbit (14%), salivary glands in 12 (11%), bowel in 8 (7%), skin in 7 (6%), upper airways in 4 (4%), peritoneum in 3 (3%), 2 each for thyroid and liver (2%), and one each for prostate, kidney, and vagina (1%). Additionally, 3 patients with splenic MZL were also included. Twenty-seven patients received prior therapy; among them, 22 (20%) received antibiotics, 4 (4%) underwent surgery, while one patient had received prior radiotherapy. Baseline patients’ and disease characteristics are summarized in Table 1.
Eighty-eight patients (79%) completed the study treatment according to the protocol. Fifteen discontinued before starting maintenance, 4 of them due to drug-related (DR) adverse events (AE), 3 due to non-DR AE, 2 due to high-grade transformation, and 2 due to withdrawal of consent. One patient each discontinued due to progressive disease (PD), a second tumor, protocol deviation, and investigator decision. Nine patients withdrew treatment during the maintenance phase: 3 for DR AE, 2 for PD, 2 due to other malignancies,
Table 1. Patients’ characteristics (N=112).
Primary site
Stomach
Lung
Orbit
Salivary
Bowel
Skin
*Primary splenic involvement (N=3 patients) was not considered extranodal. Percentages may not total 100 due to rounding. ECOG: Eastern Cooperative Oncology Group; LDH: lactate dehydrogenase; MALT IPI: Mucosa-Associated Lymphoid Tissue International Prognostic Index.
one for patient decision, and one for a protocol deviation.
Efficacy
Albeit ineligible, 3 patients with primary splenic MZL were enrolled. These patients achieved an early CR and then re-
ceived the entire study treatment. They have not relapsed, but according to the protocol they were excluded from the efficacy analysis, which was performed on the eligible and evaluable subjects (efficacy population, N=109). Fifty-seven of 109 patients (52%; 95%CI: 43-62) obtained a CR at the end of induction (primary endpoint) and 37 patients had a PR, resulting in ORR of 86% (95%CI: 78-92) (Table 2). Six patients had an early progression of disease (POD24). Five of them were re-biopsied at progression and 2 had a histologically confirmed transformation into high-grade lymphoma.
Complete remission rate increased over the time period under study, being documented in 66 patients (61%; 95%CI: 51-70) after one year of maintenance and in 76 (70%; 95%CI: 61-78) at the end of the second year. Five additional patients converted from PR to CR during the post-maintenance follow-up (Table 2). Overall, 90 patients (83%; 95% CI: 7489) achieved a CR as their best response any time during the study duration. Median time to response (either CR or PR) was 2.8 months (interquartile range, 1.7-8.2 months). Responses were durable, with 93% (95% CI: 86-97) of patients who achieved either PR or CR still in continuous remission at five years from the response attainment. The Kaplan-Meier estimate of response duration for patients achieving a CR is shown in Figure 1.
With a median follow-up of 70 months (interquartile range, 65-76 months) the estimated 5-year PFS, EFS, and OS rates in the efficacy population were 87% (95% CI: 78-92), 84% (95% CI: 75-89), and 93% (95% CI: 86-96), respectively (Figure 2). Outcome analysis in the whole cohort of 112 patients is summarized in Online Supplementary Table S1. The patients who achieved a CR as their best response showed superior 5-year PFS rates to those achieving a PR: 93% (95% CI: 85-97) versus 70% (95% CI: 33-89), respectively (P=0.0422). Similarly, EFS rates were significantly higher in those attaining CR: 92% (95% CI: 84-96) compared to 58% (95% CI: 27-80) for those achieving PR (P=0.009).
According to the primary lymphoma localization, CR rate at the end of induction was significantly higher (P<0.001) for gastric MZL (84%; 95% CI: 67-95) compared to non-gastric localizations (46%; 95% CI: 34-59), while ORR was 100% and 96%, respectively. However, the difference in terms of best response, with a CR rate of 92% (95% CI: 77-98) for gastric and 78% (95%CI: 67-87) for non-gastric MZL, was not statistically significant (P=0.079). Moreover, no significant difference was seen between gastric and non-gastric MZL also in terms of PFS (P=0.300), EFS (P=0.279), and OS (P=0.612). At univariable analysis, age >70 years, elevated β-2 microglobulin, hemoglobin <120 g/L, and the MALT-IPI score (trend test) were individually associated with significantly shorter PFS, EFS, and OS. In the cohort of 105 patients evaluable for early progression, the 6 patients with POD24 had a significantly shorter OS. At multivariable analysis, only anemia maintained a significant impact on PFS, while both anemia and elevated β-2 microglobulin
Table 2. Response rate at the planned restaging timepoints after 6 months of induction immunochemotherapy (primary endpoint) and after 12 and 24 months of rituximab maintenance in the efficacy population (N=109).
Response
After induction (month 6)
After 1 year of maintenance (month 18)
After 2 years of maintenance (month 30)
During follow-up (up to month 60)
CR: complete remission; PR: partial remission; SD: stable disease; PD: progressive disease (including those progressing between the scheduled restaging timepoint); NA: not assessed. Percentages may not total 100 due to rounding.
Figure 1. Kaplan-Meier estimate of the duration of complete response. Of 90 patients with complete remission, 95% (95% Confidence Interval [CI]: 87-98%) remained in complete remission (CR) at five years from response attainment.
levels were associated with shorter EFS and shorter OS. POD24, when added to the OS Cox model, retained its significant impact.
The Online Supplementary Appendix shows remission rates and survival outcomes at each primary anatomic site of lymphoma involvement (Online Supplementary Table S2), as well as the univariable (Online Supplementary Table S3) and multivariable (Online Supplementary Table S4) analysis of the prognostic impact of the main clinical features.
Safety
All patients received at least one dose of treatment and all experienced AE of any grade. Seventy-two DR grade ≥3 hematologic AE were reported in 46 patients (41%); among them, neutropenia was the most frequently observed (37 patients, 33%) (Table 3). Non-hematologic AE were almost exclusively of grade 1-2, with asthenia, nausea, and infusion-related reactions being the most frequently observed
A total of 45 serious adverse events (SAE) occurred involving 35 patients; 6 of them had a therapy-related SAE, 2 (fever of unknown origin, respiratory failure) occurred during the induction phase, and 3 (sepsis, pneumonia, and encephalopathy with severe autoimmune cerebellar ataxia resulting in permanent total disability) during maintenance. One drug-related SAE of acute myeloid leukemia (AML) was reported during the follow up. This patient had discontinued the study treatment after five months due to a non-drug-related transient ischemic attack, while the diagnosis of AML, attributed to chlorambucil, occurred two years later. It is worth noting that a baseline bone marrow evaluation was conducted during the screening, revealing no evidence of lymphoma or any underlying myelodysplastic syndrome prior to the initiation of the study treatment. A second case of encephalopathy with severe cerebellar ataxia, which eventually resulted in the patient’s death, was also reported, and was defined by the treating investigator as paraneoplastic, and not related to the study treatment. Notably, in both patients with cerebellar ataxia, the presence of JC virus was actively searched for and ruled out. Among SAE, in addition to the above-mentioned AML, 15 other malignancies were diagnosed during the study but considered not to be related to the study treatment (3 cutaneous basal cell carcinoma, 3 breast cancer, 3 lung cancer, 2 hepatocellular carcinoma, 1 pancreatic carcinoma, 1 melanoma in situ, 1 prostate cancer, 1 Hodgkin lymphoma). Histologic transformation into large cell lymphoma was reported in 3 patients.
Eleven deaths were observed, but only one was related to study treatment (i.e., AML). Among non-drug related deaths, 2 patients died due to progressive disease, 2 after histologic transformation into DLBCL, 2 due to lung carcinoma, one for a progressive encephalopathy associated with the above-mentioned cerebellar ataxia, and one for SARS-CoV-2 infection. In 2 patients, the cause of death remained unknown.
Figure 2. Kaplan-Meier survival estimates. (A) Event-free survival (EFS), (B) progression-free survival (PFS), and (C) overall survival (OS) in the efficacy population (N=109).
Discussion
The IELSG38 trial was designed on the backbone of the combination arm of the IELSG19 study,8 and it is the first prospective clinical trial which specifically assessed in MALT lymphomas whether the use of SC rituximab results in similar rates of CR as previously observed at the end of induction in the IELSG19 trial, and whether maintenance with SC rituximab is of any benefit. While no unexpected safety signals emerged, the primary endpoint was not met. This primary endpoint (CR rate at 6 months) was chosen to allow a rapid evaluation of the clinical activity of the SC route. However, this choice represents a major weakness in a study assessing the role of maintenance. Indeed, CR rates continuously increased over time, and rituximab maintenance allowed long-term disease control with improvement of both EFS and PFS. In this context, there are differences between this trial and the IELSG19 that impact the observed outcomes. Despite identical inclusion criteria, slightly more patients with advanced stage (56% vs. 45%), extragastric localization (68% vs. 60%), elevated lactate dehydrogenase (13% vs. 10%), elevated β-2 microglobulin (34% vs. 27%), and high-risk MALT-IPI score (30 vs. 18%) entered the IELSG38 trial compared with the IELSG19 combination arm.8 The main distinction, however, lies in the
utilization of updated response definitions in the current study,12 while the IELSG19 adopted older definitions.18 Moreover, in the current trial, the number of CR increased from 52% at six months to 70% at the end of maintenance. Maintenance might have also contributed to a reduction of the number of patients with POD24 (6% in the current study and 13% in the IELSG195). Regarding time-related secondary endpoints, the 5-year PFS (87%; 95% CI: 78-92) and EFS (83%; 95% CI: 75-89) were both superior to those of 72% (95% CI: 63-79), and 68% (95% CI: 60-76), respectively, observed without maintenance in the combination arm of the IELSG19 study.8 The duration of response (93%; 95% CI: 86-97%) was also longer than that observed without maintenance in the prior study (79%; 95% CI: 71-85).8 The need for rituximab maintenance in non-follicular indolent lymphomas is controversial, with no evidence of OS benefit.19-23 In the MALT2008-01 response-adapted prospective phase II trial of the front-line combination of bendamustine and rituximab in extranodal MZL, patients received no maintenance and achieved a 7-year EFS of 88%.9 Nowadays, rituximab maintenance is not recommended or is considered optional in front-line treatment of MALT lymphoma.11,24,25 Indeed, there are only few published data in the specific setting of patients with MZL, and MALT lymphoma in particular.23,26 The ECOG E4402 study, which
Table 3. Hematologic toxicity observed in ≥5% of patients (safety population N=112).
Percentages may not total 100 due to rounding.
Table 4. Non-hematologic toxicity observed in ≥5% of patients (safety population N=112).
Percentages may not total 100 due to rounding.
compared maintenance rituximab versus retreatment in indolent lymphomas, enrolled 71 MZL patients (29 with MALT lymphoma) who had responded to prior single-agent rituximab. The 5-year treatment failure-free survival was significantly better in the maintenance arm (45% vs. 20%; P=0.012) for patients with small lymphocytic lymphoma and MZL but specific data on the different histologic subsets were not reported.21 Results of the STIL NHL7-2008 MAINTAIN TRIAL, so far published only as an abstract, showed an improvement of PFS in patients with splenic MZL and nodal MZL treated with rituximab maintenance in comparison to observation after rituximab plus bendamustine; the study did not enroll MALT lymphoma patients.23 On the other hand, an exploratory analysis of the randomized Gallium trial, which evaluated the efficacy and safety of obinutuzumab- or rituximab-based chemotherapy followed by obinutuzumab or rituximab maintenance in patients with previously untreated MZL, including MALT lymphomas, did not demonstrate any difference in terms of PFS between the two arms, but the obinutuzumab arm had more AE.27 A Korean group reported results of a phase II trial which evaluated 2-year rituximab maintenance in patients with advanced MZL responding to first-line therapy with the
R-CVP (rituximab, cyclophosphamide, vincristine, and prednisolone) regimen. This study enrolled 47 patients, 30 of whom had an extranodal MZL. Forty-five patients (96%) received rituximab maintenance. The 3-year PFS rate was 81%.26 Finally, in a retrospective international survey of 237 patients with extranodal MZL treated with front-line rituximab plus bendamustine, with or without maintenance, the 5-year PFS was 81% in the entire group and 94% in the subset of 48 patients (20%) who had rituximab maintenance; however, maintenance had no impact on OS.25 Our results show a potential benefit from maintenance with SC rituximab on response quality and duration, as well as on EFS and PFS. Interestingly, considering the different rates of CR at the end of induction, and CR as best response in gastric and non-gastric patients, maintenance may be particularly useful in patients with non-gastric lymphoma. Nevertheless, it is important to consider that the response assessment for gastric lymphoma was based on endoscopic biopsies and not on imaging. This may have affected the observed differences in response rates. Indeed, no significant difference was seen between gastric and non-gastric MZL in terms of PFS, EFS, and OS, but the study is underpowered for this analysis. Hence, the
maintenance benefit should be confirmed in a randomized setting before recommending prolonged treatment in patients with MALT lymphoma.
As also indicated by the MALT2008-01 study mentioned above,9 patients achieving a rapid CR may not need additional treatments. In our study, and similar to all other indolent lymphomas, maintenance had no effect on OS and the recent COVID pandemic has made us more alert to the risk of infectious complications after cancer treatments that induce prolonged immunodeficiency.28 Moreover, albeit acceptable (<10% of the patients in the IELSG38 discontinued treatment due to AE), toxicity may be increased by maintenance, particularly hematologic side effects and (opportunistic) infections.
The incidence of other malignancies (15%) diagnosed during and after treatment is similar to the incidences reported in other studies and is most likely related to the older median age of the patients.29-31 Two patients developed cerebellar ataxia, with a different evaluation of causality. Notably,, despite being extremely rare, this paraneoplastic syndrome has been reported in patients with MZL.32,33 In conclusion, SC rituximab did not improve remission rates at the end of induction, which was the main endpoint. However, the CR rate increased over time, and SC rituximab maintenance might have allowed for long-term disease control and a potential improvement in EFS and PFS.
Disclosures
AS reports advisory boards from Debiopham, Janssen, AstraZeneca, Incyte, Eli Lilly, Novartis, Roche; research funding from Abbvie, ADC Therapeutics, Amgen, AstraZeneca, Bayer, Cellestia, Incyte, LoxoOncology, Merck MSD, Novartis, Pfizer, Philogen, Roche; travel grant from Incyte, AstraZeneca; expert testimonies from Bayer, Eli Lilly. PF reports consultancy, advisory boards, and honoraria from Abbvie, AstraZeneca, Gilead, Janssen, BeiGene. HG reports consultancy from Gilead, Roche; honoraria from Gilead, Roche, BMS/ Celgene, Abbvie. GM reports consultancy and honoraria from Janssen, Incyte, Roche, Abbvie. FGR reports advisory boards from Takeda, Italfarmaco. RG reports honoraria from Janssen, Roche, AstraZeneca, Abbvie, BeiGene, Amgen. EG reports honoraria from Roche. FM reports consultancy from Roche, Gilead, Abbvie; board of directors or advisory committees from Roche, Gilead, Abbvie, Novartis BMS/ Celgene, Genmab, Miltenyi, Allogene Therapeutics, AstraZeneca, Janssen. AC reports honoraria from Roche, Abbvie, Incyte, Takeda, Regeneron. HT reports board of directors or advisory committees from ADC Therapeutics, BMS/Celgene, Incyte, Roche; research funding from Roche. AP reports speaker’s bureau or advisory boards from Roche, Merk MSD, Pfizer, Sandoz, Takeda, Gilead, Bristol Meyer Squibb, Janssen. ROC reports honoraria from Roche, Takeda, BMS/ Celgene, Merck MSD, Gilead, Janssen, ADC Therapeutics, Incyte, AstraZeneca; consultancy or advisory boards from Roche, Takeda, BMS/Celgene, Merck MSD, Gilead, Janssen,
ADC Therapeutics, Incyte, AstraZeneca; research funding from Roche, Takeda, Gilead, AbbVie. GC reports advisory boards from Ownards Therapeutic, MabQi; consultancy from Roche, BMS/Celgene, Abbvie; honoraria from Sanofi, Gilead, Novartis, Milteny, Takeda. CH reports consulting or advisory from Roche, Celgene, Janssen-Cilag, Gilead, Takeda, Miltenyi, Abbvie, ADC Therapeutics; honoraria from Novartis, Amgen, Servier, Pfizer, Gilead. AML reports consulting from Amgen and Servier; honoraria from Iqvia, Incyte, Celgene, Abbvie, BMS/Celgene, Janssen; research funding from Takeda, Roche, Celgene, Abbvie, Millenium, Janssen, Sanofi, Verastem, Novartis, Morphosys, GSK, Oncopeptides, Karyopharm, Onconova, Archigen, Fibrogen, Dr. Reddy’s Lab, LoxoOncology, BeiGene, BMS/Celgene, PSI. HR reports honoraria from Bristol-Myers Squibb, Merck MSD, Kite/Gilead, Roche, Novartis, Janssen, Celgene. FB reports research funding from ADC Therapeutics, Bayer AG, Cellestia, Helsinn, ImmunoGen, Menarini Ricerche, NEOMED Therapeutics 1, Nordic Nanovector ASA, Oncternal Therapeutics; consultancy fee from Helsinn, Menarini; expert statements from HTG. DR reports honoraria from AstraZeneca, Abbvie, BeiGene, BMS/Celgene, Janssen; research funding from AstraZeneca, Abbvie, BeiGene, Janssen. SL reports advisory board from Roche, Janssen, BMS/Celgene, Kite/Gilead, Regeneron, Genmab, Takeda; speaker bureau from Janssen, BMS/Celgene. EZ reports advisory boards of BeiGene, BMS, Curis, Eli/Lilly, Incyte, Ipsen, Janssen, Merck, Miltenyi Biomedicine and Roche; research support from AstraZeneca, Beigene, BMS/Celgene, Incyte, Janssen, and Roche; travel grant from AstraZeneca, BeiGene, Janssen, Gilead, and Roche. MCP, LO, MT, FM, GG, DM, RG, FC, FP, BT, MZ, MGC, EC, CC, MC, FA, UO, LD, MM, GP, FR, MS, FL, FC, NI, EB have no conflicts of interest to disclose.
Contributions
AS and EZ designed the trial and wrote the study protocol. AS, MCP, SL, EZ and CT analyzed the data and wrote the manuscript. AS, MCP and EZ accessed and verified the trial data. NI, EB and BP coordinated regulatory activities and collection, assembly and management of the data. The remaining authors registered and treated patients or provided follow-up data. All authors provided critical review of the manuscript and approved the definitive version and its submission.
Acknowledgments
We are indebted to our patients and their families for their commitment. We thank all the clinical investigators and research nurses. We appreciate the excellent assistance of the study coordinators at each study center, as well as the administrative support in data collection and study conduction from the clinical project manager and central study team at the IELSG coordinating center (Bellinzona, Switzerland), at the FIL coordination centers (Alessandria and Modena, Italy), and at the LYSARC headquarters
(Lyon, France). The IELSG is supported by the Swiss Cancer Research Foundation and the Swiss Cancer League. The funders had no role in study design, data collection, analysis, or interpretation or writing of this report. We also express gratitude to Rita Gianascio Gianocca for the excellent secretarial assistance.
Funding
Data-sharing statement
The dataset generated and analyzed during the current study is not publicly available due to legal restrictions. De-identified data sharing could be possible for scientific research on reasonable request addressed to the IELSG (ielgs@ior.usi.ch).
The IELSG38 academic trial was sponsored by the IELSG and was funded in part by an unrestricted research grant from Roche.
References
1. Rossi D, Bertoni F, Zucca E. Marginal-zone lymphomas. N Engl J Med. 2022;386(6):568-581.
2. Cerhan JR, Habermann TM. Epidemiology of marginal zone lymphoma. Ann Lymphoma. 2021;5:1.
3. Thieblemont C, Cascione L, Conconi A, et al. A MALT lymphoma prognostic index. Blood. 2017;130(12):1409-1417.
4 Alderuccio JP, Reis IM, Habermann TM, et al. Revised MALT-IPI: a new predictive model that identifies high-risk patients with extranodal marginal zone lymphoma. Am J Hematol. 2022;97(12):1529-1537.
5. Conconi A, Thieblemont C, Cascione L, et al. Early progression of disease predicts shorter survival in MALT lymphoma patients receiving systemic treatment. Haematologica. 2020;105(11):2592-2597.
6. Luminari S, Merli M, Rattotti S, et al. Early progression as a predictor of survival in marginal zone lymphomas: an analysis from the FIL-NF10 study. Blood. 2019;134(10):798-801.
7 Alderuccio JP, Zhao W, Desai A, et al. Short survival and frequent transformation in extranodal marginal zone lymphoma with multiple mucosal sites presentation. Am J Hematol. 2019;94(5):585-596.
8. Zucca E, Conconi A, Martinelli G, et al. Final results of the IELSG-19 randomized trial of mucosa-associated lymphoid tissue lymphoma: improved event-free and progression-free survival with rituximab plus chlorambucil versus either chlorambucil or rituximab monotherapy. J Clin Oncol. 2017;35(17):1905-1912.
9 Salar A, Domingo-Domenech E, Panizo C, et al. Long-term results of a phase 2 study of rituximab and bendamustine for mucosa-associated lymphoid tissue lymphoma. Blood. 2017;130(15):1772-1774.
10 Becnel MR, Nastoupil LJ, Samaniego F, et al. Lenalidomide plus rituximab (R(2) ) in previously untreated marginal zone lymphoma: subgroup analysis and long-term follow-up of an open-label phase 2 trial. Br J Haematol. 2019;185(5):874-882.
11. Zucca E, Arcaini L, Buske C, et al. Marginal zone lymphomas: ESMO clinical practice guidelines for diagnosis, treatment and follow-up. Ann Oncol. 2020;31(1):17-29.
12. Cheson BD, Pfistner B, Juweid ME, et al. Revised response criteria for malignant lymphoma. J Clin Oncol. 2007;25(5):579-586.
13. NCI. Common Terminology Criteria for Adverse Events (CTCAE) version 4.03. 2010. https://evs.nci.nih.gov/ftp1/CTCAE/ CTCAE_4.03/CTCAE_4.03_2010-06-14_QuickReference_8.5x11. pdf Accessed July 30, 2023.
14 Copie-Bergman C, Gaulard P, Lavergne-Slove A, et al. Proposal for a new histological grading system for post-treatment evaluation of gastric MALT lymphoma. Gut. 2003;52(11):1656.
15. Altman DG, De Stavola BL, Love SB, Stepniewska KA. Review of survival analyses published in cancer journals. Br J Cancer. 1995;72(2):511-518.
16. Kaplan EL, Meier P. Nonparametric estimation from incomplete observations. J Am Stat Assoc. 1958;53:457-481.
17 Kalbfleisch JD, Prentice RL. The statistical analysis of failure time data. New York: John Wiley & Sons; 1980.
18. Cheson BD, Horning SJ, Coiffier B, et al. Report of an international workshop to standardize response criteria for non-Hodgkin’s lymphomas. NCI Sponsored International Working Group. J Clin Oncol. 1999;17(4):1244.
19 Taverna C, Martinelli G, Hitz F, et al. Rituximab maintenance for a maximum of 5 years after single-agent rituximab induction in follicular lymphoma: results of the randomized controlled phase III trial SAKK 35/03. J Clin Oncol. 2016;34(5):495-500.
20 Hainsworth JD, Litchy S, Shaffer DW, Lackey VL, Grimaldi M, Greco FA. Maximizing therapeutic benefit of rituximab: maintenance therapy versus re-treatment at progression in patients with indolent non-Hodgkin’s lymphoma--a randomized phase II trial of the Minnie Pearl Cancer Research Network. J Clin Oncol. 2005;23(6):1088-1095.
21. Williams ME, Hong F, Gascoyne RD, et al. Rituximab extended schedule or retreatment trial for low tumour burden nonfollicular indolent B-cell non-Hodgkin lymphomas: Eastern Cooperative Oncology Group Protocol E4402. Br J Haematol. 2016;173(6):867-875.
22. Salles G, Seymour JF, Offner F, et al. Rituximab maintenance for 2 years in patients with high tumour burden follicular lymphoma responding to rituximab plus chemotherapy (PRIMA): a phase 3, randomised controlled trial. Lancet. 2011;377(9759):42-51.
23. Rummel MJ, Koenigsmann M, Chow KU, et al. Two years rituximab maintenance vs. observation after first line treatment with bendamustine plus rituximab (B-R) in patients with marginal zone lymphoma (MZL): results of a prospective, randomized, multicenter phase 2 study (the StiL NHL7-2008 MAINTAIN trial). J Clin Oncol. 2018;36(15_suppl):7515.
24. Zelenetz AD, Gordon LI, Abramson JS, et al. NCCN Guidelines® Insights: B-cell lymphomas, version 6.2023. J Natl Compr Canc Netw. 2023;21(11):1118-1131.
25. Alderuccio JP, Arcaini L, Watkins MP, et al. An international analysis evaluating frontline bendamustine with rituximab in extranodal marginal zone lymphoma. Blood Adv. 2022;6(7):2035-2044.
26. Oh SY, Kim WS, Kim JS, et al. Phase II study of R-CVP followed by rituximab maintenance therapy for patients with advanced marginal zone lymphoma: consortium for improving survival of lymphoma (CISL) study. Cancer Commun (Lond). 2019;39(1):58.
27. Herold M, Hoster E, Janssens A, et al. Immunochemotherapy and maintenance with obinutuzumab or rituximab in patients with previously untreated marginal zone lymphoma in the randomized GALLIUM trial. Hemasphere. 2022;6(3):e699.
28. Buske C, Dreyling M, Alvarez-Larrán A, et al. Managing hematological cancer patients during the COVID-19 pandemic: an ESMO-EHA Interdisciplinary Expert Consensus. ESMO Open. 2022;7(2):100403.
29. Au WY, Gascoyne RD, Le N, et al. Incidence of second neoplasms in patients with MALT lymphoma: no increase in risk above the background population. Ann Oncol. 1999;10(3):317-321.
30 Tajika M, Matsuo K, Ito H, et al. Risk of second malignancies in patients with gastric marginal zone lymphomas of mucosa
31. Zucca E, Pinotti G, Roggero E, et al. High incidence of other neoplasms in patients with low-grade gastric MALT lymphoma. Ann Oncol. 1995;6(7):726-728.
32. Shams’ili S, Grefkens J, de Leeuw B, et al. Paraneoplastic cerebellar degeneration associated with antineuronal antibodies: analysis of 50 patients. Brain. 2003;126(Pt 6):1409-1418.
33. Cao X, Xu CG. Paraneoplastic cerebellar degeneration: initial presentation of mucosa-associated lymphoid tissue lymphoma in a patient with primary Sjögren’s syndrome. Chin Med J (Engl). 2020;133(8):1005-1007.
Selective pharmacologic targeting of CTPS1 shows singleagent activity and synergizes with BCL2 inhibition in aggressive mantle cell lymphoma
Romane Durand,1 Céline Bellanger,1 Charlotte Kervoëlen,1 Benoit Tessoulin,2 Christelle Dousset,1 Emmanuelle Menoret,1 Hélène Asnagli,3 Andrew Parker,3 Philip Beer,3 Catherine Pellat-Deceunynck1 and David Chiron1
1Nantes Université, INSERM, CNRS, Université d’Angers, CRCI2NA, Nantes; 2Nantes Université, CHU de Nantes, INSERM, CNRS, Université d’Angers, CRCI2NA, Nantes and 3Step Pharma, Saint-Genis-Pouilly, France
Correspondence: D. Chiron david.chiron@univ-nantes.fr
Received: September 21, 2023.
Accepted: February 13, 2024. Early view: February 22, 2024.
Innovative therapeutic strategies have emerged over the past decade to improve outcomes for most lymphoma patients. Nevertheless, the aggressive presentation seen in high-risk mantle cell lymphoma (MCL) patients remains an unmet medical need. The highly proliferative cells that characterize these tumors depend on nucleotide synthesis to ensure high DNA replication and RNA synthesis. To take advantage of this vulnerability, STP-B, a clinically available small molecule selectively targeting CTP synthase 1 (CTPS1) has been recently developed. CTPS1 is a key enzyme of the pyrimidine synthesis pathway mediated through its unique ability to provide enough CTP in highly proliferating cells. Herein, we demonstrated that CTPS1 was expressed in all MCL cells, and that its high expression was associated with unfavorable outcomes for patients treated with chemotherapy. Using aggressive MCL models characterized by blastoid morphology, TP53 mutation or polyresistance to targeted therapies, we showed that STP-B was highly effective at nanomolar concentrations in vitro and in vivo, irrespective of these high-risk features. Inhibition of CTPS1 rapidly leads to cell cycle arrest in early S-phase accompanied by inhibition of translation, including of the anti-apoptotic protein MCL1. Consequently, CTPS1 inhibition induced synergistic cell death in combination with the selective BCL2 inhibitor venetoclax, both in vitro and in vivo. Overall, our study identified CTPS1 as a promising target for MCL patients and provided a mechanism-based combination with the BCL2 inhibitor venetoclax for the design of future chemotherapy-free treatment regimens to overcome resistance.
Introduction
Since the approval of imatinib in the early 2000s, dozens of targeted therapies have been developed and are now part of the therapeutic arsenal for solid and hematological malignancies.1 Identified as Achilles’ heels of mature B-cell lymphomas, the selective inhibition of CD20 (i.e., rituximab, obinutuzumab), BCL2 (i.e., venetoclax) and BTK (i.e., ibrutinib, acalabrutinib) has recently led to remarkable clinical activity. These molecules have shown great promise in combination with chemotherapy,2,3 and are now being evaluated in combination as first-line chemotherapy-free regimens,4,5 changing the treatment paradigm for indolent i.e., chronic lymphocytic leukemia (CLL), and aggressive i.e., mantle cell lymphoma (MCL), malignancies. These novel strategies are improving patient survival, but around a third
of MCL patients have high-risk disease, which remains associated with rapid relapse and poor outcome.2,6,7 Biological risk factors characterizing this population, such as high proliferation index (Ki-67), blastoid morphology or TP53 alterations, are now well described.8 Nevertheless, aside from the promising initial results obtained with chimeric antigen receptor (CAR) T cells,9 treatment options for these patients remain an unmet medical need.
Aggressive cancer cells rely on metabolic reprogramming to maintain the hyperactive synthesis of DNA, RNA and phospholipid required to sustain high proliferation and survival.10 The dependence of MCL cells on high rates of DNA synthesis has been successfully exploited by nucleoside analogs such as cytarabine (ara-C).11,12 As the treatment of hematological cancers moves away from chemotherapy towards targeted agents, inhibition of nucleotide synthe-
sis remains an attractive strategy, especially by targeting cytidine triphosphate synthases (CTPS). CTPS1 and 2, key enzymes of the pyrimidine synthesis pathway, catalyze the rate-limiting step of CTP de novo synthesis.13,14 Elevated activity of CTPS in cancer was highlighted decades ago, but strategies to target these enzymes have so far resulted in toxicities and limited efficacies in vivo 15,16 A recent surge of interest has come from our better understanding of the differential role of CTPS1 and 2. Indeed, human studies have revealed that individuals carrying an inherited homozygous hypomorphic mutation in CTPS1 display a marked defect in the proliferation of activated T and B cells, with no phenotype outside of the hematopoietic system.17,18 These studies suggested that the selective inhibition of CTPS1, but not CTPS2, could be an innovative targeted strategy in aggressive lymphoid malignancies. In vitro functional studies further confirmed a specific role of CTPS1 and 2 and in vitro loss-of-function experiments (clustered regularly interspaced short palindromic repeats [CRISPR], small hairpin RNA [shRNA]) have demonstrated the dependence of B and T lymphomas, as well as certain solid tumors, on CTPS1 for their proliferation, especially when CTPS2 level is low.19-23
STP-B is a highly selective small molecule inhibitor of CTPS1, with more than 1,300-fold selectivity over CTPS2.24 In the present work, we evaluated the efficacy of pharmacological CTPS1 inhibition as single-agent therapy, and in combination with targeted therapies in vitro (cell lines, primary cells) and in vivo (cell line, patient-derived xenograft [PDX]), in MCL models displaying high-risk features. Our results demonstrate the efficacy of STP-B in these preclinical models, document its mechanisms of action and highlight a mechanism-based rationale for combination with the BCL2 inhibitor venetoclax.
Methods
Cell culture
Cell lines were authenticated by major histocompatibility complex (MHC) class I sequencing (EFS Nantes, France) and routinely identified using a flow cytometry-based barcode.25 Samples were collected from peripheral blood (PB) after obtaining informed consent from MCL patients (REFRACT-LYMA cohort; ethical approval GNEDS-2015-09-13). MCL cells were enriched using anti-human CD19-conjugated magnetic beads (Miltenyi®) and cultured using previously described protocols.26
Drug testing
Cell lines were treated with a highly selective inhibitor of CTPS1 provided by Step Pharma,24 STP-B (1-3,000 nM), alone or in combination with venetoclax (0.25-3,000 nM) or ibrutinib (5-500 nM). Viability assays (CellTiter-Glo and Annexin-V staining) were performed 24 to 72 hours (h)
after treatment. The synergy score (Bliss) was calculated using ‘SynergyFinder’ website. Bromodeoxyuridine/propidium iodide (BrdU/PI) cell cycle analysis was performed as previously described.26
Transcriptomic analysis
Whole transcriptome sequencing of MCL cell lines cultured or not with STP-B, for 24 h at half maximal inhibitory concentration (IC50), and of MCL cells from patients involved in the REFRACT-LYMA cohort, was performed using the 3’sequencing-RNA Profiling (3’SRP) protocol previously described.27 Publicly available datasets from bulk and single-cell RNA sequencing (scRNA-seq) of MCL samples were also collected from the Gene Expression Omnibus database (GSE93291, GSE239497, GSE239353) and analyzed as previously described.28
In vivo mouse models
Six to 8-week-old NSG mice (N=40, Charles River) were used for the study. The study was conducted within the UTE (Unité Thérapeutique Expérimentale) animal core facility of IRS-UN (C44-278 certification renewed on December 17, 2015). Animal study was approved by Ethics Committee of Pays de la Loire, France (review CEEA.2010.49) and the French Ministry of Higher Education and Research and supported by the animal welfare structure of the UTE animal core facility of IRS-UN. The first and most important criteria throughout the study was the animals’ health: any mouse risking to drop 20% of body weight or showing any clinical signs indicating that the animal is not in good health (abnormal behavior, breathing difficulties, coat appearance, etc.) was removed from the study. Venetoclax (InVivoChem) was formulated extemporaneously and protected from light in 5% dimethylsulfoxide (DMSO) / 50% polyethylene glycol300 / 5% Tween80 / 40% ddH2O. STP-B (provided by Step Pharma) was formulated extemporaneously and protected from light in 10% benzyl alcohol and 90% Castor oil. Z138 and PDX models used in the study are detailed in the Online Supplementary Appendix. Additional methods are detailed in the Online Supplementary Appendix
Results
A high level of CTPS1, but not CTPS2, is predictive of a poor prognosis in mantle cell lymphoma
While the primary expansion zone of lymphomas is located in the lymph nodes (LN), MCL is characterized by early dissemination in virtually all patients, with lymphoma cells circulating in the bone marrow (BM) and peripheral blood (PB).29 RNA-seq analysis of primary MCL samples showed that CTPS1 was expressed at significantly higher levels than CTPS2 in the LN (N=100) as well as in circulating cells (N=72) (Figure 1A, B). A similar expression profile was also
observed in MCL cell lines at the RNA (N=11) and protein (N=6) levels (Figure 1C; Online Supplementary Figure S1A). In order to further assess the consequences of CTPS expression on clinical outcomes, we studied CTPS1/2 gene expression in datasets from MCL patients previously treated with chemotherapy (rituximab, cyclophosphamide, doxorubicin, prednisone, vincristine [R-CHOP], N=122). Patients with high CTPS1 expression (upper tercile) had significantly poorer overall survival (OS) with median OS of 0.83 year versus 4.68 years for the lower expressors (P<0.0001) (Figure 1D). This observation was confirmed in patients treated with an intensive chemotherapy regimen (rituximab, cisplatin, dexamethasone, and high-dose cytarabine [R-DHAP], Lyma-trial,30 N=98), in which patients with higher CTPS1 expression had significantly shorter OS (median not reached; P=0.037) (Figure 1E). In contrast, CTPS2 expression was not significantly associated with OS in either of these cohorts (Figure 1D, E)
Taken together, CTPS1, but not CTPS2, is expressed in all MCL cells and high levels are associated with unfavorable outcomes, supporting the rationale for its selective targeting in aggressive forms of MCL.
Selective targeting of CTPS1 by STP-B reduces viability of aggressive mantle cell lymphoma cells
Analysis of the DepMap CRISPR dataset31 suggested that all B-cell lymphoma cell lines were strictly dependent on CTPS1 but not CTPS2 for growth (dependency score mean: -0.93 vs. 0.00; N=70) (Online Supplementary Figure S1B). Consistent with this, targeting CTPS1 with STP-B, a small molecule inhibitor with high selectivity for CTPS1 over CTPS2,24 resulted in a dramatic loss of viability in all MCL cell lines tested (N=11, median IC50=220 nM; range, 7-3,100 nM), with all but one cell line having an IC50 of less than 1 μM (Table 1; Figure 2A). Response to STP-B was not correlated with CTPS1/2 mRNA level and was independent of
Figure 1. CTPS1, but not CTPS2, is highly expressed in mantle cell lymphoma and associated with poor prognosis. (A) CTPS1 and CTPS2 expression was assessed by RNA sequencing (RNA-seq) in lymph node (LN) biopsies from 100 mantle cell lymphoma (MCL) patients at diagnosis. (B) CTPS1/2 mRNA levels were analyzed by 3’SRP in MCL cells from bone marrow (BM, N=9) or peripheral blood (PB, N=63) patient samples. (C) CTPS1/2 expression was determined in 11 MCL cell lines (CL) by 3’SRP. Mann-Whitney test was used. **P<0.01, ****P<0.0001. (D) Overall survival probabilities with different CTPS1/2 expression were estimated by the Kaplan-Meier method. Probabilities were calculated on 122 MCL patients treated with rituximab, cyclophosphamide, doxorubicin, prednisone, vincristine (R-CHOP) (public dataset GSE93291). ****P<0.0001. (E) Overall survival probabilities with different CTPS1/2 expression were assessed similarly using data from the LYMA trial (N=98). *P<0.05. NS: not significant; R-DHAP: rituximab, cisplatin, dexamethasone, and high-dose cytarabine; 3’SRP: 3’sequencing-RNA profiling.
high-risk features such as TP53 mutation and resistance to venetoclax or ibrutinib (Table 1; Online Supplementary Figure S2A, B). This observation was corroborated by data from resistant isogenic cell lines: ibrutinib-resistant JeKo-1, venetoclax-resistant Maver-1 and Z138 TP53KO (CRISPR/Cas9) cell lines (Figure 2B, C; Online Supplementary Figure S2C; Online Supplementary Table S1).
The activity of STP-B as a single agent was confirmed in vivo using the ibrutinib/venetoclax double-resistant Z138 xenograft model. As shown in Figure 2D, tumor volume was significantly reduced in STP-B-treated mice compared with control mice, with inhibition of tumor growth after STP-B treatment reaching 46% by day 17. Of note, the 30 mg/kg dose of STP-B used was well tolerated by the mice (Online Supplementary Figure S3A). The activity of STP-B as a single agent was confirmed in a disseminated MCL model, using ibrutinib-resistant TP53MUT blastoid PDX cells. Over 60% inhibition of circulating MCL cells (huCD45+ cells) was achieved after three cycles of treatment (28 days after engraftment) (Figure 2E, left panel), and a significant gain in survival was observed (P<0.01), despite the aggressive phenotype of this model (Figure 2E, right panel). In contrast, the number of mouse peripheral blood mononuclear cells (PBMC) (huCD45- cells) was not significantly altered by treatment (Online Supplementary Figure S3B). Overall, these results demonstrated that MCL cells are CTPS1-dependent and that its selective inhibition by STP-B impairs growth of aggressive MCL in vivo.
CTPS1 is preferentially expressed in cycling mantle cell lymphoma cells and its targeting triggers early S-phase arrest
In order to further decipher the consequences of selective CTPS1 inhibition at the molecular level, we performed a transcriptomic analysis in nine MCL cell lines treated
or not with STP-B (IC50 for 24 h) ( Online Supplementary Figure S4A ). After STP-B treatment, 110 genes showed significantly altered expression (29 up- and 81 downregulated; adjusted P <0.05) ( Online Supplementary Figure S4B ). Functional annotation highlighted the disruption of transcriptional programs associated with translation (translation, cap-dependent translation) and cell cycle (M phase, anaphase, metaphase, cell cycle checkpoints, cell cycle) (Figure 3A). A deeper analysis of cell cycle associated genes highlighted an enrichment of the transcripts expressed in G1_early-S (e.g., E2F1/2, CDK4, PIK3IP1 and genes encoding Cyclin D, E and A) and a decrease of late-S_G2/M-associated genes (e.g., MKI67, PLK1, UBEC2, CDC20 and gene encoding Cyclin B), suggesting that CTPS1 inhibition by STP-B led to S-phase arrest (Figure 3B). Regarding transcription factors, YBX1, MYC and E2F family members (E2F3/4) were predicted to be inhibited by STP-B (TRRUST algorithm), in line with cell cycle modulation and recent studies on CTPS1 regulation.20,21,23 Using LN gene expression data from two cohorts of MCL patients, we showed that expression of CTPS1, but not CTPS2 , was significantly and positively correlated with proliferation index Ki67 (MKI67; P<0.0001) levels (Figure 3C). Such a correlation was also confirmed by scRNA-seq in circulating MCL cells, which are mainly characterized by resting cells and minor cycling subpopulations.28 Indeed, proliferating BM MCL cells, identified using a previously described cell-cycle signature,28 expressed higher levels of CTPS1 compared to resting cells (P<0.0001), while CTPS2 showed low levels in both populations (Figure 3D). Overall, these transcriptomic data showed that CTPS1 is highly expressed in proliferating cells and that its selective targeting alters cell cycle transit resulting in arrest in early S-phase.
Functional cell cycle analysis (BrdU/PI staining) of MCL
Half maximal inhibitory concentration (IC50) values were determined by Cell-Titer Glo assay in 11 mantle cell lymphoma (MCL) cell lines treated for 72 hours. Values represent the mean of 3 independent experiments. RNA-seq: RNA sequencing; SEM: standard error of the mean; EBV: Epstein-Barr virus; R: resistant (IC50 >1,000 nM), S: sensitive (IC50 <1,000 nM); wt: wild-type; ND: not determined.
Table 1. STP-B half maximal inhibitory concentration and mantle cell lymphoma cell line characteristics.
Figure 2. Selective CTPS1 targeting reduces tumor viability in aggressive mantle cell lymphoma preclinical models. (A) Dose response to STP-B was evaluated by CellTiter-Glo (CTG) assay in 11 mantle cell lymphoma (MCL) cell lines treated for 72 hours. (B) Response to STP-B was similarly assessed in JeKo-1 and a derived ibrutinib-resistant JeKo-1 (left graph) and in MAVER-1 and a derived venetoclax-resistant MAVER-1 (right graph). (C) Dose response to STP-B was evaluated by CTG assay in 2 Z138 TP53KO clones compared to isogenic Z138 TP53WT cells treated for 72 hours. (D) STP-B efficacy was determined in vivo using Z138 xenograft model. Mice were treated with vehicle (N=5) or 30 mg/kg STP-B (N=5) 4 consecutive days a week for 3 cycles. Tumor size was measured by caliper. (E) STP-B efficacy in vivo was assessed using a disseminated patient-derived xenograft (PDX) model (ibrutinib-resistant, TP53MUT, blastoid). Left panels: circulating MCL cells count was determined by flow cytometry (human [hu] CD45+) 21 days and 28 days after engraftment. Mann-Whitney test was used. **P<0.01. Right panel: survival of PDX mice treated with vehicle (N=5) or STP-B (N=5) was analyzed. Mantel-Cox and Gehan-Breslow-Wilcoxon tests were performed.
cell lines (N=5) further demonstrated that a 24-h exposure to STP-B resulted in a significant accumulation of early-S phase cells (fold increase 2.0) and a consequent drop in late S and G2/M cells (fold decrease 0.8 and 0.3, respectively) (Figure 4A). This was confirmed in proliferating MCL primary cells (N=11) (Figure 4B). While cell death remained low 24 h after CTPS1 inhibition, a cytotoxic effect was observed from 48 h onwards (lethal dose, 50% [LD50] <120 nM, N=3) (Figure 4C), highlighting that S-phase arrest was followed by massive cell death in highly proliferative cells in vitro.
STP-B synergizes with the cytotoxic BCL2 inhibitor venetoclax
In vitro combination studies were then undertaken with two targeted therapies widely used in MCL i.e., ibrutinib, a selective BTK inhibitor, and venetoclax, a selective BCL2 inhibitor. The combination STP-B/venetoclax, but not STP-B/ ibrutinib, led to supra-additive apoptosis (mean synergy score: 11.8 and -3.2, respectively, N=9) (Figure 5A; Online Supplementary Figure S5A, B). In contrast to the BCL2-negative UPN1 cells (synergy score: 0.3), BCL2-positive Z138, JeKo-1 and MINO cells, as well as their associated ibru-
tinib- and venetoclax-resistant derived cell lines, were synergically killed by the STP-B/venetoclax combination (Online Supplementary Figure S5B). Further experiments demonstrated that pretreatment of the venetoclax-resistant Z138 cells with STP-B resulted in an elevated BCL2 priming at the mitochondrial level (increased cytochrome-C release; P<0.01) (Figure 5B). In order to investigate the molecular mechanisms involved
Figure 3. CTPS1 is preferentially expressed in cycling mantle cell lymphoma cells and its inhibition affects cell cycle related transcriptional programs. (A) Nine mantle cell lymphoma (MCL) cell lines were treated with STP-B at half maximal inhibitory concentration (IC50) for 24 hours and genes expression was determined by 3’sequencing-RNA profiling (3’SRP). The top 10 enriched Reactome pathways modulated upon STP-B treatment in MCL cells are depicted. (B) Cell cycle associated genes expression was analyzed upon STP-B treatment. RNA level fold changes (STP-B/untreated) were calculated for genes involved in G1/early-S phases and late-S/G2/M phases. (C) CTPS1/2 expression was compared to MKI67 expression in lymph node (LN) biopsies from MCL patients using either RNA sequencing (RNA-seq) data (N=98, upper panels) or gene expression profiling data (N=122, lower panels). Spearman test was used. (D) CTPS1 and CTPS2 levels were assessed by single-cell RNA-seq in highly proliferating and resting cells from 6 bone marrow (BM) samples from MCL patients (red line: median).
Figure 4. CTPS1 inhibition results in rapid early S-phase arrest followed by late cell death in mantle cell lymphoma. (A) Cell cycle analysis (bromodeoxyuridine/propidium iodide [BrdU/PI]) was performed in 5 mantle cell lymphoma (MCL) cell lines treated for 24 hours (h) with STP-B at half maximal inhibitory concentration (IC50). Percentage of cells in G1, early-S, late-S and G2/M phases is indicated. Change in cell cycle distribution was calculated. Paired t test was used. *P<0.05, **P<0.01, ****P<0.0001. (B) BrdU/PI analysis was performed in 11 MCL primary samples. Primary cells were co-cultured for 72 hours (h) with L40 cells and cytokines to mimic tumor microenvironment and stimulate cell proliferation prior to STP-B treatment (100 nM) for 24 h. Change in cell cycle distribution was calculated. Paired t test was used. **P<0.01. (C) Cytotoxic activity of STP-B was evaluated at 24, 48 and 72 h by Annexin-V staining in 3 MCL cell lines. Graphs represent 4 independent experiments.
in the observed synergy, we first studied the regulation of the anti-apoptotic proteins MCL1 and BCL-XL, two major venetoclax resistance factors located at the mitochondria,32 in Z138 and JeKo-1 cells treated with STP-B for 24 h. While BCL2 and BCL-XL protein levels remained unchanged, STP-B treatment resulted in a rapid degradation of MCL1 protein in both cell lines, even at low STP-B concentrations (Figure 5C). Quantitative reverse transcription polymerase chain reaction (RT-PCR) showed that MCL1 mRNA levels did not significantly change after STP-B treatment, suggesting that a defect in the translational machinery is involved in MCL1 depletion (Online Supplementary Figure S6A). Post-transcriptional inhibition of additional proteins translated from so called weak mRNA,33,34 such as CCND1, CCND2 and BIRC5 (Online Supplementary Figure S6B, C), as well as the enrichment of transcriptomic functional annotations related to translation (Figure 3A), supported such a mechanism for MCL1 inhibition by STP-B. Decreased phosphorylation
of the cap-dependent translation inhibitor 4E-BP1 upon STP-B treatment further suggested that translation was impaired (Online Supplementary Figure S6D). Finally, puromycin incorporation assay confirmed a reduced protein synthesis upon STP-B treatment in both Z138 and JeKo-1 cell lines (Figure 5D). Overall, these results confirmed that CTPS1 inhibition impaired translation, leading to decreased MCL1 protein levels.
Finally, to address CTPS1/BCL2 dual targeting in aggressive MCL cells in vivo, we used the venetoclax-resistant Z138 xenograft model. While treatment with venetoclax resulted in limited inhibition of tumor growth, STP-B reduced tumor growth to 71% of control at day 17. The combination was more effective, with tumor inhibition reaching 87% compared to control at day 17. Importantly, the synergy was also observed in the latter stages, with tumor mass in mice treated by STP-B alone increasing 2.3-fold between day 17 to day 22, whereas mice treated by the STP-B/venetoclax
Figure 5. CTPS1 inhibition synergizes with BCL2 inhibition in vitro and in vivo. (A) Bliss synergy scores were determined after treatment for 72 hours (h) with STP-B/venetoclax (ven) or STP-B/ibrutinib (ibru) combinations in mantle cell lymphoma (MCL) cell lines. Detailed results are shown in Online Supplementary Figure S5. (B) BCL2 dependence following STP-B treatment was assessed by BH3 profiling in Z138. Cells were pretreated for 24 h with 50 or 500 nM STP-B. Cytochrome C release was analyzed after treatment with 10 or 20 μM of ven (BCL2-i) as indicated in the Online Supplementary Appendix. Graph represents 4 independent experiments. Paired t test was used. *P<0.05, **P<0.01. (C) Immunoblotting of anti-apoptotic BCL2 family members was performed in Z138 and JeKo-1 treated with STP-B at 50 and 500 nM for 24 h. Protein levels normalized to GAPDH level are indicated. (D) Puromycin incorporation assay was performed to directly evaluate the rate of protein synthesis upon STP-B treatment. Cells were pretreated for 24 h with 50 or 500 nM STP-B, prior to puromycin addition as indicated in the Online Supplementary Appendix. Graph indicates the percentage of puromycin incorporated. (E) The efficacy of STP-B/ven combination was evaluated in vivo using a Z138 xenograft model (N=5 mice per group). STP-B was dosed at 30 mg/kg days 1-4 of a 7-day cycle and ven was dosed at 75 mg/kg days 2-5 of a 7-day cycle for 3 cycles. Statistical analysis was made using a two-way ANOVA test followed by a Tukey’s multiple comparisons test. **P<0.01, ****P<0.0001. subcut.: subcutaneous.
combination showed stable disease after all three cycles of treatment (1.2-fold increase from day 17 to day 22) (Figure 5E). Both single and combined compounds were well tolerated, with the mean variation in body weight in all groups being less than 10% (data not shown).
Discussion
Despite increasing treatment options, around a third of MCL patients are refractory to chemotherapy and respond poorly to targeted therapies.35 These high-risk patients are now better characterized, but innovative treatment strategies are still limited.8 Here we show that targeting nucleotide metabolism by selective inhibition of CTPS1, using the small molecule STP-B, effectively reduces viability in preclinical models of highly aggressive MCL in vitro and in vivo. STP-B has shown efficacy at nanomolar levels in vitro, and in mouse models at concentrations achievable in human patients,24 irrespective of high-risk features such as TP53 gene deletion or mutation, high proliferation index (Ki-67) or blastoid morphology. In this study, based on transcriptomic analysis and functional validations, we demonstrated that targeting the pyrimidine synthesis pathway in MCL with STP-B resulted in rapid cell cycle arrest. All MCL cases are characterized by a deregulated cell cycle resulting from Cyclin D overexpression, mainly due to a chromosomal translocation t(11;14)(q13;q32),36 and additional hits in the cell cycle such as CDKN2A deletion are associated with resistance to chemotherapy.37 This unrestrained proliferation suggested that targeting the cell cycle could be a sustainable strategy, particularly in aggressive MCL, which has been confirmed by the clinical efficacy of CDK4/6 inhibitors.38,39 Nevertheless, as with many targeted therapies, cancer cells have shown multiple ways of escape, notably through RB1 inactivation, which leads to CDK4/6-independent proliferation.40,41 In contrast, CTPS1, catalyzing a rate-limiting step in CTP synthesis, is essential for lymphoma growth, as recently demonstrated by gene editing.19,21 Accordingly, CTPS1 expression was detected in all MCL samples tested (RNA-seq: N=182), suggesting that CTPS1 loss is infrequent. In addition, CTPS1 expression was higher in samples with high proliferation (high MKI67) and was also described as higher in ibrutinib-refractory patients, who are characterized by a poor prognosis.7,42 Taken together, CTPS1 appears to be an appealing target to impair the cell cycle of highrisk lymphomas.
In contrast to CTPS1, CTPS2 was expressed at low levels in MCL, did not correlate with MKI67 and was not associated with a poor prognosis. Despite sharing 74% homology at the protein level, CTPS1 and CTPS2 have differential roles in cell proliferation. Indeed, a recent study suggests that CTPS2 has weaker enzymatic activities and may be involved in maintaining a basal cellular CTP level, and cannot com-
pensate for the role of CTPS1 in high proliferation.19 This is consistent with human studies showing that CTPS1 homozygous mutations resulted in the inability of activated lymphocytes to highly proliferate, even in the presence of normal CTPS2 levels.17,18 On the basis of these data, CTPS2 is unlikely to compensate for the loss of CTPS1 enzymatic activity in tumors treated with STP-B. Nevertheless, given the high plasticity of tumor cells under long-term drug pressure, its level should be carefully monitored in future clinical samples if a CTPS1-targeting refractory patient population emerges. A compound from this chemical series entered clinical development for relapsed refractory B and T lymphomas in 2022 (clinicaltrials gov. Identifier: NCT05463263).
Since CTPS1 inhibition preferentially targets proliferating MCL cells, we next tested the efficacy of the combination with venetoclax, a cell-cycle-independent cytotoxic agent. Venetoclax is a BH3-mimetic that selectively targets BCL2 at the mitochondria and induces rapid apoptosis in lymphoma cells such as MCL cells. BCL2 inhibition has shown good clinical activity as a single agent, but tumor cells have the ability to rapidly develop resistance, especially through the upregulation of other anti-apoptotic proteins such as MCL1.43 Accordingly, simultaneous inhibition of BCL2 and MCL1, using specific BH3-mimetics, enabled highly effective tumor control in MCL PDX.44 Unfortunately, direct inhibition of MCL1 by selective BH3 mimetics resulted in unexpected cardiac toxicity45 and alternative strategies to indirectly neutralize MCL1 are being investigated.46,47 Here, we demonstrated that inhibition of CTPS1, by altering translation, resulted in rapid inhibition of MCL1, but not BCL2, in MCL cells. MCL1 inhibition led to STP-B/venetoclax synergy in vitro, as well as effective tumor control in aggressive mouse models of MCL. These results pave the way for the study of such a combination in the near future, particularly for high-risk MCL cases which currently have very few effective therapeutic options.
De novo pyrimidine synthesis is controlled upstream by mTORC1/S6K1 through CAD phosphorylation.48 Here we show that selective downstream targeting of CTPS1 results in inhibition of protein synthesis, at least partly via a decrease in mTORC1 activity (inhibition of 4E-BP1 phosphorylation) (Online Supplementary Figure S6D). These results highlight the complexity of feedback regulation occurring in the mTORC1 pathway, which needs further mechanistic studies to potentially uncover new vulnerabilities in lymphomas.
Disclosures
HA, AP and PB are employees of Step Pharma. All other authors have no conflicts of interest to disclose.
Contributions
RD designed and performed the experiments, analyzed data and participated in writing the article. CB performed the experiments and bioinformatics analysis and analyzed
data. CD, EM and CK performed experiments and analyzed data. CK and RD performed experiments on NSG mice and analyzed data. BT participated in the design of the study. HA, AP, PB and CPD participated in the design of the study, in the data analysis, and in writing the article. DC designed the study, analyzed data, and wrote the article.
Acknowledgments
The authors would like to thank the patients who agreed to be part of the REFRACT-LYMA cohort and Dr N.L Lilli for cohort management. The authors thank the FINDMED CHICHE ! initiative (ANR-15-CRNT-0007) as well as the Carnot consortium CALYM and the SIRIC ILIAD (INCa-DGOS-Inserm-ITMO Cancer_18011) for their support. We are most grateful to the Genomics Core Facility GenoA, member of Biogenouest and France Genomique and to the Bioinformatics Core Fa-
References
1. Zhong L, Li Y, Xiong L, et al. Small molecules in targeted cancer therapy: advances, challenges, and future perspectives. Signal Transduct Target Ther. 2021;6(1):201.
2. Wang ML, Jurczak W, Jerkeman M, et al. Ibrutinib plus bendamustine and rituximab in untreated mantle-cell lymphoma. N Engl J Med. 2022;386(26):2482-2494.
3. Dreyling M, Doorduijn JK, Gine E, et al. Efficacy and safety of ibrutinib combined with standard first-line treatment or as substitute for autologous stem cell transplantation in younger patients with mantle cell lymphoma: results from the randomized triangle trial by the european MCL network. Blood. 2022;140(Suppl 1):1-3.
4 Le Gouill S, Morschhauser F, Chiron D, et al. Ibrutinib, obinutuzumab, and venetoclax in relapsed and untreated patients with mantle cell lymphoma: a phase 1/2 trial. Blood. 2021;137(7):877-887.
5. Eichhorst B, Niemann CU, Kater AP, et al. First-line venetoclax combinations in chronic lymphocytic leukemia. N Engl J Med. 2023;388(19):1739-1754.
6. Zhao S, Kanagal-Shamanna R, Navsaria L, et al. Efficacy of Venetoclax in high risk relapsed mantle cell lymphoma (MCL)outcomes and mutation profile from venetoclax resistant MCL patients. Am J Hematol. 2020;95(6):623-629.
7 Martin P, Maddocks K, Leonard JP, et al. Postibrutinib outcomes in patients with mantle cell lymphoma. Blood. 2016;127(12):1559-1563.
8. Scheubeck G, Jiang L, Hermine O, et al. Clinical outcome of mantle cell lymphoma patients with high-risk disease (high-risk MIPI-c or high p53 expression). Leukemia. 2023;37(9):1887-1894.
9 Huang Z, Chavda VP, Bezbaruah R, Dhamne H, Yang D-H, Zhao H-B. CAR T-cell therapy for the management of mantle cell lymphoma. Mol Cancer. 2023;22(1):67.
10 Vander Heiden MG, DeBerardinis RJ. Understanding the intersections between metabolism and cancer biology. Cell. 2017;168(4):657-669.
11. Tisi MC, Moia R, Patti C, et al. Long-term follow-up of rituximab plus bendamustine and cytarabine in older patients with newly diagnosed MCL. Blood Adv. 2023;7(15):3916-3924.
12. Hermine O, Jiang L, Walewski J, et al. High-dose cytarabine and autologous stem-cell transplantation in mantle cell lymphoma:
cility BiRD, member of Biogenouest and Institut Français de Bioinformatique (IFB) (ANR-11-INBS-0013) for the use of their resources and their technical support. The authors acknowledge the Cytocell-Flow Cytometry and FACS core facility (SFR Bonamy, BioCore, Inserm UMS 016, CNRS UAR 3556, Nantes, France) for its technical expertise and help.
Funding
The project was funded by Institut Français de Bioinformatique (IFB) (ANR-11-INBS-0013).
Data-sharing statement
RNA-sequencing datasets are publicly available in the Gene Expression Omnibus. All other datasets analyzed during the current study are available from the corresponding author on reasonable request.
long-term follow-up of the randomized Mantle Cell Lymphoma Younger Trial of the European Mantle Cell Lymphoma Network. J Clin Oncol. 2023;41(3):479-484.
13. Lynch EM, Hicks DR, Shepherd M, et al. Human CTP synthase filament structure reveals the active enzyme conformation. Nat Struct Mol Biol. 2017;24(6):507-514.
14 Van Kuilenburg ABP, Meinsma R, Vreken P, Waterham HR, Van Gennip AH. Identification of a cDNA encoding an isoform of human CTP synthetase. Biochim Biophys Acta. 2000;1492(2-3):548-552.
15. Schimmel KJM, Gelderblom H, Guchelaar HJ. Cyclopentenyl cytosine (CPEC): an overview of its in vitro and in vivo activity. Curr Cancer Drug Targets. 2007;7(5):504-509.
16. Williams JC, Kizaki H, Weber G, Morris HP. Increased CTP synthetase activity in cancer cells. Nature. 1978;271(5640):71-73.
17 Martin E, Palmic N, Sanquer S, et al. CTP synthase 1 deficiency in humans reveals its central role in lymphocyte proliferation. Nature. 2014;510(7504):288-292.
18. Martin E, Minet N, Boschat A-C, et al. Impaired lymphocyte function and differentiation in CTPS1-deficient patients result from a hypomorphic homozygous mutation. JCI Insight. 2020;5(5):e133880.
19 Minet N, Boschat A-C, Lane R, et al. Differential roles of CTP synthetases CTPS1 and CTPS2 in cell proliferation. Life Sci Alliance. 2023;6(9):e202302066.
20 Lin Y, Zhang J, Li Y, et al. CTPS1 promotes malignant progression of triple-negative breast cancer with transcriptional activation by YBX1. J Transl Med. 2022;20(1):1-15.
21. Liang J, Ren Y, Du K, et al. MYC-induced cytidine metabolism regulates survival and drug resistance via cGas-STING pathway in mantle cell lymphoma. Br J Haematol. 2023;202(3):550-565.
22. Wu F, Mao Y, Ma T, et al. CTPS1 inhibition suppresses proliferation and migration in colorectal cancer cells. Cell Cycle. 2022;21(24):2563-2574.
23. Sun Z, Zhang Z, Wang Q-Q, Liu J-L. Combined inactivation of CTPS1 and ATR is synthetically lethal to MYC-overexpressing cancer cells. Cancer Res. 2022;82(6):1013-1024.
24. Asnagli H, Minet N, Pfeiffer C, et al. CTP synthase 1 is a novel therapeutic target in lymphoma. Hemasphere. 2023;7(4):e864.
25. Maïga S, Brosseau C, Descamps G, et al. A simple flow
cytometry-based barcode for routine authentication of multiple myeloma and mantle cell lymphoma cell lines. Cytometry. 2015;87(4):285-288.
26. Chiron D, Bellanger C, Papin A, et al. Rational targeted therapies to overcome microenvironment-dependent expansion of mantle cell lymphoma. Blood. 2016;128(24):2808-2818.
27. Charpentier E, Cornec M, Dumont S, et al. 3’ RNA sequencing for robust and low-cost gene expression profiling. Protoc Exch. 2021;10:21203.
28. Decombis S, Bellanger C, Le Bris Y, et al. CARD11 gain of function upregulates BCL2A1 and promotes resistance to targeted therapies combination in B-cell lymphoma. Blood. 2023;142(18):1543-1555.
29 Ferrer A, Salaverria I, Bosch F, et al. Leukemic involvement is a common feature in mantle cell lymphoma. Cancer. 2007;109(12):2473-2480.
30 Le Gouill S, Thieblemont C, Oberic L, et al. Rituximab after autologous stem-cell transplantation in mantle-cell lymphoma. N Engl J Med. 2017;377(13):1250-1260.
31. Dempster JM, Rossen J, Kazachkova M, et al. Extracting biological insights from the project achilles genome-scale CRISPR screens in cancer cell lines. BioRxiv. 2019 July 31. doi:10.1101/720243 [preprint, not peer-reviewed].
32. Chiron D, Dousset C, Brosseau C, et al. Biological rational for sequential targeting of Bruton tyrosine kinase and Bcl-2 to overcome CD40-induced ABT-199 resistance in mantle cell lymphoma. Oncotarget. 2015;6(11):8750.
33. Thus YJ, De Rooij MFM, Swier N, et al. Inhibition of casein kinase 2 sensitizes mantle cell lymphoma to venetoclax through MCL-1 downregulation. Haematologica. 2022;108(3):797-810.
34 Descamps G, Gomez-Bougie P, Tamburini J, et al. The captranslation inhibitor 4EGI-1 induces apoptosis in multiple myeloma through Noxa induction. Br J Cancer. 2012;106(10):1660-1667.
35. Jain P, Wang ML. Mantle cell lymphoma in 2022 - A comprehensive update on molecular pathogenesis, risk stratification, clinical approach, and current and novel treatments. Am J Hematol. 2022;97(5):638-656.
36. Martín-Garcia D, Navarro A, Valdés-Mas R, et al. CCND2 and CCND3 hijack immunoglobulin light-chain enhancers in cyclin D1- mantle cell lymphoma. Blood. 2019;133(9):940-951.
37. Malarikova D, Berkova A, Obr A, et al. Concurrent TP53 and
CDKN2A gene aberrations in newly diagnosed mantle cell lymphoma correlate with chemoresistance and call for innovative upfront therapy. Cancers. 2020;12(8):2120.
38. Martin P, Bartlett NL, Blum KA, et al. A phase 1 trial of ibrutinib plus palbociclib in previously treated mantle cell lymphoma. Blood. 2019;133(11):1201-1204.
39 Chiron D, Di Liberto M, Martin P, et al. Cell-cycle reprogramming for PI3K inhibition overrides a relapse-specific C481S BTK mutation revealed by longitudinal functional genomics in mantle cell lymphoma. Cancer Discov. 2014;4(9):1022-1035.
40 Condorelli R, Spring L, O’shaughnessy J, et al. Polyclonal RB1 mutations and acquired resistance to CDK 4/6 inhibitors in patients with metastatic breast cancer. Ann Oncol. 2018;29(3):640-645.
41. Malarikova D, Jorda R, Dolníková A, et al. Cyclin-dependent kinase 4/6 inhibitor palbociclib synergizes with BH3-mimetics in experimental models of relapsed/refractory mantle cell lymphoma. Blood. 2022;140(Suppl 1):5996-5997.
42. Zhang L, Yao Y, Zhang S, et al. Metabolic reprogramming toward oxidative phosphorylation identifies a therapeutic target for mantle cell lymphoma. Sci Transl Med. 2019;11(491):eaau1167.
43. Thus YJ, Eldering E, Kater AP, Spaargaren M. Tipping the balance: toward rational combination therapies to overcome venetoclax resistance in mantle cell lymphoma. Leukemia. 2022;36(9):2165-2176.
44 Prukova D, Andera L, Nahacka Z, et al. Cotargeting of BCL2 with venetoclax and MCL1 with S63845 is synthetically lethal in vivo in relapsed mantle cell lymphoma. Clin Cancer Res. 2019;25(14):4455-4465.
45. Rasmussen ML, Taneja N, Neininger AC, et al. MCL-1 inhibition by selective BH3 mimetics disrupts mitochondrial dynamics causing loss of viability and functionality of human cardiomyocytes. iScience 2020;23(4):101015.
46. Zhao X, Ren Y, Lawlor M, et al. BCL2 amplicon loss and transcriptional remodeling drives ABT-199 resistance in B cell lymphoma models. Cancer Cell. 2019;35(5):752-766.
47. Zhao X, Bodo J, Chen R, et al. Inhibition of cyclin-dependent kinase 9 synergistically enhances venetoclax activity in mantle cell lymphoma. EJHaem. 2020;1(1):161-169.
48. Ben-Sahra I, Howell JJ, Asara JM, Manning BD. Stimulation of de novo pyrimidine synthesis by growth signaling through mTOR and S6K1. Science. 2013;339(6125):1323-1328.
Adjusting for subsequent therapies in the TOURMALINEMM1 study shows clinically meaningful improvement in overall survival with addition of ixazomib to lenalidomide and dexamethasone
Karthik Ramasamy,1 Nizar J. Bahlis,2 Shaji K. Kumar,3 Arun Kumar,4 Holly Cranmer,5 Bingxia Wang,4 Jonathan Dabora,6 Richard Labotka,4 Paul G. Richardson7 and Philippe Moreau8
1Oxford University Hospitals NHS Foundation Trust and Oxford Translational Myeloma Center, University of Oxford, Oxford, UK; 2Arnie Charbonneau Cancer Research Institute, University of Calgary, Calgary, Alberta, Canada; 3Division of Hematology, Mayo Clinic, Rochester, MN, USA; 4Takeda Development Center Americas, Inc. (TDCA), Lexington, MA, USA; 5Takeda UK, London, UK; 6Takeda Pharmaceuticals America, Inc., Lexington, MA, USA; 7Jerome Lipper Multiple Myeloma Center, Dana-Farber Cancer Institute, Harvard Medical School, Boston, MA, USA and 8University Hospital Hôtel Dieu, Nantes, France
Abstract
Correspondence: K. Ramasamy karthik.ramasamy@ndorms.ox.ac.uk
Received: June 20, 2023.
Accepted: February 16, 2024. Early view: February 29, 2024. https://doi.org/10.3324/haematol.2023.283713
Published under a CC BY license
TOURMALINE-MM1, the only blinded randomized study in patients with relapsed and/or refractory multiple myeloma (RRMM; ≥1 prior therapy) in the last 10 years, investigated ixazomib + lenalidomide + dexamethasone (IRd) versus lenalidomide + dexamethasone (Rd). Final overall survival (OS) data were based on a median follow-up of 85 months. In RRMM trials where patients have had 1-3 relapses after initial treatment, a high proportion receive subsequent therapy. Application of salvage therapies in blinded trials and newer modes of therapy can increasingly complicate the interpretation of OS. This analysis explores the impact of subsequent therapies on OS outcomes in TOURMALINE-MM1. The inverse probability of censoring weights (IPCW) method, marginal structural model (MSM), and rank-preserving structural failure time model (RPSFTM) were utilized to adjust for confounding on OS, introduced by subsequent therapies. Analyses were conducted for the intent-totreat (ITT) population and ≥2 prior lines subgroup. Unadjusted hazard ratio (HR) for IRd versus Rd was 0.94 (95% confidence interval [CI]: 0.78-1.13) in the ITT population. After adjusting for the impact of subsequent therapies by the RPSFTM method, estimated HR for IRd versus Rd in the ITT population was 0.89 (95% CI: 0.74-1.07). Adjusting with IPCW and MSM methods also showed an improvement in HR, favoring IRd. IRd may be particularly beneficial in patients with ≥2 prior lines of therapy (IPCW and MSM HR=0.52, 95% CI: 0.30-0.88; RPSFTM HR=0.68, 95% CI: 0.51-0.91). These analyses highlight the growing challenge of demonstrating OS benefit in MM patients and the importance of assessing confounding introduced by subsequent therapies when interpreting OS.
Introduction
The improvement in overall survival (OS) in patients with multiple myeloma (MM) has been associated with the introduction of multiple, active novel agents over the past decade.1 Consequently, interpretation of OS has become increasingly confounded by the use of these novel agents, and their availability as experimental treatment arms in clinical trials, in subsequent therapy lines.2 OS is an important endpoint in MM clinical trials and provides an excellent indicator of efficacy; however, currently randomized trials do not control for subsequent therapies.3 It is difficult to isolate the true survival benefit of a specific line of therapy
in newly diagnosed MM or early relapsed and/or refractory MM (RRMM) due to the confounding caused by initiating subsequent lines of anti-cancer treatment.4 All patients will ultimately relapse and receive multiple lines of therapy, therefore patients become refractory to different agents/ classes of drug at various points throughout their disease course.5 Each therapy line includes a different combination of chemotherapy agents of different drug classes; for MM these typically include a proteasome inhibitor (PI), immunomodulatory drug, corticosteroid, and in recent years anti-CD38 monoclonal antibodies have been approved for use in these combinations.6 A number of novel alternative therapeutic options became clinically available during the
TOURMALINE-MM1 study course, namely daratumumab, which is now a widely used drug for MM.7 This means a given studied intervention may be administered to a placebo patient at a later recurrence and thus confer benefit to OS. In contrast, a patient may be treated with an agent they are already refractory to during a later line of therapy; however, due to study blinding the administering clinician is unaware, thus conferring an OS disadvantage. The availability of an increasingly wider range of novel drugs adds to this confounding by providing more therapy options, often with alternative mechanisms of action, which provide further survival benefits for patients. Without controlling for subsequent therapies, OS should be regarded as the reflection of continued improvement in MM therapy and a continued assessment of safety instead of a long-term measure of the efficacy of a particular drug combination versus another drug combination. Albeit more efficacious drug combinations administered throughout the disease course will therefore contribute to an overall longer OS.
As an example, the recent DETERMINATION study of lenalidomide + bortezomib + dexamethasone (RVd) followed by autologous stem cell transplant (ASCT) versus RVd alone in patients with symptomatic myeloma failed to demonstrate OS improvement, despite a 21.3-month improvement in promising progression-free survival (PFS) outcomes, with the impact of novel therapies as well competing risk contributing to the marked difference in clinical benefit parameters seen.3 The TOURMALINE-MM1 clinical study (clinicaltrial gov. Identifier: NCT01564537) compared ixazomib + lenalidomide + dexamethasone (IRd) with lenalidomide + dexamethasone (Rd) in patients with RRMM after at least one line of prior therapy. The IRd combination showed a statistically significant and clinically meaningful PFS benefit over Rd, leading to its approval for the treatment of patients with MM who have received ≥1 prior therapy.8-10 Final OS data from TOURMALINE-MM1, based on a median follow-up of 85 months (median of 18 treatment cycles for IRd and 16 for Rd), showed a small, non-significant, improvement in median survival with IRd (median OS: IRd=53.6 months and Rd=51.6 months; hazard ratio [HR]=0.939, P=0.495).2 Improved HR were observed in predefined subgroups, notably in patients with ≥2 prior therapies.2 Subsequent therapies were received by 71.7% and 69.9% of patients in the IRd and Rd arms, respectively.2 The impact of these improved options and resultant better outcomes for patients with RRMM are evident from the observed extended OS in the Rd arm of the TOURMALINE-MM1 clinical trial; the median OS (51.6 months)2 is the longest observed across any historical Rd arm from large clinical trials to date in the RRMM population.11-14 In contrast, the median OS observed in the Rd arms of four comparable historical clinical trials ranged between 20.3 months and 40.4 months.11,12,15,16 We have previously outlined how subsequent therapy impacted intent-to-treat (ITT) OS outcomes in the TOURMALINE-MM1 trial.2 The double-blind nature of the study
caused imbalances between arms in terms of subsequent therapy. Compared with the IRd arm, patients in the Rd group received a higher number of subsequent therapies, and also received subsequent PI, daratumumab, and other agents more frequently.2 In this subsequent evaluation, we have conducted a range of novel statistical analyses to examine the impact of subsequent therapies on OS in the TOURMALINE-MM1 study, in the overall patient population and by line of therapy. Both IRd and Rd are approved for the treatment of RRMM in many geographies after ≥2 prior lines and hence the results for this subgroup will be useful for clinical practice. In these analyses, we attempt to isolate the impact of IRd compared with Rd on OS from the impact of subsequent therapies.
Methods
Patients and study design
The details of the study design for TOURMALINE-MM1 have been previously published elsewhere.2,8,17 To summarize, TOURMALINE-MM1 was a phase III, randomized, double-blind, controlled clinical trial designed to assess the efficacy of IRd versus Rd in patients with RRMM (i.e., ≥1 prior therapy). Patients were randomly assigned to IRd or Rd, stratified by number of prior therapies (1 vs. 2 or 3), previous PI exposure (exposed vs. naïve), and International Staging System (ISS) disease stage (I or II vs. III).2
The trial was conducted in accordance with the International Conference on Harmonization Good Clinical Practice guidelines and appropriate regulatory requirements. Local ethics committees or institutional review boards approved the protocol, which is available at https://www.nejm.org/doi/ suppl/10.1056/NEJMoa1516282/suppl_file/nejmoa1516282_ protocol.pdf. All patients provided written informed consent.
Statistical analyses
The following analyses of TOURMALINE-MM1 clinical trial data were conducted with the ITT population and the subgroups of patients who had received ≥1 and ≥2 prior lines of therapy. Analyses were conducted in SAS version 9.0. All subgroup analyses used stratified Cox Proportional hazard models to estimate HR and stratified log-rank test to obtain P values. Unless mentioned otherwise, survival curves were generated using the Kaplan-Meier method.
In order to remove the effect of subsequent therapies from OS outcomes and quantify causal survival benefit of IRd over Rd, the inverse probability of censoring weighted (IPCW), marginal structural models (MSM), and the rank preserving structural failure time models (RPSFTM) methods were used. In the ITT population, IPCW and MSM were pre-specified analyses and RPSFTM was an ad hoc analysis, while for the subgroup of patients who had received ≥2 prior treatment lines, all three analyses were post hoc. For all analyses, stratification factors were aligned with randomization strat-
ification factors. More detail on the IPCW, MSM and RPSFTM methods are provided in the Online Supplementary Appendix
Results
In TOURMALINE-MM1, a total of 722 patients were enrolled; patients were randomly assigned to IRd (N=360) or Rd (N=362) per the stratification factors. In the IRd and Rd arms, 62%/27%/11% and 60%/31%/9% of patients had received 1/2/3 prior therapies, respectively; 69% and 70% had prior PI exposure, and 63%/25%/12% and 64%/24%/12% had ISS disease stage I/II/III disease.2,8 There were fewer lines of subsequent therapy received in the IRd arm versus the Rd arm (median 2 vs. 3 in the ITT population).2 Most of the subsequent therapies received were balanced across treatment arms in the ITT population, including lenalidomide (IRd: 29%; Rd: 28%) and dexameth-
asone (IRd: 87%; Rd: 91%).2 A slightly lower proportion of patients in the ITT population received subsequent ASCT in the IRd versus Rd arms (4% vs. 10%)2 and this was also observed in the ≥2 prior lines of therapy subgroup (<1% vs. 10%; Table 1). A slight imbalance was seen for patients receiving a subsequent PI therapy in the IRd versus Rd arms (ITT: 72% vs. 77%2; ≥2 prior lines: 64% vs. 69%, Table 1); for patients receiving subsequent carfilzomib in the ITT population (IRd: 27%; Rd: 33%)2 and the ≥2 prior lines subgroup (IRd: 25%; Rd: 28%; Table 1), the Rd arm had a greater survival benefit (ITT HR=1.08, 95% confidence interval [CI]: 0.71-1.62 and ≥2 prior lines subgroup HR=1.20, 95% CI: 0.62-2.34). Notably, there was a clear imbalance in the proportion of patients receiving subsequent daratumumab (IRd: 25%; Rd: 34%).2 The same phenomenon was observed in the ≥2 prior lines of therapy subgroup (IRd: 18%; Rd: 33%; Table 1). Thus, among patients who received daratumumab as a subsequent therapy, it was evident that
Table 1. Subsequent therapies received in ≥5% of patients in either arm in TOURMALINE-MM1 (≥2 prior lines).
Corticosteroids
Dexamethasone
Prednisone
Prednisolone
Methylprednisolone
Immunomodulatory drugs
Pomalidomide
Proteasome inhibitors
Bortezomib
Carfilzomib
Ixazomib
Alkylating agents
(14)
(9)
(5)
compared with the IRd arm, patients in the Rd arm derived a larger benefit in survival (ITT HR=1.15, 95% CI: 0.73-1.812 and ≥2 prior lines subgroup HR=1.48, 95% CI: 0.69-3.19). This is likely due to patients in the Rd arm receiving daratumumab earlier than in the IRd arm in the follow-up of TOURMALINE-MM1 (Figure 1).
Table 2 provides the adjusted OS results from different methods for the ITT population2 and the ≥2 prior lines subgroup. When adjusting for the confounding due to subsequent
therapies, all methods indicated a trend towards a survival benefit for patients in the IRd arm compared with the Rd arm (HR=≤1). As previously reported for the ITT population, the estimated HR was 0.70 (95% CI: 0.48-1.03; P=0.071; Figure 2) using the IPCW method, and 0.68 (95% CI: 0.46-1.00; P=0.054) using the MSM method, compared with an unadjusted HR of 0.939.2 The estimated HR using the RPSFTM method was consistent with these findings (HR=0.89, 95% CI: 0.74-1.07; P=0.202; Figure 3). Estimated HR for the ≥2 prior lines of
Figure 1. Starting year for subsequent daratumumab. IRd: ixazomib + lenalidomide + dexamethasone; Rd: lenalidomide + dexamethasone.
≥2 prior lines subgroup
Intent-to-treat (ITT) (≥1 prior lines) data (except RPSFTM method) and ≥2 prior lines unadjusted data previously reported by Richardson et al. and reproduced with permission from the first author, Dr Paul Richardson.2 CI: confidence interval; HR: hazard ratio; IPCW: inverse probability of censoring weights; IRd: ixazomib + lenalidomide + dexamethasone; MSM: marginal structural model; NE: not evaluable; OS: overall survival; Rd: lenalidomide + dexamethasone; RPSFTM: rank preserving survival failure time model.
Table 2. Unadjusted and adjusted results for intent-to-treat population2 and ≥2 prior lines subgroup.
therapy subgroup after adjustment were 0.52 (95% CI: 0.300.88; P=0.016; Table 2) for IPCW and MSM, and 0.68 (95% CI: 0.51-0.91; P=0.008; Table 2) for RPSFTM, compared with an unadjusted HR of 0.85 (95% CI: 0.64-1.11; P=0.232; Table 2).
A small, non-significant, difference in favor of Rd was observed when analyzing time from subsequent therapy to death between the IRd and Rd arms (Figure 4; HR=1.08, 95% CI: 0.88-1.33). This was exaggerated further
Figure 2. Time from randomization to death as per IPCW method when patients who took a subsequent therapy were censored the day before (intent-to-treat population). Hazard ratio (HR), 95% confidence interval (CI) and P value for HR previously reported by Richardson et al.and reproduced with permission from the first author, Dr Paul Richardson.2 IPCW: inverse probability of censoring weights; IRd: ixazomib + lenalidomide + dexamethasone; Rd: lenalidomide + dexamethasone.
Figure 3. Time from randomization to death as per RPSFTM method (intent-to-treat population). CI: confidence interval; HR: hazard ratio; IRd: ixazomib + lenalidomide + dexamethasone; Rd: lenalidomide + dexamethasone; RPSFTM: rank preserving structural failure time model.
Figure 4. Time from subsequent therapy to death (intent-to-treat population). CI: confidence interval; HR: hazard ratio; IRd: ixazomib + lenalidomide + dexamethasone; Rd: lenalidomide + dexamethasone.
in the ≥2 prior lines of therapy subgroup (HR=1.14, 95% CI: 0.82-1.59).
Discussion
Recently published data from the TOURMALINE-MM1 clinical trial indicated a numerically favorable trend in OS with IRd versus Rd, although there was no statistically significant difference in final OS between the two treatment arms.2 However, the impact of subsequent therapies on survival outcomes was not investigated; this is a major limitation in assessment of OS in patients with likely long life expectancy.2-4 In these analyses, we elaborated on the methods and results for the ITT population and showed how subsequent therapies impacted outcomes in the ≥2 prior line subgroup. The IPCW, MSM, and RPSFTM methods were implemented to effectively reduce bias from subsequent therapies and estimate the “true” OS benefit received by adding ixazomib to the Rd combination in the presence of confounding. The results indicate that the unadjusted survival data from TOURMALINE-MM1 are confounded by imbalances in the number and type of subsequent therapies between the treatment arms. IPCW, MSM, and RPSFTM all minimized estimation bias by switching and adjusting for confounding resulting from subsequent therapy when comparing survival outcomes. By applying these three commonly used approaches, all adjusted HR using causal inference methods utilized in this analysis were reduced, demonstrating a trend towards favoring IRd versus Rd in terms of OS, concluding
that the TOURMALINE-MM1 OS results were confounded by subsequent therapy. In particular, adjusting for confounding in the ≥2 prior lines of therapy subgroup demonstrated a substantial OS benefit with IRd versus Rd. Though the degree of benefit was different as per the different methods, the consistent direction of the results indicates that the IRd combination may have a meaningful positive OS impact in this patient population.
The greater number of lines of subsequent therapy received in the Rd arm versus the IRd arm2 was driven by earlier progression of patients in the Rd arm, allowing them more opportunity for subsequent therapies across the follow-up time from TOURMALINE-MM1. Importantly, this phenomenon allowed patients in the Rd arm to receive effective monoclonal antibody-based subsequent therapies that became available during the study course. Therefore, this allowed patients in the Rd arm to have better OS outcomes than expected. Patients in the IRd arm could have also ultimately received subsequent therapies as a result of experiencing a longer OS.
The imbalance in the number of patients who received subsequent daratumumab is particularly important as daratumumab has a completely different mechanism of action that patients would not have been exposed to in prior therapies, and which has been shown to be highly efficacious for this patient population.11,18,19 TOURMALINE-MM1 enrolled patients between August 2012 and May 2014. The median time to progression was 21.4 versus 15.7 months in the IRd and Rd groups, respectively.8 Daratumumab was a newly available and highly active drug that was approved in No-
vember 2015,7 which likely coincided with the time that a number of TOURMALINE-MM1 patients, particularly those in the Rd arm, developed a need for subsequent therapies. The availability of daratumumab improved the salvage capability in the Rd arm substantially, driving post-discontinuation survival outcomes in these patients. As previously reported, approximately 70% of patients in each arm had received prior therapy with a PI at baseline, and in patients who went on to receive a PI as next-line therapy after IRd or Rd, analysis of OS favored the Rd arm (HR=1.04, 95% CI: 0.78-1.40).2 Furthermore, this outcome was observed in patients who subsequently received the PI carfilzomib in the ITT population (HR=1.08, 95% CI: 0.711.62) and the ≥2 prior line subgroup (HR=1.20, 95% CI: 0.622.34). Patients progressing on Rd had a PI-free interval or may still have been PI-naïve; therefore, these patients were more likely to have remained PI-sensitive and benefitted from PI-based subsequent therapy. However, for patients progressing on IRd, subsequent PI-based therapy was potentially their third exposure to a PI. Therefore, they were likely to have become PI-refractory, and PI-based next-line therapy would potentially have been less effective, as well as being inconsistent with clinical guidelines.20 Thus the high use of PI as next line of therapy in the TOURMALINE-MM1 IRd arm (47%)2 may have specifically affected OS outcomes, preventing the PFS advantage seen in the IRd arm from translating into OS benefit. Per the study design, patients and clinicians remained blinded throughout subsequent therapy. However, unblinding was permitted to properly treat an adverse event or other safety issue, and for the treating physician to choose subsequent therapy. As previously reported, this led to a minority of instances where clinicians were unblinded (21/360 vs. 37/362 in the IRd and Rd arms, respectively).2 Clinicians who were unblinded at discontinuation of IRd tended to treat patients at the next line with a treatment that included a drug with a different mechanism of action (76% of unblinded IRd patients received a non-PI-based next-line therapy), whereas clinicians who were unblinded at discontinuation of Rd tended to treat patients at the next line with a PI-containing regimen (81% of unblinded Rd patients received PI-containing next-line therapy). This contrasted with clinicians who remained blinded - there was a 50:50 split in PI versus no PI next-line regimens across both treatment arms.2
Other similar trials in the past decade were either open-label/ unblinded or unblinded after first interim analysis.16,21-24 In a real-world setting, the type of prior therapy received by the patient is important when choosing the next best option. Blinding is a feature of a controlled clinical trial and does not represent real-world practice. Based on these findings and clinical expectations, it is less likely that a patient discontinuing IRd in the real-world would proceed to another PI in the next line of therapy.
A small, non-significant difference favoring Rd was observed when analyzing time from subsequent therapy to death be-
tween the IRd and Rd arms in both the overall population and the ≥2 prior lines of therapy subgroup. These findings were unexpected, as we anticipated the study arms would perform similarly after receiving subsequent therapies. However, the imbalances in the number and type of subsequent therapies in the two arms likely drove the additional benefit received by patients in the Rd arm during the trial follow-up. Given the salvage therapies available in the modern era of MM treatment, and the introduction of many new therapies that became available for treatment of RRMM shortly following completion of enrollment to TOURMALINE-MM1,16,21,25-27 it is increasingly difficult to demonstrate OS improvement. This was exemplified in the results from the recent DETERMINATION study, in which RVd followed by ASCT failed to show a significant improvement in OS compared with RVd alone, despite a 21.3-month improvement in PFS.3 Nevertheless, contrasting data demonstrating OS improvements in patients with RRMM have been reported in ELOQUENT-2, ASPIRE, and POLLUX.11,14,15 Of note, however, these were open-label studies. Furthermore, in the phase III ELOQUENT-2 study of elotuzumab-lenalidomide-dexamethasone (ERd) versus Rd, no more than 10% of patients with prior lenalidomide therapy were permitted to be enrolled, thus decreasing the proportion of patients likely to be lenalidomide-refractory.15
In addition, as daratumumab was not Food and Drug Adminstration-approved until 2015, it was not as readily available at the time of the ELOQUENT-2 study; only 9% and 12% of patients in the respective ERd and Rd groups received subsequent daratumumab therapy, which could be one reason for the reported OS differences between treatment groups in the study.
This was a post hoc study conducted in a setting where an OS benefit was not reported in the ITT population and as such is a key limitation of the study. Additional limitations of these analyses relate to the assumptions underpinning the statistical methodologies. The IPCW and MSM analyses assume “no unmeasured confounders” which cannot be tested. This is a known limitation of the method. We used a large set of covariates to predict the treatment switch and found most of the covariates were eliminated after model selection (please see the Online Supplementary Appendix for a list of the baseline covariates). All these covariates were also pre specified to avoid any post-study bias. The IPCW/ MSM methodology requires that the patients who received a subsequent therapy are censored at receipt of therapy; N=65 events in the IRd arm and N=55 events in the Rd arm remained after censoring. Therefore, 84% of the patients were censored, which is very close to the 90% censoring Latimer et al 28 indicated to be the cut-off when the IPCW method is not reliable.28 The RPSFTM does not require the “no unmeasured confounders” assumption. However, it is subject to two key assumptions: (i) patients in the IRd arm continued to derive similar benefit until death/censor post-study treatment discontinuation as when they were on-treatment, and (ii) patients in the Rd arm post-discon-
tinuation derived the same survival benefit as patients in the IRd arm. While these limitations cannot be overcome methodologically, it is important to recognize that all methods indicated confounding in the same direction and hence the results from the methods cannot be ignored. Indeed, in a recent appraisal by UK’s National Institute for Health and Care Excellence (NICE), these methods were used to adjust OS in TOURMALINE-MM1 for confounding due to subsequent therapy to better reflect clinical practice in the UK, and it was concluded by NICE that IRd “likely improves OS” based on these analyses.29
These analyses look at the impact of removing the effect of all active subsequent therapies. We did not look at country-specific scenarios where only certain subsequent therapies may be available, owing to extremely different and complex pathways across different countries. In conclusion, the analyses presented here provide statistical evidence in relation to the potential for confounding in survival results from subsequent therapies and blinded trial designs in incurable malignancies. Although the methods are underpinned by strong assumptions, all approaches resulted in an improvement in the HR for IRd versus Rd and remain relevant in informing clinical decisions. In addition, adjusted OS results indicated a possible clinically and statistically meaningful OS benefit with IRd treatment compared with Rd treatment among MM patients with ≥2 prior lines of therapy. While these results are encouraging, it is important to note that these data are relevant to patients not lenalidomide-refractory at relapse. Furthermore, many MM patients do not reach subsequent therapy or have access to the latest novel drugs; the analyses highlighted here are important for informing clinical practice in the RRMM setting, while in turn helping translate these findings to real world practice and further improving patient outcomes.30
Disclosures
KR reports receiving research grants from Amgen, Celgene (BMS), GSK, Janssen, and Takeda, and participation on an advisory board for AbbVie, Adaptive Biotechnologies, Amgen, Celgene (BMS), EUSA Pharma, GSK, Janssen, Karyopharm, Oncopeptides, Pfizer, Sanofi, and Takeda outside the submitted work. NJB reports honoraria from and a consulting/ advisory role for AbbVie, BMS/Celgene, FORUS, Genentech, Janssen, Karyopharm, Pfizer, Sanofi, and Takeda, and reports receiving research grants from Celgene and Pfizer. SKK reports receiving research grants from AbbVie, Amgen, Allogene, BMS, Carsgen, GSK, Janssen, Regeneron, Roche-Genentech, and Takeda, and consultation/participation on an advisory board (without personal payment) for AbbVie, ArcellX, Beigene, BMS, Janssen, K36, Loxo Oncology, Pfizer, Roche-Genentech, Sanofi, Takeda, and consultation/participation on an advisory board (with personal payment) for Antengene and Oncopeptides. AK reports employment and holding stock/stock
options from Takeda Pharmaceuticals during the conduct of the study/development of the manuscript. HC, BW, JD, and RL report employment at Takeda during the conduct of the study/development of the manuscript. PGR reports receiving research grants from Oncopeptides, BMS/Celgene, and Karyopharm, and service on advisory boards/consultation for BMS/Celgene, Takeda, GSK, Sanofi, Oncopeptides, Adaptive Technologies, and Karyopharm. PM reports honoraria from and participation on an advisory board for AbbVie, Amgen, Celgene, GSK, Janssen, Pfizer, Sanofi, and Takeda. All other authors have no conflicts of interest to disclose.
Contributions
HC, JD and RL contributed to the conception and design of the study. HC contributed to the collection of data. KR, NJB, SKK, AK, HC, BW, JD, RL, PGR and PM contributed to the analysis and interpretation of data. KR, AK, HC and RL drafted the manuscript. KR, NJB, SKK, AK, HC, BW, JD, RL, PGR and PM performed a critical review of the paper for important intellectual content. AK and BW contributed to the statistical analysis. HC provided study materials or patients. JD contributed to obtain funding. HC provided administrative, technical, or logistic support. HC and JD supervised the work. All authors approved the final version of the manuscript.
Acknowledgments
The authors would like to thank David Arthur, Dasha Cherepanov, Paola Stefan, and Victoria Federico Paly, of Takeda Development Center Americas, Inc. (TDCA), Lexington, MA, USA for providing the strategic focus and way to contextualize. Writing and editorial support, under the direction of the authors, was provided by Philippa Lloyd, BSc, of Ashfield MedComms, an Inizio company, funded by Takeda Pharmaceuticals U.S.A., Inc., Lexington, MA and complied with the Good Publication Practice (GPP) guidelines (DeTora LM, et al. Ann Intern Med. 2022;175:1298-1304).
Funding
The study was funded by Takeda Development Center Americas, Inc. (TDCA), Lexington, MA, USA. The funder had no role in the design and conduct of the study; collection, management, analysis, and interpretation of the data; preparation, review, or approval of the manuscript; and decision to submit the manuscript for publication.
Data-sharing statement.
The datasets, including the redacted study protocol, redacted statistical analysis plan, and individual participants’ data supporting the results reported in this article, will be made available within 3 months from initial request to researchers who provide a methodologically sound proposal. The data will be provided after its de-identification, in compliance with applicable privacy laws, data protection and requirements for consent and anonymization.
References
1. Branagan A, Lei M, Lou U, Raje N. Current treatment strategies for multiple myeloma. JCO Oncol Pract. 2020;16(1):5-14.
2. Richardson PG, Kumar SK, Masszi T, et al. Final overall survival analysis of the TOURMALINE-MM1 phase III trial of ixazomib, lenalidomide, and dexamethasone in patients with relapsed or refractory multiple myeloma. J Clin Oncol. 2021;39(22):2430-2442.
3. Richardson PG, Jacobus SJ, Weller EA, et al. Triplet therapy, transplantation, and maintenance until progression in myeloma. N Engl J Med. 2022;387(2):132-147.
4 Holstein SA, Suman VJ, McCarthy PL. Should overall survival remain an endpoint for multiple myeloma trials? Curr Hematol Malig Rep. 2019;14(1):31-38.
5. Robak P, Drozdz I, Szemraj J, Robak T. Drug resistance in multiple myeloma. Cancer Treat Rev. 2018;70:199-208.
6. Facon T, Kumar S, Plesner T, et al. Daratumumab plus lenalidomide and dexamethasone for untreated myeloma. N Engl J Med. 2019;380(22):2104-2115.
7. Offidani M, Corvatta L, Morè S, et al. Daratumumab for the management of newly diagnosed and relapsed/refractory multiple myeloma: current and emerging treatments. Front Oncol. 2020;10:624661.
8. Moreau P, Masszi T, Grzasko N, et al. Oral ixazomib, lenalidomide, and dexamethasone for multiple myeloma. N Engl J Med. 2016;374(17):1621-1634.
9 US Food and Drug Administration (FDA). Ninlaro (ixazomib) capsules. https://www.accessdata.fda.gov/drugsatfda_docs/ label/2022/208462s012s013lbl.pdf. Accessed June 2023.
10 European Medicines Agency (EMA). Ninlaro (ixazomib). https:// www.ema.europa.eu/en/medicines/human/EPAR/ninlaro. Accessed June 2023.
11. Bahlis NJ, Dimopoulos MA, White DJ, et al. Daratumumab plus lenalidomide and dexamethasone in relapsed/refractory multiple myeloma: extended follow-up of POLLUX, a randomized, open-label, phase 3 study. Leukemia. 2020;34(7):1875-1884.
12. Dimopoulos M, Chen C, Spencer A, et al. Long-term follow-up on overall survival from the MM-009 and MM-010 phase III trials of lenalidomide plus dexamethasone in patients with relapsed or refractory multiple myeloma. Leukemia. 2009;23(11):2147-2152.
13. Dimopoulos MA, Lonial S, Betts KA, et al. Elotuzumab plus lenalidomide and dexamethasone in relapsed/refractory multiple myeloma: extended 4-year follow-up and analysis of relative progression-free survival from the randomized ELOQUENT-2 trial. Cancer. 2018;124(20):4032-4043.
14 Siegel DS, Dimopoulos MA, Ludwig H, et al. Improvement in overall survival with carfilzomib, lenalidomide, and dexamethasone in patients with relapsed or refractory multiple myeloma. J Clin Oncol. 2018;36(8):728-734.
15. Dimopoulos MA, Lonial S, White D, et al. Elotuzumab, lenalidomide, and dexamethasone in RRMM: final overall survival results from the phase 3 randomized ELOQUENT-2 study. Blood Cancer J. 2020;10(9):1-10.
16. Stewart AK, Rajkumar SV, Dimopoulos MA, et al. Carfilzomib, lenalidomide, and dexamethasone for relapsed multiple myeloma. N Engl J Med. 2015;372(2):142-152.
17 clinicaltrials.gov. A phase 3 study comparing oral ixazomib plus lenalidomide and dexamethasone versus placebo plus
lenalidomide and dexamethasone in adult patients with relapsed and/or refractory multiple myeloma. ClinicalTrialsgov Identifier: NCT01564537. https://clinicaltrials.gov/ct2/show/ NCT01564537. Accessed June 2023.
18. Blair HA. Daratumumab: a review in relapsed and/or refractory multiple myeloma. Drugs. 2017;77(18):2013-2024.
19 Lonial S, Weiss BM, Usmani SZ, et al. Daratumumab monotherapy in patients with treatment-refractory multiple myeloma (SIRIUS): an open-label, randomised, phase 2 trial. Lancet. 2016;387(10027):1551-1560.
20 Moreau P, Kumar SK, San Miguel J, et al. Treatment of relapsed and refractory multiple myeloma: recommendations from the International Myeloma Working Group. Lancet Oncol. 2021;22(3):e105-e118.
21. Dimopoulos MA, Oriol A, Nahi H, et al. Daratumumab, lenalidomide, and dexamethasone for multiple myeloma. N Engl J Med. 2016;375(14):1319-1331.
22. Dimopoulos M, Spencer A, Attal M, et al. Lenalidomide plus dexamethasone for relapsed or refractory multiple myeloma. N Engl J Med. 2007;357(21):2123-2132.
23. Weber DM, Chen C, Niesvizky R, et al. Lenalidomide plus dexamethasone for relapsed multiple myeloma in North America. N Engl J Med. 2007;357(21):2133-2142.
24. Lonial S, Dimopoulos M, Palumbo A, et al. Elotuzumab therapy for relapsed or refractory multiple myeloma. N Engl J Med. 2015;373(7):621-631.
25. Dimopoulos MA, Moreau P, Palumbo A, et al. Carfilzomib and dexamethasone versus bortezomib and dexamethasone for patients with relapsed or refractory multiple myeloma (ENDEAVOR): a randomised, phase 3, open-label, multicentre study. Lancet Oncol. 2016;17(1):27-38.
26. Attal M, Richardson PG, Rajkumar SV, et al. Isatuximab plus pomalidomide and low-dose dexamethasone versus pomalidomide and low-dose dexamethasone in patients with relapsed and refractory multiple myeloma (ICARIA-MM): a randomised, multicentre, open-label, phase 3 study. Lancet. 2019;394(10214):2096-2107.
27. San-Miguel JF, Hungria VT, Yoon S-S, et al. Panobinostat plus bortezomib and dexamethasone versus placebo plus bortezomib and dexamethasone in patients with relapsed or relapsed and refractory multiple myeloma: a multicentre, randomised, double-blind phase 3 trial. Lancet Oncol. 2014;15(11):1195-1206. Erratum in: Lancet Oncol. 2015;1116(1191):e1196.
28. Latimer NR, Abrams KR. NICE DSU technical support document 16: adjusting survival time estimates in the presence of treatment switching [Internet]. London: National Institute for Health and Care Excellence (NICE); 2014 Jul. https://www.ncbi. nlm.nih.gov/books/NBK310374/. Accessed June 2023.
29 National Institute for Health and Care Excellence (NICE). Ixazomib with lenalidomide and dexamethasone for treating relapsed or refractory multiple myeloma. Technology appraisal guidance [TA870]. https://www.nice.org.uk/guidance/ta870. Accessed June 2023.
30 Richardson PG, San Miguel JF, Moreau P, et al. Interpreting clinical trial data in multiple myeloma: translating findings to the real-world setting. Blood Cancer J. 2018;8(11):109.
Belantamab mafodotin, lenalidomide and dexamethasone in transplant-ineligible patients with newly diagnosed multiple myeloma: part 1 results of a phase I/II study
Evangelos Terpos,1 Maria Gavriatopoulou,1 Ioannis Ntanasis-Stathopoulos,1 Panagiotis
Malandrakis,1 Despina Fotiou,1 Magdalini Migkou,1 Foteini Theodorakakou,1 Vasiliki Spiliopoulou,1 Ioannis V. Kostopoulos,2 Rodanthi-Eleni Syrigou,1 Evangelos Eleutherakis-Papaiakovou,1 Stavros Gkolfinopoulos,3 Ourania E. Tsitsilonis,2 Efstathios Kastritis1 and Meletios A. Dimopoulos1
1Department of Clinical Therapeutics, National and Kapodistrian University of Athens, School of Medicine, Athens, Greece; 2Department of Biology, School of Science, National and Kapodistrian University of Athens, Athens, Greece and 3Health Data Specialists, Dublin, Ireland
Abstract
Correspondence: E. Terpos eterpos@med.uoa.gr
Received: September 25, 2023. Accepted: February 6, 2024. Early view: February 15, 2024.
Preclinical and clinical data demonstrate synergy between belantamab mafodotin (belamaf) and immunomodulatory drugs with limited overlapping toxicities. We investigated the safety and efficacy of belamaf with lenalidomide 25 mg on days 1-21 every 28 days and dexamethasone 40 mg weekly (belamaf-Rd) in transplant-ineligible patients with newly diagnosed multiple myeloma. Thirty-six patients (median age, 72.5 years) were randomized to receive belamaf at three different doses (2.5, 1.9, or 1.4 mg/kg) every 8 weeks. The dosing schedule was extended to every 12 weeks to mitigate ocular toxicity. Most common grade ≥3 adverse events were fatigue (n=21, 58.3%), rash (n=6, 16.7%), diarrhea (n=8, 22.2%) and COVID-19 (n=5, 13.9%). Grade 3-4 ocular adverse events, comprising visual acuity decline from baseline and/or keratopathy, were reported in 39/216 (18.1%), 33/244 (13.5%), and 26/207 (12.6%) ophthalmological assessments in the 2.5, 1.9, and 1.4 mg/kg cohorts, respectively. Importantly, grade 3-4 keratopathy was identified in 9/216 (4.2%), 1/244 (0.4%) and 1/207(0.5%) assessments. Most patients (32/36, 88.9%) were treated with the extended, every-12-week schedule, during which 40, 33 and 16 doses were withheld due to ocular adverse events in the 2.5, 1.9, and 1.4 mg/kg cohorts, respectively. Overall, the rates of very good partial response and better and complete response and better were 83.3% and 52.8%, respectively, without significant differences among cohorts. Over a median follow-up of 20.3 months no disease progression was reported; six patients discontinued treatment due to infection-related death (4 cases of COVID-19, 2 cases of pneumonia) and one patient withdrew consent. Based on the toxicity/efficacy balance, the recommended phase II dose was 1.9 mg/kg every 8 weeks, extended to every 12 weeks because of toxicity. In conclusion, Belamaf-Rd, with the extended schedule for belamaf, showed important clinical activity and a significant improvement of ocular adverse events with minimal impact on vision-related functioning in an elderly, non-transplant eligible population.
Introduction
The current gold standard for the treatment of patients with newly diagnosed multiple myeloma (NDMM) who are not eligible for autologous stem cell transplantation (ASCT) involves combination therapy with lenalidomide and dexamethasone (Rd), supplemented by a third antimyeloma agent that has a different mechanism of action, such as a proteasome inhibitor (bortezomib - VRd) or an anti-CD38 monoclonal antibody (daratumumab - DaraRd). The quadruplet of daratumumab with melphalan, bortezomib and prednisone (DaraVMP) is an equal option for the upfront treatment of transplant-ineligible NDMM.1
The reported median progression-free survival (PFS) for patients treated with VRd was 41 months and the median overall survival (OS) was not reached in the SWOG S0777 study.2 However, a clear survival benefit with VRd over Rd was not evident in the subgroup of elderly patients aged 65 years or older.2 In the ALCYONE trial, the median PFS for patients treated with DaraVMP was 36.4 months, and the median OS was 82.7 months at a median follow-up of 74.7 months.3 Similarly, at a median follow-up of 64.5 months, median PFS and OS were not reached for patients treated with DaraRd in the MAIA study.4 DaraVMP and DaraRd produced better outcomes for patients than VMP and Rd, respectively, regardless of frailty status; however, frail
patients had inferior survival outcomes compared with non-frail patients in both the ALCYONE and MAIA studies.5,6 Therefore, new treatment approaches need to be explored to further optimize outcomes, especially for frail patients who have high-risk disease and, by extension, poor prognosis,7 considering also the debatable cost-effectiveness of adding anti-CD38 monoclonal antibodies to first-line treatment.8,9
B-cell maturation antigen (BCMA) is a cell membrane receptor expressed on late-stage B cells and plasma cells.10
The pivotal DREAMM-1 and DREAMM-2 clinical trials evaluated the efficacy and tolerability of anti-BCMA targeting and established BCMA-directed therapy as the fourth pillar of myeloma treatment, along with proteasome inhibitors, immunomodulatory drugs and anti-CD38 antibodies.11,12 Currently, the three main anti-BCMA therapeutic categories are antibody-drug conjugates, bispecific antibody constructs, and chimeric antigen receptor-modified T-cell therapy.13 Ongoing trials are evaluating each of these treatment strategies in the first-line setting.14-16 Belantamab mafodotin (belamaf; GSK2857916) is a firstin-class antibody-drug conjugate, which comprises a humanized IgG1k monoclonal antibody and the cytotoxic agent monomethyl auristatin F.17 Belamaf has demonstrated important efficacy in heavily pre-treated patients with relapsed/refractory MM (RRMM) who had received four or more prior lines of treatment.11,12 In the DREAMM-2 study, belamaf monotherapy was administered at a dose of 2.5 mg/kg every 3 weeks (q3w) and resulted in an overall response rate (ORR) of 32% with a median PFS and OS of 2.8 and 13.7 months, respectively.18 Real-world studies of belamaf monotherapy provided similar results with a marked survival benefit among responders.19-22 Moreover, although belamaf monotherapy was not statistically superior to pomalidomide with dexamethasone in terms of PFS prolongation (11.2 vs 7 months, respectively, P=0.56) in the DREAMM-3 study including RRMM patients who had received at least two prior lines of therapy, the responses were deeper and more durable with belamaf.23
In terms of safety, a common belamaf-related adverse event is ocular toxicity, which is usually reversible but may require long-term use of supportive eye medications. However, although cross-trial comparisons should be made with caution, it seems that belamaf is associated with a lower infection risk overall compared with that of anti-myeloma immunotherapies such as bispecific antibodies.13 The efficacy of belamaf increases substantially when it is given in combination with other anti-myeloma agents, as in such cases a synergistic effect may take place. For example, the combination of belamaf, pomalidomide and dexamethasone produced a median PFS of 15.6 months and an ORR of 86% in triple-class-exposed patients, with 60% of the patients achieving a very good partial response (VGPR) or better.24 Similarly, the combination of belamaf, carfilzomib and dexamethasone produced a VGPR or better
in 60% of relapsed patients who had received one or more lines of therapy.25 Finally, lenalidomide potentiates the antibody-dependent cell-mediated cytotoxicity and apoptotic effect of belamaf on myeloma cells in vitro. 10
Taking the above into consideration, we investigated the safety profile and potential benefit of the triplet combination of belamaf, lenalidomide and dexamethasone (belamaf-Rd) in patients with NDMM not eligible for ASCT in the phase I/II clinical trial BelaRd (ClinicalTrials.gov number: NCT04808037), an ongoing, open-label, single-center trial conducted by the Hellenic Society of Hematology (trial number: EAE-2020/MM0107) in Greece; the trial aims to enroll a total of 66 transplant-ineligible NDMM patients. The main objective of part 1 of the BelaRd study was to establish the recommended phase II dose (RP2D) of belamaf in combination with standard dose Rd in transplant-ineligible patients with NDMM. The safety and efficacy of the RP2D will be determined in part 2 of the study. For part 1, study outcomes included the safety and tolerability of belamaf-Rd as determined by the number of participants with dose-limiting toxicities (DLT), the number of participants with adverse events (AE) and serious AE, along with an evaluation of preliminary clinical activity, in each of the three dosing cohorts.
Methods
Patients
Key eligibility criteria for enrollment of patients in the study are shown in Online Supplementary Table S1. The study was approved by the institutional review board. All patients provided written informed consent before entering the study, which was performed in accordance with the Declaration of Helsinki and its amendments.
The study is divided into two parts. Part 1 focused on assessing the safety and tolerability of three different doses of belamaf (cohort 1: 2.5 mg/kg, cohort 2: 1.9 mg/kg, cohort 3: 1.4 mg/kg) in combination with Rd in a group of 36 patients to determine the RP2D. Patients were randomly allocated to each of the three cohorts (1:1:1). Initially, 18 patients were randomized (6 in each cohort) and a safety review was performed at the end of the DLT period of 4 weeks from the first dose of the last enrolled patient. The safety assessment was in favor of study continuation and another 18 patients were randomized (another 6 in each cohort). Another safety review was performed after the completion of the DLT period for all 36 patients to reach consensus regarding the RP2D. Patients receive treatment until documented disease progression, consent withdrawal, death or unacceptable toxicity.
Initially, belamaf is administered intravenously every 8 weeks (q8w), while dosing is adjusted every 12 weeks (q12w) depending on toxicity. More specifically, if at least one grade ≥2 ocular adverse event (OAE) is observed, belamaf
dosing is withheld, and restarted when all OAE are grade ≤1. From that point forward, all subsequent belamaf doses are rescheduled to q12w. OAE are defined as a Snellen best corrected visual acuity (BCVA) decline from baseline and/ or corneal findings suggestive of keratopathy.
Lenalidomide is administered at a dose of 25 mg po for 21 days in each 28-day cycle of treatment and dexamethasone is administered weekly at a dose of 40 mg po, according to the approved Rd regimen. Patients aged 75 years or older started dexamethasone at a dose of 20 mg weekly, whereas patients with renal impairment at baseline started with a reduced lenalidomide dose. The dose levels of lenalidomide and dexamethasone were adjusted according to the highest grade of hematologic and non-hematologic toxicity attributed to each drug (Online Supplementary Material). Lenalidomide dose levels included 25 mg, 20 mg, 15 mg, 10 mg, and 5 mg, whereas dexamethasone dose levels included 40 mg, 20 mg, 12 mg, 8 mg, and 4 mg.
All NDMM patients enrolled in the study received appropriate antiviral, antibiotic and antithrombotic prophylaxis as per standard clinical practice. Infection prevention included
oral valacyclovir 500 mg daily for varicella zoster virus, oral trimethoprim/sulfamethoxazole 800/160 mg three times weekly for Pneumocystis carinii and oral levofloxacin 500 mg daily during the first 3 months of treatment. Additionally, patients were instructed to get vaccinated against coronavirus disease 2019 (COVID-19), Streptococcus pneumoniae and influenza.
Study outcomes and assessments
DLT were evaluated during the first cycle of treatment and included the AE shown in Online Supplementary Table S2. During part 1, ocular safety was monitored closely through several assessments, including an ophthalmological examination performed at baseline, every 4 weeks (before the initiation of each cycle of treatment) and as clinically indicated. Ocular symptoms and BCVA were assessed and a slit lamp corneal examination was performed. Evaluation of the lens, fundoscopy and intraocular pressure measurements were performed as required. In addition, the Ocular Surface Disease Index was used to measure dry eye disease and its impact on activities of daily living. OAE
N (%)
R-ISS, N (%)
IMWG Frailty Score, N (%) Fit (score=0)
aHigh-risk cytogenetics defined as del 17p13, t(14:16) or t(4:14). q8w: every 8 weeks; ECOG
Cooperative Oncology Performance Status; ISS: International Staging System; R-ISS: Revised International Staging System;
Table 1. Patients’ demographics and baseline disease characteristics.
were graded on the Keratopathy Visual Acuity scale, while ocular symptoms and all non-ocular AE were classified according to the Common Terminology Criteria for Adverse Events version 5.0.
Efficacy assessments were performed on day 1 of each 28-day cycle. The ORR was defined as the percentage of participants with a confirmed partial response (PR), VGPR or (stringent) complete response (CR) according to the International Myeloma Working Group response criteria.26-28 Further information on methodology is provided in the Online Supplementary Material.
Results
Patients and treatment characteristics
Overall, 36 patients were included in part 1 of the BelaRd study and were equally allocated to the three dosing cohorts (12 patients each). The median age of the whole cohort was 72.5 years (range, 64-86 years); 19 patients (52.8%) were males. Eastern Cooperative Oncology Group performance status at
baseline was 0 in 15 (41.7%) patients, 1 in 19 (52.8%) patients, and 2 in two (5.6%) patients. According to the International Myeloma Working Group frailty score, 32 (88.9%) patients were characterized as intermediate-fit and four (11.1%) patients as frail. The patients’ disposition according to prognostic staging systems was 11 (30.6%), 19 (52.8%), and six (16.7%) for International Staging System (ISS) 1, 2 and 3, respectively, and six (16.7%), 27 (75.0%), and three (8.3%) for the Revised ISS 1, 2 and 3, respectively. Twenty-seven (75.0%) patients had IgG myeloma, seven (19.4%) had IgA myeloma and two (5.6%) patients had light chain myeloma. The patients’ demographics and baseline characteristics are provided in Table 1.
The median follow-up time for the whole study cohort at the time of this analysis was 20.3 months (range, 3.2-26.8 months). Overall, 31 patients (86.1%) had one or more doses of belamaf withheld due to AE. The proportions of patients with one or more dose withheld in the 2.5, 1.9, and 1.4 mg/ kg groups were eight (66.7%), 11 (91.7%), and 12 (100%). All dose suspensions were due to OAE. At the cut-off date, 29 (80.6%) patients were still on treatment, while seven (19.4%) had discontinued: six due to infection-related death
Total N of OAEa /Total N of ocular assessments (%)
Total N of
Total N of keratopathy assessments/Total N of ocular assessments (%) Grade
Grade
N of assessments with meaningful BCVA declinec with at least 3 lines drop in the better seeing eye/Total N of ocular assessments (%)
Time to resolutiond of meaningful BCVA decline with at least 3 lines drop in better seeing eye in
to resolutiond of keratopathy in months, median (range)
aOcular adverse events (OAE) in this analysis describe assessments of decreased best corrected visual acuity (BCVA) from baseline (cycle 1, day 1) and assessments of keratopathy. These assessments are graded by the Keratopathy Visual Acuity scale. In a each assessment, the maximum grade of the aforementioned is presented. bNo grade 4 change in BCVA was observed. cMeaningful BCVA decline is defined as BCVA decrease worse than 20/50 at the better-seeing eye. The better-seeing eye was considered the eye that had higher visual acuity at baseline (based on the BCVA). Patients with BCVA worse than 20/50 in both eyes at baseline were excluded from this analysis. dFor meaningful BCVA decline with at least 3 lines drop in better seeing eye, resolution was considered when the BCVA became 20/50 or better, or the decline was less than 3 lines; while for the resolution of OAE, BCVA decline and keratopathy, resolution was considered when the grade became ≤1. q8w: every 8 weeks; OAE: ocular adverse events; BCVA: best corrected visual acuity.
Table 2. Ocular adverse events and time to resolution.
(COVID-19: 1, 1, and 2; pneumonia: 1, 1, and 0, for the 2.5, 1.9, and 1.4 mg cohorts, respectively) and one withdrew consent due to personal reasons related to inability to visit the hospital according to the study protocol. Dose intensity (mg/kg/q4w) for each patient was defined as the total belamaf administered in mg/kg divided by the overall number of cycles per patient. For the 2.5, 1.9, and 1.4 mg/kg cohorts, the intended dose intensity was 1.25, 0.95, and 0.70, while the observed median dose intensity was 0.82, 0.65, and 0.50, respectively.
Recommended phase II dose selection
After reviewing all the safety and efficacy data, the safety review committee of the study concluded that the RP2D of belamaf should be 1.9 mg/kg q8w, extended to q12w to account for toxicity. This dose optimally balances the toxicity/efficacy ratio of the belamaf-Rd regimen because, compared to the higher dose of 2.5 mg/kg, equally deep
responses and fewer OAE were reported.
Safety
OAE, including a decline in BCVA from baseline and keratopathy, were reported in 191/216 (88.4%), 200/244 (82.0%), and 168/207 (81.2%) ophthalmological assessments in the three cohorts (Table 2), while grade ≥3 OAE were reported in 39/216 (18.1%), 33/244 (13.5%), and 26/207 (12.6%) of the assessments. The median times to the first grade ≥2 OAE were 3.9, 4.5 and 5.9 months for the 2.5, 1.9 and 1.4 mg/kg cohorts, respectively. Among the 216, 244, and 207 ophthalmological assessments performed on patients in the 2.5, 1.9 and 1.4 mg/kg cohorts, a meaningful decline in BCVA (BCVA <20/50) with a drop of at least three lines in the better seeing eye was observed in 21 (9.7%), 24 (9.8%), and 17 (8.5%) assessments, with median times to resolution of 1.2, 1.4, and 1.6 months, respectively. Additionally, BCVA ≤20/200 with a drop of at least three lines
Fatal
grade 5, N (%)
aFrequency of ≥15% in the overall population. bDecreased vision is used in the present analysis to describe any event suggesting a deterioration in visual acuity; it corresponds to the following MedDRA terms: vision blurred, visual acuity reduced and visual impairment. The worst grade of the aforementioned terms is presented. q8w: every 8 weeks; MedDRA: Medical Dictionary for Regulatory Activities; COVID-19: coronavirus disease 2019.
Table 3. Safety overview.
in the better-seeing eye was noted in only two (0.9%), three (1.2%), and eight (3.9%) cases. Keratopathy of any grade was evident in 136/216 (63.0%), 130/244 (53.3%) and 94/207 (45.4%) assessments, while grade ≥3 keratopathy was noted in 11/667 (1.6%), nine of which were reported in the 2.5 mg/kg cohort. Across all cohorts, the most frequently reported grade ≥3 ocular symptom was visual impairment (26/665, 3.9%). Regarding the Ocular Surface Disease Index, from 202, 234, and 196 responses received, the numbers of “all/most of the time” worst responses in the ocular symptoms category (gritty eyes, sensitivity to light, painful or sore eyes, blurred vision, poor vision) were six (3.0%), six (2.6%), and eight (4.1%), while the respective proportions in the activities of daily living category (reading, driving at night, working with a computer or bank machine, watching television) were six (3.0%), four (1.7%), and three (1.5%) for the 2.5, 1.9 and 1.4 mg/kg cohorts, respectively. Interpreting these results, it is important to
note that while ocular symptoms were frequently reported they had minimal impact on the patients’ daily activities. Overall, belamaf administration was withheld (delayed or skipped) in 134 assessments out of 386 planned infusions (34.7%) in both the q8w and q12w schedules due to OAE, while grade ≥2 OAE were reported for all patients who transitioned from the q8w to the q12w schedule. In the extended q12w schedule, doses were withheld in 58.0% (40/69), 40.3% (33/82), and 30.8% (16/52) assessments in the 2.5, 1.9, and 1.4 mg/kg cohorts, respectively. Importantly, the percentage of doses skipped in the 2.5 mg/ kg cohort was twice the percentage of doses skipped in the 1.4 mg/kg cohort. Moreover, the median delays for belamaf re-administration following an OAE-related dose suspension were 8.0, 4.4, and 4.6 weeks for the 2.5, 1.9 and 1.4 mg/kg cohorts, respectively, reflecting a substantial difference in terms of ocular safety.
DLT were reported in eight patients (2, 4, and 2 in the
Figure 1. Overall response rate and time to response. PR: partial response; VGPR: very good partial response; CR: complete response; sCR: stringent complete response; min: minimum; max: maximum.
2.5, 1.9 and 1.4 mg/kg cohorts, respectively), and included grade 3 fatigue (n=6) and grade 3 rash (n=2) (Table 3). No hematologic or ocular DLT emerged. The most common (affecting ≥15% of the patients) non-ocular grade ≥3 treatment-emergent AE, overall and in each dosing cohort, were as follows: fatigue (n=21, 58.3%; 7 [58.3%], 7 [58.3%], and 7 [58.3%]), rash (n=6, 16.7%; 2 [16.7%], 2 [16.7%], and 2 [16.7%]), diarrhea (n=8, 22.2%; 2 [16.7%], 3 [25.0%], and 3 [25.0%]) and COVID-19 (n=5, 13.9%; 2 [16.7%], 1 [8.3%], and 2 [16.7%]) (Table 3). Regarding grade ≥3 infections other than COVID-19, pneumonia was reported for three patients (1 in each cohort, 8.3%) and lower respiratory tract infection for one patient in cohort 3. Serious AE were reported in five (41.7%), two (16.7%) and four (33.3%) patients in the 2.5, 1.9 and 1.4 mg/kg cohorts, respectively. There were six infection-related fatal events; four patients died due to COVID-19 (1, 1, and 2 in the 2.5, 1.9 and 1.4 mg/kg cohorts, respectively) and two patients due to pneumonia (1, 1, and 0 in the 2.5, 1.9 and 1.4 mg/kg cohorts). Furthermore, no grade ≥3 thrombocytopenias or infusion-related reactions were reported.
Hypogammaglobulinemia (IgG <400 mg/dL) was a common finding during the study, manifesting in 27 of 36 (75.0%) patients, while severe hypogammaglobulinemia (IgG <200 mg/dL) occurred in 14 of the 36 (38.9%) patients. In order to decrease the risk of severe infections, it was decided to administer intravenous/subcutaneous immunoglobulin to all ongoing patients.
Efficacy
The ORR was 100% across all cohorts (Figure 1). More specifically, a CR or better was achieved by seven (58.3%), six (50.0%), and six (50.0%) patients, a VGPR or better by ten (83.3%), 11 (91.7%) and nine (75.0%) and a PR by two (16.7%), one (8.3%) and three (25.0%) of the patients in the 2.5, 1.9 and 1.4 mg/kg cohorts. The median (range) times to first response were 1.1 (1.0-2.1), 1 (0.9-3.8), and 1 (1.0-2.0) months, whereas the median (range) times to best response were 10.5 (1.0-23.1), 11.8 (2.8-18.0), and 8.0 (2.8-24.8) months for the respective cohorts. In the subgroup of frail patients (4/36, 11.1%), one achieved a stringent CR, one a VGPR and one had a PR. In the subgroup of patients with two or more cytogenetic abnormalities (4/36, 11.1%), two had a stringent CR and the other two had a VGPR.
After a median follow-up of 20.3 months, no disease progression was observed, the median PFS, median time to progression and median OS were not reached, and responses continue to deepen across all cohorts. The Kaplan-Meier curve for PFS and time to progression is shown in Figure 2, while response evolution during treatment per patient is shown in Figure 3.
Additionally, among 19 patients who manifested a CR or better and were evaluated for minimal residual disease using next-generation flow, 14 (73.7%) were negative at the 1 × 10⁻⁵ sensitivity level, accounting for six (85.7%), five
(83.3%) and three (50%) patients in the 2.5, 1.9 and 1.4 mg/ kg cohorts, respectively.
Discussion
The triplet combination of belamaf-Rd demonstrated tolerability and sustainable efficacy in the treatment of transplant-ineligible NDMM patients, in a less intensified dosing scheme for belamaf compared to the monotherapy dosing schedule of 2.5 mg/kg q3w used in the DREAMM-2 study.18 Simulations based on DREAMM-1 and DREAMM-2 data have suggested that dose reductions to 1.9 or 1.4 mg/kg, as well as prolongation of dose intervals, may be associated with reduced risk and duration of grade ≥2 OAE, without compromising efficacy.29 For this reason, studies investigating belamaf combinations are designed with lower dose intensity than that used in DREAMM-2, in order to reduce both ocular and non-ocular additive toxicity.30-32 In line with this, we planned three distinct cohorts, with belamaf administered at 2.5, 1.9 and 1.4 mg/kg q8w, considering also that our patients are unfit for ASCT due to age and/ or comorbidities. In order to further reduce the risk of OAE in this frail population, the dosing interval was extended to q12w at the first sign of a grade ≥2 OAE. With the q12w interval, fewer doses were withheld in the 1.9 and 1.4 mg/ kg cohorts than in the 2.5 mg/kg cohort, and the time required to restart belamaf administration was shorter. Additionally, similar responses were observed across all cohorts, although the response rate was seemingly higher in the 2.5 and 1.9 mg/kg cohorts than in the 1.4 mg/kg cohort. Taking this into account and considering the high patient variability in terms of toxicity, we decided to select 1.9 mg/kg as the RP2D.
There are two ongoing studies evaluating belamaf-VRd in
Figure 2. Progression-free survival and time to progression.
NDMM patients. The phase I DREAMM-9 study is evaluating the combination with different belamaf dose levels and dosing frequency in transplant-ineligible NDMM patients.16 In all cohorts, belamaf is administered at more extended time intervals after eight cycles of treatment. More specifically, the following dosing schemes for belamaf are being evaluated: 1.9 mg/kg every 3 and then every 4 weeks, 1.4 mg/kg every 6 and then every 8 weeks, 1.9 mg/kg every 6 and then every 8 weeks, 1.0 mg/kg every 3 and then every 4 weeks, 1.4 mg/kg every 3 and then every 4 weeks, 1.4 mg/kg for the first dose followed by 1.0 mg/kg every 9 and then every 12 weeks, and 1.9 mg/kg for the first dose followed by 1.4 mg/kg every 9 and then every 12 weeks. An interim analysis showed an ORR of >79% for all cohorts with at least 2 months of median follow-up, whereas the ORR were 100% and 92% in the 1.9 and 1.4 mg/kg cohorts, respectively. A VGPR or better was observed in 92% and 85% and 100% and 91% of patients in the 1.9 and 1.4 mg/ kg dose cohorts, at the intervals of 3 and 4 and 6 and 8 weeks, respectively. In our study, a VGPR or better was achieved in 92% and 75% of patients in the 1.9 and 1.4 mg/ kg dose cohorts with the extended belamaf schedule. Additionally, in frail patients and patients with two or more
cytogenetic abnormalities, a VGPR or better was achieved in 75% and 100% of the patients, respectively. However, due to the very low number of patients in these subgroups, the role of belamaf for high risk and frail patients remains to be determined in part 2 of the study. Although cross-trial comparisons should be approached with caution, it should be noted that responses are comparable between the two studies, even though a proteasome inhibitor is included in the treatment in DREAMM-9.
The GEM-BELA-VRd study evaluated the combination of belamaf at a dose of 2.5 mg/kg every 8 weeks in combination with VRd in transplant-eligible patients with NDMM. The interim analysis on 40 patients who had completed induction with four cycles of belamaf-VRd showed an ORR of 82% (69% VGPR or better).33 The exact impact of integrating anti-BCMA targeted therapies in the upfront treatment of patients with NDMM remains to be determined in future studies with long follow-up and relevant endpoints such as time to second progression of disease or death (PFS2). Although there are limited data showing a potentially reduced activity of anti-BCMA chimeric antigen receptor T-cell immunotherapy following anti-BCMA treatment, the sequence of the available drug combinations may play a key role.
Figure 3. Swimmer plot showing response evolution during treatment per patient.
In a frailty subgroup analysis of the MAIA trial, the ORR of intermediate-fit and frail patients receiving the DaraRd triplet was 96.9% and 87.2%, respectively. More specifically, a CR or better was achieved in 53.9% and 43.6% and a VGPR or better in 84.4% and 74.4% of intermediate-fit and frail patients, respectively. In a median follow-up of 36.4 months, PFS was not reached for the intermediate-fit and frail subgroups.6 Interestingly, the rates of CR or better and VGPR and better in the MAIA trial in the intermediate-fit and frail subgroups are comparable to those achieved in our study.
VRd is another regimen which is commonly used in the upfront treatment of transplant-ineligible patients with NDMM based on the results of the SWOG S0777 study.2 The ORR was 90% and the VGPR or better rate reached 75%. Although the PFS and the OS were prolonged compared with those achieved with Rd in the subset of patients who did not receive an ASCT, the OS benefit did not reach statistical significance in patients aged 65 years or older. Overall, belamaf-Rd has similar efficacy to DaraRd and VRd, whereas it allows for less frequent hospital visits. Furthermore, belamaf-related ocular toxicity seems to be completely reversible in contrast to bortezomib-related peripheral neuropathy which may not resolve completely in the long term.
In our study, the belamaf-Rd combination produced deep and durable responses, with a very short time to first response, across all cohorts. Most patients received belamaf at the q12w interval, as most experienced at least one grade ≥2 OAE. Importantly, this extended dosing schedule had minimal impact on patients’ vision, as manifested by the low frequency of clinically meaningful declines in BCVA. Additionally, grade ≥3 keratopathy was identified in <2% of assessments and resolved in a very short time. In contrast, keratopathy rates ranged from 32% to 72% across clinical trials and real-world studies in heavily pretreated RRMM patients who received belamaf monotherapy.19-23,34 However, the lowest reported rates in real-world studies should be interpreted with caution, because patients’ adherence to monthly ophthalmological assessments and ophthalmological expertise may differ significantly among studies. Furthermore, considering the pattern of development of belamaf-associated keratopathy,34 we estimate that the clinical manifestation of keratopathy follows the temporal pattern of eye itching when keratopathy is grade ≤1, while visual acuity declines when keratopathy progresses to grade ≥2. Thus, withholding belamaf dosing at the first sign of a grade ≥2 OAE, and restarting when all OAE are grade ≤1, as was done in our study, significantly lowers the risk of developing visual impairment. This was particularly evident for the q12w schedule.
Despite the occurrence of ocular symptoms, daily functioning was not significantly impaired. Indeed, “all/most of the time” worst responses in the activities of daily living category, including driving, reading, working with a computer
or bank machine and watching television, ranged between 1.5-3%. Apparently, a distinction should be made between clinically significant and asymptomatic ocular toxicity in order to make treatment decisions about belamaf administration, in analogy to bortezomib-related peripheral neuropathy. Questions on ocular symptoms and impact on activities such as driving, reading, watching television or using a smartphone, are validated and reliable, they include essential psychometric properties and can serve as an endpoint in clinical research.35,36
Another safety signal in our study was the occurrence of respiratory tract infections, especially COVID-19, at a higher frequency than in other clinical trials evaluating belamaf-based regimens.18,24,25 We assume that the increased infection rate can be partially attributed to the COVID-19 pandemic. However, the rate of grade 3-4 infections in our study is very low compared to that in studies of BCMA-targeting bispecific antibodies, such as teclistamab and erlanatamab (8.3% vs 44.8% and 39.8%, respectively).37,38 B-cell depleting therapies impair the host’s humoral response to infections.39 Lymphopenia and natural killer-cell depletion with anti-CD38 treatment predispose to severe and atypical infections such as listeria.40-42 The increased infection risk with novel immunotherapies is multifactorial and may be associated with hypogammaglobulinemia, neutropenia, lymphopenia, and T-cell exhaustion.43,44 Furthermore, patients under treatment with these agents are less likely to have an optimal humoral response to vaccination against common pathogens, including severe acute respiratory syndrome coronavirus-2 (SARSCoV-2), also considering the deregulated immune response due to the underlying myeloma.45-48 Complete vaccination is essential to prevent severe infections.49 Finally, the role of dexamethasone should also be revisited. We note that the cumulative dexamethasone dose is greater in our study than in the monotherapy belamaf studies in the RRMM setting, which may have a synergistic effect on the increased risk of infections. In a recent study, a dose/schedule-adjusted Rd-R regimen was compared to continuous Rd in intermediate-fit, elderly NDMM patients.50 In the comparator arm, dexamethasone was discontinued after nine Rd cycles, without any compromise in clinical activity. A limited duration of intensified therapy followed by a maintenance phase seems a reasonable approach, although there are currently no data to challenge the standard of continuous treatment in non-transplant eligible patients with NDMM. Consequently, prompt implementation of supportive medications to reduce the risk of infections is of utmost importance. In our study, all patients received valacyclovir for varicella zoster virus prophylaxis, trimethoprim-sulfamethoxazole for Pneumocystis jirovecii prophylaxis and levofloxacin for the first 3 months of treatment. Furthermore, all patients were advised to undergo annual influenza, pneumococcal and SARS-CoV-2 vaccination. Supportive care also included gastroprophylaxis and antithrombotic prophylaxis, while preventive measures were applied to re-
duce the risk of OAE: from treatment initiation, all patients received preservative-free artificial tears at least four to eight times daily, while they were instructed to use a cooling eye mask for up to 4 hours during belamaf administration (see Online Supplementary Information). Following the results of part 1 of the study, intravenous or subcutaneous immunoglobulin infusions are to be administered to all patients who manifest hypogammaglobulinemia during the course of the study until their IgG levels are >400 mg/dL. In conclusion, the clinical activity of the belamaf-Rd triplet was very promising, as rapid, deep and durable responses were observed across all doses. Treatment-emergent AE were manageable with appropriate supportive care. Furthermore, the lower dose levels of 1.9 and 1.4 mg/kg provided an optimal balance between OAE and clinical activity, especially at the q12w dosing interval. To further reduce the risk of ocular events, hematologists should remain vigilant and withhold belamaf if a patient manifests a grade ≥2 OAE; the drug can be restarted when all OAE subside to grade ≤1. These results suggest that this novel combination may be an effective treatment option for transplant-ineligible NDMM patients.
Disclosures
ET has received honoraria for advisory board participation or lectures from Amgen, AstraZeneca, Bristol Myers Squibb, Eusa Pharma, GSK, Integris Pharma, Janssen, Pfizer, Sanofi, and Takeda; research support (to his institution) from Amgen, GSK, Janssen, Sanofi, and Takeda; and travel grants from
References
1. Dimopoulos MA, Moreau P, Terpos E, et al. Multiple myeloma: EHA-ESMO clinical practice guidelines for diagnosis, treatment and follow-up. Hemasphere. 2021;5(2):e528.
2. Durie BGM, Hoering A, Sexton R, et al. Longer term follow-up of the randomized phase III trial SWOG S0777: bortezomib, lenalidomide and dexamethasone vs. lenalidomide and dexamethasone in patients (Pts) with previously untreated multiple myeloma without an intent for immediate autologous stem cell transplant (ASCT). Blood Cancer J. 2020;10(5):53.
3. Mateos MV, San-Miguel J, Cavo M, et al. Daratumumab plus bortezomib, melphalan, and prednisone (D-VMP) versus bortezomib, melphalan, and prednisone (VMP) alone in transplant-ineligible patients with newly diagnosed multiple myeloma (NDMM): updated analysis of the phase 3 Alcyone study. Blood. 2022;140(Suppl 1):10157-10159.
4. Facon T, Kumar SK, Weisel K, et al. Daratumumab plus lenalidomide and dexamethasone in patients with transplantineligible newly diagnosed multiple myeloma: Maia age subgroup analysis. Blood. 2022;140(Suppl 1):10133-10136.
5. Mateos MV, Dimopoulos MA, Cavo M, et al. Daratumumab plus bortezomib, melphalan, and prednisone versus bortezomib, melphalan, and prednisone in transplant-ineligible newly diagnosed multiple myeloma: frailty subgroup analysis of ALCYONE. Clin Lymphoma Myeloma Leuk. 2021;21(11):785-798.
6. Facon T, Cook G, Usmani SZ, et al. Daratumumab plus lenalidomide and dexamethasone in transplant-ineligible newly
Amgen, Eusa Pharma, and Takeda. MG declares honoraria from GSK, Janssen, Sanofi, AbbVie, Amgen, and Takeda. EK declares honoraria and research funding from Amgen, Janssen, GSK, and Pfizer. MAD declares honoraria from AbbVie, Amgen, Bristol Myers Squibb, GSK, Janssen, Karyopharm, Pharmacyclics Inc, Pfizer, Sanofi, and Takeda. SG is an employee of Health Data Specialists, Dublin, Ireland. All other authors have no conflicts of interest to disclose.
Contributions
ET and MAD conceived and supervised the study. ET, MG, and SG were responsible for the methodology and SG for the formal analysis. ET, MG, INS, PM, DF, MM, FT, VS, IVK, OT, RS, EEP, EK, and MAD performed the investigation. ET and MG wrote the original draft of the manuscript. INS, PM, DF, MM, FT, VS, RS, EEP, SG, IVK, OT, EK, and MAD reviewed and edited the manuscript. All authors read and agreed to the published version of the manuscript.
Acknowledgments
We thank the patients for participating in this study.
Funding
This study was supported in part by research funding from GSK.
Data-sharing statement
Primary data are available upon reasonable request from the corresponding author.
diagnosed multiple myeloma: frailty subgroup analysis of MAIA. Leukemia. 2022;36(4):1066-1077.
7. Korst C, van de Donk N. Should all newly diagnosed MM patients receive CD38 antibody-based treatment? Hematology Am Soc Hematol Educ Program. 2020;2020(1):259-263.
8. Narsipur N, Bulla S, Yoo C, et al. Cost-effectiveness of adding daratumumab or bortezomib to lenalidomide plus dexamethasone for newly diagnosed multiple myeloma. J Manag Care Spec Pharm. 2021;27(12):1691-1702.
9 Li S, Li J, Peng L, et al. First-line daratumumab in addition to chemotherapy for newly diagnosed multiple myeloma patients who are transplant ineligible: a cost-effectiveness analysis. Clin Ther. 2021;43(7):1253-1264.
10 Tai YT, Mayes PA, Acharya C, et al. Novel anti-B-cell maturation antigen antibody-drug conjugate (GSK2857916) selectively induces killing of multiple myeloma. Blood. 2014;123(20):3128-3138.
11. Lonial S, Lee HC, Badros A, et al. Belantamab mafodotin for relapsed or refractory multiple myeloma (DREAMM-2): a twoarm, randomised, open-label, phase 2 study. Lancet Oncol. 2020;21(2):207-221.
12. Trudel S, Lendvai N, Popat R, et al. Antibody-drug conjugate, GSK2857916, in relapsed/refractory multiple myeloma: an update on safety and efficacy from dose expansion phase I study. Blood Cancer J. 2019;9(4):37.
13. Shah N, Chari A, Scott E, Mezzi K, Usmani SZ. B-cell maturation antigen (BCMA) in multiple myeloma: rationale for targeting and
current therapeutic approaches. Leukemia. 2020;34(4):985-1005.
14 Zamagni E, Boccadoro M, Spencer A, et al. MajesTEC-4 (EMN30): a phase 3 trial of teclistamab + lenalidomide versus lenalidomide alone as maintenance therapy following autologous stem cell transplantation in patients with newly diagnosed multiple myeloma. Blood. 2022;140(Suppl 1):7289-7291.
15. Usmani SZ, Berdeja JG, Truppel-Hartmann A, et al. KarMMa-4: idecabtagene vicleucel (ide-cel, bb2121), a BCMA-directed CAR T-cell therapy in high-risk newly diagnosed multiple myeloma. J Clin Oncol. 2021;39:(15_suppl):TPS8053.
16. Usmani SZ, Mielnik M, Byun JM, et al. A phase 1 study of belantamab mafodotin in combination with standard of care in newly diagnosed multiple myeloma: an interim analysis of DREAMM-9. J Clin Oncol. 2023;41(16_suppl):8018.
17. European Medicines Agency. Blenrep (belantamab mafodotin). Summary of product characteristics. https://www.ema.europa. eu/en/documents/product-information/blenrep-epar-productinformation_en.pdf. Accessed 12 July 2023.
18. Lonial S, Lee HC, Badros A, et al. Longer term outcomes with single-agent belantamab mafodotin in patients with relapsed or refractory multiple myeloma: 13-month follow-up from the pivotal DREAMM-2 study. Cancer. 2021;127(22):4198-4212.
19 Shragai T, Magen H, Lavi N, et al. Real-world experience with belantamab mafodotin therapy for relapsed/refractory multiple myeloma: a multicentre retrospective study. Br J Haematol. 2023;200(1):45-53.
20 Talbot A, Bobin A, Tabone L, et al. Real-world study of the efficacy and safety of belantamab mafodotin (GSK2857916) in relapsed or refractory multiple myeloma based on data from the nominative ATU in France: IFM 2020-04 study. Haematologica. 2023;108(10):2774-2782.
21. Vaxman I, Abeykoon J, Dispenzieri A, et al. “Real-life” data of the efficacy and safety of belantamab mafodotin in relapsed multiple myeloma - the Mayo Clinic experience. Blood Cancer J. 2021;11(12):196.
22. Ntanasis-Stathopoulos I, Malandrakis P, Fotiou D, et al. Realworld effectiveness and safety of belantamab mafodotin monotherapy in triple-class refractory multiple myeloma. Int J Mol Sci. 2023;24(14):11829.
23. Dimopoulos MA, Hungria VTM, Radinoff A, et al. Efficacy and safety of single-agent belantamab mafodotin versus pomalidomide plus low-dose dexamethasone in patients with relapsed or refractory multiple myeloma (DREAMM-3): a phase 3, open-label, randomised study. Lancet Haematol. 2023;10(10):e801-e812.
24. Trudel S, McCurdy A, Fu M, et al. Belantamab mafodotin in combination with pmalidomide and dexamethasone demonstrates durable responses in triple class exposed/ refractory multiple myeloma. Blood. 2022;140(Suppl 1):7306-7307.
25. Lasica M, Spencer A, Campbell P, et al. P946: a phase I/II single arm study of belantamab mafodotin, carfilzomib and dexamethasone in patients with relapsed multiple myeloma: AMARC 19-02 BELACARD study. Hemasphere. 2022;6(Suppl):836-837.
26. Rajkumar SV, Dimopoulos MA, Palumbo A, et al. International Myeloma Working Group updated criteria for the diagnosis of multiple myeloma. Lancet Oncol. 2014;15(12):e538-548.
27. Palumbo A, Bringhen S, Mateos MV, et al. Geriatric assessment predicts survival and toxicities in elderly myeloma patients: an International Myeloma Working Group report. Blood. 2015;125(13):2068-2074.
28. Kumar S, Paiva B, Anderson KC, et al. International Myeloma Working Group consensus criteria for response and minimal
residual disease assessment in multiple myeloma. Lancet Oncol. 2016;17(8):e328-e346.
29 Collins J, van Noort M, Rathi C, et al. Longitudinal efficacy and safety modeling and simulation framework to aid dose selection of belantamab mafodotin for patients with multiple myeloma. CPT Pharmacometrics Syst Pharmacol. 2023;12(10):1411-1424.
30 Nooka AK, Weisel K, van de Donk NW, et al. Belantamab mafodotin in combination with novel agents in relapsed/ refractory multiple myeloma: DREAMM-5 study design. Future Oncol. 2021;17(16):1987-2003.
31. Quach H, Gironella M, Lee C, et al. Safety and clinical activity of belantamab mafodotin with lenalidomide plus dexamethasone in patients with relapsed/refractory multiple myeloma (RRMM): DREAMM-6 arm-A interim analysis. J Clin Oncol. 2022;40(16_suppl):8017.
32. Trudel S, Davis R, Lewis NM, et al. DREAMM-8: a phase III study of the efficacy and safety of belantamab mafodotin with pomalidomide and dexamethasone (B-Pd) vs pomalidomide plus bortezomib and dexamethasone (PVd) in patients with relapsed/refractory multiple myeloma (RRMM). Blood. 2020;136(Suppl 1):4.
33. Gonzalez-Calle V, Rodriguez Otero P, Rey-Bua B, et al. Belantamab mafodotin in combination with Vrd for the treatment of newly diagnosed transplant eligible multiple myeloma patients: results from the phase II, open label, multicenter, GEM-BELA-Vrd trial. Blood. 2022;140(Suppl 1):7286-7288.
34 Farooq AV, Degli Esposti S, Popat R, et al. Corneal epithelial findings in patients with multiple myeloma treated with antibodydrug conjugate belantamab mafodotin in the pivotal, randomized, DREAMM-2 study. Ophthalmol Ther. 2020;9(4):889-911.
35. Schiffman RM, Christianson MD, Jacobsen G, Hirsch JD, Reis BL. Reliability and validity of the Ocular Surface Disease Index. Arch Ophthalmol. 2000;118(5):615-621.
36. Okumura Y, Inomata T, Iwata N, et al. A review of dry eye questionnaires: measuring patient-reported outcomes and health-related quality of life. Diagnostics (Basel). 2020;10(8):559.
37. Moreau P, Garfall AL, van de Donk NWCJ, et al. Teclistamab in relapsed or refractory multiple myeloma. N Engl J Med. 2022;387(6):495-505.
38. Lesokhin AM, Tomasson MH, Arnulf B, et al. Elranatamab in relapsed or refractory multiple myeloma: phase 2 MagnetisMM-3 trial results. Nat Med. 2023;29(9):2259-2267.
39 Ludwig H, Terpos E, van de Donk N, et al. Prevention and management of adverse events during treatment with bispecific antibodies and CAR T cells in multiple myeloma: a consensus report of the European Myeloma Network. Lancet Oncol. 2023;24(6):e255-e269.
40 Vassilopoulos S, Vassilopoulos A, Kalligeros M, Shehadeh F, Mylonakis E. Cumulative incidence and relative risk of infection in patients with multiple myeloma treated with anti-CD38 monoclonal antibody-based regimens: a systematic review and meta-analysis. Open Forum Infect Dis. 2022;9(11):ofac574.
41. Khan S, Vaisman A, Hota SS, et al. Listeria susceptibility in patients with multiple myeloma receiving daratumumab-based therapy. JAMA Oncol. 2020;6(2):293-294.
42. Nahi H, Chrobok M, Gran C, et al. Infectious complications and NK cell depletion following daratumumab treatment of multiple myeloma. PLoS One. 2019;14(2):e0211927.
43. Mazahreh F, Mazahreh L, Schinke C, et al. Risk of infections associated with the use of bispecific antibodies in multiple myeloma: a pooled analysis. Blood Adv. 2023;7(13):3069-3074.
44 Reynolds G, Cliff ERS, Mohyuddin GR, et al. Infections following bispecific antibodies in myeloma: a systematic review and meta-analysis. Blood Adv. 2023;7(19):5898-5903.
45. Terpos E, Gavriatopoulou M, Ntanasis-Stathopoulos I, et al. Booster BNT162b2 optimizes SARS-CoV-2 humoral response in patients with myeloma: the negative effect of anti-BCMA therapy. Blood. 2022;139(9):1409-1412.
46. Robertson JD, Nagesh K, Jowitt SN, et al. Immunogenicity of vaccination against influenza, Streptococcus pneumoniae and Haemophilus influenzae type B in patients with multiple myeloma. Br J Cancer. 2000;82(7):1261-1265.
47. Renaud L, Schraen S, Fouquet G, et al. Response to pneumococcal vaccination in multiple myeloma. Cancer Med.
2019;8(8):3822-3830.
48. Chuleerarux N, Manothummetha K, Moonla C, et al. Immunogenicity of SARS-CoV-2 vaccines in patients with multiple myeloma: a systematic review and meta-analysis. Blood Adv. 2022;6(24):6198-6207.
49 Raje NS, Anaissie E, Kumar SK, et al. Consensus guidelines and recommendations for infection prevention in multiple myeloma: a report from the International Myeloma Working Group. Lancet Haematol. 2022;9(2):e143-e161.
50 Larocca A, Bonello F, Gaidano G, et al. Dose/schedule-adjusted Rd-R vs continuous Rd for elderly, intermediate-fit patients with newly diagnosed multiple myeloma. Blood. 2021;137(22):3027-3036.
A NOTCH3-CXCL12-driven myeloma-tumor niche
signaling axis promotes chemoresistance in multiple myeloma
Hayley M. Sabol,1 Cody Ashby,2,3 Manish Adhikari,1 Aric Anloague,1 Japneet Kaur,1 Sharmin Khan,1 Samrat Roy Choudhury,3,4 Carolina Schinke,3,5 Michela Palmieri,6 C. Lowry Barnes,7 Elena Ambrogini,6 Intawat Nookaew2,3 and Jesus Delgado-Calle1,3
1Physiology and Cell Biology, University of Arkansas for Medical Sciences; 2Department of Biomedical Informatics, University of Arkansas for Medical Sciences; 3Winthrop P. Rockefeller Cancer Institute, University of Arkansas for Medical Sciences; 4Pediatric Hematology-Oncology, Arkansas Children’s Research Institute, University of Arkansas for Medical Sciences; 5Myeloma Center, University of Arkansas for Medical Sciences; 6Division of Endocrinology and Metabolism, Center for Osteoporosis and Metabolic Bone Diseases and Center for Musculoskeletal Disease Research, University of Arkansas for Medical Sciences and Central Arkansas Veterans Healthcare System and 7Department of Orthopedic Surgery, University of Arkansas for Medical Sciences, Little Rock, AR, USA
Abstract
Correspondence: J. Delgado-Calle jdelgadocalle@uams.edu
Received: October 10, 2023.
Accepted: February 13, 2024. Early view: February 22, 2024.
Multiple myeloma (MM) remains incurable due to disease relapse and drug resistance. Notch signals from the tumor microenvironment (TME) confer chemoresistance, but the cellular and molecular mechanisms are not entirely understood. Using clinical and transcriptomic datasets, we found that NOTCH3 is upregulated in CD138+ cells from newly diagnosed MM (NDMM) patients compared to healthy individuals and increased in progression/relapsed MM (PRMM) patients. Further, NDMM patients with high NOTCH3 expression exhibited worse responses to bortezomib (BOR)-based therapies. Cells of the TME, including osteocytes, upregulated NOTCH3 in MM cells and protected them from apoptosis induced by BOR. NOTCH3 activation (NOTCH3OE) in MM cells decreased BOR anti-MM efficacy and its ability to improve survival in in vivo myeloma models. Molecular analyses revealed that NDMM and PRMM patients with high NOTCH3 exhibit CXCL12 upregulation. TME cells upregulated CXCL12 and activated the CXCR4 pathway in MM cells in a NOTCH3-dependent manner. Moreover, genetic or pharmacologic inhibition of CXCL12 in NOTCH3OE MM cells restored sensitivity to BOR regimes in vitro and in human bones bearing NOTCH3OE MM tumors cultured ex vivo. Our clinical and preclinical data unravel a novel NOTCH3-CXCL12 pro-survival signaling axis in the TME and suggest that osteocytes transmit chemoresistance signals to MM cells.
Introduction
Multiple myeloma (MM) is a hematological cancer characterized by the accumulation of malignant plasma cells in the bone marrow and the overproduction of monoclonal proteins (M-proteins). First-line therapy in MM includes proteasome inhibitors, such as bortezomib (BOR), administered alone or in combination regimens.1 Despite high response rates to BOR-based therapies, MM remains incurable due to the development of chemoresistance and disease recurrence after transient remissions. Although MM cells exhibit genetic and molecular heterogeneity, they depend highly on the bone marrow niche. MM cells localize in specialized niches in the marrow where tumor microenvironment (TME) cells promote their pro-
liferation and allow them to escape anti-MM therapies by promoting de novo chemoresistance.2-4 Notch signaling activation downstream of the four NOTCH (1-4) receptors in MM cells plays a critical role in transforming the bone marrow into a permissive niche for MM progression and chemoresistance.5,6 Pharmacologic pan-inhibition of Notch in the TME induces apoptosis in MM cells and enhances sensitivity to chemotherapy.6,7 Notch signals from stromal cells contribute to de novo drug resistance to proteasome inhibitors in MM cells.8 Yet, the role of other TME cells and how MM cells integrate and execute TME Notch signals are not completely understood. Prior studies have focused on NOTCH1 or 2, as they are expressed at relatively higher levels than NOTCH3 or 4 in NDMM patients.9 However, we recently reported that 30% of NDMM
patients exhibit NOTCH3 expression levels comparable to NOTCH1 or NOTCH2 9 Moreover, we showed that osteocytes, the most abundant bone cells,10 rapidly upregulate NOTCH3 expression in MM cells,9 emphasizing the need to understand the role of NOTCH3 in MM further. In this study, we describe a novel NOTCH3-CXCL12 signaling axis of TME-mediated chemoresistance and identify the osteocyte as a new TME cell capable of influencing MM therapeutic responses to BOR-based regimes.
Methods
Study population
The mRNA expression of NOTCH receptors was studied in CD138+ plasma cells from a previously described institutional cohort of NDMM patients (N=52; t(4;14=8; t(11;14)=10; t(14;16)=9; t(14;20)=6; D1=12; D2=7) and age-matched healthy donors (N=4).11 In order to study the impact of NOTCH3 on the transcriptome and clinical outcomes of MM patients, we obtained clinical and gene expression data from NDMM patients from the Multiple Myeloma Research Foundation (MMRF) CoMMpass registry (clinicaltrial gov. Identifier: NCT01454297, version IA15).
Bioinformatic analyses
Gene expression and mutation analyses are described in the Online Supplementary Appendix.
Cell culture
MM osteocyte (5:1) or MM stroma (5:1) co-cultures were established as described before.9,12 Co-cultures were treated with plerixafor (25 uM), BOR (3 nM), VRd (BOR: 2 nM, lenalidomide: 1 uM, dexamethasone: 10 nM) and refreshed every 24 hours (h). Cell characteristics, reagents, and methods for apoptosis/proliferation assays are described in the Online Supplementary Appendix.
Gene expression
Methods to quantify mRNA (quantitative polymerase chain reaction [qPCR]) and protein expression (western blot and enzyme-linked immunosorbant assay) are described in the Online Supplementary Appendix
Genetic inhibition/activation in multiple myeloma cells
Methods used to manipulate NOTCH3/CXCL12 expression are described in the Online Supplementary Appendix.
Ex vivo organ cultures
Ex vivo MM murine bone organ cultures were established as described before.12 Ex vivo MM human bone organ cultures were established with human cancellous bone fragments similar in size obtained from femoral heads discarded after hip arthroplasty (see the Online Supplementary Appendix for details).
Animal studies
Seven-week-old immunodeficient littermate NSG female and male mice were injected intravenously with 5x10⁵ OPM2-Scr MM cells, OPM2-Notch3OE MM cells, or saline. Equal numbers of female and male mice were used per group. After 1 week, mice were randomized based on tumor burden and bone disease to two groups (1) vehicle (saline) or (2) 0.1 mg/kg BOR (intraperitoneally [i.p.]) 5x/week (wk) for 3 wks. In order to assess survival, the health of mice was monitored daily, and mice were euthanized at first sign of back leg paralysis. The sample size was calculated based on previous studies.13,14 MicroCT analyses were performed as shown before.12,14
Statistics
Data were analyzed using GraphPad (GraphPad Software Inc, San Diego, CA, USA). Differences in means were analyzed using a combination of unpaired t test, one-way or two-way ANOVA tests, followed by pairwise multiple comparisons (Tukey post hoc test). Values were reported as means ± standard deviation (SD). P values ≤0.05 were considered statistically significant. Data analysis was performed in a blinded fashion.
Study approvals
All procedures involving animals were performed in accordance with guidelines issued by the University of Arkansas for Medical Sciences IACUC (protocol #2022200000489). Collection and de-identification of human bone samples was coordinated by the UAMS Winthrop P. Rockefeller Cancer Institute TBAPS and approved by the UAMS Institutional Review Board (IRB) (protocol # 262940). All participants provided written, informed consent before study procedures occurred, with continuous consent ensured throughout participation. NDMM patients and healthy donors were consented with IRB approval (protocol IRB #260284) for bone marrow aspirates for CD138+ cell selection.
Results
NOTCH3 expression is increased in newly diagnosed patients by a non-mutational, tumor microenvironment cell-dependent mechanism
In order to investigate the integration of Notch signals by MM cells, we first compared the expression of the NOTCH receptors in CD138+ plasma cells using an institutional cohort of NDMM patients of major molecular MM subgroups, including primary translocations t(4;14), t(11;14), t(14;16) and t(14:20), hyperdiploid subgroups D1 and D2, and age-matched healthy donors (Figure 1A). We found no differences in the expression of NOTCH1 or NOTCH2 in NDMM patients compared to healthy donors, except for a NOTCH2 upregulation detected in the t(14;16) MM subgroup. NOTCH4 was decreased in all the MM subgroups, except the t(4;14) MM subgroup. In contrast, NOTCH3 ex-
Figure 1. NOTCH3 expression is increased in newly diagnosed multiple myleoma patients and regulated by the cells of the tumor niche. (A) Gene expression of NOTCH 1-4 receptors in CD138+ cells from newly diagnosed multiple myeloma (NDMM) or healthy donors. N=52 patients. *P<0.05 versus healthy donors by one-way ANOVA, followed by a Tukey post hoc test. Boxes show the data interquartile range, the middle line in the box represents the median, and whiskers the 95% confidence interval of the mean. (B) NOTCH3 gene expression in CD138+ cells from NDMM patients with or without point mutations in the NOTCH3 gene. N=725 (12 with mutations) NDMM patients.
pression was elevated in all NDMM subgroups, although it did not reach statistical significance in the t(14;16) subgroup. In order to understand the mechanisms behind NOTCH3 upregulation in NDMM, we next mined the MMRF CoMMpass cohort dataset to investigate whether NOTCH3 expression levels in CD138+ plasma cells from NDMM patients correlated with gain- or loss-of-function mutations in the NOTCH3 gene. We identified several mutations in the NOTCH3 gene ( Online Supplementary Table S1) but did not find an association with NOTCH3 expression (Figure 1B). In addition, we investigated the presence of NOTCH3 mutations in a panel of 69 human MM cell lines and identified only one cell line, FLAM76 (t11;14), with a frameshift mutation (AGGGG/AGGG). Next, we investigated if constituents of the TME upregulate NOTCH3 in MM cells. As shown before,9 co-culture with osteocytes upregulated NOTCH3 and increased the expression of the Notch target gene HES1 in several murine and human MM cell lines (Online Supplementary Figure S1A-C). In contrast, no changes were detected in NOTCH1, 2 , or 4 . Like osteocytes, co-culture with stromal cells, another important cellular component of the MM-TME,2 selectively upregulated NOTCH3 expression and activated Notch signaling in MM cells ( Online Supplementary Figure S1D-F). Together, these data support that non-mutational, TME cell-dependent NOTCH3 activation occurs in specialized niches in the bone marrow of NDMM patients.
NOTCH3 expression correlates with worse responses to bortezomib-based therapies in newly diagnosed multiple myleoma patients
Further bioinformatic mining of the CoMMpass cohort revealed that NDMM patients with high NOTCH3 expression exhibited upregulation and enrichment in genes associated with processes involved in chemoresistance, including responses to drugs (Figure 2A) and cell-adhesion pathways (Figure 2B). Moreover, gene set enrichment analysis (GSEA) revealed that the transcriptome of high NOTCH3 NDMM patients is enriched in genes associated with poor responses to BOR therapy (Figure 2C).15 Poised by these observations, we next investigated if high expression levels of NOTCH3 are associated with poor prognosis in NDMM patients. No significant correlations were observed between the expression of NOTCH3 and OS or PFS (Online Supplementary Figure S2A, B). However, after stratification by therapy (combined graph is shown in Online Supplementary Figure S2C), we observed that NDMM patients with high NOTCH3 had significantly worse PFS when receiving BOR-based therapies versus other therapies not including BOR (Figure 2D). In contrast, NDMM patients with low NOTCH3 levels exhibited similar PFS regardless of the therapy received. Next, we rationalized that if CD138+ MM cells expressing high NOTCH3 are chemoresistant, the expression of NOTCH3 should increase in PRMM patients. Consistent with this notion, we found an increase in NOTCH3 expression in PRMM patients using
Figure 2. NOTCH3 expression is increased in relapsed multiple myleoma patients and correlates with poor responses to bortezomib-based therapies. Network plot of selected upregulated functional enrichment analysis of gene ontology (GO) terms related to (A) responses to drugs or (B) cell-adhesion in CD138+ cells from newly diagnosed multiple myeloma (NDMM) patients with high versus low NOTCH3 expression. The size of the circles represents the number of genes in the individual GO terms. The
Continued on following page.
thickness of the lines represents the number of overlapped genes between the individual GO terms. (C) Gene set enrichment analysis (GSEA) shows NDMM patients with high NOTCH3 have enrichment in genes involved in poor responses to bortezomib (BOR) therapy in MM patients compared to NDMM patients with low NOTCH3 expression. Data were analyzed using a weighted Kolmogorov-Smirnov-like statistical test. (D) Kaplan-Meier plot of the progression-free survival (PFS) of NDMM patients with high (top) versus low (bottom) NOTCH3 expression receiving BOR-based (blue line) versus other therapies (other) not including BOR (red line). N=708 patients. Data were analyzed using a log-rank (Mantel-Cox) test. (E) Gene expression of NOTCH 1-4 receptors in CD138+ cells from paired diagnosis (NDMM) and progression/relapsed MM (PRMM) patients. N=70/group. *P<0.05 versus diagnosis by Student’s t test. Boxes show the data interquartile range, the middle line in the box represents the median, and whiskers the 95% confidence interval of the mean. FDR: false discovery rate; NES: normalized enrichment score.
paired diagnosis-relapse samples of MM patients included in the CoMMpass cohort (Figure 2E). These results suggest that NOTCH3-regulated transcriptional reprogramming of MM cells promotes drug resistance to BOR-based therapies and associates with poor clinical outcomes.
In order to investigate the impact of NOTCH3 signaling on drug resistance to BOR-based therapies, we selected murine 5TGM1 and human U266 MM cells, which exhibit higher levels of NOTCH3 expression/activation,9 and human OPM2 MM cells, with lower NOTCH3 levels (Online Supplementary Figure S3A), and determined that BOR therapy does not affect NOTCH expression in these cell lines (Online Supplementary Figure S3B). Then, we knocked down NOTCH3 (NOTCH3KD) in 5TGM19 and U266 MM cells (Online Supplementary Figure 3C) and established co-cultures with cells of the TME (Figure 3A). Control (Scr) and NOTCH3KD MM cells cultured alone exhibited similar apoptotic responses to BOR and the triple regime VRd (BOR + dexamethasone + lenalidomide), frequently used in induction therapy for NDMM. Co-culture with osteocytes decreased by ~50% the apoptosis induced by BOR or VRd in control MM cells, while this protection was lost in Notch3KD MM cells (Figure 3A, B). Second, we used CRISPR-mediated transcriptional activation from the endogenous NOTCH3 loci to promote a more physiological activation of NOTCH3 in OPM2 MM cells (NOTCH3OE cells) while permitting further NOTCH3 regulation by the TME (Online Supplementary Figure S3D). NOTCH3 activation did not alter the anti-MM efficacy of these therapies in MM cells cultured alone but enhanced the pro-survival effects of osteocytes in in vitro co-cultures exposed to BOR or VRd (Figure 3C). Similar responses to NOTCH3 inhibition/activation in MM cells exposed to BOR or VRd were also observed in co-cultures with stromal cells ( Online Supplementary Figure S4A-C ). Co-culture with osteocytes or genetic manipulation of NOTCH3 did not affect the baseline levels of apoptosis in MM cells cultured in the absence of BOR (Online Supplementary Figure S4D-E).
Next, we injected Scr and NOTCH3OE OPM2 MM cells in immunodeficient mice and treated them with BOR after the tumors engrafted. BOR decreased tumor progression, re-
duced tumor burden (~60%), and improved survival in mice injected with control MM cells (Figure 4A-C). In contrast, BOR only reduced tumor burden by 23% in mice bearing NOTCH3OE MM cells and had no impact on survival. Lastly, to assess the effects of NOTCH3 inhibition on responses to BOR-based therapies, we established ex vivo MM bone organ cultures (Figure 4D), a system that recapitulates the spatial dimension, cellular diversity, and molecular networks of the TME in a controlled setting.16 Scr or NOTCH3KD MM cells were allowed to colonize calvarial bones, treated with BOR, and MM-secreted paraprotein levels were quantified in the media to assess tumor growth (Figure 4E, F; Online Supplementary Figures S5A, C). BOR exhibited higher anti-MM efficacy in bones bearing 5TGM1 or U266 NOTCH3KD MM cells compared to Scr MM cells (Figure 4E, F). Similarly, treatment of bones bearing 5TGM1 NOTCH3KD MM cells with VRd resulted in better tumor reduction compared to bones bearing control 5TGM1 tumors (Online Supplementary Figure S5B). Together, this set of experiments supports that NOTCH3 integrates TME-mediated Notch signals in MM cells and confers chemoresistance/sensitivity to BOR-based therapies. Because we previously reported that NDMM patients with high NOTCH3 have a gene signature consistent with increased osteoclastogenic potential,9 we examined the impact of NOTCH3 activation on MM-induced bone disease. We found that NOTCH3OE MM tumors led to greater reductions in cancellous bone mass and higher levels of the bone resorption biomarker CTX compared to control tumors (Online Supplementary Figure S6A-C), but no differences were detected in the levels of the bone formation marker P1NP (Online Supplementary Figure S6D). BOR therapy improved cancellous bone mass and P1NP and reduced CTX in mice bearing control MM cells, but had no effect on NOTCH3OE MM-bearing mice. Consistent with increased MM osteoclastogenic potential, NOTCH3OE MM cells expressed higher mRNA levels of RANKL, which were further enhanced by co-culture with osteocytes or stromal cells (Online Supplementary Figure S6E).
NOTCH3 transcriptional reprogramming increases the expression of CXC chemokines in multiple myeloma cells
In order to determine the molecular mechanism(s) by which TME-mediated NOTCH3 signaling dictates responses to BOR-based therapies in MM cells, we compared the transcriptome of NDMM patients with high versus low NOTCH3
Figure 3. NOTCH3 integrates tumor micorenvironment-mediated signals dictating multiple myeloma cell responses to bortezomibbased therapies. (A) Multiple myeloma (MM) cells were co-cultured with osteocytes (Ots) and treated with bortezomib (BOR; 48 hours [h]) or dexamethasone + BOR + lenalidomide (VRd; 24 h). Percent apoptosis in scramble (Scr) or NOTCH3 knockdown (NOTCH3KD) 5TGM1 or U266 (B) MM cells, and in Scr or NOTCH3-activated (NOTCH3OE) OPM2 (C) MM cells co-cultured in the absence/presence of Ots and treated with/without BOR or VRd. N=4/group. *P<0.05 by two-way ANOVA, followed by a Tukey post hoc test. The dotted line represents the percent apoptosis in vehicle-treated Scr MM cells cultured alone. NS: non-significant. Data are shown as mean ± standard deviation; each dot represents an independent sample. Representative experiments out of 2 are shown. DiD: cell label dye; PI: propidium iodide.
expression (Online Supplementary Figure S7). We found enrichment in GO terms related to chemokine signaling, CXCR chemokine signaling, chemotaxis, and cell adhesion (Online Supplementary Figure S7A-C), and upregulation of cytokine-cytokine receptor interaction, chemokine signaling pathways, and cell adhesion molecules pathways in NDMM patients with high NOTCH3 expression (Figure 5A). Moreover, several members of the CXC chemokine family were upregulated in NDMM patients with high NOTCH3 (Online Supplementary Figure S7D). We focused on CXCL12 because it has been previously linked to cell adhesion-mediated drug resistance in MM.17,18 We found a strong positive correlation between CXCL12 and NOTCH3 expression in NDMM and PRMM patients (Figure 5B). Similar to NOTCH3, the expression of CXCL12 also increased in PRMM patients compared to levels at diagnosis (Figure 5C). Additionally, we mined a previously published single-cell RNA-sequencing data set of CD138+ plasma cells from PRMM patients19 and found co-localization of NOTCH3 and CXCL12 expression in a subset of CD138+ plasma cells from patients with primary refractory MM (Online Supplementary Figure S8). Based
on this clinical data, we hypothesized that TME-mediated NOTCH3 signaling increases CXCL12 expression in MM cells. Osteocytes increased the expression of CXCL12 in murine and human MM cells. This increase was prevented in NOTCH3KD cells and further increased in NOTCH3OE MM cells (Figure 5D-F). A similar regulation of CXCL12 by NOTCH3 was seen in co-cultures with stromal cells (Online Supplementary Figure S9). Together, these clinical and cellular data demonstrate that NOTCH3 signaling regulates CXCL12 expression in MM cells.
Autocrine CXCL12-CXCR4 signaling mediates NOTCH3induced chemoresistance in multiple myeloma cells Next, we investigated the contribution of CXCL12 to the NOTCH3-mediated acquired chemoresistance triggered by the TME. We found that TME osteocytes activated NOTCH3 signaling by cleaving NICD3, but not NICD1 or 2 (Online Supplementary Figure S10) and increased the phosphorylation of the CXCL12 receptor CXCR4 and the downstream targets ERK 1/2 and AKT in MM cells. These effects were fully prevented in NOTCH3KD and enhanced in NOTCH3OE MM cells
Figure 4. NOTCH3 activation in multiple myeloma cells promotes chemoresistance to bortezomib therapy. (A) Experimental design. Tumor progression and bortezomib (BOR)-induced tumor reduction (B) and probability of survival (C) in mice injected with scramble (Scr) or NOTCH3-activated (NOTCH3OE) OPM2 MM cells treated with/without BOR. N=6/11 mice/group. A two-way ANOVA test was used for (B, endpoint), followed by a Tukey post hoc test. Tumor reduction by BOR therapy by Student’s t test, *P<0.05 versus mice bearing Scr tumors treated with BOR. For (C), a log-rank (Mantel-Cox) test was performed. (D) Tumor reduction by BOR in ex vivo organ cultures of calvarial disc bones from KaLwRijHsd bearing murine 5TGM1 (E) or NSG mice bearing human U266 (F) Scr/NOTCH3 knockdown (NOTCH3KD) MM cells. N=4-8/group. *P<0.05 versus Scr MM cells treated with BOR by Student’s t test for each time point. NS: non-significant. wk: week. Boxes show the data interquartile range, the middle line in the box represents the median, and whiskers the 95% confidence interval of the mean (D, E, F).
(Figure 6A, B; Online Supplementary Figure S11), indicating that CXCL12-CXCR4 signaling in MM cells depends on NOTCH3 signals. In order to further explore the role of CXCL12-CXCR4 signaling on responses to BOR-based therapies, we first employed plerixafor, a selective inhibitor of CXCR4. Plerixafor fully restored sensitivity to BOR and VRd in NOTCH3OE MM cells co-cultured with osteocytes or stromal cells (Figure 6C, D; Online Supplementary Figure S12A). Because cells of the TME are thought to be an abundant source of CXCL12 in the MM-TME,20,21 we examined the specific contribution of MM-derived CXCL12 by silencing CXCL12 in NOTCH3OE MM cells (Online Supplementary Figure S12B). As seen with
plerixafor, genetic inhibition of CXCL12 in MM cells restored the anti-MM efficacy of BOR and VRd to control levels (Figure 6E; Online Supplementary Figure S12C). These data identify the existence of a novel autocrine NOTCH3-CXCL12-CXCR4 signaling axis promoted by the TME in MM cells.
Pharmacological inhibition of CXCL12-CXCR4 or Notch signaling increases bortezomib sensitivity in high NOTCH3 multiple myeloma cells
Prompted by our in vitro studies with plerixafor, we explored further the use of this agent in combination with BOR-based therapies using MM ex vivo 3D organ cultures
established with murine and human bone. As seen in vivo with BOR, VRd’s anti-MM efficacy was significantly reduced in murine bones bearing NOTCH3OE versus control MM cells (Figure 7A, B). Co-administration of plerixafor increased the sensitivity of NOTCH3OE MM cells to VRd. We also tested the effects of VRd + plerixafor in a novel human MM-hu-
man bone ex vivo system, which allowed us to study MM cell responses to chemotherapy in a TME closer to the one in patients (Figure 7C). MM cells engrafted human bones, and tumor growth was evident after 4 days (Figure 7C). NOTCH3OE MM cells exhibited resistance to VRd therapy compared to control MM cells, and co-administration of
Figure 5. Activation of NOTCH3 transcriptional reprogramming by the tumor microenvironment increases CXCL12 expression in multiple myeloma cells. Top 20 most significantly upregulated pathways (A) in newly diagnosed multiple myeloma (NDMM) patients with high versus low NOTCH3 expression. N=768 patients. (B) CXCL12 and NOTCH3 expression correlation in CD138+ cells from NDMM and progression/relapsed (PRMM) patients. N=70/group. For (B), Pearson’s correlation tests were performed. (C) Gene expression of CXCL12 in CD138+ cells from paired diagnosis and relapsed MM patients. N=70/group. *P<0.05 versus diagnosis by Student’s t test. Boxes show the data interquartile range, the middle line in the box represents the median, and whiskers the 95% confidence interval of the mean. CXCL12 gene expression in scramble (Scr)/NOTCH3 knockdown (NOTCH3KD) 5TGM1 (D) or U266 (E) MM cells and Scr/NOTCH3 activated (NOTCH3OE) OPM2 (F) MM cells cultured in the absence/presence of osteocytes (Ots). N=4/group. *P<0.05 by two-way ANOVA, followed by a Tukey post hoc test. NS: non-significant. Data are shown as mean ± standard deviation; each dot represents an independent sample; representative experiments out of 2 are shown (F).
plerixafor restored VRd’s anti-MM efficacy to control levels (Figure 7D). Lastly, we investigated if bone-targeted pan inhibition of Notch signals with a novel compound recently developed by our laboratory (BT-GSI)13 overcomes the chemoresistance conferred by NOTCH3 activation in MM cells. Using ex vivo cultures established with murine bone and Notch3OE MM cells, we found that co-administration of BT-GSI doubled the anti-MM efficacy of BOR (Figure 7E-F). Together, these studies highlight the potential of combining BOR-based therapies with CXCL12-CXCR4 or
Figure 6. NOTCH3-CXCL12-CXCR4 signaling mediates tumor microenvironment-induced chemoresistance in multiple myeloma cells. Effects of osteocytes (Ots) and manipulation of NOTCH3 signaling in MM cells on protein levels of activated NOTCH3 receptor (NICD3), phosphorylated (p) CXCR4, pERK, pAKT in (A) scramble (Scr)/NOTCH3 knockdown (NOTCH3KD) 5TGM1 MM cells and (B) Scr/NOTCH3-activated (NOTCH3OE) OPM2 MM cells. Representative images from 3 independent experiments are shown (see Online Supplementary Figure S11). (C) Experimental design. (D) Percent apoptosis of OPM2 NOTCH3OE MM cells treated with/ without plerixafor, bortezomib (BOR), or dexamethasone + BOR + lenalidomide (VRd) in the absence/presence of Ots. N=4/group; BOR=48 hours (h), VRd=24h. (E) Percent apoptosis of OPM2 NOTCH3OE MM cells with/without CXCL12 silencing and treated with BOR or VRd in the absence/presence of Ots. *P<0.05 by two-way ANOVA, followed by a Tukey post hoc test. The dotted line represents the percent apoptosis in vehicle-treated OPM2 NOTCH3OE MM cells cultured alone. NS: non-significant. DiD: cell label dye. siRNA: small interference RNA. Data are shown as mean ± standard deviation; each dot represents an independent sample; representative experiments out of 2 are shown.
bone-targeted Notch inhibitors to overcome TME-mediated drug resistance.
Discussion
Chemotherapy resistance is the leading cause of relapsed/ refractory disease, decreased survival, and a major obstacle to more successful clinical outcomes in MM. In this study, we demonstrate that a signaling pathway involving NOTCH3 activation by the extrinsic TME in MM cells promotes resistance to BOR therapeutic regimes. Our data highlight that this pathway is present in NDMM patients, upregulated in PRMM patients, and predicts worse clinical responses to BOR-based chemotherapy. Further, genetic
Figure 7. Pharmacological inhibition of CXCL12-CXCR4 or Notch signaling enhances therapeutic responses to bortezomib-based therapy in NOTCH3-activated multiple myeloma cells. (A) Ex vivo bone-multiple myeloma (MM) organ cultures established with scramble (Scr)/ NOTCH3-activated (NOTCH3OE) OPM2 human MM cells and calvarial disc bones from NSG mice. (B) Percent tumor reduction by co-administration of dexamethasone + bortezomib (BOR) + lenalidomide (VRd) and plerixafor. N=6/group. *P<0.05 versus bones bearing Scr MM cells treated with VRd alone for 11 days by one-way ANOVA, followed by a Tukey post hoc test. (C) Ex vivo bone-MM organ cultures established with Scr/NOTCH3OE OPM2 human MM cells and femoral head bone fragments from healthy human donors. Representative bioluminescence images of human bones showing engraftment and growth of human MM cells through the length of the experiment. (D) Percent tumor reduction by co-administration of VRd and plerixafor. N=6/group. *P<0.05 by two-way ANOVA, followed by a Tukey post hoc test. (E) Ex vivo bone-MM organ cultures established with NOTCH3OE OPM2 human MM cells and calvarial disc bones from NSG mice. (F) Percent tumor reduction by co-administration of BOR and bone-targeted γ-secretase inhibitor (BT-GSI) after 4 and 11 days. N=6/group. *P<0.05 versus bones bearing NOTCH3OE MM cells treated with BOR alone by one-way ANOVA, followed by a Tukey post hoc test. NS: non-significant. Boxes show the interquartile range, the middle line in the box represents the median, and whiskers the 95% confidence interval of the mean. d: day.
activation of NOTCH3 in MM cells is sufficient to promote resistance to BOR therapies. Conversely, we show that genetic or pharmacologic interruption of NOTCH3 signals in MM cells increases sensitivity to BOR and decreases tumor burden. Our clinical and preclinical data position NOTCH3 inhibition as a rational target to improve clinical responses to first-line regimes based on BOR in MM patients. Osteocytes are best known for their role in bone remodeling, where they function as paracrine and endocrine cells controlling the activity of bone cells in the bone marrow and distant organs.10 Work from our group and others uncovered that osteocytes are also important components of the TME, capable of directly interacting with tumor cells, and have a pivotal role in tumor growth and cancer-induced bone disease.22-24 Yet, the role of osteocytes in chemoresistance
has not been explored until now. Our studies extend beyond previous work on stromal cell-mediated mechanisms of resistance3,4,8 and identify the osteocyte as a new cell type of the TME contributing to resistance to chemotherapy via Notch communication. Along the same lines, another recent study reported that osteocytes can confer MM resistance to chemotherapy via exosomes.25 Because osteocytes are 95% of the cells in bone and, as stromal cells, can live for decades, these two cell types represent a major and long-lasting source of pro-survival signals for MM cells in MM. Future studies are needed to characterize further the contextual microenvironments and disease stages where these cell types preferentially operate. It has been long appreciated that Notch signaling mediates communication between MM cells and other cells of the TME, supports tumor growth and bone destruction, and contributes to drug resistance and survival;5,26 furthermore, functional studies have suggested that inhibiting Notch activation downstream all NOTCH receptors with γ-secretase inhibitors (GSI) decreases tumor burden, bone disease, and improves sensitivity to chemotherapeutic agents.6,27 Although the evidence for the influence of NOTCH signals in MM progression is strong, the specific contribution of individual NOTCH components is less clear. Notably, our paper uncovers that the basal expression of NOTCH3 is dynamic and selectively upregulated by TME cells and describes a previously unknown role for NOTCH3 in MM chemoresistance. Previous in vitro studies suggested that NOTCH1 and 2 are the main mediators of stroma-MM communication.28,29 In contrast, our prior work showed that osteocytes preferentially employ NOTCH3 to communicate with MM cells.9 Although we cannot exclude the contribution of other NOTCH receptors to TME-mediated chemoresistance, this study suggests that NOTCH3 activation is a common molecular mechanism that TME cells utilize to communicate with MM cells and plays a pivotal role in promoting drug resistance. We reported before that homotypic NOTCH3 signaling mediates MM cell proliferation but does not affect MM cell viability.9 Consistent with this observation, homotypic NOTCH3 signaling (between MM cells) did not affect MM cell apoptotic responses to BOR or VRd, underlining their dependence on TME-derived Notch ligands for chemoprotection. Further studies beyond the scope of the current manuscript are granted to identify the TME Notch ligand(s) responsible for the activation of NOTCH3 and chemoresistance in MM cells.
We noted fascinating differences in the transcriptome of NDMM that are mechanistically dependent on NOTCH3 and lead to a gene signature predictive of poor clinical outcomes. Our data show that NOTCH3 integrates signals from cells of the TME to increase CXCL12 expression in MM cells and provide evidence of NOTCH3-CXCL12 co-expression in CD138+ plasma cells from patients. Previous in vitro observations showed that inhibition of all NOTCH receptors with GSI decreases CXCL12 production in MM cells.30 Our
findings are consistent with this study and support that NOTCH3 is a major molecular regulator of CXCL12. Although stroma-derived CXCL12/CXCR4 is a well-established symbiotic bridge linking MM cells and their stromal neighbors in oncogenic communication/drug resistance,8,17,18,20,21,32 this report is one of the first indications suggesting the existence of an active autocrine CXCL12-CXCR4 signaling axis in MM cells promoted by the TME. We show that interruption of NOTCH3 signals by inhibiting NOTCH3 cleavage at the membrane level (BT-GSI) or suppressing CXCL12 expression (small interfering RNA) or signaling through CXCR4 (plerixafor) led to comparable prevention of TME-induced BOR resistance in MM cells. Remarkably, we validated these observations in human ex vivo models, which showed that bones infiltrated with NOTCH3-activated MM cells have worse responses to VRd and, importantly, a robust reduction in tumor burden after co-administration of VRd and plerixafor. Therefore, human (and murine) ex vivo organ cultures represent a powerful tool to model responses to chemotherapy in a physiologically relevant environment. Collectively, these findings support that NOTCH3 is activated in MM cells by the TME in specialized niches, resulting in a transcriptional response downstream of CXCL12 binding to CXCR4, which leads to chemoresistance.
In addition to its role in drug resistance, we confirmed that NOTCH3 signaling in MM cells exerts bone catabolic actions. We showed before that inhibition of NOTCH3 in MM cells reduces MM-induced bone disease.9 Conversely, we found that mice-bearing MM cells with activated NOTCH3 exhibited worse bone destruction in this study. Two potential mechanisms, not mutually exclusive, may account for this observation. One, NOTCH3 activation by TME cells increases in MM cells the expression of RANKL, a pro-osteoclastogenic cytokine with a key role in the development of bone disease in MM patients.33,34 Second, TME-derived signals integrated by NOTCH3 stimulate the proliferation of MM cells and lead to greater tumors and, therefore, more bone disease. Our studies did not address the contribution of each potential mechanism, as both occur simultaneously in our model.
These findings have important clinical implications. Our results suggest the potential added value of NOTCH3 expression in MM treatment decision-making for NDMM and PRMM patients. Further validation of the impact of NOTCH3 expression in other cohorts is needed to strengthen this argument, which we acknowledge as a limitation of our study. In addition, these findings raise the possibility that NOTCH3 might be a useful target for MM patients. Anti-NOTCH3 antibodies have shown efficacy against solid tumors35-37 but have not yet been evaluated in MM models. Further, our data suggest the potential of a therapy targeting NOTCH3 to simultaneously decrease tumor growth, improve responses to BOR regimes, and stop bone destruction, as pharmacological inhibition of NOTCH3 in vivo is sufficient to decrease bone resorption in naïve mice.37
Of note, NOTCH3 antibodies do not exhibit dose-limiting side effects37 seen with pan-inhibition of Notch signaling in humans and mice.13,38 Similarly, our novel bone-targeted GSI inhibitor shows great potential to overcome drug resistance mediated by NOTCH3, and other NOTCH receptors, while circumventing toxicities. Lastly, our work provides a cellular and molecular rationale to combine BOR regimes with plerixafor as a chemosensitization strategy in MM patients, a strategy proven successful recently in a small clinical trial (clinicaltrials gov. Identifier: NCT00903968).39 A better understanding of the cellular and molecular events leading to disease progression/relapse in MM is needed to bypass drug resistance. This study unravels a crucial role of NOTCH3 as a mediator of TME-mediated chemoresistance in MM. Complementary clinical and preclinical data and pharmacologic and genetic approaches in human and mouse systems support this conclusion. Further, we identified a previously unknown function of osteocytes as providers of Notch signals in the TME conducive to resistance to chemotherapy. Lastly, we demonstrate the beneficial effects of targeting NOTCH3 and its downstream signals to restore sensitivity to BOR-based therapies in MM cells. In summary, our findings support using existing and novel pharmacologic tools to interfere with NOTCH3 signals to overcome drug resistance and improve bone health in MM.
Disclosures
No conflicts of interest to disclose.
Contributions
JDC conceived and supervised the project. HMS, CA, CS, and JDC designed the experiments. HMS, CA, MA, AA, JK, SK, SRC, MP, CLB, IN, and EA performed the experiments and/
References
1. Rajkumar SV, Kumar S. Multiple myeloma current treatment algorithms. Blood Cancer J. 2020;10(9):94.
2. Maiso P, Mogollón P, Ocio EM, Garayoa M. Bone marrow mesenchymal stromal cells in multiple myeloma: their role as active contributors to myeloma progression. Cancers (Basel). 2021;13(11):2542.
3. Ria R, Vacca A. Bone marrow stromal cells-induced drug resistance in multiple myeloma. Int J Mol Sci. 2020;21(2):613.
4 Nefedova Y, Landowski TH, Dalton WS. Bone marrow stromalderived soluble factors and direct cell contact contribute to de novo drug resistance of myeloma cells by distinct mechanisms. Leukemia. 2003;17(6):1175-1182.
5. Colombo M, Galletti S, Garavelli S, et al. Notch signaling deregulation in multiple myeloma: a rational molecular target. Oncotarget. 2015;6(29):26826-26840.
6. Nefedova Y, Sullivan DM, Bolick SC, Dalton WS, Gabrilovich DI. Inhibition of Notch signaling induces apoptosis of myeloma cells and enhances sensitivity to chemotherapy. Blood. 2008;111(4):2220-2229.
or collected data. HMS, CA, IN, and JDC contributed to the data analysis and interpretation. JDC and HMS wrote the manuscript. All authors reviewed the manuscript.
Acknowledgments
The authors would like to acknowledge the services provided by the TBAPS of the UAMS Winthrop P. Rockefeller Cancer Institute and the MMRF for providing the CoMMpass IA15 dataset. These data were generated as part of the Multiple Myeloma Research Foundation Personalized Medicine Initiatives (https://research.themmrf.org and www.themmrf.org). The authors thank Dr. Onal for her assistance with CRISPR NOTCH3 activation and sgRNA design.
Funding
This work was supported by the National Institutes of Health (NIH) R37CA251763, R01CA209882, R01CA241677 (to JDC), P20GM125503 (to JDC and IN), and F31CA284655 (to HMS), the UAMS Musculoskeletal Hub Award (to JDC and IN), the UAMS Translational Research Institute (TRI), grant KL2 TR003108 through the National Center for Advancing Translational Sciences of the NIH (to CA), and the UAMS Winthrop P. Rockefeller Cancer Institute Seeds of Science Award and Voucher Program awarded (to JDC).
Data-sharing statement
The IA15 datasets used for the analyses described in this work were downloaded from the Multiple Myeloma Research Foundation CoMMpass (MMRF CoMMpass [SM] [Relating Clinical Outcomes in MM to Personal Assessment of Genetic Profile] study [www.themmrf.org]) researcher gateway. Other non-public datasets used and analyzed during the current study are available from the corresponding author upon reasonable request.
7 Wang Z, Li Y, Ahmad A, et al. Targeting Notch signaling pathway to overcome drug resistance for cancer therapy. Biochim Biophys Acta. 2010;1806(2):258-267.
8. Colombo M, Garavelli S, Mazzola M, et al. Multiple myeloma exploits Jagged1 and Jagged2 to promote intrinsic and bone marrow-dependent drug resistance. Haematologica. 2020;105(7):1925-1936.
9. Sabol HM, Amorim T, Ashby C, et al. Notch3 signaling between myeloma cells and osteocytes in the tumor niche promotes tumor growth and bone destruction. Neoplasia. 2022;28:100785.
10 Delgado-Calle J, Bellido T. The osteocyte as a signaling cell. Physiol Rev. 2022;102(1):379-410.
11. Choudhury SR, Ashby C, Tytarenko R, et al. The functional epigenetic landscape of aberrant gene expression in molecular subgroups of newly diagnosed multiple myeloma. J Hematol Oncol. 2020;13(1):108.
12. Delgado-Calle J, Anderson J, Cregor MD, et al. Bidirectional Notch signaling and osteocyte-derived factors in the bone
marrow microenvironment promote tumor cell proliferation and bone destruction in multiple myeloma. Cancer Res. 2016;76(5):1089-1100.
13. Sabol HM, Ferrari AJ, Adhikari M, et al. Targeting Notch inhibitors to the myeloma bone marrow niche decreases tumor growth and bone destruction without gut toxicity. Cancer Res. 2021;81(19):5102-5114.
14 Delgado-Calle J, Anderson J, Cregor MD, et al. Genetic deletion of Sost or pharmacological inhibition of sclerostin prevent multiple myeloma-induced bone disease without affecting tumor growth. Leukemia. 2017;31(12):2686-2694.
15. Mulligan G, Mitsiades C, Bryant B, et al. Gene expression profiling and correlation with outcome in clinical trials of the proteasome inhibitor bortezomib. Blood. 2007;109(8):3177-3188.
16. Bellido T, Delgado-Calle J. Ex vivo organ cultures as models to study bone biology. JBMR Plus. 2020;4(3):10.
17 Waldschmidt JM, Simon A, Wider D, et al. CXCL12 and CXCR7 are relevant targets to reverse cell adhesion-mediated drug resistance in multiple myeloma. Br J Haematol. 2017;179(1):36-49.
18. Bouyssou JM, Ghobrial IM, Roccaro AM. Targeting SDF-1 in multiple myeloma tumor microenvironment. Cancer Lett. 2016;380(1):315-318.
19. Cohen YC, Zada M, Wang SY, et al. Identification of resistance pathways and therapeutic targets in relapsed multiple myeloma patients through single-cell sequencing. Nat Med. 2021;27(3):491-503.
20 Ullah TR. The role of CXCR4 in multiple myeloma: cells’ journey from bone marrow to beyond. J Bone Oncol. 2019;17:100253.
21. Ren Z, Lantermans H, Kuil A, et al. The CXCL12gamma chemokine immobilized by heparan sulfate on stromal niche cells controls adhesion and mediates drug resistance in multiple myeloma. J Hematol Oncol. 2021;14(1):11.
22. Anloague A, Delgado-Calle J. Osteocytes: new kids on the block for cancer in bone therapy. Cancers (Basel). 2023;15(9):2645.
23. Atkinson EG, Delgado-Calle J. The emerging role of osteocytes in cancer in bone. JBMR Plus. 2019;3(3):e10186.
24. Pin F, Prideaux M, Bonewald LF, Bonetto A. Osteocytes and cancer. Curr Osteoporos Rep. 2021;19(6):616-625.
25. Cheng F, Wang Z, You G, Liu Y, He J, Yang J. Osteocyte-derived exosomes confer multiple myeloma resistance to chemotherapy through acquisition of cancer stem cell-like features. Leukemia. 2023;37(6):1392-1396.
26. Fairfield H, Falank C, Avery L, Reagan MR. Multiple myeloma in the marrow: pathogenesis and treatments. Ann N Y Acad Sci. 2016;1364(1):32-51.
27. Colombo M, Platonova N, Giannandrea D, Palano MT, Basile A, Chiaramonte R. Re-establishing apoptosis competence in bone associated cancers via communicative reprogramming induced through Notch signaling inhibition. Front Pharmacol. 2019;10:145.
28. Nefedova Y, Cheng P, Alsina M, Dalton WS, Gabrilovich DI. Involvement of Notch-1 signaling in bone marrow stromamediated de novo drug resistance of myeloma and other malignant lymphoid cell lines. Blood. 2004;103(9):3503-3510.
29 Muguruma Y, Yahata T, Warita T, et al. Jagged1-induced Notch activation contributes to the acquisition of bortezomib resistance in myeloma cells. Blood Cancer J. 2017;7(12):650.
30 Mirandola L, Apicella L, Colombo M, et al. Anti-Notch treatment prevents multiple myeloma cells localization to the bone marrow via the chemokine system CXCR4/SDF-1. Leukemia. 2013;27(7):1558-1566.
31. Di Marzo L, Desantis V, Solimando AG, et al. Microenvironment drug resistance in multiple myeloma: emerging new players. Oncotarget. 2016;7(37):60698-60711.
32. Azab AK, Runnels JM, Pitsillides C, et al. CXCR4 inhibitor AMD3100 disrupts the interaction of multiple myeloma cells with the bone marrow microenvironment and enhances their sensitivity to therapy. Blood. 2009;113(18):4341-4351.
33. Raje N, Terpos E, Willenbacher W, et al. Denosumab versus zoledronic acid in bone disease treatment of newly diagnosed multiple myeloma: an international, double-blind, doubledummy, randomised, controlled, phase 3 study. Lancet Oncol. 2018;19(3):370-381.
34 Silbermann R, Roodman GD. Myeloma bone disease: pathophysiology and management. J Bone Oncol. 2013;2(2):59-69.
35. Varga J, Nicolas A, Petrocelli V, et al. AKT-dependent NOTCH3 activation drives tumor progression in a model of mesenchymal colorectal cancer. J Exp Med. 2020;217(10):e201921515.
36. Choy L, Hagenbeek TJ, Solon M, et al. Constitutive NOTCH3 signaling promotes the growth of basal breast cancers. Cancer Res. 2017;77(6):1439-1452.
37. Yu J, Siebel CW, Schilling L, Canalis E. An antibody to Notch3 reverses the skeletal phenotype of lateral meningocele syndrome in male mice. J Cell Physiol. 2020;235(1):210-220.
38. Golde TE, Koo EH, Felsenstein KM, Osborne BA, Miele L. γ -Secretase inhibitors and modulators. Biochim Biophys Acta. 2013;1828(12):2898-2907.
39 Ghobrial IM, Liu CJ, Zavidij O, et al. Phase I/II trial of the CXCR4 inhibitor plerixafor in combination with bortezomib as a chemosensitization strategy in relapsed/refractory multiple myeloma. Am J Hematol. 2019;94(11):1244-1253.
Long-term outcomes and renal responses following autologous hematopoietic stem cell transplantation for light chain deposition disease: a retrospective study on behalf of the Chronic Malignancies Working Party of the European Society for Blood and Marrow Transplantation
Laurent Garderet,1 Luuk Gras, 2 Linda Koster, 3 Liesbeth de Wreede,4 Rovira Montserrat, 5 Laure Vincent,6 Roland Fenk,7 Kamaraj Karunanithi, 8 Dries Deeren, 9 Martin Kaufmann,10 Jürgen Kuball,11 Hakan Ozdogu,12 Maria Jesus Pascual Cascon,13 Jakob Passweg,14 Adam Rye,15 Urpu Salmenniemi,16 John Snowden,17 Charlotte Toftmann Hansen,18 Xavier Leleu,19 Lauris Gastaud, 20 Joanna Drozd-Sokolowska, 21 Kavita Raj, 22 Meral Beksac, 23 Stefan Schönland, 24 Patrick Hayden 25 and Donal McLornan 22
1Sorbonne University, APHP, Hôpital Pitié Salpêtrière, Service d’Hématologie, Paris, France; 2EBMT Statistical Unit, Leiden, the Netherlands; 3EBMT Leiden Study Unit, Leiden, the Netherlands; 4Department of Biomedical Data Sciences, Leiden University Medical Center, Leiden, the Netherlands; 5Hospital Clinic, Barcelona, Spain; 6Clinical Hematology, Montpellier University Hospital Center, Montpellier, France; 7Department of Hematology, Oncology and Clinical Immunology, University Hospital Duesseldorf, Düsseldorf, Germany; 8University Hospital of North Staffordshire, Stoke, UK; 9AZ Delta, Roeselare, Belgium; 10Robert Bosch Krankenhaus, Stuttgart, Germany; 11Department of Hematology, University Medical Center Utrecht, Utrecht, the Netherlands; 12Department of Hematology, Baskent University Hospital, Adana, Turkey; 13Hospital Regional de Málaga, Malaga, Spain; 14University Hospital Basel, Basel, Switzerland; 15Gloucestershire Hospitals NHS Foundation Trust, Cheltenham, UK; 16HUCH Comprehensive Cancer Center, Stem Cell Transplantation Unit - Helsinki, Finland; 17Sheffield Teaching Hospitals NHS Foundation Trust, Sheffield, UK; 18Department of Hematology, Odense University Hospital, Odense, Denmark; 19CHU Poitiers, Poitiers, France; 20Centre Antoine Lacassagne, Tourrettes-surLoup, France; 21Central Clinical Hospital, The Medical University of Warsaw, Warsaw, Poland; 22University College London Hospitals NHS Trust, London, UK; 23Ankara University School of Medicine, Hematology Department, Ankara, Turkey; 24University Hospital Heidelberg, Heidelberg, Germany and 25Department of Hematology, Trinity College Dublin, St. James’s Hospital, Dublin, Ireland
Abstract
Correspondence: L. Garderet laurent.garderet@aphp.fr
Received: October 22, 2023. Accepted: March 20, 2024. Early view: March 28, 2024.
There is little long-term outcome data on the efficacy of autologous hematopoietic stem cell transplantation (ASCT) in light chain deposition disease (LCDD). We identified 51 LCDD patients in the European Society for Blood and Bone Marrow transplantation registry who had undergone upfront ASCT between 1995 and 2021. The median serum creatinine was 280 µmol/L and 45% required renal replacement therapy (RRT) at time of transplant. The melphalan dose was 100 mg/m2 in 23%, 140 mg/m2 in 55% and 200 mg/m2 in 21%. The rate of very good partial response or better improved from 41% pretransplant to 66% at day +100 postASCT. In RRT-independent patients, there was a modest improvement in renal function within the first 3 months; the median estimated glomerular filtration rate increased from 44 to 51 mL/min/1.73 m2. There was no further change between 3 and 12 months post-ASCT. No patient who was RRT-independent at ASCT became RRT dependent by day + 100 post-ASCT. Median follow-up post-ASCT was 84 months (interquartile range [IQR]: 46-122). At 6-years post ASCT, overall survival was 88% (95% confidence interval [CI]: 78-98) and PFS was 44% (95% CI: 28-60). The 2-year cumulative incidence of relapse and non-relapse mortality was 17% (95% CI: 6-27) and 2% (95% CI: 0-6), respectively. The cumulative incidence of renal transplantation at 4 years
after ASCT was 27% (95% CI: 13-41) with renal transplantation performed between 6.3 and 52.9 months post-ASCT (median 24.7 months). ASCT represents a feasible option for LCDD patients even if RRT dependent at time of transplant. Outcomes are favorable with low non-relapse mortality and good long-term overall survival.
Introduction
Light chain deposition disease (LCDD) is a rare disease involving deposition of amorphous non-amyloid monoclonal immunoglobulin light chains (AL), most often k restricted, along basement membranes.1-3 It is frequently associated with plasma cell disorders such as multiple myeloma (MM) or other B-cell lymphoproliferative disorders though, sometimes no clonal B-lymphocytes/plasma cells can be identified. LCDD typically involves organs, the kidneys being the cardinal organ involved, but also rarely the heart, liver and peripheral nerves.1-7
Therapeutic approaches historically have been adapted from the treatment algorithm followed for MM. Both bortezomib and lenalidomide based regimens have shown encouraging results.8,9 High-dose melphalan followed by autologous stem cell transplantation (ASCT) has also shown favorable outcomes in few retrospective studies with a limited number of patients focusing on LCDD/heavy chain DD, demonstrating that hematological response along with some organ responses can be achieved.10-12 However, the role of ASCT remains, on occasion, controversial in this setting, especially as these patients quite frequently demonstrate marked renal impairment, sometimes requiring renal replacement therapy (RRT). Therefore, ASCT toxicity and morbidity in this setting can be a considerable challenge. Of note, successful reversal of renal failure with RRT independence has been previously reported following ASCT in some cases.13 We hereby report outcomes from a retrospective, multicentre, European Society for Blood and Bone Marrow Transplantation (EBMT) registry-based study of 51 adult patients with a confirmed diagnosis of LCDD who underwent ASCT, assessing toxicity and efficacy with regard to both hematological and renal responses.
Methods
Study design and patient selection
This was a retrospective, multicenter, registry-based analysis approved by the Chronic Malignancies Working Party of the EBMT. The EBMT is a non-profit, scientific society representing more than 600 transplant centers mainly in Europe. Data are entered, managed, and maintained in a central database with internet access. Each EBMT center is represented in this database. All centers commit to obtain informed consent according to the local regulations applicable at the time in order to report pseudonymized data to the EBMT. Newly diagnosed LCDD patients who underwent upfront
ASCT between 1995 and 2021 were selected from the EBMT database. In addition, we contacted 469 ASCT centers to ask whether any LCDD patients had received ASCT during this period. For patients thus identified, renal biopsy reports were requested from the centers. Submitted renal biopsy reports were checked and verified by two AL amyloidosis-specialized physicians. Inclusion criteria mandated a diagnosis of LCDD made after renal biopsy showing typical glomerular and tubular lesions by light microscopy, immunofluorescence and electron microscopy analysis. The presence of AL amyloidosis was an exclusion criterion as well as other MGRS.
Outcome
The primary endpoint of the study was the cumulative incidence of non-relapse mortality (NRM). Secondary endpoints were overall survival (OS), progression-free survival (PFS) and cumulative relapse incidence (RI), neutrophil and platelet engraftment, renal transplantation, hematological and renal response.
Engraftment
Time to neutrophil engraftment was defined as the first of 3 consecutive days with a neutrophil count >0.5×10⁹/L and time to platelet engraftment the first of 3 consecutive days with an unsupported platelet count >20×109/L. The use of growth factor was allowed.
Disease response to treatment was defined according to the new criteria for response to treatment in AL amyloidosis based on free light chain measurement.14,15
Evaluation of renal function
Renal function was assessed by serum creatinine level and estimated glomerular filtration rate (eGFR) calculated using the CKD-EPI (Chronic Kidney Disease Epidemiology Collaboration) equation. Renal response was based on the criteria proposed by the International Myeloma Working group.16 We did not use the amyloid renal response criteria based on proteinuria.
Outcome after autologous stem cell transplantation
OS was considered to be the time from ASCT to death from any cause, and PFS was the time from ASCT until disease relapse/progression or death, whichever occurred first. NRM was defined as death post-ASCT without relapse/ progression.
Statistical analysis
Quantitative data were described by median, interquartile ranges (IQR). Qualitative data were presented by their frequency and proportion, calculated among subjects with no missing values for the corresponding variable. The median follow-up was calculated using the reverse Kaplan-Meier estimator.17 Both time to neutrophil and time to platelet engraftment were analyzed using the crude cumulative incidence estimator with death as a competing event. OS and PFS were estimated with the Kaplan-Meier method, and cumulative incidence of relapse (CIR) and NRM were estimated using the crude cumulative incidence function to account for the competing event. In order to test for differences between groups the log-rank test was used for OS and PFS and Gray’s test was used for RI and NRM. A multistate model was used to give an overview of the probability of events or states after ASCT. We used a non-parametric time inhomogenous Markov model stratified for RRT status at ASCT.17 All analyses were performed in R version 4.2.2 using ‘survival’, ‘cmprsk’ and ‘prodlim’, ‘mstate’18 and ‘lme4’ packages.19
More details are available in the Online Supplementary Appendix.
Results
Baseline patient characteristics at diagnosis
One hundred and thirty-five patients with a registered LCDD diagnosis and an ASCT during 1995-2021 were identified in the EBMT database and renal biopsy reports for these patients were requested. In addition, 469 centers were asked to send renal biopsy reports of any patient with a LCDD diagnosis and an ASCT during this period. Renal biopsy reports were thus received for 63 patients. After checking the reports, a total of 51 patients with a verified LCDD diagnosis from 24 EBMT-registered centers were included in the study (Table 1). For 40 patients additional data was acquired through the data questionnaire. Sixty-three percent were male and the median year of diagnosis was 2011 (IQR, 2009-2016). The underlying plasma cell disorder was MM (62%), smoldering myeloma (8%) and monoclonal gammopathy of unknown significance (MGUS, 30%). Among 38 patients with data available, 16% had evidence of bone lesions. Median bone marrow aspirate plasma cell burden was 10% (IQR, 7.8-20) and serologic immunoglobulin (Ig) isotype (available in 44 patients, 86%) was IgG in 25%, IgA in 2.5%, light chain in 70%, and IgD in 2.5%. Light chain distribution (available in 44 patients, 86%) was k in 82%, and l in 18%. Median k and l light chain serum concentration were 575 mg/L (IQR, 1461,095) and 20.4 mg/L (IQR, 11.7-43.5), respectively. Among the 17 patients with cytogenetics available, three patients had a translocation t (11;14) and 1 a deletion of 17p. Among the 40 patients with available data on disease involvement, three patients additionally demonstrated cardiac involvement and
two patients hepatic involvement. At diagnosis, median serum creatinine was 233 μmol/L (IQR, 159-467) and the median level of proteinuria was 1,813 mg/24 hours (IQR, 445-5,974). The renal histology was: glomerulosclerosis in 39 patients (76%) with a glomerular involvement ≤50% in 22 (88%) and >50% in three (12%) (quantification available in 25 patients), tubular atrophy in 36 patients (71%) with ≤50% involvement in 12 (63%) and >50% in seven (37%) (quantification available in 19 patients) and interstitial fibrosis in 41 patients (80%) with ≤50% involvement in 18 (69%) and >50% in eight (31%) (quantification available in 26 patients). No crescentic glomerulonephritis was mentioned.
Induction regimen
Among the 44 patients with data available, 42 patients (95%) received an induction regimen prior to ASCT (in 89% bortezomib-based). Induction regimens (available for 41 patients) comprised of: bortezomib and dexamethasone, N=19; bortezomib, thalidomide and dexamethasone, N=5; bortezomib, lenalidomide and dexamethasone, N=6; bortezomib, adriamycin and dexamethasone, N=4; daratumumab and bortezomib-thalidomide-dexamethasone, N=2; bortezomib cyclophosphamide and dexamethasone, N=1; cyclophosphamide, thalidomide dexamethasone, N=1; vincristine, adriamycin and dexamethasone, N=1; bortezomib, melphalan and dexamethasone, N=1; and dexamethasone alone, N=1. A total of four patients had two lines of induction treatment.
Stem cell collection
Stem cell mobilization regimen detail was available in 42 patients (82%). This comprised of granulocyte colony-stimulating factor (G-CSF) in 26 (62%), granulocyte macrophage-CSF (GM-CSF) in two (5%), G-CSF + plerixafor in two (5%), plerixafor alone in one (2%) and cyclophosphamide based in 11 (26%) patients. The number of days of apheresis for collection was 1 in 41 (93%) cases, one patient had two courses of mobilization (each mobilize with G-CSF alone).
Patient characteristics at transplant
Median age at transplant was 55 years (IQR, 49-61) with a median time from diagnosis to transplant of 7.4 months (IQR, 5.5-13.0). Karnofsky performance status was >80 in 79% of the patients; 59% of patients underwent ASCT in 2012 or later. Data on RRT status was available in 38 patients (75%). A total of 17 patients (45%) were undergoing RRT at time of ASCT. Hematological response at ASCT was as follows: complete reponsee (CR) in six patients (12%), very good partial response (VGPR) in 15 (29%), partial response (PR) in 16 (31%), stable disease (SD) in eight (16%), relapse/progression in three (6%), and three patients were not treated prior to ASCT (6%).
Transplant characteristics, engraftment and consolidation/maintenance
Melphalan conditioning dose (available in 47 patients, 92%)
Table 1. Characteristics of the study population at diagnosis and at transplantation (N=51).
Characteristics at diagnosis
Male sex, N (%)
Underlying plasma cell disorder, missing N=14, 27%, N (%) Myeloma
Smoldering myeloma
RRT-dependant, missing N=11, 22%, N (%)
Lytic bone lesions, missing N=13, 25%, N (%)
Bone marrow plasmacytosis %, missing N=11, 22%, median (IQR)
Patients with bone marrow plasmocytosis ≥10%, N (%)
Patients with bone marrow plasmocytosis ≥60%, N (%)
Monoclonal protein isotype, missing N=7, 14%, N (%)
IgG
IgA
International Staging System, missing N=38, 75%, N (%)
(63)
(62)
(8)
(30)
(47)
(11)
(5)
(45) 1 (2)
(70) 1 (2.5)
I II III 1(7) 4 (31) 8 (62)
Serum light chain mg/L
k, missing N=16, 31%, median (IQR)
l, missing N=17, 33%, median (IQR)
Involved/uninvolved FLC ratio, missing N=17, 33%, median (IQR)
575 (146-1,095) 20 (12-44)
FLC ratio >100, missing N=17, 33%, N (%) 21 (2.9-83.3) 6 (18)
Serum creatinine μmol/L, missing N=10, 20%, median (IQR)
Proteinuria (mg/24 hours), missing N=21, 41%, median (IQR)
233 (159-467)
1,813 (445-5,974)
Characteristics at transplant Values
Pretransplant induction, missing N=7, 14%, N (%)
No therapy
Bortezomib-based therapy
Cyclophosphamide-based therapy
VAD
Dexamethasone alone
Age in years, median (IQR)
Serum creatinine μmol/L, missing N=11, 22%, median (IQR)
Proteinuria (mg/24 hours), missing N=31, 61%, median (IQR)
RRT dependant, missing N=12, 26%, N (%)
Yes
No
2 (5)
39 (89) 1 (2) 1 (2) 1 (2)
55 (49-61)
280 (146-510)
569 (178-1,961)
17 (45)
22 (55)
Time in months from diagnosis to transplant, median (range) 7 (6-13)
Karnofsky score, missing N=9, 18%, N (%)
> 80
≤ 80
33 (79) 9 (21)
IQR: interquartile range; MGUS: monoclonal gammopathy of unknown significance; RRT: renal replacement therapy; FLC: free light chain ratio, monoclonal protein isotype is defined by serologic immunofixation; VAD: vincristine adriamycine dexamethasone.
was 100 mg/m2 in 11 patients (23%), 140 mg/m2 in 26 patients (55%) and 200 mg/m2 in ten patients (21%). In patients on RRT: the melphalan conditioning dose was 200 mg/m2 in one, 140 mg/m2 in nine and 100 mg/m2 in seven, in patients not on RRT: 200 mg/m2 in seven, 140 mg/m2 in 11 and 100 mg/m2 in three (for 9 patients: unknown whether or not they were on RRT).
Median number of CD34+ cells x106/kg infused was 3.4 (IQR, 2.5-4.6) and 13 (33%) received GCSF post ASCT. The median time to neutrophil engraftment was 12 days (IQR, 11-13) and median time to platelet engraftment was 13 days (IQR, 1116). Out of a total of 39 patients (76%) with data available, five patients (13%) had received post-ASCT consolidation. Consolidation comprised bortezomib-based regimens (N=4) or pomalidomide plus dexamethasone plus daratumumab (N=1). Three patients (8%) had maintenance treatment postASCT out of a total of 37 with data available (73%).
Hematological response at day +100 post-autologous stem cell transplantation
The best hematological response at day +100 post-ASCT (available in 39 patients, 76%) was as follows: CR: 17 (43.6%), VGPR: nine (23.1%) and PR: ten (33.3%) and three patients who had progressed at day +100 (missing 12 [23.5%]). Response improvement from pre-ASCT to day +100 post-ASCT is shown in Table 2.
Renal outcome
From the time of LCDD diagnosis to ASCT, among the 51 patients, 33 patients were assessable (11 patients did not have data on RRT status, 6 patients were not assessable because the eGFR at diagnosis was >50 mL/min and in 1 case the eGFR was missing at diagnosis). Among these 33 assessable patients: 21 patients were on dialysis at some point from diagnosis, one patient reached a partial renal response (PRenal), one patient a minimal renal response (MRenal), one patient progressed and nine patients had no response. Concerning patients on dialysis: 21 patients were on dialysis at some time point between diagnosis and ASCT (11 unknown), 17 at time of ASCT and 16 after ASCT (1 patient went off dialysis 14 months after ASCT). These numbers do not take into account patients who proceeded to renal transplantation. There was no change in RRT status at day +100 in either the 17 RRT-dependent or 21 independent patients. Figure 1A shows eGFR at ASCT, and at +3, +6 and +12 months among 37 patients with known RRT status and eGFR data available. In patients with measurements at both time points, the mean eGFR improved slightly within the first 3 months post-ASCT in patients not on RRT at ASCT with the mean eGFR increasing from 52 at ASCT to 57 mL/min/1.73 m2 (paired t test, P=0.19). The eGFR evolution for each individual patient is shown in Figure 1B as well as the mean eGFR between ASCT and 1 year post-ASCT for patients not on RRT as estimated using the linear mixed effects model including 126 eGFR measurements obtained from 37 patients. Estimated mean eGFR at ASCT was 50.7
mL/min/1.73m2 (95% CI: 39.4-62.1) in those not on RRT. There was no significant changes in eGFR after ASCT (test whether slope is different from 0; P=0.64,). Altogether, three of 27 evaluable patients (11%) improved their renal function according to IMWG criteria (Table 3). Of 40 patients with data available on renal transplantation status, the cumulative incidence of renal transplantation at 4 years after ASCT was 27% (95% CI: 13-41). Renal transplantations were performed between 6.3 and 52.9 months post-ASCT with a median of 24.7 months. One patient who was on RRT at the time of transplant got off dialysis 14 months after the transplant (without renal transplantation).
Survival, relapse incidence and non-relapse mortality
Median follow-up time after ASCT was 84 months (IQR, 46-122). Outcomes after ASCT are shown in Figure 2 for all patients. The 100-day and the 2-year cumulative incidence of NRM was 2% (95% CI: 0-6). At 6 years post-ASCT, OS was 88% (95% CI: 78-98) and PFS was 44% (95% CI: 28-60). Median OS was not reached (NR), median PFS was 65 months (95% CI: 45-103; IQR, 27.9-NR) and 2-year cumulative RI was 17% (95% CI: 6-27). Nine patients died during the follow-up: six (67%) of relapse/progression, two (22%) infection and one (11%) organ damage/failure. The only patient who died before relapse/progression had multiple organ failure (including renal) at day 9.
In univariable analyses, RRT status at ASCT was not signifi-
Table 2. Hematological responses between autologous stem cell transplantation and day 100 following autologous stem cell transplantation in 39 patients.
Response, N (%)
treated - VGPR
- PR
- PR
- CR
- VGPR
- CR
For 12 (23%) of the total 51 patients no day 100 response data was available, hence only the data of 39 patients is shown. Percentages shown are calculated as the percentage of all patients with an evaluable response at day 100. Responses were assessed according to criteria for response to treatment in immunoglobulin light chain amyloidosis.14 CR: complete response; VGPR: very good partial response; PR: partial response; SD: stable disease.
cantly associated with OS and PFS (Online Supplementary Figure S1). Undergoing ASCT in or after the year 2012 was associated (log-rank P=0.05) with a better OS (6-year OS: 100% vs. 75%), women (log-rank P=0.05) tended towards a better OS (6-year OS: 100% vs. 82%). Karnofsky performance status, age and status of disease at ASCT (VGPR or better vs. other) did not have a significant association with any outcome measure in this small cohort.
Status post autologous stem cell transplanatation
Figure 3 shows the probability of being in different stages of renal and hematological disease post-ASCT for patients on RRT (Figure 3A) and patients not on RRT at ASCT (Figure 3B). All patients started as being event-free, and could subsequently move to either having had a hematological relapse or progression, having had a renal transplantation, a combination of these two events or death. At 4 years post-ASCT the probability for a patient on dialysis at ASCT to be event-free was 24% (95% CI: 11-54), to have had a renal transplantation (possibly after of followed by hematological relapse) was 58% (95% CI: 39-85), to be in a state of hematological relapse was 22% (95% CI: 10-52) and to have died was 6% (95% CI: 1-27). For patients who were not on RRT at ASCT these 4-year estimates were 54% (95% CI: 37-78), 11% (95% CI: 3-43), 35% (95% CI: 17-73) and 4% (95% CI: 0-37) respectively.
Discussion
This is the first international, multicenter, retrospective study analyzing outcomes following ASCT in patients with LCDD. Even though a significant proportion (45%) of the patients were on RRT at the time of transplant, we observed a low
2-year cumulative NRM rate of only 2% for such a high-risk population. Moreover, hematological responses by day +100 post-ASCT were very encouraging accompanied by more modest improvements in renal function. Indeed, no patient of the non RRT group had worse renal function after ASCT and 11 % improved their renal function at day 100.
Table 3. Renal responses at day 100 post autologous stem cell transplantation in 38 patients with renal replacement therapy status at autologous stem cell transplantation available.
Renal response at day 100 post-ASCT N (%)*
Total number of patients 38
Total number of assessable patients 27 (100) CRenal 1 (4)
PRenal 0
MRenal
No response
2 (7)
7 (26)
Progression 0
Still on dialysis
Not assessable (baseline eGFR ≥50 mL/ min/1.73 m2)
Not assessable (missing baseline or day 100 eGFR)
17 (63)
8
3
Responses were assessed according to the International Myeloma Working Group Recommendations for the diagnosis and management of myeloma-related renal impairment.16 CRenal: complete renal response; PRenal: partial renal response; MRenal: minimal renal response. ASCT: autologous stem cell transplantation; eGFR: estimated glomerular filtration rate. The response reported are based on improvement from pretransplant until day 100 post-transplant. *Percentages calculated for the total number of assessable patients.
Figure 1. Estimated glomerular filtration rate at autologous stem cell transplantation, and 3, 6 and 12 months post-autologous stem cell transplantation in renal replacement therapy-independent patients. (A) Data shown as boxplots. The horizontal line shows the median, edges of the box show the interquartile range (IQR) and end of the whiskers show 1.5xIQR. (B) Individual estimated glomerular filtration rate (eGFR) trajectories in renal replacement therapy-independent patients, the estimated mean eGFR and 95% confidence interval around the mean estimated using a linear mixed effects model. ASCT: autologous stem cell transplantation.
Our experience is in keeping with prior reports, albeit of much smaller cohorts, that have described an important role for ASCT in patients with monoclonal immunoglobulin deposition disease (MIDD). Weichman and colleagues described six patients, five with LCDD and one with light chain crystal deposition disease (LCCDD), who underwent ASCT and who achieved a good outcome with acceptable toxicity.20 Hassoun et al. described that most patients in a small cohort (N=7) demonstrated complete hematologic remission (CHR) followed by renal improvement and reversal of RRT dependence in one case.21 Royer and colleagues subsequently reported their experience in 11 patients with LCDD/HCDD who received a variety of therapeutic regimens.10 Regarding ASCT response, they too reported an overall favorable outcome, including CHR in five patients,
improvement of renal function in four patients and several patients with cardiac and/or hepatic involvement who additionally demonstrated organ-specific improvements. Lorenz and co-workers reported the long-term outcome after ASCT of six patients. Although one patient did not survive the procedure, five had a hematological response by standard criteria and four who were not on RRT at the time of transplantation had a renal response as assessed by improvements in their GFR.12 More recently, a single-center reported their experience with 36 patients, 32 AL amyloidosis and four with MIDD, all on RRT. Here, the NRM at day +100 post-ASCT was 8%, at 1 year 70% achieved a CHR and the median OS for the entire cohort was 5.8 years.13 We observed an initial increase in renal function by day +100 post-ASCT which was not statistically significant for
Figure 2. Survival, relapse incidence and non-relapse mortality. Probability of (A) overall survival (OS), (B) progression-free survival (PFS), (C) cumulative incidence of relapse (RI) and (D) non-relapse mortality (NRM). Numbers below the graphs show the number at risk. Shaded areas show the 95% confidence intervals.
Figure 3. Probability of being in different stages of (combinations of) hematological and renal disease after autologous stem cell transplantation in patients, based on a multi-state model. (A) Patients on renal replacement therapy (RRT) and (B) patients not on RRT. At each time point the distance between two adjacent curves represents the probability of being in the corresponding state. The probability of being ‘event-free’ decreases over time and the probability of being in intermediate states ‘renal transplantation’, ‘hematological relapse’, ‘hematological relapse after renal transplantation’ and ‘hematological relapse followed by renal transplantation‘ can both increase and decrease over time, whereas the probability of ‘death’ can only increase over time. Hem: hematological; transpl.: transplantation.
A B C D
3. Masai R, Wakui H, Togashi M, et al. Clinicopathological features and prognosis in immunoglobulin light and heavy chain deposition disease. Clin Nephrol. 2009;71(1):9-20.
4 Cohen C, Joly F, Sibille A, et al. Randall-type monoclonal immunoglobulin deposition disease: new insights into the pathogenesis, diagnosis and management. Diagnostics. 2021;11(3):420.
5. Mohan M, Buros A, Mathur P, et al. Clinical characteristics and prognostic factors in multiple myeloma patients with light chain deposition disease. Am J Hematol. 2017;92(8):739-745.
6. Sayed RH, Wechalekar AD, Gilbertson JA, et al. Natural history and outcome of light chain deposition disease. Blood. 2015;126(26):2805-2810.
7 Leung N, Bridoux F, Nasr SH. Monoclonal gammopathy of renal significance. N Engl J Med. 2021;384(20):1931-1941.
8. Cohen C, Royer B, Javaugue V, et al. Bortezomib produces high hematological response rates with prolonged renal survival in monoclonal immunoglobulin deposition disease. Kidney Int. 2015;88(5):1135-1143.
9 Kimura S, Ohkawara H, Ogawa K, et al. Lenalidomide as a beneficial treatment option for renal impairment caused by light chain deposition disease. Intern Med. 2018;57(24):3651-3657.
10 Royer B, Arnulf B, Martinez F, et al. High dose chemotherapy in light chain or light and heavy chain deposition disease. Kidney Int. 2004;65(2):642-648.
11. Harada K, Akai Y, Sakan H, et al. Resolution of mesangial light chain deposits 3 years after high-dose melphalan with autologous peripheral blood stem cell transplantation. Clin Nephrol. 2010;74(5):384-8.
12. Lorenz EC, Gertz MA, Fervenza FC, et al. Long-term outcome of autologous stem cell transplantation in light chain deposition disease. Nephrol Dial Transplant. 2008;23(6):2052-2057.
13. Batalini F, Econimo L, Quillen K, et al. High-dose melphalan and stem cell transplantation in patients on dialysis due to immunoglobulin light-chain amyloidosis and monoclonal immunoglobulin deposition disease. Biol Blood Marrow Transplant. 2018;24(1):127-132.
14 Gertz MA, Comenzo R, Falk RH, et al. Definition of organ involvement and treatment response in immunoglobulin light chain amyloidosis (AL): a consensus opinion from the 10th International Symposium on Amyloid and Amyloidosis. Am J Hematol. 2005;79(4):319-328.
15. Palladini G, Dispenzieri A, Gertz MA, et al. New criteria for response to treatment in immunoglobulin light chain amyloidosis based on free light chain measurement and cardiac biomarkers: impact on survival outcomes. J Clin Oncol. 2012;30(36):4541-4549.
16. Dimopoulos MA, Merlini G, Bridoux F, et al. Management of multiple myeloma-related renal impairment: recommendations from the International Myeloma Working Group. Lancet Oncol. 2023;24(7):e293-e311.
17 Schemper M, Smith TL. A note on quantifying follow-up in studies of failure time. Control Clin Trials 1996;17(4):343-346.
18. de Wreede LC, Fiocco M, Putter H. Mstate: an R package for the analysis of competing risks and multi-state models. J Stat Softw. 2011;38(7):1-30.
19 R Core Team. A language and environment for statistical computing. R foundation for statistical computing 2022. Accessed on 2022, Jan 1st. https://www.r-project.org/
20. Weichman K, Dember LM, Prokaeva T, et al. Clinical and molecular characteristics of patients with non-amyloid light chain deposition disorders, and outcome following treatment with high-dose melphalan and autologous stem cell transplantation. Bone Marrow Transplant. 2006;38(5):339-343.
21. Hassoun H, Flombaum C, D’Agati VD, et al. High-dose melphalan and auto-SCT in patients with monoclonal Ig deposition disease. Bone Marrow Transplant. 2008;42(6):405-412.
22. Joly F, Cohen C, Javaugue V, et al. Randall-type monoclonal immunoglobulin deposition disease: novel insights from a nationwide cohort study. Blood. 2019;133(6):576-587.
23. McCarthy PL, Holstein SA, Petrucci MT, et al. Lenalidomide maintenance after autologous stem-cell transplantation in newly diagnosed multiple myeloma: a meta-analysis. J Clin Oncol. 2017;35(29):3279-3289.
24. Pianko MJ, Tiutan T, Derkach A, et al. Assessment of renal outcome following therapy in monoclonal immunoglobulin deposition disease: emphasizing the need for a consensus approach. Am J Hematol. 2023;98(3):421-431.
25. Roussel M, Merlini G, Chevret S, et al. A prospective phase 2 trial of daratumumab in patients with previously treated systemic light-chain amyloidosis. Blood. 2020;135(18):1531-1540.
26. Milani P, Basset M, Curci P, et al. Daratumumab in light chain deposition disease: rapid and profound hematologic response preserves kidney function. Blood Adv. 2020;4(7):1321-1324.
27. Moreau P, Garfall AL, van de Donk NWCJ, et al. et al. Teclistamab in relapsed or refractory multiple myeloma. N Engl J Med. 2022;387(6):495-505.
28. Sadelain M, Riviere I, Riddell S. Therapeutic T cell engineering. Nature. 2017;545(7655):423- 431.
29 Sidana S, Peres LC, Hashmi H, et al. Idecabtagene vicleucel chimeric antigen receptor T-cell therapy for relapsed/refractory multiple myeloma with renal impairment. Haematologica. 2024;109(3):777-786.
30. Bansal T, Garg A, Snowden JA, et al. Defining the role of renal transplantation in the modern management of multiple myeloma and other plasma cell dyscrasias. Nephron Clin Pract. 2012;120(4):c228-c235.
31. Chitty DW, Hartley-Brown MA, Abate M. Kidney transplantation in patients with multiple myeloma: narrative analysis and review of the last two decades. Nephrol Dial Transplant. 2022;37(9):1616-1626.
Endurance training improves oxygen uptake/demand mismatch, metabolic flexibility and recovery in patients with sickle cell disease
Loïs Mougin,1* Manon Riccetti,1* Angèle N. Merlet,2,3 Pablo Bartolucci,4,5 Barnabas Gellen,6 Léo Blervaque,1 Thomas d’Humières,5,7,8 Frédéric Galactéros,4,5 Chi-An W. Emhoff,1,9 Léonard Féasson2,3 and Laurent A. Messonnier1,10
1Inter-university Laboratory of Human Movement Sciences, University Savoie Mont Blanc, Chambéry, France; 2Inter-university Laboratory of Human Movement Sciences, University Jean Monnet, Saint-Etienne, France; 3Myology Unit, Department of Clinical Physiology and Exercise, Saint-Etienne University Hospital, Saint-Etienne, France, 4Department of Internal Medicine, Henri-Mondor Hospital (AP-HP), University Paris-Est Créteil (UPEC), Créteil, France; 5Sickle Cell Referral Center - UMGGR, Great Paris East Rare Diseases Expertise Platform, UPEC, FHU SENEC, Henri-Mondor Hospital (AP-HP), Créteil, France; 6Department of Cardiac Rehabilitation, Henri-Mondor Hospital (AP-HP), Créteil, France; 7Department of Physiology, FHU SENEC, Henri-Mondor Hospital (AP-HP), Créteil, France; 8INSERM IMRB U955, Team 8, University Paris Est (UPEC), Créteil, France; 9Department of Kinesiology, Saint Mary’s College of California, Moraga, CA, USA and 10Institut Universitaire de France (IUF), Paris, France
Patients with sickle cell disease (SCD) display lower slope coefficients of the oxygen uptake (VO2) versus work rate (W) relationship (delineating an O2 uptake/demand mismatch) and a poor metabolic flexibility. Because endurance training improves the microvascular network and increases the activity of oxidative enzymes, including one involved in lipid oxidation, endurance training might improve the slope coefficient of the VO2 versus W curve and the metabolic flexibility of SCD patients. Endurance training may also contribute to improve patients’ post-exercise cardiopulmonary and metabolic recovery. Fifteen patients with SCD performed a submaximal incremental test on a cycle ergometer before (SIT1) and after (SIT2) 8 weeks of endurance training. Minute ventilation (V E), ventilation rate, heart rate, VO2, carbon dioxide production (VCO2), respiratory exchange ratio, carbohydrate/lipid utilization and partitioning (including %Lipidox) and blood lactate concentration were measured during and after SIT1 and SIT2. At baseline, the slope coefficient of the VO2 versus W curve positively correlated with total hemoglobin, mean corpuscular hemoglobin and percentage of HbF. After training, the slope coefficient of the VO2 versus W curve was significantly higher and the increase in blood lactate concentration was delayed. If patients’ energy metabolism apparently relied largely on carbohydrate sources during SIT1, %Lipidox tended to increase at low exercise intensities during SIT2, supporting a training-induced improvement of metabolic flexibility in patients with SCD. Post-exercise recovery of ventilation rate, V E/VCO2, heart rate and blood lactate concentration was faster after training. We concluded that exercise training in patients with SCD: (i) ameliorated the oxygen uptake/ demand mismatch, (ii) blunted the metabolic inflexibility, and (iii) improved post-exercise cardiopulmonary and metabolic responses.
Introduction
Sickle cell disease (SCD) is the most common severe genetic disease and hemoglobinopathy in the world.1 SCD is caused by a mutation of the gene that encodes for β-globin, leading to the synthesis of an abnormal hemoglobin S (HbS). When
deoxygenated, HbS can polymerize, giving red blood cells a particular sickle shape. Sickle red blood cells are (i) fragile, leading to important hemolytic anemia on the one hand, and (ii) rigid and adherent to the endothelium, disturbing hemodynamics, favoring entrapment of the sickle red blood cells in the microcirculation, and potentially progressing
into vaso-occlusion on the other hand. These consequences of SCD (hemolytic anemia, endothelial adherence, altered hemodynamics and vaso-occlusion) act in concert with a rarefaction of the microvascular network2 and an apparent tissue shunt3 to limit oxygen transport and delivery deep into the tissues. The active skeletal muscle, which uses oxygen for its energy metabolism, may suffer particularly from this impeded oxygen supply. Additionally, the muscle remodeling associated with SCD includes alterations of the activity of oxidative enzymes2 indicative of impaired mitochondrial respiration. Therefore, if the oxygen supply to skeletal muscles is restricted, their capacity to consume the oxygen is also limited.2 As a consequence, SCD patients display poor physical ability as well as particular/abnormal responses to physical activity.4,5 A first particular response to exercise is the shape of the oxygen uptake (VO2) versus work rate (W) relationship. Previous studies have shown that the slope of this relationship is lower in young adult6 and adult4,5 patients with SCD than in control subjects. This lower slope does not reflect a higher efficiency of movement in patients with SCD. Rather, the lower slope coefficient results from the disturbed oxygen delivery and utilization as illustrated by the lower total hemoglobin and peripheral oxygen extraction displayed by patients with SCD,7 delineating an oxygen uptake/demand mismatch.3 A second particular response to exercise in patients with SCD is the early and rapid accumulation of lactate in the blood.4,8 If this early blood lactate accumulation signifies involvement of the glycolytic pathway in the energy supply, it also suggests a downregulation in lipid utilization. Indeed, elevated lactate levels inhibit lipolysis9 and the function of carnitine palmitoyl transferase 1, the transporter of free fatty acids into mitochondria.10 Because metabolic flexibility reflects the ability to oxidize carbohydrate and lipid during exercise,13 poor metabolic flexibility can be suspected in the context of SCD. In the past decade, studies have investigated the potentially beneficial effects of moderate-intensity endurance-exercise training programs in patients with SCD.4,12-14 At the muscular level, this type of training enlarged the microvascular network and improved the activity of key mitochondrial energy metabolism enzymes.14,15 Thus, endurance training seems to augment muscle oxygen supply and utilization. Whether these tissue adaptations lead to, or at least coincide with, alterations observable at the integrative level, such as a higher slope coefficient of the VO2 versus W relationship, remains unknown. Furthermore, the well-documented blunting effect of endurance training on blood lactate concentrations ([lactate]b) in healthy subjects16,17 occurs in patients with SCD,14,15 suggesting that the lactate-related inhibition of lipolysis and free fatty acid entry in mitochondria may also be partially blunted. In this context, it is interesting to note that endurance training in patients with SCD increased the activity of 3-hydoxylacyl-CoA dehydrogenase, a key enzyme involved in β-oxidation.15 Together,
these latter results suggest a potential for increased lipid oxidation after endurance training in SCD, consequently improving metabolic flexibility.
Endurance training improves post-exercise physiological adaptations by accelerating the return to basal values in healthy subjects. These faster returns to baseline values are observable in cardiorespiratory parameters such as heart rate (HR), minute ventilation (VE) and VO2, as well as in metabolic responses, including [lactate]b.16,18 For the cardiorespiratory parameters, these adaptations are particularly observable in the first part of the recovery.18,19 However, whether similar post-training observations are present in patients with SCD has yet to be investigated. The aim of the present study was, therefore, to test the hypotheses that in patients with SCD, endurance training would improve: (i) the oxygen uptake/demand matching, increasing the slope coefficient of the VO2 versus W curve, (ii) metabolic flexibility, and (iii) post-exercise cardiopulmonary responses.
Methods
Study population
Fifteen adult patients with homozygous SCD (HbSS or HbS/ β0-thalassemia genotypes; 7 women [2 taking hydroxyurea] and 8 men [7 taking hydroxyurea]) without severe chronic complications (see Online Supplement) participated in this study which took place in the Referral Center for Major Sickle Cell Syndrome in Créteil, France. They received no transfusions or supplemental oxygen during the whole duration of the study, nor were they hospitalized for vaso-occlusive crises. The study was approved by the ethics committee (Comité de Protection des Personnes Sud-Est 1 2014-14; EudraCT ID RCB 2014-A00334-43), conducted in accordance with the Declaration of Helsinki, and registered at www.clinicaltrials.gov (#NCT02571088). Volunteers were informed of the purposes, procedures, and possible associated risks and/ or discomfort related to the protocol before they gave written informed consent. Part of the results have been previously published for other purposes.8,14,15 When necessary, they are repeated here for the convenience of readers.
Study design
Patients were subjected to blood sampling (for complete blood count, HbS and HbF proportions, β-thalassemia, lactate dehydrogenase and total bilirubin) and performed the same submaximal incremental exercise test on a cycle ergometer before (SIT1) and after (SIT2) an 8-week endurance training program.
Submaximal incremental exercise test
The exercise test was performed on an electronic cycle ergometer (Ketler, Ense-Parsit, Germany). Exercise started at 20 W for women or 30 W for men and increased
stepwise every 2 min by 10 or 15 W for women or men, respectively. Gas exchange measurements (including ventilation rate [VR, cycle min -1], V E [L min -1], V O 2 [L min -1 or mL . min -1. kg -1] and carbon dioxide production [V CO 2, L min-1]) and HR (beats min-1) were recorded continuously. Every minute, whole [lactate] b (mmol . L-1) was assessed via a blood drop taken from the earlobe and analyzed extemporaneously (Lactate Scout, EKF diagnostics, Cardiff, UK). Exercise terminated as soon as a [lactate] b ≥4 mmol L-1 was recorded. 4,14 The test was followed by 2 min of active recovery at 20 or 30 W for women or men respectively, and thereafter by at least 6 min of passive recovery. The recovery and observation period ended when experimenters observed both a clear decrease in [lactate] b and a [lactate] b value below 4 mmol . L-1. This session was used to determine ( vide infra ) (i) indices of physical fitness, (ii) the V O 2 versus W relationship, (iii) energy substrate oxidation and partitioning, (iv) cardiopulmonary data during recovery and (v) the initial target exercise intensity for the training sessions.
Endurance exercise training protocol
Patients completed a moderate-intensity endurance-exercise training period, composed of 24 exercise sessions (3 sessions a week for 8 weeks) on a cycle ergometer. Each training session started with an initial 5-min warm-up (at 70% of the target work rate), continued with a 30-min constant-load endurance exercise at the target exercise intensity, followed by a 5-min cool-down (at 70% of the target work rate), and ended with light stretching. During the training sessions, several parameters were recorded: HR, blood pressure, peripheral oxygen saturation and [lactate]b. Patients were encouraged to drink water regularly for proper hydration. The exercise workload was selected with the goal of reaching a [lactate]b of ~2.5 mmol L-1. Depending on the [lactate]b obtained during each training session, exercise work rate for the subsequent training session was adjusted according to the strategy previously proposed.4 A physician was present to observe the patients during each training session.
Blood lactate curve analysis
The blood lactate versus work rate curves obtained during SIT1 and SIT2 were used to identify (i) the first lactate threshold (LT1) defined as the first inflection point on the curve and (ii) the achievement of the 4 mmol L-1 [lactate]b. Work rate at LT1 was used as the initial target exercise intensity for the training sessions (expecting a [lactate]b of ~2.5 mmol.L-1)4 while work rate at 4 mmol L-1 of [lactate]b was used as a criterion for exercise termination.
Cardiopulmonary and gas exchange measurements and analyses
During SIT1 and SIT2, cardiopulmonary parameters (HR, VR, VE, VO2 and VCO2) were measured continuously by an
ErgoCard device (Medisoft, Sorinnes, Belgium). VO2 at LT1 (VO2@LT1) and at 4 mmol L-1 blood lactate concentration (VO2@4mM) were used as physical fitness criteria. VO2 and VCO2 obtained at steady state (mean value of the last 20 seconds of steps of SIT, see Online Supplement) were considered for determination of the slope coefficient (a) of the linear VO2 versus work rate relationship and of the respiratory exchange ratio (RER) according to Eq. 1 and Eq. 2, respectively:
VO2 = a work rate + b (Eq. 1)
RER = VCO2/VO2 (Eq. 2)
Demography and anthropometry
Age in years 34.7±11.1
Hematology
VO2@4mM, mL min-1
Values are mean ± standard error. SIT1 and SIT2: submaximal incremental exercise tests 1 and 2, respectively; P: probability; NA: not applicable; NM: not measured; HbS: hemoglobin S; HbF: hemoglobin F; MCV: mean corpuscular volume; MCH: mean corpuscular hemoglobin; MCHC: mean corpuscular hemoglobin concentration; LDH: lactate dehydrogenase; W@LT1 and VO2@LT1: work rate and oxygen uptake at the first lactate threshold; W@4mM and VO2@4mM: work rate and VO2 at the 4 mM blood lactate concentration i.e., at exercise cessation; thVO2peak: theoretical peak oxygen uptake; %thVO2peak@4mM: percentage of thVO2peak at 4 mM of blood lactate concentration; N: number of patients.
Table 1. Some characteristics of patients (N=15).
Carbohydrate oxidation (CHOox) and lipid oxidation (Lipidox) rates were assessed using, respectively, Eq. 3 and Eq. 4 proposed by Frayn.20
The last RER value taken into account for CHOox, Lipidox, %CHOox and %Lipidox analyses was the first value ≥1.0 but lower than 1.05 on SIT2.11 For RER values ≥1.0, Lipidox and %Lipidox were considered to be null.
Theoretical peak oxygen uptake and related parameters
Theoretical peak oxygen uptake (thVO2peak) was calculated according to the equation proposed by Myers et al. 22 taking into account age, weight and gender as follows: thVO 2peak = 79.9 - (0.39 age) – (13.7 gender) –(0.127 . weight) (Eq. 8)
In this equation, thVO2peak is expressed in mL kg-1 min-1 and weight in lbs. For gender, male = 0 and female = 1. VO2@4mM was also expressed as percentage of thVO2peak (%thVO2peak@4mM). In the present study, the number of patients with values below and above 52% of thVO2peak was considered. This cut-off percentage corresponds to 80% of the theoretical value of VO2@4mM which is reached at 65% of thVO2peak in healthy (active but untrained) populations.17,23
Recovery data analysis
Different variables (VR, VE, VO2, HR and [lactate]b) were measured and recorded at T0’ and T2’ of active recovery and at T0’, T2’, T4’ and T6’ of passive recovery. Differences between T0’ and T2’ of active recovery (Δ0-2) and between T0’ and T6’ of passive recovery (Δ0-6) were considered.
Statistical analysis
Statistical analyses were performed with Statistica (version 80.0, Statsoft, Tulsa, OK, USA). Values are presented as mean ± standard deviation. Normality of data distribution was tested and confirmed by the Shapiro-Wilk test. Differences between pre- and post-training data were investigated using a t test, dependent samples. Relationships between two different variables were studied by means of linear regressions (confirmed by Pearson tests). The level of statistical significance was set at a=0.05.
Results
Patients’ characteristics
Some patients’ baseline and post-training characteristics are reported in Table 1. Hemoglobin concentration and indirect markers of hemolysis (lactate dehydrogenase, reticulocytes, total bilirubin) were similar before and after training.
Submaximal incremental exercise
Step count was 4.8±1.0 and 5.6±1.2 for SIT1 and SIT2, respectively (P=0.004). The corresponding exercise duration was 9.5±2.0 and 10.9±2.1 min, respectively (P=0.003).
Table 1 also reports pre- and post-training (SIT1 and SIT2, respectively) data of physical fitness parameters. More specifically, the work rates and VO2 at LT1 and at exercise completion (W@LT1, VO2@LT1, W@4mM and VO2@4mM, respectively) as well as %thVO2peak@4mM were all significantly improved by endurance training.
Applying Eq. 1 to the individual experimental data, mean ± standard deviation r2 value of the VO2 versus W correlation was 0.9492±0.0598. The slope coefficient of the curve was significantly higher after training ( P=0.008) (Figure 1). Before training, the slope coefficient of the curve was positively correlated with the hemoglobin concentration, the mean corpuscular hemoglobin (MCH) content and the percentage of fetal hemoglobin (%HbF), and negatively
Figure 1. Oxygen uptake and work rate relationships. (A) Mean ± standard deviation of oxygen uptake versus work rate curves before and after training. (B) Slope coefficients of the oxygen uptake versus work rate relationship before and after training. Open dots and black squares are mean or individual values before and after training, respectively. VO2: oxygen uptake; SIT1: submaximal incremental test before training; SIT2: submaximal incremental test after training.
correlated with the percentage of hemoglobin S (%HbS) (Figure 2). After training, the slope coefficient was correlated with hemoglobin concentration (Figure 2).
Table 2 reports values of [lactate]b, gas exchange measurements and substrate utilization and partitioning during SIT1 and SIT2. At rest and at 20/30 W, no training-induced differences were observed for [lactate]b. At 30/45 W and 40/60 W, [lactate]b was significantly lower after training (P=0.005 and P=0.006, respectively) (Figure 3). At rest and all exercise intensities (20/30 W, 30/45 W, and 40/60 W), RER was significantly lower after training (P=0.03, P=0.004, P=0.004 and P=0.001, respectively). Lipidox increased at 30/45 W, while %Lipidox increased and thus %CHOox decreased at 30/45 W and 40/60 W.
Subsequent recovery
During active and passive recovery (Table 3), no significant changes were observed for VE, VO2 and VCO2. During passive recovery (Δ0-6), the VR drop was greater after training (P=0.05).
HR decreased significantly more rapidly during active recovery after training, as shown by: (i) a lower mean HR after 2 min of active recovery (P=0.02), while HR at exercise completion was similar, and (ii) a greater post-training Δ0-2 of HR (P=0.02).
After training, [lactate]b decreased more rapidly during passive recovery (Table 3), as [lactate]b values at the 4th and 6th minutes of passive recovery were lower after training (P=0.05 and P=0.01, respectively).
Figure 2. Correlations between the slope coefficient of the oxygen uptake versus work rate curves and total hemoglobin(A, B), mean corpuscular hemoglobin (C, D), and percentages of hemoglobin S (E, F) and F (G, H) before and after training. SIT1: submaximal incremental test before training; SIT2: submaximal incremental test after training; Hb: hemoglobin; MCH: mean corpuscular hemoglobin; HbS: hemoglobin S; HbF: hemoglobin F.
Discussion
The main findings of the present study were that 8 weeks of endurance training in patients with SCD: (i) increased the slope coefficient of the VO2 versus W relationship, (ii) blunted the metabolic inflexibility and (iii) improved post-exercise recovery of some cardiopulmonary and metabolic parameters.
Effects of endurance training on oxygen uptake/demand mismatch and blood lactate accumulation
The slope coefficient of the VO2 versus W relationship has been reported to be lower in young adult and adult pa-
tients with SCD than in control subjects.4-6 This lower slope coefficient suggests an oxygen uptake/demand mismatch resulting from lower muscle oxygen supply due to anemia, microvasculature rarefaction and smaller capillary/fiber surface of exchange, and/or lower ability of muscle to consume oxygen as testified by the lower activity of oxidative enzymes in SCD patients.2 In accordance with this inferred oxygen uptake/demand mismatch, blood lactate levels increased early (for very low exercise intensity) during incremental exercise in patients with SCD.4 This oxygen uptake/ demand mismatch at the whole-body level is reminiscent of the oxygen supply/demand mismatch at the cerebral and peripheral (hand and forearm) levels due to lower oxygen
Figure 3. Blood lactate concentrations as a function of power output in males (A) and females (B) during submaximal incremental tests before and after endurance training. SIT1: submaximal incremental test before training; SIT2: submaximal incremental test after training.
Table 2. Blood lactate concentrations, gas exchange and substrate utilization and partitioning at different power outputs of the submaximal incremental tests before (SIT1) and after (SIT2) 8 weeks of endurance training.
Power output
Values are mean ± standard error. SIT1 and SIT2: submaximal incremental exercise tests 1 and 2, respectively; VO2: oxygen uptake; VCO2: CO2 production; RER: respiratory exchange ratio; CHOox: carbohydrate oxidation; Lipidox: lipid oxidation; %CHOox and %Lipidox: substrate partitioning. N: number of patients; P: probability; NS: not significant.
extraction and testified by arterialization of venous blood in patients with SCD.3,24 Interestingly, in the present study, the baseline slope coefficients were positively correlated with hemoglobin concentration, MCH and %HbF, as well as negatively correlated with %HbS (Figure 2A, C, E and G). These correlations suggest that, in our population, the baseline abnormal metabolic response to exercise (i.e., a low oxygen uptake for a given work rate) was associated with severity of anemia, and more generally with severity indices of the pathology.
Because endurance training enlarges the microvasculature, increases the capillary/fiber surface of exchange, and enhances the activity of oxidative enzymes (in other words, mitochondrial respiration) in patients with SCD,8,15 we suspected improved oxygen supply and extraction/consumption after training. Consequently, exercise-associated energy metabolism is expected to rely more on oxygen-derived pathways after training. Therefore, we hypothesized that endurance training would reduce the oxygen uptake/ demand mismatch by increasing the slope coefficient of the VO2 versus W curve in patients with SCD. The present results support this hypothesis (Figure 1). This assertion of a training-induced reduction of oxygen supply/demand mismatch via better oxygen supply (through an increased capillary network) and consumption (by increased mito-
chondrial respiration) also fits with the lower blood lactate accumulation (for a giver power output) after training (Table 2, Figure 3). This beneficial effect of endurance training on the slope resembles results obtained in trained athletes. Indeed, Lacour et al. showed that the most successful athletes displayed a higher slope coefficient of the VO2 versus W relationship associated with delayed blood lactate accumulation.25 Of note, the observed increase in the slope coefficient after training was independent of any change in anemia since hemoglobin concentration was not altered by endurance training. Furthermore, after training, the correlation between the slope coefficients and hemoglobin was still present but those with MCH, %HbS and %HbF were not observed. These latter results suggest that if anemia remained a limiting factor for oxygen supply and consumption, the other indices of pathology seemed to be less determinant in the physiological responses associated with oxygen uptake during exercise after endurance training. The improved matching between oxygen uptake and demand is of paramount importance for patients with SCD. This adaptation promotes better physical ability allowing patients with SCD to perform more vigorous activities of everyday life (e.g., climbing stairs, carrying loads, walking faster).3 The concomitant delay in blood lactate accumulation is equally significant because it should dampen
Table 3. Time courses of VE, VE/VCO2, VR, VO2, heart rate and blood lactate concentration during recovery following the submaximal incremental exercise tests 1 and 2 (SIT1 and SIT2).
Values are mean ± standard error. SIT1 and SIT2: submaximal incremental exercise tests 1 and 2, respectively; VE: minute ventilation; VCO2: CO2 production; VR: ventilation rate; VO2: oxygen uptake; HR: heart rate; [lactate]b: blood lactate concentration; P: probability; NS: not significant.
the risk of triggering the polymerization/sickling cascade and vaso-occlusion. Indeed, the acidosis that accompanies substantial blood lactate accumulation,26 triggers the polymerization/sickling cascade via a Bohr effect on the oxyhemoglobin dissociation curve.4,27
Endurance training improves metabolic flexibility
In the present study, RER values were elevated during rest and low-intensity exercise. This is not the first time that elevated RER values have been observed in SCD patients6,13,28,29 and these values cannot be attributed to an unsteady state in the present study (see Online Supplement). A possible explanation is that patients with SCD may experience acid/base disturbances, as described by Maurel et al., 30 who reported that 42% of SCD patients (stable and without renal failure) had baseline metabolic acidosis. Therefore, although high RER values would apparently indicate no or poor lipid oxidation, it cannot be excluded that lipid oxidation was partially masked by acid/base disturbances in the patients with SCD. In this context of high RER values, several data have been excluded (see Methods) to be able to assess substrate utilization and partitioning. Nevertheless, considered collectively, the present results (RER values, %CHOox and %Lipidox, Table 2) suggest a high dependence on glycolytic sources in the energy supply at rest and during exercise in patients with SCD. In accordance, we have previously shown that skeletal muscle of patients with SCD has similar glycolytic but lower β-oxidation enzymes activities than control counterparts.2 By extension, the present results suggest an apparent metabolic inflexibility11 in patients with SCD.
Given the link between capillary density and glucose uptake31 and the fact that patients with SCD have lower capillary density2 as well as the links between insulin, hemodynamics and glucose uptake32 and the observed hemodynamic disturbances in patients with SCD,3,33 one could expect insulin resistance and lower glucose uptake in patients with SCD. Contrary to this hypothesis, insulin resistance and glucose uptake do not differ between SCD patients and control subjects.34 Other studies even found lower insulin resistance35 and higher insulin sensitivity36 in SCD patients than in control subjects. From that point of view, the present results (elevated RER and %CHOox) suggest that glucose uptake and its subsequent utilization by the skeletal muscle are not dampened in patients with SCD. This latter inference is in accordance with the lower fasting blood glucose observed by Babiker et al. 37 Further studies would be necessary to characterize the relationship between this elevated glucose utilization and risk of metabolic syndrome in SCD; however, the prevalence of metabolic syndrome in sickle cell anemia patients has been reported to be approximately half of that in African-American counterparts.38 Patients with SCD also seem to be less likely to develop obesity and diabetes mellitus compared to their peers.39 As a whole, the lower insulin resistance35
and fasting blood glucose37 as well as the lower prevalence of metabolic syndrome, diabetes mellitus and obesity in SCD38,39 are in agreement with the high glucose utilization found in the present study.
In healthy subjects, endurance training decreases utilization of carbohydrates (glycogen and glucose) and increases lipid oxidation for low-intensity exercises.40-42 The trends towards lower post-training values of RER, CHOox and %CHOox along with higher Lipidox and %Lipidox during low-intensity exercise suggest that endurance training acts to some extent similarly in patients with SCD as in healthy subjects by improving metabolic flexibility. This training-induced beneficial adaptation is supported by the concomitant increase in activity of 3-hydoxylacyl-CoA dehydrogenase (a key enzyme involved in β-oxidation) in patients with SCD.15 Of note, while endurance training appeared to improve metabolic flexibility in patients with SCD, the adaptations remained relatively modest. Further studies are necessary to determine the extent of benefits of a long-term endurance training program on substrate oxidation and partitioning in patients with SCD.
Post-exercise recovery
During active recovery, HR declined faster after training. In addition, VR decreased faster, VE decreased similarly and VE/VCO2 increased less after training (Table 3). These latter results tend to support better ventilatory efficiency after training. The faster blood lactate decline observed during passive recovery is also in accordance with previous studies in healthy subjects.16 Although fragmentary, the present results suggest that similar benefits of endurance training can be observed during post-exercise recovery in patients with SCD and in healthy subjects.
Experimental considerations and future directions
Classically, exercise-related physiological responses are evaluated using a maximal (symptom-limited) cardiopulmonary exercise test. While, several authors reported no complications (cardiac or other) during and after this type of exercise,28,43,44 patients and physicians still have in mind that exercise may induce hemolysis45 and that approximately one-third of vaso-occlusive crises and episodes of secondary acute chest syndrome are associated with exertion.46 In this context, numerous patients and physicians remain reluctant to perform or prescribe a maximal (symptom-limited) cardiopulmonary exercise test, respectively. To convince patients and physicians that exercise testing may remain safe, we adopted a strategy using lactate concentration as a marker of safety. Lactate accumulation can testify the risk of triggering the polymerization/sickling cascade and vaso-occlusion through at least three mechanisms: metabolic acidosis, vasoconstriction, and cell adhesion (Figure 4). Acidosis that accompanies substantial blood lactate accumulation26 triggers the polymerization/ sickling cascade via a Bohr effect on the oxyhemoglobin
dissociation curve.4,27 Second, lactate production is driven by muscle glycogenolysis, which is activated by adrenaline47 due to progressive sympathetic nervous system activation with exercise intensity17 (Figure 4). Of note, sympathetic nervous system activation induces vasoconstriction, and adrenaline activates cell adhesion via a cyclic adenosine monophosphate–dependent protein kinase A pathway,48 both increasing the risk of hemodynamic disorders and potentially vaso-occlusion.49-51 Given the potential implication of these mechanisms in the pathophysiology of SCD, avoiding rapid blood lactate accumulation may constitute an effective strategy of safety. For further information about the protocol/strategy used in the present study, we refer the reader to a previous paper.4
Complementary results of the present study should be highlighted. First, the lack of changes in some markers of hemolysis (lactate dehydrogenase, reticulocytes and total bilirubin) before and after training suggests that the proposed training program was not detrimental for the patients (Table 1). Second, all indices of patients’ physical fitness (W@LT1, VO2@LT1, W@4mM, VO2@4mM and %thVO2peak@4mM) were improved in response to endurance training (Table 1). Although significant, the training-induced improvements observed in the present study were modest (Tables 1-3, Figures 1 and 3, Online Supplementary Table S1). Furthermore, because of high RER values, the number of available data to assess substrate partitioning and utilization was limited and the interpretation of metabolic changes (including metabolic flexibility) with endurance training should be strengthened by further investigations. As a whole, further studies including a larger number of patients with and without complications and a longer training period should allow a more precise assessment of the effects of endurance training in SCD patients. It is important to keep in mind that the present results were obtained in patients without systemic complications, at steady state (see Online Supplement) and particularly without cardiovascular impairment. Indeed, cardiovascular complications are one of the leading causes of functional impairment and mortality in SCD.52-54 Therefore, our results cannot be extended to more severely affected populations, which require dedicated trials that are currently underway. In patients with SCD, mitochondrial function is reduced compared to that of healthy HbAA counterparts5 and is improved by endurance training.15 Because mitochondrial respiration is believed to drive the oxygen uptake kinetics55 (observed in everyday life when patients get up from a chair, climb stairs, etc.), it would be interesting in the near future to investigate oxygen uptake kinetics in SCD patients and the effects of endurance training on this kinetics. The expected post-training faster kinetics would further support the notion of improved oxygen delivery/ uptake matching within skeletal muscles. Along the same line, because the improvement of mitochondrial function with endurance training is a central outcome in patients
Figure 4. Lactate accumulation as a marker of safety. Lactate accumulation as a marker of (i) pH decrease triggering the polymerization/sickling cascade, and (ii) sympathetic nervous system activation and adrenaline production triggering vasoconstriction and cell adhesion, respectively, all of which ultimately lead to hemodynamic disturbances and potentially vaso-occlusive crises (VOC).
with SCD, any disturbances in mitochondrial function (e.g., SOD2V16A variant56) which may dampen both the ability of patients to be physically active and improvements in response to endurance-training would deserve to be studied. Finally, it would be of great interest to investigate the effects of endurance training on nitric oxide bioavailability (which is known to be decreased in SCD patients 57 and constitutes a determinant factor of muscle oxygen supply during exercise58).
Conclusions
The main findings of the present study were that 8 weeks of endurance training in patients with SCD: (i) increased the slope coefficient of the VO2 vs. work rate relationship indicating a decrease of the oxygen supply/demand mismatch, (ii) blunted metabolic inflexibility, although the adaptations were modest and relied on a low number of data in the present study and (iii) improved some post-exercise cardiometabolic responses, as in the general population. As a whole, the present data reinforce the idea that endurance training is beneficial for patients with SCD.
Disclosures
PB has received grants from Addmedica, Fabre Foundation, Novartis and Bluebird in the past 36 months; has received consulting fees from Addmedica, Novartis, Roche, GBT, Bluebird, Emmaus, Hemanext, and Agios; has received honoraria for lectures from Novartis, Addmedica, and Jazzpharma; is a member of a Novartis steering committee; and is a cofounder of Innovhem.
Contributions
PB, BG, FG, LF, and LAM designed the study. AM, PB, BG, TR, FG, LF, and LAM performed the experiments and recorded the data. LM, MR, AM, LB, and LAM analyzed and interpreted the data. LM, MR, and LAM wrote the first draft. All authors critically revised and approved the present version of the manuscript. Artificial intelligence (AI) or AI-assisted technologies have not been used in the writing of this paper.
Acknowledgments
This study is part of a larger experiment. A small part of the results presented here have been published elsewhere for other purposes.8,14,15 The authors would like to thank all the
2. Ravelojaona M, Féasson L, Oyono-Enguéllé S, et al. Evidence for a profound remodeling of skeletal muscle and its microvasculature in sickle cell anemia. Am J Pathol. 2015;185(5):1448-1456.
3. Detterich JA, Kato R, Bush A, et al. Sickle cell microvascular paradox-oxygen supply-demand mismatch. Am J Hematol. 2019;94(6):678-688.
4 Messonnier LA, Gellen B, Lacroix R, et al. Physiological evaluation for endurance exercise prescription in sickle cell disease. Med Sci Sports Exerc. 2019;51(9):1795-1801.
5. Miller DM, Winslow RM, Klein HG, et al. Improved exercise performance after exchange transfusion in subjects with sickle cell anemia. Blood. 1980;56(6):1127-1131.
6. Liem RI, Nevin MA, Prestridge A, et al. Functional capacity in children and young adults with sickle cell disease undergoing evaluation for cardiopulmonary disease. Am J Hematol. 2009;84(10):645-649.
7 Hammoudi N, Ceccaldi A, Haymann JP, et al. Altered cardiac reserve is a determinant of exercise intolerance in sickle cell anaemia patients. Eur J Clin Invest. 2022;52(1):e13664.
8. Merlet AN, Chatel B, Hourdé C, et al. How sickle cell disease impairs skeletal muscle function: implications in daily life. Med Sci Sports Exerc. 2019;51(1):4-11.
9 Issekutz B, Miller H. Plasma free fatty acids during exercise and the effect of lactic acid. Exp Biol Med. 1962;110(2):237-239.
10. McGarry JD. The mitochondrial carnitine palmitoyltransferase system: its broadening role in fuel homoeostasis and new insights into its molecular features. Biochem Soc Trans. 1995;23(2):321-324.
11. San-Millán I, Brooks GA. Assessment of metabolic flexibility by means of measuring blood lactate, fat, and carbohydrate oxidation responses to exercise in professional endurance athletes and less-fit individuals. Sports Med. 2018;48(2):467-479.
12. Grau M, Nader E, Jerke M, et al. Impact of a six week training program on ventilatory efficiency, red blood cell rheological parameters and red blood cell nitric oxide signaling in young sickle cell anemia patients: a pilot study. J Clin Med. 2019;8(12):2155.
13. Liem RI, Akinosun M, Muntz DS, et al. Feasibility and safety of home exercise training in children with sickle cell anemia. Pediatr Blood Cancer. 2017;64(12):e26671.
patients for their interest and voluntary participation in the study.
Funding
This study was supported by a grant from the Heart and Sport Foundation.
Data-sharing statement
Material described in the manuscript will be available for non-commercial purposes, without breaching participant confidentiality, and upon reasonable request by contacting the corresponding author.
14 Gellen B, Messonnier LA, Galactéros F, et al. Moderate-intensity endurance-exercise training in patients with sickle-cell disease without severe chronic complications (EXDRE): an open-label randomised controlled trial. Lancet Haematol. 2018;5(11):e554-e562.
15. Merlet AN, Féasson L, Bartolucci P, et al. Muscle structural, energetic and functional benefits of endurance exercise training in sickle cell disease. Am J Hematol. 2020;95(11):1257-1268.
16. Messonnier L, Freund H, Féasson L, et al. Blood lactate exchange and removal abilities after relative high-intensity exercise: effects of training in normoxia and hypoxia. Eur J Appl Physiol. 2001;84(5):403-412.
17 Messonnier LA, Emhoff CAW, Fattor JA, et al. Lactate kinetics at the lactate threshold in trained and untrained men. J Appl Physiol (1985). 2013;114(11):1593-1602.
18. Hagberg JM, Hickson RC, Ehsani AA, et al. Faster adjustment to and recovery from submaximal exercise in the trained state. J Appl Physiol Respir Environ Exerc Physiol. 1980;48(2):218-224.
19 Coote JH. Recovery of heart rate following intense dynamic exercise. Exp Physiol. 2010;95(3):431-440.
20 Frayn KN. Calculation of substrate oxidation rates in vivo from gaseous exchange. J Appl Physiol Respir Environ Exerc Physiol. 1983;55(2):628-634.
21. Zarins ZA, Wallis GA, Faghihnia N, et al. Effects of endurance training on cardiorespiratory fitness and substrate partitioning in postmenopausal women. Metabolism. 2009;58(9):1338-1346.
22. Myers J, Kaminsky LA, Lima R, et al. A reference equation for normal standards for VO2 max: analysis from the Fitness Registry and the Importance of Exercise National Database (FRIEND Registry). Prog Cardiovasc Dis. 2017;60(1):21-29.
23. Miller BF, Fattor JA, Jacobs KA, et al. Metabolic and cardiorespiratory responses to ‘the lactate clamp’. Am J Physiol Endocrinol Metab. 2002;283(5):E889-898.
24. Bush AM, Coates TD, Wood JC. Diminished cerebral oxygen extraction and metabolic rate in sickle cell disease using T2 relaxation under spin tagging MRI. Magn Reson Med. 2018;80(1):294-303.
25. Lacour JR, Messonnier L, Bourdin M. The leveling-off of oxygen uptake is related to blood lactate accumulation. Retrospective study of 94 elite rowers. Eur J Appl Physiol. 2007;101(2):241-247.
26. Freund H, Lonsdorfer J, Oyono-Enguelle S, et al. Lactate exchange and removal abilities in sickle cell patients and in untrained and trained healthy humans. J Appl Physiol (1985).
1992;73(6):2580-2587.
27. Chatel B, Messonnier LA, Bendahan D. Do we have to consider acidosis induced by exercise as deleterious in sickle cell disease? Exp Physiol. 2018;103(9):1213-1220.
28. Liem RI, Reddy M, Pelligra SA, et al. Reduced fitness and abnormal cardiopulmonary responses to maximal exercise testing in children and young adults with sickle cell anemia. Physiol Rep. 2015;3(4):e12338.
29. Alsaied T, Niss O, Powell AW, et al. Diastolic dysfunction is associated with exercise impairment in patients with sickle cell anemia. Pediatr Blood Cancer. 2018;65(8):e27113.
30. Maurel S, Stojanovic KS, Avellino V, et al. Prevalence and correlates of metabolic acidosis among patients with homozygous sickle cell disease. Clin J Am Soc Nephrol. 2014;9(4):648-653.
31. Lillioja S, Young AA, Culter CL, et al. Skeletal muscle capillary density and fiber type are possible determinants of in vivo insulin resistance in man. J Clin Invest. 1987;80(2):415-424.
32. Baron AD, Roudebush RL. Hemodynamic actions of insulin. Am J Physiol. 1994;267(2):187-202.
33. Nath KA, Katusic ZS, Gladwin MT. The perfusion paradox and vascular instability in sickle cell disease. Microcirculation. 2004;11(2):179-193.
34. Ter Maaten JC, Serné EH, Bakker SJL, et al. Effects of insulin on glucose uptake and leg blood flow in patients with sickle cell disease and normal subjects. Metabolism. 2001;50(4):387-392.
35. Yavropoulou MP, Pikilidou M, Pantelidou D, et al. Insulin secretion and resistance in normoglycemic patients with sickle cell disease. Hemoglobin. 2017;41(1):6-11.
36. Akinlade K, Kumuyi A, Rahamon S, et al. Insulin sensitivity, inflammation, and basal metabolic rate in adults with sickle cell anemia. Int J Appl Basic Med Res. 2018;8(2):106-110.
37. Babiker AO, Kaddam LA. Risk factors of metabolic syndrome among adult Sudanese sickle cell anemia patients. BMC Hematol. 2018;18(1):38.
38. Ogunsile FJ, Bediako SM, Nelson J, et al. Metabolic syndrome among adults living with sickle cell disease. Blood Cells Mol Dis. 2019;74:25-29.
39 Jang T, Mo G, Stewart C, et al. Obesity and diabetes mellitus in patients with sickle cell disease. Ann Hematol. 2021;100(9):2203-2205.
40 Brooks GA, Mercier J. Balance of carbohydrate and lipid utilization during exercise: the ‘crossover’ concept. J Appl Physiol (1985). 1994;76(6):2253-2261.
41. Jeukendrup AE, Mensink M, Saris WHM, Wagenmakers AJM. Exogenous glucose oxidation during exercise in endurancetrained and untrained subjects. J Appl Physiol (1985). 1997;82(3):835-840.
42. Kiens B, Essen-Gustavsson B, Christensen NJ, Saltin B. Skeletal muscle substrate utilization during submaximal exercise in man: effect of endurance training. J Physiol. 1993;469(1):459-478.
43. Van Beers EJ, van der Plas MN, Nur E, et al. Exercise tolerance, lung function abnormalities, anemia, and cardiothoracic ratio in sickle cell patients. Am J Hematol. 2014;89(8):819-824.
44 Ogunsile FJ, Stewart KJ, Kanter J, Lanzkron SM. An evaluation of cardiopulmonary endurance and muscular strength in adults living with sickle cell disease. Br J Haematol. 2022;199(4):597-602.
45. Platt OS, Lux SE, Nathan DG. Exercise-induced hemolysis in xerocytosis. Erythrocyte dehydration and shear sensitivity. J Clin Invest. 1981;68(3):631-638.
46. Bartolucci P, Habibi A, Khellaf M, et al. Score predicting acute chest syndrome during vaso-occlusive crises in adult sickle-cell disease patients. EBioMedicine. 2016;10:305-311.
47. Watt MJ, Howlett KF, Febbraio MA, Spriet LL, Hargreaves M. Adrenaline increases skeletal muscle glycogenolysis, pyruvate dehydrogenase activation and carbohydrate oxidation during moderate exercise in humans. J Physiol. 2001;534(Pt 1):269-278.
48. Zennadi R, Moeller BJ, Whalen EJ, et al. Epinephrine-induced activation of LW-mediated sickle cell adhesion and vasoocclusion in vivo. Blood. 2007;110(7):2708-2717.
49 Winder WW, Hagberg JM, Hickson RC, Ehsani AA, McLane JA. Time course of sympathoadrenal adaptation to endurance exercise training in man. J Appl Physiol Respir Environ Exerc Physiol. 1978;45(3):370-374.
50. Velusamy P, Mohan T, Ravi DB, et al. Targeting the Nrf2/ARE signalling pathway to mitigate isoproterenol-induced cardiac hypertrophy: plausible role of hesperetin in redox homeostasis. Oxid Med Cell Longev. 2020;2020:9568278.
51. Febbraio MA, Lambert DL, Starkie RL, Proietto J, Hargreaves M. Effect of epinephrine on muscle glycogenolysis during exercise in trained men. J Appl Physiol (1985). 1998;84(2):465-470.
52. d’Humières T, Savale L, Inamo J, et al. Cardiovascular phenotypes predict clinical outcomes in sickle cell disease: an echocardiography-based cluster analysis. Am J Hematol. 2021;96(9):1166-1175.
53. Hammoudi N, Lionnet F, Redheuil A, Montalescot G. Cardiovascular manifestations of sickle cell disease. Eur Heart J. 2020;41(13):1365-1373.
54 Gladwin MT. Cardiovascular complications and risk of death in sickle-cell disease. Lancet. 2016;387(10037):2565-2574.
55. Poole DC, Jones AM. Oxygen uptake kinetics. Compr Physiol. 2012;2(2):933-996.
56. Dosunmu-Ogunbi A, Yuan S, Reynolds M, et al. SOD2 V16A amplifies vascular dysfunction in sickle cell patients by curtailing mitochondria complex IV activity. Blood. 2021;139(11):1760-1765.
57. Gladwin MT, Schechter AN, Ognibene FP, et al. Divergent nitric oxide bioavailability in men and women with sickle cell disease. Circulation. 2003;107(2):271-278.
58. Hirai DM, Copp SW, Ferguson SK, et al. Exercise training and muscle microvascular oxygenation: functional role of nitric oxide. J Appl Physiol. 2012;113(4):557-565.
Functional and multi-omics signatures of mitapivat efficacy upon activation of pyruvate kinase in red blood cells from patients with sickle cell disease
Angelo D’Alessandro,1 Kang Le,2 Maureen Lundt,2 Quan Li,3 Emily B. Dunkelberger,3 Troy Cellmer,3 Andrew J. Worth,4 Spurthi Patil,4 Chris Huston,4 Abby Grier,1 Monika Dzieciatkowska,1 Daniel Stephenson,1 William A. Eaton3 and Swee Lay Thein2
1Department of Biochemistry and Molecular Genetics, University of Colorado Denver –Anschutz Medical Campus, Aurora, CO; 2Sickle Cell Branch, National Heart, Lung, and Blood Institute, NIH, Bethesda, MD; 3Laboratory of Chemical Physics, National Institute of Diabetes and Digestive and Kidney Diseases, NIH, Bethesda, MD and 4Agios Pharmaceuticals, Inc., Cambridge, MA, USA
Abstract
Correspondence: A. D’Alessandro angelo.dalessandro@cuanschutz.edu
S.L. Thein sweelay.thein@nih.gov
Received: December 11, 2023.
Accepted: February 29, 2024. Early view: March 7, 2024. https://doi.org/10.3324/haematol.2023.284831
Mitapivat, a pyruvate kinase activator, shows great potential as a sickle cell disease (SCD)-modifying therapy. The safety and efficacy of mitapivat as a long-term maintenance therapy are currently being evaluated in two open-label studies. Here we applied a comprehensive multi-omics approach to investigate the impact of activating pyruvate kinase on red blood cells (RBC) from 15 SCD patients. HbSS patients were enrolled in one of the open-label, extended studies (NCT04610866). Leukodepleted RBC obtained from fresh whole blood at baseline, prior to drug initiation, and at longitudinal timepoints over the course of the study were processed for multi-omics through a stepwise extraction of metabolites, lipids and proteins. Mitapivat therapy had significant effects on the metabolome, lipidome and proteome of SCD RBC. Mitapivat decreased 2,3-diphosphoglycerate levels, increased adenosine triphosphate levels, and improved hematologic and sickling parameters in patients with SCD. Agreement between omics measurements and clinical measurements confirmed the specificity of mitapivat on targeting late glycolysis, with glycolytic metabolites ranking as the top correlates to parameters of hemoglobin S oxygen affinity (p50) and sickling kinetics (t50) during treatment. Mitapivat markedly reduced levels of proteins of mitochondrial origin within 2 weeks of initiation of treatment, with minimal changes in reticulocyte counts. In the first 6 months of treatment there were also transient elevations of lysophosphatidylcholines and oxylipins with depletion of free fatty acids, suggestive of an effect on membrane lipid remodeling. Multi-omics analysis of RBC identified benefits for glycolysis, as well as activation of the Lands cycle.
Introduction
In red blood cells (RBC), the small molecule metabolite 2,3-diphosphoglycerate (DPG) stabilizes the deoxy conformation of hemoglobin to promote oxygen off-loading and counteract hypoxia.1 In sickle cell disease (SCD), mutation of glutamate 6 to valine in the β subunit of hemoglobin favors the polymerization of the sickle hemoglobin (HbS) upon deoxygenation.2 Therefore, elevation of 2,3-DPG in SCD is deleterious because it promotes polymerization by stabilizing HbS fibers. High levels of DPG also promote HbS polymerization by decreasing intracellular pH.3,4 DPG is an intermediate metabolite in the Rapoport-Luebering shunt off the glycolytic pathway; in the Embden-Meyerhof-Parnas
glycolytic pathway, pyruvate kinase (PK) is a rate-limiting enzyme that catalyzes the second adenosine triphosphate (ATP)-generating step, in which phosphoenolpyruvate is converted to pyruvate.5 Therapeutic enhancement of the endogenous RBC PK (PKR) activity should increase the glycolytic flux, therefore leading to increases of ATP concomitantly with decreases in DPG, both of which have anti-sickling effects. Intracellular ATP is essential for the maintenance of RBC hydration and membrane integrity, which impact the pathophysiology of SCD.6
Mitapivat (AG-348, Agios Pharmaceuticals Inc, Cambridge, MA, USA) is a first-in-class, oral, allosteric activator of PK that was originally developed for treating patients with inherited PK deficiency caused by mutations in the PKLR
gene. Mitapivat is approved in the USA by the Food and Drug Administration for the treatment of hemolytic anemia in adults with PK deficiency, and in the European Union by the European Medicines Agency and in Great Britain by the Medicines and Healthcare Products Regulatory Agency for the treatment of PK deficiency in adults. Its ability to enhance the activity of wild-type PK subsequently led to clinical trials of mitapivat in other hemolytic anemias, including thalassemia and SCD. Indeed, proof-of-concept for activating PK as a therapeutic approach was established in two independent studies of mitapivat, a phase I, open-label, multiple dose ascending study7 (NCT04000165) and a phase II, open-label study8 (www.trialregister.nl NL8517). In both studies, mitapivat improved hematologic parameters, increased ATP and decreased DPG levels with decreased sickling.7,8 The safety and efficacy of mitapivat as a long-term maintenance therapy for patients with SCD are currently being evaluated in both studies. In the present study, we apply a comprehensive multi-omics approach9-11 to investigate the impact of activating PK on RBC from SCD patients on mitapivat therapy in the NCT04610866 extended study. The rationale for these omics analyses was to test the metabolic effects of mitapivat on late glycolysis and other pathways, including ATP synthesis, and redox status of the sickle RBC cytosol and membrane (lipidome). At the same time, proteomics analyses afforded the opportunity to monitor changes in PK levels, while also assessing the impact on the proteome and (ATP-dependent) phosphoproteome as a whole.
Methods
Study design and preparation of blood samples
This study evaluated one of the exploratory endpoints in an open label phase I/II study (NCT04610866), i.e., the longterm safety and tolerability of mitapivat. The study was approved by the National Heart, Lung, and Blood Institute Institutional Review Board and was performed in accordance with the Declaration of Helsinki.12 Blood samples for ex-vivo studies were obtained from 15 patients with HbSS enrolled in the study. All the patients were adult (age >18 years) with confirmed SCD (HbSS) and a baseline hemoglobin between 7.1-10.5 g/dL, with no recent blood transfusions, erythropoietin therapy, or changes in SCD-specific therapies including hydroxyurea and L-glutamine.13 All patients started mitapivat at a dose of 50 mg twice daily, escalating after 4 weeks to 100 mg twice daily; dose adjustments were performed for reasons of safety and tolerability, as per the Principal Investigator’s discretion. At the time of data cutoff (March 23, 2023), all 15 patients had completed the core period of 24 weeks (visit 6, V6), 14 patients had completed 48 weeks (V8), ten patients had completed 72 weeks (V10) and six patients had completed 92 weeks (V12). RBC obtained from fresh whole blood in EDTA at baseline (V1,
prior to drug initiation) and longitudinal timepoints were collected over the course of the study. After centrifuging 6 mL of whole blood at 800 g for 10 minutes at room temperature, the plasma was removed and the RBC pellets were resuspended by adding 3 mL of phosphate-buffered saline. To obtain leukodepleted RBC, the resuspended RBC were subjected to a leukodepletion process using a NEO High-Efficiency Leukocyte Reduction Filter for RBC (Haemonetics, PA, USA). Samples were flash-frozen in ethanol and dry ice, and kept frozen at -80°C until analysis. PKR activity was measured as described elsewhere.14,15 In total, 150 (6x12, 4x10, 4x8 and 1x6) timepoint samples were analyzed (Figure 1A). Sickling kinetics were measured by counting the fraction of sickled red cells as a function of time in a 384-well plate using a machine learning method while slowly deoxygenating cells with nitrogen to 5% oxygen in the oxygen pressure- and temperature-controlled humidified chamber of a Biotek “Lionheart FX” automated microscope system (Agilent Technologies).16 The t50 is the time at which 50% of the cells are sickled. Oxygen dissociation curves were measured with a Hemox Analyzer (TCS Scientific Corp, PA, USA). Briefly PKR activity was measured by a coupled enzyme system with lactate dehydrogenase (LDH) in which the pyruvate produced by PKR was reduced to lactate with the concomitant oxidation of NADH to NAD. The progress of the reaction was followed by a change in the oxidation state of the cofactor spectrophotometrically at 340 nm. PKR protein levels were determined by Mesoscale Assay (MesoScale Discovery) goat anti-PKLR antibody (Aviva) and mouse anti-PKLR antibody (Abcam). SULFO-TAG goat anti-mouse (Mesoscale Discovery) was used as the detection antibody.
Omics analyses
The omics methods and statistical analyses are reported extensively in the Online Supplementary Methods - Extended. Metabolomics, lipidomics and proteomics analyses were performed as previously described.17-19 The statistical analysis was conducted using MetaboAnalyst v 5.0 and RStudio (v.4.2.3). Biorender (https://www.biorender.com/) was used to generate summary vignettes.
Results
Mitapivat had significant effects on the sickle red blood cell metabolome, lipidome and proteome
We performed two separate analyses of the data collected on the longitudinal samples. We first analyzed all 150 samples available from all visit timepoints 1-12 (V1 to V12) - a breakdown of biological replicates available for each timepoint is shown in Figure 1A. We then analyzed 90 samples for all 15 patients up to V6 (Figure 1A). All raw omics data and elaborations are provided in Online Supplementary Table S1, including complete blood counts from
the patients at the timepoints analyzed in the study. Unsupervised analyses of multi-omics data were performed via repeated measure analysis of variance (ANOVA) and linear models of combined metabolomics and lipidomics data (Figure 1B), and proteomics data (Figure 1C), respectively. These analyses identified molecules associated with mitapivat treatment, either when testing for unadjusted variables, or upon adjustments for confounders such as patient-specific responses. Mitapivat levels were detected via mass spectrometry in the leukodepleted RBC, suggesting successful drug delivery (Figure 1D). Of note, ATP and L-carnitine levels were identified as the top two metabolites with the strongest positive and negative responses, respectively, across all patients throughout the whole duration of the study (Figure 1D). First, we performed supervised analysis of combined multi-omics data via linear
discriminant analysis (LDA). Figure 1E shows the results were plotted based on the top two major components (LDA1 and LDA2 – x and y, respectively), while discriminating the samples across visits along the z axis. Plotting the same results using LDA3 as a sample clustering factor for the z axis revealed patient-specific responses to the treatment, with a confounded, yet still observable clustering of the samples by visit number (Online Supplementary Figure S1A). This patient-specific heterogeneity can be at least in part explained by the heterogeneity of mitapivat levels, in accordance with the design of the clinical protocol, as detected by mass spectrometry (Online Supplementary Figure S1B). Overall, the temporal trends of omics responses to mitapivat treatment across visits was evident, as highlighted by heatmap representations, especially when focusing on the top 50 metabolites/lipids (Figure 2A) or
Figure 1. Alterations of the metabolome in sickle red blood cells from patients on treatment with mitapivat. (A) Overview of the clinical study. Fifteen sickle cell patients (SS genotype) were enrolled in this clinical trial, with all 15 patients being treated for 6 months, 14 for a whole year and six for up to 2 years (visit 12). Red blood cell (RBC) samples underwent multi-omics characterization. (B, C) Linear model analysis of metabolomics and lipidomics data (B) or proteomics data (C) identified molecules associated with the treatments, either unadjusted (x axis) or adjusted by patient-specific responses (y axis). Highlighted metabolites (B) or proteins (C) represent the variables with the highest weights across linear discriminant analysis 1 (LDA1). (D) Line plots of mitapivat, ATP and carnitine, the very drug being administered, along with the levels of the top metabolites affected by the treatment. In light blue, median metabolite levels across all samples, while range intervals are shown in light gray. Data are shown as peak area abundance (arbitrary unit on the y axis), while the x axis represents visits 1-12. (E) LDA identified two major components (LDA1 and LDA2 – x and y, respectively) discriminating samples across visits (z axis).
proteins (Figure 2B) by LDA (Online Supplementary Table S1). Similar results were obtained by time-series ANOVA, when focusing on the patients for whom analyses at all time points were available. Such trends are highlighted by line plot representations of selected top responding omics results (Online Supplementary Figure S1C) and are further illustrated by the heatmap representation of time series measurements across all samples at all visits (without the filter for the top significant features (Online Supplementary Figure S1D).
Pathway analyses of combined multi-omics data identified multiple sub-networks of metabolites/proteins involved in glycolysis (PKR – KPYR) representing one of the nodes with the highest betweenness centrality (Figure 2C). Additional pathways significantly affected by mitapivat included proteins of mitochondrial origin and carboxylic acids of the Krebs cycle, amino acid catabolism, especially glutaminolysis and glutathione synthesis and tryptophan/ kynurenine metabolism, nucleoside metabolism and proteasome components.
Figure 2. Heatmap and network analysis of top metabolites and lipids or proteins affected by mitapivat treatment in sickle red blood cells. (A, B) The top 50 metabolites/lipids (A) and proteins (B) (based on linear discriminant analyses) affected by mitapivat treatment are shown as a function of time (visits). A full list of these features is provided in Online Supplementary Table S1 (C) Merged data from these analyses were uploaded to Omicsnet to perform combined pathway analyses.
Mitapivat treatment significantly affects the levels of mitochondrial proteins
The most consistent and important finding in the proteome was the significant depletion of proteins of mitochondrial origin in leukodepleted RBC immediately after 2 weeks of mitapivat treatment at V2 (Figure 3A). Several components of the mitochondrial electron transport chain (e.g., ATPB)
or other key cytosolic enzymes (e.g., mitochondrial malate dehydrogenase – MDHM) with roles in apoptosis (e.g., cytochrome c – CYTC) were rapidly depleted within 2 weeks of initiating mitapivat and their levels remained low in most patients for the whole duration of the study (Figure 3B). This effect appeared to be lost for a subset of mitochondrial proteins (especially components of complex V ATP
Figure 3. Impact of mitapivat treatment on red blood cell residual mitochondrial proteins. (A) Heatmap of median values of peak areas for proteins identified despite the gene ontology classification as proteins of mitochondrial origin or localization. (B) Selected line plots for the most significantly affected members of this group through the course of the study.
synthase; Krebs cycle enzymes isocitrate dehydrogenase and fumarate hydratase, aspartate aminotransferase and mitochondrial elongation factors) by visit 12 (Figure 3A), but this could be due to the small sample size. Of note, these results could not be explained by changes in reticulocyte counts, since there were minimal changes in reticulocyte levels throughout the duration of the study (Online Supplementary Table S1; Online Supplementary Figure S2A). Correlation of omics data to complete blood counts did not highlight a significant association between proteins of mitochondrial origin and reticulocyte, platelet or white blood cell counts (Online Supplementary Figure S2B). Only the levels of MDH cytosolic (MDHC) and mitochondrial (MDHM) subunits were negatively and positively correlated with reticulocyte counts, though they ranked 315 and 317, respectively, in the list of omics correlates to this complete blood count parameter (Online Supplementary Figure S2B). Despite the drop in mitochondrial proteins immediately after the first visits, the levels of corresponding carboxylic acids were transiently elevated between visits 5-6 after 24 weeks of mitapivat treatment (Online Supplementary Figure S3A). As an internal validation of the omics results and caveat in the interpretation of the data, it is worth noting that thrombospondin 1 (TSP1) and platelet factor 4 (PLF4) ranked among the top three positive correlates to platelet counts (Online Supplementary Figure S2B).
Mitapivat significantly promotes PKR activity and boosts DPG consumption and ATP production in human sickle red blood cells in vivo
Mechanistically, mitapivat was designed to stabilize the active conformation of PKR (also known as KPYR), thus boosting late glycolysis, with concomitant consumption of DPG and generation of ATP (Figure 4A). Consistent with the proposed mechanism of mitapivat, our results confirmed the elevation of glycolytic metabolites upstream to DPG (hexose phosphate – isomers, fructose bisphosphate and glyceraldehyde 3-phosphate), concomitant with the reduction of DPG, phosphoglycerate (isomers) and phosphoenolpyruvate downstream to DPG. Of note, while our mass spectrometry-based approach does not distinguish between the 1,3- and 2,3-DPG isomers, the latter being by far the more abundant in mature RBC, the spectrometry results were in strong agreement with standard clinical measurements of 2,3-DPG via enzymatic assays (see the correlation analyses below). The end products of glycolysis in RBC, pyruvate and lactate were both significantly elevated after visits 2-3 (2-3 months’ interval after initiation of mitapivat treatment) (Figure 4B). Some of these changes were consistent with elevations in the levels of multiple glycolytic enzymes, especially after visit 10 (at 72 weeks of treatment), suggestive of additional phenomena favoring glycolysis beyond PKR activation. Of note, the levels of PKR (KPYR, Figure 4C) were not found to increase with treatment, with minor albeit significant decreases after
the first visit and levels that remained constant after that timepoint. No significant changes were observed in other PK isoforms (KPYM – pyruvate kinase M), with elevations in other glycolytic enzymes (glyceraldehyde 3-phosphate dehydrogenase, bisphosphoglycerate mutase, phosphoglycerate kinase) (Figure 4C) but not hexokinase (HK1) or KPYR/HK1 ratios (Online Supplementary Figure S1C) after visit 11. Also of note, the mass spectrometry-based metabolic measurements of increased ATP (Figure 1D) and decreased DPG (Figure 4B) were independently validated via standard CLIA-certified clinical chemistry assays (see correlation analyses below). Elevation of lactate and consumption of DPG were also consistent with the enzymatic assay-based detection of PKR activity.
Beyond glycolysis: mitapivat treatment significantly reduces sickle red blood cell acyl-carnitines, induces transient increases in pentose phosphate pathway and amino acid levels
The metabolic pathways that were most significantly affected by mitapivat other than glycolysis were acyl-carnitine and free fatty acid metabolism (Figure 5). The levels of almost all free fatty acids decreased over the course of the treatment, while those of almost all acyl-carnitines transiently increased between visits 2 and 6, to decrease again afterwards, suggesting a stabilization of the Lands cycle pathway of damaged membrane lipid remodeling (Figure 5A-C). This consideration is in part supported by the lipidomics data, showing transient elevations of oxylipins and bile acids within the same time window (Online Supplementary Figure S3C). Of note, all very-long chain (especially C20 series) acyl-carnitines showed a strong positive correlation with RBC counts, suggesting an association between RBC numbers (but not size – mean corpuscular volume and hemoglobin concentration) with the acyl-carnitine pool throughout the study (Online Supplementary Figure S2B).
Consistent with a transient membrane remodeling phenotype at visits 2-3, altered phosphoproteomics profiles were observed – especially for the structural proteins band 3 (SLC4A1) and ankyrin (ANK1), as well as functional proteins (HBA1, HBG, HBB in the heatmap in Figure 5D, HBB P.S73 in Figure 5E), transporters (the monocarboxylate transporter SLC16A1; the excitatory amino acid transporter SLC1A3) and the modulatory proteins adducin 1 and 2 (Figure 5D). However, trends diverged for different residues, with transient elevation in phospho-Y347 of SLC4A1 corresponding to decreases in the levels of the neighboring phospho-S349 residue (Figure 5E). Similar observations held true for ANK1, with elevated phospho-S1666 accompanied by parallel decreases in phospho-S1671 (Figure 5E).
In the same time window (visit 2-6 – i.e., until 6 months of treatment), all nucleotides and, even more strikingly, all free amino acids (especially glutamine, arginine, methionine) increased before decreasing again to levels comparable to
Figure 4. Impact of mitapivat on sickle red blood cell glycolysis. (A) Overview of glycolysis, showing the reaction catalyzed by red cell pyruvate kinase (PKR, Uniprot name KPYR) –the target of mitapivat. (B, C) Line plots for mass spectrometry-based measurements of peak areas of glycolytic metabolites and enzymes during the course of the study.
A
B C
pre-treatment levels by visit 10 – suggestive perhaps of altered intake from the bloodstream or increased proteolysis to remove damaged protein components, consistent with the elevation in proteasomal proteins and the increased availability of ATP to fuel energy-dependent proteasomal activity (Online Supplementary Figure S3B and S3D). In this view, it is interesting to note that after visit 2 a remarkable elevation in glutaminolysis was accompanied by a delayed
elevation in the levels of the key antioxidant reduced glutathione (GSH) only by visit 4 (Online Supplementary Figure S3E). Of note, kynurenine levels correlated with those of mitochondrial proteins, showing a depletion after visit 2, increases at visits 3 and 4, followed by a decrease and then an increase again at visit 10 in a subset of patients (driving increases of the median of the line plot in Online Supplementary Figure S3E).
Figure 5. Sickle red blood cell membrane remodeling after mitapivat treatment. (A, B) Acyl-carnitines and free fatty acids are significantly affected by mitapivat treatment. (A) Heatmap of the median values of each metabolite in these pathways across all subjects for up to 2 years of treatment (visit 12). (B) Highlight of acyl-carnitine depletion during the course of the treatment, especially free and saturated fatty acid-conjugated acyl-carnitines, (C) with an of the pathway overview. (D) Longitudinal phosphoproteomics analyses suggest a transient increase in protein phosphorylation at visits 2-3. (E) Significant changes in band 3 (SLC4A1), hemoglobin beta (HBB) and ankyrin (ANK1) were observed, with diverging trends at different S/T/Y residues).
Changes to the acyl-carnitine, free fatty acid and oxylipin pools were accompanied by widespread changes in the lipidome in almost all classes (Online Supplementary Figure S4A). Indeed, all classes but diacylglycerols increased transiently after visit 2 and decreased afterwards (similar to the trends described above for the amino acids). Of all these changes, the most notable was the transient elevation of lyosphospholipids (especially lysophosphatidylcholines– LPC) and sphingomyelins (especially SM) (Online Supplementary Figure S4).
Omics correlates to mass spectrometry-detected mitapivat levels in HbSS red blood cells
After cataloging the changes in the metabolome, lipidome and proteome over the course of the study, we then correlated omics findings to functional measurements, based on two groups of data for all 15 patients: all timepoints V1-V12 (n=150 samples) and for timepoints V1 to V6 (n=90 samples). Mass spectrometry-based measurements of mitapivat levels in RBC confirmed a strong positive association between mitapivat levels and glycolysis, with lactate and
Figure 6. Omics correlates to mass spectrometry-detected mitapivat in sickle red blood cells. (A-F) Metabolite (A-C) and protein (D-F) correlates to mitapivat levels in red blood cells from patients with sickle cell disease during a 2-year period of treatment (visits 1-12; N=6) or just within the first 6 months (N=15). Volcano plots indicate Spearman correlations (x axis) and -log10 of related P values. (C and F) Line plots for selected metabolites (C) and proteins (F), with mitapivat levels (independent variable) shown on the y axis upon 90 degree rotation of the original graph for ease of visualization.
ATP ranking among the most significant positive correlates, and DPG and phosphoenolpyruvate (PEP) as the top negative correlates, confirming the specificity of the treatment (Figure 6A-C). Mitapivat levels were positively associated with the most abundant acyl-carnitines, especially palmitoyl (AC 16:0), stearoyl (AC 18:0) and oleyl (AC 18:1), confirming a potential link between membrane lipid remodeling and mitapivat (Figure 6A, B). Similarly, mitapivat levels were negatively associated with free fatty acids and succinate. At the protein level, mitapivat was strongly negatively associated with multiple mitochondrial proteins, especially mitochondrial malate dehydrogenase (MDHM) (Figure 6D, E). On the other hand, we observed a positive association with key RBC antioxidant enzymes such as peroxiredoxin 2 (PRDX2) (Figure 6F).
Unsupervised analyses confirm a significant association between mitapivat levels, PKR activity, DPG consumption and ATP levels
Clinical measurements of DPG corrected for hematocrit were strongly negatively associated with omics-measured mitapivat and ATP levels (Figure 7A) while ATP corrected for hematocrit was positively associated with omics-measured PKR activity and mitapivat levels (Figure 7B). Clinical measurements of PKR activity also positively correlated with elevations of almost all acyl-carnitines and mitapivat (Figure 7C). Serving as an internal control for the quality of the proteomics data, KPYR (PKR protein) levels measured by mass spectrometry were identified as the top overall positive correlate to PKR levels measured in the clinical arm of the study (Figure 7D). A decrease in p50 and an increase in t50 are both anti-sickling effects; increased HbS oxygen affinity (decreased p50) indicates less very low affinity polymer in red cells, while increased t50 indicates longer delay times, allowing more cells to escape the microcirculation before HbS polymerizes and makes RBC less flexible. Elevations in the levels and activity of KPYR mass-spectrometry measurements were positively associated with increases in p50 (along with succinate, as well as spermidine and putrescine) (Figure 7E), polyamines whose levels were positively correlated to reticulocyte counts (Online Supplementary Figure S2B) and negatively associated with sickling time (t50) (Figure 7F), suggestive of functional implications of these omics changes upon mitapivat treatment.
Discussion
Clinical studies have shown that RBC in patients with SCD have elevated levels of DPG and a functional deficiency of ATP, alterations which have also been observed in more recent metabolomic studies.9-11 Recently, we reported13 that mitapivat is well-tolerated in patients with SCD, having beneficial effects on several hematologic parameters: above
all, the mean hemoglobin at 24 weeks increased significantly from baseline (mean increase: 1.38 g/dL, standard deviation: 0.88 g/dL; P<0.0001), with minor changes in fetal hemoglobin percentages.13 Here we describe results from the first multi-omics analysis of RBC from patients with SCD being treated with mitapivat therapy for up to 2 years. We confirm the specificity of mitapivat, a PK activator, using a combination of metabolomics, proteomics, lipidomics and correlation to clinical measurements of DPG and ATP levels, PK protein and activity levels, HbS oxygen affinity (p50), and sickling kinetics (t50). We leverage state-of-the-art high-throughput approaches,9,10,20-26 which we had recently used to investigate the metabolome of subjects with sickle cell trait and SCD,11,27,28 and patients with PK deficiency.7,29,30 Our measurements confirmed that the increased RBC ATP levels are sustained during a time window of 2 years in this study. Through a combination of multi-omics approaches we show that elevated ATP levels are indeed associated with elevation in pools of reduced glutathione (glutathione synthesis is an ATP-dependent process)31 and, above all, activation of the Lands cycle, a pathway that relies on acyl-carnitine pools to restore oxidatively damaged lipids. 21 These findings are interesting in that they are aligned with similar observations from metabolomics studies on dried blood spots from SCD patients on mitapivat treatment from the SCORE trial.32 In this context, it is worth noting that our data suggest the presence of a transition period in which increased ATP availability is associated with depletion of free carnitine, transient increases in lysophospholipids and declines in free fatty acids, and alterations of ATP-dependent membrane protein phosphorylation33 profiles (e.g., SLC4A1, ANK1), suggestive of ongoing membrane lipid remodeling within the (<120-day) lifespan of the sickle RBC originally exposed to the drug at the beginning of the treatment. Our results also suggest that replenishing depleted carnitine pools via exogenous supplementation (dietary or – better delivered – intravenously administered) of L-carnitine34 could be a testable intervention to complement the mitapivat regimen under evaluation in this study, at least at initiation of treatment within the first 6 months. It appears plausible that the initial lipidomics profile is a readout of existing, circulating, irreversibly damaged sickle RBC that will need to be completely removed from the bloodstream before a full representation of the benefits of increased ATP for mature erythrocytes derived from de novo erythropoiesis when already exposed to mitapivat could be manifested. In this regard, it is worth noting that very-long chain acyl-carnitine levels were associated with total RBC counts, but not reticulocyte, platelet or white blood cell counts, nor to other RBC-related parameters (mean corpuscular volume, mean corpuscular hemoglobin, hematocrit, etc.). An alternative explanation consistent with the data is that an extension in RBC lifespans upon mitapivat treatment would account for the generally lower carnitine pools, since carnitine reservoirs are consumed
Figure 7. Multi-omics findings correlate to functional readouts on red blood cells from patients with sickle cell disease on mitapivat treatment for 2 years. Correlates (Spearman) are shown for 2,3-DPG and ATP upon normalization to hematocrit (A, B), PKR activity and levels (C, D), p50 (E) and sickling time - t50 (F). Whole blood levels of ATP and 2,3-DPG were measured using a validated liquid chromatography tandem mass spectrometry assay with lower limit of quantitation at 50.0 μg/mL and converted to intracellular concentrations by dividing by the hematocrit (as a fraction).
as RBC age in the circulation.35
One of the most striking and unexpected findings was the decrease in RBC mitochondrial proteins within 2 weeks of exposure to mitapivat treatment. Although some immature reticulocytes could have been retained in the leukodepleted RBC, we utilized the same technique for leukodepletion that was used in a previous study.36 Furthermore, the mitapivat treatment was not associated with significant changes in reticulocyte counts in this study, and mitochondrial protein levels were also not significantly associated with reticulocyte counts (with the exception of MDH isoforms). Of note, we previously showed that mature RBC accounted for the major source of mitochondrial DNA (detected by polymerase chain reaction-based assay) in the leukodepleted RBC. Multiple groups have reported that mature sickle red cells abnormally retain mitochondria that contribute to sickle inflammatory pathology in various ways – as a source of cell-free mitochondrial DNA that acts as a damage-associated molecular pattern and by generation of reactive oxygen species.36-38 Functionally, we had previously suggested a link between the accumulation of mitochondrial metabolites such as succinate and the stabilization of transcription factors such as the hypoxia-inducible factor 1a and its downstream targets including the pro-inflammatory cytokine interleukin 1β 39 Succinate levels are a predictor of cardiovascular function and exercise intolerance both in murine models and patients with SCD.26 Here it is interesting to observe that early decreases of proteins of potential mitochondrial origin in the mature erythrocytes were associated with transient elevations and then decreases of carboxylic acids such as succinate. In this regard, we and others previously associated elevation of carboxylic acids, as well as kynurenine levels to activation of cGAS-STING-interferon signaling not just upon viral infection, but also upon age- or disease-related elevations of circulating mitochondrial DNA and RNA.40-42 In the context of SCD, we have recently associated RBC and plasma kynurenine levels to poor cardiorenal function and outlook in this patient population,9-11 as well as to elevation in basal levels of hemolysis and osmotic fragility in older healthy blood donors with higher body mass indices.43 Transient elevation of kynurenine in the earliest visits during the trial was followed by ultimate declines below the initial, pre-treatment levels, suggesting a potential beneficial effect of mitapivat on this pathway. There are several points to note regarding this study. First of all, here we performed a longitudinal study in SCD patients, which is more powerful than cross-sectional studies that include healthy controls, as it enables direct monitoring of the impact of mitapivat in a patient-specific fashion, while controlling for factors like the complexity of a disease such as SCD. However, similar omics studies are necessary to understand the impact of mitapivat in healthy controls, and to determine whether mitapivat-associated changes promote a phenotypic change towards a “healthy RBC” omics profile. While samples were buffy coat-depleted and filtered to remove residual platelets and leukocytes, it is not possible to
exclude cell-extrinsic effects on the RBC metabolome, which is indeed influenced by metabolite uptake from plasma, as is the case for kynurenine.43
Altogether, muti-omics investigations confirmed the direct benefits of activating PK in SCD, i.e., increasing ATP and decreasing DPG, clearly correlating with functional measurements of oxygen affinity (p50) and sickling kinetics (t50). An increase in ATP does, however, have additional beneficial effects, one of these being an almost immediate reduction in protein and metabolic markers of retention of mitochondria in the mature RBC. Other beneficial effects shown in changes in the metabolomics-lipid-proteomics profile provide insights into a potential series of pathways that warrants further mechanistic testing in the future. Our data also suggest that, on top of glycolytic metabolites, mitochondrial proteins could be a useful biomarker for monitoring response of biochemical efficacy of activating PK as a therapeutic approach in SCD.
Disclosures
The clinical arm of this study is part of a Cooperative Research and Development Agreement (CRADA) between Agios Pharmaceuticals, Inc., Cambridge, MA, USA and SLT (National Heart, Lung, and Blood Institute). Agios did not sponsor the omics analyses and did not influence any of the contents of this manuscript. The authors declare that AD’A is a founder of Omix Technologies Inc. and Altis Biosciences LLC. AD’A is also a consultant for Hemanext Inc and Macopharma Inc. AJW, SP and CH are Agios employees and shareholders. The other authors have no other conflicts to disclose.
Contributions
KL and SLT performed the clinical trial. Clinical; measurements of red blood cell 2,3-diphosphoglycerate, ATP, and pyruvate kinase protein and activity were performed by Agios. Parameters of oxygen affinity (p50) and sickling kinetics (t50) were evaluated by QL, EBD, TC, and WAE. AG, MD, and DS performed omics analyses. AD’A processed the data, generated the figures and wrote the first version of the manuscript; AD’A, SLT and WAE edited subsequent versions. The final version of the manuscript was reviewed and approved by all co-authors.
Funding
Clinical research was supported by the intramural divisions of National Heart, Lung, and Blood Institute (NHLBI) and National Institute of Diabetes and Digestive and Kidney Diseases (NIDDK) at the National Institutes of Health (NIH). AD’A was supported by funds from the NHLBI (R01HL146442, R01HL149714, R01HL148151, R01HL161004). The content is solely the responsibility of the authors and does not necessarily represent the official views of the NIH.
Data-sharing statement
All the raw data generated in this study are available in Online Supplementary Table S1.
References
1. D’Alessandro A, Earley EJ, Nemkov T, et al. Genetic polymorphisms and expression of Rhesus blood group RHCE are associated with 2,3-bisphosphoglycerate in humans at high altitude. Proc Natl Acad Sci U S A. 2024;121(1):e2315930120.
3. Hofrichter J, Ross PD, Eaton WA. Supersaturation in sickle cell hemoglobin solutions. Proc Natl Acad Sci U S A. 1976;73(9):3035-3039.
4 Goldberg MA, Husson MA, Bunn HF. Participation of hemoglobins A and F in polymerization of sickle hemoglobin. J Biol Chem. 1977;252(10):3414-3421.
5. Nemkov T, Stephenson D, Earley E, et al. Biological and genetic determinants of red blood cell glycolysis. bioRxiv. Sept 11, 2023. doi:10.1101/2023.09.11.55725 [preprint, not peer-reviewed].
6. Adebiyi MG, Manalo JM, Xia Y. Metabolomic and molecular insights into sickle cell disease and innovative therapies. Blood Adv. 2019;3(8):1347-1355.
7 Xu JZ, Conrey A, Frey I, et al. A phase 1 dose escalation study of the pyruvate kinase activator mitapivat (AG-348) in sickle cell disease. Blood. 2022;140(19):2053-2062.
8. van Dijk MJ, Rab MAE, van Oirschot BA, et al. Safety and efficacy of mitapivat, an oral pyruvate kinase activator, in sickle cell disease: a phase 2, open-label study. Am J Hematol. 2022;97(7):E226-E229.
9 Sun K, D’Alessandro A, Ahmed MH, et al. Structural and functional insight of sphingosine 1-phosphate-mediated pathogenic metabolic reprogramming in sickle cell disease. Sci Rep. 2017;7(1):15281.
10. Darghouth D, Koehl B, Madalinski G, et al. Pathophysiology of sickle cell disease is mirrored by the red blood cell metabolome. Blood. 2011;117(6):e57-e66.
11. D’Alessandro A, Nouraie SM, Zhang Y, et al. In vivo evaluation of the effect of sickle cell hemoglobin S, C and therapeutic transfusion on erythrocyte metabolism and cardiorenal dysfunction. Am J Hematol. 2023;98(7):1017-1028.
12. World Medical Association World Medical Association Declaration of Helsinki: ethical principles for medical research involving human subjects. JAMA. 2013;310(20):2191-2194.
13. Conrey A, Frey I, Asomaning N, et al. Long-term safety and efficacy of mitapivat, an oral pyruvate kinase activator, in adults with sickle cell disease: extension of a phase 1 dose escalation study. Blood. 2023;142(Suppl 1):273.
14 Beutler E, Blume KG, Kaplan JC, Löhr GW, Ramot B, Valentine WN. International Committee for Standardization in Haematology: recommended methods for red-cell enzyme analysis. Br J Haematol. 1977;35(2):331-340.
15. Beutler E. Red Cell Metabolism: A Manual of Biochemical Methods. 3rd edition. Orlando (FL): Grune & Stratton; 1984.
16. Metaferia B, Cellmer T, Dunkelberger EB, et al. Phenotypic screening of the ReFRAME drug repurposing library to discover new drugs for treating sickle cell disease. Proc Natl Acad Sci U S A. 2022;119(40):e2210779119.
17 Nemkov T, Reisz JA, Gehrke S, Hansen KC, D’Alessandro A. Highthroughput metabolomics: isocratic and gradient mass spectrometry-based methods. Methods Mol Biol. 2019;1978:13-26.
18. Reisz JA, Zheng C, D’Alessandro A, Nemkov T. Untargeted and semi-targeted lipid analysis of biological samples using mass
19 Thomas T, Stefanoni D, Dzieciatkowska M, et al. Evidence of structural protein damage and membrane lipid remodeling in red blood cells from COVID-19 patients. J Proteome Res. 2020;19(11):4455-4469.
20 Song A, Wen AQ, Wen YE, et al. p97 dysfunction underlies a loss of quality control of damaged membrane proteins and promotes oxidative stress and sickling in sickle cell disease. FASEB J. 2022;36(5):e22246.
21. Wu H, Bogdanov M, Zhang Y, et al. Hypoxia-mediated impaired erythrocyte Lands’ cycle is pathogenic for sickle cell disease. Sci Rep. 2016;6:29637.
22. Zhang Y, Dai Y, Wen J, et al. Detrimental effects of adenosine signaling in sickle cell disease. Nat Med. 2011;17(1):79-86.
23. Dembélé KC, Mintz T, Veyrat-Durebex C, et al. Metabolomic profiling of plasma and erythrocytes in sickle mice points to altered nociceptive pathways. Cells. 2020;9(6):1334.
24. Kato GJ, Steinberg MH, Gladwin MT. Intravascular hemolysis and the pathophysiology of sickle cell disease. J Clin Invest. 2017;127(3):750-760.
25. Ribeiro PR, Teixeira RdS, Souza AR, et al. Blood plasma metabolomics of children and adolescents with sickle cell anaemia treated with hydroxycarbamide: a new tool for uncovering biochemical alterations. Br J Haematol 2021;192(5):922-931.
26. Cendali FI, Nemkov T, Lisk C, et al. Metabolic correlates to critical speed in murine models of sickle cell disease. Front Physiol. 2023;14:1151268.
27. Nemkov T, Skinner S, Diaw M, et al. Plasma levels of acylcarnitines and carboxylic acids correlate with cardiovascular and kidney function in subjects with sickle cell trait. Front Physiol. 2022;13:916197.
28. D’Alessandro A, Nouraie SM, Zhang Y, et al. Metabolic signatures of cardiorenal dysfunction in plasma from sickle cell patients as a function of therapeutic transfusion and hydroxyurea treatment. Haematologica. 2023;108(12):3418-3432.
29 Glenthøj A, van Beers EJ, Al-Samkari H, et al. Mitapivat in adult patients with pyruvate kinase deficiency receiving regular transfusions (ACTIVATE-T): a multicentre, open-label, singlearm, phase 3 trial. Lancet Haematol. 2022;9(10):e724-e732.
30 Al-Samkari H, Galactéros F, Glenthøj A, et al. Mitapivat versus placebo for pyruvate kinase deficiency. N Engl J Med. 2022;386(15):1432-1442.
31. D’Alessandro A, Anastasiadi AT, Tzounakas VL, et al. Red blood cell metabolism in vivo and in vitro. Metabolites. 2023;13(7):793.
32. van Dijk MJ, van der Veen S, Rab MAE, et al. Untargeted metabolomics on dried blood spots of patients with sickle cell disease treated with the pyruvate kinase activator mitapivat. Blood. 2022;140(Suppl 1):21-23.
33. Bardyn M, Crettaz D, Rappaz B, et al. Phosphoproteomics and morphology of stored human red blood cells treated by protein-tyrosine-phosphatases inhibitor. Blood Adv. 2023;8(1):1-13.
34 Xu P, Chen C, Zhang Y, et al. Erythrocyte transglutaminase-2 combats hypoxia and chronic kidney disease by promoting oxygen delivery and carnitine homeostasis. Cell Metab. 2022;34(2):299-316.e6.
35. D’Alessandro A, Key A, Amireault P, et al. Genetic regulation of carnitine metabolism controls lipid damage repair mechanisms
and hemolytic propensity of human red blood cells during aging in vivo and in vitro. Blood. 2023;142(Suppl 1):4032.
36. Tumburu L, Ghosh-Choudhary S, Seifuddin FT, et al. Circulating mitochondrial DNA is a proinflammatory DAMP in sickle cell disease. Blood. 2021;137(22):3116-3126.
37. Moriconi C, Dzieciatkowska M, Roy M, et al. Retention of functional mitochondria in mature red blood cells from patients with sickle cell disease. Br J Haematol. 2022;198(3):574-586.
38. Jagadeeswaran R, Lenny H, Vazquez B, et al. The abnormal presence of mitochondria in circulating red blood cells cause an increased oxygen consumption rate, ROS generation and hemolysis in patients with sickle cell disease. Blood. 2017;130(Suppl 1):2237.
39 Tannahill GM, Curtis AM, Adamik J, et al. Succinate is an inflammatory signal that induces IL-1β through HIF-1a. Nature.
2013;496(7444):238-242.
40 Zecchini V, Paupe V, Herranz-Montoya I, et al. Fumarate induces vesicular release of mtDNA to drive innate immunity. Nature. 2023;615(7952):499-506.
41. Giordano AMS, Luciani M, Gatto F, et al. DNA damage contributes to neurotoxic inflammation in Aicardi-Goutières syndrome astrocytes. J Exp Med. 2022;219(4):e20211121.
42. Unali G, Crivicich G, Pagani I, et al. Interferon-inducible phospholipids govern IFITM3-dependent endosomal antiviral immunity. EMBO J. 2023;42(10):e112234.
43. Nemkov T, Stephenson D, Erickson C, et al. Regulation of kynurenine metabolism by blood donor genetics and biology impacts red cell hemolysis in vitro and in vivo. Blood. 2024;143(5):456-472.
Molecular responses in decitabine- and decitabine/ venetoclax-treated patients with acute myeloid leukemia and myelodysplastic syndromes
In order to determine the prognostic significance of molecular response, we performed serial exome sequencing in patients with acute myeloid leukemia (AML) or myelodysplastic syndrome (MDS) treated with single-agent decitabine or decitabine/venetoclax. We found that both the rate and depth of mutation clearance correlated with clinical responses and with overall survival and that molecular results correlated between bone marrow (BM) and peripheral blood samples (PB). In addition, we note that decitabine/venetoclax treatment was associated with more rapid and deeper molecular clearance versus single-agent decitabine. Collectively, these data suggest that mutation clearance may provide a complementary endpoint in hypomethylating (HMA)-based trials of AML and MDS patients. We used serial exome sequencing to quantify molecular responses among 95 patients who were treated at Washington University (10-day decitabine; clinicaltrials gov. Identifier: NCT01687400; N=64)1 or at MD Anderson (10-day decitabine + venetoclax; clinicaltrials gov. Identifier: NCT03404193; N=31).2,3 All studies were approved by respective Institutional Review Boards and were done in compliance with the Declaration of Helsinki. Patients were selected based on available serial samples and prior sequencing for analysis. Cohorts were enriched for patients with MDS or secondary AML (sAML) to determine whether, in these cytopenic cases, mutations might still be detectable in the PB. The initial decitabine/venetoclax cases available for serial analysis had been enrolled early in that study, and as such, had been enriched for relapsed/refractory cases, based on study preferences at the time. Thus, the two sequenced cohorts were not clinically well-balanced; the decitabine-treated cohort was enriched for MDS patients, de novo AML, and better performance status, with trends toward less adverse risk karyotypes (Table 1).
Sequencing was completed over multiple years (2014-2019) and available exome capture reagents and Illumina platforms were iteratively adapted. However, somatic mutation calling was performed uniformly for all 95 cases with standard pipelines at Washington University (https://github. com/genome/analysis-workflows) and with independent analysis in BM and PB.
Subclonal mutation organization was manually curated for each patient to identify variants associated with the “founding clone” and the primary sequencing data for founding clone variants were manually reviewed to verify mutation calling. The founding clone was defined by manual review of each case and the rate of founding clone clearance was
calculated by applying a linear regression model on time points representing the induction of treatment and the first, maximal reduction in variant allele frequency (VAF) (Figure 1A, B; representing cases with molecular stable disease vs. response).
Not all cases presented with simple linear kinetics. In patients with molecular stable disease, we observed some degree of variance in the absolute founding clone VAF at different time points (Online Supplementary Figure S1A-C), perhaps related to variance in sample quality in different collections. Responding decitabine patients often exhibited stable founding clone VAF after cycle 1 or 2 (~day 28 and day 54), followed by subsequent reduction (Online Supplementary Figure S1D, F), whereas responding decitabine/venetoclax patients more commonly responded after the first cycle (Online Supplementary Figure S1G, I). Other groups have observed persistence of DNMT3A, ASXL1, or TET2 mutations with elimination of other clonal variants following cytotoxic chemotherapy.4 We observed only two of 25 cases with discordant responses involving DNMT3A (both treated with decitabine/venetoclax), one of 16 involving TET2, and none with ASXL1 (0/25 cases).
Concurrently collected BM and PB samples were available from 38 patients that could be directly compared. The founding clone VAF at day 0 (linear regression Y-axis intercept) correlated between BM and PB samples (Figure 1C). Outlier cases, with reduced PB day 0 founding clone VAF compared with BM, frequently were associated with >50% lymphocytes in the PB, suggestive of a dilution effect by non-malignant cells, reflecting prior results.5 Similar results were observed for MDS and sAML patients (Online Supplementary Figure S2A). The rate and depth of founding clone clearance correlated between BM and PB samples in the total cohort (Figure 1D, E), and also correlated with morphologic responses (Figure 1F, G). Similar results were observed in the subset of MDS and sAML patients (Online Supplementary Figure S2B, C), suggesting that PB molecular responses could be feasibly determined even in this group of patients. Because of clinical ambiguity associated with morphologic leukemia-free state (mLFS) and partial response (PR), we repeated the analysis excluding these patients and noted retained correlation (P<0.01 and P<0.001, respectively for rate and depth). Differences were also examined between CR and CRi/mLFS within de novo AML patients, a subset where clinical responses could be more uniform; we observed no difference in molecular responses between these two groups (Online Supplementary
Continued on following page.
Figure 1. Molecular responses assessed by exome sequencing in decitabine-treated patients. (A, B) Representative calculations of the rate and depth of mutation clearance using linear regression. Black dots: founding clone mutations. Blue dashed lines: mutations not included in founding clone. Red line: linear regression. Blue line: 95% confidence interval for linear regression. Mutations in recurrent myeloid gene panel are labeled when present. DNMT3A and TP53 mutations would be associated with the founding clone if copy number adjusted. When calculating founding clone clearance, we did not include variants that required copy number adjustment. (C-E) Comparison of molecular tumor burden and responses measured using bone marrow (BM) versus peripheral blood (PB) substrates (N=38). R2 calculation performed separately for cases with <50% PB lymphocytes (lymphs) (black) and for >50% PB lymphs (red). (F, G) Comparison of molecular versus clinical responses (N=95). Comparison with Mann-Whitney test. BM results were used unless BM was unavailable and then PB results were used for calculation. (H) Proportion of cases with 0 or more founding clone mutations within a myeloid panel of 40 genes. ***P<0.001. VAF: variant allele frequency; CR: complete response; CRi: complete response with incomplete count recovery; mCR: morphologic complete response; mLFS: morphologic leukemia-free state; PR: partial response; SD: stable disease; PD: disease progression.
Figure S2F, G).
In order to determine how often a myeloid-focused clinical gene panel would be adequate to identify and track founding clone responses, we performed down-sample analysis to a panel of 40 recurrently-mutated myeloid genes used clinically at Washington University. No myeloid mutations were observed in seven of 81 (9%) and five of 52 (10%) BM- or PB-detected founding clones, respectively (Figure 1H). Of note, in six BM cases and two PB cases, the single detected myeloid mutation was associated with some form of loss of heterozygosity and would require copy number adjustment if tracked in isolation. Within this cohort, treatment correlated with founding clone reduction (decitabine/venetoclax vs. single-agent decitabine; Figure 2A). We observed similar results when restricting analysis to data collected at the end of cycle 1 (day 21-35; Figure 2B) or limiting analysis to PB samples (Figure 2C). Likewise, the depth of founding clone reduction was lower in the decitabine/venetoclax cohort, although the difference was more moderate (Figure 2D), which may be due to the limit of sensitivity with exome sequencing. We compared the rate of founding clone reduction between patients based on recurrent myeloid mutations. Within the single-agent decitabine cohort, TP53-associated cases displayed an increased rate of founding clone clearance compared with mutations in other genes, consistent with prior report (Figure 2E).1 Within the decitabine/venetoclax cohort, IDH1/2 and NRAS-associated cases were associated with an increased rate of founding clone clearance compared with TP53-mutant cases (Figure 2F). Between treatment cohorts, cases with mutations in IDH1/2, and NRAS were associated with increased rate of founding clone clearance in the decitabine/venetoclax versus decitabine cohort, with no difference in TP53-associated founding clones (Figure 2G), similar to prior subgroup analyses.2,6,7 Overall survival was similar between the two treatment cohorts (Figure 2F), although in other datasets, HMA/venetoclax combinations have been associated with improved survival versus single-agent HMA.3,6 Additional variables correlated with overall survival in the total sequenced cohort, including age, performance status, PB white blood cell count (WBC), disease, and transplant (Online Supplementary Figure S3). These variables were not well matched
between the treatment cohorts (Table 1) and may explain the difference in overall survival.
Within the total 95 patients, the rate and depth of founding clone reduction correlated with overall survival (Figure 2I, J). Qualitatively, the depth of clearance was associated with an early separation in survival, whereas the rate of clearance appeared to correlate with late survival differences. A multivariate analysis was performed that included pre treatment factors associated with univariate significance (age, performance status, WBC, disease). Each of these factors remained significant in multivariate analysis, as did the rate (P<0.005) and depth (P<0.014) of founding clone mutation clearance.
Reflecting differences in molecular clearance trends associated with different treatments, overall survival was prolonged in patients with IDH1/2 mutations treated with decitabine/venetoclax (P<0.001) but not decitabine (P=0.91), whereas overall survival was shorter in patients with TP53 mutations treated with decitabine/venetoclax (P<0.001) but not in patients treated with decitabine (P=0.61), and shorter in patients with NRAS mutations treated with decitabine (P<0.005) but not in patients treated with decitabine/venetoclax (P=0.67) (Online Supplementary Figure S4).
Successful AML clinical trials have been challenging and have required large numbers of patients enrolled at hundreds of international centers to identify survival advantages in phase III studies.6,8,9 As we seek to build on the current HMA/venetoclax backbones, we are faced with the statistical requirement of sample sizes necessary (i.e., several hundreds of patients). In order to accurately identify new combinations that augment activity in smaller studies it will be necessary to improve or reconsider end-point statistics. Molecular responses (comparisons of the rate and depth of founding clone clearance) provide median comparisons in the place of proportions comparisons (morphologic response and overall survival). They also provide an early analysis of anti-leukemic activity (end of cycle 1) that may isolate anti-leukemic effects from other clinical confounders (infections, declining performance status, treatment discontinuation, transplant, etc) and increase the proportion of evaluable patients on study. As such, the rate of clonal responses is emerging as a biomarker in AML,10 MDS,11-13 and Philadelphia-positive acute and chronic leukemias.14,15
Figure 2. Comparison of molecular responses between treatment cohorts. (A-D) Comparison of rate and depth of molecular responses between decitabine/venetoclax (Dac/ven) and single-agent Dac treatment cohorts. Mann-Whitney comparisons. (E-G) Subgroup analysis of molecular response (rate of founding clone reduction) by treatment cohort (genes included with at least 5 cases). ANOVA with Kruskal-Wallis test. (H-J) Correlation of treatment and molecular responses with overall survival. Cohorts in (I) and (J) are separated based on median. Log-rank tests. *P<0.05; **P<0.01; ***P<0.001. VAF: variant allele frequency.
Likewise, the depth of measurable residual disease is being increasingly explored as a biomarker in AML,4,16,17 although how and what is measured remains controversial. Understandably, the application of molecular endpoints may be therapy-specific; differentiation agents (e.g., retinoids and inhibitors of IDH, menin, and DHODH) may have slow mutation clearance kinetics as cells mature but persist,
and appropriate adaptation of molecular endpoints may be required.
We note tradeoffs between the use of PB versus BM and exome sequencing versus gene panel sequencing approaches. Like others, we note high concordance between PB and BM mutation VAF.5,18,19 In principle, PB collections can occur more often, allowing for a more granular analysis of
Table 1. Characteristics of sequenced patients.
Characteristics
(1)
Median fold sequencing coverage at somatic variants
response kinetics than BM. Also, PB avoids complications with hemodilute aspirates and collections are less likely to be declined or missed. However, PB is not as sensitive as BM; we observed dilution effects in the day 0 VAF in cases with >50% PB lymphocytes and in several cases PB exhibited greater depth of clearance than BM, suggestive of overestimates of clonal clearance (Figure 1E). Nevertheless, the rate of founding clonal reduction appeared largely preserved in PB versus BM (Figure 1D), suggesting utility in PB to detect the rate of clonal clearance. Likewise, gene-panel sequencing is cheaper and bioinformatically more straightforward than exome sequencing, but leaves the founding clone undetected in ~10% of patients. In summary, we observed that within HMA-treated cohorts, molecular responses correlated with clinical responses and survival, and that results from BM and PB were well correlated, in both AML and MDS patients. These observations support the future use of molecular end-points as adjuncts in clinical trials, and raise the question of
whether clonal clearance might be a sufficiently early and independent median-based measure of anti-leukemic activity to successfully identify promising new regimens using smaller cohorts.
Authors
Agata Gruszczynska,1 Abhishek Maiti,2 Christopher A. Miller,1 Sai Mukund Ramakrishnan,1 Daniel C. Link,1 Geoffrey L. Uy,1 Allegra A. Petti,3 Kala Hayes,2 Courtney D. DiNardo,2 Farhad Ravandi,2 Timothy J. Ley,1 David H. Spencer,4 Feng Gao,5 Marina Y. Konopleva6 and John S. Welch1°
1Department of Medicine, Division of Oncology, Washington University School of Medicine, St. Louis, MI; 2Department of Leukemia, MD Anderson Cancer Center, Houston, TX; 3Department of Neurosurgery, Washington University School of Medicine, St. Louis, MI; 4Department of Pathology, Washington University School of Medicine, St. Louis,
MO; 5Department of Surgery, Division of Public Health Sciences, Washington University School of Medicine, St. Louis, MI and 6Albert Einstein College of Medicine, Bronx, NY , USA
°Current address: A2 Biotherapeutics, Agoura Hills, CA, USA
AM discloses research funding from Chimeric Therapeutics, Lin Biosciences, Astex Pharmaceuticals and Inspirna Therapeutics; and other support from Cero Therapeutics and Electra Therapeutics. GLU discloses advisory boards with Jazz pharmaceuticals. CDD discloses research support to institution from Abbvie, Astex, Beigene, BMS, Foghorn, Schrodinger and Servier; consulting/advisory boards with Abbvie, BMS, Genentech, GenMab, GSK, Immunogen, Notable Labs, Rigel, Schrodinger and Servier; is supported by the LLS Scholar in Clinical Research Award. DHS discloses consulting for Wugen. MYK discloses research funding from AbbVie, Allogene, AstraZeneca, Genentech, Gilead, ImmunoGen, MEI Pharma, Precision, Rafael, Sanofi and Stemline; consulting/advisory boards with AbbVie, AstraZeneca, Auxenion, Bakx, Boehringer, Dark Blue Therapeutics, F. Hoffman La-Roche, Genentech, Gilead, Janssen,
References
1. Welch JS, Petti AA, Miller CA, et al. TP53 and decitabine in acute myeloid leukemia and myelodysplastic Syndromes. N Engl J Med. 2016;375(21):2023-2036.
2. Kim K, Maiti A, Loghavi S, et al. Outcomes of TP53-mutant acute myeloid leukemia with decitabine and venetoclax. Cancer. 2021;127(20):3772-3781.
3. DiNardo CD, Maiti A, Rausch CR, et al. 10-day decitabine with venetoclax for newly diagnosed intensive chemotherapy ineligible, and relapsed or refractory acute myeloid leukaemia: a single-centre, phase 2 trial. Lancet Haematol. 2020;7(10):e724-e736.
4. Jongen-Lavrencic M, Grob T, Hanekamp D, et al. Molecular minimal residual disease in acute myeloid leukemia. N Engl J Med. 2018;378(13):1189-1199.
5. Duncavage EJ, Uy GL, Petti AA, et al. Mutational landscape and response are conserved in peripheral blood of AML and MDS patients during decitabine therapy. Blood. 2017;129(10):1397-1401.
6. DiNardo CD, Jonas BA, Pullarkat V, et al. Azacitidine and venetoclax in previously untreated acute myeloid leukemia. N
Legend, MEI Pharma, Redona, Sanofi, Sellas, Stemline and Vincerx; stock options/royalties form Reata Pharmaceutical (IP); patents from Novartis, Eli Lilly and Reata Pharmaceutical. JSW is employed at A2 Biotherapeutics. All other authors have no conflicts of interest to disclose.
Contributions
The clinical trials that provided samples for these analyses were designed and executed by JSW, CDD, MYK, AM, DCL, GLU, KH, FR and TJL. Data analysis was provided by AG, CAM, SMR, AAP, DHS, FG, MYK and JSW. The manuscript was written by the AG and JSW. The investigators performed the data analysis. All authors reviewed the manuscript.
Acknowledgments
We thank Megan Haney and Jeff King for assistance in patient enrollment, sample collection, and data processing; Sharon Heath, Nicole Helton, and the Tissue Procurement Core for assistance in sample collection and processing; the McDonnell Genome Institute at Washington University in St. Louis for support in sequencing; and Anh Vu for help with mutation manual review.
Funding
The study was supported by grants from the National Cancer Institute (CA235622, to MYK and JSW), the Specialized Program of Research Excellence in AML of the National Cancer Institute (P50 CA171963, to DCL), the Genomics of AML Program Project (P01 CA101937, to TJL), and the Evans MDS Foundation (Discovery Grant, to JSW).
Data-sharing statement
Available sequencing data accessible via dbGaP, study ID phs000159.
Engl J Med. 2020;383(7):617-629.
7. Lachowiez CA, Loghavi S, Furudate K, et al. Impact of splicing mutations in acute myeloid leukemia treated with hypomethylating agents combined with venetoclax. Blood Adv. 2021;5(8):2173-2183.
8. Zavras PD, Shastri A, Goldfinger M, Verma AK, Saunthararajah Y. Clinical trials assessing hypomethylating agents combined with other therapies: causes for failure and potential solutions. Clin Cancer Res. 2021;27(24):6653-6661.
9 Stone RM, Mandrekar SJ, Sanford BL, et al. Midostaurin plus chemotherapy for acute myeloid leukemia with a FLT3 Mutation. N Engl J Med. 2017;377(5):454-464.
10 Gianfaldoni G, Mannelli F, Intermesoli T, et al. Early peripheral clearance of leukemia-associated immunophenotypes in AML: centralized analysis of a randomized trial. Blood Adv. 2020;4(2):301-311.
11. Yun S, Geyer SM, Komrokji RS, et al. Prognostic significance of serial molecular annotation in myelodysplastic syndromes (MDS) and secondary acute myeloid leukemia (sAML). Leukemia. 2021;35(4):1145-1155.
12. Hunter AM, Komrokji RS, Yun S, et al. Baseline and serial molecular profiling predicts outcomes with hypomethylating agents in myelodysplastic syndromes. Blood Adv. 2021;5(4):1017-1028.
13. Illman J, Kytola S, Myllymaki M, Ebeling F. Clonal dynamics using droplet digital polymerase chain reaction in peripheral blood predicts treatment responses in myelodysplastic syndrome. Haematologica. 2023;108(7):1951-1956.
14. Harrington P, Kizilors A, de Lavallade H. The role of early molecular response in the management of chronic phase CML. Curr Hematol Malig Rep. 2017;12(2):79-84.
15. Yilmaz M, Kantarjian H, Wang X, et al. The early achievement of measurable residual disease negativity in the treatment of adults with Philadelphia-negative B-cell acute lymphoblastic leukemia is a strong predictor for survival. Am J Hematol.
2020;95(2):144-150.
16. Gui G, Hourigan CS. Measurable residual disease assessment as a surrogate marker in new drug development in acute myeloid leukemia. Cancer J. 2022;28(1):73-77.
17 Colmenares R, Alvarez N, Barrio S, Martinez-Lopez J, Ayala R. The minimal residual disease using liquid biopsies in hematological malignancies. Cancers (Basel). 2022;14(5):1310.
18. Jansko-Gadermeir B, Leisch M, Gassner FJ, et al. Myeloid NGS analyses of paired samples from bone marrow and peripheral blood yield concordant results: a prospective cohort analysis of the AGMT Study Group. Cancers (Basel). 2023;15(8):2305.
19 Lucas F, Michaels PD, Wang D, Kim AS. Mutational analysis of hematologic neoplasms in 164 paired peripheral blood and bone marrow samples by next-generation sequencing. Blood Adv. 2020;4(18):4362-4365.
Sotatercept for anemia of myelofibrosis: a phase II investigator-initiated study
Anemia (hemoglobin <10 g/dL) is common in myelofibrosis (MF), present in about a third of patients at diagnosis and eventually developing in all patients. The Janus kinase 1/2 (JAK1/2) inhibitor ruxolitinib ameliorates splenomegaly and symptoms of MF and prolongs survival;1 however, on-target anemia from JAK2 inhibition, especially pronounced in the first 12-24 weeks of therapy, is a significant problem. Anemia may be the most common cause of ruxolitinib discontinuation,2 and frequently results in dose reduction. Spleen responses to ruxolitinib are dose-dependent and correlate with survival.3,4 Thus, counteracting ruxolitinib-induced anemia remains an important goal.
Very recently, the JAK1/2 and activin receptor type 1 (ACVR1) inhibitor, momelotinib, was approved in the US for anemic patients with intermediate/high-risk myelofibrosis, based on the SIMPLIFY-1 and MOMENTUM trials.5,6
Therapies currently used specifically for anemia of MF include corticosteroids, danazol, erythroid-stimulating agents (ESA) and immunomodulatory drugs, but responses are infrequent and often short-lived. Sotatercept (formerly ACE-011, Acceleron Pharma, Cambridge, MA, now Merck, Kenilworth, NJ), a novel fusion protein, is a first-in-class, activin receptor type IIA (ActRIIA) “ligand trap” that sequesters MF bone marrow-derived TGF-β superfamily ligands (such as Activin A and growth and differentiation factor 11) that inhibit terminal erythropoiesis via Smad signaling upon ActRIIA binding.7,8 Sotatercept demonstrated substantial efficacy in anemic patients with β-thalassemia and myelodysplastic syndromes (MDS).9,10
This was a phase II, open-label, single-institution, investigator-initiated trial (clinicaltrials gov. Identifier: NCT01712308).
Adults (≥18 years) with primary MF (PMF) or post polycythemia vera/essential thrombocythemia myelofibrosis (post-PV/ET) MF were eligible if they were anemic (i.e., hemoglobin [Hg]b <10 g/dL sustained over ≥84 days preceding study entry without red blood cell [RBC] transfusions, or Hgb <10 g/dL with occasional transfusions but not RBC-transfusion dependant [TD] per International Working Group-Myeloproliferative Neoplasms Research and Treatment [IWG-MRT] criteria), or RBC-TD per IWG-MRT criteria.11 Sotatercept was administered subcutaneously every 3 weeks. All monotherapy patients after the first patient, who received 0.3 mg/kg, received 0.75 mg/kg or 1 mg/kg. Upon early demonstration of activity, a combination cohort was added: patients must have been on ruxolitinib for ≥6 months with a stable dose for the preceding ≥8 weeks. The sotatercept dose chosen for this cohort was 0.75 mg/kg, as most responses in the monotherapy cohort at the time had been observed at this dose. MF-directed therapies
within 2 weeks of sotatercept initiation were not permitted, except ruxolitinib in the combination cohort. Patients with uncontrolled hypertension were excluded. Additional eligibility criteria are listed in the study protocol, available as a supplement. Sotatercept was held for Hgb values ≥11.5 g/ dL (resumed once the Hgb level was <11 g/dL). Concomitant use of erythroid stimulating agents or any other MF-directed therapy (except ruxolitinib in the combination cohort) was not permitted. The study was approved by the MD Anderson Cancer Center Institutional Review Board and was conducted according to the principles of the Declaration of Helsinki. All participants provided written informed consent. The study was supported by Celgene Corporation (now Bristol Myers Squibb) through drug supply and funding. BMS/Celgene had no role in the study design, data collection, analysis, interpretation, or manuscript writing.
The primary endpoint of the study was the anemia response rate, a composite of hemoglobin response in non-TD patients, and achievement of transfusion independance (TI) in RBC-TD patients. Hemoglobin response was defined as an increase from baseline Hgb level of ≥1.5 g/dL sustained for ≥84 days, without RBC transfusions (Gale criteria).12 The baseline Hgb in anemic patients was the lowest Hgb level in the 84 days preceding study entry. In patients who were RBC-TD at enrollment, TI was defined as no RBC transfusions in any “rolling” 84-day interval during the treatment period. Secondary endpoints included duration of and time to response. All patients who received at least one dose of sotatercept were evaluable for safety.
Patients had to remain on study for ≥84 days to be efficacy-evaluable.
Online Supplementary Figure S1 shows the patient disposition. A total of 63 patients were enrolled and 56 were treated. One patient received a dose of 0.3 mg/kg for 6 cycles and is not considered further. Thirty-four patients received sotatercept monotherapy (16 at 0.75 mg/kg/dose and 18 at 1 mg/kg/dose), and 21 received sotatercept (0.75 mg/kg/dose) “added” to a stable dose of ruxolitinib. Baseline characteristics appear in Table 1. Five patients in the monotherapy cohort were treatment-naïve. Prior therapies in the remainder are available in Online Supplementary Table S1. In the monotherapy cohort, 17 patients each were “anemic” and RBC-TD at study entry. In the combination cohort, 15 patients were “anemic” and six were RBC-TD at study entry. All patients are currently off-study. The study was terminated after the commercial supporter ended investigational drug supply in December 2021. Four patients, two in each cohort, were receiving sotatercept on the study at that point.
Eight of 27 evaluable (30%) patients in the monotherapy cohort responded. Five were anemia responses (of 13 evaluable) and three, TI responses (of 14 evaluable). Six responses (4 anemia and 2 TI) occurred at the 0.75 mg/kg dose, and two (1 anemia and 1 TI) at the 1 mg/kg dose. Of the seven unevaluable patients, three had Hgb increases of ≥1.5 g/dL from baseline but came off study due to hypertension deemed related to sotatercept (N=1), or a decision to proceed to allogeneic hematopoietic cell transplantation (allo-HCT) (N=2). The median number of cycles of sotatercept was 6 (range, 1-73), and median time on-study was 4.4 (range, 0.7-75.3) months. The median time to (onset of)
Table 1. Characteristics of the patients at baseline.
Characteristics
response was 19 (range, 1-22) days, and the median duration of response was 23.3 (range, 3.9-74.6) months. Reasons for discontinuation of sotatercept included lack or loss of response (N=14), MF progression in other aspects, e.g., splenic progression (N=6), allo-HCT (N=4), logistical/travel-related (N=3), patient decision (N=2), study termination (N=2), transformation to AML (N=1), hypertension deemed related to sotatercept (N=1) and medical complications unrelated to sotatercept (N=1).
In the combination cohort, there were six responses ( of 19 evaluable patients, 32%). All were hemoglobin responses (of 14 evaluable); there were no TI responses (of 5 evaluable).
*Driver mutation status was not known with certainty in 1 patient in the monotherapy cohort as CALR mutational testing had not been performed. MF: myelofibrosis; Hgb: hemoglobin; BID: twice daily; DIPSS: Dynamic International Prognostic Scoring System; N/A: not applicable; PET: post-essential thrombocythemia; PMF: primary myelofibrosis; PPV: post-polycythemia vera; RBC: red blood cell; Rux: ruxolitinib; VAF: variant allele fraction.
Table 2. Adverse events* at least possibly related to sotatercept.
*The numbers represent the number of occurrences of each adverse event (not necessarily the number of patients experiencing them).
Adverse events were graded according to the National Cancer Institute’s Common Terminology Criteria for Adverse Events (NCI CTCAE) version 3.0. ALT: alanine aminotransferase; AST: aspartate aminotransferase; UMACR: urine microalbumin/creatinine ratio.
The median number of cycles of sotatercept was 8 (range, 2-52), and the median time on-study was 5.5 (range, 1.657.1) months. The median time to (onset of) response was 14 (range, 6-147) days, and the median response duration was 20.9 (range, 3.7-56.8) months. Reasons for discontinuation of sotatercept included lack or loss of response (N=8), allo-HCT (N=4), MF progression in other aspects (N=2), logistical/travel-related (N=2), study termination (N=2), transition to hospice (N=1), patient decision (N=1) and loss of insurance (N=1).
Several responders in both cohorts required sotatercept doses to be held per protocol for Hgb levels ≥11.5 g/dL, with resumption of dosing when the Hgb level was <11 g/dL. Eight responders, five in the monotherapy cohort and three in the combination cohort, experienced multiple instances of this phenomenon. However, we were not able to identify a molecular biomarker or clinical factor predictive of these robust and durable responses to sotatercept.
We did not observe any consistent effects of sotatercept on other disease-related parameters, such as spleen size, symptoms, leukocyte or platelet counts, bone marrow fibrosis grade and JAK2 V617F variant allele frequency. No responder in either cohort had a detectable SF3B1 mutation at study entry; however, spliceosome genes were
not sequenced as part of our institutional next-generation sequencing panel until April 2017. No responder had bone marrow ring sideroblasts (RS) at study entry.
Sotatercept was well-tolerated. Table 2 lists the adverse events (AE) felt to at least possibly be related to sotatercept. No grade 4 or 5 AE occurred. Seven patients experienced grade 3 hypertension on the study, not in the context of high Hgb levels. Hypertension (all grades) occurred in 20% of patients. Pain in the extremities (muscle, bones, joints) on the days following injection of sotatercept was common, occurring in 40%; however, most of these events were grade 1 or 2 in severity, with only two patients reporting grade 3 limb pain. There were no on-study deaths.
In conclusion, our study adds to a growing body of evidence supporting the safety and clinical activity of the activin receptor ligand traps in anemic patients with myeloid malignancies. Although sotatercept is currently being developed for the treatment of pulmonary arterial hypertension,13 luspatercept, an ActRIIB ligand trap, is approved for the treatment of anemia in patients with lower-risk MDS with RS, as well as those with myelodysplastic/myeloproliferative neoplasm with RS and thrombocytosis. In a phase II study in 95 patients with MF and anemia, luspatercept led to a 26.3% rate of TI during the primary treatment period (24 weeks) in the cohort of RBC-TD patients receiving a stable dose of ruxolitinib (N=38), and 50% of the patients in this cohort experienced at least halving of their transfusion burden during this time. These results have led to an ongoing, phase III, placebo-controlled trial of luspatercept (INDEPENDENCE™) in RBC-TD MF patients on a stable dose of a JAK inhibitor.14 Early data on elritercept, an investigational, modified ActRIIA ligand trap are promising, with some “trifactor” (hematopoiesis, spleen, and symptoms) responses observed.15
Authors
Prithviraj Bose, Lucia Masarova, Naveen Pemmaraju, Sharon D. Bledsoe, Naval G. Daver, Elias J. Jabbour, Tapan M. Kadia, Zeev Estrov, Steven M. Kornblau, Michael Andreeff, Nitin Jain, Jorge E. Cortes, Gautam Borthakur, Yesid Alvarado, Mary Ann Richie, Mackenzie H. Dobbins, Selene A. McCrackin, Lingsha Zhou, Sherry A. Pierce, Xuemei Wang, Allison M. Pike, Guillermo Garcia-Manero, Hagop M. Kantarjian and Srdan Verstovsek°
The University of Texas MD Anderson Cancer Center, Houston, TX, USA
°SV current address: Kartos Therapeutics, Redwood City, CA, USA °JEC current address: Georgia Cancer Center, Augusta, GA, USA
Correspondence: P. BOSE - pbose@mdanderson.org
https://doi.org/10.3324/haematol.2023.284078
Received: August 14, 2023.
Accepted: March 26, 2024. Early view: April 4, 2024.
PB discloses research support to his institution from BMS, Incyte, CTI, Morphosys, Kartos, Telios, Ionis, Disc, Blueprint, Cogent, Geron, Janssen, and Sumitomo; and honoraria/consulting fees from Incyte, BMS, CTI, GSK, Abbvie, Morphosys, Karyopharm, Pharma Essentia, Blueprint, Cogent, Novartis, Jubilant, and Morphic. HK discloses research grants to his institution from AbbVie, Amgen, Ascentage, BMS, Daiichi-Sankyo, Immunogen, Jazz, and Novartis; and honoraria/ consulting fees from AbbVie, Amgen, Amphista, Ascentage, Astellas, Biologix, Curis, Ipsen Biopharmaceuticals, KAHR Medical, Labcorp, Novartis, Pfizer, Shenzhen Target Rx, Stemline, and Takeda. TK discloses research support to his institution from AbbVie, Amgen, Ascentage, Astella, Astex, AstraZeneca, BMS, Celgene, Cellenkos, Cyclacel, Delta-Fly Pharma, Genfleet, Genentech, Glycomimetrics, Iterion, Janssen, Jazz, Pfizer, Pulmotect, Regeneron, and Sellas; and honoraria/consulting fees from Abbvie, Agios, Daiichi Sankyo, Genentech, Genzyme, Jazz, Liberum, Novartis, Pfizer, PinotBio, Pulmotect, and Sanofi-Aventis. JC discloses support to his institution from Abbvie and Actuate. EJJ discloses research support to his institution, as well as honoraria/consulting fees from Abbvie, Adaptive Biotech, Amgen, Bristol Meyers Squib, Ascentage, Genentech, Novartis, Pfizer, and Takeda. NP discloses research support to his institution from the US Department of Defense, other financial or non-financial interests in Dan’s House of Hope, and honoraria/consulting fees from Abbvie, Aplastic Anemia and MDS International Foundation, Aptitude Health, Astellas Pharma US, Blueprint Medicines, BMS, CancerNet, CareDx, Celgene, Cimeio Therapeutics AG, Clearview Healthcare Partners, CTI BioPharma, Curio Science, DAVA Oncology, EUSA Pharma, Harborside Press, Imedex, Immunogen, Intellisphere, Magdalen Medical Publishing, Medscape, Menarini Group, NeoPharm, Novartis Pharmaceuticals,
References
1. Verstovsek S, Gotlib J, Mesa RA, et al. Long-term survival in patients treated with ruxolitinib for myelofibrosis: COMFORT-I and -II pooled analyses. J Hematol Oncol. 2017;10(1):156.
2. Kuykendall AT, Shah S, Talati C, et al. Between a rux and a hard place: evaluating salvage treatment and outcomes in myelofibrosis after ruxolitinib discontinuation. Ann. Hematol. 2018;97(3):436-441.
3. Verstovsek S, Kantarjian HM, Estrov Z, et al. Long-term outcomes of 107 patients with myelofibrosis receiving JAK1/ JAK2 inhibitor ruxolitinib: survival advantage in comparison to matched historical controls. Blood. 2012;120(6):1202-1209.
4 Vannucchi AM, Kantarjian HM, Kiladjian JJ, et al. A pooled analysis of overall survival in COMFORT-I and COMFORT-II, 2 randomized phase III trials of ruxolitinib for the treatment of myelofibrosis. Haematologica. 2015;100(9):1139-1145.
OncLive, Pacylex, Patient Power, PeerView Institute for Medical Education, Pharma Essentia and Physicians’ Education Resource. MA discloses research support to his institution from Daiichi Sankyo, Breast Cancer Research Foundation, Astra Zeneca, Oxford Biomedical UK, Eterna, Senti Bio, Pinot Bio and Syndax; payments for advisory board or data safety monitoring board participation from Cancer UK, Leukemia and Lymphoma Society, Aptose, German Research Council, National Cancer Institute, CLL Foundation and Eterna; and stocks or stock options from Reata, Aptose, Eutropics, Senti Bio and Chimerix. NGD discloses research support to his institution from Daiichi-Sankyo, Bristol- Meyers Squibb, Pfizer, Gilead, Servier, Genentech, Astellas, AbbVie, ImmunoGen, Amgen, Trillium, Hanmi, Trovagene, FATE Therapeutics, Novimmune, Glycomimetics, and KITE; and consulting fees from Daichii-Sankyo, Bristol-Meyers Squibb, Pfizer, Gilead, Servier, Genentech, Astellas, AbbVie, ImmunoGen, Amgen, Trillium, Arog, Novartis, Jazz, Celgene, Syndax, Shattuck Labs, Agios, KITE and Stemline/Menarini. All other authors have no conflicts of interest to disclose.
Contributions
PB performed data collection, analysis, interpretation and wrote the manuscript. SV designed the study and critically reviewed the manuscript for important intellectual content. XW helped design the study. LM, NP, NGD, EJJ, TMK, ZEV, SMK, MA, NJ, JEC, GB, YA, GGM and HK enrolled patients. LZ and SAP collected data. PB, LZ and SAP directly accessed and verified the underlying data. SDB, MAR, MHD, SAM and AMP helped collect data and conducted the trial on a day-to-day basis. PB supervised the overall conduct of the trial.
Funding
The study was supported by Celgene Corporation (now BMS) and in part, by the MD Anderson Cancer Center support grant P30 CA016672 from the National Cancer Institute (National Institutes of Health).
Data-sharing statement
Clinical data are available upon request from the corresponding author.
5. Mesa RA, Kiladjian JJ, Catalano JV, et al. SIMPLIFY-1: a phase III randomized trial of momelotinib versus ruxolitinib in Janus kinase inhibitor-naïve patients with myelofibrosis. J Clin Oncol. 2017;35(34):3844-3850.
6. Verstovsek S, Gerds AT, Vannucchi AM, et al. Momelotinib versus danazol in symptomatic patients with anaemia and myelofibrosis (MOMENTUM): results from an international, double-blind, randomised, controlled phase 3 study. Lancet. 2023;401(10373):269-280.
7. Iancu-Rubin C, Mosoyan G, Wang J, Kraus T, Sung V, Hoffman R. Stromal cell-mediated inhibition of erythropoiesis can be attenuated by Sotatercept (ACE-011), an activin receptor type II ligand trap. Exp Haematol 2013;41(2):155-166.
8. Carrancio S, Markovics J, Wong P, et al. An activin receptor IIA ligand trap promotes erythropoiesis resulting in a rapid
induction of red blood cells and haemoglobin. Br J Haematol. 2014;165(6):870-882.
9. Cappellini MD, Porter J, Origa R, et al. Sotatercept, a novel transforming growth factor β ligand trap, improves anemia in β-thalassemia: a phase II, open-label, dose-finding study. Haematologica. 2019;104(3):477-484.
10 Komrokji R, Garcia-Manero G, Ades L, et al. Sotatercept with long-term extension for the treatment of anaemia in patients with lower-risk myelodysplastic syndromes: a phase 2, doseranging trial. Lancet Haematol. 2018;5(2):e63-e72.
11. Tefferi A, Cervantes F, Mesa R, et al. Revised response criteria for myelofibrosis: International Working GroupMyeloproliferative Neoplasms Research and Treatment (IWGMRT) & European LeukemiaNet (ELN) consensus report.
Blood. 2013;122(8):1395-1398.
12. Gale RP, Barosi G, Barbui T, et al. What are RBC-transfusiondependence and - independence? Leuk Res. 2011;35(1):8-11.
13. Hoeper MM, Badesch DB, Ghofrani HA, et al. Phase 3 trial of sotatercept for treatment of pulmonary arterial hypertension. N Engl J Med. 2023;388:1478-1490.
14 Gerds AT, Harrison C, Kiladjian J-J, et al. Safety and efficacy of luspatercept for the treatment of anemia in patients with myelofibrosis: results from the ACE-536-MF-001 study. J Clin Oncol. 2023;41(Suppl 16):7016.
15. Harrison CN, Ross DM, Chee LCY, et al. Modulation of TGF-β superfamily signaling by KER-050 demonstrated potential to treat myelofibrosis and mitigate ruxolitinib-associated cytopenia. Blood. 2023;142(Suppl 1):3185.
Low-dose non-steroidal anti-inflammatory drugs: a promising approach for the treatment of symptomatic bone marrow failure in Ghosal hematodiaphyseal dysplasia
Ghosal hematodiaphyseal dysplasia (GHD) is a rare autosomal recessive disease characterized by severe anemia and painful long-bone diaphyseal cortical endosteal hypertrophy.1 Some 40 cases have been reported, mostly in childhood. The disease results from biallelic deleterious variants in the TBXAS1 gene, disrupting TXAS protein function, causing thromboxane A2 pathway blockage and arachidonic acid metabolite accumulation.2,3 Standard care involves systemic corticosteroids, effectively alleviating hematopoietic and bone disorders. However, patients often require long-term corticosteroids, leading to iatrogenic complications. Based on the thromboxane A2 pathway dysregulation, Brown et al 4 reported for the first time the good efficacy of cyclo-oxygenase (COX) 1 and 2 inhibition with non-steroidal anti-inflammatory drugs (NSAID) in two patients. Based on a similar hypothesis, four other non-related patients with GHD were treated in France from June 2019 with low-dose NSAID.
The French bone-marrow failure observatory (study’s ethic committee approval CLEA-2023-#312) was consulted to identify patients with biallelic pathogenic TBXAS1 variants, who underwent treatment with low doses of aspirin or NSAID.
During screening, four unrelated patients were identified among 1,857 patients included in the observatory. The characteristics of these patients and their disease are detailed in Table 1. Our four patients are male, with no medical history other than GHD. Patients #1, #3 and #4 had severe transfusion-dependent anemia in early childhood. Patients #1 and #3 achieved spontaneous red blood cell (RBC) transfusion independence without treatment for over 20 years. Patient #4 required long-lasting steroid treatment, to which he had a partial response and required occasional RBC transfusions. Patient #2 had no hematologic issues until the age of 24 years.
In the months preceding treatment with NSAID, all patients had severe anemia (median hemoglobin level 6.8 g/dL; range, 5.6-8.0 g/dL) and thrombocytopenia (median platelet count 85x109/L; range, 67-110x109/L), with normal neutrophil count, except for patient #4 (neutrophil count 0.7x10⁹/L) and presented mild inflammation (median C-reactive protein 31 mg/L; range, 12.8-65 mg/L). Clinically, three were reported to have moderate obesity (patients #1, #2 and #3) and one had hepatosplenomegaly (patient #4). All had increased cortical density with diaphyseal involvement on bone X-rays, with a history of associated long-bone pain without skeletal deformity. Bone marrow aspirations failed,
and biopsies revealed hypoplasia of the three myeloid lineages with dysmyelopoietic features, edema and fibrosis (Online Supplementary Figure S1). Investigations to rule out a myeloid malignancy were normal and genetic analyses for classical inherited bone marrow failure syndromes (Table 1) reported only the TBXAS1 variants. The genetic diagnosis was made at a median time of 15.5 years (range, 4-34 years) after the first occurrence of symptomatic anemia. Patients #3 and #4 had received high-dose steroids with a good response, but treatment was discontinued, due to relapse, after suspension and high-dose steroid requirement, respectively. Patient #1 had received hydrocortisone therapy at a dose of 100 mg/day with a weak response. Before treatment with aspirin, patients #1, #2 and #4 required monthly RBC transfusions for over a year, while patient #3 was promptly treated with aspirin after the discontinuation of corticosteroids, due to worsening anemia, before requiring RBC transfusions. None of the patients required platelet transfusions.
The median age of the patients at the start of treatment with NSAID was 26 years (range, 23-40 years), corresponding to a median delay of 21 months (range, 1-48 months) from the first transfused anemia episode for patient #2, or from the relapse of anemia for the others. Aspirin was initiated at a dose of 75 mg/day, except for patient #3, who received 3 g/day (rheumatological dosage for rapid relief of bone pain).
All patients experienced a rapid hematologic response (Figure 1), with the hemoglobin level reaching >100 g/L without transfusion at a median of 43 days (range, 10-121 days), and were transfusion-independent at 1 month with resolution of bone pain. Their platelet counts exceeded 100x109/L in less than 4 months. The neutrophil count of patient #4 improved to over 1.0x10⁹/L. The biological inflammatory syndrome initially resolved in all patients, concomitantly with improvement of the hematologic parameters. During follow-up, patient #2 suddenly stopped the treatment for 2 months, resulting in a relapse of his anemia and inflammatory syndrome. A new complete hematologic response occurred 1 month after resumption of treatment, indicating an aspirin-dependence profile.
Patient #4 also relapsed on aspirin 75 mg/day, with the reappearance of an inflammatory syndrome followed by anemia. As suggested by Brown et al., 4 patients may have different residual TBXAS1 enzyme activity, and in some cases require a higher dose of aspirin. Therefore, a dose of 500 mg/day was introduced; the current follow-up is too
Table 1. Patients’ characteristics and main outcomes.
IBMF panel screening* No additional mutation No additional mutation Not performed** No additional mutation
Bone marrow biopsy
Richness
Medullary fibrosis***
Affected hematologic lineages
Dysplasia
Radiological bone involvementb/ Bone pain
Very severe hypoplasia
Grade 1 with interstitial edema
Severe damage to all three lines
Signs of dysmegakaryopoiesis and dyserythropoiesis
Severe hypoplasia, richness: 20%
Grade 1 with interstitial edema
Severe damage to all three lines
Signs of dysmegakaryopoiesis and dyserythropoiesis
Very severe hypoplasia, richness: grade 1
Grade 3 + osteosclerosis
Severe damage to all three lines
Severe hypoplasia, richness: grade 1-2
Grade 3
Severe damage to all three lines
Signs of dysmegakaryopoiesis and dyserythropoiesis No dysplastic features described
Clinical and biological parameters before treatment with NSAID
Continued on following page.
Persistent transfusion
Persistent hematologic responsee at 6 months Yes
Short relapse post-aspirin cessation, with a second complete response obtained 1 month after reintroduction
Yes
Loss of response with RBC transfusion required under treatment at 75 mg/ day
Hematologic response at the end of
aNo family relationship between the patients could be established on examination. bBone abnormality was defined as long-bone X-rays revealing an increased cortical density with diaphyseal involvement, often associated with bone pain. cHemoglobin level response is defined as a hemoglobin level ≥100 g/L without transfusion in the preceding month. dPlatelet level response is defined as a platelet level ≥100x109/L without transfusion in the preceding month. eHematologic response is defined as an association of hemoglobin level and platelet level responses, with no bone pain related to the disease. It is counted as persistent if no relapse episode has been recorded since it was obtained.
*The screening panel for innate bone marrow failure (IBMF) syndromes includes ARID2, ASXL1, ASXL2, ATRX, BCOR, BCORL1, BRAF, BRCA1, BRCA2, BRCC3, CALR, CBL, CEBPA, CHEK2, CLPB, CREBBP, CSF3R, CSNK1A1, CTCF, CUX1, DDX41, DNMT3A, ELANE, EP300, ERCC6L2, ETNK1, ETV6, EZH2, FLT3, GATA2, HRAS, IDH1, IDH2, IKZF5, IRF1, JAK2, JAK3, KDM5A, KDM6A, KIT, KMT2A/MLL, KMT2D/MLL2, KRAS, LUC7L2, MBD4, MECOM, MPL, MPO, MYC, NF1, NPM1, NRAS, PDS5B, PHF6, PPM1D, PRPF8, PTEN, PTPN11, RAD21, RIT1, RUNX1, SAMD9, SAMD9L, SBDS, SETBP1, SF1, SF3B1, SMC1A, SMC3, SRP72, SRSF2, STAG2, TET2, TERC, TERT, TP53, U2AF1, U2AF2, WT1, ZNF687, ZRSR2, and TBX1S1. TBXAS1 is currently included in the IBMF panel, but was also studied specifically in our patients. **For patient #3, given that his brother had confirmed Ghosal hematodiaphyseal dysplasia, a targeted investigation was carried out with confirmation of the TBXAS1 mutation and the use of a restricted panel to screen for myeloid disorders. *** The bone marrow biopsies from patients #1 and #2 were reassessed by two specialized hematopathologists who reported that the fibrosis observed is unusual with, notably, interstitial edema. NSAID: non-steroidal anti-inflammatory drugs; GHD: Ghosal hematodiaphyseal dysplasia; PNH: paroxysmal nocturnal hemoglobinuria; IBMF: innate bone marrow failure; N of RBC units: number of red blood cell units; N/A: not available; CRP: C-reactive protein.
short to assess response. Patient #4 was the only patient with a chronic disease evolution since childhood, associated with the emergence of steroid resistance and clinical hepatosplenomegaly, probably related to extensive bone marrow fibrosis. Another consideration, if improvement stalls despite dose escalation, is that the prolonged illness may have severely affected the bone marrow, hindering effective hematopoiesis through treatment.
With a median follow-up of 15.5 months (range, 9.5-52 months), patients #1, #2 and #3 sustained a complete hematologic response (on aspirin 75 mg/day for patients #1 and #2, and on a reduced dose of 2 g/month for patient #3, due to persistent remission).
Considering the spontaneous hematologic improvement that occurred during childhood in patients #1 and #3, we looked for a correlation between the phenotype and TBXAS1 genotype. Analysis of our patients and genetically confirmed cases in the literature3-10 (Online Supplementary Table S1) revealed three phenotypes, summarized in Table 2.
Firstly, there was a group of hematologically asymptomatic carriers, or with at worse moderate anemia, with no reported history of RBC transfusions (group 1, n=5). These
subjects were diagnosed at a median age of 16 years, during family screening performed because of a symptomatic relative. Although they all had abnormal bone X-rays consistent with GHD, no bone symptoms were reported. Interestingly, most were female (80%).
The second phenotypic group (group 2, n=4) comprised patients with childhood onset of severe anemia, necessitating RBC transfusions (discovered at a median of 25 months), who achieved a spontaneous hematologic improvement after a mean time of 3.5 years (range, 1-6.5), allowing RBC transfusions to be stopped. Three patients relapsed after a prolonged hematologically asymptomatic period (12.5 to 28 years), presenting with severe transfused anemia with clinical and radiological bone manifestations and a biological inflammatory syndrome.
The last group (group 3, n=14) included patients with early severe and persistent/long-lasting transfusion-dependent anemia (median age at onset of 2 years), associated with thrombocytopenia and leukopenia in most cases. They all had radiological bone involvement, with half of them experiencing bone pain. Twelve patients were treated with high-dose corticosteroids as first-line therapy (the other 2 received NSAID as first-line treatment), with a good
Figure 1. The main hematologic and inflammatory biological parameters during treatment of the four patients with Ghosal hematodiaphyseal dysplasia. (A-D) Hematological results. (E-H) Inflammatory results. The standards for a positive determination were set at >5 mg/L for C-reactive protein, represented by a dashed red line, and for fibrinogen at >4g/L, represented by the dashed blue line. The shadowed background represents the evolution of results under aspirin treatment. The green color indicates the initial aspirin dose, while the change in color corresponds to a change in dose. For patient #4, inflammatory results were missing at relapse and at the end of follow-up. RBC: red blood cell; CRP: C-reactive protein.
hematologic response in each. However, only 25% of these patients were able to stop steroids without relapse (data available for 8 patients with a short follow-up).
No genotype/phenotype correlations were identified (Online Supplementary Table S2). Inter- and intra-familial heterogeneity suggest unknown factors affecting phenotype, such as, possibly, female sex, which was more frequent in asymptomatic patients (group 1: 80% vs. groups 2+3: 20%). In groups 2 and 3 the appearance of anemia coincided with a biological inflammatory syndrome, which may reflect disease activity. External factors, such as infections, might also trigger disease worsening by generating inflammation and stimulating the arachidonic acid pathway, exacerbating metabolic problems caused by TBXAS1 mutations, and contributing to clinical heterogeneity. However, grouping patients is challenging, due to the heterogeneity of the population and the reported data, but also due to the lack of information on follow-up for asymptomatic patients and the impact of treatment on spontaneous outcome of the disease.
Our four GHD patients, treated with low-dose aspirin, confirm this treatment’s efficacy with three sustained hematologic responses. Our last patient, despite an initial response, relapsed and is currently being treated with a higher dose. Hypotheses to explain the loss of response were non-compliance, drug interaction and a more severe
enzymatic defect. Considering the treatment’s excellent tolerability, especially its lower infection risk compared with corticosteroids, low-dose NSAID appear promising. However, data on the efficacy of NSAID in correcting radiological bone lesions are lacking, unlike steroid treatment, for which some pediatric studies have reported improvements. Our review of the literature highlights the clinical heterogeneity of GHD, including the possibility of long-lasting spontaneous hematologic improvement in childhood, which has been rarely reported so far. In most of these patients, anemia required RBC transfusions over a prolonged period, supporting treatment with low-dose NSAID as soon as transfusions are required. No genotypic or clinical predictive factors were identified to predict a spontaneous improvement, which would have helped us to discuss the discontinuation of treatment in some patients. For others, such as patient #2, who relapsed quickly after treatment was discontinued, suggesting NSAID dependency, lifelong treatment would seem necessary.
Lastly, our study highlights the importance of considering GHD in adults, as well as in children presenting with severe anemia and thrombocytopenia, especially in the case of abnormally tough bones, independently of myelofibrosis or radiological findings. Given the low toxicity of aspirin, TBXAS1 mutation should be added to the panel for inherited bone marrow failure screening, especially if transplantation
Asymptomatic means no hematologic disorders. *Age at first symptoms or at diagnosis if asymptomatic. **Not reported for three patients at first symptoms but all of them had bone pain at relapse. ***Two patients had pathological bone radiography at diagnosis, the two other patients had pathological bone radiography at relapse (no data for first episode), all patients have a history of pathological bone radiography typical of Ghosal hematodiaphyseal dysplasia during their lifetime. RBC: red blood cell; N: number of patients; yrs: years; mths: months; M: male; F: female.
Table 2. Subgroup phenotype description.
is considered. Unlike other inherited bone marrow failure syndromes, no evolution to myeloid malignancy has been reported. While most reported cases involved children without long-term follow-up, five patients (four from our study) provided reassuring follow-up data into their fourth decade.
Authors
Jonathan Bordat,1 Felipe Suarez,2-4 Valérie Cormier-Daire,2,5 Regis Peffault de Latour,1,2,6 Jean Soulier,2,6,7 Veronique Meignin,8 Mathilde Doyard,5 Lise Larcher,2,6,7 Stephane Vanderbecken9 and Flore Sicre de Fontbrune1,6
1Department of Hematology and Bone Marrow Transplantation, Saint-Louis Hospital, Assistance Publique-Hôpitaux de Paris, Paris; 2Paris Cité University, Paris; 3Imagine Institute, INSERM UMR 1163, Laboratory of Molecular Mechanisms of Hematologic Disorders and Therapeutic Implications, Necker-Enfants Malades University Hospital, Assistance Publique-Hôpitaux de Paris, Paris; 4Adult Hematology, Necker-Enfants Malades University Hospital, Assistance Publique-Hôpitaux de Paris, Paris; 5French Reference Center for Skeletal Dysplasia, INSERM UMR 1163, Imagine Institute, Necker Enfants Malades University Hospital, Assistance Publique-Hôpitaux de Paris, Paris; 6French Reference Center for Aplastic Anemia, Saint-Louis Hospital, Assistance Publique-Hôpitaux de Paris, Paris; 7Laboratory of Hematology, Saint-Louis Hospital, Assistance Publique-Hôpitaux de Paris, Paris; 8Department of Pathology, SaintLouis Hospital, Assistance Publique-Hôpitaux de Paris, Paris and 9Hemophilia Treatment Center, University Hospital of Réunion,
References
1. Ghosal SP. An unusual bone dysplasia. Indian J Pediatr. 1957;24(12):359-368.
2. Isidor B, Dagoneau N, Huber C, et al. A gene responsible for Ghosal hemato-diaphyseal dysplasia maps to chromosome 7q33-34. Hum Genet. 2007;121(2):269-273.
3. Geneviève D, Proulle V, Isidor B, et al. Thromboxane synthase mutations in an increased bone density disorder (Ghosal syndrome). Nat Genet. 2008;40(3):284-286.
4 Brown TJ, Barrett NA, Meng H, et al. Non-steroidal antiinflammatory drugs as a targeted therapy for bone marrow failure in Ghosal hematodiaphyseal dysplasia. Blood. 2023;141(13):1553-1559.
5. Jeevan A, Doyard M, Kabra M, Daire VC, Gupta N. Ghosal type hematodiaphyseal dysplasia. Indian Pediatr. 2016;53(4):347-348.
6. Joy P, Yoganathan S, Korula S, et al. Ghosal hematodiaphyseal dysplasia and response to corticosteroid therapy. Am J Med
Réunion Island, France. Correspondence:
J. BORDAT - jonathan.bordat@aphp.fr
F. S. DE FONTBRUNE - flore.sicre-de-fontbrune@aphp.fr
JB and FSdF designed the study, collected the patients and wrote the original version of the manuscript. FSdF, FS, RPdL, and SV took care of the patients and enrolled them in the RIME database. VCD, JS, MD, and LL were responsible for molecular data analysis and performed the genetic diagnosis. VM provided data about bone marrow biopsies and pictures for Online Supplementary Figure S1 All authors contributed to reviewing and editing the manuscript and approved the final version.
Data-sharing statement
The datasets analyzed during the current study are available from the corresponding author upon reasonable request.
Genet A. 2021;185(2):596-599.
7 Kim SY, Ing A, Gong S, Yap KL, Bhat R. Novel compound heterozygous variants of TBXAS1 presenting with Ghosal hematodiaphyseal dysplasia treated with steroids. Mol Genet Genomic Med. 2021;9(3):e1494.
8. Sharma R, Sierra Potchanant E, Schwartz JE, Nalepa G. Chronic steroid-response pancytopenia and increased bone density due to thromboxane synthase deficiency. Pediatr Blood Cancer. 2018;65(1):e26777.
9 Sudhakar M, Sharma M, Kandasamy S, Gummadi A, Rawat A, Vignesh P. Novel TBXAS1 variants in two Indian children with Ghosal hematodiaphyseal dysplasia: a concise report. Eur J Med Genet. 2022;65(5):104498.
10. Selina A, Kandagaddala M, Madhuri V. A recurrent biallelic pathogenic variant in TBXAS1 gene causing Ghosal hematodiaphyseal dysplasia. Indian J Pediatr. 2021;88(4):381-382.
Differential activation of basal and IL-7-induced PI3K/Akt/ mTOR and JAK/STAT5 signaling distinguishes pediatric from adult acute lymphoblastic leukemia
The age distribution of cases of B-cell acute lymphoblastic leukemia (B-ALL) is bimodal, peaking in childhood at 2-5 years of age and in adults after the age of 50, with children displaying significantly better prognosis than adults. Signaling pathways triggered by leukemia cell-autonomous lesions or by extracellular cues, such as interleukin-7 (IL7), have been shown to play a pivotal role in B-ALL biology and response to treatment.1-3 However, whether age-related differences exist in signaling pathway activation between pediatric and adult cases of B-ALL has not been scrutinized. Here, we characterized the basal and IL-7-induced PI3K/Akt/ mTOR and JAK/STAT5 signaling profile of pediatric patients age (range, 1-14 years) and adult patients age, (range, 29-75 years), using phospho-specific flow cytometry. We show that there are clear age-related differences in signaling activation that correlate with sensitivity to pathway-specific small molecule inhibitors. Our results underline the importance of considering the age group when predicting potential clinical benefits of signaling targeted therapies. IL-7, a bone marrow stroma-produced cytokine, is vital for normal B-cell development.4-6 However, IL-7 can also stimulate the proliferation of B-ALL cells3 and aberrant IL-7/IL-7R-mediated signaling contributes to malignant transformation of developing B cells.6 IL7R gain-of-function mutations, which are able to initiate B-ALL in mice,1,2 occur in up to 3% of human B-ALL cases.7 IL7R-driven leukemias display activation of JAK/STAT and PI3K/Akt/mTOR signaling and are sensitive to pharmacological inhibitors of these pathways.1
The genomic landscape of ALL has been shown to vary with age, with favorable and unfavorable cytogenetics being less and more frequent, respectively, in adults.7 Moreover, adult patients have an increased incidence of extramedullary disease with central nervous system involvement.8 However, whether these age-related differences correlate with the activation of key pro-tumoral signaling pathways has been poorly explored, despite the knowledge that signaling inhibitors can have considerable clinical impact, as demonstrated by the use of tyrosine kinase inhibitors in Philadelphia chromosome-positive (Ph+) B-ALL cases.9 The PI3K/Akt/mTOR pathway is frequently activated in pediatric B-ALL and associated with a poor response to chemotherapy.10 Constitutive hyperactivation of this signaling axis was also observed in adult cases of B-ALL.11 Thus, we questioned whether there are differences in activation of PI3K/Akt/mTOR signaling between the two age groups. Initially, we compared samples from children (N=40; median
age, 4 years; range, 1-14 years) and adults (N=21; median age, 56 years; range, 29-75 years) collected at diagnosis after informed consent and under ethical approval of the Instituto Português de Oncologia de Lisboa and Hospital Santo António dos Capuchos, Lisbon, Portugal (see Online Supplementary Table S1 – Exploratory cohort, for information about the patients). Flow cytometry analyses of Akt (S473) and S6 (S235/236) phosphorylation levels showed that PI3K/ Akt/mTOR pathway activation was higher in pediatric cases than in adult cases (Figure 1A, B). Given these age-related differences, we next analyzed the impact of the pan-PI3K inhibitor buparlisib (BKM120) on leukemia cell viability ex vivo. Pharmacological inhibition of the PI3K signaling pathway had a clear impact on leukemia cell survival in both age groups, although pediatric samples were significantly more sensitive to buparlisib (Figure 1D, E), in agreement with higher PI3K signaling activation and suggestive of stronger reliance of childhood ALL than adult ALL on this pathway. In contrast, there were no significant differences between childhood and adult B-ALL regarding JAK/STAT5 pathway activation (Figure 1C). This is remarkable, since the frequency of Ph+ cases (which are known to display STAT5 activation) was lower in children (2 of 18 cases, 11%) than in adults (5 of 13 analyzed, 38.4%). Interestingly, childhood Ph+ samples had levels of STAT5 phosphorylation similar to those of the remaining samples, whereas Ph+ adult cases were among those with highest phospho-STAT5 (Figure 1C), confirming our previous observations.11 These findings suggest that other genetic alterations leading to high STAT5 phosphorylation, similar to BCR::ABL1 in Ph+ ALL, may be more frequent in pediatric cases. However, such alterations, known as BCR::ABL1/Ph-like alterations (e.g. CRLF2 rearrangements or mutations in IL7R or in Janus kinases) are more frequent in adults.
We, therefore, speculated that B-ALL cells from pediatric patients may be more sensitive to IL-7 than those from adult cases, resulting in levels of STAT5 activation similar to those arising from BCR::ABL1 or other cell-autonomous lesions. In agreement with our hypothesis, we found that IL-7 promoted the viability of pediatric leukemias to a higher extent than that of adult cases (Figure 2A). We then sought age-related differences in IL-7Ra surface expression as a potential cause for increased IL-7 responsiveness in pediatric cases. However, childhood and adult samples displayed similar IL-7Ra levels (Figure 2B). This notwithstanding, we questioned whether signaling responses could differentiate the two age groups. IL-7 stimulation did not promote
Figure 1. Higher PI3K/Akt/mTOR signaling pathway activation in pediatric B-cell acute lymphoblastic leukemia is associated with greater sensitivity to the PI3K inhibitor buparlisib. (A-C) Levels of phosphorylated Akt S473 (A), S6 S235/236 (B) and STAT5 Y694 (C) in bone marrow cells from pediatric and adult B-cell acute lymphoblastic leukemia (B-ALL) samples were quantified by flow cytometry analysis using phospho-specific antibodies. Points represent individual samples and horizontal bars denote the median. In (C), Philadelphia chromosome-positive patients are indicated by triangles. The mean ± standard of error of mean (SEM) is shown in parentheses. The statistical analysis was performed using a two-tailed Mann-Whitney test. (D, E) B-ALL samples were cultured for 72 h in medium alone or with buparlisib (5 μM), collected and stained with annexin V and 7-aminoactinomycin D (7AAD) for cell viability assessment by flow cytometry. (D) The viability index, calculated as the ratio of viability of cells cultured with buparlisib over that of cells cultured in medium alone, is indicated. Points represent individual samples, and horizontal bars denote mean ± SEM. Statistical analysis was performed using an unpaired t test with Welch correction. (E) Annexin V by 7-AAD dot plots of two representative cases. The percentages of live (bottom left), early apoptotic (bottom right), and late apoptotic/ necrotic (top right) cells are indicated in the respective quadrants.
phosphorylation of Akt or S6 in adult patients. In contrast, pediatric B-ALL samples showed Akt and S6 activation in response to IL-7 in 54% and 34.7% of the cases, respectively (Figure 2C, D, F and Table 1). STAT5 phosphorylation was upregulated by IL-7 in 50% of adult cases as opposed to 83% of pediatric cases (Figure 2E, F and Table 1). Within the responsive cases, the degree of STAT5 phosphorylation was clearly higher in childhood B-ALL samples (Figure 2E). Targeting STAT5 or STAT5 target genes, such as BCL2 and PIM, was shown to reduce leukemia burden in mice and induce apoptosis of newly diagnosed and tyrosine kinase
Table 1. Frequency of IL-7-induced phosphorylation of Akt (S473), S6 (S235/236) and STAT5 (Y694) in samples from pediatric and adult patients.
Response to interleukin-7*
N of positive cases/N of tested cases (%)
pAkt (S473) pS6 (S235/236) pSTAT5 (Y694)
Pediatric 13/24 (54) 8/23 (34.7) 20/24 (83)
Adult 0/6 (0) 0/6 (0) 3/6 (50)
*Fold-change values >1.25 were considered as a positive response.
Figure 2. Samples from children with B-cell acute lymphoblastic leukemia have stronger signaling and functional responses to IL-7, and are more sensitive to STAT5 inhibition in the presence of IL-7, than samples from adults. (A) Bone marrow cells from pediatric and adult patients with B-cell acute lymphoblastic leukemia (B-ALL) were cultured for 72 h in the presence or absence of 10 ng/mL IL-7, stained with annexin V and 7-aminoactinomycin D (7-AAD) and cell viability was determined by flow cytometry analysis. The viability index, calculated as the ratio between viable cells in medium with IL-7 over medium alone, is indicated.
Continued on following page.
Bars represent individual samples, horizontal dashed lines and the shaded area represent lack of response, defined as ≤1.25-fold change. The mean ± standard error of mean (SEM) is shown in parentheses. Statistical analysis was performed using a two-tailed Mann-Whitney test. (B) Cell surface levels of IL-7Ra were determined by flow cytometry analysis. Points represent individual samples, horizontal bars denote the mean ± SEM. Statistical analysis was performed using an unpaired t test with Welch correction. (C-E) B-ALL samples were stimulated with 50 ng/mL IL-7 for 30 min and the levels of phospho-Akt S473 (C), phospho-S6 S235/236 (D) and phospho-STAT5 Y694 (E) were analyzed by flow cytometry. (F) Flow cytometry dot plots representative of data in (C-E). IL-7-induced phosphorylation levels are expressed as the ratio of the stimulated over the unstimulated conditions. Bars represent individual samples, horizontal dashed lines and the shaded area represent lack of response, defined as ≤1.25-fold change. The mean ± SEM is shown in parentheses. Statistical analysis was performed using a two-tailed Mann-Whitney test. (G, H) B-ALL samples were cultured for 72 h in the presence of 10 ng/mL IL-7 alone or with a STAT5 inhibitor (STAT5i, 200 μM), stained with annexin V and 7-AAD and cell viability determined by flow cytometry. (G) The viability index, calculated as the ratio of viability of cells cultured with IL-7 plus STAT5i over that of cells cultured with IL-7 alone, is indicated. Points represent individual samples, and horizontal bars denote the mean ± SEM. Statistical analysis was performed using an unpaired t test with Welch correction. (H) Annexin V by 7-AAD dot plots of two representative cases. The percentages of live (bottom left), early apoptotic (bottom right), and late apoptotic/necrotic (top right) cells are indicated in the respective quadrants.
inhibitor-resistant Ph+ ALL patient-derived cells.12 Thus, we incubated samples from both age groups with a STAT5 inhibitor (N9-((4-oxo-4H-chromen-3-yl)methylene) nicotinohydrazide) in the presence of IL-7 for 72 h. B-ALL pediatric patient samples were more sensitive to STAT5 inhibition than adult patient samples as shown by a greater decrease in cell viability (Figure 2G, H).
Adult and pediatric B-ALL cases differ in oncogenic subtype composition. For example, Ph+ ALL is more frequent in adults, whereas ETV6::RUNX1 cases are common in children and rare in adults.13 To ensure that our observations were not substantially affected by age-related ALL subtype biases, we first removed the Ph+ cases from our analyses. Exclusion of pediatric and adult Ph+ cases did not alter our initial conclusions (Online Supplementary Figure S1). We next evaluated a confirmatory cohort of pediatric and adult French patients who were classified as having Ph+, ETV6::RUNX1 or KMT2A/MLL-rearranged B-ALL. Samples were obtained, after informed consent and ethical approval, from patients at Hôpital Saint-Louis and Hôpital Robert Debré, Paris, France (Online Supplementary Table S1 – Confirmatory cohort). Analysis of the three genetic subgroups altogether (Online Supplementary Figure S2A) or comparing non-Ph+ cases (KMT2A/MLL-rearranged and ETV6::RUNX1) versus Ph+ cases (Online Supplementary Figure S2B) confirmed the lack of differences in basal STAT5 phosphorylation levels between children and adults found in the Portuguese cohort of patients (Figure 1C). Moreover, we also confirmed that pediatric B-ALL samples respond better to IL-7 (Online Supplementary Figure S2C), irrespective of subtype (Online Supplementary Figure S2D). Our findings may reflect a combination of normal age-related differences and leukemia peculiarities. Mouse old B-cell progenitors have lower phospho-Akt and phospho-STAT5 than younger counterparts,14 and, in vitro, respond poorly to IL-7 but not to other growth factors.15 Notably, the lesser fitness resulting from impaired IL-7-mediated signaling in aging B cells precursors sets the stage for the development of Ph+ leukemias due to increased competitiveness of Ph+ B cells, which are selected because Bcr-Abl constitutive signaling compensates for the impaired IL-7-mediated sig-
naling that occurs in aged precursors.14 This contrasts with young B-lymphoid progenitors, in which IL-7 responsiveness is high and Bcr-Abl provides a much smaller competitive advantage.14 If these features are conserved in humans, they suggest that the lesser ability of adult B-ALL cells to respond to IL-7 ex vivo, as we report herein, may at least partially reflect a normal aging process. Moreover, the higher frequency of Ph+ cases in adult B-ALL may, to some extent, reflect the decreased ability of adult B-cell precursors to respond to IL-7.
Overall, our studies expose age-related differences in PI3K/ Akt/mTOR and JAK/STAT5 signaling pathway activation in B-ALL that are associated with differential sensitivity to signaling-specific inhibitors. These results may have important implications for clinical decision-making using targeted therapies, as pediatric B-ALL patients will likely benefit more from PI3K pathway inhibitors and anti-IL-7R signaling therapies than adult cases. Evidently, larger studies are warranted to extend and integrate the age-associated findings on signaling activation presented here within the full scope of karyotypic, genetic, epigenetic and transcriptomic features that characterize the distinct B-ALL subtypes.
Authors
Marta B. Fernandes,1* A. Margarida Gomes,1* Mariana L. Oliveira,1 Joana Caldas,2 Paulo Lúcio,3,4 Rathana Kim,5,6 Aurélie Caye-Eude,7,8 Filomena Pereira,3 Aida B. de Sousa,2 Alessia De Stefano,1,9 Matilde Y. Follo,9 Maria V. Soares,1 João F. Lacerda,1 Joana Desterro,3 Hélène Cavé,6,7 Emmanuelle Clappier,4,5 Ximo Duarte,3 Patrícia Ribeiro2 and João T. Barata1
1Instituto de Medicina Molecular João Lobo Antunes, Faculdade de Medicina da Universidade de Lisboa, Lisboa, Portugal; 2Hospital dos Capuchos, Lisboa, Portugal; 3Instituto Português de Oncologia de Lisboa Francisco Gentil, Lisboa, Portugal; 4Champalimaud Center for the Unknown, Lisboa, Portugal; 5Hematology Laboratory, Saint-Louis Hospital, Assistance Publique des Hôpitaux de Paris (AP-HP), Paris, France; 6Saint-Louis Research Institute, Université de Paris, INSERM U944/Centre National de la Recherche Scientifique (CNRS) Unité
Mixte de Recherche (UMR) 7212, Paris, France; 7Département de Génétique, Unité de Génétique Moléculaire, Hôpital Robert Debré, Assistance Publique des Hôpitaux de Paris (AP-HP), Paris, France; 8INSERM UMR_S1131, Institut de Recherche Saint-Louis, Université Paris-Cité, Paris, France and 9University of Bologna, Department of Biomedical and Neuromotor Sciences, Bologna, Italy.
*MBF and AMG contributed equally as first authors.
MBF, AMG, MLO, and ADS performed experiments, and analyzed and interpreted data. MBF also drafted the manuscript. JC, PL, FP, ABS,
References
1. Almeida ARM, Neto JL, Cachucho A, et al. Interleukin-7 receptor a mutational activation can initiate precursor B-cell acute lymphoblastic leukemia. Nat Commun. 2021;12(1):7268.
2. Geron I, Savino AM, Fishman H, et al. An instructive role for interleukin-7 receptor alpha in the development of human B-cell precursor leukemia. Nat Commun. 2022;13(1):659.
3. Touw I, Pouwels K, van Agthoven T, et al. Interleukin-7 is a growth factor of precursor B and T acute lymphoblastic leukemia. Blood. 1990;75(11):2097-2101.
4 von Freeden-Jeffry U, Vieira P, Lucian LA, McNeil T, Burdach SE, Murray R. Lymphopenia in interleukin (IL)-7 gene-deleted mice identifies IL-7 as a nonredundant cytokine. J Exp Med. 1995;181(4):1519-1526.
5. Kaiser FMP, Janowska I, Menafra R, et al. IL-7 receptor signaling drives human B-cell progenitor differentiation and expansion. Blood. 2023;28(13):1113-1130.
6. Barata JT, Durum SK, Seddon B. Flip the coin: IL-7 and IL-7R in health and disease. Nat Immunol. 2019;20(12):1584-1593.
7 Brady SW, Roberts KG, Gu Z, et al. The genomic landscape of pediatric acute lymphoblastic leukemia. Nat Genet. 2022;54(9):1376-1389.
8. Neaga A, Jimbu L, Mesaros O, et al. Why do children with acute lymphoblastic leukemia fare better than adults? Cancers (Basel). 2021;13(15):3886.
MYF, MVS, JFL, JD, XD, and PR contributed with critical patients’ samples and clinical information and/or crucial feedback. JTB designed the project structure, analyzed and interpreted data, coordinated the studies, and wrote the manuscript. All authors critically read and agreed to the final version of the manuscript.
Acknowledgments
We are grateful to the patients and their families for generously providing the samples that were used in our studies. We also thank the Flow Cytometry core facility of Instituto de Medicina Molecular João Lobo Antunes for technical support. We also gratefully acknowledge the Center for Biological Resources of the Robert Debré (CRB-cancer; BB-0033-00076) and Saint-Louis (CRB BiRTH) hospitals.
Funding
This work was supported by the European Research Council, under the European Union’s Horizon 2020 research and innovation program and the European Union’s Horizon Europe (ERC-CoG-648455, ERCPOC-862545 and ERC-POC-101069429), by “la Caixa” Foundation (HR21-00761), and by Worldwide Cancer Research (WWCR 24-0426) to JTB. MBF was the recipient of a PhD fellowship from Fundação para a Ciência e a Tecnologia (FCT), Portugal. ADS was the recipient of a Marco Polo fellowship from the University of Bologna, Italy.
Data-sharing statement
For original data please contact joao_barata@medicina.ulisboa.pt
9 Leoni V, Biondi A. Tyrosine kinase inhibitors in BCR-ABL positive acute lymphoblastic leukemia. Haematologica. 2015;100(3):295-299.
10. Morishita N, Tsukahara H, Chayama K, et al. Activation of Akt is associated with poor prognosis and chemotherapeutic resistance in pediatric B-precursor acute lymphoblastic leukemia. Pediatr Blood Cancer. 2012;59(1):83-89.
11. Gomes AM, Soares MV, Ribeiro P, et al. Adult B-cell acute lymphoblastic leukemia cells display decreased PTEN activity and constitutive hyperactivation of PI3K/Akt pathway despite high PTEN protein levels. Haematologica. 2014;99(6):1062-1068.
12. Minieri V, De Dominici M, Porazzi P, et al. Targeting STAT5 or STAT5regulated pathways suppresses leukemogenesis of Ph+ acute lymphoblastic leukemia. Cancer Res. 2018;78(20):5793-5807.
14 Henry CJ, Marusyk A, Zaberezhnyy V, Adane B, DeGregori J. Declining lymphoid progenitor fitness promotes agingassociated leukemogenesis. Proc Natl Acad Sci U S A. 2010;107(50):21713-21718.
15. Stephan RP, Lill-Elghanian DA, Witte PL. Development of B cells in aged mice: decline in the ability of pro-B cells to respond to IL-7 but not to other growth factors. J Immunol. 1997;158(4):1598-1609.
Diagnostic challenges and proposed classification of myeloid neoplasms with overlapping features of thrombocytosis, ring sideroblasts and concurrent del(5q) and SF3B1 mutations
Myelodysplastic syndromes/neoplasms (MDS) are a spectrum of clonal bone marrow failure disorders at risk of progression to acute myeloid leukemia (AML). The classification of MDS relies on peripheral blood findings, morphology, cytogenetics, and molecular data. However, a subset of cases may be challenging to differentiate given overlapping features of MDS and myeloproliferative neoplasms (MPN). For example, MDS with low blasts and isolated deletion 5q (MDSdel(5q)) is characterized by cytopenia, usually anemia, and deletion 5q which may co-occur with another cytogenetic abnormality except monosomy 7 or deletion 7q. This entity is recognized by both the World Health Organization (WHO) and International Consensus Classification (ICC) systems under slightly different terminology.1-3 The presence of ring sideroblasts (RS) or SF3B1 mutations does not exclude the diagnosis of MDS-del(5q) if other diagnostic criteria are met.1-3 Up to a third of patients with MDS-del(5q) have sustained thrombocytosis, and a subset harbor additional JAK2 or MPL mutations.1-5 In some of these cases, the mutation and del(5q) are found in different clones.6 These features therefore overlap with MDS/MPN with SF3B1 mutation and thrombocytosis (MDS/MPN-SF3B1-T), another entity recognized by both the WHO and ICC classification systems.1-3 Notably, cases that fulfil the criteria for MDS-del(5q) are excluded from MDS/ MPN-SF3B1-T.1,3 Recent classification updates also include a new MDS entity with low blasts and SF3B1 mutation (MDSSF3B1), which may further complicate the differential diagnosis.1,7,8 According to the WHO, these cases are classified as MDS-SF3B1 in the absence of del(5q), monosomy 7/7q deletion, or a complex karyotype.3 The ICC has similar criteria and also specifies that the variant allele frequency of SF3B1 must be >10% without multi-hit TP53 or RUNX1 alterations.1 In addition, cases of MDS-SF3B1 that later develop thrombocytosis should not be reclassified as MDS/MPN-SF3B1-T.1 While most myeloid neoplasms in this differential diagnosis can be categorized with existing classification schema, some cases may show features that overlap between entities, presenting a diagnostic challenge. The clinical features and how to best classify these overlap cases remain unclear. We sought to systematically characterize myeloid neoplasms with overlapping features of del(5q) and SF3B1 mutations to assess their frequency, clinicopathological features, and their cell of origin. We searched the pathology archives at Memorial Sloan Kettering (MSK) Cancer Center for in-house bone marrow biopsy specimens from 2014 through 2018
for myeloid neoplasms with <5% blasts in the bone marrow, <2% circulating blasts in peripheral blood, and either del(5q) by cytogenetic studies or SF3B1 variants by mutational testing (Figure 1A). Bone marrow cytogenetic testing included both conventional karyotyping and fluorescence in situ hybridization (FISH) for MDS-related abnormalities. Molecular data were collected from targeted next-generation sequencing-based mutational analysis performed on either a bone marrow or peripheral blood specimen using MSK laboratory-developed microdroplet amplicon-based 30 or 49 gene panels9 or a hybridization-capture-based 400 gene panel (MSK-IMPACT), as previously described (Online Supplementary Table S1).10 These assays report variants in key oncogenes and tumor suppressor genes implicated in hematolymphoid malignancies. This study was approved by the Institutional Review Board of the MSK Cancer Center. In total, 41 unique patients were identified: nine patients met WHO 5th edition criteria for MDS-del(5q), 27 patients had myeloid neoplasms with SF3B1 mutation (MN-SF3B1), and five patients had overlapping features (Figure 1B). Of the 27 patients in the MN-SF3B1 category, five met the criteria for MDS/MPN-SF3B1-T, although the variant allele frequency of SF3B1 in one of the five patients could not be confirmed. The remaining 22 patients fell under the category of MDS-SF3B1, although the variant allele frequency could not be evaluated in six of these patients. The summary of clinicopathological features of all patients in the study is shown in Online Supplementary Table S2. Twenty-six of 37 patients (70%) with reviewable iron-stained aspirate smears demonstrated RS: five had <5% RS, one had 5-15% RS, and 20 had >15% RS as a proportion of total erythroid precursors; 25 of these patients harbored SF3B1 mutations. Twelve of 41 (29.3%) patients had a history of thrombocytosis (platelet count >450x109/L). Nineteen cases (46.3%) demonstrated morphological evidence of megakaryocytic dysplasia, which included forms with small, non-lobated and/or hypolobated nuclei, widely spaced nuclei, and hyperlobated nuclei. Twelve (29.3%) had significant reticulin fibrosis, with a grading of at least 2 on a scale from 0 to 3.
We identified five overlap cases that simultaneously met criteria for MDS-del(5q) while also harboring an SF3B1 mutation. Three of these patients also had a history of sustained thrombocytosis, thus demonstrating overlapping diagnostic features between MDS-del(5q), MDS-SF3B1, and MDS/MPNSF3B1-T. Based on the current classification, all five cases
were assigned to the diagnostic group of MDS-del(5q).
The five overlap patients had a median age of 69 years and comprised three females and two males. None had received
prior cytotoxic therapy. The median hemoglobin was 8.6 g/ dL, platelet count 528x109/L, and absolute neutrophil count 1.4 x10⁹/L in these overlap cases. No circulating blasts were
Figure 1. Patient and specimen selection criteria, case distribution by category, and flow cytometric sorting data. (A) Flow chart demonstrating criteria for selecting cases of myeloid neoplasms with <5% blasts in the bone marrow, <2% circulating blasts in peripheral blood, and either del(5q) by cytogenetic studies or SF3B1 variants by mutational testing. (B) Venn diagram illustrating the number of cases within each category. Of the 27 patients in the category of MN-SF3B1 (myeloid neoplasms with SF3B1 mutation), five meet the criteria for MDS/MPN-SF3B1-T (myelodysplastic syndrome/myeloproliferative neoplasm with SF3B1 mutation and thrombocytosis), although the variant allele frequency (VAF) of SF3B1 in one of the five patients could not be confirmed. The remaining 22 patients fall under the category of MDS-SF3B1, of which the VAF could not be evaluated in six patients. (C) For patients A and B, cells were sorted by flow cytometry into four populations: hematopoietic stem cells, progenitor cells, mature myelomonocytic cells, and T cells as a negative control. Fluorescence in situ hybridization testing using probes for del(5q) and digital droplet polymerase chain reaction analyses were performed in each cell population. The presence or absence of del(5q) is indicated with + or –, respectively. The VAF of a mutation in SF3B1 or MPL, if present, is listed as a percent. BM: bone marrow; PB: peripheral blood; NA: not applicable; WBC: white blood cells.
seen in the peripheral blood. The overlap patients showed significantly increased maximum platelet counts compared to MDS-del(5q) patients (P=0.029). Histologically, all five (100%) showed dysplastic megakaryocytes, and four out of five (80%) also showed RS: two cases had >15% RS on aspirate smear, and two had <5% RS, although one of these patients had absent iron stores on an iron-stained aspirate and evidence of a concurrent iron-deficiency anemia. The overlap patients had a median of 3% blasts on bone marrow aspirate differential (range, 0-4%), and two of five (40%) showed evidence of at least grade 2 reticulin fibrosis. The five overlap cases are described in detail in Table 1. During a median follow-up of 26 months, two of the five (40%) patients progressed to AML and ultimately died. In contrast, one of nine (11.1%) patients with MDS-del(5q) and three of 27 (11.1%) with MN-SF3B1 evolved to AML.
Evaluating bone marrow morphology, the prevalence of megakaryocytic dysplasia was higher in the overlap cases (P=0.0099) and the isolated del(5q) cases (P=0.001) than in the MN-SF3B1 cases. The megakaryocytes were more heterogenous and ranged in size from small to large in the overlap cases. RS were more common in MN-SF3B1 (P=0.0003) and overlap cases (P=0.032) when compared to MDS-del(5q) cases. While there were no significant differences in complete blood count findings between the overlap patients and the remaining patients, patients with MN-SF3B1 showed a significantly lower median hemoglobin concentration compared to MDS-del(5q) patients (P=0.011), and a significantly higher median absolute neutrophil count (P=0.0062) when assessed using non-parametric Mann-Whitney tests.
An oncoplot was generated to evaluate the mutational landscape of the entire cohort (Figure 2).11,12 An MPL variant was seen in two of the five patients (40%) in the overlap group compared to none in the MDS-del(5q) (P>0.05) and MNSF3B1 (P=0.02) groups. Mono-allelic TP53 variants were more common in the overlap (2/5, 40%) and MDS-del(5q) groups (4/9, 44.4%) than in the MN-SF3B1 cohort (2/27, 7.4%), which was a statistically significant difference when comparing MDS-del(5q) and MN-SF3B1 (P=0.025). Cases of MN-SF3B1 also showed greater frequencies of mutations in TET2 and ASXL1 genes compared to MDS-del(5q) and overlap groups, but these were not statistically significant differences.
To infer the cell of origin of genetic events, we used fluorescence assisted cell sorting (FACS) in two overlap patients who had cryopreserved cells from bone marrow aspirates. Cell populations were sorted using a panel of six antibodies (CD34, CD38, CD45, CD15, CD14, CD3) and scatter characteristics to separate four populations: CD38dim/CD34bright blasts (enriched for hematopoietic stem cells), CD38bright/ CD34positive blasts (enriched for progenitor cells), mature myelomonocytic cells based on scatter characteristics and CD45 expression, and CD3positive T-cells as a negative control (Figure 1C). The data were analyzed using custom software (“Woodlist,” a gift from B.L. Wood, Children’s Hospital of Los Angeles, Los Angeles, CA, USA). In all sorted cell pop-
ulations, FISH testing using probes for del(5q) and digital droplet polymerase chain reaction (ddPCR) were performed. For one case we were unable to sort enough viable cells for ddPCR testing on the CD38dim stem cell population but acquired enough cells for ddPCR testing in the other three cell populations. A commercially available QX100 Droplet Digital PCR System (Bio-Rad Laboratories, Inc., Hercules, CA, USA) was used following the manufacturer’s protocols and with custom PCR primers targeting the specific variants identified in the corresponding next-generation sequencing studies.
We found that the major genetic alterations that occurred within these cases, including del(5q), SF3B1 mutations, and MPN-related mutations, were present in all sorted myeloid cell populations and not identified in the T-cell component (Figure 1C). Given that there was no evidence of loss of heterozygosity and the gene alterations had similar variant allele frequencies as compared to the proportion of cells harboring del(5q) by FISH (Table 1), our findings support that all genetic alterations occur within the same clone of early myeloid stem cells. Interestingly, these results contrast with those of some previously published studies, although the data are limited.4-7 For example, MDS cases with isolated del(5q) harboring concomitant JAK2 V617F were shown to occur in different clones.6 Another study reported that JAK2 alterations were a subclonal event present in the same clone, although not all del(5q) cells in that cohort harbored the JAK2 variant.4 Our data suggest the possibility that these alterations occur within the same clone, although the timeline of these mutational events is unclear. Future studies should seek to determine the impact of clonal architecture and the chronology of mutation acquisition on pathogenesis, as this may clarify classification of these challenging cases.
This is the first study to summarize this rare type of overlap myeloid neoplasm with thrombocytosis, ring sideroblasts, SF3B1 and MPL mutations, which may create a diagnostic challenge. Currently, WHO and ICC recommend classifying these cases as MDS-del(5q). However, two of five of these cases had MPL mutations that showed moderate to severe reticulin fibrosis, a feature uncommon for MDS-del(5q). Of note, two of the patients within the overlap cohort on lenalidomide therapy progressed to AML. Typically, patients with MDS-del(5q) and MDS/ MPN- SF3B1 -T have a better prognosis than patients with other myeloid neoplasms.13-15
Moreover, the updated prognostic schema, the Molecular International Prognostic Scoring System (IPSS-M), demonstrated that cases of SF3B1 mutation in the presence of isolated del(5q) are assigned to higher risk categories compared to cases of del(5q) or SF3B1 alterations occurring in isolation.16 Based on this observation along with the results our study, it may be prudent to classify these patients as a subcategory under MDS/MPN-SF3B1-T. Features suggesting subcategorization under MDS/MPN-SF3B1-T include a more
Table 1. Clinicopathological findings in patients with myeloid neoplasias with features overlapping between myelodysplastic syndrome with low blasts and isolated del(5q), myelodysplastic syndrome with low blasts and SF3B1 mutation, and myelodysplastic/ myeloproliferative neoplasm with thrombocytosis and SF3B1 mutation.
Max: maximum; ANC: absolute neutrophil count; AMC: absolute monocyte count; MDS-del(5q): myelodysplastic syndrome with low blasts and isolated del(5q); ISCN: International System for Human Cytogenetic Nomenclature; FISH: fluorescence in situ hybridization; VAF: variant allele frequency; IPSS-R: Revised International Prognostic Scoring System; IPSS-M: Molecular International Prognostic Scoring System; NA: not applicable; NSCLC: non-small cell lung carcinoma; AML: acute myeloid leukemia.
heterogeneous megakaryocytic appearance in the overlap cases than in MDS-del(5q) cases. Although our cohort of overlap cases showed frequent hypolobated megakaryocytes, there were also forms with widely separated nuclei and others with hyperlobated nuclei and some clustering. Furthermore, MDS-del(5q) rarely transforms into AML, but in our cohort, we identified two patients on lenalidomide therapy without response who ultimately progressed to AML. There have been limited studies exploring del(5q) as an exclusion criterion from MDS/MPN-SF3B1-T, as currently defined in the updated classifications. Thus, additional studies utilizing single-cell sequencing techniques are warranted, as they may provide insight regarding the acquisition of a particular genetic alteration and its influence on morphology within dysplastic cells.
Figure 2. Oncoplot of the most frequent genetic aberrations by category. Overlap cases harbored both del(5q) and SF3B1 mutation. MDS-del(5q): myelodysplastic syndrome with low blasts and del(5q); MN-SF3B1: myeloid neoplasm with SF3B1 mutation.
Although limited by sample availability, results from our sorted subpopulations suggest that in at least some overlap cases, driver genetic alterations occur at similar stages in early myeloid stem cells. Future studies are needed to study the oncogenic cooperation between these genetic events, determine the impact of clonal architecture and chronology of mutation acquisition, and explore the relationship between genotype and phenotype. Together, this additional information may help inform the pathogenesis of these unique myeloid neoplasms.
Authors
Jyoti
Kumar,1,2 Natasha E. Lewis,1° Sarina Sherpa,3 Dory Londono,3
Xiaotian Sun,1 Qi Gao,1 Maria E. Arcila,1,2 Mikhail Roshal,1 Yanming Zhang,3 Wenbin Xiao1# and Alexander Chan1#
1Hematopathology Service; 2Diagnostic Molecular Pathology Service and 3Cytogenetics Laboratory, Department of Pathology and Laboratory Medicine, Memorial Sloan Kettering Cancer Center, New York, NY, USA
°Current address: Division of Hematopathology, Department of Laboratory Medicine and Pathology, Mayo Clinic Arizona, Phoenix, AZ, USA #WX and AC contributed equally as senior authors.
Correspondence:
A. CHAN - chana7@mskcc.org W. XIAO - xiaow@mskcc.org https://doi.org/10.3324/haematol.2023.284599
Received: November 2, 2023.
Accepted: March 22, 2024. Early view: April 4, 2024.
1. Arber DA, Orazi A, Hasserjian RP, et al. International Consensus Classification of Myeloid Neoplasms and Acute Leukemias: integrating morphologic, clinical, and genomic data. Blood. 2022;140(11):1200-1228.
2. Swerdlow SH, Campo E, Harris NL, et al. editors. WHO classification of tumours of haematopoietic and lymphoid tissues. Revised 4th edition. Lyon: International Agency for Research on Cancer; 2017. p. 585.
3. Khoury JD, Solary E, Abla O, et al. The 5th edition of the World Health Organization classification of haematolymphoid tumours: myeloid and histiocytic/dendritic neoplasms. Leukemia. 2022;36(7):1703-1719.
4 Ingram W, Lea NC, Cervera J, et al. The JAK2 V617F mutation identifies a subgroup of MDS patients with isolated deletion 5q and a proliferative bone marrow. Leukemia. 2006;20(7):1319-1321.
5. Patnaik MM, Lasho TL, Finke CM, et al. WHO-defined “myelodysplastic syndrome with isolated del(5q)” in 88 consecutive patients: survival data, leukemic transformation rates and prevalence of JAK2, MPL and IDH mutations. Leukemia. 2010;24(7):1283-1289.
6. Sokol L, Caceres G, Rocha K, Stockero KJ, Dewald DW, List AF. JAK2(V617F) mutation in myelodysplastic syndrome (MDS) with del(5q) arises in genetically discordant clones. Leuk Res. 2010;34(6):821-823.
7 Malcovati L, Stevenson K, Papaemmanuil E, et al. SF3B1-mutant MDS as a distinct disease subtype: a proposal from the International Working Group for the Prognosis of MDS. Blood. 2020;136(2):157-170.
8. Alaggio R, Amador C, Anagnostopoulos I, et al. The 5th edition of the World Health Organization classification of haematolymphoid tumours: lymphoid neoplasms. Leukemia.
Disclosures
No conflicts of interest to disclose.
Contributions
JK, NEL, WX, and AC compiled and annotated the cohort of patients. JK and MEA annotated the mutations. DL and YZ helped with cytogenetic analysis. XS, QG, MR, and AC designed/performed flow sorting analyses. WX and AC designed/validated the digital droplet polymerase chain reaction assay primers. WX designed and supervised the entire study. JK AC, and WX prepared the manuscript. All authors edited or reviewed the manuscript.
Funding
This study was funded in part through the NIH/NCI Cancer Center Support Grant P30 CA008748. WX is supported by Alex’s Lemonade Stand Foundation and the Runx1 Research Program, a Cycle for Survival’s Equinox Innovation Award in Rare Cancers, MSK Leukemia SPORE (Career Enhancement Program, NIH/NCI P50 CA254838-01) and a National Cancer Institute grant (K08CA267058-01).
Data-sharing statement
The original data that support the findings of this study will be made available upon request.
2022;36(7):1720-1748.
9 Cheng DT, Cheng J, Mitchell TN, et al. Detection of mutations in myeloid malignancies through paired-sample analysis of microdroplet-PCR deep sequencing data. J Mol Diagn. 2014;16(5):504-518.
10 Cheng DT, Mitchell TN, Zehir A, et al. Memorial Sloan KetteringIntegrated Mutation Profiling of Actionable Cancer Targets (MSK-IMPACT): a hybridization capture-based next-generation sequencing clinical assay for solid tumor molecular oncology. J Mol Diagn. 2015;17(3):251-264.
11. Gao J, Aksoy BA, Dogrusoz U, et al. Integrative analysis of complex cancer genomics and clinical profiles using the cBioPortal. Sci Signal. 2013;6(269):pl1.
12. Cerami E, Gao J, Dogrusoz U, et al. The cBio cancer genomics portal: an open platform for exploring multidimensional cancer genomics data. Cancer Discov. 2012;2(5):401-404.
13. Singh A, Al-Kali A, Foran JM, et al. Lenalidomide therapy for primary myelodysplastic syndromes with isolated del(5q): determinants of response and survival in a real-world setting. Am J Hematol. 2022;97(10):E377-E379.
14 Mangaonkar AA, Lasho TL, Ketterling RP, et al. Myelodysplastic/ myeloproliferative neoplasms with ring sideroblasts and thrombocytosis (MDS/MPN-RS-T): Mayo-Moffitt collaborative study of 158 patients. Blood Cancer J. 2022;12(2):26.
15. Mądry K, Lis K, Fenaux P, et al. Cause of death and excess mortality in patients with lower-risk myelodysplastic syndromes (MDS): a report from the European MDS registry. Br J Haematol. 2023;200(4):451-461.
16. Bernard E, Tuechler H, Greenberg PL, et al. Molecular International Prognostic Scoring System for myelodysplastic syndromes. NEJM Evid. 2022;1(7):EVIDoa2200008.
Validation of mutated CEBPA bZIP as a distinct prognosis entity in acute myeloid leukemia: a study by the Spanish PETHEMA registry
The prognosis for patients diagnosed with acute myeloid leukemia (AML) suitable for intensive chemotherapy, is defined by the presence of specific genetic abnormalities.1,2 Among these, mutations in CCAAT/enhancer binding protein a (CEBPA) gene have classically classified as favorable risk.3 The frequency of CEBPA gene mutations ranges from 7% to 20%,4,5 being present mostly in cytogenetically normal patients. While wild-type CEBPA (CEBPAwt) or CEBPA single-mutation (CEBPAsm) patients have ~60% risk of relapse, this risk is ~40% in those with CEBPA double mutation (CEBPAdm) 5 These findings led to the inclusion of CEBPAdm AML as a distinct diagnostic entity in the 2016 World health Organization (WHO) classification6 and as favorable risk group by 2017 European Leukemia Net (ELN) risk classification.7 However, a study in children and young adults enrolled in Children’s Oncology Group trials showed that CEBPA mutations in bZIP region conferred favorable prognosis, regardless of whether they are CEBPAsm or CEPBAdm 8 This finding was confirmed in adult patients enrolled in protocols of the Study Alliance Leukemia, 9 where bZIP mutations were associated with higher overall survival (OS) and complete remission (CR) rate. This data led to refinement of 2022 ELN risk classification,2 defining as favorable risk only the presence of inframe bZIP CEBPA mutation (CEBPA-bZIP-inf).
In this study, we aim to describe the incidence, clinical-biological features, and prognosis of CEBPA mutations, including CEBPA-bZIP-inf, in a large series of real-life consecutive patients, homogeneously studied with harmonized next-generation sequencing (NGS) methodologies. For this purpose, we conducted a retrospective, non-interventional, multicenter study in the PETHEMA epidemiologic registry (N=2,434 consecutive patients with available centralized NGS) involving seven Spanish central-core laboratories (PLATAFO-LMA protocol; clinicaltrials gov. Identifier: NCT04446741). The consortium members are included in the Online Supplementary Appendix. Of them, a total of 696 intensively treated AML (IT AML) patients (≥18 years) diagnosed with AML according to WHO 20166 criteria since October 2017, with treatment and survival data were included. The ELN2017 was used for risk stratification.7 The intensive schedules consisted mainly in anthracycline plus cytarabine (Ara-C)-based regimens, such as 3+7 (idarubicin or daunorubicin and Ara-C) (N=493, 66.5%), mitoxantrone plus Ara-C, FLAG-IDA, FLAT (fludarabine, Ara-C, and topotecan), or ICE (idarubicin, Ara-C, and etoposide).
Genomic DNA, extracted from bone marrow (or peripheral blood) of each patient at the time of diagnosis, was shipped and analyzed at reference hospitals. The AML PETHEMA diagnostic network employs harmonized NGS protocols for analysis and reporting with external quality control rounds.10 All reference laboratories performed the analysis of at least 32 genes established by consensus due to their importance in AML In all cases, CEBPA gene was entirely sequenced.10 Mutation in bZIP-inf was considered if they are multiples of 3 bp and affect DNA binding, fork or bZIP from amino acid position 278 to C-terminus as previously stated.9
A total of 82 of 696 IT AML patients (11.8%) harbored CEBPA gene mutations by NGS. Among them, 45 had mutations within bZIP domain and 40 fulfilled criteria of CEBPA-bZIPinf (5.7%). Among CEBPA-bZIP-inf, 22 were CEBPAdm and 18 CEBPAsm. Online Supplementary Figure 1S shows patients flow chart classified from the detection of any CEBPA gene mutation to the final categorization as CEBPA-bZIP-inf. Main characteristics of the entire cohort according to CEBPA status (i.e, bZIP-inf vs. other CEBPA mutations [CEBPA other mut] vs CEBPAwt are detailed in Table 1. Patients with CEBPA-bZIP-inf were significantly younger than other CEBPAmut and CEBPAwt (49.6 vs. 60.6 vs. 57.8 years respectively; P=0.009). Patients harboring CEBPA-bZIP-inf mutation had an estimated 3-year survival of 83.3% (95% confidence interval [CI]: 58.3-100) better than those with CEBPA other mut (54.3%, 95% CI: 34.9-84.4) and those with CEBPAwt (47.2%, 95% CI: 41.5-53.7) albeit no statistical differences were reached (P=0.17 for both comparisons) (Figure 1A). In order to seek the prognosis importance of being strictly “inframe” bZIP mutations, we performed similar OS analyses grouping all bZIP mutations (including not-inframe). Thus, patients harboring grouped CEBPA-bZIP mutations had also a 3-year survival (87.5%, 95% CI: 67.3-100) better than those with CEBPA other mut (47.9%, 95% CI: 27.9-82.2) and those with CEBPAwt (47.2%, 95% CI: 41.5-53.7; P=0.068 for both comparisons) (Figure 1B).
The mutational landscape found in patients with bZIP-inf (median number of mutations 1.5, range 0-5) compared CEBPA other mut (median number of mutations 2.5, range 0-7) is displayed in Figure 2A. We identified at least one mutation in any of the genes included in the study panel in 82 patients with CEBPA mutations (median 2; range, 0-7). Only 17 patients (13.69%) had no additional mutations. From these 17 patients (47% CEBPA-bZIP-inf), karyotype data was only available for five patients (2 patients had intermediate
Table 1. Demographic and clinical characteristics of intensively treated acute myeloid leukemia patients including wild-type CEBPA, bZIP in-frame CEBPA mutation and other CEBPA mutation.
Sex, N (%) Female
Age group, N (%)
Type of AML, N (%)
ECOG, N (%)
WHO by differentiation, N (%)
Minimal
MRC cytogenetic risk, N (%) Favorable
Targetable mutations, N (%)
IQR: interquartile range; AML: acute myeloid leukemia; ECOG: Eastern Cooperative Oncology Group; WBC: white blood cell; BM: bone marrow; MRC: medical research council; HSCT: hematopoietic stem cell transplantation; CR: complete remission; CRi: complete remission with incomplete count recovery; WHO: World Health Organization; inf: in-frame; mut: mutation; wt: wild-type.
risk, 1 had favorable risk and 2 had normal karyotype). We identified significantly higher percentage of mutations in WT1, GATA2 y C-KIT in patients with CEBPA-bZIP-inf compared to CEBPA other mut (20% vs. 4.8%, 20% vs. 7.1% and 5% vs. 0%, respectively). By contrast, CEBPA other mut patients harbored significantly higher percentage of mutations in ASXL1 and NPM1 genes than CEBPA-bZIP-inf (19% vs 2.5%, 28.5% vs. 2.5%, and 14.3% vs. 5% respectively). These differences are maintained when grouping all CEBPA-bZIP mutations compared to CEBPA other mut. Additionally, we performed analysis to infer the timing of co-mutation occurrence among all CEBPA-mutated AML patients by using the Bradley-Terry model.11 As displayed in Figure 2B, TP53 mutations, chromatin modificators mutations (ASXL1, EZH2), epigenetic regulators (TET2, DNMT3A) and splicing machinery mutations (SF3B1, UA2F1) seem to occur earlier. By contrast, mutations in NPM1 and signaling pathways (NRAS, KRAS and FLT3) seem to occur later. Finally, we studied the impact on OS of the presence of co-mutations in CEBPA-bZIP-inf and CEBPA other mut. The presence of mutations in WT1 and GATA2 genes did not modify the prognosis of CEBPA-bZIP-inf patients. In the same way, no statistical differences were found analyzing the impact of mutations in the myelodysplasia-associated genes SRSF2, SF3B1, U2AF1, ZRSR2, ASXL1, EZH2, BCOR, RUNX1 or STAG2 in patients with CEBPA-bZIP-inf. However, the presence of mutations in TET2 genes conferred worse outcomes to CEBPA-bZIP-inf (P=0.064) and FLT3 mutations conferred significant worse outcomes only to CEBPA other mut patients (P=0.042). These differences are maintained
when grouping all CEBPA-bZIP mutations compared to CEBPA other mut.
Since the first description of mutations in CEBPA gene in AML, the definition of which type had diagnosis entity and clinical prognostic impact, has evolved.3 Currently, WHO 2022 includes biallelic CEBPA mutations (independent of the gene region) and single mutations located in the bZIP region,12 but ICC only accepts a narrower definition CEBPAbZIP-inf mutations (independent of the allelic state)13 as defined also as favorable prognosis category in ELN 2022.2 Therefore, this recent step forward of ICC and ELN2002 statements implies a meaningful paradigm shift in the way AML with CEBPA mutations must be diagnosed and prognostically defined. This notable change has been made based mainly on the results of two large series of pediatric and adult patients intensively treated in clinical protocols and analyzed using different methologies.8,9
We confirm that CEBPA-bZIP-inf is associated with favorable prognosis among fit AML patients intensively treated, but we also suggest that all CEBPA-bZIP (inframe and others) could be categorized as favorable risk. These findings were also in agreement with those reported by Taube et al. when analyzed only bZIP-inf and all bZIP mutations differentially.9 Importantly, other studies have reported favorable outcomes when grouping all bZIP mutations.8,14 Altogether, these results question whether the restriction to bZIP-inf mutations as defined by ICC and ELN2022 has a meaningful clinical or diagnostic impact, while it is sure that it could increase complexity when reporting and interpreting these mutations. Moreover, although some data suggest
Figure 1. Overall survival probability curves (%) of intensively treated acute myeloid leukemia patients. (A) Patients with bZIP in-frame (inf) CEBPA mutation CEBPA-bZIP-inf (red line), with other CEBPA mutation (mut) (green line) and wild-type CEBPA (CEBPAwt) mutation (blue line). (B) Patients with all CEBPA-bZIP mutations including non-inframe (CEBPA bZIP, red line), with CEBPA other mut (green line) and CEBPAwt (blue line).
that CEBPA bZIP mutant does not downregulate miR-182 and this incapability could be restricted to typical bZIP-inf mutations,15 there is no a clear evidence of CEBPA-bZIP-inf as a biological distinct entity. Additionally, we observed that CEBPA-bZIP-inf carried more frequently well-known co-mutations as WT1 and GATA2, whereas in CEBPA other mut, ASXL1 mutations and NPM1 mutations were more frequent. It is important to remark the relatively frequent co-existence of mutations in NPM1 and CEBPA, both defining diagnostic entities in current WHO and ICC classifications, which is homogeneously found in up
to 5% of CEBPA-bZIP-inf cases in our series and others.8,9,14 This finding opens the question of the real-independent diagnosis entity of CEBPA-bZIP-inf which should be mutually exclusive with other genetically defined AML entities. The role of co-mutations in CEBPA-mutated patients has been extensively analyzed with discordant results. Prior studies reported inferior outcomes among CEBPAdm with GATA or WT1 co-mutations.3,5 However, when restricting the analyses to the bZIP-inf, the negative impact of these co-mutations is less clear since conflicting results have been published.8,9,14 In our series, neither GATA nor WT1
Figure 2. Genomic characterization of CEBPA-mutated patients. (A) Co-mutational spectrum of the 82 patients with CEBPA mutations. Each column represents 1 subject. (B) Comparison of percentage of patients with additional specific gene mutations between bZIP in-frame CEBPA mutation (CEBPA-bZIP-inf) and other CEBPA mutation (CEBPA other mut). (B) Bradley-Terry model to infer the timing of co-mutation occurrence by using the Bradley-Terry model.11 As displayed TP53 mutations, chromatin modificators mutations (ASXL1, EZH2), epigenetic regulators (TET2, DNMT3A) and splicing machinery mutations (SF3B1, UA2F1) seem to occur earlier. By contrast, mutations in NPM1 and signaling pathways (NRAS, KRAS and FLT3) seem to occur later. MDS: myelodysplatic syndrome; TF: tissue factor.
mutations adversely impact clinical outcome. Interestingly, the presence of mutations in TET2 gene could negatively impact prognosis in CEBPA-bZIP-inf patients in agreement with Taube et al. 9
The strengths of our study are to be a very large series of real-life consecutive patients, homogeneously analyzed within a harmonized NGS nationwide platform. In summary, CEBPA-bZIP-inf confer a favorable OS, compared to CEBPA other mut, but the narrow definition of in-frame could not be clinically relevant while increasing complexity for routine practice. although larger series are undoubtedly needed to firmly conclude this statement.
Authors
Esther Prados de la Torre,1* Josefina Serrano,1* David MartínezCuadrón,2,3 Laura Torres,2,3 Claudia Sargas,4 Rosa Ayala,5 Cristina Bilbao-Sieyro,6 María Carmen Chillón,7 María José Larráyoz,8 Elena Soria,9 Clara Aparicio-Pérez,1 Juan M. Bergua10 Teresa Bernal,11 Cristina Gil,12 Mar Tormo,13 Lorenzo Algarra,14 Juan M. Alonso-Domínguez,15 Eduardo Rodriguez-Arbolí,9 Pilar Martínez-Sanchez,5 Ana Oliva,16 Ana M. Colorado-Araujo,17 Carlos Rodríguez-Medina,6 Susana Vives,18 Lourdes Hermosín,19 Joaquín Martínez-López,5 Ramón García-Sanz,7 José A. Pérez-Simón,9 María José Calasanz,8 María Teresa GómezCasares,6 Eva Barragán,3,20 Joaquín Sánchez-García J.1 and Pau Montesinos2,3 on behalf of the PETHEMA group
1Instituto Maimónides de Investigación Biomédica de Córdoba (IMIBIC), UGC Hematología Hospital Universitario Reina Sofía, Universidad de Córdoba (UCO), Córdoba; 2Servicio de Hematología, Grupo Acreditado de Investigación en Hematología, Hospital Universitario y Politécnico La Fe, Instituto de Investigación Sanitaria La Fe (IIS La Fe), Valencia; 3Centro de Investigación Biomédica en Red de Cáncer (CIBERONC), Instituto de Investigación Sanitaria La Fe (IIS La Fe), Valencia; 4Grupo Acreditado de Investigación en Hematología, Instituto de Investigación Sanitaria La Fe (IIS La Fe), Valencia; 5Hospital Universitario 12 de Octubre, Spanish National Cancer Research Center (CNIO), Department of Medicine, Complutense University, Madrid; 6Hospital Universitario de Gran Canaria Dr. Negrín, Universidad de Las Palmas de Gran Canaria, Las Palmas de Gran Canaria; 7Servicio de Hematología, Hospital Universitario de Salamanca (HUS/IBSAL), CIBERONC, Centro de Investigación del Cáncer-IBMCC (USAL-CSIC), Salamanca; 8Hematological Diseases Laboratory, CIMA LAB Diagnostics, University of Navarra, IdiSNA (Navarra Institute for Health Research), Pamplona; 9Hospital Universitario Virgen del Rocío, Instituto de Biomedicina (IBIS/ CSIC), Universidad de Sevilla, Sevilla; 10Hospital Universitario San Pedro de Alcántara, Cáceres; 11Hospital Universitario Central de Asturias, Instituto Universitario (IUOPA), Instituto de Investigación del Principado de Asturias (ISPA), Oviedo; 12Hospital General Universitario de Alicante,
Alicante; 13Hospital Clínico Universitario. Universidad de Valencia. Instituto de investigación INCLIVA, Valencia; 14Hospital Universitario General de Albacete, Albacete; 15Hospital Universitario Fundación Jiménez Díaz, Madrid; 16Hospital Universitario Nuestra Señora de Candelaria, Santa Cruz de Tenerife; 17Hospital Universitario Marqués de Valdecilla, Santander; 18Hospital Universitario Germans Trias i PujolICO Badalona, Badalona; 19Hospital General Jerez de la Frontera, Jerez and 20Servicio Análisis Clínicos, Grupo Acreditado de Investigación en Hematología, Hospital Universitario y Politécnico La Fe, Instituto de Investigación Sanitaria La Fe (IIS La Fe), Valencia, Spain
*EPdlT and JS contributed equally as first authors.
Correspondence:
J. SÁNCHEZ GARCÍA - joaquin.sanchez@cheerful.com
https://doi.org/10.3324/haematol.2023.284601
Received: November 11, 2023. Accepted: April 10, 2024. Early view: April 18, 2024.
EPdlT, JS, JSG and PM conceived and designed the study, and wrote the manuscript. EPdlT and JS performed data analysis. JS, DMC, LT, CS, RA, CBS, MCC, MJL, ES, CAP, JMB, TB, CG, MT, LA, JMAD, ERA, PMS, AO, AMCA, CRM, SV, LH, JML, RGS, JAPS, MJC, MTGC and EB provided clinical and/molecular data of patients, collected and assembled data and interpreted data. All authors wrote the manuscript, gave the final approval of the manuscript and are accountable for all aspects of the work.
Acknowledgments
The authors would like to thank María D. García, Carlos Pastorini, Asier Laria, Yolanda Mendizabal, and Teresa Martinez Sena for data collection and management.
Funding
This investigation was partially supported by Instituto de Salud Carlos III, Spain, grant PMP22/00069 and PI19/00730.
Data-sharing statement
Requests for data sharing should be sent to Pau Montesinos (montesinos_pau@gva.es).
References
1. Sanchez-Garcia J, Serrano J, Prados de La Torre E, et al. Identifying prognostic gene panels in acute myeloid leukemia. Expert Rev Hematol. 2023;16(4):277-287.
2. Döhner H, Wei AH, Appelbaum FR, et al. Diagnosis and management of AML in adults: 2022 recommendations from an international expert panel on behalf of the ELN. Blood. 2022;140(12):1345-1377.
3. Su L, Shi YY, Liu ZY, Gao SJ. Acute myeloid leukemia with CEBPA mutations: current progress and future directions. Front Oncol. 2022;12:806137.
4. Lin LI, Chen CY, Lin DT, et al. Characterization of CEBPA mutations in acute myeloid leukemia: most patients with CEBPA mutations have biallelic mutations and show a distinct immunophenotype of the leukemic cells. Clin Cancer Res. 2005;11(4):1372-1379.
5. Taskesen E, Bullinger L, Corbacioglu A, et al. Prognostic impact, concurrent genetic mutations, and gene expression features of AML with CEBPA mutations in a cohort of 1182 cytogenetically normal AML patients: further evidence for CEBPA double mutant AML as a distinctive disease entity. Blood. 2011;117(8):2469-2475.
6. Arber DA, Orazi A, Hasserjian R, et al. The 2016 revision to the World Health Organization classification of myeloid neoplasms and acute leukemia. Blood. 2016;127(20):2391-2405.
7 Döhner H, Estey E, Grimwade D, et al. Diagnosis and management of AML in adults: 2017 ELN recommendations from an international expert panel. Blood. 2017;129(4):424-447.
8. Tarlock K, Lamble AJ, Wang YC, et al. CEBPA-bZip mutations are associated with favorable prognosis in de novo AML: a report from the Children’s Oncology Group. Blood. 2021;138(13):1137-1147.
9 Taube F, Georgi JA, Kramer M, et al. CEBPA mutations in 4708 patients with acute myeloid leukemia: differential impact of bZIP and TAD mutations on outcome. Blood. 2022;139(1):87-103.
10 Sargas C, Ayala R, Chillón MC, et al. Networking for advanced molecular diagnosis in acute myeloid leukemia patients is possible: the PETHEMA NGS-AML project. Haematologica. 2021;106(12):3079-3089.
11. Christen F, Hoyer K, Yoshida K, et al. Genomic landscape and clonal evolution of acute myeloid leukemia with t(8;21): an international study on 331 patients. Blood. 2019;133(10):1140-1151.
12. Khoury JD, Solary E, Abla O, et al. The 5th edition of the World Health Organization Classification of haematolymphoid tumours: myeloid and histiocytic/dendritic neoplasms. Leukemia. 2022;36(7):1703-1719.
13. Arber DA, Orazi A, Hasserjian RP, et al. International Consensus Classification of myeloid neoplasms and acute leukemias: integrating morphologic, clinical, and genomic data. Blood. 2022;140(11):1200-1228.
14 Wakita S, Sakaguchi M, Oh I, et al. Prognostic impact of CEBPA bZIP domain mutation in acute myeloid leukemia. Blood Adv. 2022;6(1):238-247.
15. Wurm AA, Zjablovskaja P, Kardosova M, et al. Disruption of the C/EBPa-miR-182 balance impairs granulocytic differentiation. Nat Commun. 2017;8(1):46.
Benefit of phlebotomy and low-dose aspirin in the prevention of vascular events in patients with EPOR primary familial polycythemia on the island of New Caledonia
Hereditary or congenital erythrocytosis is a group of rare, inherited disorders, including congenital erythrocytosis associated with a germline mutation in erythropoietin receptor (EPOR). Of the 130 cases reported in the literature to date, only 25 provide information on the presence or absence of vascular events, and only 18 with information on treatment, mainly phlebotomy but without a clear benefit on vascular events, and without aspirin in most cases. Our data from a homogeneous (both genetically and in terms of medical management) cohort of 33 affected subjects from the island of New Caledonia, a French territory in the South Pacific, suggest the possible benefit of phlebotomy and low-dose aspirin in the prevention of vascular events in patients with erythrocytosis due to an EPOR mutation.
In 1985, Prchal and collaborators reported an autosomal dominant polycythemia associated with a hypersensitivity of colony-forming unit erythroblast colony growth to erythropoietin (EPO) and low serum EPO levels. This entity was called primary familial and congenital polycythemia or familial erythrocytosis type 1.1 A few years later, Juvonen et al. described similar patterns in a large family in which the proband was an Olympic gold medalist.2 The molecular signature at the origin of the phenotype was then identified by de La Chapelle et al. as a mutation in the EPOR gene leading to a truncated protein.3 Since then, it has been noted that the majority of reported pathological variants are nonsense or frameshift mutations, and almost all of them reside in exon 8 of the EPOR gene, which encodes the negative feedback regulatory domains of the receptor. The lack of EPOR cytoplasmic suppressors results in overexpression of the receptor and thereby prolonged phosphorylation of JAK2 with excessive activation of STAT5 and the RAS-MAPK signal transduction pathway.4 Recently, Pasquier et al. reported another mechanism from the consequences of EPOR mutations: distal truncations induced by frameshift mutants confer EPO hypersensitivity that depends on the appearance of a new C-terminal tail which causes pre-activation of EPOR and JAK2, constitutive signaling and hypersensitivity to EPO by increasing EPOR dimerization and stability at the cell surface.5 According to guidelines from the American College of Medical Genetics and Genomics and the Association of Molecular Pathologists, among the 35 EPOR variants reported to be associated with primary familial
and congenital polycythemia to date, four are classified as benign or likely benign, three are variants of uncertain significance, and 28 are pathogenic or likely pathogenic.6 Mutations in EPOR are relatively rare among patients with JAK2-negative erythrocytosis, and are found in only approximately 1% of cases.7
We recently reported a new EPOR mutation (c.1293del, p.Ser432Alafs*21) in patients from different unrelated families. Interestingly, this mutation has been exclusively observed in patients from the island of New Caledonia, strongly supporting a founder effect.7 In order to further explore the patients with erythrocytosis related to this EPOR mutation, a family survey was carried out in New Caledonia and in France where some patients currently live. In particular, we aimed to assess the vascular risk and to evaluate the possible impact of treatments.
A total of 33 patients (14 males, 19 females), mean age 43 years old (from 2 months to 82 years old), from four unrelated families from New Caledonia with the germline EPOR mutation (c.1293del, p.Ser432Alafs*21) were included (Figure 1, Table 1). All patients signed an informed consent form. Comprehensive clinical and biological data were available for 26 of them. The mean hemoglobin concentration and hematocrit at diagnosis were 185 g/L and 56.3% in males and 179 g/L and 54.9% in females, respectively. When available, the serum EPO level at diagnosis was low in all cases (<5 mU/mL). Four of the cases were children (from 2 months to 15 years old) and had no treatment or history of thrombosis.
Among the 22 adults, 16 were being treated with a combination of aspirin and phlebotomy, two with a combination of anticoagulant therapy (for atrial fibrillation) and phlebotomy, one with phlebotomy alone, and three were not receiving any treatment. Of note, no thrombosis was observed in healthy relatives, but a vascular event was reported in three patients (3/22=13%) who were not receiving any treatment: no recurrence of vascular events was noted in these three patients after treatment had been initiated. On the other hand, no hemorrhagic events have been reported in this cohort to date. Remarkably, over 50% of patients treated with phlebotomies (9/17) reported improvements in headaches, dizziness, tinnitus and visual disturbance. The hematocrit threshold for phlebotomies was guided by the onset of symptoms or, in asymptomatic patients, essentially varied from 51% to 55%.
Figure 1. Family trees of New Caledonian patients with EPOR mutations. The black circles and squares represent people in the family with erythrocytosis (crossed-out: deceased). Patients C II:1, C II:4, C II:7, C III:6 and D III:1 have been reported by Filser et al.7 Patient #11 (Family B IV:6) is a 29-year-old woman living in Eastern France but originally from New Caledonia, with a history of three spontaneous early miscarriages. Her hemoglobin concentration and hematocrit were 177 g/L and 53%, respectively. Biological investigations for thrombophilia were negative, but she was an active smoker and obese. Later on, after introduction of low-dose aspirin, she had two successful full-term pregnancies in 2015 and 2019. Finally, in 2023, an EPOR mutation similar to that in the other New Caledonian patients (c.1293del p.Ser432Alafs*21) was detected. Patient #18 (Family D II:5) is a 50-year-old woman who presented with spontaneous deep vein thrombosis of the lower limb in 2016 in New Caledonia. She had no risk factors for venous thrombosis but was treated for high blood pressure. She had no treatment at the time of the deep vein thrombosis. Three years later, a mutation of the EPOR gene (c.1293del p.Ser432Alafs*21) was detected. Her hemoglobin concentration was 187 g/L, her hematocorit was 59%, and her leukocyte and platelet counts were 5x10⁹/L and 1,865x109/L, respectively. Phlebotomies were initiated in 2019 associated with low-dose aspirin. Serum erythropoietin was not tested in this patient. Patient #19 (Family D II:8) is a 54-year-old man, followed in New Caledonia for congenital erythrocytosis. He had no history of thrombosis and was treated with phlebotomy without antiplatelet agents. The only known cardiovascular risk factor was active smoking. In February 2022, he discontinued phlebotomies, and 4 months later, in May 2022, he presented with non-ST-elevated myocardial infarction for which he was subsequently phlebotomized and treated using low-dose aspirin. At the time of this thrombotic event, he had a hemoglobin of 204 g/L, hematocrit of 67%, leukocyte count of 115x109/L and platelet count of 1,695x109/L. No recurrence has been observed since then.
It is worth noting that the distribution of cardiovascular risk factors was similar in the three groups, i.e., EPOR-mutated patients with vascular events, EPOR-mutated patients without vascular events and healthy relatives (Table 1). Overall, the use of aspirin (or oral anticoagulant in 2 patients) and phlebotomy was associated with a decreased risk of vascular events (P<0.001, Fisher exact test). The occurrence of vascular events in more than 10% of the cohort raises the question of the seriousness of this complication, which was initially considered to have little effect. The occurrence of a myocardial infarction when phlebotomy was discontinued in one patient, and the cessation of miscarriages followed by two successful full-term pregnancies after the introduction of low-dose
aspirin in another patient suggest the beneficial effect of these treatments in people with EPOR -related congenital erythrocytosis. In this regard, as far as obstetric complications of congenital erythrocytosis are concerned, one could imagine an analogy with the antiphospholipid syndrome, even if the pathophysiology is very different. In the antiphospholipid syndrome, the clinical criteria used to make the diagnosis may be either vascular thrombosis, or pregnancy-related morbidity including (i) one or more unexplained deaths of a morphologically normal fetus at or beyond 10 weeks of gestation, (ii) one or more premature births before 34 weeks of gestation, or (iii) three or more unexplained consecutive spontaneous abortions before 10 weeks of gestation.8 Similarly, in our study, the recurrence
of three miscarriages in the young woman with the EPOR mutation was considered to be a vascular event. Interestingly, in a series of pregnant women with congenital erythrocytosis (including those with EPAS1 , EGLN1 and EPO mutations) we previously found a possible benefit of aspirin or heparin associated with phlebotomy in the management of these high-risk pregnancies, thus strengthening the appeal of this therapeutic approach in pregnant patients with congenital erythrocytosis.9
In fact, the discovery of an EPOR mutation in a threetime Olympic ski champion could initially have given rise to optimism. Indeed, in the initial report, life span was considered to be unaffected by this mutation.2 However, severe vascular events were reported in the original proband, who suffered several cardiovascular events and died in his 50s of a stroke, and his affected son had a myocardial infarction at the age of 40, highlighting the potential serious thrombotic complications associated with EPOR mutations.10 Surprisingly, to date, no study has been carried out to investigate possible complications, particularly vascular ones, in patients with an EPOR mutation: at most, some case reports described possible complications, but these reports involved very few patients, and data on treatment were not always provided. To the best of our knowledge, 130 cases had been reported in the literature so far, 25 with information on the presence or absence of thrombotic events, and 18 with information on treatment, mainly phlebotomy but without a clear benefit on thrombosis.5-7 Most of the reported cases had not been treated using low-dose aspirin, mainly because EPOR-related polycythemia was considered benign, as opposed to polycythemia vera, for which low-dose aspirin has long been demonstrated to lower the risk of thrombosis. Only two cases have been reported to have been treated with a combination of phlebotomy and aspirin, with no thrombosis observed6 (Online Supplementary Table S1). The benefit of phlebotomy in congenital erythrocytosis is debated, particularly because it is ineffective, or even harmful, in Chuvash polycythemia: in a large cohort of such patients, a history of previous phlebotomy was associated with a higher risk of thrombosis.11,12 Similarly, a high rate of thrombosis was reported in a large family with congenital erythrocytosis due to the EPAS1 (c.1603A>G, p.M535V) mutation, without any obvious benefit of phlebotomy, raising the question of whether phlebotomy is an effective treatment. It was not mentioned whether these patients were also taking low-dose aspirin. On the other hand, we recently reported two large series of EPAS1/HIF2- and EGLN1/PHD2-mutated patients with congenital erythrocytosis who had a low rate of thrombotic complications,13,14 suggesting that the mechanisms of thrombosis in secondary congenital erythrocytosis are complex. Remarkably, there are very few international recommendations on the management of congenital erythrocytosis. The British Society of Haematology recently suggested
the use of phlebotomy in combination with low-dose aspirin (by analogy with the recommendations for polycythemia vera), with a threshold hematocrit of 52% being proposed.15 In fact, the hematocrit threshold should be guided by the relief of hyperviscosity symptoms. This is the case of erythrocytosis related to high-affinity hemoglobins, for which phlebotomy to relieve hyperviscosity symptoms, associated or not with low-dose aspirin, has been suggested. In the absence of randomized trials, partly due to the very rare nature of EPOR-related polycythemia, solid therapeutic evidence is difficult to obtain. Our study, although limited by the size of the cohort and its retrospective nature, has the advantage of focusing on a homogeneous population carrying the same germline mutation, whose management was centralized, limiting recruitment or management biases.
Our results shed new light on the management of primary congenital erythrocytosis related to EPOR mutations and suggest that the combination of phlebotomy plus lowdose aspirin has a possible benefit in terms of preventing vascular events, thus providing an additional argument in line with recent recommendations.
Au tho rs
Léa Boulnois,1* Margot Robles,2* Nada Maaziz,1 Bernard Aral,1 Martin Gauthier,3,4 Francis Duchene,5 Marie-Amélie Goujart,6 Betty Gardie7-9# and François Girodon1,9-11#
1Pôle Biologie, CHU Dijon, Dijon, France; 2Onco-Hématologie, Service de Médecine Interne, Maladies Infectieuses et Hématologie, CHT Gaston Bourret, Nouméa, New Caledonia; 3Service d’Hématologie, Hospitalier Universitaire de Toulouse, Institut Universitaire du Cancer de Toulouse Oncopole, Toulouse, France; 4Centre Hospitalier Jean Rougier, Cahors, France; 5Service de Médecine Interne, Hôpital Nord Franche Comté, Belfort Montbéliard, France; 6Service d’Hématologie Biologique, Laboratoire de Biologie Médicale, CHT Gaston Bourret, Nouméa, New Caledonia; 7Université de Nantes, CNRS, INSERM, L’Institut du Thorax, Nantes, France; 8Ecole Pratique des Hautes Etudes, EPHE, Université PSL, Paris, France; 9Laboratoire d’Excellence GR-Ex, Paris, France; 10Inserm U1231, Université de Bourgogne, Dijon, France and 11France Intergroupe Myeloprolifératifs (FIM), Paris, France
*LB and MR contributed equally as first authors. #BG and FG contributed equally as senior authors.
Correspondence: F. GIRODON - francois.girodon@chu-dijon.fr https://doi.org/10.3324/haematol.2023.284658
MR, MG, FD, and M-AG recruited patients. NM, BA, and BG performed genetic analyses, FG, LB, and BG wrote the manuscript and designed the study. FG directed the study. All authors contributed to the research and approved the final manuscript.
2. Juvonen E, Ikkala E, Fyhrquist F, Ruutu T. Autosomal dominant erythrocytosis caused by increased sensitivity to erythropoietin. Blood. 1991;78(11):3066-3069.
3. de la Chapelle A, Träskelin AL, Juvonen E. Truncated erythropoietin receptor causes dominantly inherited benign human erythrocytosis. Proc Natl Acad Sci U S A. 1993;90(10):4495-4499.
4. Huang LJ, Shen YM, Bulut GB. Advances in understanding the pathogenesis of primary familial and congenital polycythaemia. Br J Haematol. 2010;148(6):844-852.
5. Pasquier F, Marty C, Balligand T, et al. New pathogenic mechanisms induced by germline erythropoietin receptor mutations in primary erythrocytosis. Haematologica. 2018;103(4):575-586.
6. Lo Riso L, Vargas-Parra G, Navarro G, et al. Identification of two novel EPOR gene variants in primary familial polycythemia: case report and literature review. Genes. 2022;13(10):1686.
7. Filser M, Aral B, Airaud F, et al. Low incidence of EPOR mutations in idiopathic erythrocytosis. Haematologica. 2021;106(1):299-301.
8. Miyakis S, Lockshin MD, Atsumi T, et al. International consensus statement on an update of the classification criteria for definite antiphospholipid syndrome (APS). J Thromb Haemost.
Acknowledgments
We thank Suzanne Rankin (University Hospital, Dijon, France) for revising the manuscript.
Funding
This study was supported by grants from the Région des Pays de la Loire (project “EryCan”), the ANR (PRTS 2015 “GenRED” and AAPG 2020 “SplicHypoxia”), the Labex GR-Ex, reference ANR-11LABX-0051, and Fonds Européen de Développement Régional (FEDER) Bourgogne Franche Comté.
Data-sharing statement
Data and detailed information related to the study are available from the corresponding author upon request.
2006;4(2):295-306.
9 McMullin MF, Bento C, Rossi C, Rainey MG, Girodon F, Cario H. Outcomes of pregnancy in patients with congenital erythrocytosis. Br J Haematol. 2015;170(4):586-588.
11. Gordeuk VR, Key NS, Prchal JT. Re-evaluation of hematocrit as a determinant of thrombotic risk in erythrocytosis. Haematologica. 2019;104(4):653-658.
12. Gordeuk VR, Miasnikova GY, Sergueeva AI, et al. Thrombotic risk in congenital erythrocytosis due to up-regulated hypoxia sensing is not associated with elevated hematocrit. Haematologica. 2020;105(3):e87-e90.
13. Karaghiannis V, Maric D, Garrec C, et al. Comprehensive in silico and functional studies for classification of EPAS1/HIF2A genetic variants identified in patients with erythrocytosis. Haematologica. 2023;108(6):1652-1666.
14 Delamare M, Le Roy A, Pacault M, et al. Characterization of genetic variants in the EGLN1/PHD2 gene identified in a European collection of patients with erythrocytosis. Haematologica. 2023;108(11):3068-3085.
15. McMullin MFF, Mead AJ, Ali S, et al. A guideline for the management of specific situations in polycythaemia vera and secondary erythrocytosis: a British Society for Haematology guideline. Br J Haematol. 2019;184(2):161-175.
Dexamethasone treatment for COVID-19 is related to increased mortality in hematologic malignancy patients: results from the EPICOVIDEHA registry
The optimal treatment strategies for hematological malignancy patients with COVID19 are still unclear with respect to the selection and timing of anti-viral as well as anti-inflammatory therapies. Most COVID-19 management recommendations have been adapted from the ones used in immunocompetent patients.1,2 However, immunosuppressed patients often have substantial alterations in their adaptive and innate immunity that affect the pathophysiology of SARS-CoV-2 infection and often have reduced anti-viral immunity as well as dysfunctional inflammatory response. As a result, we hypothesize that these patients mainly benefit more from antiviral treatment, whereas dexamethasone may perpetuate the intrinsic immunosuppression and be even detrimental. Our study demonstrates that dexamethasone treatment for SARS-CoV-2 infection is related to increased mortality in hematological malignancy patients, even during the omicron wave with most patients being fully vaccinated. Data included were exported from the EPICOVIDEHA registry ( clinicaltrials gov. Identifier: NCT04733729). The corresponding local ethics committee of each participating institution has approved the EPICOVIDEHA study when applicable. The local Institutional Review Board and Ethics Committee of the Fondazione Policlinico Universitario Agostino Gemelli—IRCCS, Università Cattolica del Sacro Cuore of Rome, Italy, approved the multicenter, non-interventional EPICOVIDEHA study (study ID: 3226). Both hospitalized and non-hospitalized patients were eligible for inclusion. Each patient was reviewed for validity following the inclusion criteria: i) patient >18 years old, ii) hematological malignancies with activity during the 5 years before COVID-19, iii) confirmed diagnosis for COVID-19 and iv) COVID-19 treatment information. Mortality rate was reported at 90 days after COVID-19 diagnosis. Classification of COVID-19 role in patient’s death was made by the reporting physician. Patients in the study population were classified as following: i) “dexamethasone only” group, for patients treated with dexamethasone exclusively, ii) “dexamethasone plus antivirals” group, for patients having received dexamethasone in addition to antivirals, and iii) in the “antiviral strategy group”, with patients treated with antivirals exclusively. With regard to antivirals regimens, in both antiviral strategy group and the dexamethasone plus antivirals group, antivirals were used in monotherapy or in combination with monoclonal antibodies and convalescent plasma. Differences between treatment groups were assessed by χ2 or Fisher’s exact test. Factors associated with mortality were analyzed by Cox regression. Given the
lack of randomization of therapies, a propensity score of receiving dexamethasone was estimated using a backward stepwise logistic regression model that included variables with P values ≤0.05 in the univariable analysis: age, renal dysfunction, smoking history, status of the malignancy, lymphopenia, previous COVID-19 vaccination, season of COVID-19 diagnosis and COVID-19 severity. The propensity score for receiving dexamethasone was then used as a covariable in a multivariable analysis to adjust for potential confounding factors associated with initial anti-COVID-19 treatment. The goodness of fit of the final multivariable model was assessed by the Hosmer-Lemeshow test and the area under the receiver operating characteristic curve (AUC). Sensitivity analyses were performed by repeating the propensity score approach with different methods, including 1:1 matching with replacement and a calliper of 0.25, as well as quintile stratification. A P value <0.05 was considered statistically significant. Statistical analysis was run with SPSS v25.0 (IBM Corp. Chicago, IL, USA). A total of 5,962 patients with COVID-19 and hematological malignancies were enrolled in EPICOVIDEHA registry. Finally, 2,267 patients were included in the analysis, of whom 500 (22.1%) patients were assigned to the dexamethasone only group, 470 (20.7%) to the dexamethasone plus antivirals group and 1,297 (57.2%) to the antiviral strategy group (Table 1; Online Supplementary Table S3; Online Supplementary Figure S1). Anti-SARS-CoV-2 strategies were administered based on internal criteria of the respective treatment team (Online Supplementary Tables S1, S2). Overall, day-90 mortality was 20.5% (464 patients), 9.8% (223 patients) exclusively related to COVID-19, 6.0% (137) related to both hematological malignancies and SARS-CoV-2 infection and 1.6% (36 patients) not related to the COVID-19 episode. Figure 1A-C detailed the survival probability curves for the three treatment groups of the study, regardless of the pandemic waves and in those patients with omicron infection. Figure 1B detailed the survival probability curves for the groups according to the need of hospital admission, intensive care unit (ICU) admission or outpatients’ care. In the dexamethasone only group, 138 patients (27.6%) died at the end of follow-up versus 86 patients (18.3%) in the dexamethasone plus antivirals group (P>0.001) and 55 patients (4.2%) in the antiviral strategy group (P<0.001). The independents factors associated to mortality were age, chronic liver disease, absence of neutropenia, active hematological malignancy, less than three vaccine doses, need of hospital and ICU admission (Table 2). The dexamethasone only group was an
Figure 1. Survival curves for the three groups of patients with different treatment strategies. (A) All patients. (B) Non-hospitalized (home) patients and hospitalized patients (non-intensive care unit [non-ICU] admitted patients and ICU-admitted patients. (C) SARS-CoV-2 Omicron variant-infected patients.
Table 1. Clinical characteristic by treatment group.
Characteristics
Continued on following page.
Characteristics Dexamethasone plus antivirals N=470 N (%)
dexamethasone only versus dexamethasone plus antivirals Dexamethasone only N=500 N (%)
dexamethasone only versus antivirals
Antiviral strategies N=1,297 N (%)
Hematological malignancy status at coronavirus disease 2019 (COVID-19) onset: “stable disease” indicated patients at watch and wait, “controlled disease” patients in complete or partial remission, and “active diseases” patients on active treatment. Concerning COVID-19 severity: asymptomatic (no clinical signs or symptoms); mild (non-pneumonia and mild pneumonia); severe (dyspnea, respiratory frequency ≥30 breaths per minute, SpO2 ≤ 93%, PaO2/FiO2 < 300, or lung infiltrates > 50%), and critical (patients admitted in intensive care for respiratory failure, septic shock, or multiple organ dysfunction or failure). Asymptomatic patients were diagnosed by COVID-19 after testing as part of routine hospital admission screening or prior to hematologic specific treatment regimen. IQR: interquartile range; CRP: C-reactive protein; PH-negative: Philadelphia chromosome-negative; ICU: intensive care unit.
independent factor related to mortality (absolute hazard ratio [aHR]=0.562, 95% confidence interval [CI]: 0.418-0.754 in the antiviral strategy group; aHR=0.284, 95% CI: 0.1910.422 in the dexamethasone plus antivirals group, P<0.001). This finding remained by incorporating the propensity score for receiving dexamethasone into the model. The goodness of fit was assessed by the Hosmer-Lemeshow test (P=0.099), and the discriminatory power of the score, as evaluated by the area under the curve (AUC), was 0.77 (95% CI: 0.75-0.79). The consistency of this result was confirmed by repeating the propensity score analyses by 1:1 matching with replacement and a calliper of 0.25, and by quintile stratification. The main finding of this study is that the use of dexamethasone treatment for COVID-19 was associated with the worse outcomes in patients suffering from hematological malignancies, especially when antiviral strategies were not concomitantly applied (Figure 1A-C). It is increasingly acknowledged that patients with COVID-19 can present with different clinical phenotypes depending on the pathophysiology complicating the infection.3-5 Low cycle threshold values of the real-time reverse transcription polymerase chain reaction (rRT-PCR) can guide us about the fact that our patients have a high viral load. Conversely, acute elevations in C-reactive protein, ferritin, or lactate dehydrogenase (LDH) values may indicate a hyper-inflammatory syndrome. Personalizing the treatment that
patients receive based on the respective clinical phenotype of COVID-19 is essential to improve the prognosis.4,6 In this scenario, hematological patients may be different compared with immunocompetent general population. First, the process of immune-mediated viral clearance is often distorted in immunosuppressed patients leading to insufficient viral control, which may end up in long-term persistent positive PCR. Thus, the day from the onset of symptoms may not give us optimal information about the need for antivirals. Secondly, hematologic patients with malignancies have commonly pre-existing elevations in LDH and ferritin. It is therefore important not to analyze the absolute value of these markers in COVID-19 but also to consider the longer-time evolution of these inflammatory biomarkers prior and during the infection. Since the beginning of the pandemic, hematological patients have had an increased mortality when compared to the general population.7,8 Most factors associated with mortality identified in our study are well known.9 Our study helps to identify that a delay in antiviral treatment until the patient manifests severe illness and the use of dexamethasone are related to increased mortality in hematological patients with malignancies. Importantly, most patients included in this study presented COVID-19 during the predominance of SARS-CoV-2 Omicron variant.
ment option for COVID-19 patients.10 In the RECOVERY study including mainly unvaccinated patients from the first pandemic wave with wild-type SARS-CoV-2, mortality decreased from 25.7% to 22.9%. In fact, a recent sub-anal-
ysis from this trial, including 1,272 patients admitted with COVID-19 for hypoxemia mainly receiving oxygen, showed that higher doses of dexamethasone in patients with high viral load significantly increased the risk of death, com-
Table 2. Factors related with mortality in univariate and multivariate analyses.
Comorbidities at COVID-19 onset
malignancy at COVID-19 onset
Status malignancy at COVID-19 onset
SARS-CoV-2 vaccination status at COVID-19 onset
Season SARS-CoV-2 diagnosis
Pre-
(before May 2021)
(May 2021-November 2021)
(December 2021-onwards)
Stay during COVID-19 episode
Home
COVID-19 treatment
Dexamethasone only
Antiviral strategy group
plus antivirals
Neutropenia: absolute neutrophil count of less than 0.5x10⁹/L during more than 7 days. Lymphopenia: absolute lymphocyte count of less than 0.2x10⁹/L during more than 7 days. COVID-19; coronavirus disease 2019; CI: confidence interval; HR: hazard ratio, ICU: intensive care unit; PH-negative: Philadelphia chromosome-negative.
pared with patients receiving usual care.11 No severe immunosuppressant patients were included. Data validating these results in immunocompromised patients has been never reported. Our study provides clear real-life evidence against the general use of dexamethasone in this population, specially without antivirals, regardless of SARS-CoV-2 variant predominance. Interesting, mortality in ICU patients is very high and seems not to be influenced by detailed treatment strategies. Dexamethasone potentially diminishes type I interferon (INF) response, an endogenous cytokine essential to avoid escape of SARS-CoV-2 and it may also increase SARS-CoV-2 viral load and prolongs SARS-CoV-2 viral shedding.12 Our study contributes additional evidence to previously documented results supporting the improving outcomes related with the use of early antiviral strategies in patients with hematological malignancies and COVID-19.13-15 The strengths of this study are the large number of patients included, the multicenter approach and the extensive data gathered. However, there are some limitations, this study was non-randomized and non-interventional, with treatment decisions made by attending physicians. The absence of randomization introduces the potential for selection bias. Nevertheless, we employed propensity score methodology to mitigate the impact of these limitations. The retrospective design of the study may inherently result in lower data quality. Additionally, the analysis spanned a dynamic period, making it impossible to completely rule out the presence of a calendar effect on certain aspects, such as the evolving medical expertise in COVID-19. Data on the cycling time (Ct) of rRT-PCR or other surrogate viral marker (subgenomic RNA) are not available. Finally, we report the limitation of missing information on the day of starting different treatments after symptoms onset. In conclusion, this real-life large multicenter study showed the potential worse effect of dexamethasone treatment for COVID-19 in hematological patients with malignancies, even in the omicron era with most vaccinated patients. General treatment recommendations for patients with COVID-19 can be used with caution in patients with immunosuppression. New studies to provide high quality recommendations and treatment guidelines addressed to solve the specific problems of COVID-19 in patients with hematological malignancies are needed.
Authors
Tommaso Francesco Aiello,1* Jon Salmanton-García,2* Francesco Marchesi,3 Barbora Weinbergerová,4 Andreas Glenthøj,5 Jens Van Praet,6 Francesca Farina,7 Julio Dávila-Valls,8 Sonia Martín-Pérez,8 Shaimaa El-Ashwah,9 Martin Schönlein,10 Iker Falces-Romero,11-12 Jorge Labrador,13 Uluhan Sili,14 Caterina Buquicchio,15 Antonio Vena,16 Gaëtan Plantefeve,17 Verena Petzer,18 Monika M. Biernat,19 Tobias Lahmer,20 Ildefonso Espigado,21 Jaap Van Doesum,22 Ola Blennow,23 Klára Piukovics,24 Carlo Tascini,25 Michail Samarkos,26 Yavuz M. Bilgin,27 Luana
Fianchi,28 Federico Itri,29 Toni Valković,30-31 Nicola S. Fracchiolla,32 Michelina Dargenio,33 Moraima Jiménez,34-35 Ferenc Magyari,36 Alberto López-García,37 Lucia Prezioso,38 Natasha Čolović,39 Evgenii Shumilov,40 Ghaith Abu-Zeinah,41 Carolin Krekeler,42 Esperanza Lavilla-Rubira,43 Mario Virgilio Papa,44 Tomás José González-López,45 László Imre Pinczés,46 Fatih Demirkan,47 Natasha Ali,48 Caroline Besson,49 Guillemette Fouquet,50 Alessandra Romano,51 José-Ángel HernándezRivas,52 Maria Ilaria Del Principe,53 Avinash Aujayeb,54 Maria Merelli,55 Sylvain Lamure,56 Joyce Marques De Almeida,57 Maria Gomes Da Silva,58 Noha Eisa,59 Joseph Meletiadis,60 Ikhwan Rinaldi,61 Olimpia Finizio,62 Ozren Jaksic,63 Mario Delia,64 Summiya Nizamuddin,65 Monia Marchetti,66 Marriyam Ijaz,65 Marina Machado,67 Rebeca BailénAlmorox,68 Martin Čerňan,69 Nicola Coppola,70 Eleni Gavriilaki,71 Chiara Cattaneo,72 Ana Groh,73 Zlate Stojanoski,74 Nurettin Erben,75 Nikola Pantic,39 Gustavo-Adolfo Méndez,76 Roberta Di Blasi,77 Stef Meers,78,79 Cristina De Ramón,80-81 Nathan C. Bahr,82 Ziad Emarah,83 Gina Varricchio,44 Milche Cvetanoski,74 Ramón García-Sanz,80 Mirjana Mitrovic,39 Raphaël Liévin,84 Michaela Hanakova,85 Zdeněk Ráčil,85 Maria Vehreschild,73 Athanasios Tragiannidis,86 Raquel Nunes Rodrigues,87 Daniel García-Bordallo,43 Raul Cordoba,37 Alba Cabirta,34 Anna Nordlander,23 Emanuele Ammatuna,22 Elena Arellano,21 Dominik Wolf,18 Romane Prin,17 Alessandro Limongelli,16 Martina Bavastro,16 Gökçe Melis Çolak,14 Stefanie Gräfe,2 Ditte Stampe Hersby,5 Laman Rahimli,2 Oliver A. Cornely,2 Carolina Garcia-Vidal1,12# and Livio Pagano28#
*TFA and JS-G contributed equally as first authors.
#CG-V and LP contributed equally as senior authors.
1Infectious Diseases Department, Hospital Clinic of Barcelona-IDIBAPS, Universitat de Barcelona, Barcelona, Spain; 2University of Cologne, Faculty of Medicine and University Hospital Cologne, Translational Research, Cologne Excellence Cluster on Cellular Stress Responses in Aging-Associated Diseases (CECAD), Cologne, Germany; 3Hematology and Stem Cell Transplant Unit, IRCCS Regina Elena National Cancer Institute, Rome, Italy; 4Department of Internal Medicine - Hematology and Oncology, Masaryk University Hospital Brno, Brno, Czech Republic; 5Department of Hematology, Copenhagen University HospitalRigshospitalet, Copenhagen, Denmark; 6Department of Nephrology and Infectious diseases, AZ Sint-Jan Brugge-Oostende AV, Brugge, Belgium; 7IRCCS Ospedale San Raffaele, Milan, Italy; 8Hospital Nuestra Señora de Sonsoles, Ávila, Spain; 9Oncology Center, Mansoura University, Mansoura, Egypt; 10Department of Oncology, Hematology and Bone Marrow Transplantation with Section of Pneumology, University Medical Center Hamburg-Eppendorf, Hamburg, Germany; 11La Paz University Hospital, Madrid, Spain; 12CIBERINFEC, Instituto de Salud Carlos III, Madrid, Spain; 13Department of Hematology, Research Unit, Hospital Universitario de Burgos, Burgos, Spain; 14Department of Infectious Diseases and Clinical Microbiology, School of Medicine, Marmara University, Istanbul, Turkey; 15Hematology Department, Dimiccoli Hospital, Barletta, Italy; 16Ospedale San Martino, Genova, Italy; 17Centre Hospitalier d’Argenteuil, Argenteuil, France; 18Department of Hematology and Oncology, Medical University of Innsbruck, Innsbruck, Austria; 19Department of Hematology, Blood Neoplasms, and Bone Marrow Transplantation, Wroclaw Medical University, Wroclaw, Poland; 20Medizinische Klinik II, Klinikum rechts der Isar, TU
München, Munich, Germany; 21Department of Hematology, University Hospital Virgen Macarena - University Hospital Virgen del Rocío, Instituto de Biomedicina de Sevilla (IBIS/CSIC), Universidad de Sevilla, Seville, Spain; 22University Medical Center Groningen, Groningen, the Netherlands; 23Department of Infectious Diseases, Karolinska University Hospital, Stockholm, Sweden; 24Department of Internal Medicine, South Division Faculty of Medicine University of Szeged, Szeged, Hungary; 25Azienda Sanitaria Universitaria del Friuli Centrale, Udine, Italy; 26Laikon Hospital, Athens, Greece; 27Department of Internal Medicine, ADRZ, Goes, the Netherlands; 28Hematology Unit, Fondazione Policlinico Universitario Agostino Gemelli - IRCCS, Rome, Italy; 29San Luigi Gonzaga Hospital - Orbassano, Orbassano, Italy; 30University Hospital Centre Rijeka, Rijeka, Croatia; 31Croatian Cooperative Group for Hematological Diseases (CROHEM), Faculty of Medicine and Faculty of Health Studies University of Rijeka, Rijeka, Croatia; 32Fondazione IRCCS Ca’ Granda Ospedale Maggiore Policlinico, Milan, Italy; 33Hematology and Stem Cell Transplant Unit, Vito Fazzi, Lecce; 34Department of Hematology, Vall d’Hebron Hospital Universitari, Experimental Hematology, Vall d’Hebron Institute of Oncology (VHIO), Vall d’Hebron Barcelona Hospital Campus, Barcelona, Spain; 35Departament de Medicina, Universitat Autònoma de Barcelona, Bellaterra, Spain; 36Division of Hematology, Institution of Internal Medicine, Faculty of Medicine, University of Debrecen, Debrecen, Hungary; 37Fundación Jimenez Diaz University Hospital, Health Research Institute IIS-FJD, Madrid, Spain; 38Hospital University of Parma - Hematology and Bone Marrow Unit, Parma, Italy; 39University Clinical Center Serbia, Medical Faculty University Belgrade, Belgrade, Serbia; 40UK Münster, Münster, Germany; 41Division of Hematology and Oncology, Weill Cornell Medicine, New York, NY, USA; 42Department of Medicine A, Hematology, Oncology and Pneumology, University Hospital Münster (UKM), Münster, Germany; 43Hospital Lucus Augusti, Lugo, Spain; 44Azienda Ospedaliera Sant’Anna e San Sebastiano, Caserta, Italy; 45Department of Hematology, Hospital Universitario de Burgos, Burgos, Spain; 46Division of Hematology, Department of Internal Medicine, Faculty of Medicine, University of Debrecen, Debrecen, Hungary; 47Dokuz Eylul University, Division of Hematology, Izmir, Turkey; 48Aga Khan University, Karachi, Pakistan; 49Centre Hospitalier de Versailles, Le Chesnay and Université ParisSaclay, UVSQ, INSERM, Équipe “Exposome et Hérédité”, CESP, Villejuif, France; 50Department of Hematology, CH Sud Francilien, Corbeil Essonnes, France; 51Divisione Clinicizzata di Ematologia, Ospedale Ferrarotto, Catania, Italy; 52Hospital Universitario Infanta Leonor, Madrid, Spain; 53Hematology, Department of Biomedicine and Prevention, University of Rome Tor Vergata, Rome, Italy; 54Northumbria Healthcare, Newcastle, UK; 55Azienda Sanitaria Universitaria del Friuli Centrale, Udine, Italy; 56Department of Clinical Hematology, Montpellier University Hospital, IGMM UMR5535 CNRS, University of Montpellier, Montpellier, France; 57Istituto Oncologico della Svizzera Italiana, Bellinzona, Switzerland; 58Portuguese Institute of Oncology, Lisbon, Portugal; 59Aseer Central Hospital, Abha, Saudi Arabia; 60Clinical Microbiology Laboratory, Medical School, “Attikon” University General Hospital, National and Kapodistrian University of Athens, Athens, Greece; 61Division of Hematology and Medical Oncology, Department of Internal Medicine, Faculty of Medicine Universitas Indonesia - Cipto Mangunkusumo Hospital, Jakarta, Indonesia; 62UOC
Hematology, AORN Cardarelli, Naples, Italy; 63Department of Hematology, University Hospital Dubrava, Zagreb, Croatia; 64Hematology and Stem Cell Transplantation Unit, AOUC Policlinico, Bari, Italy; 65Memorial Cancer Hospital and Research Center, Lahore, Pakistan; 66Azienda Ospedaliera Nazionale SS. Antonio e Biagio e Cesare Arrigo, Alessandria, Italy; 67Clinical Microbiology and Infectious Diseases Department, Hospital General Universitario Gregorio Marañón, Madrid, Spain; 68Hematology Department, Hospital General Universitario Gregorio Marañón, Madrid, Spain; 69Department of Hemato-Oncology, Faculty of Medicine and Dentistry, Palacky University and University Hospital Olomouc, Olomouc, Czech Republic; 70Department of Mental Health and Public Medicine, University of Campania, Naples, Italy; 71General Hospital of Thessaloniki “George Papanikolaou”, Thessaloniki, Greece; 72Hematology Unit, ASST-Ospedali Civili, Brescia, Italy; 73Infektiologie, Universitätsklinikum Frankfurt am Main, Frankfurt am Main, Germany; 74University Clinic of Hematology, Skopje, North Macedonia; 75Department of Infectious Diseases and Clinical Microbiology, Faculty of Medicine Eskisehir Osmangazi University, Eskisehir, Turkey; 76Hospital Escuela de Agudos Dr. Ramón Madariaga, Posadas, Argentina; 77Service d’Hematologie-Oncologie, Hopital St Louis, Assistance Publique - Hopitaux de Paris, Université de Paris Diderot, Paris, France; 78AZ KLINA, Brasschaat, Belgium; 79IBSAL, Centro de Investigación del Cáncer-IBMCC (USAL-CSIC), Salamanca, Spain; 80Hematology Department, Hospital Universitario de Salamanca, Salamanca, Spain; 81IBSAL, Centro de Investigación del Cáncer-IBMCC (USAL-CSIC), Salamanca, Spain; 82University of Kansas Medical Center, Kansas City, MO, USA; 83Oncology Center, Mansoura University, Mansoura, Egypt; 84Hospital St Louis, Paris, France; 85Institute of Hematology and Blood Transfusion, Prague, Czech Republic; 86Aristotle University of Thessaloniki, Thessaloniki, Greece and 87Portuguese Institute of Oncology, Lisbon, Portugal
Correspondence:
C. GARCIA-VIDAL - cgarciav@clinic.cat
J. SALMANTON-GARCIA - jon.salmanton-garcia@uk-koeln.de https://doi.org/10.3324/haematol.2023.284678
Received: December 12, 2023. Accepted: March 22, 2024. Early view: April 4, 2024.
CG-V has received honoraria for talks on behalf of Gilead Science, MSD, Pfizer, Janssen, Novartis, Basilea, GSK, Shionogi, AbbVie and Advanz Pharma; and a grant support from Gilead Science, Pfizer, GSK, MSD and Pharmamar.
ES, GAZ, CK, ELR, MP, TGL, LP, FD, NA, CB, GF, AR, JHR, MDP, AA, MM, SL, JMDA, MGDS, NE, JM, IR, OF, OJ, MD, SN, MM, MI, MM, RBA, MC, NC, EG, CC, AG, ZS, NE, NP, GM, RDB, SM, CDR, NB, ZE, GV, MC, RGS, MM, RL, MH, ZR, MV, A.T, RNR, DGB, RC, AC, AN, EA, EA, DW, RP, AL, MB, GC, SG, DH and LR. Formal analysis by CGV and JSG. Project administration by CGV, JSG and TFA. Writing of the original draft by CGV, TFA and JSG. Reviewing and editing of the manuscript by CGV, TFA, JSG, OAC, LP. FM, BW, AG, JVP, FF, JDV, SMP, SEA, MS, IFR, JL, US, CB, AV, GP, VP, MB, TL, IE, JVD, OB, KP, CT, MS, YB, LF, FI, TV, NF, MD, MJ, FM, ALG, LP, NC, ES, GAZ, CK, ELR, MP, TGL, LP, FD, NA, CB, GF, AR, JHR, MDP, AA, MM, SL, JMDA, MGDS, NE, JM, IR, OF, OJ, MD, SN, MM, MI, MM, RBA, MC, NC, EG, CC, AG, ZS, NE, NP, GM, RDB, SM, CDR, NB, ZE, GV, MC, RGS, MM, RL, MH, ZR, MV, AT, RNR, DGB, RC, AC, AN, EA, DW, RP, AL, MB, GC, SG, DH and LR.
Acknowledgments
Acknowledged are the following collaborative group members: M. Mladenović, C. Flasshove, B. Mišković, J-M Ribera-Santa Susana, M. Hoenigl, J. Prattes, M. Mikulska, A. Cuccaro, E. Bekirova, J. Batinić, N. De Jonge, T. Adžić-Vukičević, L. Drgoňa, H. M. Orth, F. Reizine, M. Piedimonte, J. Schubert, A. Soto-Silva, J. Loureiro-Amigo, L. Serrano, L. Lorenzo De La Peña, A. Guidetti, I. Ormazabal-Vélez, S. Malak, M. Calbacho, N. Fernández, R. F. Duarte, E. De Kort, G. Cengiz Seval, L.
References
1. Cesaro S, Ljungman P, Mikulska M, et al. Recommendations for the management of COVID-19 in patients with haematological malignancies or haematopoietic cell transplantation, from the 2021 European Conference on Infections in Leukaemia (ECIL 9). Leukemia. 2022;36(6):1467-1480.
2. Pan H, Peto R, Henao-Restrepo AM, et al. Repurposed antiviral drugs for Covid-19 - Interim WHO Solidarity Trial Results. N Engl J Med. 2021;384(6):497-511.
3. Aiello TF, Puerta-Alcalde P, Chumbita M, et al. Infection with the Omicron variant of SARS-CoV-2 is associated with less severe disease in hospitalized patients with COVID-19. J Infect. 2022;85(5):e152-e154.
4 Garcia-Vidal C, Moreno-García E, Hernández-Meneses M, et al. Personalized therapy approach for hospitalized patients with coronavirus disease 2019. Clin Infect Dis. 2022;74(1):127-159.
5. Hedberg P, Karlsson Valik J, Van Der Werff S, et al. Clinical phenotypes and outcomes of SARS-CoV-2, influenza, RSV and seven other respiratory viruses: a retrospective study using complete hospital data. Thorax 2022;77(2):1-10.
6. Garcia-Vidal C, Alonso R, Camon AM, et al. Impact of remdesivir according to the pre-admission symptom duration in patients with COVID-19. Journal of Antimicrobial Chemotherapy 2021;76(12):3296-3302.
7 Blennow O, Salmanton-García J, Nowak P, et al. Outcome of infection with omicron SARS-CoV-2 variant in patients with hematological malignancies: an EPICOVIDEHA survey report. Am J Hematol. 2002;97(8):E312-E317.
8. Vijenthira A, Gong IY, Fox TA, et al. Outcomes of patients with hematologic malignancies and COVID-19: a systematic review and meta-analysis of 3377 patients. Blood.
Verga, R. Bergantim, M-J. Jiménez-Lorenzo, J. Maertens, N. Khanna, M. Egger, O-F. Coronel-Ayala, P. Zdziarski, A. Busca, E. Busch, C. B. Poulsen, F. Danion, T. Cushion, S. Pinzón, Y. Gonzaga, A. Kulasekararaj, H. Zarrinfar, B. Hoell-Neugebauer, C. S. Kho, R. Duléry, M. Kolditz, M. Fung and A. D. Tanase.
Funding
This study has been co-funded by the European Regional Development Fund (EDRD). CG-V [FIS PI21/01640] have received research grants from the Ministerio de Sanidad y Consumo, Instituto de Salud Carlos III. The Project PI21/01640 has been funded by Instituto de Salud Carlos III (ISCIII) and co-funded by the European Union. No funding bodies had any role in study design, data collection and analysis, decision to publish, or preparation of the manuscript. This work was co-funded by a research grant (SGR 01324 Q5856414G) from the AGAUR (Agencia de Gestión de Ayudas Universitarias y de Investigación) of Catalunya. A-TF has received a pre-doctoral grant supported by the Ministerio de Sanidad y Consumo, Instituto de Salud Carlos III [RH RH042953].
Data-sharing statement
Data were collected via the EPICOVIDEHA electronic case report form (eCRF), available at www.clinicalsurveys.net (EFS Summer 2021, TIVIAN, Cologne, Germany).
2020;136(25)2881-2892.
9 Sharma A, Bhatt NS, St Martin A, et al. Clinical characteristics and outcomes of COVID-19 in haematopoietic stem-cell transplantation recipients: an observational cohort study. Lancet Haematol. 2021;8(3):e185-e193.
10. Horby P, Lim WS, Emberson JR, et al. Dexamethasone in hospitalized patients with Covid-19. N Engl J Med. 2021;384(8):693-704.
11. Abani O, Abbas A, Abbas F, et al. Higher dose corticosteroids in patients admitted to hospital with COVID-19 who are hypoxic but not requiring ventilatory support (RECOVERY): a randomised, controlled, open-label, platform trial. Lancet. 2023;401(10387):1499-1507.
12. Camon AM, Alonso R, Muñoz FJ, et al. C-reactive protein cut-off for early tocilizumab and dexamethasone prescription in hospitalized patients with COVID-19. Sci Rep 2022;12(1):5250.
13. Aiello T-F, Puerta-Alcalde P, Chumbita M, et al. Current outcomes of SARS-CoV-2 Omicron variant infection in high-risk haematological patients treated early with antivirals. J Antimicrob Chemother. 2023;78(6):1454-1459.
14 Mikulska M, Sepulcri C, Dentone C, et al. Triple combination therapy with 2 antivirals and monoclonal antibodies for persistent or relapsed severe acute respiratory syndrome coronavirus 2 infection in immunocompromised patients. Clin Infect Dis. 2023;77(2):280-286.
15. Salmanton-García J, Marchesi F, Gomes da Silva M, et al. Nirmatrelvir/ritonavir in COVID-19 patients with haematological malignancies: a report from the EPICOVIDEHA registry. EClinicalMedicine. 2023;58:101939.
IRF4-BLOC1S5: the first rearrangement gene identified in TEMPI syndrome
TEMPI syndrome is a rare multisystem disorder characterized by telangiectasias, elevated erythropoietin and erythrocytosis, monoclonal gammopathy, perinephric fluid collections and intrapulmonary shunting, first described by Sykes and reported in the literature in a total of 29 patients.1 Regimens based on plasma cell-directed drugs have shown to be effective, 2 suggesting a pathogenic role of the monoclonal antibody or the monoclonal plasma cell in the syndrome. It has been hypothesized that autoimmune or oxygen sensing disorders mediated by aberrant monoclonal antibodies or their fragments are involved in the pathogenesis of TEMPI syndrome.2,3 However, no convincing evidence has been identified. Professor Hu has reported the duplication of 22q11.23, where the gene of macrophage migration inhibitory factor (MIF) is located, in one TEMPI syndrome case and high expression of MIF was observed in three TEMPI syndrome patients, suggesting a possible role of MIF in the pathophysiology of TEMPI syndrome,4 which still needed further study to verify these findings as recurrent or episodic. In this study, we report a novel fusion gene, IRF4-BLOC1S5, that drives the expansion of a plasma cell clone in a TEMPI syndrome patient. The patient exhibited a favorable response to a bortezomib-based regimen with decreased IRF4-BLOC1S5 expression, consistent with in vitro sensitivity data. This report unveils a previously unreported fusion gene between IRF4 and BLOC1S5, offering a pioneering insight into the molecular mechanism implicated in TEMPI syndrome and opening avenues for targeted therapeutic strategies. A 75-year-old female, with an 8-year history of diffuse telangiectasia, was referred to our hospital in July 2019 with unexplained erythrocytosis and exertional dyspnea. The physical examination corroborated the presence of widespread telangiectasia (Figure 1A). The laboratory investigations revealed elevated hemoglobin (156 g/L), serum erythropoietin (1,035 mIU/mL), and immunoglobulin A- l monoclonal protein (10.96 g/L). Bone marrow aspirates indicated 13% monoclonal plasma cells, expressed with CD38 +, CD138 +, CD19 , CD56 +, CD117P +, CD27dim, CD81 dim , CD45 dim. Imaging confirmed perinephric fluid collections, and 99mTc macro-aggregated albumin scintigraphy detected intrapulmonary shunting (Figure 1A). The patient did not exhibit signs and symptoms of hypercalcemia, renal failure, anemia, and bone lesion, excluding multiple myeloma. Molecular testing showing that BCR/ABL translocation and mutations of JAK2 V617F , JAK2 exon 12 , CALR, and MFL were negative, excluding myeloproliferative neoplasms. Therefore, a diagnosis of TEMPI syndrome was made.
In order to identify the genetic abnormalities in this pa-
tient, we performed whole-genome sequencing and transcriptome analysis. This study was approved by the Ethics Committee of Ruijin Hospital. Informed consent was obtained from the patient. Whole-genome sequencing of paired tumor (CD138+ plasma cells) and normal samples revealed a 7.6-Mb somatic inversion on chromosome 6 in the region 6p25.3-6p24.3 (Figure 1B; Online Supplementary Figure S1). Bulk RNA sequencing (RNA-seq) showed that this inversion caused fusion of exon 1-5 of IRF4 to the 3’UTR of BLOC1S5, which generated a short N-terminal-truncated IRF4 protein. Western blotting confirmed that the corresponding truncated IRF4 protein was only expressed in the CD138+ plasma cells of this patient, but not in the CD138- cells of this patient (Figure 1C). Furthermore, the truncated IRF4 protein was also not detectable in the multiple myeloma (MM) samples and cells from normal donors (Figure 1D, E). This specificity in expression substantiates the potential role of the truncated IRF4 in the TEMPI syndrome pathogenesis of this patient. In order to decipher the role of the truncated-IRF4 protein in the aberrant plasma cell transcriptional program, single-cell RNA-seq (scRNA-seq) was performed, incorporating data from eight healthy controls to construct normal bone marrow cell types, particularly the scarce plasma cell population. A notable 11.2-fold expansion of the plasma cell population, with high expression of the rearranged IRF4-BLOC1S5, was observed in the patient (Figure 2A, B, D; Online Supplementary Figure S2). Furthermore, incorporating B-cell antigen receptor (BCR) sequence information into the scRNA-seq analysis revealed that this uniquely expanded plasma cluster expressed one specific immunoglobulin clonotype, sharing the same third complementarity determining region (CDR3) sequence (Figure 2B, C). The results indicated that this abnormally expanded cluster shared characteristics of one common B-cell origin. Differentially expressed genes (DEG) in plasma cells between this patient and healthy controls were enriched in the KEGG pathways, such as ribosome and protein processing in endoplasmic reticulum (ER) (Figure 2E, F), implicating that highly expressed truncated IRF4 contributed to the production of monoclonal immunoglobulin and the survival and expansion of monoclonal plasma cells.
In order to further dissect the contribution of the BLOC1S5 moiety to the pathogenic role of the truncated IRF4, we mapped the chromatin occupancy of H3K27 acetylation (H3K27ac) on the BLOC1S5 gene locus and found that high H3K27ac signals were enriched on the 3’UTR of BLOC1S5, i.e., the genomic locus fused to the IRF4 gene (Online Supplementary Figure S3).5 The results suggested that the
inversion did merely truncate IRF4; it also repositioned the regulatory elements of the BLOC1S5 gene in proximity to the truncated IRF4, thereby triggering its overexpression. In order to determine the most appropriate treatment regimen for this patient, we constructed plasma cell lines with the ectopic expression of the IRF4-BLOC1S5 fusion. The cell models were used to test the sensitivity of the fusion-expressing cells to various therapeutic agents commonly used in TEMPI syndrome, such as bortezomib and lenalidomide. Interestingly, we found that cells with the ectopic expression of IRF4-BLOC1S5 demonstrated sensitivity to bortezomib but showed resistance to lenalidomide (Figure 3A-E). This finding was further corrob-
orated by the recent literature, which reported a similar resistance pattern in a multiple myeloma cell line with a similar truncated IRF4 formed by an IRF4-BTN3A3 inversion mutation.6 Based on the in vitro sensitivity data and the patient’s age and overall health status, a decision was made to initiate a bortezomib-based treatment regimen for this patient. After four cycles of bortezomib and dexamethasone (BD) treatment, the patient achieved a complete response with a negative minimal residual disease (MRD) status, undetectable level of the serum M protein and normalization of free light-chain K/ l ratio, hemoglobin and erythropoietin level (Figure 3F-I). The symptoms were completely relieved, with the disappearance of the
Figure 1. Identification of IRF4-BLOC1S5 formed by chromosome inversion in TEMPI syndrome. (A) Clinical photographs of the TEMPI syndrome patient before and after bortezomib and dexamethasone (BD) treatment. The patient had typical clinical manifestations of the TEMPI syndrome, with diffuse telangiectasias on her face, hands, and back, and perinephric fluid collection and intrapulmonary shunting. These symptoms were relieved after 4 cycles of BD treatment. Cycle 1 and 2: bortezomib 1.3 mg/m2 and dexamethasone 40 mg on day (D) 1, 4, 8, 11. Cycle 3: bortezomib 1.0 mg/m2 and dexamethasone 40 mg on D1, 4, 8, 11. Cycle 4: bortezomib 1.0 mg/m2 and dexamethasone 40 mg on D1, 4. (B) The schematic diagram of the rearrangement gene IRF4-BLOC1S5 An inversion on chromosome 6 in the region 6p25.3-6p24.3 was detected by whole-genome sequencing. The resulting transcript included the exon 1-5 of IRF4 and 3’UTR of BLOC1S5 and encoded a short N-terminal-truncated IRF4 protein, verified by RNA sequencing. (C) Expression of the truncated-IRF4 protein in CD138+ cells of the patient. The CD138+ cells were obtained from the bone marrow mononuclear cells (BMNC) with CD138 microbeads. The truncated-IRF4 protein was detected in CD138+ cells of the patient. (D, E) Expression of the truncated-IRF4 protein in CD138+ cells of multiple myeloma (MM) samples. Compared with the BMNC of the healthy donor and CD138+ cells from MM patients and cell lines, the truncated-IRF4 was specifically expressed in CD138+ cells of the patient.
cyanosis, telangiectasias, and perinephric-fluid collection and significant amelioration of intrapulmonary shunting (Figure 1A). Furthermore, the expression of IRF4-BLOC1S5 was significantly decreased after the BD treatment and during the clinical follow-up (up to 18 months) (Figure 3J), suggesting that IRF4-BLOC1S5 could act as a biomarker for TEMPI syndrome treatment and prognosis.
IRF4 plays essential roles in the transition from B cells to plasma cells, orchestrating class-switch recombination and somatic hypermutation.7-9 IRF4 activates genes essential for plasma cell identity and effector function, including
CD138, immunoglobulin heavy/light chains, and XBP1. 10 The high expression of IRF4, necessary for the survival of MM plasma cells, is associated with a poor prognosis11-13 and is often elevated due to IgH/IRF4 rearrangements.14 The truncated-IRF4 protein, a product of this fusion, emerges as a significant factor in the monoclonal gammopathy characteristic of TEMPI syndrome.
The exclusive expression of truncated-IRF4 in the patient’s abnormal plasma cells not only offers insights into disease mechanisms but also presents potential therapeutic avenues. Targeting the aberrant protein or pathways it affects
Figure 2. Strong expansion of the monoclonal plasma cell population accompanied by high expression of IRF4-BLOC1S5. (A) Cluster of cell population specially expanded in the bone marrow mononuclear cells (BMNC) of the patient. The UMAP plot integrated BMNC from normal donors and those from the patient of the TEMPI syndrome. The arrow points to a cluster of cells that was limited to the patient. (B) Plasma cells was particularly expanded in the patient. The same UMAP plot as is in (A) was separated, and the different cell clusters were identified by cell markers. The arrow points to the specifically expanded cell cluster which was mapped to plasma cells. (C) Plasma cells from the patient showed hyper-expansion and monoclonality. The UMAP plot of the patient was analyzed by B-cell antigen receptor (BCR) sequence. The color gradient corresponds to the expansion. (D) Percent of plasma cells occupied in BMNC of normal donors and the patient of the TEMPI syndrome. (E) Differentially expressed genes (DEG) in plasma cells. Comparison of the RNA profiling of plasma cells from normal donors and the patient by single-cell RNA sequencing. The DEG are shown in the dot plot. (F) Enriched KEGG pathways of DEG. The DEG from panel (E) were analyzed for functional enrichment analysis. The dot size represents the number of genes associated with a specific term. The dot color represents the adjusted P value.
Figure 3. The TEMPI syndrome patient with high IRF4-BLOC1S5 expression was sensitive to bortezomib treatment. (A) The exogenous IRF4-BLOC1S5 fusion protein was overexpressed in the NCI-H929 and RPMI 8226 cell line. (B, C) RPMI 8226 cells overexpressing IRF4-BLOC1S5 were treated with bortezomib 0, 0.5, 1, 1.5, 2, 3, 4, 5, 7.5, 10 nM for 2 days and lenalidomide 0, 1, 2, 4, 6, 8, 10, 20, 40, 80 μM for 5 days. (D, E) NCI-H929 cells overexpressing IRF4-BLOC1S5 were treated with bortezomib 0, 0.5, 1, 1.5, 2, 3, 4, 5, 7.5, 10 nM for 2 days and lenalidomide 0, 1, 2, 4, 6, 8, 10, 20, 40, 80 μM for 5 days. CCK-8 assay was applied to detect the cell viability. (F-I) Trend of serum M-protein, free light-chain K/l ratio, hemoglobin and erythropoietin of the TEMPI patient after bortezomib and dexamethasone treatment. (J) Expression level of IRF4-BLOC1S5 of the patient in clinical follow-ups. Quantitative real-time polymerase chain reaction was performed to monitor the expression level of IRF4-BLOC1S IRF4-BLOC1S5 was significantly decreased after bortezomib treatment. vec: Vector.
could pave the way for more effective treatments for TEMPI syndrome. The patient’s positive response to bortezomib, a proteasome inhibitor, suggests that therapies targeting protein degradation pathways might be particularly promising. While this case report sheds light on possible molecular mechanisms driving TEMPI syndrome, further studies are essential. Investigating the prevalence of the IRF4-BLOC1S5 fusion in other TEMPI patients, exploring its functional implications in cellular models or mouse models, and assessing the therapeutic potential of targeting this fusion are all critical future directions.
1Shanghai Institute of Hematology, State Key Laboratory for Medical Genomics, National Research Center for translational Medicine at Shanghai, Ruijin Hospital Affiliated to Shanghai Jiao Tong University School of Medicine; 2School of Life Sciences and Biotechnology, Shanghai Jiao Tong University; 3Department of General Practice,
Ruijin Hospital Affiliated to Shanghai Jiao Tong University School of Medicine and 4Hongqiao International Institute of Medicine, Shanghai Tongren Hospital/Faculty of Basic Medicine, Department of Pathophysiology, Key Laboratory of Cell Differentiation and Apoptosis of the Chinese Ministry of Education, Shanghai Jiao Tong University School of Medicine, Shanghai, China
*MZ, JL and QY contributed equally as first authors. #HY and KW contributed equally as senior authors.
1. Sykes DB, Schroyens W, O’Connell C. The TEMPI syndrome - a novel multisystem disease. N Engl J Med. 2011;365(5):475-477.
2. Sykes DB, O’Connell C, Schroyens W. The TEMPI syndrome. Blood. 2020;135(15):1199-1203.
3. Zhang X, Fang M. TEMPI syndrome: erythrocytosis in plasma cell dyscrasia. Clin Lymphoma Myeloma Leuk. 2018;18(11):724-730.
4 Sun C, Xu J, Zhang B, et al. Whole-genome sequencing suggests a role of MIF in the pathophysiology of TEMPI syndrome. Blood Adv. 2021;5(12):2563-2568.
5. Jia Y, Zhou J, Tan TK, et al. Myeloma-specific superenhancers affect genes of biological and clinical relevance in myeloma. Blood Cancer J. 2021;11(2):32.
6. Zhu YX, Shi CX, Bruins LA, et al. Identification of lenalidomide resistance pathways in myeloma and targeted resensitization using cereblon replacement, inhibition of STAT3 or targeting of IRF4. Blood Cancer J. 2019;9(2):19.
7 Ochiai K, Maienschein-Cline M, Simonetti G, et al. Transcriptional regulation of germinal center B and plasma cell fates by dynamical control of IRF4. Immunity. 2013;38(5):918-929.
8. Klein U, Casola S, Cattoretti G, et al. Transcription factor IRF4
Contributions
HY, KW, RBR, JML, and YLW designed the research. JL, MZ, ZLZ, ZF, MYJ and XYZ performed experiments. QY, WBX, CYW, CJY, and CW recruited the patient and did the follow-up. MZ, JL, KW, and HY analyzed the results. JL, MZ, KW, and HY wrote the paper.
Acknowledgments
Informed consent was obtained from the patient. The authors thank the patient presented in this study. The computations in this paper were run on the π 2.0 (or the Siyuan-1) cluster supported by the Center for High Performance Computing at Shanghai Jiao Tong University.
Funding
This work was supported by grants from the National Key R&D Program of China (2023YFA1800401) and the National Nature Science Foundation of China 82350710226, 82370178, 82170195 and 81470339.
Data-sharing statement
The sequence data reported in this paper have been deposited in National Genomics Data Center, China National Center for Bioinformation/Beijing Institute of Genomics, Chinese Academy of Sciences (BioProject: PRJCA022841) that are publicly accessible at https://ngdc.cncb.ac.cn/.
controls plasma cell differentiation and class-switch recombination. Nat Immunol. 2006;7(7):773-782.
9 Sciammas R, Shaffer AL, Schatz JH, Zhao H, Staudt LM, Singh H. Graded expression of interferon regulatory factor-4 coordinates isotype switching with plasma cell differentiation. Immunity. 2006;25(2):225-236.
10 Low MSY, Brodie EJ, Fedele PL, et al. IRF4 activity is required in established plasma cells to regulate gene transcription and mitochondrial homeostasis. Cell Rep. 2019;29(9):2634-2645.
11. Shaffer AL, Emre NC, Lamy L, et al. IRF4 addiction in multiple myeloma. Nature. 2008;454(7201):226-231.
12. Wang L, Yao ZQ, Moorman JP, Xu Y, Ning S. Gene expression profiling identifies IRF4-associated molecular signatures in hematological malignancies. PLoS One. 2014;9(9):e106788.
13. Heintel D, Zojer N, Schreder M, et al. Expression of MUM1/IRF4 mRNA as a prognostic marker in patients with multiple myeloma. Leukemia. 2008;22(2):441-445.
14. Yoshida S, Nakazawa N, Iida S, et al. Detection of MUM1/IRF4IgH fusion in multiple myeloma. Leukemia. 1999;13(11):1812-1816.
Cladribine plus cytarabine plus venetoclax in acute myeloid leukemia relapsed or refractory to venetoclax plus hypomethylating agent
Venetoclax (Ven) in combination with a hypomethylating agent (HMA) is the standard first-line treatment for elderly and unfit patients with newly-diagnosed acute myeloid leukemia (AML), after the phase III VIALE-A trial demonstrated superior complete remission (CR) with or without count recovery (CRi) rates and overall survival (OS) with azacitidine-Ven in comparison to azacitidine monotherapy. Despite superior CR/CRi rates observed in the VIALE-A study, primary refractory disease or relapse was documented in 42% of patients receiving azacitidine-Ven.1 In this regard, we have recently underlined the dismal outcome of patients with newly-diagnosed AML following failure of Ven-HMA therapy, and reported a median survival of ~3 months, which was significantly inferior in the presence of TP53, K/NRAS, or ASXL1 mutations. Importantly, in this particular study, only 11 of 71 (15%) patients received subsequent salvage therapy.2 Similarly, another study of 41 patients with relapsed/refractory AML following frontline Ven-HMA also demonstrated a median OS of 2.3 months, with 24 (59%) patients receiving salvage therapy.3 The aforementioned studies highlight the dire need for additional salvage regimens to extend survival and ensure optimal transplant eligibility, particularly for patients without targetable mutations. A recent phase II study, with cladribine, low-dose cytarabine (Ara-C) and venetoclax (CAV), alternating with azacitidine, in older patients with newly-diagnosed AML, demonstrated a CR/CRi rate of 93%.4 In routine practice, CAV is used as salvage therapy in patients with relapsed/ refractory AML lacking targetable mutations and ineligible for intensive therapy, although efficacy data with this regimen following Ven-HMA is unknown. Accordingly, we sought to determine the efficacy of CAV as a salvage regimen in AML patients following failure of Ven-HMA, including clinical and molecular predictors associated with treatment response and survival.
Under an institutional review board-approved minimum risk protocol, the Mayo Clinic (MN, AZ, FL) database was searched to identify patients with AML who progressed after treatment with Ven-HMA and subsequently received at least one cycle of CAV, outside of clinical trials, between April 2020 and April 2023. Patients received cladribine 5 mg/m2 on days 1-5, low-dose Ara-C, 20 mg/m2 twice daily on days 1-10, and Ven 100-400 mg daily, dose-adjusted based on anti-fungal prophylaxis, on days 1-21, according to treating physician discretion. CAV was administered in the inpatient setting in 17 patients, inpatient followed by outpatient after day 5 in ten, after day 6 in five, after day
7 in four, after day 4 and day 2 in one patient each, and all outpatient in one patient. All patients received anti-bacterial and anti-viral prophylaxis, on the other hand, azole and pneumocystis prophylaxis was administered in 38 (97%) and 21 (54%) of patients, respectively. Bone marrow biopsy, conventional karyotyping, and next-generation sequencing via a 4-, 11-, or 48-gene panel were collected at the discretion of the treating physician, and in most cases occurred at the time of diagnosis. The 2022 European LeukemiaNet (ELN) criteria5 were applied to define disease risk and response to treatment. Significance testing for covariates associated with response was performed via χ2 or Fischer’s exact test for categorical variables and Wilcoxon rank-sum test for continuous variables. Follow-up was updated in December 2023 and survival calculated from the time of CAV treatment to last follow-up or death, and group differences were assessed with the log-rank test. JMP Pro 16.0.0 software package, SAS Institute, Cary, NC was used for statistical analysis.
A total of 39 AML patients (median age 65 years; range, 22-78; 67% male; 64% de novo) relapsed (54%, N=21) or refractory (46%, N=18) to prior chemotherapy, which included Ven-HMA, received CAV (median of 1 cycle; range, 1-5 cycles). A majority (87%, N=34) of these patients had failed or relapsed from Ven-HMA as their most recent line of therapy. Patients had received one (N=16), two (N=14), three (N=5), four (N=2), five (N=1) or nine (N=1) prior therapies, including a median of three cycles of Ven-HMA (range, 1-14 cycles). Nine (23%) patients relapsed following allogeneic hematopoietic stem cell transplant (AHSCT). Median duration of remission in relapsed patients was 7.04 months (range, 1.2-70.1 months). ELN cytogenetic risk at diagnosis included intermediate (46%, N=18), and adverse (54%, N=21). Mutations at diagnosis involved TP53 in nine (23%), K/NRAS in eight (21%), RUNX1 in seven (18%), TET2 in six (15%), ASXL1 in five (13%), STAG2 in five (13%), and IDH1/2 in two (5%) patients, one of whom had received ivosidenib. Eleven (28%) patients achieved CR (5%, N=2) or CRi (23%, N=9); median time to response was 1 month and median response duration was 4.4 months. In addition, one patient achieved partial remission (PR) and two patients had bone marrow aplasia not fulfilling criteria for morphologic leukemia-free state (MLFS). Measurable residual disease (MRD) was negative by multiparametric flow cytometry in two of seven (29%) informative CR/CRi cases. CR/CRi rates were higher in females (54% vs. 15%; P=0.01), de novo versus secondary AML (40% vs. 7%; P=0.02), absence versus presence of
adverse karyotype (50% vs. 9%; P<0.01), and absence versus presence of K/NRAS (35% vs. 0%; P=0.01), ASXL1 (32% vs. 0%; P=0.05), and STAG2 mutations (32% vs. 0%; P=0.05) (Table 1). Multivariable analysis confirmed superior response in de novo AML (P<0.01), absence of adverse karyotype, (P<0.01), and absence of K/NRAS mutations (P=0.02). Notably, CR/ CRi rates were not impacted by relapsed versus refractory disease (29% vs. 28%; P=0.95), exposure to more than one prior line of therapy (25% vs. 33%; P=0.58), prior AHSCT (22% vs. 30%; P=0.64), or TP53 mutations (22% vs. 30%; P=0.64) (Table 1). Five (13%) of patients had monocytic leukemia, CR/CRi rates were 40% versus 26% in patients with versus without monocytic leukemia (P=0.54). The most common
treatment-emergent adverse event was infection (51%, N=20), comprising bacteremia (N=11), bacterial pneumonia (N=10), and abscesses (N=6). Of these infections, 85% were grade 3 or higher, including two fatal episodes of septic shock, involving an E. faecium peri-rectal abscess and P. aeruginosa pneumonia. None of the patients developed pneumocystis pneumonia. Less frequent toxicities included liver dysfunction (18%, N=7, of which 3 were grade 3) and tumor-lysis syndrome (2%, N=1, grade 3).
At a median follow-up of 4.7 months (range, 0.4-17.5 months) from the initiation of CAV, 34 deaths (87%), seven relapses (18%), and seven AHSCT (18%) were documented. Five patients remain alive and are disease-free at the time of this
Table 1. Clinical characteristics at time of treatment with cladribine, Ara-C (low-dose), venetoclax for 39 patients with acute myeloid leukemia, relapsed/refractory to venetoclax and hypomethylating agent stratified by achievement of complete response or complete response with incomplete count recovery.
writing, three of whom underwent AHSCT, while one patient each are in CR/CRi and in MLFS for 17.5 and 8.3 months, respectively. Median survival following CAV was 4.7 months, and superior in patients achieving CR/CRi (8.1 vs. 3.2 months; P=0.01) and in patients receiving AHSCT (10.5 vs. 3.7 months; P=0.01). Figure 1 illustrates survival differences in patients that underwent AHSCT, patients achieving CR/CRi but not transplanted, and patients not achieving CR/CRi, with respective median survival of 10.5, 6.9, and 2.6 months (P<0.01). Absence of adverse cytogenetic risk was also associated with superior survival (6 vs. 3.4 months; P=0.05). Multivariable analysis confirmed the favorable survival impact of CR/CRi (P=0.03) and AHSCT (P=0.05); whereas survival impact was not apparent for secondary AML (P=0.29), K/NRAS (P=0.70) or TP53 (P=0.10) mutations. On the other hand, there was a trend towards inferior survival in nine patients with prior AHSCT; median survival 1.9 versus 4.9 months (P=0.10). Of the seven patients (18%) receiving AHSCT following CAV, five patients were in CR/CRi before proceeding to transplant, one achieved bone marrow aplasia, and one case was refractory to CAV but achieved a CRi with mitoxantrone + etoposide + cytarabine (MEC) (Table 2).
Similar results were obtained when response and survival analysis was restricted to 34 patients who had received VenHMA as the most recent line of therapy. CR/CRi was documented in eight (24%) patients, death in 30 (88%), AHSCT in five (15%) and relapse in six (18%) cases; median survival was 4.7 months. Moreover, in 16 patients who received CAV as first salvage therapy, CR/CRi was noted in five (31%) patients, with death in 12 (75%), AHSCT in three (19%) and relapse in two (13%) patients. Median survival was 6.4 months.
The current study demonstrates that the CAV regimen can induce remissions in Ven-HMA- relapsed/refractory AML, albeit at expectedly lower CR/CRi rates in comparison to its efficacy in treatment-naïve AML (CR/CRi rate of 28% vs. 93%).4 Prior studies examining outcomes of AML patients relapsed/refractory to Ven-HMA reported CR/CRi rates of 21%3 and 27%2 following a number of salvage regimens including intensive chemotherapy and FLT3/IDH1/2 targeted agents. In the current study, only two patients harbored IDH1/2 mutations, one of whom had previously received ivosidenib. A phase II trial (clinicaltrials gov. Identifier: NCT05190549) investigating the use of CAV in relapsed/ refractory AML (N=30) reported CR/CRi rate of 27% and 1-year OS of 60%.6 In contrast to the present study which featured elderly patients with heavily treated, high-risk disease, the clinical trial enrolled a younger patient population (median age, 39.5 years) with the majority (63%) of patients with ELN 2017 favorable/intermediate risk. In the current study, de novo AML, absence of adverse karyotype, and absence of K/NRAS mutation were associated with a higher likelihood of response. In that regard, detailed single-cell DNA sequencing analysis of patient samples preand post-treatment with Ven-based regimens, including Ven-HMA and Ven-LDAC, demonstrated frequent acquired mutations in kinase activating pathways, specifically FLT3 and RAS. 7 The frequency of K/NRAS mutations in our cohort was 21%, slightly higher than the general prevalence of K/ NRAS mutations in newly diagnosed AML (10-15%).8 Thus, RAS pathway activating mutations may represent a form of acquired resistance to BCL2 inhibition and predict lower response to salvage therapy. The infectious complications
Figure 1. Median survival following treatment with cladribine, cytarabine (low-dose), venetoclax in 39 patients with acute myeloid leukemia, relapsed/refractory to venetoclax and hypomethylating agent, stratified by achievement of complete response or complete response with incomplete count recovery and allogeneic transplantation. CAV: cladribine, cytarabine (low-dose), venetoclax; CR: complete response; CRi: complete response with incomplete count recovery; yr: year.
Table 2. Clinical characteristics and survival of seven patients with venetoclax/hypomethylating agent-relapsed/refractory acute myeloid leukemia receiving allogeneic stem cell transplant following salvage treatment with cladribine, cytarabine (low-dose), and venetoclax.
observed in our study were comparable to those previously reported in the phase 2 study of CAV alternating with azacitidine in newly-diagnosed AML.4
Survival following CAV was marginally superior at 4.7 months than previously reported survival rates in AML patients following Ven-HMA failure not receiving salvage therapy (median OS ~ 3 months), although there are likely confounders, such as selection of relatively fit patients to receive additional lines of therapy, which preclude comparison. Notably, survival was superior in patients achieving CR/CRi following CAV, particularly in patients bridged to AHSCT. Our findings suggest the CAV regimen, while associated with a high risk of infectious complications, offers a therapeutic option for patients without targeted treatment options after failure of Ven-HMA and has salvage value as a bridge to AHSCT. The current study underlines efficacy of the CAV regimen in the setting of Ven-HMA failure, suggesting that all such cases may not be due to Ven resistance. On the other hand, in the instance of treatment resistance, the use of Ven has unveiled a new type of leukemia stem cell designated as monocytic leukemia stem cell which is resistant to Ven-azacitidine and addition of cladribine to the Ven-azacitidine regimen has been shown to eradicate these stem cells in both in vitro and in vivo preclinical models.9 Next steps include incorporation of cladribine to Ven-HMA in the front-line setting with the goal to improve remission rates and reduce relapses.
Authors
Nickolas Steinauer,1 Kristen McCullough,1 Aref Al-Kali,1 Hassan B. Alkhateeb,1 Kebede H. Begna,1 Abhishek A. Mangaonkar,1 Antoine N. Saliba,1 Mehrdad Torghabeh,1 Mark R Litzow,1 William J. Hogan,1 Mithun Shah,1 Mrinal M. Patnaik,1 Animesh Pardanani,1 Talha Badar,2 Hemant Murthy,2 James Foran,2 Cecilia Arana Yi,3 Ayalew Tefferi1 and Naseema Gangat1
1Division of Hematology, Mayo Clinic, Rochester, MN; 2Division of Hematology, Mayo Clinic, Jacksonville, FL and 3Division of Hematology, Mayo Clinic, Scottsdale, AZ, USA
Correspondence: N. GANGAT - gangat.naseema@mayo.edu https://doi.org/10.3324/haematol.2024.284962
Received: January 1, 2024. Accepted: March 21, 2024. Early view: March 28, 2024.
NS, KM, and NG, designed the study, collected data, performed analysis and co-wrote the paper. AA, HA, KHB, AM, AS, MH, MRL, WH, MS, MMP, AP, TB, HM, JF, CA, and AT contributed patients. All
References
1. DiNardo CD, Jonas BA, Pullarkat V, et al. Azacitidine and venetoclax in previously untreated acute myeloid leukemia. N Engl J Med. 2020;383(7):617-629.
2. Gangat N, Ilyas R, Johnson IM, et al. Outcome of patients with acute myeloid leukemia following failure of frontline venetoclax plus hypomethylating agent therapy. Haematologica. 2023;108(11):3170-3174.
3. Maiti A, Rausch CR, Cortes JE, et al. Outcomes of relapsed or refractory acute myeloid leukemia after frontline hypomethylating agent and venetoclax regimens. Haematologica. 2021;106(3):894-898.
4 Kadia TM, Reville PK, Wang X, et al. Phase II study of venetoclax added to cladribine plus low-dose cytarabine alternating with 5-azacitidine in older patients with newly diagnosed acute myeloid leukemia. J Clin Oncol. 2022;40(33):3848-3857.
5. Döhner H, Wei AH, Appelbaum FR, et al. Diagnosis and management of AML in adults: 2022 recommendations from an
authors reviewed and approved the final draft of the paper.
Data-sharing statement
Please email the corresponding author.
international expert panel on behalf of the ELN. Blood. 2022;140(12):1345-1377.
6. Li Y, Ge S, Huang Y, et al. Efficacy and safety of cladribine, low-dose cytarabine and venetoclax in relapsed/refractory acute myeloid leukemia: results of a pilot study. Blood Cancer J. 2024;4(1):12.
7. DiNardo CD, Tiong IS, Quaglieri A, et al. Molecular patterns of response and treatment failure after frontline venetoclax combinations in older patients with AML. Blood. 2020;135(11):791-803.
8. Rivera D, Kim K, Kanagal-Shamanna R, et al. Implications of RAS mutational status in subsets of patients with newly diagnosed acute myeloid leukemia across therapy subtypes. Am J Hematol. 2022;97(12):1599-1606.
9 Pei S, Shelton I, Gillen A, et al. A novel type of monocytic leukemia stem cell revealed by the clinical use of venetoclaxbased therapy. Cancer Discov. 2023;13(9):2032-2049.
Acute myeloid leukemia with mast cell differentiation is characterized by interstitial mast cells, complex karyotype, TP53 alterations and poor prognosis
Among 2,167 acute myeloid leukemia (AML) cases at our institution, we identified 21 (approx. 1%) cases of AML with mast cell (MC) differentiation (AML-MC), defined as: (1) increased immature MC (>0.3%; >3 Standard Deviation [SD] above normal/reactive bone marrow (BM) MC by flow cytometric immunophenotyping (FCI) that are: CD117+bright, HLA-DR+low/negative, CD45+dim with low side scatter (SSC), CD38+, CD123+, CD34+partial/dim (Figure 1A); (2) cells with metachromatic granules observed on PB and/or BM aspirate smears; and (3) ≥1% MC shown by tryptase immunohistochemistry in BM biopsy specimens. This study was approved by the Institutional Review Board. Our cohort included 11 men and 10 women, median age 68 years (range, 28-83 years). Twelve patients had a history of malignancy: 9 (43%) had myeloid neoplasms (including 6 myelodysplastic syndrome, 2 chronic myelomonocytic leukemia, and one chronic myeloid leukemia [CML]), 3 (14%) with lymphoid neoplasms, and 3 (14%) with solid tumors. Among them, 2 patients had both lymphoid and myeloid neoplasms, and one patient had both solid tumor and myeloid neoplasm. The classification of these AML cases is listed in Online Supplementary Table S1. The myeloblasts (without MC differentiation) were mostly large, with small amounts of agranular cytoplasm (Figure 1B-D). The blasts with MC differentiation were usually smallto medium-sized, with a few metachromatic cytoplasmic granules, consistent with metachromatic blasts (Figure 1B-D). Atypical immature or mature MC that were round to oval, mostly mononuclear or occasionally bi-lobed or segmented nucleated, and often with hypo-granular cytoplasm, were also present. The median count of cells with metachromatic granules was 6% (range, 1-41%). Five of 18 (28%) cases had ≥10% cells with metachromatic granules, consistent with myelomastocytic leukemia (MML). Background dysplasia was present in 18 of 20 (90%) cases (Figure 1D). Dysplasia was observed in granulocytic (N=15; 75%), erythroid (N=14; 70%), and megakaryocytic (N=10; 50%) lineages, and involved multiple lineages in 16 (80%) and a single lineage in 2 (10%) cases. Immunohistochemistry for CD117 highlighted myeloblasts (dim) and MC (bright) in the BM (Figure 1F). The median MC percentage by tryptase was 5% of the BM cellularity (range, 1-40%) and the MC were distributed in an interstitial pattern without forming aggregates. The intensity of tryptase expression in MC was weak to moderate in most cases (Figure 1G).
Next-generation sequencing (NGS) analysis using panels designed to target genes commonly mutated in myeloid
neoplasms was performed on all cases: 20 cases using an 81-gene panel, 1 case using a 28-gene panel. TP53 was the most frequently mutated, detected in 11 of 21 (52%) cases, followed by NRAS (N=7; 33%), ASXL1 (N=4; 19%), and RUNX1 (N=4; 19%) (Figure 2A). No other gene mutations including KIT were identified. TP53 mutations identified in the AML-MC cases included nonsense (N=8), missense (N=3), and splice site mutations (N=2) (Figure 2B). Eleven of 13 (85%) TP53 mutations were present within the DNA binding domain; 2 (15%) mutations occurred in splice sites. In the 10 TP53 wild-type cases, NRAS was most often mutated (N=4; 40%). There was no significant difference in the percentage of MC between the TP53 mutant and wild-type cases (Online Supplementary Figure S1A). Thirteen of 19 (68%) cases had a complex karyotype (Figure 2A). Nine of 21 (43%) cases showed TP53 deletion by fluorescence in situ hybridization (FISH) (Figure 2A). Seven of 21 (33%) cases had both TP53 deletion and mutation (biallelic TP53 alterations) (Online Supplementary Figure S1B).
Ten (48%) patients were treated with intensive chemotherapy, with or without targeted therapy. Seven (33%) patients received hypomethylating agents with or without venetoclax. Two (10%) patients were treated with immunomodulator therapy alone and one (5%) was treated with targeted therapy alone. Three (14%) patients received allogeneic stem cell transplant (SCT). After a median follow-up of 7.4 months (range, 0.2-41.9 months), 13 of 21 (62%) patients died, with a median overall survival (OS) of 9.6 months (Figure 3A). Patients aged 65 years or older had a significant shorter OS than those younger than 65 years (Figure 3B). The percentage of MC did not affect OS, using a cut-off value of 5% (Figure 3C), 2% or 10% (data not shown). The OS of AML-MC patients showed no difference after stratifying patients by TP53 mutation status (mutated vs. wildtype) (Figure 3D). Patients with a non-complex karyotype or those who received SCT tended to show a better OS than patients with a complex karyotype or without SCT, but these differences did not reach statistical significance (Figure 3E, F).
Our definition of AML-MC is very similar to the “pre-MML” condition” described by Panda et al.11 MML requires that MC comprise ≥10% of BM cells, an arbitrary and stringent cut-off that is likely set too high; as a result only about 10 cases have been reported in the literature.1-7 Similar to MML, the MC in AML-MC were interstitially distributed in the background of dysplasia. These MC are immunopheno-
Figure 1. A representative case of acute myeloid leukemia with mast cell differentiation. (A) Mast cells (MC) are positive for CD117 (bright), CD45 (dim), CD38, CD123, CD34 (partial/dim), and CD13 (partial), and are negative for HLA-DR, with low side scatter (SSC), consistent with immature MC. (B) Peripheral blood and (C and D) bone marrow (BM) aspirate smears reveal myeloblasts (red arrow heads) which are large, with irregular nuclear contour, fine chromatin, inconspicuous nucleoli, and a small amount of agranular cytoplasm. Metachromatic blasts (green arrow heads) have a small to moderate amount of cytoplasm containing a few metachromatic granules. Erythroid dysplasia is present in the background (black arrow). (E) BM biopsy shows a hypercellular marrow (approx. 100% cellularity) with markedly increased blasts. Immunohistochemical stains for (F) CD117 (strong) and (G) tryptase (weak) highlight scattered MC. (F) CD117 also stains the myeloblasts (dim). (B-D) Wright-Giemsa stain, x1000. (E) Hematoxylin-eosin stain, x400. Immunohistochemistry: (F) x400 and (G) x600. AML-MC: acute myeloid leukemia with mast cell differentiation.
typically immature, in contrast to the mature MC (negative for CD34, brighter CD45, higher SSC), as can be seen in chronic lymphocytic leukemia and reactive conditions (data not shown). Among the 9 AML-MC patients with a history of myelodysplastic and/or myeloproliferative neoplasms, 5 cases of the earlier neoplasms were assessed by FCI, and none showed increased immature MC. Tryptase is often strongly expressed on mature MC, but can be decreased or lost in MML and mast cell leukemia,8,12 thought to be attributable to the MC immaturity. Low tryptase expression on immature MC is also seen in AML-MC cases, supported by their immunophenotypic signature and decreased tryptase staining. Interestingly, elevated serum tryptase levels were reported in MML cases, and some patients had symptoms due to inappropriate release of MC mediators.1,6-8,13 None of the AML-MC patients we report were tested for serum
tryptase or had mediator-related symptoms. Although little is known about the genetic and molecular pathogenesis underlying MML, a complex karyotype is found in 75% of cases.1-4,8-10,13,14 In this cohort of AML-MC cases, about 70% showed a complex karyotype and 50% had TP53 deletion. One case (5%) had t(8;21), which has been reported in MML.1,5,6 We also had 2 (10%) AML-MC cases with inv(16), which has not been previously reported in MML. Another recurrent genetic abnormality was t(9;22), seen in 2 (10%) BP-CML cases. CML in accelerated/blast phase has been reported to develop MML or to have increased immature MC.2,11 KIT mutations are observed in approximately 2040% of core binding factor (CBF) AML cases, but they are typically not detectable in MML as was observed in this cohort.4,8,13,14 TP53 was the most frequently mutated gene, occurring in about 50% of AML-MC cases, and 64% of the
TP53-mutated cases had biallelic inactivation (one copy mutated, the other copy lost). However, there was no significant difference in the percentage of MC between TP53 mutant and wild-type cases, suggesting that TP53 is not a driver for MC differentiation. The prognosis of AML-MC patients was poor, with a median OS of 9.6 months, similar to OS reported in MML patients.1-3,9,10 Patient outcome was even worse if they were
65 years or older. Generally, AML with t(8;21) and inv(16) are associated with a favorable prognosis.15 In the current study, after initial diagnosis, the patient with t(8;21) died in 17 months and one of 2 patients with inv(16) died in four months, both due to infection and respiratory failure; the sample size of CBF AML-MC cases in this study is too small to assess their behavior. The patients with a non-complex karyotype, or if they received SCT, tended to show a better
Figure 2. The molecular and cytogenetic findings of acute myeloid leukemia with mast cell differentiation. (A) Oncoplot of gene mutations and status of karyotype and TP53 deletion. (B) Lollipop graph of TP53 mutations in acute myeloid leukemia with mast cell (AML-MC) differentiation. (Template from Uniprot).
Figure 3. The overall survival of patients with acute myeloid leukemia with mast cell differentiation. Overall survival (OS) in (A) all 21 patients with acute myeloid leukemia with mast cell (AML-MC) differentiation, (B) patients aged ≥65 years and <65 years, (C) patients with ≥5% MC and <5% MC, (D) patients with mutated and wild-type TP53, (E) patients with a complex karyotype and non-complex karyotype, and (F) patients with and without allogeneic stem cell transplant (SCT).
OS than patients with a complex karyotype or without SCT, but these differences did not reach statistical significance, possibly also due to the small sample size. SCT was reported to achieve prolonged survival in 2 MML with t(8;21) patients.1,6 The percentage of MC in AML was not associated with OS, using a cut-off value of 2%, 5%, or 10%, suggesting that once the immature MC component is increased, arbitrarily setting a MC% cut-off may not be relevant. In summary, patients with AML-MC are characterized by interstitial MC, multilineage dysplasia, complex karyotype, TP53 alterations, and poor prognosis. The results of this study support recognition of this rare subset of aggressive AML cases, which are not adequately captured by current prognostic systems.
Authors
Do Hwan Kim,1 Sa A Wang,1 Wei Wang,1 Guilin Tang,1 Shaoying Li,1 C. Cameron Yin,1 Pei Lin,1 Marina Konopleva,2 M. James You,1 Roberto N. Miranda,1 Xiaoqiong Wang,1 Qing Wei,1 L. Jeffrey Medeiros1 and Jie Xu1
1Department of Hematopathology and 2Department of Leukemia, The University of Texas MD Anderson Cancer Center, Houston, TX, USA
Correspondence: J. XU - jxu9@mdanderson.org
https://doi.org/10.3324/haematol.2024.284976
Received: January 4, 2024.
Accepted: March 20, 2024. Early view: March 28, 2024.
DHK collected and analyzed the data and wrote the manuscript. SAW, WW, SL, PL, MJY and RNM contributed data and edited the manuscript. GT and QW analyzed the cytogenetic data. CCY analyzed the molecular data. MK treated the patients. XW collected data. LJM analyzed data and wrote the manuscript. JX designed the study, collected and analyzed the data, supervised the study and wrote the manuscript. All authors reviewed and approved the manuscript.
Acknowledgments
The study was partially supported by Faculty Startup Fund (to JX) and Research Grant (to DHK and JX) from the Division of Pathology and Laboratory Medicine, The University of Texas MD Anderson Cancer Center.
Data-sharing statement
Data are available for sharing upon request to the corresponding author.
References
1. Sperr WR, Drach J, Hauswirth AW, et al. Myelomastocytic leukemia: evidence for the origin of mast cells from the leukemic clone and eradication by allogeneic stem cell transplantation. Clin Cancer Res. 2005;11(19 Pt 1):6787-6792.
2. Valent P, Spanblochl E, Bankl HC, et al. Kit ligand/mast cell growth factor-independent differentiation of mast cells in myelodysplasia and chronic myeloid leukemic blast crisis. Blood. 1994;84(12):4322-4332.
3. Wimazal F, Sperr WR, Horny HP, et al. Hyperfibrinolysis in a case of myelodysplastic syndrome with leukemic spread of mast cells. Am J Hematol. 1999;61(1):66-77.
4 Rich A, Sun J, Aldayel AS, et al. Myelomastocytic leukemia with aberrant CD25 expression: case report and review of the literature. Clin Lymphoma Myeloma Leuk. 2014;14(5):e173-177.
5. Johnson RC, Savage NM, Chiang T, et al. Hidden mastocytosis in acute myeloid leukemia with t(8;21)(q22;q22). Am J Clin Pathol. 2013;140(4):525-535.
6. Intzes S, Wiersma S, Meyerson HJ. Myelomastocytic leukemia with t(8;21) in a 3-year-old child. J Pediatr Hematol Oncol. 2011;33(8):e372-375.
7 Arredondo AR, Gotlib J, Shier L, et al. Myelomastocytic leukemia versus mast cell leukemia versus systemic mastocytosis associated with acute myeloid leukemia: a diagnostic challenge. Am J Hematol. 2010;85(8):600-606.
8. Valent P, Sotlar K, Sperr WR, et al. Refined diagnostic criteria and classification of mast cell leukemia (MCL) and myelomastocytic leukemia (MML): a consensus proposal. Ann Oncol. 2014;25(9):1691-1700.
9 Valent P, Sperr WR, Samorapoompichit P, et al. Myelomastocytic overlap syndromes: biology, criteria, and relationship to mastocytosis. Leuk Res. 2001;25(7):595-602.
10. Valent P, Samorapoompichit P, Sperr WR, Horny HP, Lechner K. Myelomastocytic leukemia: myeloid neoplasm characterized by partial differentiation of mast cell-lineage cells. Hematol J. 2002;3(2):90-94.
11. Panda D, Chatterjee G, Khanka T, et al. Mast cell differentiation of leukemic blasts in diverse myeloid neoplasms: a potential pre-myelomastocytic leukemia condition. Cytometry B Clin Cytom. 2021;100(3):331-344.
12. Sanchez-Munoz L, Teodosio C, Morgado JM, Escribano L. Immunophenotypic characterization of bone marrow mast cells in mastocytosis and other mast cell disorders. Methods Cell Biol. 2011;103:333-359.
13. Leguit R, Hebeda K, Kremer M, et al. The spectrum of aggressive mastocytosis: a workshop report and literature review. Pathobiology. 2020;87(1):2-19.
14. Horny HP, Sotlar K, Reiter A, Valent P. Myelomastocytic leukemia: histopathological features, diagnostic criteria and differential diagnosis. Expert Rev Hematol. 2014;7(4):431-437.
15. Khoury JD, Solary E, Abla O, et al. The 5th edition of the World Health Organization Classification of Haematolymphoid Tumours: Myeloid and Histiocytic/Dendritic Neoplasms. Leukemia. 2022;36(7):1703-1719.
Outcomes after chimeric antigen receptor T-cell therapy across large B-cell lymphoma subtypes
CD19 chimeric antigen receptor (CAR) T-cell therapy has significantly improved treatment options for large B-cell lymphoma (LBCL) and has become a new standard-ofcare for relapsed or refractory (r/r) disease. The license includes histological subtypes of primary mediastinal B-cell lymphoma (PMBCL) and transformed LBCL from follicular lymphoma (t-FL) or non-FL background (t-NFL), such as marginal zone lymphoma (MZL) or chronic lymphocytic leukemia/small lymphocytic lymphoma (CLL/SLL), i.e., Richter’s syndrome (RS).
Efficacy of CD19 CAR T in r/r LBCL has been confirmed in long-term follow-up of the registrational trials,1,2 as well as several large retrospective CAR T real-world cohorts.3-7 However, the clinical benefit of CAR T within histological subgroups is less clear. T-NFL have been excluded from the clinical trials and patients with PMBCL or t-FL have been underrepresented.1,2 In the real-world setting, incidences ranged between 3-6% for PMBCL, 14-26% for t-FL, and 1-6% for t-NFL within national CAR T cohorts, but subtype-specific outcomes were not provided.4-9
In a single-center retrospective analysis of 21 patients with t-NFL, CAR T response rates and long-term survival were similar to other subgroups, but with potentially higher rates of Immune effector cell-associated neurotoxicity syndrome (ICANS).10 Regarding r/r PMBCL, multicenter retrospective analyses suggested better long-term survival with axicabtagene ciloleucel (axi-cel) compared to other LBCL.11-13 Subtype-specific CAR T outcome data will be key to understand the relative benefit of CAR T versus alternative treatments such as CD20xCD3 bispecific antibodies in each subgroup in order to guide decision-making in daily practice. Herein, we report outcomes of patients intended to be treated with CD19 CAR T in the UK according to histological subtypes. We included 760 consecutive patients with r/r LBCL approved for ≥3rd-line treatment with axi-cel or tisagenlecleucel (tisa-cel) between December 2018 and October 2022 across 12 CAR T centers as part of a National Service Evaluation (not requiring separate consent). The UK National CAR T Clinical Panel approval process, toxicity grading and response assessment have been previously described.6
Among 760 cases, 529 (70%) had de novo diffuse large B-cell lymphoma (DLBCL), 27 (4%) PMBCL, 157 (21%) t-FL and 47 (6%) t-NFL (23 t-MZL, 15 RS, five t-NLPHL (nodular lymphocyte predominant Hodgkin lymphoma), four t-LPL (lymphoplasmacytic lymphoma). No significant differences were seen in baseline characteristics when comparing the t-NHL group to de novo DLBCL. PMBCL patients were significantly younger and t-FL patients showed significant
differences compared to de novo DLBCL for cyclophosphamide, doxorubicin, vincristine and prednisone (CHOP)-refractory disease and bridging response (Table 1). Seven hundred and twenty (94.7%) of patients proceeded with leukapheresis and 614 (81%) received CAR T, with similar rates across subgroups. Of 614 infused patients, 485 received axi-cel and 129 tisa-cel. Bridging therapy was given to 89.9% of apheresed patients.
Median follow-up from the time of CAR T approval was 18.2 months (interquartile range [IQR], 13.6-23.6). The best overall response rate (ORR) was 77% (57% complete response [CR]), with no significant differences between groups, but a trend towards better response in t-FL (ORR 84%/CR 70%; P=0.054). The 12-month progression-free survival (PFS) for the different subgroups was as follows: 53% (IQR, 33-70) for PMBCL, 42% (IQR, 37-47) for de novo DLBCL, 54% (IQR, 45-63) for t-FL and 39% (IQR, 24-54) for t-NFL. The intention-to-treat (ITT) 12-month overall survival (OS) rates were 84% (IQR, 63-94), 50% (IQR, 45-54), 58% (IQR, 50-66) and 50% (IQR, 34-63), respectively (Figure 1). We did not observe significant differences in PFS or OS between subtypes of t-NFL (PFS: RS vs. t-MZL 0.80 [IQR, 0.31-2.04]; t-other vs. t-MZL 0.51 [IQR, 0.16-1.59]; RS vs. t-other 0.64 [IQR, 0.192.18]; P=0.49, OS: RS vs. t-MZL 1.06 [IQR, 0.37-3.07]; t-other vs. t-MZL 0.67 [IQR, 0.18-2.54]; RS vs. t-other 0.63 [IQR, 0.16 -2.53]; P=0.79). PFS was significantly better for t-FL versus de novo DLBCL (hazard ratio [HR]= 0.75 [IQR, 0.57-0.99]; P=0.043), in both the ITT and infused cohorts; OS was significantly better for PMBCL and t-FL (for infused: PMBCL: HR=0.34 [IQR, 0.16-0.72], P=0.005; t-FL: HR=0.73 [IQR, 0.570.94], P=0.017). There was no evidence of a different effect by CAR T product (P value for interaction [Cox model]: 0.29 PFS and 0.89 OS [infused cohort]).
Grade ≥3 cytokine release syndrome (CRS) occurred in 5% and grade ≥3 ICANS in 15% of patients and was similar between subgroups. No significant differences were seen according to tocilizumab and corticosteroid use, intensive care unit admission, and non-relapse mortality (see Online Supplementary Appendix).
In this large national dataset, we show that safety and efficacy of CD19 CAR T in t-NFL patients are comparable to the main LBCL cohort, indicating that CAR T is a suitable and curative treatment for these rare subgroups. Given the generally poor outcomes of r/r patients with t-MZL or RS with conventional therapies, the relative benefit of CAR T might indeed be higher than in de novo DLBCL. For subtypes such as RS, which characteristically show aggressive disease kinetics, it is particularly important to provide ITT outcomes and account for patients dropping out during
Table 1. Baseline characteristics across subgroups.
Characteristics
Product, N (%)
Axi-cel
Tisa-cel
Sex, N (%)
Stage at approval, N (%) Stage 0-2
ECOG at approval, N (%)
>7.5 cm, N (%)
LDH
More than 2 lines of therapy,
Previous SCT, N (%)
Refractory to CHOP, N (%)
Continued on following page.
1P value comparing de novo DLBCL, PMBCL, t-FL and t-NFL.2 Compares product in those infused and excludes PMBCL (only approved for axicel). 3Compares infusion rates. 4No significant differences between de novo DLBCL and t-NFL; PMBCL significantly younger than de novo DLBCL (P=0.0001); t-FL significantly less likely to have been refractory to R-CHOP (P=0.021) and less likely to have responded to bridging (p=0.001) when compared to de novo DLBCL. 5No pairwise comparison with de novo DLBCL was significant. DLBCL: diffuse large B-cell lymphoma; PMBCL: primary mediastinal B-cell lymphoma; t-FL: transformed LBCL from follicular lymphoma (FL); t-NFL: transformed LBCL from non-FL background; t-MZL: transformed LBCL from marginal zone lymphoma; RS: Richter’s syndrome; CHOP: cyclophosphamide, doxorubicin, vincristine and prednisone; axi-cel: axicabtagene ciloleucel; tisa-cel: tisagenlecleucel; IQR: interquartile range; ECOG: Eastern Oncology Group; LDH: lactate dehydrogenase; IPI: International Prognostic Index; SCT: stem cell transplantation; HCT-CI: hematopoietic cell transplantation-specific comorbidity index; CR: complete response; PR: partial response; SD: stable disease; PD: progressive disease.
the prolonged CAR T pathway due to fast disease progression. In this regard, the infusion rate of 87% seen in our RS cohort is very encouraging, although numbers are too small to draw firm conclusions. Due to the heterogeneity of RS, larger studies with more detailed analyses of prior CLL-directed therapy and baseline T-cell function are warranted.14,15 Efficacy of bispecific antibodies and other novel
treatments in t-NFL is not yet known. Our data provide a useful benchmark for future comparison of CAR T against novel immunotherapies in t-MZL and RS.
We observed similar drop-out rates across all LBCL subtypes. However, PMBCL and t-FL had significantly better long-term survival compared to other subgroups. The favorable results seen in PMBCL are in line with previous re-
Continued on following page.
ports. Our 2-year PFS of 53% for PMBCL is almost identical to the 54% reported in the German series.12 The survival difference was highly significant in their cohort, but did not reach significance in our analysis, probably explained by the unexpectedly short PFS of the German comparator cohort (DLBCL not otherwise specified) of only 26% at 2 years.12 A numerically higher response rate was seen in t-FL in the ZUMA-1 and JULIET trials,1,2 but to our knowledge, this is the first study suggesting superior long-term outcomes of t-FL versus de novo DLBCL. CAR T-cell toxicities and non-relapse mortality were similar between subgroups which is an important finding, suggesting a similar risk/ benefit profile of CAR T in rare subtypes. In conclusion, our data provide evidence for a clinical benefit of CAR T across rare subgroups of r/r LBCL such as t-NFL. We further show particularly favourable CAR T outcomes in patients with PMBCL as well as t-FL, highlighting the important role of CD19 CAR T against alternative treatment options for
Figure 1. Overall survival and progression-free survival. (A) Overall survival (OS) total cohort, (B) progression-free survival (PFS) total cohort. (C) OS by lymphoma subgroups. (D) PFS by lymphoma subgroups. DLBCL: diffuse large B-cell lymphoma; PMBCL: primary mediastinal B-cell lymphoma; t-FL: transformed follicular lymphoma; t-NFL: transformed non-follicular lymphoma.
these patients, which should be confirmed in larger datasets.
Authors
Christianne Bourlon,1* Claire Roddie,2,3* Tobias Menne,4 Jane Norman,5 Maeve O’Reilly,2 Adam Gibb,6 Caroline Besley,7 Sridhar Chaganti,8 Carlos Gonzalez Arias,9 Ceri Jones,10 Abdalla Dikair,11 Sharon Allen,12 Frances Seymour,13 Wendy Osborne,4 Amrith Mathew,8 William Townsend,2 Piers E. M. Patten,1,14 Eleni Thoulouli,5 Ahmed Abdulgawad,15 Sanne Lugthart,7 Robin Sanderson,1 Amy A. Kirkwood16 and Andrea Kuhnl1
1Department of Hematology, King’s College Hospital, London; 2Department of Hematology, University College London Hospitals, London; 3UCL Cancer Institute, University College London, London; 4Department of Hematology, Freeman Hospital, Newcastle University, Newcastle; 5Department of Hematology, Manchester Royal Infirmary, Manchester; 6Department of Medical Oncology, The Christie Hospital,
Manchester; 7Department of Hematology, University Hospitals Bristol and Weston, Bristol; 8Department of Hematology, Queen Elizabeth Hospital, Birmingham; 9Department of Hematology, Royal Marsden Hospital, London; 10Department of Hematology, University Hospital of Wales, Cardiff; 11Department of Hematology, Queen Elizabeth Hospital, Glasgow; 12Department of Hematology, Cambridge University Hospitals, Cambridge; 13Department of Hematology, Leeds Teaching Hospitals, Leeds; 14Comprehensive Cancer Center, King’s College London, London; 15Department of Hematology, The Christie Hospital, Manchester and 16CR UK & UCL Cancer Trials Center, UCL Cancer Institute, UCL, London, UK
*CB and CR contributed equally as first authors.
Correspondence: A. KUHNL - andrea.kuhnl@nhs.net https://doi.org/10.3324/haematol.2024.285010
Received: January 8, 2024.
Accepted: March 28, 2024. Early view: April 4, 2024.
AK has served on advisory boards and received honoraria from
References
1. Locke FL, Ghobadi A, Jacobson CA, et al. Long-term safety and activity of axicabtagene ciloleucel in refractory large B-cell lymphoma (ZUMA-1): a single-arm, multicentre, phase 1–2 trial. Lancet Oncol. 2019;20(1):31-42.
2. Schuster SJ, Tam CS, Borchmann P, et al. Long-term clinical outcomes of tisagenlecleucel in patients with relapsed or refractory aggressive B-cell lymphomas (JULIET): a multicentre, open-label, single-arm, phase 2 study. Lancet Oncol. 2021;22(10):1403-1415.
3. Jacobson CA, Locke FL, Ma L, et al. Real-world evidence of axicabtagene ciloleucel for the treatment of large B cell lymphoma in the United States. Transplant Cell Ther. 2022;28(9):581.e1-581.e8.
4 Bachy E, Le Gouill S, Di Blasi R, et al. A real-world comparison of tisagenlecleucel and axicabtagene ciloleucel CAR T cells in relapsed or refractory diffuse large B cell lymphoma. Nat Med. 2022;28(10):2145-2154.
5. Kwon M, Iacoboni G, Reguera JL, et al. Axicabtagene ciloleucel compared to tisagenlecleucel for the treatment of aggressive B-cell lymphoma. Haematologica. 2023;108(1):110-121.
6. Kuhnl A, Roddie C, Kirkwood AA, et al. A national service for delivering CD19 CAR-Tin large B-cell lymphoma - the UK realworld experience. Br J Haematol. 2022;198(3):492-502.
7 Bethge WA, Martus P, Schmitt M, et al. GLA/DRST real-world outcome analysis of CAR-T cell therapies for large B-cell lymphoma in Germany. Blood. 2022;140(4):349-358.
8. Nastoupil LJ, Jain MD, Feng L, et al. Standard-of-care axicabtagene ciloleucel for relapsed or refractory large B-cell
Kite/Gilead, Novartis, Abbvie, Roche and BMS. CR has served on advisory boards and received honoraria from Kite/Gilead, Novartis and BMS. AAK received honoraria from Kite/Gilead. RS and MOR have served on advisory boards and received honoraria from Kite/ Gilead and Novartis. SC has served on advisory boards, provided consultancy services, and received meeting attendance support from Takeda, Novartis, Celgene/BMS, Kite/Gilead, Atara Bio, Incyte, and Roche. JN received travel funds from Kite/Gilead. AG has served on advisory boards for Takeda and received honoraria from Kite/Gilead and Takeda. WO has received honoraria from Roche, Takeda, Pfizer, Servier, Kite/Gilead, MSD, Novartis, Beigene, Astra Zeneca, Syneos, Autolus, Kyowa Kirin, Abbvie, Incyte, BMS and Janssen. CGA has served on advisory boards and received honoraria from Kite/Gilead and Novartis; received research funding from Kite/Gilead; and received conference sponsorship from Kite/ Gilead, Novartis and BMS/Celgene. The remaining authors have no conflicts of interest to disclose.
Contributions
CB, CR, AAK, and AK designed the research, collected the data, analyzed the data, and wrote the manuscript. All other authors contributed to collecting the data and reviewed the manuscript.
Data-sharing statement
Anonymized data may be shared on reasonable request and ethical approval.
lymphoma: Results from the US lymphoma CAR T consortium. J Clin Oncol. 2020;38(27):3119-3128.
9. Jacobson CA, Hunter BD, Redd R, et al. Axicabtagene ciloleucel in the non-trial setting: outcomes and correlates of response, resistance, and toxicity. J Clin Oncol. 2020;38(27):3095-3106.
10. Dong N, Rubio Lopes-Garcia L, Viñal D, et al. Outcomes of CD19-directed chimeric antigen receptor T cell therapy for transformed nonfollicular lymphoma. Transplant Cell Ther. 2023;29(6):349e1-349.e8.
11. Crombie JL, Nastoupil LJ, Redd R, et al. Real-world outcomes of axicabtagene ciloleucel in adult patients with primary mediastinal B-cell lymphoma. Blood Advances. 2021;5(18):3563-3567.
12. Schubert M-L, Bethge WA, Ayuk FA, et al. Outcomes of axicabtagene ciloleucel in PMBCL compare favorably to DLBCL: a GLA/DRST registry study. Blood Adv. 2023;7(20):6191-6195.
13. Chiappella A, Dodero A, Guidetti A, et al. CART-SIE Real Life Study: primary mediastinal B-cell lymphoma (PMBCL) have a superior outcome compared to large B-cell lymphoma (LBCL) treated with axicabtagene ciloleucel. Hematol Oncol. 2023;41(Suppl 2):198-199.
14 Abrisqueta P, Delgado J, Alcoceba M, et al. Clinical outcome and prognostic factors of patients with Richter syndrome: realworld study of the Spanish Chronic Lymphocytic Leukemia Study Group (GELLC). Br J Haematol. 2020;190(6):854-863.
15. Kittai AS, Bond DA, Huang Y, et al.. Anti-CD19 chimeric antigen receptor T-cell therapy for Richter’s transformation: an international multicenter retrospective study. Blood. 2023;142(Suppl 1):108.
Non-myeloma light chain cast nephropathy: a multicenter retrospective study on clinicopathological characteristics
Kidney injury is a common complication of multiple myeloma (MM),1 with light chain cast nephropathy (LCCN) being a well described MM-defining event correlated with poor outcomes.2 LCCN results from the precipitation of monoclonal free light chains (FLC) with Tamm-Horsfall protein in distal tubules.2 Kidney involvement in other mature B-cell neoplasms with plasmacytic differentiation is much rarer than in MM.1 When present it results mainly from monoclonal heavy or light chain deposition in the glomerular basement membrane, such as monoclonal immunoglobulin deposition disease (MIDD), interstitial infiltration of neoplastic lymphoplasmacytic cells, light chain amyloidosis or LCCN.3,4 In the light of the work by Royal et al., 2 who described the clinicopathological predictors of renal outcomes in MM-associated LCCN, we have set out to describe the clinical, biological, and pathological presentation of LCCN in non-MM mature B-cell neoplasms. We also aim to compare the clinicopathological presentations of MM and non-MM-associated LCCN and understand whether both diseases have similar renal manifestations and outcomes.
Patients were selected from the renal biopsy databases of the Pathology Departments of five hospitals. Research ethics board approval was granted by the local Ethics Committee of the Assistance Publique Hôpitaux de Paris. Patients were informed about the purpose of the study and gave their consent to participation. Renal biopsy samples for light microscopy and immunofluorescence were processed as standard and sections were independently reviewed by two pathologists. Pathology variables and scoring definitions were categorized in the same manner as used by Royal and collaborators2 to enable the comparison between MM and nonMM LCCN. Continuous variables were described using mean, median, and interquartile range (IQR) values and categorical variables were described by frequencies and percentages. A Mann-Whitney test was used to compare the medians of continuous variables, a Fisher exact test was performed to compare groups and the Kaplan-Meier method was implemented to analyze overall survival. The Pearson correlation coefficient was used to measure the statistical relationship between two continuous variables.
A total of 23 patients with biopsy-proven non-MM-associated LCCN were included. Their demographic, clinical, and histopathological characteristics are shown in Table 1. The median age of the patients was 72 (70-78) years and 56% (n=13) of the patients were male. Fourteen patients were diagnosed with IgM lymphoplasmacytic lymphoma/Waldenström macroglobulinemia, two with IgG lymphoplasmacytic lymphoma, two with extranodal marginal zone lymphomas with plasmacytic differentiation, three with small lymphocytic lymphoma and
two with diffuse large B-cell lymphoma. Baseline estimated glomerular filtration rate (eGFR), defined as renal function prior to LCCN and calculated using the Chronic Kidney Disease Epidemiological Collaboration equation (CKD-EPI), was 63 (47-87) mL/min/1.73 m2 and eGFR at kidney disease onset was 11.5 (5-15) mL/min/1.73 m2.5 Median proteinuria was 1.28 (0.70-3.08) g/g and 22% (n=5) of the patients had hematuria at presentation. Eighty-three percent (n=19) of the patients presented with Kidney Disease Improving Global Outcomes (KDIGO) stage 3 acute kidney injury, and 44% (n=10) needed dialysis at disease onset. The mean level of FLC at diagnosis was 2,237 (437.5-3,648.2) mg/L and none of the patients underwent extracorporeal removal of FLC. Our results show that non-MM neoplasms have a similar clinical presentation as that of MM.2 Acute kidney injury KDIGO stage 3 was the most common clinical presentation in both entities (82% in MM and 83% in non-MM), with almost half of the patients needing dialysis at disease onset (47% in the MM group and 44% in the non-MM group).2 It is noteworthy that FLC levels at diagnosis in non-MM LCCN appear to be lower than those in LCCN associated with MM (2,237 vs. 5,010 mg/L).2
For 13 patients (57%), the diagnoses of both the LCCN and the hematologic malignancy were concomitant and in the other ten patients (43%) the LCCN diagnosis was made 9.7 (4.4-14.3) years after the diagnosis of the hematologic malignancy when this latter relapsed or progressed. In contrast to MM, in which cast nephropathy is most often revealed at the time of the hematologic diagnosis (92% of the cases before first-line therapy),2 in other B-cell neoplasms in half the cases cast nephropathy may be an event occurring during follow-up and even several years after the initial diagnosis of the hematologic malignancy. This result highlights the need for regular and longitudinal assessment of renal function of patients with mature B-cell neoplasms with plasmacytic differentiation.
The main kidney pathological findings are summarized in Table 1 and illustrated in Figure 1. The median number of casts per square millimeter was 2.50 (1.18-4.70) in the cortex, 1.25 (0.04-5.17) in the medulla, and 2.35 (1.24-4.70) in the entire kidney biopsy, which was close to the findings of Royal et al. (3.2/mm2 in the cortex).2 The median percentage of globally sclerosed glomeruli was 25% (855) and almost half of the patients (48%, n=11) had mild interstitial fibrosis and tubular atrophy (IFTA). All except one patient had acute tubular injury. Most of the patients had interstitial edema (70%, n=16), tubulitis (74%, n=17), giant cell reaction around the casts (70%, n=16) and tubular rupture (65%, n=15), as previously described in MM LCCN.2 Only 26% (n=6) of the patients displayed extravasation of
Tamm-Horsfall protein. As myeloma casts are known to be formed through binding to uromodulin, we performed an immunohistochemistry analysis targeting uromodulin.6 In our patients, the observed monotypic light chain casts were also associated with uromudulin as in MM LCCN (Online
Supplementary Figure S1). Ninety-six percent (n=22) of the patients had a cortical interstitial lymphoid infiltrate and 30% (n=7) had medullary interstitial lymphoid infiltrate. Importantly, this infiltration was in most cases due to a monoclonal B-cell infiltration, observed in 83% (n=19) of
Table 1. Demographic, baseline renal and hematologic characteristics and histological findings in the study cohort.
Characteristic Patients, N=23
Demographic characteristics
Age in years, median (IQR)
72 (70-78)
Male sex, N (%) 13 (56)
Renal characteristics
Baseline eGFR, mL/min/1.73 m2, median (IQR)
eGFR at disease onset, mL/min/1.73 m2, median (IQR)
63 (47-87)
11.5 (5-15)
AKI KDIGO stage, unknown, 1, 2, 3, % 4, 4, 9, 83
Dialysis dependence at presentation, N (%) 10 (44)
Proteinuria, g/24 h, median (IQR) 1.28 (0.70-3.08)
Albuminuria fraction, N=6, %, median (IQR) 18 (3-27)
Hematuria, N (%) 5 (22)
Hematologic characteristics
Prior LCCN diagnosis, N (%) 10 (44)
Waldenström macroglobulinemia, N (%) 14 (60.9)
Small lymphocytic lymphoma, N (%) 3 (13)
IgG lymphoplasmacytic lymphoma, N (%) 2 (8.7)
Extranodal marginal zone lymphomas, N (%) 2 (8.7)
Diffuse large B-cell lymphoma, N (%) 2 (8.7)
Type of heavy chains, IgA, IgM, IgG, none, % 9, 57, 30, 4
Quantification of monoclonal spike, g/L, median (IQR) 22.2 (7.7-37.4)
k light chain, N (%) 17 (74)
l light chain, N (%) 6 (26)
FLC level, mg/L, median (IQR) 2,237 (437.5-3,648.2)
Pathology findings
Globally sclerosed glomeruli, %, median (IQR) 25 (8-55)
the patients. In contrast, in the cohort of 178 patients with MM, only 1.7% (n=3) had interstitial infiltration by neoplastic cells.2 It should be noted that the extent of the tumor infiltration may be such that it overrides LCCN, especially considering the presence of other conditions secondary to the circulating paraprotein, potentially reducing the detection of hematologic malignancy-related LCCN in these patients. The most frequent concomitant kidney pathology was MIDD, which was diagnosed in 22% (n=5) of the patients. Other kidney pathologies were AL amyloidosis, amyloid cast nephropathy and C3 glomerulopathy. In the cohort of 178 patients with MM, 10.6% (n=19) had other kidney diseases with, as in our cohort, MIDD being most
Figure 1. Pathology illustrations. (A) Representative image of a patient’s kidney biopsy viewed by light microscopy after staining with periodic acid-Schiff (PAS), showing multiple pale tubular casts with PAS staining (black arrows) and areas of interstitial infiltration (black asterisk). (B) Light microscopy after staining with Masson trichrome showing typical polychromatophilic casts with a giant cell reaction around a fractured cast (black arrow). (C) Light microscopy after hematoxylin & eosin staining showing diffuse interstitial lymphoma infiltration. (D) Immunohistochemistry analysis targeting CD79A showing diffuse interstitial B-cell lymphoma infiltration. (E ) Light microscopy after PAS staining of a biopsy from a patient with monoclonal immunoglobulin deposition disease (MIDD) and associated cast nephropathy showing PAS-positive mesangial expansion (red arrow) and PAS-positive tubular basement membrane thickening (black square) together with the presence of PAS-negative tubular casts (black arrows). (F, G) Immunofluorescence analyses of a patient with MIDD and associated cast nephropathy using anti-k and anti-l antibodies showing monotypic k light chain staining within a tubular cast (red arrows), glomerular mesangium (yellow arrows) and tubular basement membrane (blue arrows). Scale bar 100 μm.
frequently associated disease (n=11, 6.2%).2
As identified in MM, eGFR at disease onset was inversely correlated with the number of casts per square millimeter in the cortex and medulla combined (r=-0.423, P=0.045).2
In addition, patients with more than 2 casts/mm2 in the whole sample presented with higher serum creatinine (361±330 vs. 724±392 μmol/L; P=0.032) and lower eGFR (20±12 vs. 8±4 mL/min/1.73 m2; P=0.016). We also observed a positive correlation between proteinuria and the number of casts per square millimeter of the total sample (r= 0.558, P=0.009), and between proteinuria and light chain levels (r=0.590, P=0.016). Of interest, FLC level was higher in the group with >25% of IFTA (3,793 mg/L) than in the
group with <25% of IFTA (1,101.5 mg/L) ( P<0.05). This is similar to the findings of Royal et al.2 and further supports the hypothesis of a chronic profibrotic role for light-chain proteinuria, as mentioned by Ying et al.7 Of note, the percentage of globally sclerotic glomeruli did not correlate with onset eGFR or proteinuria, but it did correlate with baseline eGFR (r=-0.694, P=0.004) and serum creatinine (r=0.630, P=0.012). There was no statistically significant difference in terms of presenting eGFR or serum creatinine between the patients who did or did not have a giant cell reaction around casts, tubulitis, interstitial edema, tubular rupture, extravasation of Tamm-Horsfall protein or IFTA. Of particular importance, 12 patients (52%) died during the follow-up period, with a median survival of 15 months (3-48) which is comparable to that of patients with MM-associated LCCN (103 deaths, 58%, median survival of 13 months).2 In addition, all patients requiring dialysis at the time of diagnosis (n=10) progressed to end-stage renal failure or died (n=6). Among patients alive at last follow up (n=10), the median eGFR at presentation was 13.5 (4-21) mL/min/1.73 m2 and 40% (n=4) of the patients required hemodialysis at presentation. All these four patients remained under hemodialysis at last follow-up. None of the patients who did not require hemodialysis at disease onset (n=6) progressed to end-stage renal disease and presented a median eGFR at last follow-up of 36.5 (27-47) mL/min/1.73 m2. The difference between initial and final eGFR in these six patients was an increase of 14.5 (11-20) mL/min/1.73 m2, i.e., a median increase of 61%. Thus, although lymphoplasmacytic lymphomas are considered hematologic malignancies with a better overall prognosis than myeloma,8,9 the presence of associated LCCN considerably worsens the survival of patients, with mortality rates comparable to those of patients with myeloma-associated LCCN.2 It is therefore crucial to diagnose this renal complication early in all patients with lymphoplasmacytic lymphomas.
This multicenter study represents the most extensive investigation of its kind to examine and delineate the clinical and pathological attributes of non-MM LCCN while drawing comparisons with MM LCCN. However, the limited number of patients in our study, attributed to the rarity of the disease and inherent to the retrospective nature of the study, presented a challenge to achieving statistically significant results and identifying reliable prognostic markers. Overall, our pathological analysis and correlation with clinical and biological data at presentation were very similar to those of patients with MM, particularly with regard to the number of casts and correlation with initial renal dysfunction. More importantly, we show that non-MM LCCN is associated with poor survival as in MM. Finally, with regard to clinicians and pathologists, this study identified three important points. First, it emphasizes the need for a close and longitudinal assessment of kidney function in patients with mature B-cell neoplasms with plasmacytic differentiation. Unlike MM LCCN, non-MM/lym-
phoma LCCN is often not concomitant with the diagnosis of the hematologic malignancy, and often develops later (43% of our cases). Secondly, it should raise pathologists’ awareness of the need to look for casts in lymphoma patients, as LCCN is classically associated with myeloma and not lymphomatous disorders. Lastly, it should also sensitize pathologists to systematically look for casts even in the presence of more exuberant histological features that may overlap, such as tumor cell infiltration (83% of our cases) and/or glomerular lesions (MIDD), which could cause them to miss the most important lesion in terms of outcome.
Authors
Ana Cristina Martins,1,2 Jean-Baptiste Gibier,3 Charles Ronsin,4 Christine Kandel-Aznar,5 Anne Moreau,5,6 Marion Chapal,7 Diogo Francisco,1,2 Hamza Sakhi,8,9 Julie Oniszczuk,10 Lorraine Gueguen,11
Anne Grunenwald,12 Mathilde Devaux,13 Alexandre Karras,9,14 Virginie Royal,15 Marion Rabant,1,9 Viviane Gnemmi,3 Jérôme Olagne,16,17# JeanPaul Duong Van Huyen1,9# and Pierre Isnard1,9#
1Department of Pathology, Necker-Enfants Malades and Robert Debré University Hospital, APHP, Paris, France; 2Nephrology and Kidney Transplantation Department, Centro Hospitalar de Lisboa Ocidental, Lisbon, Portugal; 3Department of Pathology, Lille University Hospital, Lille, France; 4Department of Nephrology, Nantes University Hospital, Nantes, France; 5Department of Pathology, Nantes University Hospital, Nantes, France; 6Department of Pathology, Centre Hospitalier Départemental de Vendée, La Roche sur Yon, France; 7Department of Nephrology, Centre Hospitalier Départemental de Vendée, La Roche sur Yon, France; 8Department of Nephrology, Necker University Hospital, Paris, France; 9Paris-Cité University, Paris, France; 10Department of Nephrology, Foch Hospital, Suresnes, France; 11Department of Nephrology, Ta’aone Hospital, Tahiti, French Polynesia; 12Department of Nephrology, Poissy Hospital, Poissy, France; 13Department of Internal Medicine, Poissy Hospital, Poissy, France; 14Department of Nephrology, Georges Pompidou European University Hospital, Paris, France; 15Department of Pathology, Maisonneuve-Rosemont Hospital, Montréal University, Montréal, Quebec, Canada; 16Department of Nephrology and Transplantation, Strasbourg University Hospital, Strasbourg, France and 17Department of Pathology, Strasbourg University Hospital, Strasbourg, France
#JO, J-PDVH and PI contributed equally as senior authors.
Correspondence: P. ISNARD E - pierre.isnard@aphp.fr
All authors participated in the acquisition of data, and revised and approved the final version of the manuscript. PI, J-PDVH and JO
References
1. Leung N, Bridoux F, Nasr SH. Monoclonal gammopathy of renal significance. N Engl J Med. 2021;384(20):1931-1941.
2. Royal V, Leung N, Troyanov S, et al. Clinicopathologic predictors of renal outcomes in light chain cast nephropathy: a multicenter retrospective study. Blood. 2020;135(21):1833-1846.
3. Vos JM, Gustine J, Rennke HG, et al. Renal disease related to Waldenström macroglobulinaemia: incidence, pathology and clinical outcomes. Br J Haematol. 2016;175(4):623-630.
4 Uppal NN, Monga D, Vernace MA, et al. Kidney diseases associated with Waldenström macroglobulinemia. Nephrol Dial Transplant. 2019;34(10):1644-1652.
5. Levey AS, Stevens LA, Schmid CH, et al. A new equation to estimate glomerular filtration rate. Ann Intern Med.
designed the study. PI and ACM analyzed the data, created the figures and tables and drafted the manuscript.
Acknowledgments
The authors would like to thank the French Nephropathology Group.
Data-sharing statement
All the data supporting the findings of this study are in the manuscript, Figure and Online Supplementary Figure.
2009;150(9):604-612.
6. Sanders PW. Mechanisms of light chain injury along the tubular nephron. J Am Soc Nephrol. 2012;23(11):1777-1781.
7 Ying WZ, Li X, Rangarajan S, Feng W, Curtis LM, Sanders PW. Immunoglobulin light chains generate proinflammatory and profibrotic kidney injury. J Clin Invest. 2019;129(7):2792-2806.
8. Campo E, Jaffe ES, Cook JR, et al. The International Consensus Classification of Mature Lymphoid Neoplasms: a report from the Clinical Advisory Committee. Blood. 2022;140(11):1229-1253.
9 Alaggio R, Amador C, Anagnostopoulos I, et al. The 5th edition of the World Health Organization classification of haematolymphoid tumours: lymphoid neoplasms. Leukemia. 2022;36(7):1720-1748.
Outcome of infants with acute lymphoblastic leukemia treated with the Chinese Children’s Cancer Group Acute Lymphoblastic Leukemia 2015 study protocol
Infants diagnosed with acute lymphoblastic leukemia (ALL) constitute a subgroup of patients notorious for their inferior outcome, high risk of treatment failure and susceptibility to treatment-related toxicities when compared to older children with ALL. This subgroup accounts for less than 5% of all pediatric ALL cases, with overall event-free survival (EFS) reported in the range of 40-50%.1 The presence of KM2TA-rearrangement (KMT2A-r) is a well-defined prognostic factor for infants with ALL. Despite various multi-center studies aimed at testing new treatment strategies to enhance outcomes, success has proven elusive.2-5 The results of the Chinese Children’s Cancer Group ALL-2015 (CCCG-ALL-2015) study, a multicenter collaboration in China for the treatment of pediatric ALL, are already available elsewhere.6,7 In this report, we present the treatment outcomes of the infant patients enrolled in this study and analyze the factors influencing treatment outcomes.
Patients were enrolled between January 2015 and December 2019. Written informed consent was obtained from the patients’ parents or legal guardians. All infants were categorized into an intermediate-risk (IR) or high-risk (HR) group. Infants aged <6 months and KMT2A-r, with a white blood cell count (WBC) ≥300x109/L at presentation, or those experiencing induction failure defined by the presence of ≥5% blast on morphology assessment of the day 46 bone marrow aspirate or minimal residual disease (MRD) ≥1%, were stratified to the HR group. Dose adjustments based on age were not implemented in this study. Event-free survival was computed from diagnosis to the first adverse event, including induction failure, relapse, death from any cause, development of a second malignant neoplasm, withdrawal upon parental request, or off-protocol by the decision of the treating physician. Overall survival (OS) was defined as the duration from diagnosis to death due to any cause. Outcome data were updated on December 2022. The cumulative incidence of relapse (CIR) and treatment-related fatal infections were estimated by Kalbfleisch and Prentice, and compared with Grey’s test. The Kaplan-Meier method was used to estimate EFS and OS. Cox’s hazards model was used for univariate or multivariate analyses. Statistical analyses were performed using R software, version 3.6.3 and SPSS 25.0. A two-tailed P<0.05 was considered statistically significant. Among the 134 enrolled infant ALL, median age was 254 days (range, 46-364 days) (Online Supplementary Table S1).
Median WBC was 62.7 (1.3-777x109/L), with 11.2% having a WBC ≥300x109/L. There were 71 (53.0%) with KMT2A-r ALL (median age, 7.4 months) and 63 with KMT2A-g ALL (medi-
an age, 9.4 months). Among the 71 KMT2A-r, 60 had fusion partners identified, 32 (53.3%) had KMT2A::AFF1 fusion, 10 (16.7%) had KMT2A::MLLT1, 15 (25%) had KMT2A::MLLT3, and 3 (5%) had KMT2A::MLLT10. In the KMT2A-r patients, 20 (27.8%) were aged <6 months at diagnosis and 12 (16.9%) had WBC ≥300x109/L at presentation, with 5 being both <6 months and WBC ≥300x109/L, thus classified as HR. WBC >300x109/L was less commonly encountered in the KMT2A-g patients, occurring in 3 (4.8%).
As of December 2022, with a median follow up of 4.2 years (range, 0.08-7.2 years), 45 patients had died. Eighteen subjects (13.4%) experienced discontinuation of protocol-specified treatment; 10 were withdrawn upon parental request (Online Supplementary Figure S1). For the entire cohort, 5-year EFS was 52.1% (95% CI: 44.2-61.4%) and 5-year OS was 66.1 (95% CI: 58.4-74.8%). The 5-year EFS and OS for KMT2A-g versus KMT2A-r were 69.8 (95% CI: 59.3-82.1%) versus 35.6% (95% CI: 25.7-49.4%) (P<0.001), and 74.6% (95% CI: 64.5-86.1%) versus 58.1% (95% CI: 47.2-71.5%) (P=0.02), respectively (Figure 1A, B). The complete remission (CR) rate for the entire group was 89.6% (120/134). The CR rate was 81.6% (58/71) for KMT2A-r ALL and 98.4% (62/63) for KMT2A-g ALL. On day 5 of induction therapy (i.e., after 4 days of oral dexamethasone), 86 patients had peripheral blood blast count available, with 63 showing blast count dropped to below 1x10⁹/L, considered as good responders. There was no statistically significant difference in the EFS and OS between the dexamethasone good responder and poor responder.
For the entire group, MRD negativity on day 19 and day 46, IR group, and KMT2A-g had superior EFS on univariate analysis, and the MRD negativity on day 19, IR group and KMT2A-g remained significant on multivariate analysis (Table 1). Among KMT2A-r patients, factors associated with an inferior EFS were <3 months and day 19 and day 49 MRD positive (Table 2). KMT2A-r subtypes had no prognostic value for EFS and OS (Figure 1C, D). For the KMT2A-r subgroup, multivariate analysis of EFS only showed day 19 with MRD >0.01% as a significant factor (P=0.008). WBC >100x109/L at presentation was of prognostic significance in the KMT2A-g group, along with inferior OS (55% vs. 83.7%; P=0.01) and EFS (50% vs. 79%; P=0.01). Dexamethasone poor response was associated with a poorer EFS among the KMT2A-g subgroup (P=0.009) (Online Supplementary Table S2).
The infection rates for sepsis, severe pneumonia, and invasive fungal infection were 44.8% (60/134), 17.9% (24/134), and 9.0% (12/134). There were 18 deaths in remission, including 8 severe pneumonia (44.4%), 7 septic shock (38.9%), 2 invasive
fungal infections (11.1%) and one third-degree atrioventricular block (5.6%). The cumulative incidence of fatal infection during the entire treatment was 13.5% (95%CI: 7.7-19.3%).
Twenty-nine recurrences (21.6%) occurred at a median of 15.7 months (range 1.6 month to 39.2 months); five patients relapsed more than 2 years post diagnosis. Among these, 23 (17.2%) relapses manifested in the bone marrow, two (3% in male patients) were isolated testicular relapse, three (2.2%) were isolated CNS recurrences and one (0.7%) involved combined bone marrow and CNS relapse. The 5-year CIR for the entire group was 23.0% (15.7-30.3%). The 5-year CIR was 30.2% (95% CI: 18.8-41.6%) in the KMT2A-r subgroup and 15.9% (95% CI: 6.8-25.0%) in the KMT2A-g subgroup (P=0.05).
therapy (CAR-T therapy), all of whom had KMT2A-r. HSCT timing ranged from 4.2 to 33.8 months post diagnosis. Among transplant recipients, 3 subjects died of progressive and refractory disease, one succumbed to an accident, and the remaining 3 subjects were alive with a duration follow-up of from 37.5 to 51.1 months. Six patients received CAR-T therapy: 2 received CD19 and 4 received CD19/CD22. Five patients received HSCT after CAR-T therapy at a mean interval of 71 days post CAR-T; these 5 remained in remission. Notably, the subject with KMT2A-g who did not receive HSCT post CAR-T experienced a second relapse six months post CAR-T therapy, and succumbed to progressive disease ten months later. This cohort of infants with ALL is part of the CCCG-ALL-2015 study which had enrolled 7,640 subjects. The infant cohort, constituting approximately 1.7% of the entire CCCG-ALL-2015
Figure 1. 5-year event-free survival and overall survival of infant acute lymphoblastic leukemia according to genetic subtypes. (A) 5-year event-free survival (EFS) of the KMT2A-r group compared with the KMT2A-g group: 69.8 (95% CI: 59.3-82.1%) versus 35.6% (95% CI: 25.7-49.4%), respectively (P<0.001). (B) 5-year overall survival (OS) of the KMT2A-r group compared with the KMT2A-g group: 74.6% (95% CI: 64.5-86.1%) versus 58.1% (95% CI: 47.2-71.5%), respectively (P=0.02). (C) The EFS of the various KMT2A-r subtypes. (D) The OS of the various KMT2A-r subtypes.
protocol, was notably lower than the anticipated 3-4% based on comparisons with other studies. Within our cohort, the percentage of infants under six months of age at diagnosis was 18.4%, significantly lower than the 50-68% reported in previous studies.3,8 Moreover, KMT2A-r was observed in 53.0% of the enrolled subjects, a figure also below the 74-83% reported in other studies.3,8 It is noteworthy that high-risk subjects appeared to be under-represented in our enrolled patients. Additionally, only 11% of our subjects had WBC >300x109/L, significantly lower than that in the Interfant 06 and JPLSG MLL10 studies, which reported 29% and 30%, respectively3,8 (Online Supplementary Table S3).
In our study, first lumbar puncture (LP) and central nervous system (CNS) assessment was deferred to day 5 of induction and demonstrated a lower CNS involvement after 4 days of dexamethasone prophase. The isolated CNS relapse rate was 2.2% and combined BM and CNS relapse was 0.7%, contrasting with the isolated CNS relapse rate of 11.9% in the Interfant 06 study.3 Performing LP when the blast count in peripheral blood was reduced after the pre-phase treatment might be a safer approach. Notably, CNS relapse rate remained low despite a relatively high rate of traumatic LP (approx. 10%) in our cohort.
The early treatment-related mortality (TRM) was high in
Table 1. Risk analysis of event-free survival in infants with acute lymphoblastic leukemia.
our cohort, with 10 fatal infections (7.5%) occurring in the induction period; this rate surpasses that reported in the Interfant-99 protocol (3.8%).2 Recognizing the critical role of supportive care in the early phase of therapy is essential for enhancing outcomes, particularly in developing countries. Implementing dose modification during the induction could also contribute to reducing early mortality.9 To mitigate TRM during the early intensive phase, we developed a dedicated Infant ALL study with an age-adjusted dose approach and blinatumomab.
Blinatumomab, recently investigated in a pilot study based
on the Interfant regimen, demonstrated remarkable early results.10 CAR-T therapy, performed in patients with relapsed or refractory ALL, raises concerns about lineage switch, particularly in patients with mixed-phenotype acute leukemia, where the B-lineage is the target.11,12 Instances of myeloid leukemia have been reported in infants after achieving remission with ALL treatment post blinatumomab or CAR-T therapy.13-15 Consolidative HSCT after CAR-T therapy has shown success in our cohorts. In conclusion, the CCCG-2015-Study had a low percentage of infant patients as well as KMT2A-r. Despite high TRM, the relapse rate was not excessively high.
Table 2. Treatment outcome according to selected clinical and biological characteristics in infants with KMT2A-r acute lymphoblastic leukemia.
Dexamethasone prophase may offer protection against CNS relapse in infants. CAR-T therapy followed by allogeneic HSCT should be explored in future studies.
1Department of Pediatrics, Hong Kong Children’s Hospital, The Chinese University of Hong Kong, Hong Kong SAR, China; 2Department of Hematology/Oncology, Shanghai Children’s Medical Center, Shanghai Jiao Tong University School of Medicine, Key Laboratory of Pediatric Hematology & Oncology of China Ministry of Health, and National Children’s Medical Center, Shanghai, China; 3Department of Pediatrics, West China Second University Hospital, Sichuan University, Key Laboratory of Birth Defects and Related Disease of Women and Children, Ministry of Education, Chengdu, China; 4Department of Hematology/Oncology, Chongqing Medical University Affiliated Children’s Hospital, Chongqing, China; 5Department of Hematology/ Oncology, Children’s Hospital of Nanjing Medical University, Nanjing, China; 6Department of Pediatrics, Affiliated Hospital of Qingdao University, Qingdao, China; 7Department of Hematology/Oncology, Shanghai Children’s Hospital, Shanghai, China; 8Department of Hematology/Oncology, Children’s Hospital of Soochow University, Suzhou, China; 9Department of Pediatrics, Anhui Medical University Second Affiliated Hospital, Anhui, China; 10Department of Hematology/ Oncology, Xi ‘an Northwest Women’s and Children’s Hospital, Xi ‘an, China; 11Department of Hematology/Oncology, KunMing Children’s Hospital, Kunming, China; 12Department of Pediatrics, State Key Laboratory of Experimental Hematology, National Clinical Research Center for Blood Diseases, Institute of Hematology & Blood Diseases Hospital, Chinese Academy of Medical Sciences & Peking Union Medical College, Tianjin, China; 13Department of Pediatrics, Union Hospital of Tongji Medical College, Huazhong University of Science and Technology, Wuhan, China; 14Department of Pediatrics, Nanfang Hospital, Southern Medical University, Guangzhou, China; 15Department of Pediatrics, Qilu Hospital of Shandong University, Jinan, China; 16Department of Hematology/Oncology, Children’s Hospital of
References
1. Hilden JM, Dinndorf PA, Meerbaum SO, et al. Analysis of prognostic factors of acute lymphoblastic leukemia in infants: report on CCG 1953 from the Children’s Oncology Group. Blood. 2006;108(2):441-451.
2. Pieters R, Schrappe M, De Lorenzo P, et al. A treatment protocol for infants younger than 1 year with acute lymphoblastic leukaemia (Interfant-99): an observational study and a multicentre randomised trial. Lancet. 2007;370(9583):240-250.
Fudan University, Shanghai, China; 17Department of Hematology/ Oncology, Guangzhou Women and Children’s Medical Center, Guangzhou, China; 18Department of Pediatrics, Tongji Hospital of Tongji Medical College, Huazhong University of Science and Technology, Wuhan, China; 19Department of Hematology/Oncology, Jiangxi Provincial Children’s Hospital, Nanchang, China; 20Department of Pediatrics, Xiangya Hospital Central South University, Changsha, China and 21Departments of Oncology, Pathology, and Global Pediatric Medicine, St. Jude Children’s Research Hospital, Memphis, Tennessee, TN, USA
*AWKL, JC and ZW contributed equally as first authors.
#JG, C-HP and C-KL contributed equally as senior authors.
Correspondence:
C-K LI - ckli@cuhk.edu.hk https://doi.org/10.3324/haematol.2024.285201
Received: January 31, 2024.
Accepted: April 10, 2024. Early view: April 18, 2024.
C-KL, C-HP and JG conceived and performed the research, discussed data and wrote the paper. AWKL, JC and ZW collected data and provided statistical analysis. All authors contributed to the manuscript and to the interpretation of the data, and approved the final version for publication.
Acknowledgments
This study was supported by the VIVA China Children’s Cancer Foundation, and the American Lebanese and Syrian Associated Charities (to C-HP).
Data-sharing statement
The original data and protocols are available to other investigators on reasonable request to the corresponding author.
3. Pieters R, De Lorenzo P, Ancliffe P, et al. Outcome of infants younger than 1 year with acute lymphoblastic leukemia treated with the Interfant-06 protocol: results from an international phase III randomized study. J Clin Oncol. 2019;37(25):2246-2256.
4 Dreyer ZE, Hilden JM, Jones TL, et al. Intensified chemotherapy without SCT in infant ALL: results from COG P9407 (Cohort 3). Pediatr Blood Cancer. 2015;62(3):419-426.
5. Brown PA, Kairalla JA, Hilden JM, et al. FLT3 inhibitor lestaurtinib plus chemotherapy for newly diagnosed KMT2Arearranged infant acute lymphoblastic leukemia: Children’s
Oncology Group trial AALL0631. Leukemia. 2021;35(5):1279-1290.
6. Yang W, Cai J, Shen S, et al. Pulse therapy with vincristine and dexamethasone for childhood acute lymphoblastic leukaemia (CCCG-ALL-2015): an open-label, multicentre, randomised, phase 3, non-inferiority trial. Lancet Oncol. 2021;22(9):1322-1332.
7 Tang J, Yu J, Cai J, et al. Prognostic factors for CNS control in children with acute lymphoblastic leukemia treated without cranial irradiation. Blood. 2021;138(4):331-343.
8. Tomizawa D, Miyamura T, Imamura T, et al. A risk-stratified therapy for infants with acute lymphoblastic leukemia: a report from the JPLSG MLL-10 trial. Blood. 2020;136(16):1813-1823.
9. Salzer WL, Jones TL, Devidas M, et al. Decreased induction morbidity and mortality following modification to induction therapy in infants with acute lymphoblastic leukemia enrolled on AALL0631: a report from the Children’s Oncology Group. Pediatr Blood Cancer. 2015;62(3):414-418.
10 van der Sluis IM, de Lorenzo P, Kotecha RS, et al. Blinatumomab added to chemotherapy in infant lymphoblastic leukemia. N Engl J Med. 2023;388(17):1572-1581.
11. Stasik C, Ganguly S, Cunningham MT, Hagemeister S, Persons DL. Infant acute lymphoblastic leukemia with t(11;16)(q23;p13.3) and lineage switch into acute monoblastic leukemia. Cancer Genet Cytogenet. 2006;168(2):146-149.
12. Jacoby E, Nguyen AM, Fountaine TJ. CD19 CAR immune pressure induces B-precursor acute lymphoblastic leukaemia lineage switch exposing inherent leukaemic plasticity. Nat Commun. 2016,7:12320.
13. Du J, Chisholm KM, Tsuchiya K, et al. Lineage switch in an infant B-lymphoblastic leukemia with t(1;11)(p32;q23); KMT2A/ EPS15, following blinatumomab therapy. Pediatr Dev Pathol. 2021;24(4):378-382.
14 Rayes A, McMasters RL, O’Brien MM. Lineage switch in MLLrearranged infant leukemia following CD19-directed therapy. Pediatr Blood Cancer. 2016;63(6):1113-1115.
15. Leahy AB, Devine A, Li Y, et al. Impact of high-risk cytogenetics on outcomes for children and young adults receiving CD19directed CAR T-cell therapy. Blood. 2022;139(14):2173-2185.
Hypomethylating agents are associated with high rates of hematologic toxicity in patients with secondary myeloid neoplasms developing after acquired aplastic anemia
Most patients with acquired aplastic anemia (AA) treated with immunosuppressive therapy (IST) develop clonal hematopoiesis (CH) in recovering hematopoietic stem and progenitor cells (HSPC).1-3 Up to 20% of patients go on to develop secondary myelodysplastic syndrome (MDS) or acute myeloid leukemia (AML).4,5 Despite an improved understanding of CH and risk factors for post-AA myeloid neoplasms (MN),1,3,4,6-8 optimal management of patients with post-AA MN remains unknown.
Curative treatment for patients with high-risk MN typically requires allogeneic stem cell transplantation (SCT). Hypomethylating agents (HMA) prolong survival in MDS patients and are commonly administered before SCT for disease control. HMA are given as outpatient therapy and have a favorable toxicity profile.9,10 Because AA patients have a depletion of their HSPC, we hypothesized that postAA MN patients may be more susceptible to hematologic toxicities with HMA therapy. We thus evaluated treatment outcomes and treatment-emergent adverse events (TEAE) in post-AA MN patients treated at the University of Pennsylvania (Penn) and Children’s Hospital of Philadelphia (CHOP) between 2005 and 2022.
Patients were identified retrospectively through ICD-9/10 codes and the Penn/CHOP Comprehensive Bone Marrow Failure (BMF) registry, followed by chart review as a part of Institutional Review Board-approved research. MN was defined according to World Health Organization (WHO) criteria. AA diagnosis was established using standard criteria,11 requiring systematic exclusion of other causes including transient cytopenias, neoplasia, and inherited BMF. TEAE were graded according to the Common Terminology Criteria for Adverse Events (CTCAE, version 5.0). Overall survival (OS) from MN diagnosis to death was estimated using the Kaplan-Meier method. Each post-AA patient who received at least one cycle of HMA was randomly matched to three similarly-aged non-AA MDS patients who received at least one cycle of HMA at Penn for MDS during the study period. Endpoints of interest included incidence of febrile neutropenia; grade 3-4 infections and hemorrhage; intracranial hemorrhage (ICH); duration of grade 4 neutropenia, anemia, and thrombocytopenia; hospitalizations; HMA cycle delays; dose reductions; therapy discontinuation; receipt of SCT; and death during HMA treatment. Treatment cycles were 28 days from the start of HMA, with delay defined as >14 days from planned subsequent cycle initiation. The study cohort included 14 post-AA MN patients who were diagnosed with AA at a median age of 49 years (range, 1-71)
(Table 1). Thirteen of 14 received IST with anti-thymocyte globulin and cyclosporine. One had hepatitis-associated AA that was initially managed with growth factors and transfusions followed by recovery of blood counts after development of paroxysmal nocturnal hemoglobinuria. Six patients (43%) had at least one AA relapse, with two (14%) developing MN within 1 year of IST retreatment. Median time from AA to MN transformation was 5 years (range, 0.2530), with a median age at MN of 56.5 years (range, 5-75). After MN diagnosis, patients were followed for 33 months (range, 1-107).
No patients had evidence of dysplasia at AA diagnosis, and of those with evaluable cytogenetic (N=11) and somatic sequencing (N=4) data, none had clonal abnormalities at AA diagnosis. After IST, three developed CH without morphologic dysplasia (Online Supplementary Figure S1). At MN diagnosis, nine patients (64%) had cytogenetic abnormalities, most commonly monosomy 7 (36%). Five (36%) had poor-or verypoor-risk cytogenetics by Revised International Prognostic Scoring System (IPSS-R) criteria. Eight (57%) had somatic mutations classically associated with secondary malignancy in AA,6 most commonly ASXL1 (29%) and RUNX1 (21%). By WHO criteria, eleven patients were classified as having MDS, one AML, and two clonal cytopenia of undetermined significance (CCUS; 1 had transfusion-dependent thrombocytopenia with ASXL1, RUNX1, and DNMT3A mutations, another 1 had der(3;15) with 3q gain).
Patients with post-AA MN were treated according to institutional standard practices for pediatric and adult patients. Three pediatric patients were treated with SCT. In contrast, ten of 11 adults received HMA, administered to induce hematologic response, prevent leukemic progression, and reduce disease burden. One adult died before receiving treatment. Nine MDS/CCUS patients were treated with azacitidine, while the AML patient received azacitidine and venetoclax. Overall survival was 71% (95% confidence interval [CI]: 5199) at 1 year and 56% (95% CI: 34-90) at 3 years. OS was not associated with age at diagnosis (hazard ratio [HR]=1.01; P=0.637) or premalignant CH (HR=0.63; P=0.67). Nine patients (3 pediatric, 6 adult) received SCT (Online Supplementary Table S1) - seven (78%) were alive and six (66%) remained in remission at time of analysis (Figure 1A). Two adults (22%) relapsed following SCT. One pediatric patient had primary graft failure with high-titer HLA alloimmunization and died after second SCT. All six patients transplanted after HMA had residual dysplasia, including two with ≥5% marrow blasts at SCT. Five of six stopped HMA due to toxicity. Me-
Table 1. Baseline characteristics of investigated patients.
Characteristics of the 14 pediatric and adult patients with post-AA myeloid neoplasms
Characteristic Value
Total patients, N 14
Median age in years at AA diagnosis (range) 49 (1-71)
Median age in years at MN diagnosis (range) 56.5 (5-75)
Median time in years from AA to MN diagnosis (range) 5 (0.25-30)
Female sex, N (%) 6 (43)
Initial AA therapy, N (%)
ATG + CSA 10 (71)
ATG + CSA + eltrombopag 1 (7)
CSA + androgen 1 (7)
ATG + androgen 1 (7)
Growth factor support 1 (7)
Patients with at least 1 AA relapse, N (%) 6 (43) AA status at MN diagnosis, N (%)
Complete remission, off immunosuppression 7 (50)
At least partial remission, on immunosuppression or growth factor 5 (36)
Refractory, on immunosuppression 2 (14)
Presence of PNH clone†, N (%) 3 (21)
Characteristics of post-AA adults treated with HMA compared to non-AA MDS patients
N
†Two patients had clinically significant hemolytic PNH, and 1 had a subclinical PNH clone. AA: acquired aplastic anemia; MN: myeloid neoplasm; ATG: anti-thymocyte globulin; CSA: cyclosporine; PNH: paroxysmal nocturnal hemoglobinuria; AML: acute myeloid leukemia; MDS: myelodysplastic syndrome; CCUS: clonal cytopenia of undetermined significance; IPSS-R: Revised International Prognostic Scoring System; IPSS-M: Molecular International Prognostic Scoring System; ANC: absolute neutrophil count; HMA: hypomethylating agent; SCT: stem cell transplant.
dian time from MN diagnosis to SCT was 6 months (range, 3-21). Four patients who did not undergo SCT after HMA either died (N=2) or could no longer receive SCT after TEAE (N=2). Median OS was 12 months in patients who did not
receive SCT (N=5) and not reached in transplanted patients (Figure 1B).
Ten post-AA MN adult patients treated with HMA were then included in comparative analysis of TEAE, with outcomes
Figure 1. Clinical courses of 14 post-aplastic anemia patients with secondary myeloid neoplasms. Swimmer plot (A) depicting clinical courses; year 0 on the x-axis is diagnosis of myeloid neoplasm with negative time representing time from aplastic anemia diagnosis with scale compressed given large range (0.2530 years); and overall survival (B) of post-aplastic anemia patients plotted from the time of diagnosis of myeloid neoplasia. AML: acute myeloid leukemia; CSA: cyclosporine; HMA: hypomethylating agent; HiDAC: high-dose cytarabine; IST: immunosuppressive therapy; ATG: anti-thymocyte globulin; MDS: myelodysplastic syndrome; SCT: allogeneic stem cell transplant.
compared to 30 randomly-selected, aged-matched MDS patients without antecedent AA. The cohorts had similar baseline characteristics (Table 1) aside from lower median platelet counts (36x109/L vs. 115x109/L; P=0.007) in post-AA patients.
Post-AA patients, most of whom were in remission from AA when they developed MN, experienced significantly higher rates of hematologic toxicities with HMA administration (Table 2). Per cycle, post-AA patients experienced longer grade 4 neutropenia (median 9 vs. 1.5 days; P=0.044) and grade 4 thrombocytopenia (median 13 vs. 0 days; P=0.003), more febrile neutropenia (80% vs. 17%, RR 4.8; P<0.001), grade 3-4 infections (90% vs. 13%, RR 6.8; P<0.001), and grade 3-4 hemorrhages (40% vs. 7%, RR 6.0; P=0.026). Two post-AA patients (20%) experienced ICH on HMA versus none in the non-AA cohort. Post-AA patients had more hospital admissions - 18 in 25 total chemotherapy cycles (72%) compared to 12 in 207 cycles (6%) in the matched cohort (RR 12.4; P<0.001). Post-AA MN patients had more treatment delays (28% vs. 8% of cycles, RR 3.4; P=0.007), more HMA discontinuation (70% vs. 3%, RR 21.0; P<0.001), and received fewer cycles of HMA (median 2.5 vs. 6; P=0.021). Death occurred following TEAE in 20% of post-AA MN patients versus no deaths on HMA in the matched cohort (RR 14.1; P=0.06). Median time from MN diagnosis to SCT was 8.5 months (range, 4-21) in post-AA versus 5 months (range, 4-15) in non-AA patients. Three-year OS in the post-AA MN cohort was shorter (57% vs. 88%), though this was not statistically significant (P=0.18). Three-year OS in post-AA versus nonAA patients who underwent SCT was similar (83% vs. 92%;
P=0.6). Exclusion of the one post-AA AML patient did not affect the results (Online Supplementary Table S2). Prior registry-based studies evaluated outcomes of postAA MN patients after SCT, with comparable OS for postAA versus de novo MDS, and better OS compared to other types of secondary MDS.12-14 However, these analyses were restricted to transplanted patients and did not include data on pretransplant patient management. Cytotoxic chemotherapy has been linked to increased rates of hematologic and extra-hematopoietic toxicities in inherited BMF. Ours is the first report, however, of increased toxicity in patients with a history of acquired AA. Though HMA has a tolerable toxicity profile in MDS, post-AA patients in our cohort experienced dramatically higher rates of serious infections, hemorrhage, hospitalizations, and treatment delays compared to age-matched non-AA MDS patients. Higher TEAE rates occurred with fewer HMA cycles (median 2.5 vs. 6) reflecting a high incidence of treatment termination. In our study, post-AA MN patients who had received multiple IST cycles for relapsed AA had particularly severe cytopenias with HMA, likely reflecting a cumulative effect of HSPC depletion by successive episodes of immune-mediated aplasia. Prospective studies are needed to develop risk stratification for post-AA MDS patients. Traditional risk models used to aid treatment in MDS such as IPSS-R and Molecular IPSS (IPSS-M) may be less predictive in post-AA MDS. AA patients treated with IST frequently have residual cytopenias and CH without overt MN transformation, and some alterations (e.g., mutations in BCOR/BCORL1 and del(13q)) are favorable in AA patients compared to their prognostic significance in
Table 2. Comparative analysis of hematologic toxicities and treatment-emergent adverse events in ten adult post-aplastic anemia myeloid neoplasm patients and 30 non-aplastic anemia myelodysplastic syndrome controls treated with hypomethylating agents.
MDS.3,6,15 Until such data are available, we recommend an individualized approach to guide treatment decisions that considers age at AA diagnosis, hematologic parameters at recovery from IST, relapsed or refractory AA, and presence of high-risk features such as ASXL1 or RUNX1 mutations,6 monosom,7 or excess blasts.4
While our cohort was small, the differences in TEAE compared to age-matched non-AA MDS controls were large and statistically significant. Our data suggest that post-AA MN patients may not derive the expected benefits from HMA due to high treatment toxicity and inability to tolerate repeated chemotherapy cycles. Early SCT may be a more suitable treatment strategy in appropriate candidates. New approaches are needed to minimize toxicity and improve access to SCT in transplant-eligible post-AA MN patients.
Authors
Matthew P. Connor,1 Neeharika Prathapa,1 Noelle V. Frey,1 Saar I. Gill,1 Elizabeth O. Hexner,1 Ximena Jordan Bruno,1 Catherine E. Lai,1 Alison W. Loren,1 Selina M. Luger,1 Andrew H. Matthews,1 Shannon R. McCurdy,1 Alexander E. Perl,1 David L. Porter,1 Arlene Zeringue,2 Joseph H. Oved,3,4 Timothy S. Olson,4,5 Keith W. Pratz1 and Daria V. Babushok1,4
1Division of Hematology-Oncology, Department of Medicine, University of Pennsylvania, Philadelphia, PA; 2Information Services, University of Pennsylvania, Philadelphia, PA; 3Department of Pediatrics, Memorial Sloan Kettering Cancer Center, New York City, NY; 4Comprehensive Bone Marrow Failure Center, Children’s Hospital of Philadelphia, Philadelphia, PA and 5Department of Oncology, Department of Pediatrics, Children’s Hospital of Philadelphia, Philadelphia, PA, USA
References
1. Kulasekararaj AG, Jiang J, Smith AE, et al. Somatic mutations identify a subgroup of aplastic anemia patients who progress to myelodysplastic syndrome. Blood. 2014;124(17):2698-2704.
2. Babushok DV, Perdigones N, Perin JC, et al. Emergence of clonal hematopoiesis in the majority of patients with acquired aplastic anemia. Cancer Genet. 2015;208(4):115-128.
3. Yoshizato T, Dumitriu B, Hosokawa K, et al. Somatic mutations and clonal hematopoiesis in Aplastic Anemia. N Engl J Med. 2015;373(1):35-47.
4 Sun L, Babushok DV. Secondary myelodysplastic syndrome and leukemia in acquired aplastic anemia and paroxysmal nocturnal hemoglobinuria. Blood. 2020;136(1):36-49.
5. Socie G, Henry-Amar M, Bacigalupo A, et al. Malignant tumors occurring after treatment of aplastic anemia. European Bone Marrow Transplantation-Severe Aplastic Anaemia Working Party. N Engl J Med. 1993;329(16):1152-1157.
6. Gurnari C, Pagliuca S, Prata PH, et al. Clinical and molecular determinants of clonal evolution in aplastic anemia and paroxysmal nocturnal hemoglobinuria. J Clin Oncol. 2023;41(1):132-142.
MC and DB designed the study, analyzed data, and wrote the manuscript. MC, NP, and DB performed the chart review. MC, NF, SG, EH, XJB, CL, AL, SL, AM, SM, AP, DP, KP, and DB contributed clinical care for adult patients, and JO and TO for pediatric patients. TO and DB oversaw the Penn/CHOP BMF patient registry. AZ performed the bioinformatics analysis in electronic medical records. All authors contributed to manuscript revisions.
Funding
This publication was supported by the National Institutes of Health T32-CA009679 (to MC), and the American Society of Hematology Scholar Award and R03 HL160678 (to DB).
Data-sharing statement
Data supporting the findings of this study are available from the corresponding authors upon reasonable request.
7 Maciejewski JP, Selleri C. Evolution of clonal cytogenetic abnormalities in aplastic anemia. Leuk Lymphoma. 2004;45(3):433-440.
8. Hosokawa K, Mizumaki H, Yoroidaka T, et al. HLA class I allelelacking leukocytes predict rare clonal evolution to MDS/AML in patients with acquired aplastic anemia. Blood. 2021;137(25):3576-3580.
9 Fenaux P, Mufti GJ, Hellstrom-Lindberg E, et al. Efficacy of azacitidine compared with that of conventional care regimens in the treatment of higher-risk myelodysplastic syndromes: a randomised, open-label, phase III study. Lancet Oncol. 2009;10(3):223-232.
10 Kantarjian H, Issa JP, Rosenfeld CS, et al. Decitabine improves patient outcomes in myelodysplastic syndromes: results of a phase III randomized study. Cancer. 2006;106(8):1794-1803.
11. DeZern AE, Churpek JE. Approach to the diagnosis of aplastic anemia. Blood Adv. 2021;5(12):2660-2671.
12. Tanizawa RSdS, Zerbini MCN, Rosenfeld R, et al. Secondary myeloid neoplasms: bone marrow cytogenetic and histological features may be relevant to prognosis. Rev Bras Hematol
Hemoter. 2017;39(1):4-12.
13. Kim SY, Le Rademacher J, Antin JH, et al. Myelodysplastic syndrome evolving from aplastic anemia treated with immunosuppressive therapy: efficacy of hematopoietic stem cell transplantation. Haematologica. 2014;99(12):1868-1875.
14. Prata PH, Eikema D-J, Sr., Piepenbroek B, et al. Transplant outcomes for acute myeloid leukemia or myelodysplastic syndromes secondary to acquired aplastic anemia or
paroxysmal nocturnal hemoglobinuria: a report from the EBMT Severe Aplastic Anemia Working Party. Blood. 2023;142(Suppl 1):704.
15. Hosokawa K, Katagiri T, Sugimori N, et al. Favorable outcome of patients who have 13q deletion: a suggestion for revision of the WHO ‘MDS-U’ designation. Haematologica. 2012;97(12):1845-1849.
Evaluation of the ATM L2307F germline variant in 121
Italian pedigrees with familial myeloproliferative neoplasms
It has been increasingly recognized that a subset of myeloproliferative neoplasms (MPN) aggregates within families, suggesting a role of germline mutations in disease etiology. Relatives of MPN patients were shown to be at 5- to 7-fold increased risk of developing MPN.1 Moreover, we previously reported that 7.6% of apparently sporadic MPN in fact exhibit familial clustering.2 Causative germline variants underlying familial MPN (fMPN) remain largely unknown. Of note, the phenotypic driver mutations established in MPN (JAK2, CALR, MPL) are acquired somatically also in fMPN.2-4 The co-existence of JAK2, CALR, and MPL somatic mutations in relatives within the same pedigree has led to the hypothesis that what is truly inherited is a genetic predisposition to acquire one of the three MPN drivers.5 Underlying germline variants do not drive the disease per se, but rather predispose for the acquisition of oncogenic mutations. In recent years, a few highly penetrant susceptibility variants for fMPN have been reported.5-7 However, these variants are rare in the general population or regionally restricted and therefore do not explain most of the hereditability observed in fMPN. To date, a unique predisposing gene accounting for familial clustering of MPN has not been identified.8 This led to the hypothesis that a part of the inherited risk might depend on common, low-penetrance risk alleles each representing a small fraction of MPN heritability, jointly contributing to familial clustering. Thus, common germline susceptibility alleles, each slightly increasing the risk of developing sporadic MPN, might be enriched in fMPN, as previously demonstrated for the TERT rs2736100_C allele in conjunction with the JAK2 46/1 (GGCC) predisposition haplotype.9
Most recently, the germline variation ATM L2307F, caused by a single-nucelotide variant (rs56009889) in the coding region of the ATM gene was reported to occur in nearly 8% of individuals with fMPN in a single-center study.10 Braunstein et al. reported an increased prevalence of ATM L2307F in fMPN as compared to sporadic MPN (7.8% vs. 2.3%; P=0.05) at borderline statistical significance. While the authors classified ATM L2307F as variant of uncertain significance based on ACMG guidelines for interpretation of sequence variants,11 they presented functional data suggesting that ATM L2307F stabilizes the ATM dimer in a closed conformation, thereby decreasing the phosphorylation of the downstream tumor suppressor CHECK2, subsequently altering the cellular response to DNA damage.10 In a different study, in vitro experiments showed increased rates
of apoptosis for cells carrying ATM L2307F after exposure to DNA damaging agents, suggesting ATM L2307F to be functionally hypomorphic.12
In order to evaluate the role of ATM L2307F in germline genetic predisposition to familial clustering of MPN, we screened our cohort of 121 fMPN families, defined by two or more affected relatives per family. DNA was available for 180 affected individuals with fMPN. Additionally, a control cohort of 111 unrelated subjects was screened for the presence of ATM L2307F. These unrelated controls were recruited from the same hospital and showed normal hemograms or reactive hematological conditions. The clinical and molecular characteristics of our fMPN cohort and controls are detailed in Table 1. In order to screen for the presence of ATM L2307F, we developed an amplicon-based next-generation sequencing assay to derive DNA sequences of ATM exon 47 (NM_000051.4), subsequently allowing for genotyping of rs56009889.
We did not observe ATM L2307F in any of our 180 patients constituting 121 fMPN families from Northern Italy.
Table1. Clinical and molecular characteristics of our cohort of patients with familial myeloproliferative neoplasms and unrelated healthy controls.
This stands in contrast to the study by Braunstein et al. conducted on a single-center cohort assembled in North America. Moreover, the ATM L2307F variant was not detected in any of the 111 unrelated control individuals collected locally at our center, in line with data reported in large population-based studies.13 In the gnomAD database (v4.0.0),14 the ATM L2307F variant (rs56009889; single-nucleotide variant:11-108326169-C-T [GRCh38]) is reported at an overall minor allele frequency of 0.013%, presenting at 0.014% in the European (non-Finnish) sub-cohort. In contrary, ATM L2307F is reported at a significantly higher frequency in the Ashkenazi Jewish population (3.017%). Accordingly, associations of ATM L2307F with cancer susceptibility were previously shown to be influenced by the ethno-geographic origin of the populations investigated. Specifically, Ji et al. reported an association of ATM L2307F with lung adenocarcinoma risk that was observed at higher effect size in Israeli (odds ratio=6.74) as compared to North American (odds ratio=3.36) populations, but was absent in Europeans due to the lack of variant carriers.13 A different study by Lampson et al., involving patients from the Dana-Farber Cancer Institute located in Boston (MA), USA, demonstrated an enrichment of germline ATM L2307F in chronic lymphocytic leukemia (CLL) (2.78%) and in other non-CLL lymphoid disorders (1.47%) as compared to myeloid disorders (0.67%).12 While only a fraction of the latter was diagnosed with MPN, in comparison with Braunstein et al. this study suggests low frequencies of ATM L2307F also in some North American MPN patient cohorts. Moreover, the same study reported an absence of ATM L2307F in a local control cohort, arguing for a limited potential of ATM L2307F as genetic marker also outside of Europe.12 While Braunstein et al.10 reported ATM L2307F frequencies of 7.8% and 2.3% for fMPN and sporadic MPN, respectively, a control cohort recruited at the same center may allow separating population-specific effects from general applicability with regard to the disease. In conclusion our data do not support a role of ATM L2307F as predisposing factor for fMPN in our cohort from Northern Italy representing a European population. However, other germline variants affecting DNA repair pathway genes recently implicated in fMPN susceptibility15 might be present at consistent frequencies across populations. Thus, further cohort studies using targeted resequencing-based analyses or alternative genotyping
References
1. Landgren O, Goldin LR, Kristinsson SY, Helgadottir EA, Samuelsson J, Björkholm M. Increased risks of polycythemia vera, essential thrombocythemia, and myelofibrosis among 24,577 first-degree relatives of 11,039 patients with myeloproliferative neoplasms in Sweden. Blood. 2008;112(6):2199-2204.
2. Rumi E, Passamonti F, Della Porta MG, et al. Familial chronic myeloproliferative disorders: clinical phenotype and evidence of
approaches, possibly focused on well-selected candidate genes, are warranted.
Authors
Oscar Borsani,1,2* Roland Jäger,3* Daniela Pietra,2 Ines Flieder,3 Giacomo Riccaboni,1 Robert Kralovics3 and Elisa Rumi1,2
1Department of Molecular Medicine, University of Pavia, Pavia, Italy; 2Hematology, Fondazione IRCCS Policlinico San Matteo, Pavia, Italy and 3Department of Laboratory Medicine, Medical University of Vienna, Vienna, Austria
OB, RJ, RK and ER designed research and wrote the paper. IF, RJ and DP performed molecular investigations. GR collected clinical data. RJ and ER finalized the manuscript. All authors contributed to data analysis, participated in the revision of the draft, and provided final approval.
Funding
This work was supported by grants from Associazione Italiana per la Ricerca sul Cancro (AIRC; Milan, Italy) (to ER), AIRC IC 2021 ID 25703, Minerva project AIRC award no. 21267.
Data-sharing statement
Data are available upon request to the corresponding author.
3. Bellanné-Chantelot C, Chaumarel I, Labopin M, et al. Genetic and clinical implications of the Val617Phe JAK2 mutation in 72 families with myeloproliferative disorders. Blood. 2006;108(1):346-352.
4 Rumi E, Passamonti F, Pietra D, et al. JAK2 (V617F) as an acquired somatic mutation and a secondary genetic event associated with disease progression in familial
5. Harutyunyan AS, Giambruno R, Krendl C, et al. Germline RBBP6 mutations in familial myeloproliferative neoplasms. Blood. 2016;127(3):362-365.
6. Saliba J, Saint-Martin C, Di Stefano A, et al. Germline duplication of ATG2B and GSKIP predisposes to familial myeloid malignancies. Nat Genet. 2015;47(10):1131-1140.
7 Rumi E, Harutyunyan AS, Pietra D, et al. LNK mutations in familial myeloproliferative neoplasms. Blood. 2016;128(1):144-145.
8. Rumi E, Cazzola M. Advances in understanding the pathogenesis of familial myeloproliferative neoplasms. Br J Haematol. 2017;178(5):689-698.
9 Jäger R, Harutyunyan AS, Rumi E, et al. Common germline variation at the TERT locus contributes to familial clustering of myeloproliferative neoplasms. Am J Hematol. 2014;89(12):1107-1110.
10 Braunstein EM, Imada E, Pasca S, et al. Recurrent germline
variant in ATM associated with familial myeloproliferative neoplasms. Leukemia. 2023;37(3):627-635.
11. Kopanos C, Tsiolkas V, Kouris A, et al. VarSome: the human genomic variant search engine. Bioinformatics. 2019;35(11):1978-1980.
12. Lampson BL, Gupta A, Tyekucheva S, et al. Rare germline ATM variants influence the development of chronic lymphocytic leukemia. J Clin Oncol. 2023;41(5):1116-1128.
13. Ji X, Mukherjee S, Landi MT, et al. Protein-altering germline mutations implicate novel genes related to lung cancer development. Nat Commun. 2020;11(1):2220.
14 Karczewski KJ, Francioli LC, Tiao G, et al. The mutational constraint spectrum quantified from variation in 141,456 humans. Nature. 2020;581(7809):434-443.
15. Elbracht M, Meyer R, Kricheldorf K, et al. Germline variants in DNA repair genes, including BRCA1/2, may cause familial myeloproliferative neoplasms. Blood Adv. 2021;5(17):3373-3376.
HJV mutations causing hemochromatosis: variable phenotypic expression in a pair of twins
Hemochromatosis is a genetic condition characterized by excessive intestinal iron absorption leading to systemic iron overload. Hemochromatosis is caused by a deficiency of hepcidin, or resistance to the effects of hepcidin. The mutations that cause hepcidin deficiency affect genes that regulate hepcidin transcription, or the hepcidin gene itself. Homozygous C282Y mutation in HFE is the most common cause of hemochromatosis, however mutations in other genes, including HJV, HAMP, and TFR2, 1 can also cause hemochromatosis. Resistance to hepcidin is caused by certain autosomal dominant mutations in SLC40A1, the gene encoding the hepcidin receptor and iron transporter ferroportin.1 Homozygous or compound heterozygous HJV mutations are the most common cause of juvenile hemochromatosis (JH) with an autosomal recessive pattern of inheritance. JH is characterized by early onset severe iron overload before age 30 leading to liver damage, cardiomyopathy, diabetes, arthropathy, and hypogonadism.2 HJV codes for the hemojuvelin protein, a bone morphogenetic protein co-receptor, which is essential for adequate hepcidin production in response to iron.3 Among several mutations identified, HJVpG320V is the most common mutation worldwide. Here we report a case of fraternal twin girls with similar HJV mutations but highly discordant severity of iron overload after obtaining parental consent as part of the Undiagnosed Disease Network. The dizygotic twin girls were born at 32 weeks of gestation to a primigravida mother. They were conceived with intra-
uterine insemination. The pregnancy was complicated by placenta previa and placenta accreta in twin B. A Cesarian section was performed as twin B had intrauterine growth restriction (IUGR). The family history includes mother with SLE and Sjogren’s syndrome and father who had a benign neuroendocrine tumor.
Twin A. She weighed 1.8 kg at birth, had a single umbilical artery, and stayed in the neonatal intensive care unit (NICU) for 10 days to establish feeding. She was discharged with ptosis as the only noted abnormality. Since then, she has been meeting all her developmental milestones and growing appropriately. At age 7, the patient had axillary and pubic hair, was evaluated for precocious puberty. The patient was using lavender lotions and soaps which apparently contributed to premature adrenarche, and the rest of the workup for precocious puberty was unremarkable. Incidentally, the patient was found to have elevated liver enzymes aspartate transaminase (AST) 101 U/L (age-appropriate normal range, 13-62 U/L), alanine transaminase (ALT) 183 U/L (age-appropriate normal range, 8-70 U/L), alkaline phosphatase 356 U/L (age-appropriate normal range, 145-335 U/L). She had a positive antinucelar antibodies (ANA) 1/640 titer, homogeneous pattern. Due to persistent elevation in liver enzymes, a liver biopsy was performed, which revealed moderate iron deposition with focal bridging fibrosis (etiology of fibrosis is unclear), a hepatic iron concentration of 17,362 μg/g/dry weight of liver tissue (age-appropriate
Figure 1. Liver biopsy of twin A. (A) Perl’s Prussian blue iron stain, magnification x200. There is moderate hemosiderin deposition predominantly within the hepatocytes. Scattered iron-laden Kupffer cells are present. (B) Trichome stain, magnification x100. Bridging fibrosis highlighted in blue.
Table 1. Laboratory findings in the twins. (A) Genetic findings in the twins. (B) Hematological and biochemical parameters in the twins.
HFE Het. c.187C>G p.His63Asp 14% European, non-Finnish Risk -
Twin A
Twin B
HJV Het. c.302 T>C p.Leu101Pro 0.00093% European, non-Finnish Pathogenic -
HJV Het. c.959 G>T p.Gly320 Val 0.039% European, non-Finnish Pathogenic -
BUB1B Het. p.Glu215del chr15:g.40475962_40475 964delAAGUncertain significance Mother
HFE Het. c.187C>G p.His63Asp 14% European, non-Finnish Risk -
HJV Het. c.302 T>C p.Leu101Pro 0.00093% European, non-Finnish Pathogenic -
HJV Het. c.959 G>T p.Gly320 Val 0.039% European, non-Finnish Pathogenic -
At the time of diagnosis 3 months after chelation for twin A 11 months after chelation for twin A and 2 months after stopping PPI for twin B
Het: heterozygous. PPI: proton pump inhibitors; UC: unable to calculate.
normal range, 200-1.800 μg/g) (Figure1). Iron studies showed ferritin of 17,63 ng/mL (age-appropriate normal range, 8-180 ng/mL), serum iron 308 mcg/dL (age-appropriate normal range, 27-164 mcg/dL), TIBC 328 mcg/dL (age-appropriate normal range, 271-448 mcg/dL), serum transferrin 215 mg/ dL (age-appropriate normal range, 188-341 mg/dL), and transferrin saturation of 94%. Genetic testing for hemochromatosis revealed pathogenic compound heterozygous HJV mutations and heterozygosity for the H63D HFE mutation as listed in Table 1A. Patient opted to be on iron chelation instead of phlebotomy, hence started on deferasirox 10 mg/ kg/day. Magnetic resonance imaging (MRI) of the abdomen performed 3 months after starting chelation showed diffuse hepatic iron overload with estimated iron concentration of 5.9 mg iron per 1 g dry liver. Liver enzymes (AST 52 U/L, ALT 66 U/L), serum ferritin (1,480 ng/mL) and transferrin saturation (54%) showed a decreasing trend.
Twin B. She weighed 680 g at birth and spent 3 months in the NICU, course was complicated by chronic lung disease, feeding intolerance, failure to thrive, and astigmatism. Chromosomal microarray study was normal. At 8 months, she was diagnosed with infantile spasms and brain MRI revealed pachygyria. She was then tested for IGF1R and PAPPA2 mutations through next generation sequencing, but no abnormality was found. She was diagnosed with gastric esophageal reflux disease and was treated with proton pump inhibitors (PPI). She also had poor weight gain of 400-900 g per year despite adequate calorie intake by mouth. Patient has received zinc, copper, and folate supplementation during infancy. Whole exome sequencing was performed. A heterozygous c.636_638delAGA, pGlu215del variant of uncertain significance in the BUB1B gene was identified. Variants in this gene are associated with autosomal recessive mosaic variegated aneuploidy (MVA) syndrome 1. At age 7, serum ferritin was 196 ng/dL, serum iron 261 mcg/ dL, TIBC <283 mcg/dL, and serum transferrin 239 mg/dL, transferrin saturation 94 %. Genetic testing revealed the same heterozygous HJV mutations and heterozygosity for the H63D HFE mutation as in her sister. MRI of the abdomen was not performed as it was not clinically indicated. She has no clinical signs of iron overload currently. Laboratory parameters of the twins are listed in Table 1B. Iron overload in HJV associated JH (HJV-JH) develops at an early age, with the mean age at diagnosis of 24 years. The sex distribution is equal in HJV-JH.4 HJVpGy320Val and HJVLeu101Pro are the most common mutations in Caucasians.5 HFE-associated hemochromatosis is inherited in an autosomal recessive pattern and p.Cys282Tyr in HFE is the most common pathogenic substitution in Caucasians. Both girls have a HFE mutation, with variant c.187C>G p. His63Asp (H63D) in addition to the HJV mutations. The H63D mutation is mild, and a single copy has not been known to cause any iron dysregulation. The interaction between H63D in HFE and HJV has not been established. Prior to the discovery of
the HFE gene but after the linkage of the common form of hemochromatosis to human leucocyte antigen (HLA) was already established, Crawford et al. reported concordance in hepatic iron concentration among siblings of same sex with genetic hemochromatosis unless one of the siblings had definite reason for blood loss or discordance in HLA status.6 Piling et al. report that common genetic variants that influence iron in the general population may help in estimating prognosis and treatment planning in patients with HFEpC282Y homozygous mutations.7 Although twin A and B have the same known hemochromatosis ( HJV) mutations, twin B has normal serum ferritin level and no clinical signs of iron overload. Twin B has no history of bleeding or blood donation. She has been maintaining hemoglobin >11 g/dL since discharge from the NICU. Fraternal twins share only half their genome, so it is possible that discordance in yet unknown genetic modifiers cause the phenotypic difference.
We measured serum hepcidin levels in both twins. Twin A has a low serum hepcidin of 7.7 ng/mL (normal range 4.447.3 ng/mL) despite elevated ferritin, and hepcidin to ferritin (H: F) ratio of 0.018 indicating classical hemochromatosis phenotype.8 Twin B has a serum hepcidin level of 12.3 ng/ mL and H: F ratio of 0.072, four-times higher than twin A. The level of hepcidin in twin B is inappropriately low considering the high serum transferrin saturation (>50%). It is unclear why the patient has high transferrin saturation but no evidence of elevated iron stores (ferritin 170 ng/ mL). Iron utilization appears normal as hemoglobin (13.4 g/dL) is within the normal range. Twin B has higher mean corpuscular hemoglobin (MCH) and mean corpuscular hemoglobin concentration (MCHC), by ~10% consistently (Table 1B). This may indicate that she is utilizing iron for erythropoiesis at a higher rate than her sister, however their reticulocyte count is similar.
Twin B has a BUB1B mutation which is associated with MVA syndrome. Based on exome sequencing, she appears to be a carrier for this condition. We pursued additional testing, a sensitive genome-wide method to assess aneuploidy from blood DNA for which the whole genome sequence was generated. There was no evidence of any aneuploidy. There are no reports of any relationship between BUB1B mutation and iron metabolism. Twin B however has a few features of the MVA, such as IUGR, slow post-natal growth, shorter than average stature, and pachygyria with seizures. Currently, twin B weighs 15.6 kg at 8 years of age, less than the 1 percentile (compared to twin A who is 39 kg at 91st percentile). It is likely that twin B’s chronic malnutrition has contributed to having normal serum iron and ferritin levels despite having high transferrin saturation levels (>50%). She may be absorbing iron at a higher rate than other nutrients because of her hemochromatosis mutations, which allows maintaining iron homeostasis and erythropoiesis at a normal level despite malnutrition. In contrast, the patient has been taking zinc supplements. Serum zinc lowest at 49 μg/dL at
age 4 years, maintains in the range of 62.6-98.6 μg/dL with zinc supplements (normal range, 60-120 μg/dL). PPI are known to limit iron absorption,9,10 thus it is possible that twin B absorbed less iron than what would be expected based on the hemochromatosis mutations. However, the patient stopped taking PPI for the last 2 months and the iron studies have not changed appreciably (serum iron 233 vs. 250 mcg/dL, TIBC <255 vs. <272 mcg/dL and ferritin 129 vs. 170 ng/mL). Longer observation is needed to make a more meaningful conclusion regarding any effect of PPI on iron parameters since she been taking them for the last 8 years.
We describe for the first time a severe case of juvenile hemochromatosis presenting with classical clinical features in contrast to her twin sister with the same mutations in the HJV gene with no signs of iron overload. In addition to the recognized hemochromatosis genes, other genetic and nutritional factors may modulate the severity of iron overload in hemochromatosis.
Authors
Akhila Vadivelan,1,2 Sarah Zhang,3 Daniel N Srole,2 Elizabeth A. Marcus,4 George Carvalho Neto,5 Elizabeta Nemeth,2 Tomas Ganz2,6 and Satiro De Oliveira1
1Division of Pediatrics, Division of Hematology/Oncology, UCLA; 2Center for Iron Disorders, Department of Medicine, UCLA; 3Division of Pathology, UCLA; 4Division of Pediatric, Pediatrics Gastroenterology, Hepatology, and Nutrition, UCLA; 5Corporate Authorship -Undiagnosed Diseases Network, Institute for Precision Health and 6Division of
References
1. Santos PC, Dinardo CL, Cançado RD, Schettert IT, Krieger JE, Pereira AC. Non-HFE hemochromatosis. Rev Bras Hematol Hemoter. 2012;34(4):311-316.
2. Griffiths WJH, Besser M, Bowden DJ, Kelly DA. Juvenile haemochromatosis. Lancet Child Adolesc Health. 2021;5(7):524-530.
3. Lin L, Goldberg YP, Ganz T. Competitive regulation of hepcidin mRNA by soluble and cell-associated hemojuvelin. Blood. 2005;106(8):2884-2889.
4 Sandhu K, Flintoff K, Chatfield MD, et al. Phenotypic analysis of hemochromatosis subtypes reveals variations in severity of iron overload and clinical disease. Blood. 2018;132(1):101-110.
5. Kong X, Xie L, Zhu H, et al. Genotypic and phenotypic spectra of hemojuvelin mutations in primary hemochromatosis patients: a systematic review. Orphanet J Rare Dis. 2019;14(1):171.
6. Crawford DH, Halliday JW, Summers KM, et al. Concordance of iron storage in siblings with genetic hemochromatosis: evidence
Medicine and Pathology, UCLA, Los Angeles, CA, USA
Correspondence: A. VADIVELAN - av.akhila@gmail.com
https://doi.org/10.3324/haematol.2023.284134
Received: August 24, 2023. Accepted: February 28, 2024. Early view: March 7, 2024.
AV prepared the manuscript and figures. SZ prepared pathology images. DS revised the manuscript and contributed to brainstorm discussion. GC performed whole genome sequencing. EM, EN, TG and SG revised the manuscript and contributed to brainstorm discussion.
Funding
This work was partially supported by the UCLA California Center for Rare Disease of the Institute for Precision Health and by National Institutes of Health grant U01NS134356 awarded to the UCLA Clinical Site of the Undiagnosed Diseases Network.
Data-sharing statement
Data can be accessed with the references, tables and figures submitted as part of the manuscript.
for a predominantly genetic effect on iron storage. Hepatology.1993(5):833-837.
7. Pilling LC, Atkins JL, Melzer D. Genetic modifiers of penetrance to liver endpoints in HFE hemochromatosis: Associations in a large community cohort. Hepatology. 2022;76(6):1735-1745.
8. Zaman BA, Ibrahim SA. Hepcidin-to-ferritin ratio as an early diagnostic index of iron overload in β-thalassemia major patients. Hemoglobin. 2022 ;46(2):106-113.
9 Hirofumi Hamano, Takahiro Niimura, Yuya Horinouchi, et al. Proton pump inhibitors block iron absorption through direct regulation of hepcidin via the aryl hydrocarbon receptormediated pathway. Toxicol Lett. 2020;318:86-91.
10. Kani HT, Gündüz F. Should we use proton pump inhibitors as an add-on treatment in hereditary hemochromatosis? Turk J Gastroenterol. 2018;29(2):253.
Classical meets malignant hematology: a case of acquired εγδβ -thalassemia in clonal hematopoiesis
Hemoglobinopathies including thalassemias are among the most frequent genetic disorders worldwide. Primarily, these entities result from germline variants in the globin gene clusters and their cis-acting regulatory elements,1 and thus the World Health Organization classifies thalassemias as inherited diseases.2 Non-inherited disorders of globin chain synthesis mimicking the phenotype of thalassemias have also been described and are referred to as acquired thalassemias. These forms mainly affect the a-globin genes and are observed at much lower frequencies.3 Acquired a-thalassemias are associated mainly with myelodysplastic neoplasms (MDS) and are caused either by somatic deletions of the a-globin gene cluster on chromosome 16p13.3 limited to the hematological clone or, more commonly, by inactivating somatic variants of the trans-acting regulatory factor, ATRX, leading to downregulation of a -globin gene expression.3 In contrast, acquired somatic genetic variants causing reduced β-globin production and leading to a β -thalassemic phenotype are a rarity, and only a few, single cases have been described so far.4-7
Here, we describe a patient presenting with thalassemic erythrocyte parameter changes, i.e., microcytic, hypochromic anemia and a rather high erythrocyte count. Further evaluation including hemoglobin capillary electrophoresis and molecular genetic analyses exhibited clonal hematopoiesis with large deletions in the short and long arm of one chromosome 11 restricted to the neoplastic clone. The loss in the chromosomal band 11p15.4 harboring the complete β -globin gene cluster resulted in an acquired εγδβ -thalassemia which we documented at the molecular level.
Our laboratory received a peripheral blood sample from a 34-year-old woman with microcytic, hypochromic anemia for further investigation after exclusion of iron deficiency. Blood count measurement at our laboratory confirmed a
mild microcytic, hypochromic anemia (hemoglobin [Hb] 11.0 g/dL, mean corpuscular volume [MCV] 72.3 fL, mean corpuscular hemoglobin 22.0 pg, mean corpuscluar hemoglobin concentration [MCH] 30.5 g/dL, red cell distribution width [RDW] 19.2 %, red blood cell [RBC] count 4.99x10¹²/L).
The white blood cell count was normal (7.97x10⁹/L), and the thrombocyte count was slightly increased (513x109/L).
A peripheral blood smear showed polychromatic erythrocytes with basophilic stippling and target cells (Figure 1), and a normal leukocyte morphology and differential blood count (57% segmented neutrophils, 30% lymphocytes, 7% monocytes, and 6% eosinophils).
Further hemoglobinopathy work-up using capillary electrophoresis exhibited normal Hb fractions with HbA 96.8%, HbA2 2.7% and HbF 0.5%; no Hb variants were detected. Molecular genetics applying gap-polymerase chain reaction, multiplex-ligation-dependent probe amplification and targeted next generation sequencing (NGS) of HBA1, HBA2 and HBB revealed no aberration of the a-globin gene locus, but a loss of the complete β -globin gene cluster with an allele frequency of about 50% in peripheral blood DNA (Figure 2).
In order to delimit the precise breakpoints of the deletions and to identify potential further genomic structural variants, whole genome sequencing (WGS) of DNA from peripheral blood leukocytes showed large deletions of 3.8 Mbp at chromosome 11p15.5-4 (GRCh37/hg19; chr11_2207001::5984000) including the β-globin cluster, of 2.9 Mbp at 11p14.3-1 (chr11_24706001:: 27629000), and of 6.2 Mbp at chr11q22.3-q23.2 (chr11_108103001::114299000) involving the ATM gene (Figure 3A). Single nucleotide variants clinically significant in development of hematologic neoplasms were not detected.
Whole genome sequencing (WGS) findings were in line with chromosome banding analysis from peripheral blood
Figure 2. Multiplex ligation-dependent probe amplification. Multiplex-ligation-dependent probe amplification revealing a loss of the complete β-globin gene cluster with an allele frequency of about 50% (red arrow).
showing a derivative chromosome 11 with the expected deletions in the p- and q-arm: 46,XX,der(11)del(11)(p15p14) del(11)(q22q23)[16]/46,XX[8]. The aberrant clone was found in phytohemagglutinin-stimulated cultures as well as in cultures stimulating the myeloid lineage. Interestingly, the aberrant karyotype was detected in only 16 of 24 metaphases and additional interphase-fluorescence in situ hybridisation analyses with probes for the NUP98 gene (11p15.4) and the ATM gene (11q22.3) confirmed the deletions in 85 of 100 and 80 of 100 cells, respectively, indicating that the deletions were not of germline origin but acquired in the hematopoietic cells. In a next step, we thus investigated DNA derived from oral mucosa of the patient as a germline surrogate by WGS to have a direct comparison with blood cell WGS results. The deletions on chromosome 11 were absent in the oral mucosa DNA of the patient (Figure 3B). In summary, we confirmed the somatic origin restricted to a hematopoietic clone of the deletion affecting the β -globin cluster at a molecular level. The patient has given informed consent to publish the findings, and the study has been approved by the institutional review board. In this case report, we describe an acquired thalassemic condition in clonal hematopoiesis resulting in a β -thalassemic phenotype and document it at the molecular level. In contrast to acquired forms of a-thalassemia that are an established observation in MDS, acquired β -thalassemia are extremely rare and described in only a few cases. So far, acquired γδβ -thalassemias have been described in MDS,4,5,7 acute myeloid leukemia,8 juvenile myelomonocytic
leukemia,6 and common variable immunodeficiency. 9 In the present patient, bone marrow investigations would be necessary to differentiate between clonal cytopenia of unknown significance and a hematologic neoplasm, such as MDS, as final diagnosis. However, clonal hematopoiesis harboring a somatic 11p deletion as the pathophysiological cause of the acquired β -thalassemia could be reliably demonstrated. Previous studies have shown that genomic gains and losses are a frequent phenomenon in clonal hematopoiesis.10,11 This includes recurrent chromosome 11 aberrations, and loss of ATM due to chromosomal deletions as in the present case. Interestingly, ATM mutations and chromosome 11q deletions are recurrent aberrations in MDS,12,13 while deletions in the short arm of chromosome 11 are rather rare in clonal hematopoiesis.10,11
An increase in HbA2 above 3.6% with corresponding microcytic, hypochromic anemia with erythrocytosis is the hallmark phenotypical finding of inherited, heterozygous β -thalassemia. Interestingly, none of the previously described cases of acquired β -thalassemia exhibited an HbA2 increase suggesting the presence of deleterious aberrations of both the β - and δ -globin genes. However, most of those patients presented with an increase in HbF pointing to intact γ-globin genes.5-8 Thus, these cases most likely represent δβ -thalassemias caused by deletions in the β -globin gene cluster affecting the δ - and β -globin gene, but leaving the γ -globin genes intact. Despite the phenotypic observations in those studies, the genetic correlates remain hypothetical as precise molecular experiments were lacking in most studies. In our case, we
observed a normal distribution of the hemoglobin fractions without an increase in HbA2 or HbF. High resolution molecular genetic analyses documented on the sequence level that the absence of an HbA2 and HbF increase was due to the loss of the complete β -globin gene cluster in the neoplastic clone. The deletion includes the locus control region of the β -globin gene cluster in addition to the e ε -, γ -, δ and β -globin genes and is thus the documentation of an acquired form of εγδβ -thalassemia at the molecular level.
a to non- a globin ratio imbalance represents the pathophysiological source of the typical thalassemic phenotype of microcytic, hypochromic anemia.1 Despite its common genetic basis of variants disturbing regular globin gene transcription, the origin of those alterations vary and either represent germline variants that are inherited from generation to generation or are somatic mutations acquired in a hematopoietic cell of an individual. In most cases, thalassemias originate from inherited germline variants and are classified as disorders from the field of classical, non-malignant hematology. However, clinicians also need to consider acquired thalassemic syndromes in hematological malignancies, especially in cases of discrepancy between tentative diagnosis and corresponding blood count changes. For example, macrocytic anemia is a typical finding in MDS, and thus, additional conditions like iron deficiency or acquired thalassemia need to be ruled out when MDS is accompanied with microcytic hypochromic
Figure 3. Copy number variation analysis of the entire genome by next generation sequencing. Copy number variant analysis of the entire genome by next generation sequencing indicating the presence of deletions on chromosome 11 (red arrows) in peripheral blood DNA (A) and their absence in oral mucosa DNA (B).
erythrocyte parameters. In those cases, molecular genetic analysis of the neoplastic cell clone is key to a precise diagnosis, which may be elusive when using standard tests like hemoglobin separation techniques used to screen for hereditary hemoglobinopathies.
Authors
Armin P. Piehler,1 Marietta Truger,1 Jan-Hendrik Kozik,1 Sandra Weissmann,1 Martin Schwonzen,2 Manja Meggendorfer,1 Wolfgang Kern,1 Torsten Haferlach,1 Gregor Hoermann1 and Claudia Haferlach1
1MLL Munich Leukemia Laboratory, Munich and 2MVZ Hochsauerland Meschede, Hematology and Oncology, Meschede, Germany
2. World Health Organization. Thalassaemia and other haemoglobinopathies. https://apps.who.int/gb/ebwha/pdf_files/ EB118/B118_5-en.pdf Accessed January 01, 2024.
3. Steensma DP, Gibbons RJ, Higgs DR. Acquired alphathalassemia in association with myelodysplastic syndrome and other hematologic malignancies. Blood. 2005;105(2):443-452.
4 Brunner AM, Steensma DP. Myelodysplastic syndrome associated with acquired beta thalassemia: “BTMDS”. Am J Hematol. 2016;91(8):E325-327.
5. Aoyagi Y, Akimoto H, Yamaoka K, et al. [Refractory anemia with ringed sideroblasts complicated with delta beta-thalassemialike hemoglobinopathy]. Rinsho Ketsueki. 1989;30(5):674-679.
6. Honig GR, Suarez CR, Vida LN, Lu SJ, Liu ET. Juvenile myelomonocytic leukemia (JMML) with the hematologic phenotype of severe beta thalassemia. Am J Hematol. 1998;58(1):67-71.
7 Hoyle C, Kaeda J, Leslie J, Luzzatto L. Acquired beta thalassaemia trait in MDS. Br J Haematol. 1991;79(1):116-117.
GH and CH performed data analysis. APP, WK, TH, GH and CH wrote the manuscript. MM, WK, TH and CH supervised the study.
Data-sharing statement
Original data are available upon request in accordance with applying data protection rules.
8. Markham RE, Butler F, Goh K-O, Rowley PT. Erythroleukemia manifesting δβ-thalassemia. Hemoglobin. 2009;7(1):71-78.
9 Belickova M, Schroeder HW, Jr., Guan YL, et al. Clonal hematopoiesis and acquired thalassemia in common variable immunodeficiency. Mol Med. 1994;1(1):56-61.
10 Loh PR, Genovese G, McCarroll SA. Monogenic and polygenic inheritance become instruments for clonal selection. Nature. 2020;584(7819):136-141.
11. Gao T, Ptashkin R, Bolton KL, et al. Interplay between chromosomal alterations and gene mutations shapes the evolutionary trajectory of clonal hematopoiesis. Nat Commun. 2021;12(1):338.
12. Haferlach T, Nagata Y, Grossmann V, et al. Landscape of genetic lesions in 944 patients with myelodysplastic syndromes. Leukemia. 2014;28(2):241-247.
13. Stengel A, Kern W, Meggendorfer M, Haferlach T, Haferlach C. MDS with deletions in the long arm of chromosome 11 are associated with a high frequency of SF3B1 mutations. Leukemia. 2017;31(9):1995-1997.
Erratum to: Immunochemotherapy plus lenalidomide for high-risk mantle cell lymphoma with measurable residual disease evaluation
Zachary D. Epstein-Peterson,1 Esther Drill,2 Umut Aypar,3 Connie Lee Batlevi,1 Philip Caron,1 Ahmet Dogan,3 Pamela Drullinsky,1 John Gerecitano,1° Paul A. Hamlin,1 Caleb Ho,3° Allison Jacob,4 Ashlee Joseph,1 Leana Laraque,1 Matthew J. Matasar,1 Alison J. Moskowitz,1 Craig H. Moskowitz,1° Chelsea Mullins,4° Colette Owens,1 Gilles Salles,1 Heiko Schöder,5 David J. Straus,1 Anas Younes,1° Andrew D. Zelenetz1 and Anita Kumar1
1Lymphoma Service, Division of Hematologic Malignancies, Department of Medicine, Memorial Sloan Kettering Cancer Center, New York, NY; 2Department of Biostatistics and Epidemiology, Memorial Sloan Kettering Cancer Center, New York, NY; 3Department of Pathology, Memorial Sloan Kettering Cancer Center, New York, NY; 4Adaptive Biotechnologies, Seattle, WA and 5Department of Radiology, Memorial Sloan Kettering Cancer Center, New York, NY, USA
°Current address JG: The Janssen Pharmaceutical Companies of Johnson & Johnson, Raritan, NJ, USA
°Current address CH: Loxo Oncology, Inc., Stamford, CT, USA
°Current address CM: Notch Therapeutics, Seattle, WA, USA
°Current address CHM: Department of Medicine, Division of Hematology, Sylvester Comprehensive Cancer Center, University of Miami Miller School of Medicine, Miami, FL, USA
°Current address AY: AstraZeneca Pharmaceuticals, LP, Wilmington, DE, USA
This erratum corrige contains corrections to the text (in the Patient Characteristics section of the Results and in the Discussion) and tables (Tables 1 and 2) of our article published in Haematologica in April 2024, “Immunochemotherapy plus lenalidomide for high-risk mantle cell lymphoma with measurable residual disease evaluation”.1 These comments, shown below, relate to the patients’ tumor TP53 status in which the breakdown by TP53 gene alteration status is revised and clarified.
References
1. Epstein-Peterson, Drill E, Aypar U, et al. Immunochemotherapy plus lenalidomide for high-risk mantle cell lymphoma with measurable residual disease evaluation. Haematologica. 2024;109(4):1149-1162.
Results
Patient characteristics
We enrolled 49 total patients (Table 1) from January 2016 until June 2018. Per protocol, efficacy-evaluable patients completed len-R-CHOP treatment. Two patients did not complete len-R-CHOP, one for progressive disease and one for toxicity. One patient withdrew from the study in remission following R-HiDAC to pursue HDT/ASCR. The median age among all patients was 63 years (range, 30-79) and 22 (45%) were ≥65 years old at enrollment. Thirty-one (65%) patients were high-risk by protocol including four patients with blastoid histology. Forty-one patients (84%) had tumor TP53
mutation and deletion status assessed prior to treatment; of these, 16 were TP53 altered (mutation and/or gene loss) (34%): two harbored mutated TP53, six harbored one copy of TP53, and eight harbored both abnormalities. High-risk patients were enriched for MCL harboring TP53 alterations (Online Supplementary Table S1).
Discussion
We performed a single-center, investigator-initiated, phase II study examining a frontline intensive IC-based treatment regimen for MCL with the addition of len and omitting con-
solidative HDT/ASCR. Although the primary study endpoint of 3-year PFS was not met, this was primarily driven by the poor outcomes observed among patients with TP53-altered MCL, further establishing that TP53-altered MCL is associated with poor outcomes when treated with IC and len does not overcome this negative prognostic impact.5 However, among patients with WT TP53, outcomes were more favorable, even among patients whose MCL harbored adverse disease features (elevated Ki67 and/or blastoid/pleomorphic histology). We further demonstrated the prognostic importance of MRD status in MCL within our approach, especially at the level of 1E-6 sensitivity, which can be achieved using the NGSbased MRD assay.
The frequency and severity of toxicities observed with our treatment regimen generally aligned with those expected based on prior studies investigating len-R-CHOP15 and R-len.16
The addition of lenalidomide did impact R-CHOP dosing, as 41% of patients required dose reduction (in len) or delay during len-R-CHOP, primarily due to cytopenias (7 instances) and neutropenic fever (6 instances). This frequency is higher than that observed (9%15) in treating diffuse large B-cell lymphoma with len-R-CHOP, which could be due to the higher incidence of bone marrow involvement in MCL predisposing to hematologic toxicity. At interim analysis of 16 patients, we observed excessive hematologic toxicity, primarily grades 3/4 thrombocytopenia without bleeding, with 3,000 mg/m2 of cytarabine. Therefore, this dose level was removed for the remainder of our study. Numerous dose regimens of cytarabine have been utilized in treating MCL, notably: R-BAC - 500-800 mg/m2 for 3 days, R-DHAX - 2,000 mg/m2 every 12 hours for two doses, hyper-CVAD (age-based) - 1,000-3,000 mg/m2 every 12 hours for 2 days, and Nordic (age-based) - 2,000-3,000 mg/m2 every 12 hours for 2 days. In our study, many patients’ MCL responded to cytarabine radiographically and based on conversion from dMRD to uMRD with cytarabine dosing of <3,000 mg/m2, suggesting that efficacy may be maintained with dose attenuation for advanced age or comorbidity.
The role for consolidative HDT/ASCR in first remission in MCL has been questioned given several retrospective and real-world studies in the modern era which have not demonstrated an OS benefit associated with this approach.1,3,17 Recent data from the European Mantle Cell Lymphoma Network show no statistically significant difference in PFS and OS in the rituximab-treated patient subset (N=68) between HDT/ASCR and interferon-a maintenance in first remission.3 The rate of referral for HDT/ASCR in real-world datasets of patients in the United States is as low as 17%, suggesting incomplete uptake of this practice.18,19 Although supportive care measures for patients undergoing HDT/ ASCR have improved and the incidence of major toxicities or death with its use in contemporary practice is lower,20 it still carries potential for substantial toxicity (especially in older patients in whom MCL is common), deep and lasting immunosuppression with potential infectious sequelae,
high cost, and intensive exposure to healthcare
much of which are especially undesirable during the ongoing COVID-19 pandemic.
Table 1. Patient characteristics at enrollment.
*Percentages refer to evaluated patients. **One patient did not have Ki67 assessment at baseline; additionally, 1 patient’s MCL displaying aggressive pathologic features not reaching the threshold for formally labeling as blastic morphology had Ki67 (<10%) only assessed from bone marrow sampling at baseline was classified as high-risk per protocol given these features at diagnosis and that subsequent biopsy specimens showed an elevated (≥30%) Ki67 concurrent with the same aggressive features. †Patients with evaluation via multiple methodologies are listed in each category. IQR: interquartile range; MIPI_b: biologic Mantle Cell Lymphoma International Prognostic Index; LDH: lactate dehydrogenase; GI: gastrointestinal; NGS: next-generation sequencing; WT: wild-type; ALT: altered; SNP: single nucleotide polymorphism.
Other notable studies have incorporated novel agents to frontline therapy with IC without HDT/ASCR consolidation.21-24 Results from the WINDOW-1 study were published,22 reporting outcomes from 131 patients treated with ibrutinib-rituximab followed by R-hyper-CVAD/methotrexate-cytarabine: among 97 PET/CT-evaluable patients, the overall response rate was 71% and complete response rate 69% to ibrutinib-rituximab alone; 3-year PFS was 79% (95% CI: 70-85), indicative of high clinical activity for this regimen. The Nordic MCL4 study24 investigated len added to upfront bendamustine-rituximab in a non-transplant-eligible patient population (N=50) and demonstrated a median PFS of 42 months; importantly, patients whose MCL harbored altered TP53 (N=16) had inferior survival outcomes in this study. Finally, abstract results have been reported for the Triangle study,23 which randomized 870 patients to IC plus HDT/ASCR (‘arm A’) versus IC plus HDT/ASCR plus ibrutinib (‘arm A+I’) versus IC plus ibrutinib omitting HDT/ASCR (‘arm I’). Similar to the WINDOW-1 study, only 15% of patients in Triangle were high-risk by MIPI. Although the 3-year PFS estimates from these studies (especially WINDOW-1 and Triangle) are higher than the 3-year PFS reported in the current study, our study included both younger and older patients and enriched for high-risk patients (59%
with MIPI-b high risk and 23% with mutated TP53), thus limiting cross-trial comparison of outcomes. Collectively, these studies and our results show that frontline targeted therapies can build upon IC regimens and spare patients the toxicities associated with HDT/ASCR without a clear decrement in PFS.
Maintenance therapy has a clear role post-HDT/ASCR in prolonging remission duration based on results from the LYSA Group’s randomized study demonstrating prolongation in PFS and OS with 3 years of rituximab maintenance.25 Data from the Randomized European MCL Elderly Trial26 reinforced the benefit of rituximab maintenance for older patients following R-CHOP. Multiple other groups have investigated the role for len-based maintenance with27 or without8 HDT/ ASCR. The MCL R2 Elderly trial8 reported improved PFS but not OS comparing R-len to rituximab alone as maintenance following induction (without HDT/ASCR) at the cost of increased toxicity; thus, along with waited results from the ongoing ECOG-ACRIN E1411 trial,28 the optimal composition of maintenance therapy remains an unanswered question that warrants further inquiry. In our study, the re-emergence of detectable MRD and subsequent relapses that we observed in the 6 months following EoT suggest that a longer duration of maintenance beyond 6 months may have been
Table 2. Progression-free survival and overall survival estimates by risk factors.
beneficial to sustain remissions in this high-risk patient population. However, such considerations would have to balance potential benefits with toxicity and further immunosuppression from R-len.
We evaluated MRD status at multiple points and our data comprise one of the largest experiences in MCL using the NGS clonoSEQ platform; most prior studies used ASO PCR. Overall, we have shown that MRD status carried prognostic importance in our sequential treatment regimen, especially at later time points such as 6 months following EoT, and that 1E6 is more strongly predictive of outcomes than 1E5 sensitivity. A key finding from our study is the different implications for MRD results at the level of 1E-5 versus 1E-6 sensitivity levels: a majority of patients’ disease was uMRD at 1E-5 following R-HiDAC and MRD status at this sensitivity level and time point did not carry prognostic significance. However, MRD status at 1E-6 at this same time point did discriminate long-term PFS (median 22 months dMRD vs. 54 months uMRD). This supports the use of an NGS MRD assay which is a highly sensitive assay and can achieve a sensitivity level of 1x10⁻⁶. An additional key finding is that persistent or recurrent dMRD late in study treatment predicted long-term PFS: at 6 months following EoT, median PFS was 13 months for dMRD versus 39 uMRD at the level of 1E-6 sensitivity. This prompts consideration as to whether additional maintenance could have been beneficial in patients with dMRD. Furthermore, this finding of a later MRD time point carrying prognostic importance is concordant with results from a large, prospective effort using a PCR-based assay.29 Therein, the authors showed that MRD status at 6 months post-HDT/ ASCR was a particularly useful measure for predicting longterm outcome. MRD-based study designs based on these results could continue maintenance for patients with dMRD and/or terminate maintenance for patients with uMRD. We substantiated existing literature correlating abnormalities in TP53 and poor outcomes with IC-treated patients in MCL (this relationship was not firmly established at time of study conception). Our data correlating upfront sequencing results with clinical outcomes is one of the largest and most comprehensive in uniformly treated patients with MCL. We did not identify additional gene signatures predictive of outcomes. Through serial sequencing in 20 patients at baseline and relapse, we demonstrated stability in TP53 alterations (Figure 4B) and identified an increase in CDKN2A and CDKN2B loss at time of relapse, similar to previously published findings.30 The 3-year PFS rate among patients with
TP53-altered MCL approximates data from the Nordic MCL2 study in which patients underwent HDT/ASCR, recognizing the limitations of cross-trial comparisons and differences between these cohorts.5 The addition of len did not appear to abrogate this negative effect. There are ongoing studies without chemotherapy that are investigating the use of targeted therapies, such as BTKi with or without venetoclax, as upfront treatment of TP53-altered MCL (clinicaltrials gov. Identifier: NCT03824483, NCT03112174) and we await results from these studies to inform management for high-risk MCL patients.
Our study carries limitations. First, our study was devised and implemented prior to the extensive body of literature demonstrating the adverse prognostic effect of TP53 abnormalities in MCL. Second, although there are clear patterns among our data from clinical and MRD perspectives, we caution firm conclusions given the relatively small numbers of patients treated at a single center that ultimately warrant confirmation in a multicenter effort.
We designed a non-HDT/ASCR-based frontline treatment approach for MCL and achieved generally favorable clinical outcomes in patients with WT TP53 MCL with expected toxicity for cytarabine-containing induction regimens in treating MCL. Our clinical outcomes roughly align with those from other upfront HDT/ASCR-sparing approaches with novel agents, when accounting for our enriching for patients with high-risk MCL, and further substantiate the validity of this therapeutic approach. Additionally, we have redemonstrated the predictive power of MRD evaluation in defining disease trajectories longitudinally in patients with MCL and highlight the 1E-6 sensitivity level as particularly useful. Although we are not further developing this treatment regimen, similar future approaches could consider developing a strategy with a longer maintenance treatment phase given the pattern of relapses that we observed post-maintenance. Based on the first formal evaluation in the Triangle study incorporating upfront BTKi, it is unclear whether or not upfront len + chemoimmunotherapy approaches will be further developed. Noteworthy ongoing upfront studies include venetoclax-lenalidomide-rituximab31 and acalabrutinib-lenalidomide-rituximab32 from which we await further results. Given len’s immunomodulatory mechanism of action and the advent of chimeric antiden receptor T cell33 and bi-specific antibodies34 in treating MCL, there may be rational synergistic combinations that can be pursued wherein len augments the efficacy of these immune-based therapies.