
QUARTER ONE 2023
Star Valley Real Estate Market Report
Get to know Compass Real EstateStar Valley
Compass is the fastest growing and most technologically advanced real estate organization in the world. We are the benchmark for innovation, marketing prowess and programming. This translates to better exposure for our clients and more successful deals.
The real estate business has been rapidly evolving over the last few years. As a market leader in Star Valley, we strive to
COMPASS X STAR VALLEY
stay ahead of the competition by adopting and implementing forward thinking change. Compass is home to more than 28,000 of the top agents in 150+ cities across the country; our network connects us directly with similar luxury brokerages and agents in many of the markets that are most important to us.
This season in Star Valley, our local team is even more equipped with the tools, information and insider insight that supports you in the process of buying or selling property.
Please enjoy our Year-To-Date Market Report. And, as always, we are here as your trusted advisor, armed with the tools needed to make your real estate experience a pleasant and successful process.
Q1 / 2023 2 COMPASS.COM
Welcome to our Quarter One 2023 Market Report
Compass Real Estate sells more property than any other brokerage in Star Valley.
We are #1 in both dollar volume and transactions providing you with a singular insight to the local real estate market.
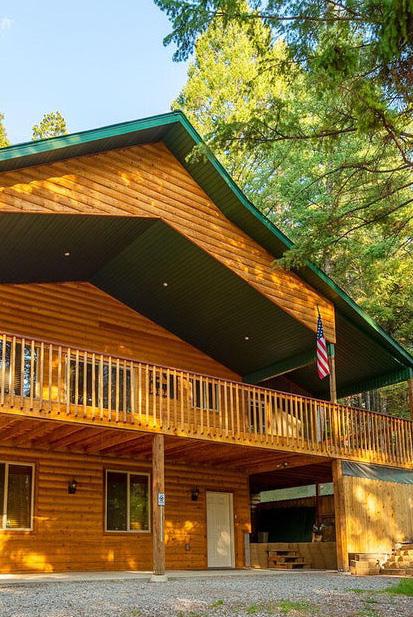
COVER: SOLD
LIST PRICE: $695,000
CENTRAL STAR VALLEY
COMPASS X STAR VALLEY
THE MOST ACCURATE REPORT IN LINCOLN COUNTY.
Experience the Compass Real Estate difference by working with Star Valley’s leading real estate experts. We are a team of trusted advisors working collaboratively to leverage our collective knowledge and expertise to deliver fundamentally different service. For us, nothing matters more than creating legacy of excellence that honors and celebrates our people and the exceptional place we call home.

To start your search of all active Star Valley listings, scan the QR code.


Q1 / 2023 4 COMPASS.COM
The Star Valley Market
Star Valley has experienced notable growth in its population and economy over the past few years, with its scenic mountain views, outdoor recreation opportunities, and low cost of living. It has become an increasingly attractive destination for those seeking a quieter, more rural lifestyle. New businesses have opened in the area, including restaurants, shops, and hotels.
At the end of Q1 2023, the market is continuing to readjust. Overall, Star Valley saw a 54% decrease in the number of sales, leading to a decrease in the total sales volume, which totaled $23.3M, a decrease of 65% compared to Q1 of 2022. The impacts of higher interest rates that started Q3 of 2022 have continued into Q1 of 2023, fueled by volatility in the regional banking markets has caused this dramatic drop in deal flow. Now, more than ever, it is crucial to work with a trusted advisor and talk to the right lender.
Historically, a huge driver for the Star Valley market has been sales in the vacant land segment, in Q1 of 2023, the number of single family homes and vacant land sales are vying for the top spot and, together, make up over 80% of the
total number of the first quarter transactions.
The single family home segment has seen a decrease in total sales in Q1 2023 compared to Q1 2022. The median sales price has decreased by 33%, making single family homes more affordable in Star Valley after the banner years of 2020-2022.
Condominium and townhome sales increased exponentially in Q1 of 2023 due to new construction and increased demand. Inventory has been historically low, and the addition of Buffalo Sage Townhomes proved to be a worthy investment. Total sales volume in this segment saw a dramatic increase to over $3.2M.
Active listings are still on the rise as we head into spring, totaling 259, a 67% increase compared to 2022. Average days on market increased, indicating that the demand for property is shifting and allowing more buyer influence to the market.
The following pages provide a more detailed look into the Q1 2023 top segments of the Star Valley market.
COMPASS X STAR VALLEY HIGHLIGHTS
Q1 / 2023 6 COMPASS.COM Total Dollar Volume 65% Decrease YOY Average SFH Sale Price 36% Decrease YOY $515,500 Median SFH Sale Price 33% Decrease YOY Total Transactions 54% Decrease YOY Active Listings 67% Increase YOY $415,000 56 259 $2,381,710
Sales Distribution by Segment
Single Family Condo/Townhome Vacant Land Commercial 42% 14% 4% 40%
2023 Data 2022 Data $60M $50M $40M $30M $20M $10M $5M Jan. Feb. Mar. April May June July Aug. Sept Oct. Nov. Dec.
Sales Volume Year-to-Date
HIGHEST SALE $2,900,000
LOWEST SALE
$52,000
Q1 / 2023 8 COMPASS.COM
Transaction Distribution by Location
North Star Valley: 21
Central Star Valley: 24
Southern Star Valley: 11
X
COMPASS
STAR VALLEY

10 COMPASS.COM Q1 / 2023 21 24 11
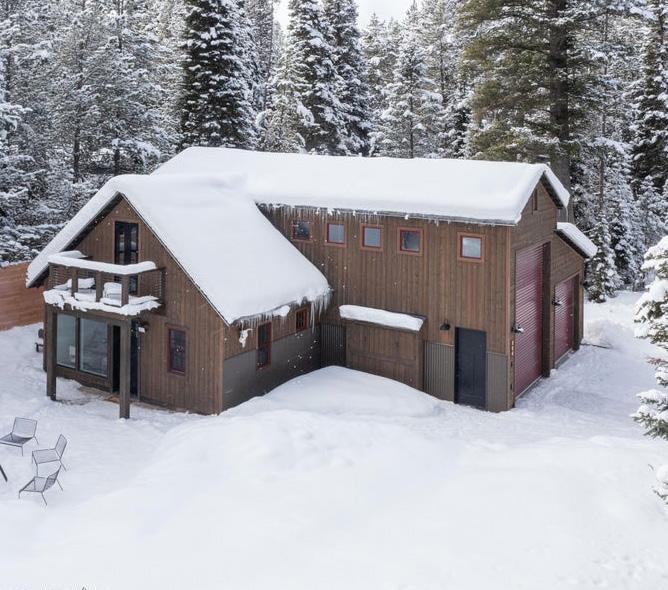
Single Family
SOLD LIST PRICE: $1,050,000
NORTH STAR VALLEY
Much like the overall market, the single family home segment has seen a decrease in total number of sales in Q1 2023 compared to Q1 2022. The median sales price has decreased by 33%, making single family homes more affordable in Star Valley after the banner years of 2020-2022.
At the time of this report active listings are up 135%, to a total of 80 compared to 34 at the end of Q1 2022. With this increase in active listings, and median sale price continuing to be historically high, the average days on market has not surprisingly increased.
Number of Transactions 21
Total Dollar Volume $10,825,500
Minimum Price Sold $119,500
Maximum Price Sold $950,000
Average Sale Price $515,500
Median Sale Price $415,000
Average Days on the Market 146 Number Pending Transactions 19
12 COMPASS.COM Q1 / 2023
50% ▼ 68% ▼ 37% ▼ 72% ▼ 36% ▼ 33% ▼ 11% ▲ 37% ▼ 135% ▲
Inventory 80
Condo & Townhome
SOLD
LIST PRICE: $554,900
SOUTH STAR VALLEY
Historically, condominium and townhome inventory in Star Valley has always been low. New construction brought an increase in sales, up to 7 vs. 1 in Q1 2022. The median and average sale prices dipped 14% and 16%, respectively.
The increase in number of sales skyrocketed the total dollar volume, which reached over $3.2M, a 485% increase compared to Q1 2022. For the first time in quite a while, there are 9 active listings in the condo townhome market, which can also be attributed to new construction.
Number of Transactions 7
Total Dollar Volume $3,216,000
Minimum Price Sold $375,000
Maximum Price Sold $495,000
Average Sale Price $459,429
Median Sale Price $475,000
Average Days on the Market 430
Number Pending Transactions 3 Inventory 9
COMPASS X STAR VALLEY
600% ▲ 485% ▲ 32% ▼ 10% ▼ 16% ▼ 14% ▼ 489% ▲ 50% ▲ ◀▶

Q1 14 COMPASS.COM

Vacant Land
SOLD LIST PRICE: $98,000 CENTRAL STAR VALLEY
The vacant land segment continues to be a driver in Star Valley. The number of sales did dip quite a bit Q1 of 2023, down 74%. Active listings are up 31%, average days on market are down 39%, and the median sales price saw a 46% increase vs. Q1 2022 - indicating that vacant land is trading quickly and at a higher price.
Number of Transactions 19
Total Dollar Volume $6,980,210
Minimum Price Sold $52,000
Maximum Price Sold $2,900,000
Average Sale Price $349,010
Median Sale Price $203,215
Average Days on the Market 156
Number Pending Transactions 17 Inventory 138
16 COMPASS.COM Q1 / 2023
74% ▼ 69% ▼ 160% ▲ 31% ▼ 12% ▲ 46% ▲ 39% ▼ 60% ▼ 31% ▼
307.733.6060
COMPASS.COM
LUXURYATCOMPASS.COM COMPASSRANCHANDLAND.COM
80 West Broadway Jackson, WY 83001
3200 McCollister Drive Teton Village, WY 83025
Snake River Sporting Club Jackson, WY 83001
46 Iron Horse Drive Alpine, WY 83128
307.654.7575
235 S Main Street Thayne, WY 83127
307.883.7575
8 North Main St. Victor, ID 83455
65 S Main Street Driggs, ID 83422
208.354.7325
