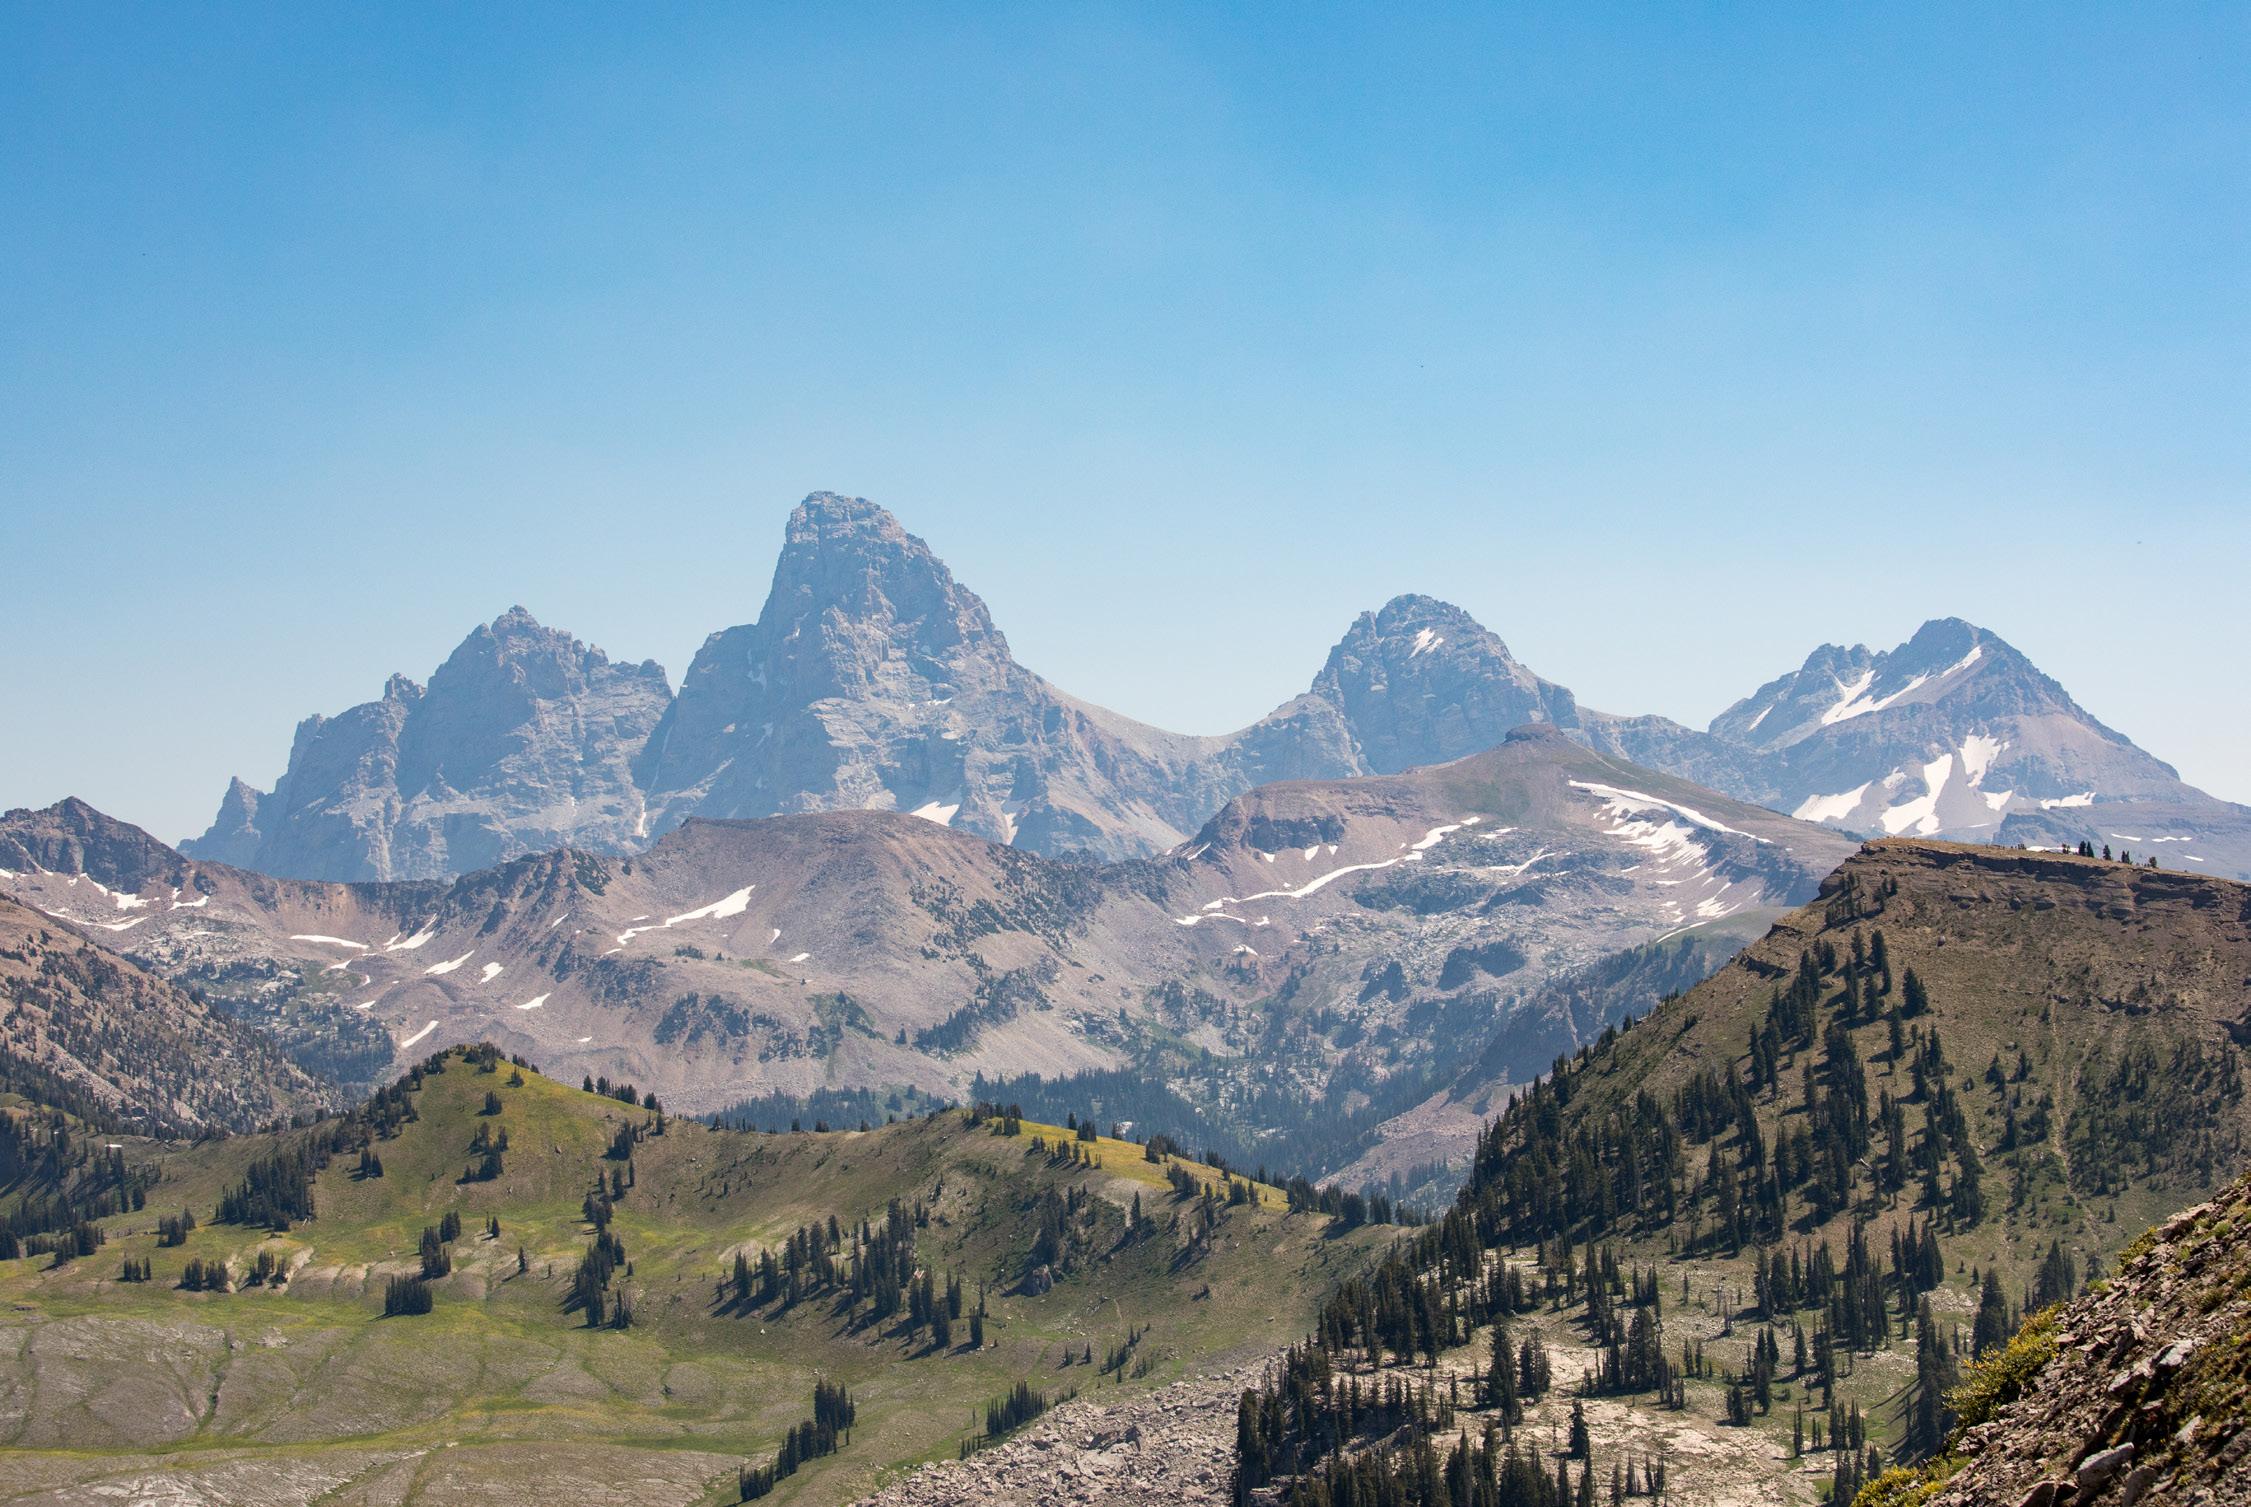
Q2 2023 TETON VALLEY
REAL ESTATE MARKET


The real estate market in Teton Valley, Idaho showcased diverse trends across different property types during the first half of 2023. The post pandemic era is unfolding, and while we are seeing some substantial decreases across the overall market, Teton Valley is still experiencing record highs.
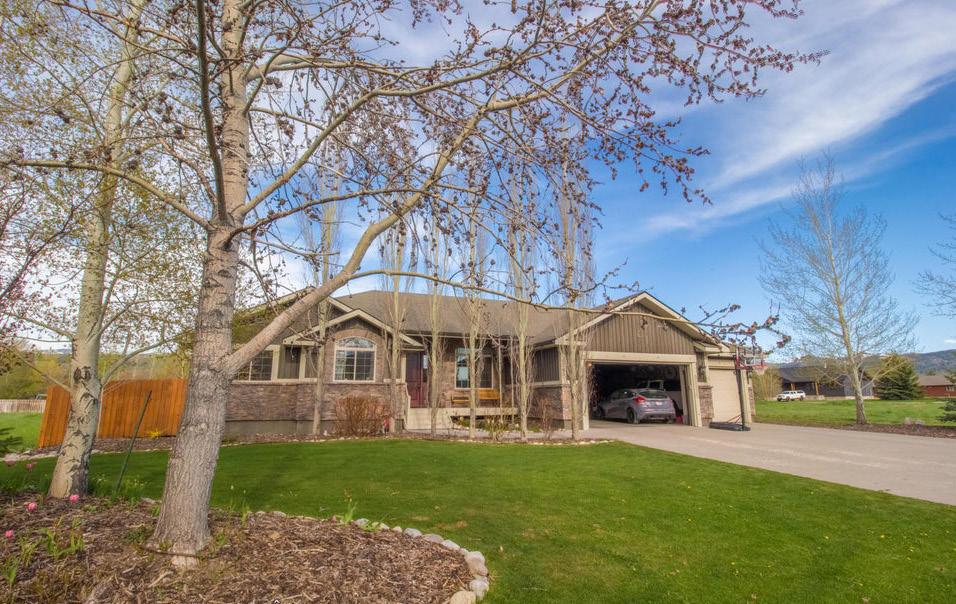
Single family homes experienced a moderate increase in the median sales price, reaching $1.1 million. However, the market witnessed a decline in transaction volume, totaling 78 transactions, representing a 20% decrease. Notably, there was a significant increase in the maximum sales price, driven by a substantial property sale in Alta.
In contrast, the condo and townhome market faced its own set of changes. The total number of transactions in this segment decreased by 25% year over year, with only 23 transactions recorded. Furthermore, the total dollar volume dropped by 66% to $12.1 million, highlighting a significant decrease in overall sales activity. However, there was a positive aspect with a 9% increase in the median sales price, indicating that properties that did sell commanded higher prices. Additionally, the market saw a notable increase in inventory levels,
reflecting an increased supply of condos and townhomes available for sale.
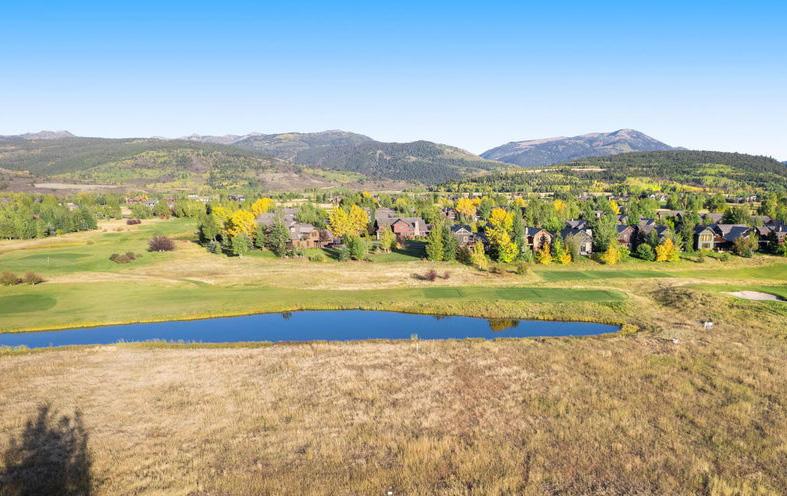
The vacant land market in Teton Valley, Idaho experienced substantial changes during the first half of 2023. While vacant land remained the most traded property type, the number of transactions decreased by 56% year over year, totaling 119 transactions. The total sales volume witnessed a sharp decline of 62%, amounting to $32.4 million, indicating a decrease in investment in vacant land. However, despite the overall decrease, there was a 4% increase in the median sales price, reaching $207,000. .
The number of commercial transactions remained relatively stable, indicating a consistent level of activity in the market. However, there was a 48% decrease in the total dollar volume, which amounted to $5.4 million.
As market participants navigate the real estate landscape, it is crucial to carefully analyze these trends and adjust strategies accordingly. Understanding the evolving market conditions across all market segments will enable buyers, sellers, and real estate professionals to make informed decisions in this dynamic market.

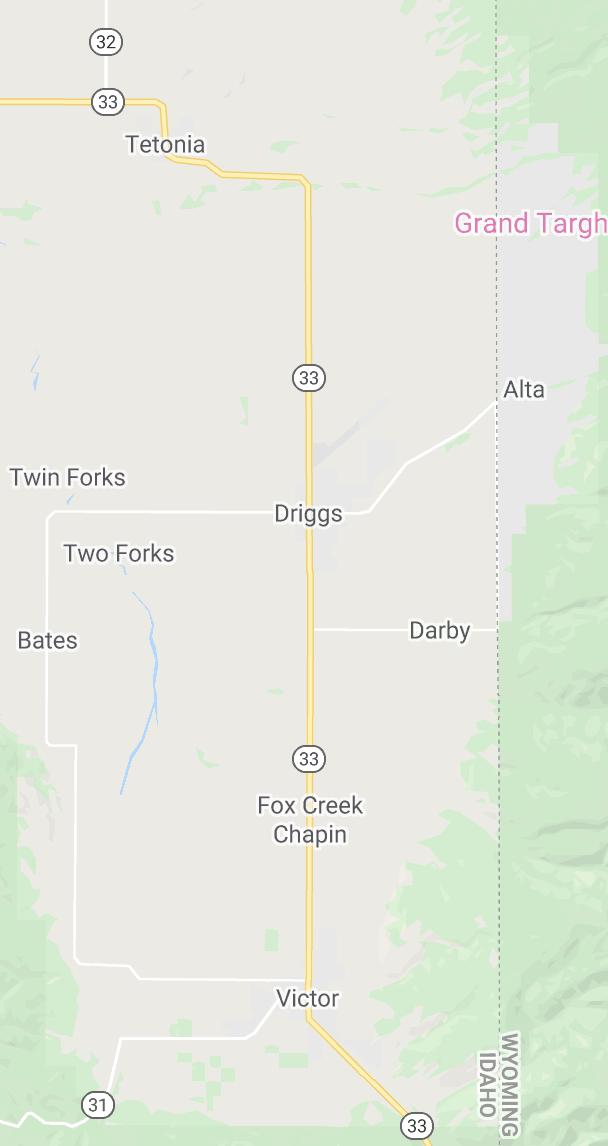
Alta: 6
Victor: 98
Driggs: 81
Tetonia: 48
While the median sales price of single family homes in Teton Valley, Idaho saw a moderate increase of 6% to $1.1M, the overall single family home market witnessed a decline in transaction volume by 20% totaling 78 transactions. The maximum sales price saw a dramatic increase as a significant property in Alta traded during the first half of 2023.
Most significantly, the market experienced a substantial increase in the number of days on market, signaling a potential slowdown in buyer activity or heightened competition among sellers.
All
Total
Minimum
Maximum
Average
Median
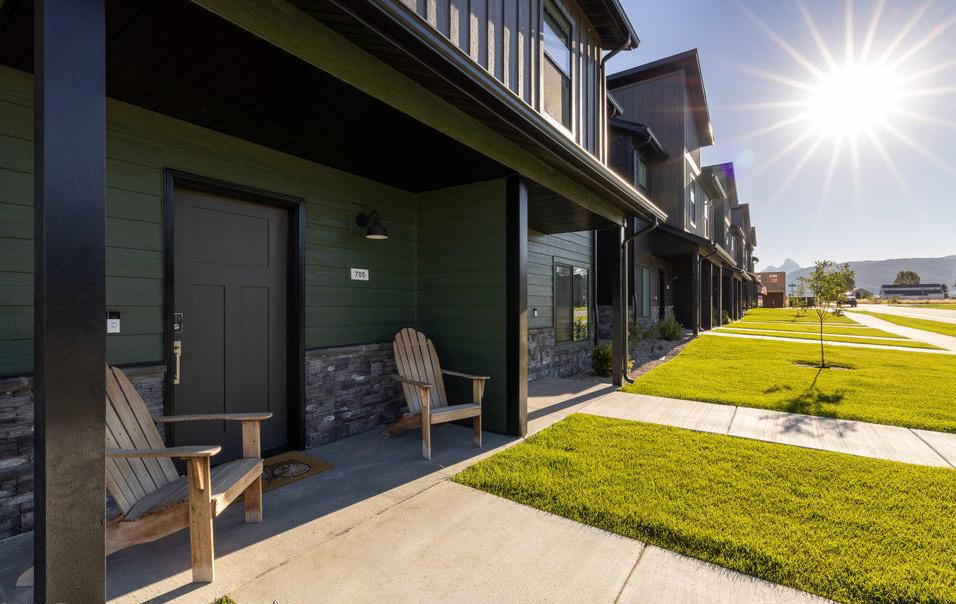
The total number of transactions decreased in the condo and townhome market by 65% year over year, totaling 23 transactions. This decline suggests a slowdown in buyer interest or potential shifts in demand for this particular property type. Additionally, the total dollar volume dropped by 66% to $12.1 million, reflecting a substantial decrease in overall sales activity. However, there was a 9% increase in the median sales price, indicating that the properties that did sell commanded higher prices.
On average, condos and townhomes spent 96 days on the market, representing a 57% increase in the time it took for these properties to sell. This longer duration on the market suggests decreased buyer urgency or increased competition among sellers. Lastly, there was a notable jump in inventory levels, indicating an increase in the supply of condos and townhomes available for sale.
Vacant land continues to be the most traded property type in Teton Valley, Idaho. The number of transactions decreased by 56% year over year, with a total of 119 transactions. This decline indicates a substantial slowdown in buyer activity or a shift in demand for vacant land properties. Furthermore, the total sales volume saw a sharp decrease of 62%, totaling $32.4 million. This significant drop in sales volume suggests decreased investment in vacant land during the first half of 2023.
Despite the overall decline, there was a 4% increase in the median sales price, reaching $207,000. This suggests that the vacant land properties that did sell commanded higher prices. On average, vacant land properties spent more time on the market, with a 27% increase in the number of days it took to sell.
 Sold | List Price: $179,000 | Victor
During the first half of 2023, the commercial real estate market in Teton Valley, Idaho exhibited a combination of contrasting trends. The number of transactions remained relatively stable, indicating a consistent level of activity in the market.
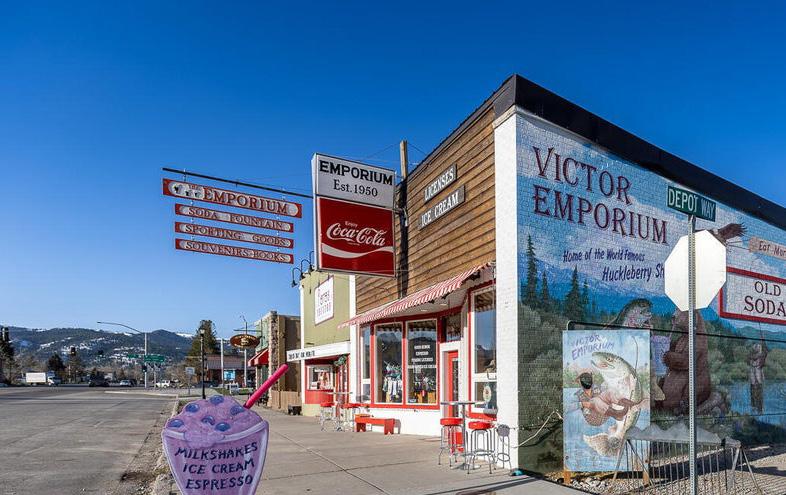
However, there was a 48% decrease in the total dollar volume, which amounted to $5.4 million. This decrease in sales volume suggests a potential decline in investment or a shift in market dynamics. Despite this, the median sales price experienced a 49% increase, signaling that properties that did sell commanded higher prices.
Additionally, there was a notable decrease in the number of active listings, indicating a decrease in available commercial properties for sale.
Active | List Price: $1,799,000 | Victor COMPASS X STAR VALLEYExperience the Compass Real Estate difference by working with Teton Valley’s leading real estate experts. We are a team of trusted advisors working collaboratively to leverage our collective knowledge and expertise to deliver fundamentally different service. For us, nothing matters more than creating legacy of excellence that honors and celebrates our people and the exceptional place we call home.
To start your search of all active Teton Valley listings, scan the QR code.

307.733.6060
COMPASS.COM
LUXURYATCOMPASS.COM
COMPASSRANCHANDLAND.COM
80 West Broadway Jackson, WY 83001
3200 McCollister Drive Teton Village, WY 83025
Snake River Sporting Club Jackson, WY 83001
46 Iron Horse Drive Alpine, WY 83128
307.654.7575
235 S Main Street Thayne, WY 83127
307.883.7575
8 North Main St. Victor, ID 83455
65 S Main Street Driggs, ID 83422
208.354.7325