Star Valley Real Estate Market Report

QUARTER THREE 2022

Compass is the fastest growing and most technologically advanced real estate organization in the world. We are the benchmark for innovation, marketing prowess and programming. This translates to better exposure for our clients and more successful deals.
The real estate business has been rapidly evolving over the last few years. As a
market leader in Star Valley, we strive to stay ahead of the competition by adopting and implementing forward thinking change. Compass is home to more than 29,000 of the top agents in 150+ cities across the country; our network connects us directly with similar luxury brokerages and agents in many of the markets that are most important to us.
This season in Star Valley, our local team is even more equipped with the tools, information and insider insight that supports you in the process of buying or selling property.
Please enjoy our Year-To-Date Market Report. And, as always, we are here as your trusted advisor, armed with the tools needed to make your real estate experience a pleasant and successful process.
Compass Real Estate is involved in more transactions than any other brokerage in Star Valley.
We are #1 in both dollar volume and transactions providing you with a singular insight to the local real estate market.
COVER: SOLD LIST PRICE: $5,997,000 SOUTH STAR VALLEY
Experience the Compass Real Estate difference by working with Star Valley’s leading real estate experts. We are a team of trusted advisors working collaboratively to leverage our collective knowledge and expertise to deliver fundamentally different service. For us, nothing matters more than creating a legacy of excellence that honors and celebrates our people and the exceptional place we call home.

To start your search of all active Star Valley listings, scan the QR code.

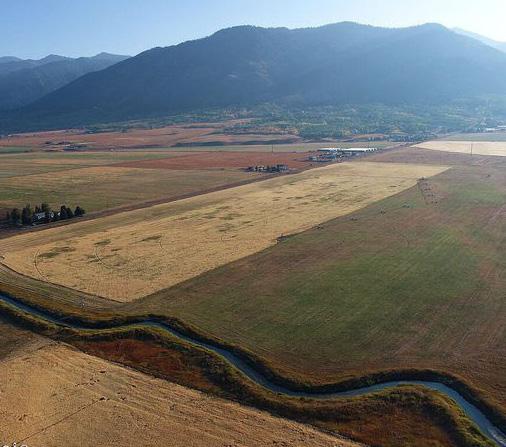
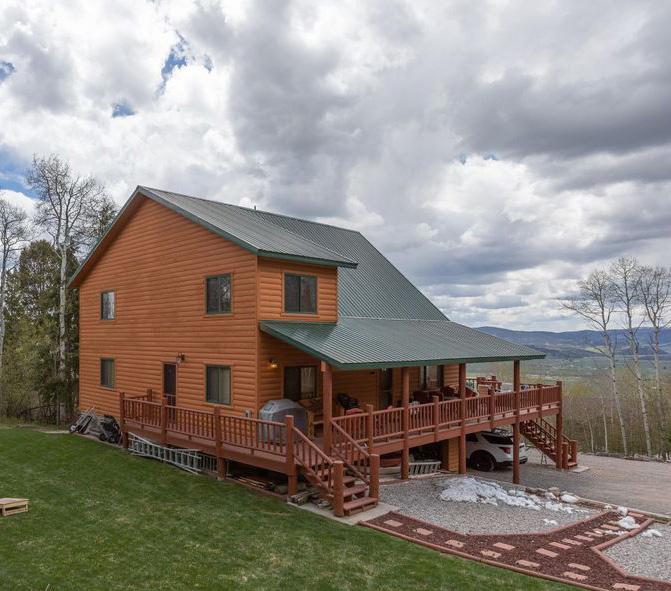
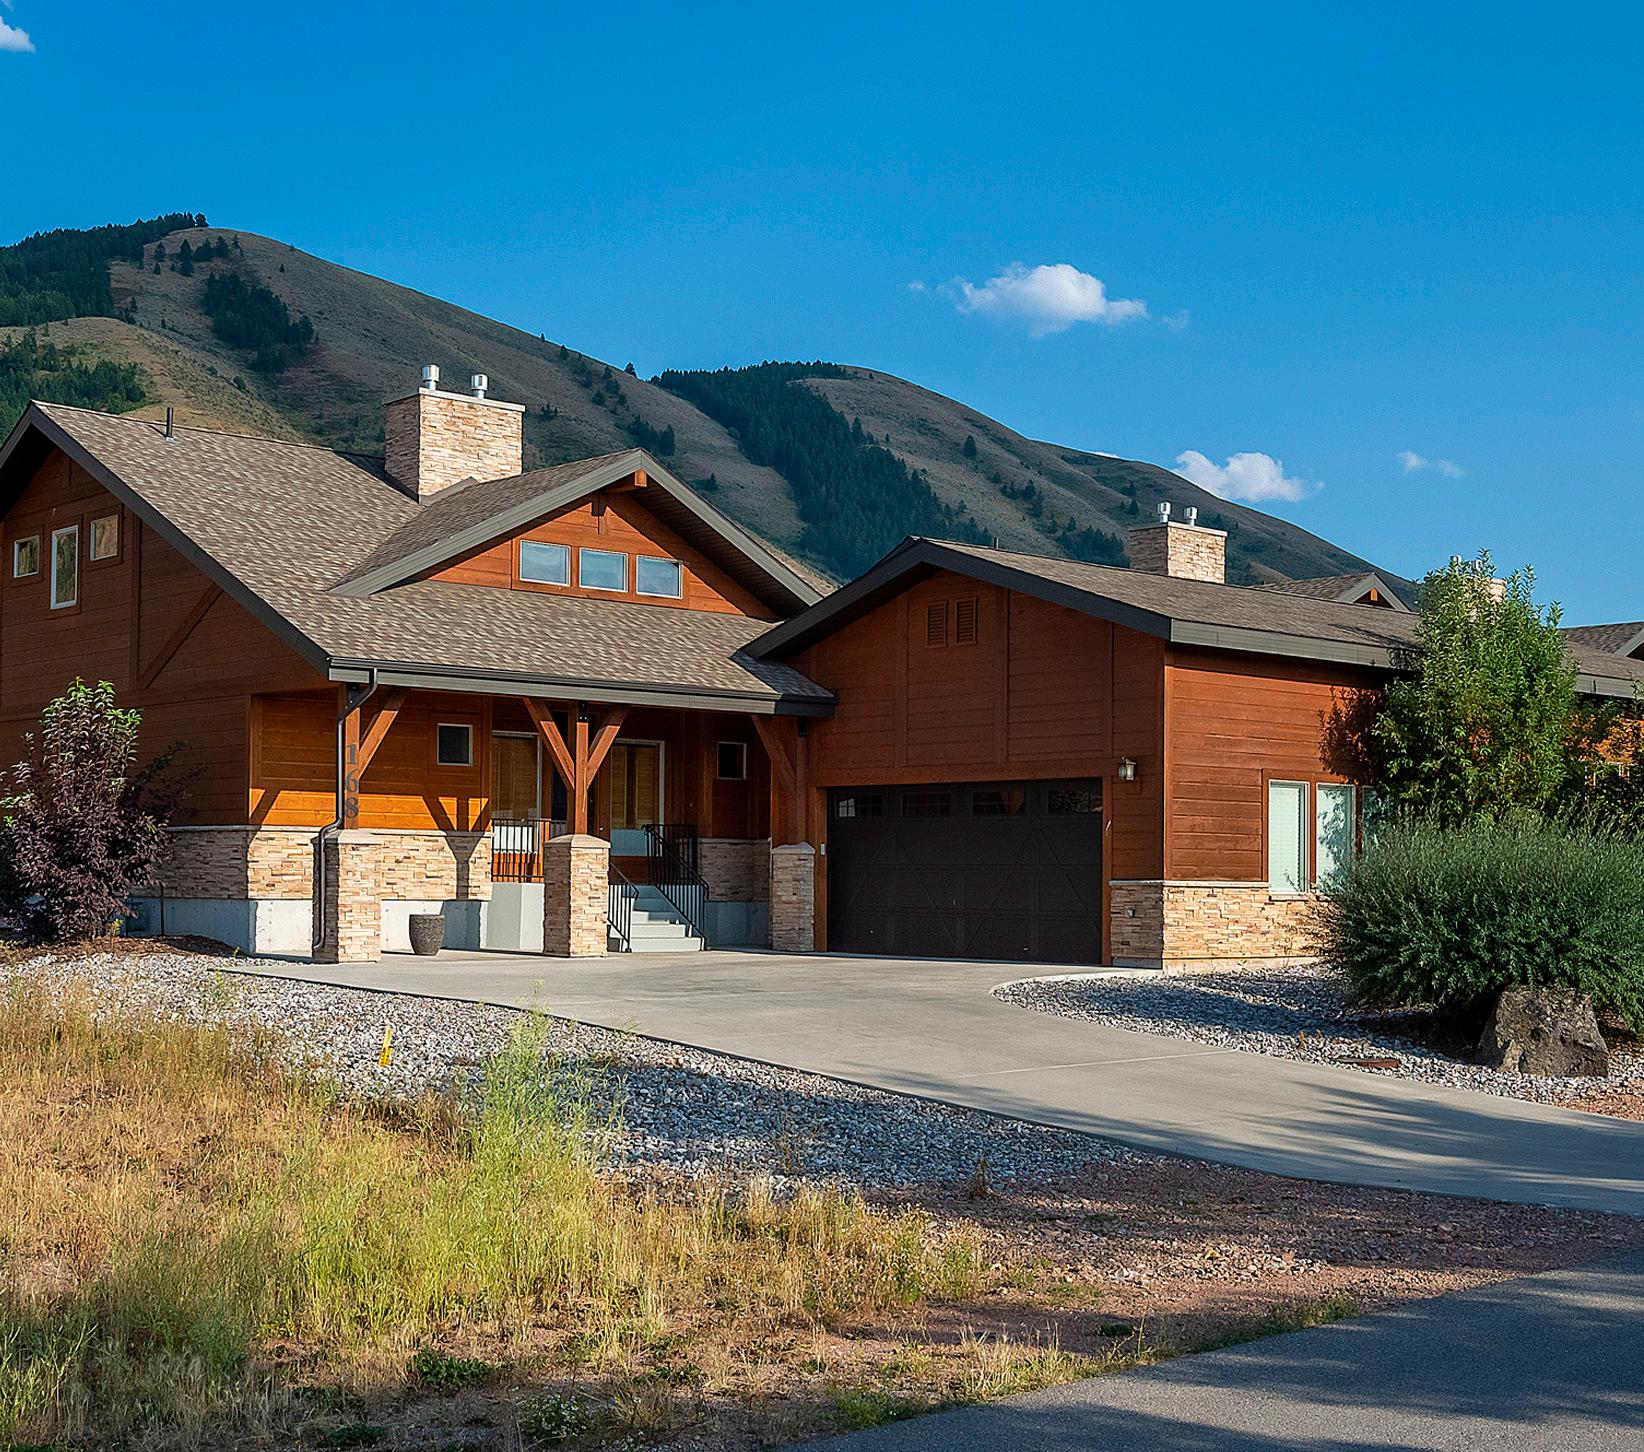
Star Valley has seen impeccable growth over the last few years, and it’s no surprise with its gorgeous views, open space, and unmatched quality of life. Surrounded by National Parks, National Forest, and wilderness, Star Valley offers access and privacy simultaneously.
As the market continues to readjust, Star Valley saw a decrease in overall transitions, down 44% for a total of 409, and a decrease in total dollar volume, down 21% totaling $231M. Although single family home transactions are down 30%, this segment continues to trade quickly as the average days on market have decreased 23%. The average sales price of single family homes is still on the rise, up 21% to $846K, this is driving consumers to purchase land with the intent to build. This increased demand has pushed sales at the lower end of the land segment to increase significantly, causing a surge in average sale price, up 81% to $304K in Q3 2022.
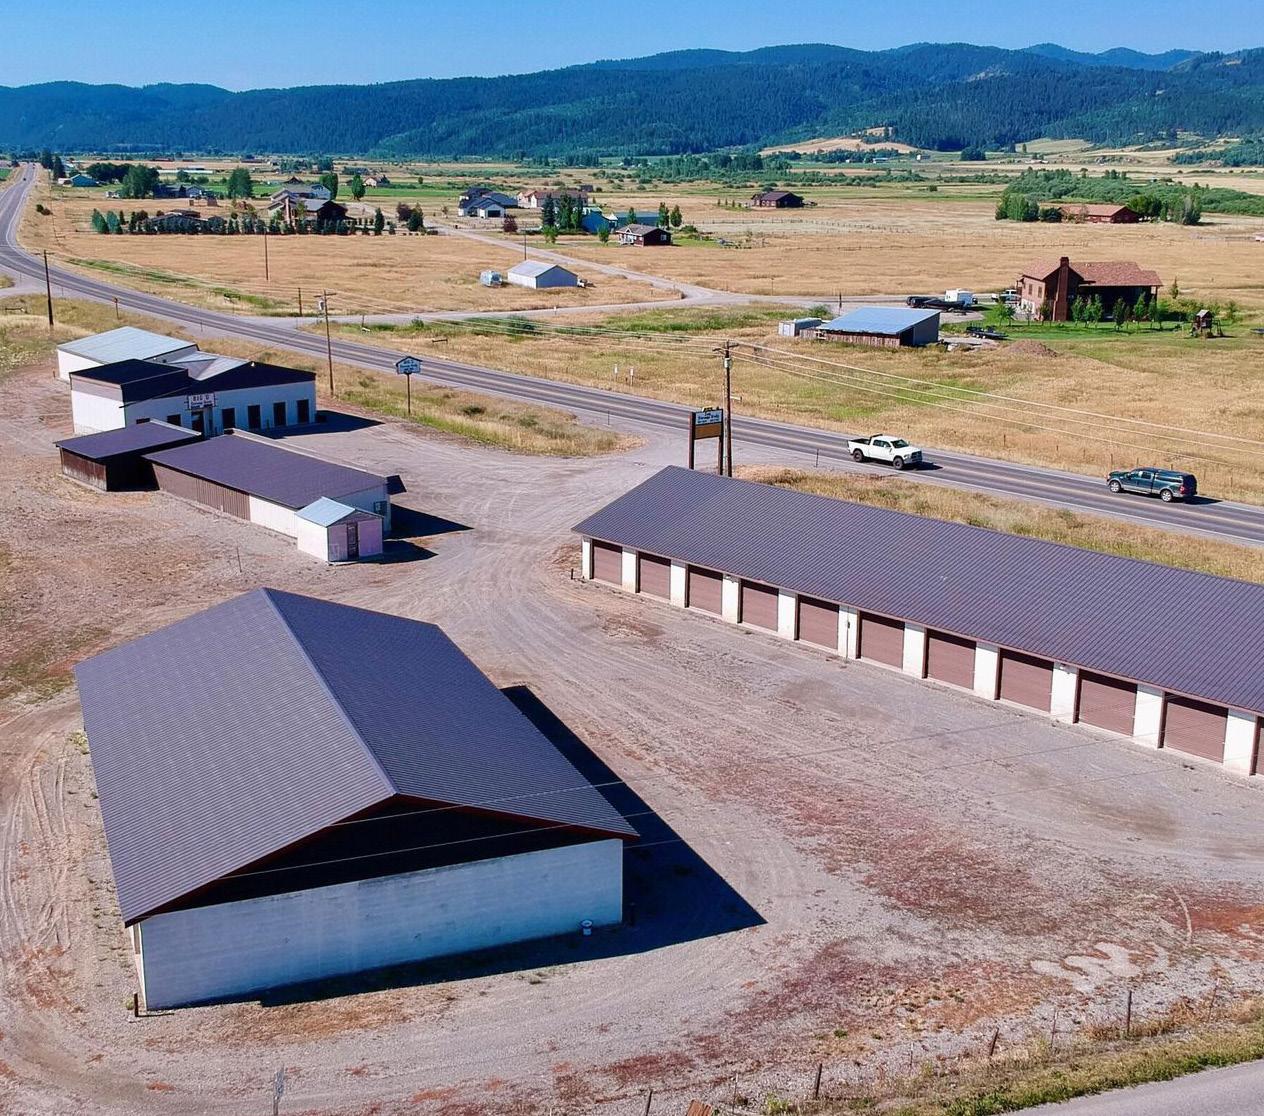
Although sales of commercial property has decreased by 25%, at the time of this report there is an increase of commercial active listings, and average days on market has decreased by 45%. Indicating there is still strong demand for commercial property in Star Valley.
Active listings are still on the rise as we head into quarter four, and average days on market saw a decrease indicating that the demand for property in Star Valley remains strong and the market is still highly competitive.
The following pages provide a more detailed look into the single family, condominium and townhome, land, commercial, and ranch segments of the Star Valley real estate market, year to date 2022 vs 2021.
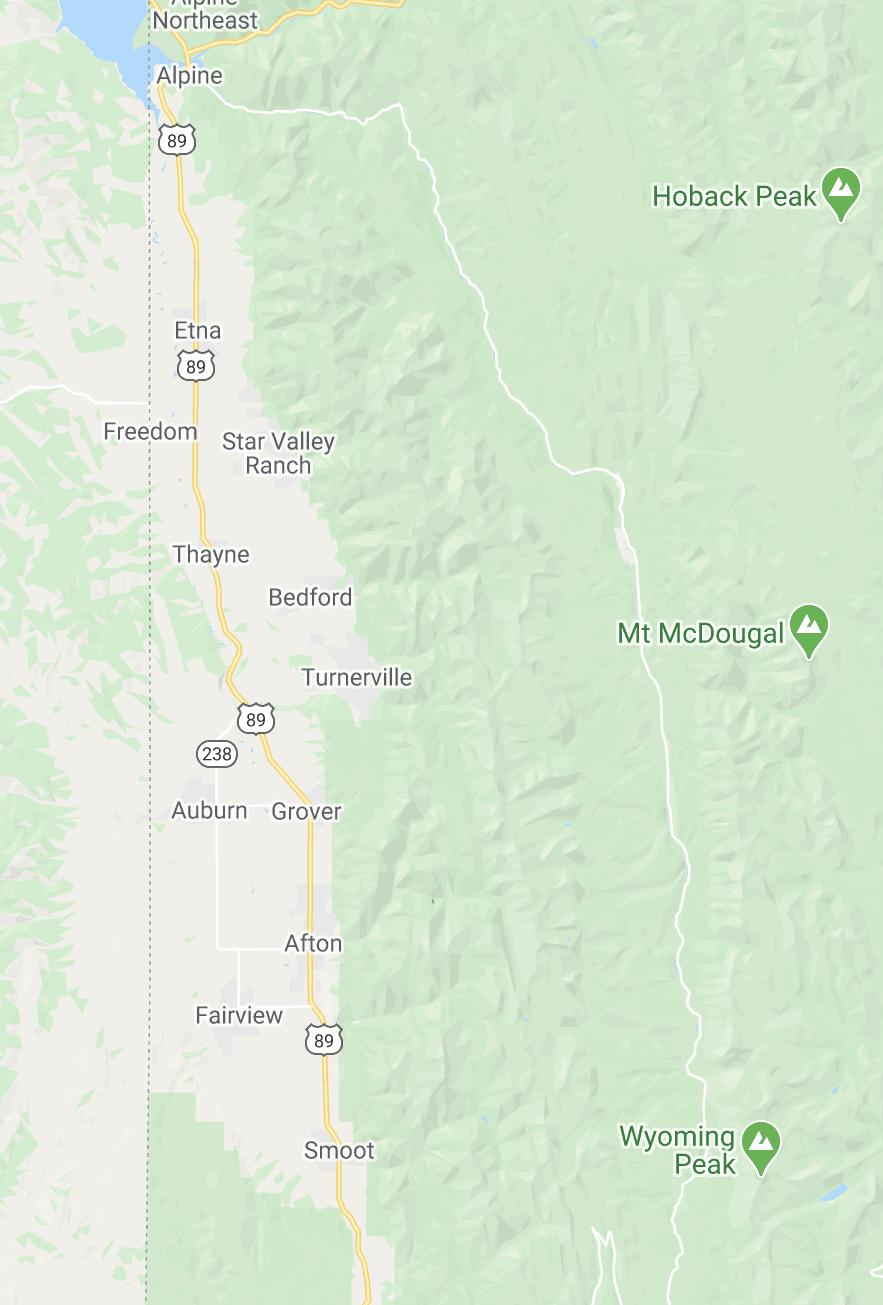
North
With very little inventory in the condominium segment, the market saw a significant decrease in transactions and total dollar volume Year to Date 2021 vs. 2020.
While inventory is tight, Q3 2022 showed a 60% increase. Average days on market is down 45%, reinforcing that demand for the condo and townhome segment remains high.
Number of Transactions 6
Total Dollar Volume $3,664,000
Minimum Price Sold $485,000
Maximum Price Sold $665,000
Average Sale Price $610,000
Median Sale Price $599,500
Average Days on the Market 73
Number Pending Transactions 2

SOLD LIST PRICE:
Although sales of commercial property has decreased by 25%, at the time of this report there is an increase of commercial active listings, and average days on market has decreased by 45%.
STAR VALLEY
Indicating there is still strong demand for commercial property in Star Valley.
Number of Transactions 15
Total Dollar Volume $10,673,500
Minimum Price Sold $630,000
Maximum Price Sold $1,600,000
Average Sale Price $711,567
Sale Price $630,000
Average Days on the Market 176
Number Pending Transactions 2