CALUMET COUNTRY CLUB FACT SHEET


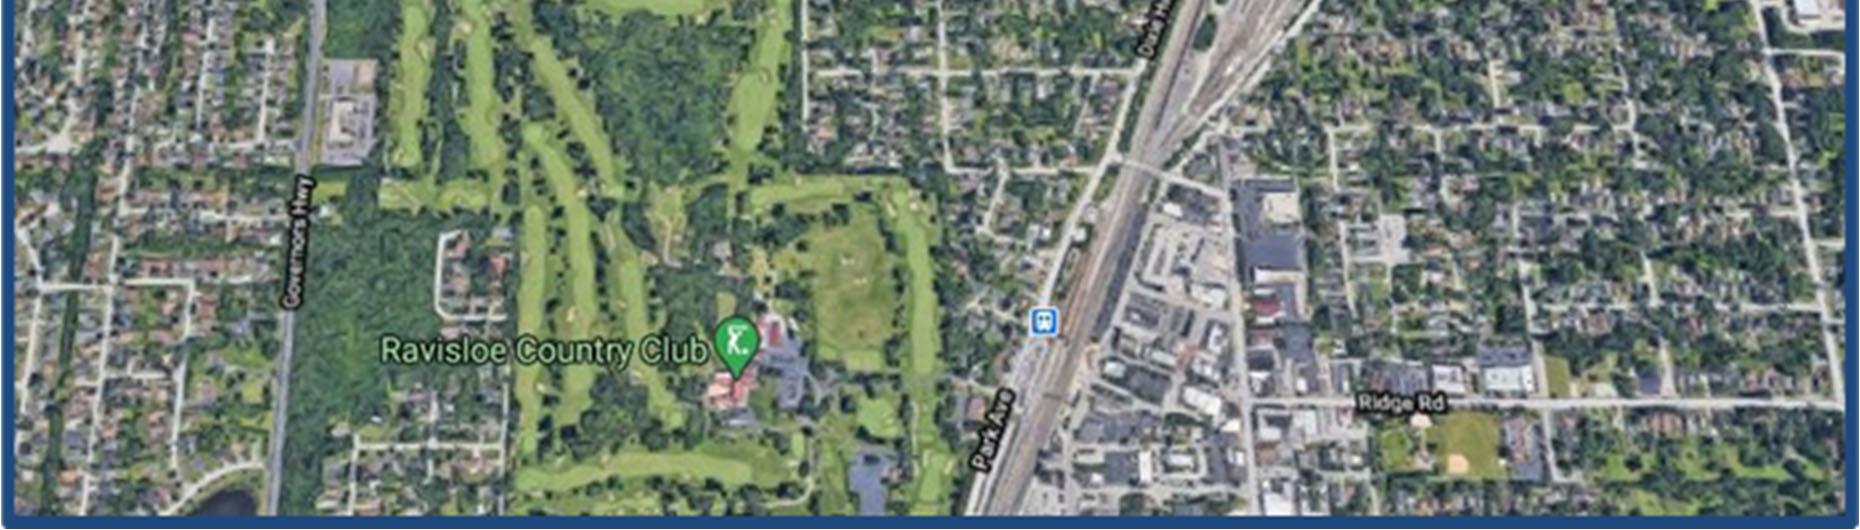
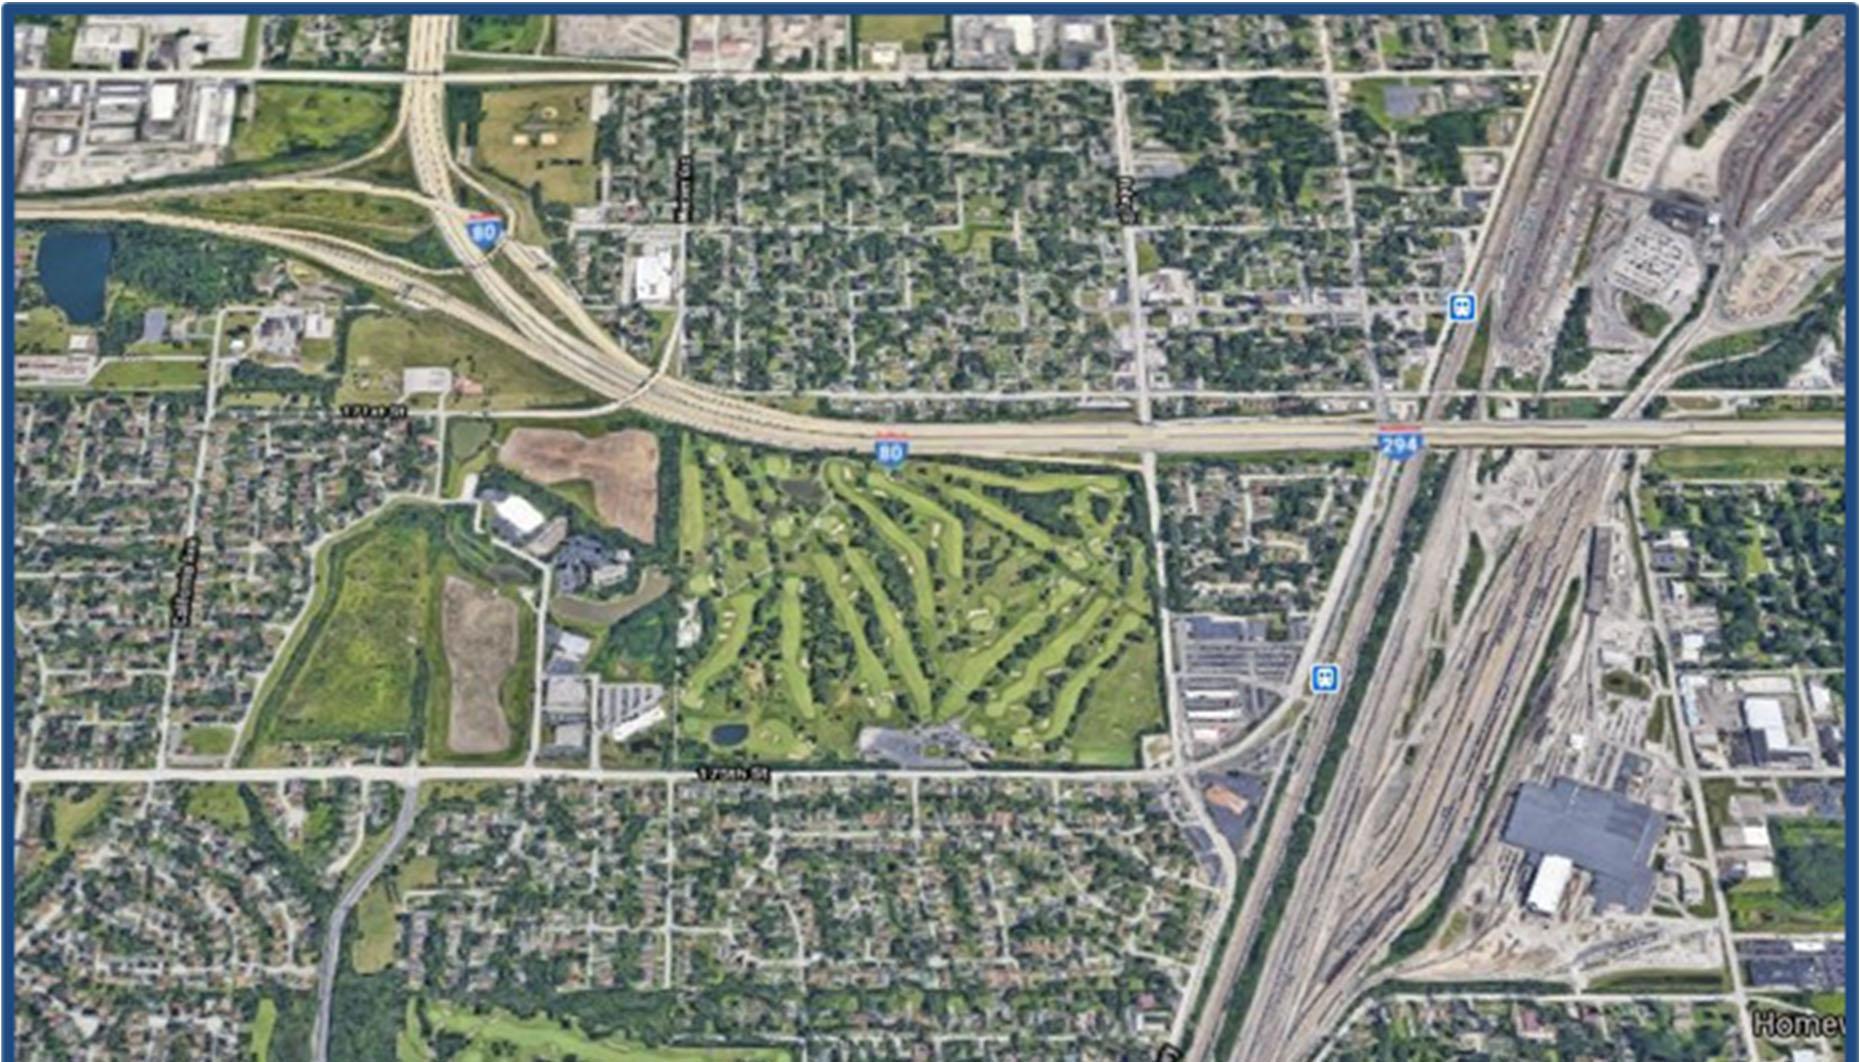
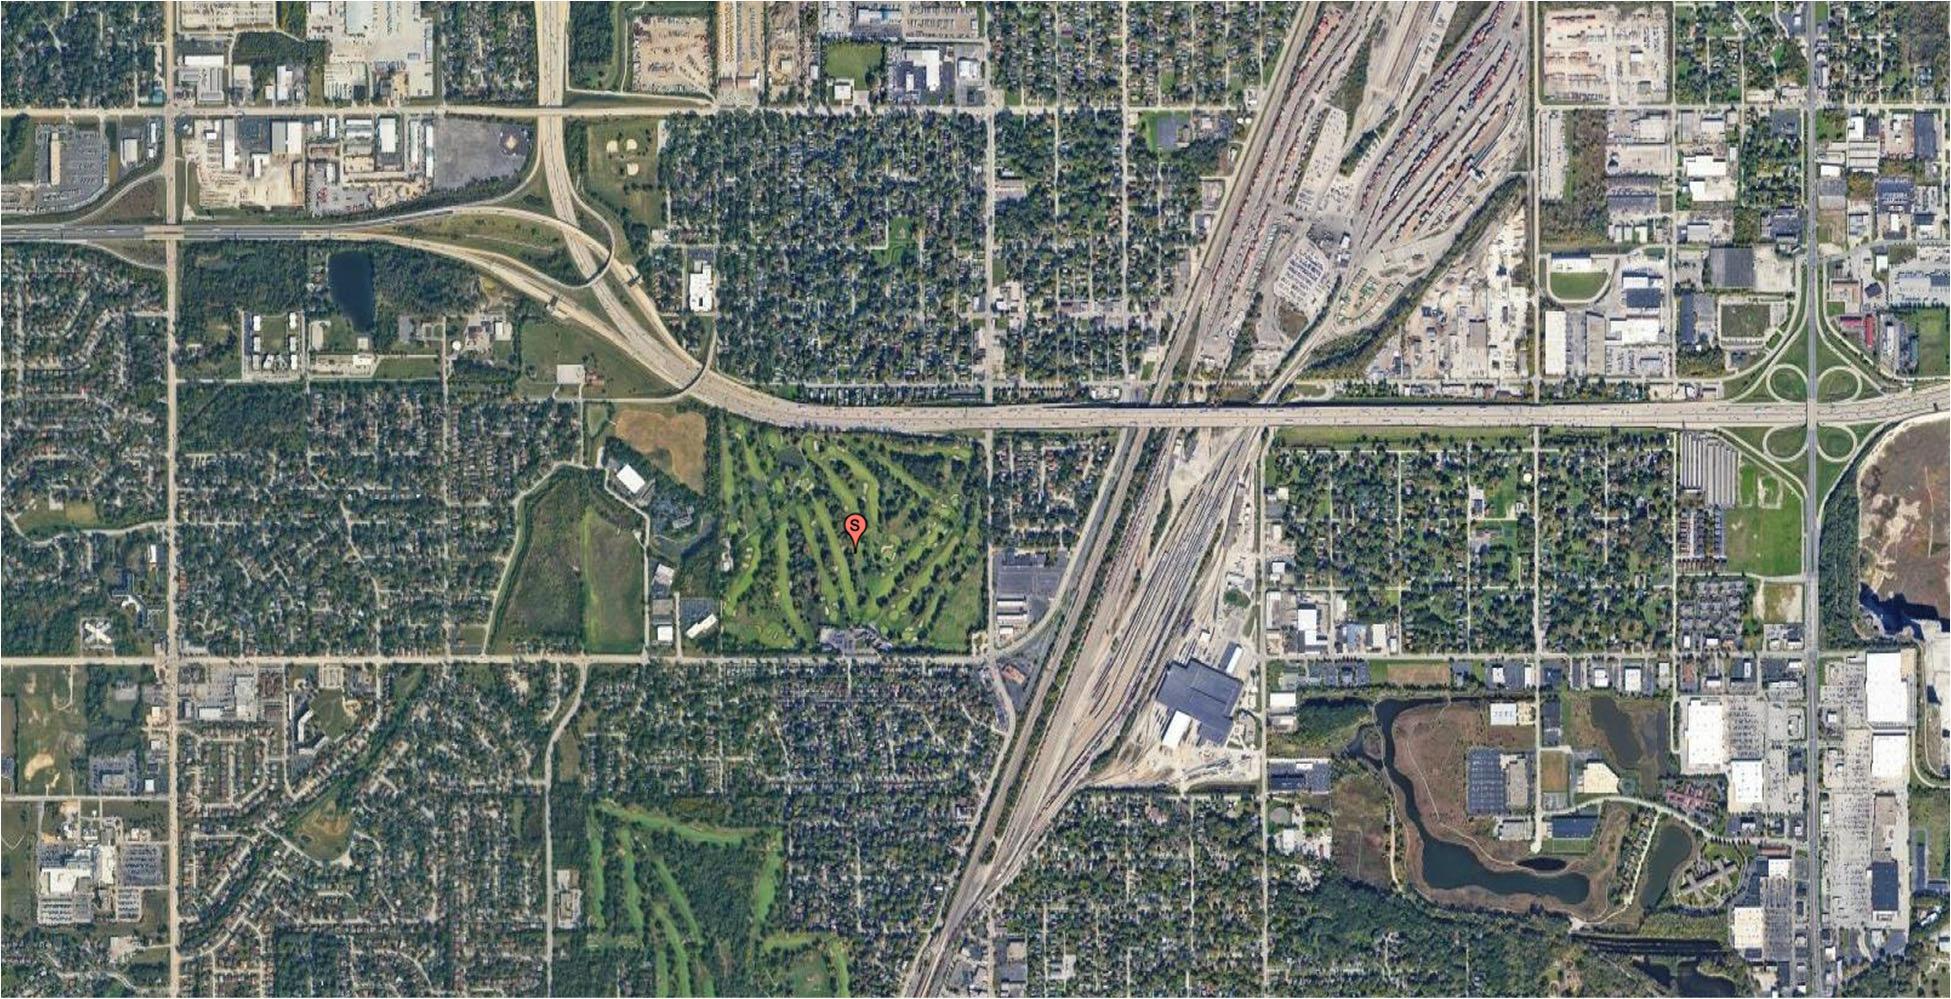
Uses along 175th Street in the vicinity of the subject are primarily residential in nature. Another golf club is located less than ¼ mile to the south of the subject, Ravisloe Country Club. To the immediate west is industrial development and established residential dwellings further west. Single family development is to the south, in between the subject and the Ravisloe Club. There are government buildings to the east, including the Hazel Crest Village Hall, as well as parking for the Calumet Metra station. The subject abuts Interstate 80 to the north, with single family development north of the highway. A drive of the neighborhood revealed that occupancies in the area are quite high. The area has remained popular with no signs of this changing into the future. As shown above, the density of uses in the area is relatively high with few vacant parcels available.

The subject neighborhood is a developed suburban community which exhibits great access to local traffic linkages. Moreover, local demographics indicate a loosely defined but stable population with average income levels at the metropolitan and statewide averages. Given the surrounding population figures and access, the subject neighborhood should remain a viable commercial area for the foreseeable future.
The subject site is located on the northwest corner of 175th Street and Dixie Highway, just south of I80. The characteristics of the site are summarized as follows:
Site Characteristics
Gross Land Area: 128.36000 Acres or 5,591,362 SF
Usable Land Area: 109.00000 Acres or 4,748,040 SF
Usable Land %: 84.9%
Shape: Generally Rectangular
Average Depth: 2,140.00 feet
Topography: Gently sloping
Drainage: Assumed adequate
Grade: Varies above and below street grade
Utilities: All Available
Off-Site Improvements: Asphalt paved street, curbs, gutters
Interior or Corner: Corner
Signalized Intersection: Yes - Traffic signal at the site that enhances access
Excess or Surplus Land: None
Additional Access Alley Access: None
Water or Port Access: None
Rail Access: None
Flood Zone Data
Flood Map Panel/Number: 17031C0733J
Flood Map Date: 08-19-2008
Portion in Flood Hazard Area: 0.00%
Flood Zone: Zone X
The areas of minimal flood hazard, which are the areas outside the SFHA and higher than the elevation of the 0.2-percent-annualchance flood, are labeled Zone C or Zone X (unshaded).
Soil Type: Assumed adequate
Environmental Issues: A Phase I Environmental Site Assessment was conducted by ECS Midwest, LLC and dated October 12, 2020. According to this document, a 1,000-gallon gasoline UST was removed from the property on January 3rd, 1990. The Illinois EPA issued a No Further Remediation Letter on April 15, 1991, and no associated land use restrictions and/or engineering/institutional controls were placed on the property as part of site closure. Other than this historical condition, ECS revealed no evidence of environmental conditions with the property.
Easements/Encroachments: The easements are described in the Addenda.
Earthquake Zone: None
Wetlands Classification: Cherry Creek is on the northwest corner of the site. This area is subject to federal regulation. There are a number of other designated wetlands but have been determined to not be under federal regulation.
North: Interstate 80
South: Single-Family Residential Neighborhood
East: Single-Family Residential Neighborhood, Retail Buildings, Calumet Metra Station
West: Industrial Buildings, Vacant Land
Site Ratings
Access: Good Visibility: Good
Zoning Jurisdiction: Village of Homewood
Zoning Classification: PL-2, Public Land and Open Space
General Plan Designation: Public Land and Open Space
Permitted Uses: A variety of uses (see exhibit)
Zoning Comments: The purpose of the PL 2 Public Land and Open Space Zoning District is to protect and maintain public properties owned by the Village, the park district, school districts, non-profit organizations, and privately-owned country clubs. The development standards provide flexibility to local government bodies, non-profit organizations, and country clubs in the use of their land while protecting surrounding uses.
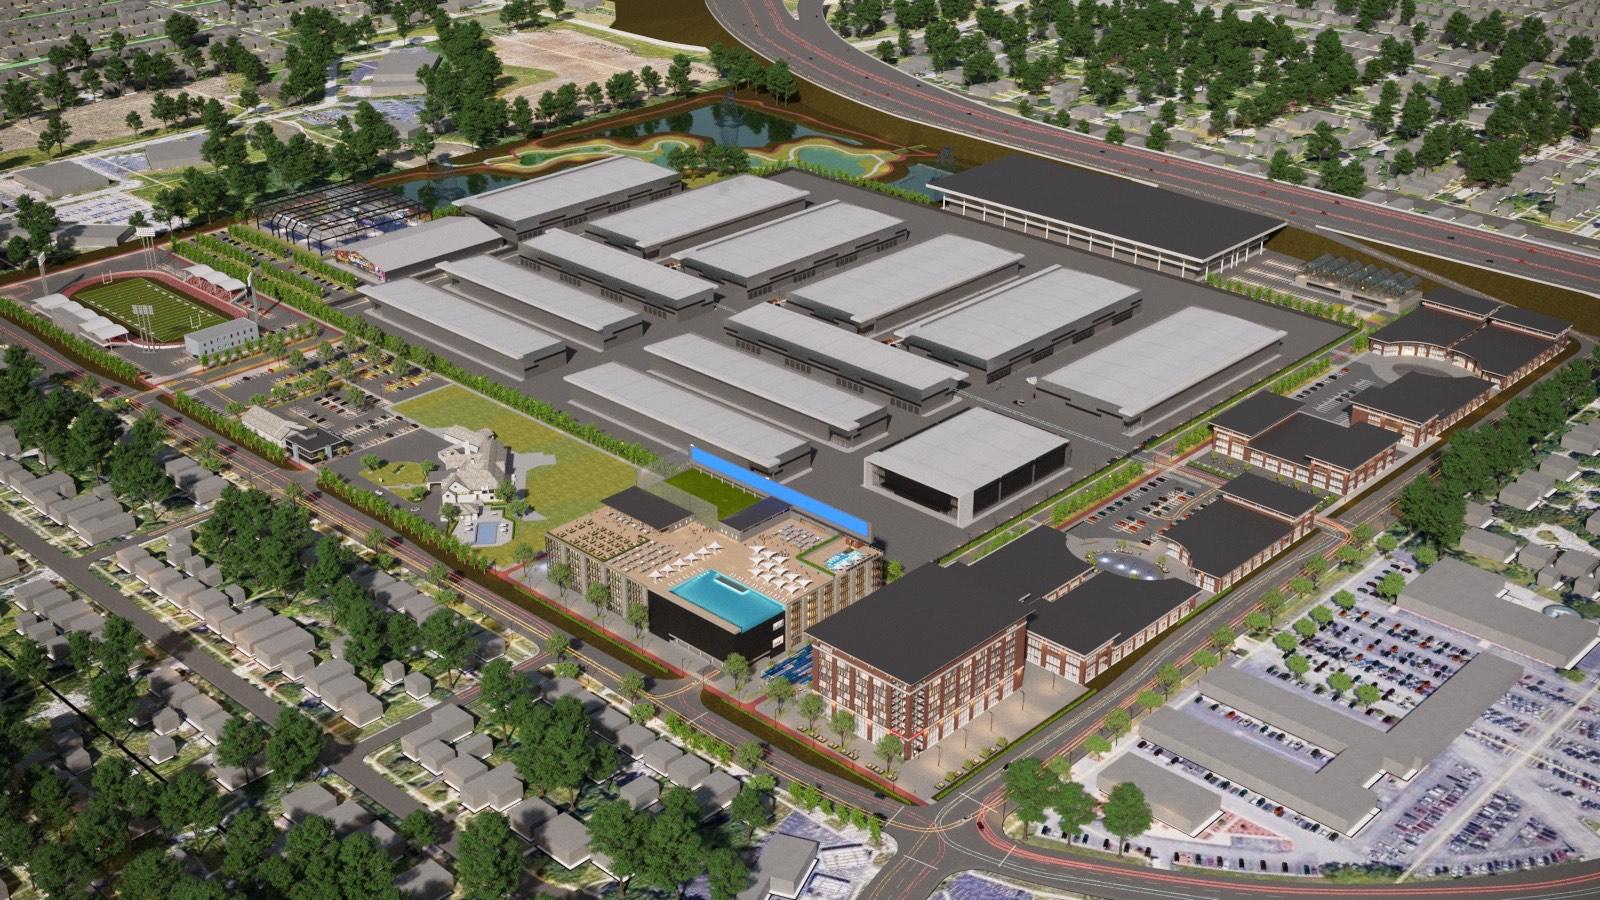
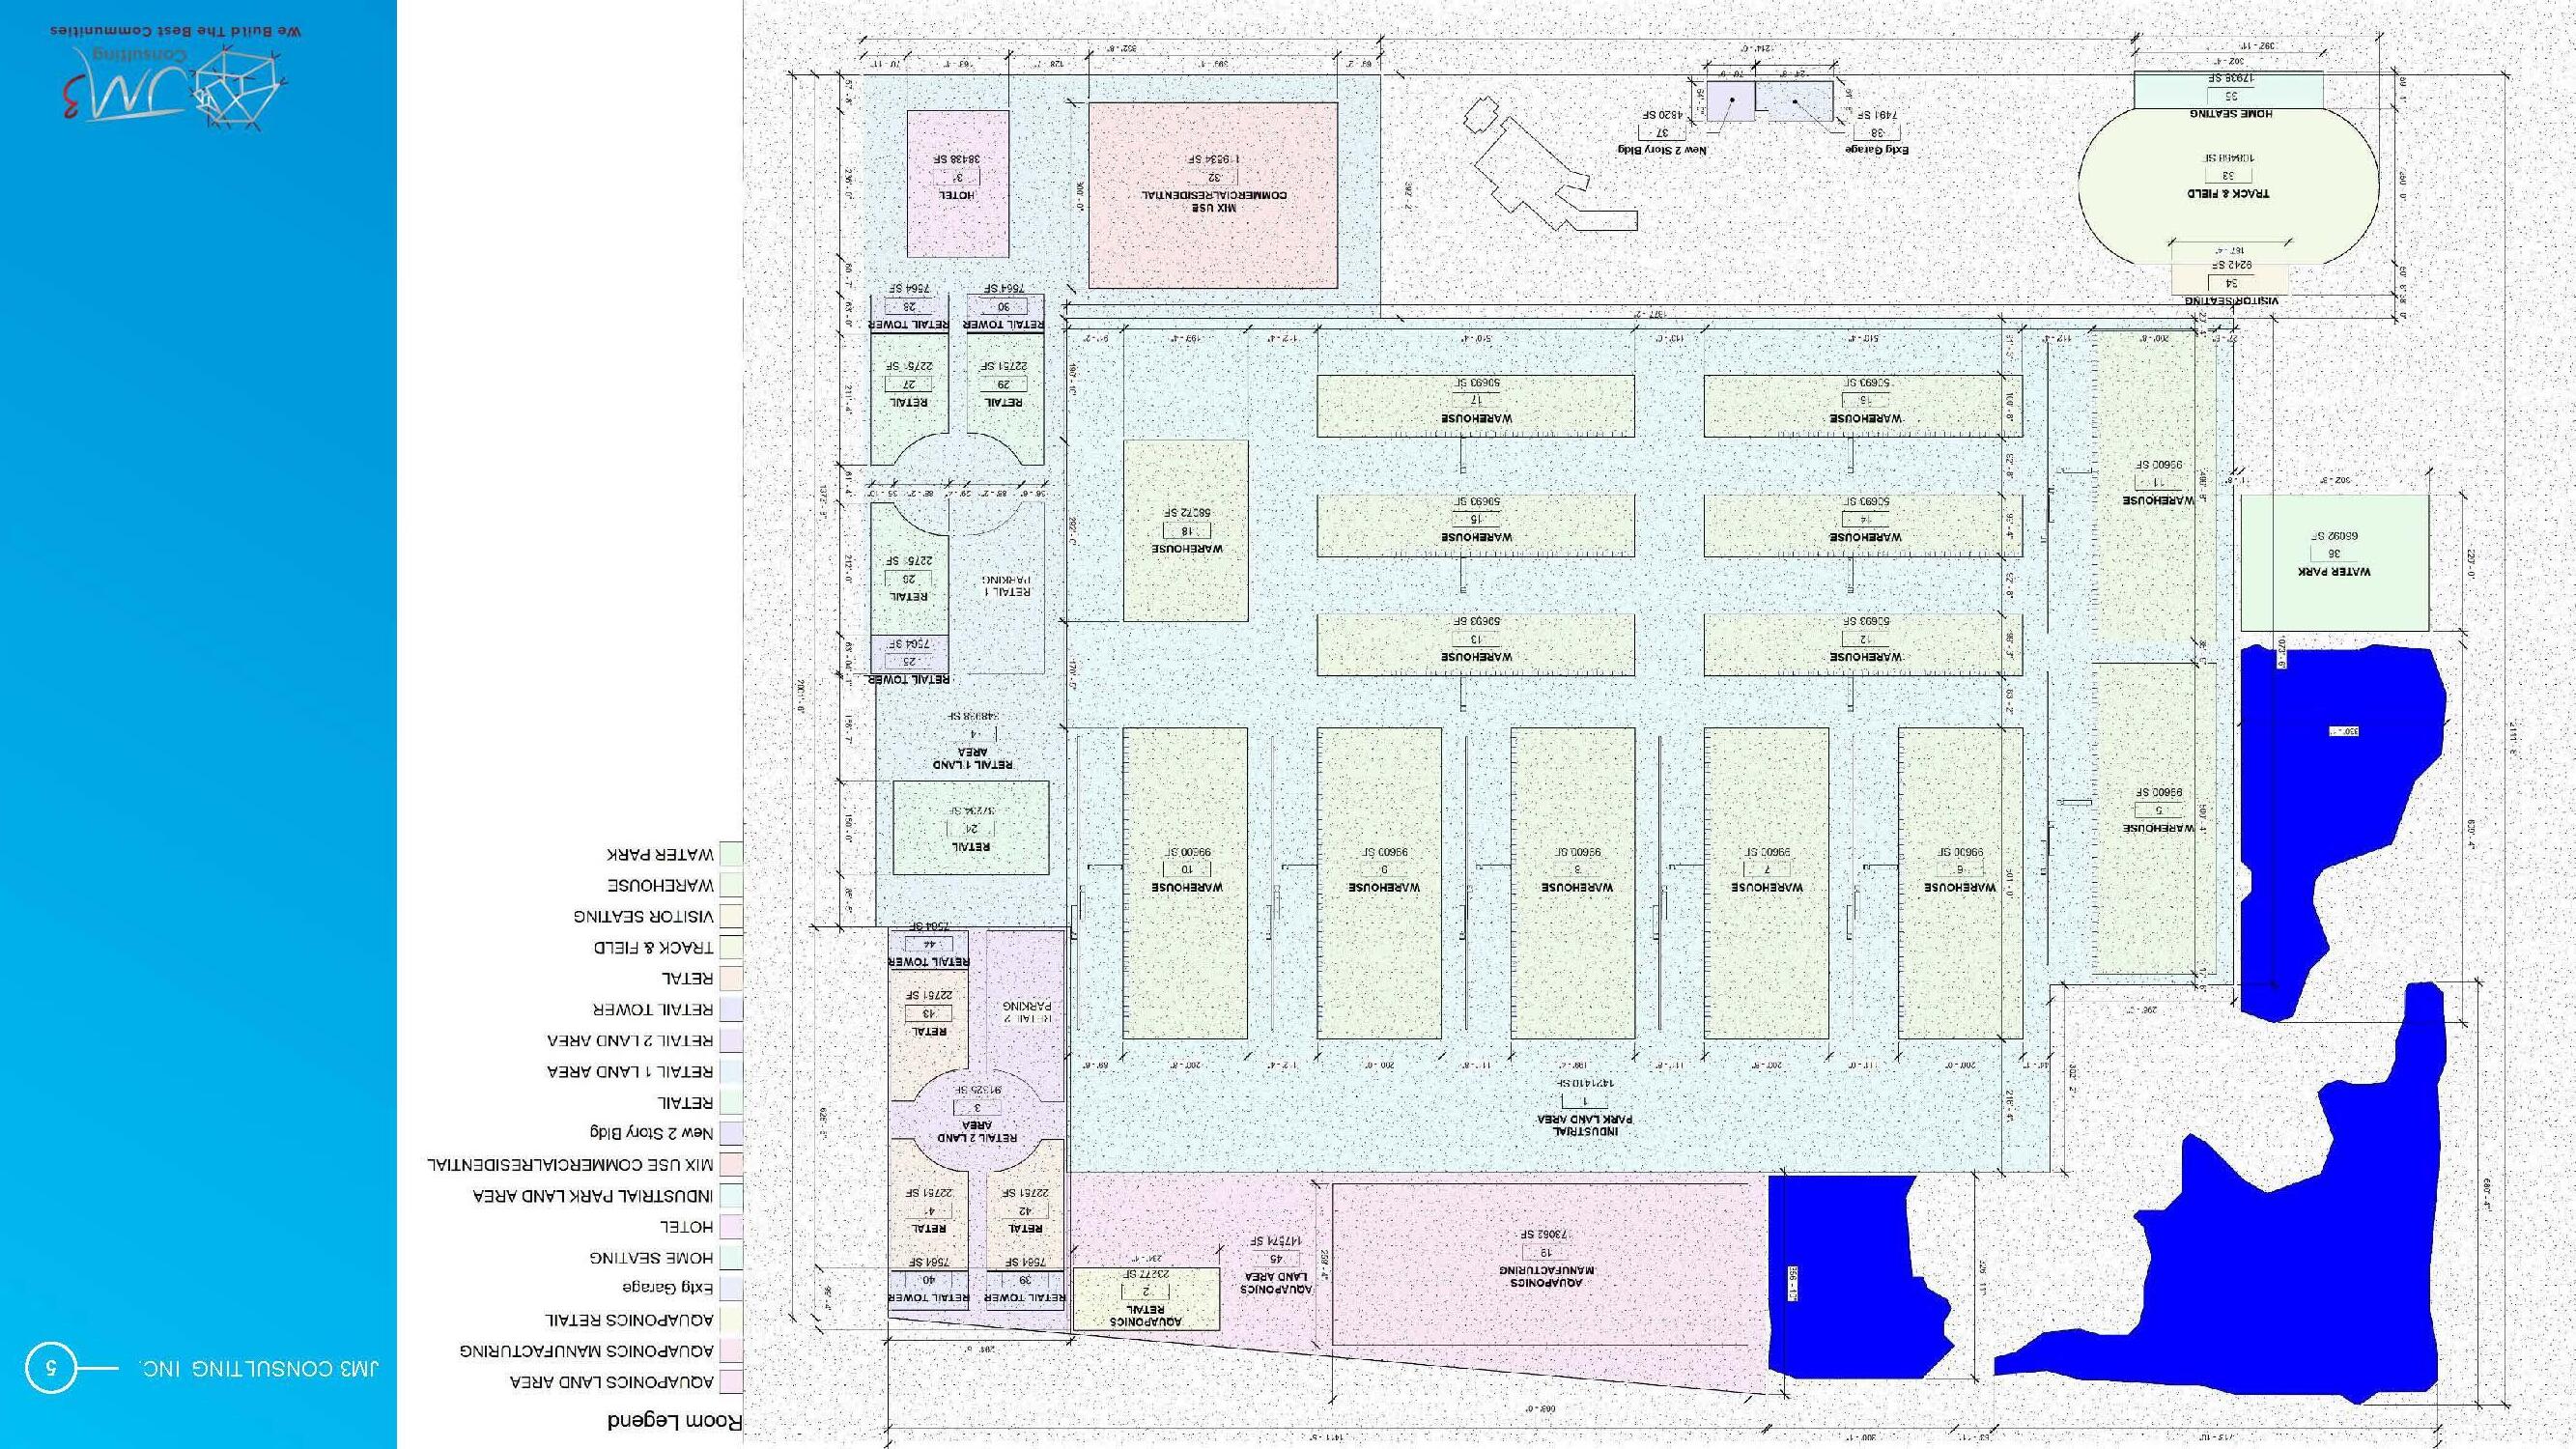
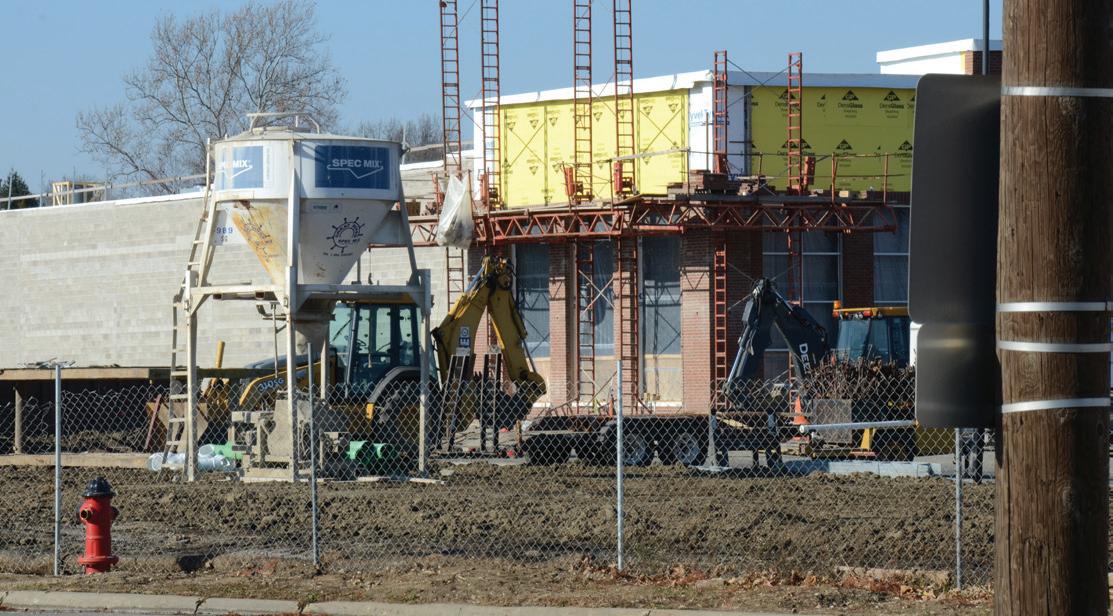
The subject property consists of a 128.36-acre parcel of land that is currently occupied with the Calumet Country Club. The Calumet Country Club is a private 18-hole championship golf course. The property is improved with various structures, including:
• An approximately 31,500 square foot, two-story clubhouse
• An approximately 1,240 square foot, single-story locker room and swimming pool building
• An approximately 275 square foot, single-story halfway house
• An approximately 5,940 square foot, single-story storage building
• An approximately 4,900 square foot, single-story maintenance building
• A pump house
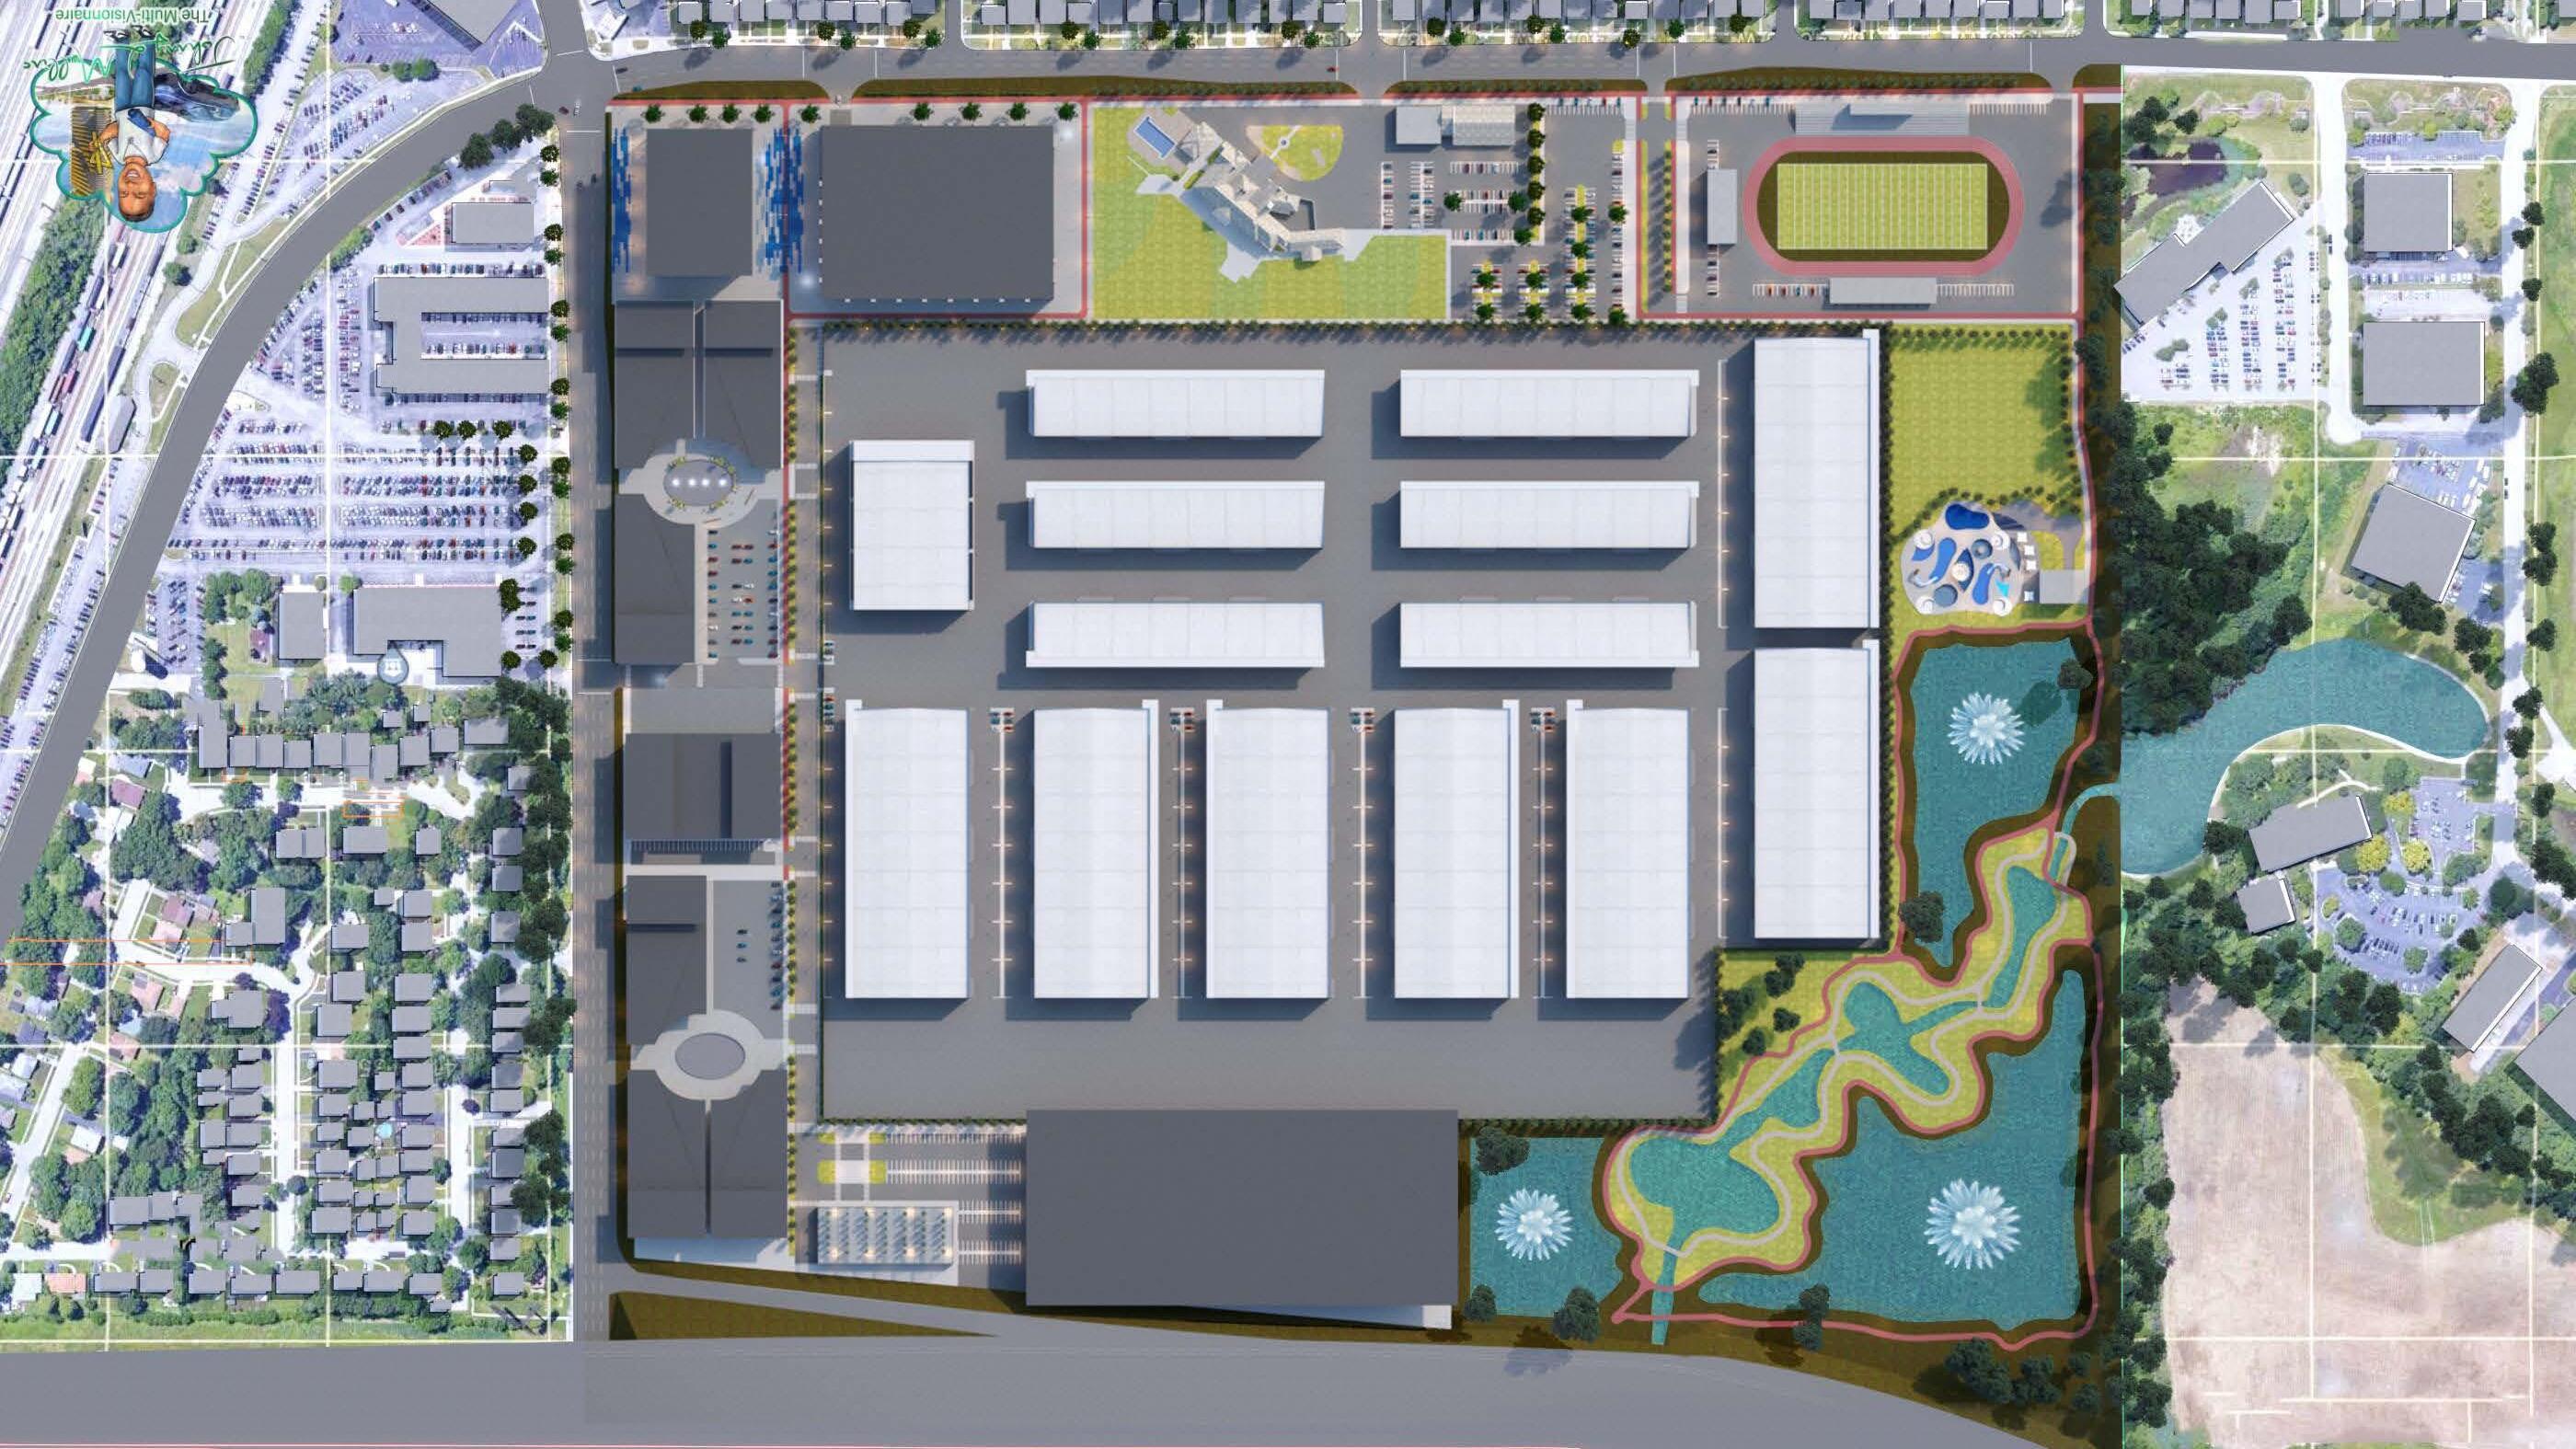
The subject property is located in a commercial/residential area formerly in Homewood, Cook County, Illinois. However, in April of 2021, by direction of the owner, the Homewood Village Board approved disconnecting the property from the village. Therefore, a majority of the property currently is located in unincorporated Cook County, with a small portion at the northwest corner of 175th Street and Dixie Highway falling with the village boundaries of Hazel Crest. Currently, the property is under review for potential redevelopment with proposed uses to include industrial, retail, commercial, residential condos, hotel, training facility, recreational land and aquaponics along with a dog park and walking trails. More specifically, the proposed development will feature an indoor waterpark and a state of the art sporting complex. Other tenants may include a fresh market farm stand, per groomer, UPS Store, Bamenda Coffee shop and more. The mixed-use industrial plans will also include the introduction of Factory Town and Warehousing. This inclusion will provide continuous support and growth for the proposed retail tenants. This is all pending re-zoning to a mixed-use industrial district either within Cook County or re-annexation into the neighboring village of Hazel Crest. The subject property is bound on the north by Interstate 80/294, on the east by Dixie Highway, on the south by 175th Street, and on the west by The Lanco Group of Companies and Community Care Systems, Inc.
As noted earlier, currently, the property is under review for potential redevelopment with proposed uses to include industrial, retail, commercial, hotel, recreational land and aquaponics among other uses noted above. This is pending re-zoning to a mixed-use industrial district either within Cook County or re-annexation into the neighboring village of Hazel Crest. At this stage, development plans are very fluid, however, we have been provided with a proposed site plans that includes various building layout, configurations and areas. This market study will consider the overall proposed plan and research the general market conditions for the various uses and report on findings that include rental and vacancy rates, absorption, supply and demand factors among other financial, demographic and economic considerations. The following chart details the current proposed development and land area along with associated building type and area for the respective improvements.
PROPOSED SITE LAYOUT

separate article from NPR came out just two months prior showing the number of absences teachers had throughout the Chicago public school in 2018-2019. Upon visits to each local school, 99 majority black schools, 45 majority Hispanic, and majority 8 mixed schools reported instructor absences. The slight increase in hirings is a promising look for the future of students learning in the Chicago Public School District. Some of the more prominent changes on the Crains List for 2022 would be Amita Health and United Airlines Holdings INC. Amita Health has shown an increase of 24.2% since 2019 and will continue to grow as nurses and doctors gain more knowledge on the COVID-19 pandemic and feel safer entering health facilities. United Airlines has lost 23.8% in employment since 2019 due to the lack of travel during the pandemic. With travel becoming more prominent again, we should likely see an increase in employment within the next two years.
The top industries by percentage of employment in DuPage County according to the chart above were Manufacturing, Professional/Scientific/Tech Services and Health Care/Social Assistance.
The following table exhibits current and past unemployment rates as obtained from the Bureau of Labor Statistics. Overall, the Region boasts one of the lowest unemployment rates for metropolitan statistical areas in the country at 4.2 percent.
NEIGHBORHOOD MAP
The subject is located in in an unincorporated portion of Cook County, formerly within the village of Homewood in Cook County. As noted earlier, in April of 2021, by direction of the owner, the Homewood Village Board approved disconnecting the property from the village. Therefore, a majority of the property currently is located in unincorporated Cook County, with a small portion at the northwest corner of 175th Street and Dixie Highway falling with the village boundaries of Hazel Crest. For purposes of this analysis, we have provided an overview of Homewood as it most closely represents the socio economic characteristics of the subject property. Location influences from the village of Hazel Crest are also considered in this market study.
Homewood is in Chicago’s south suburbs and part of the greater Chicago MSA, about 21.5 miles south of the Chicago Loop. Surrounding communities include Hazel Crest to the west, Thornton to the east, Flossmoor to the south and Harvey to the north.
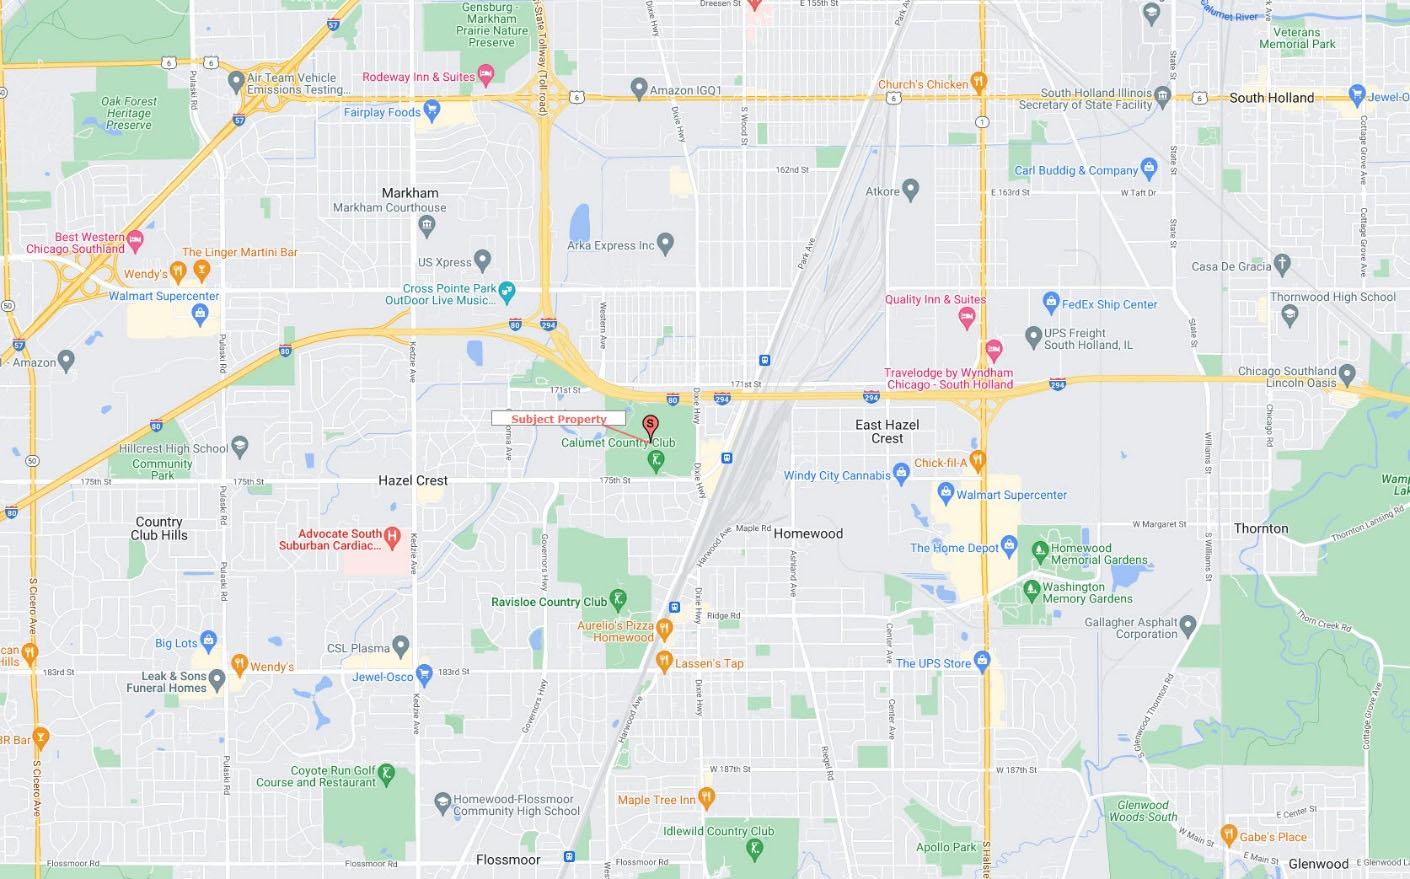
The subject neighborhood is located to the north of Homewood, now within Thornton Township, Cook County, IL. The southeast corner of the site is located in Hazel Crest. The area is suburban in nature. The neighborhood is bounded by Interstate 80 to the north, Dixie Highway to the east, 183rd Street to the south, and Kedzie Avenue to the west.
Within the immediate area of the subject property, transportation access helps define the character of its development. Major east/west traffic routes include Interstate 80, 175th Street, Ridge Road, 183rd Street and 187th Street. North/south routes include Ridge Road, Governor’s Highway and Halsted Street. Metra services Homewood with stations at Calumet, East Hazel Crest, Homewood
Amtrak Station, and Flossmoor. The commute to the Chicago Central Business District is about 20 to 40 minutes, although it may be substantially longer during peak traffic hours. Access to the area is considered good.
No major road improvements are planned for the immediate area surrounding the subject property.
The subject neighborhood is located in an area with primarily residential and industrial land uses. An approximate breakdown of the development in the area is as follows:
Like most suburbs, land uses are mixed with single family being most prominent. Other uses such as multi-family and industrial are scattered throughout as well. Support retail and office uses are primarily located along the main arteries.
The subject property is a large part of the neighborhood which will most likely be changing from open space to industrial and retail use. Although there are plans for redevelopment of the subject parcel, there is little other new construction or change in land uses noted within proximity.
In 2019, the Villages of East Hazel Crest and Homewood were awarded a casino bid. East Hazel Crest and Homewood joined hands on a potential casino in 2012, when they were in the running for a potential license along with Calumet City, Chicago Heights, Country Club Hills, Ford Heights and Lynwood.
The Wind Creek Casino proposed for Homewood and East Hazel Crest would cost $440 million. The proposal is for a 64,000 square-foot casino off of Interstate-80 and Halsted Street.
Along with the casino, which would have 2,000 gaming positions — the number of gambling locations including machines and table games — the casino would have a 13,000-square-foot buffet area and 10,000-square-foot entertainment area, according to the proposal. Two hotels, each with 225 rooms, would be built.
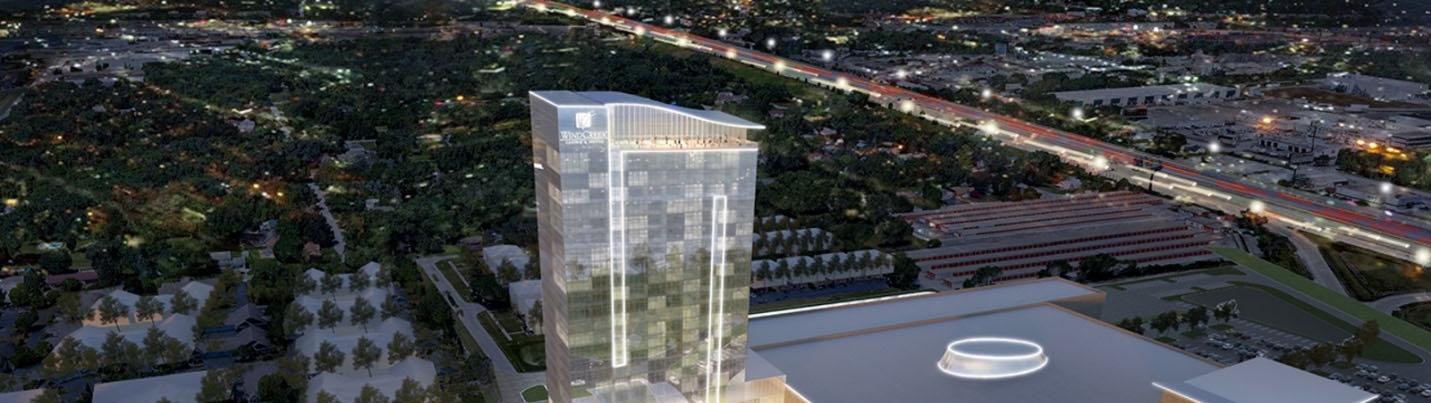
The casino is slated to open in the end of 2023/early 2024, with construction delayed almost a year due to COVID-19 supply chain issues and planning setbacks. The casino will be mostly on East Hazel

Crest land, with a parking garage overflowing into Homewood's property. The construction site is located off of Interstate 80 near Halsted Street and 175th Street.
A revenue sharing agreement would be in place once the casino is built, and the 2019 law that provided a south suburban license calls for the host community and 42 other south suburbs to share in 5% of revenue generated.
In this instance, with two host communities, they would keep 2% of monthly adjusted gross receipts, while another 3% would be shared among 41 other suburbs. The host communities also would get $1 of the $3 admission tax for each person entering the casino.
Wind Creek has estimated that $3 million in tax revenue would flow annually to Homewood and East Hazel Crest, and another $4 million a year to the other communities.
Demographics
The following table depicts the area demographics in Homewood within a one-, three-, and five-mile radius from the subject.
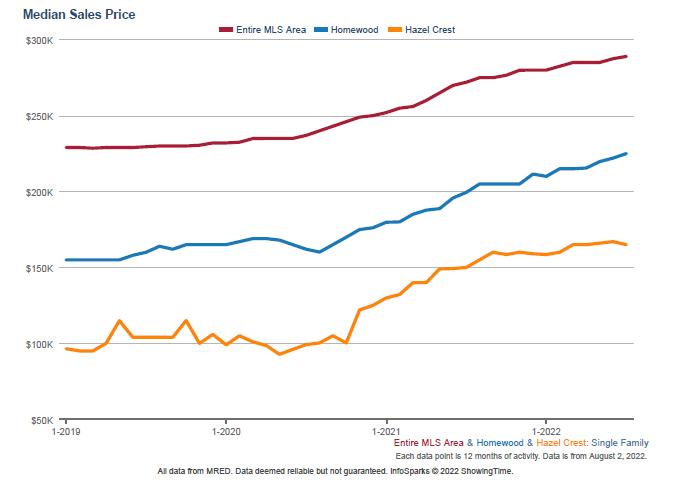
Within a three-mile radius, the reported population is 78,754 with a projected growth rate of approximately -0.6% annually. There are 31,388 housing units within that three-mile radius. The growth rate is expected to be 0.0% annually. Most of the housing is owner-occupied. Our research indicates that property values in the area are stable to increasing.
Within a three-mile radius, the median household income is $70,319. Looking ahead, annual household income growth is projected at 3.4% per year. The average income figures suggest that the inhabitants are within the middle income brackets.
Neighborhood properties have adequate levels of maintenance. No adverse or unfavorable factors were observed.
Most neighborhoods are classified as being in one of four stages: growth, stability, decline, or renewal. Overall, the subject neighborhood is in the stability stage of its life cycle.
The below aerial photo exhibits the uses located in the subject’s immediate vicinity.
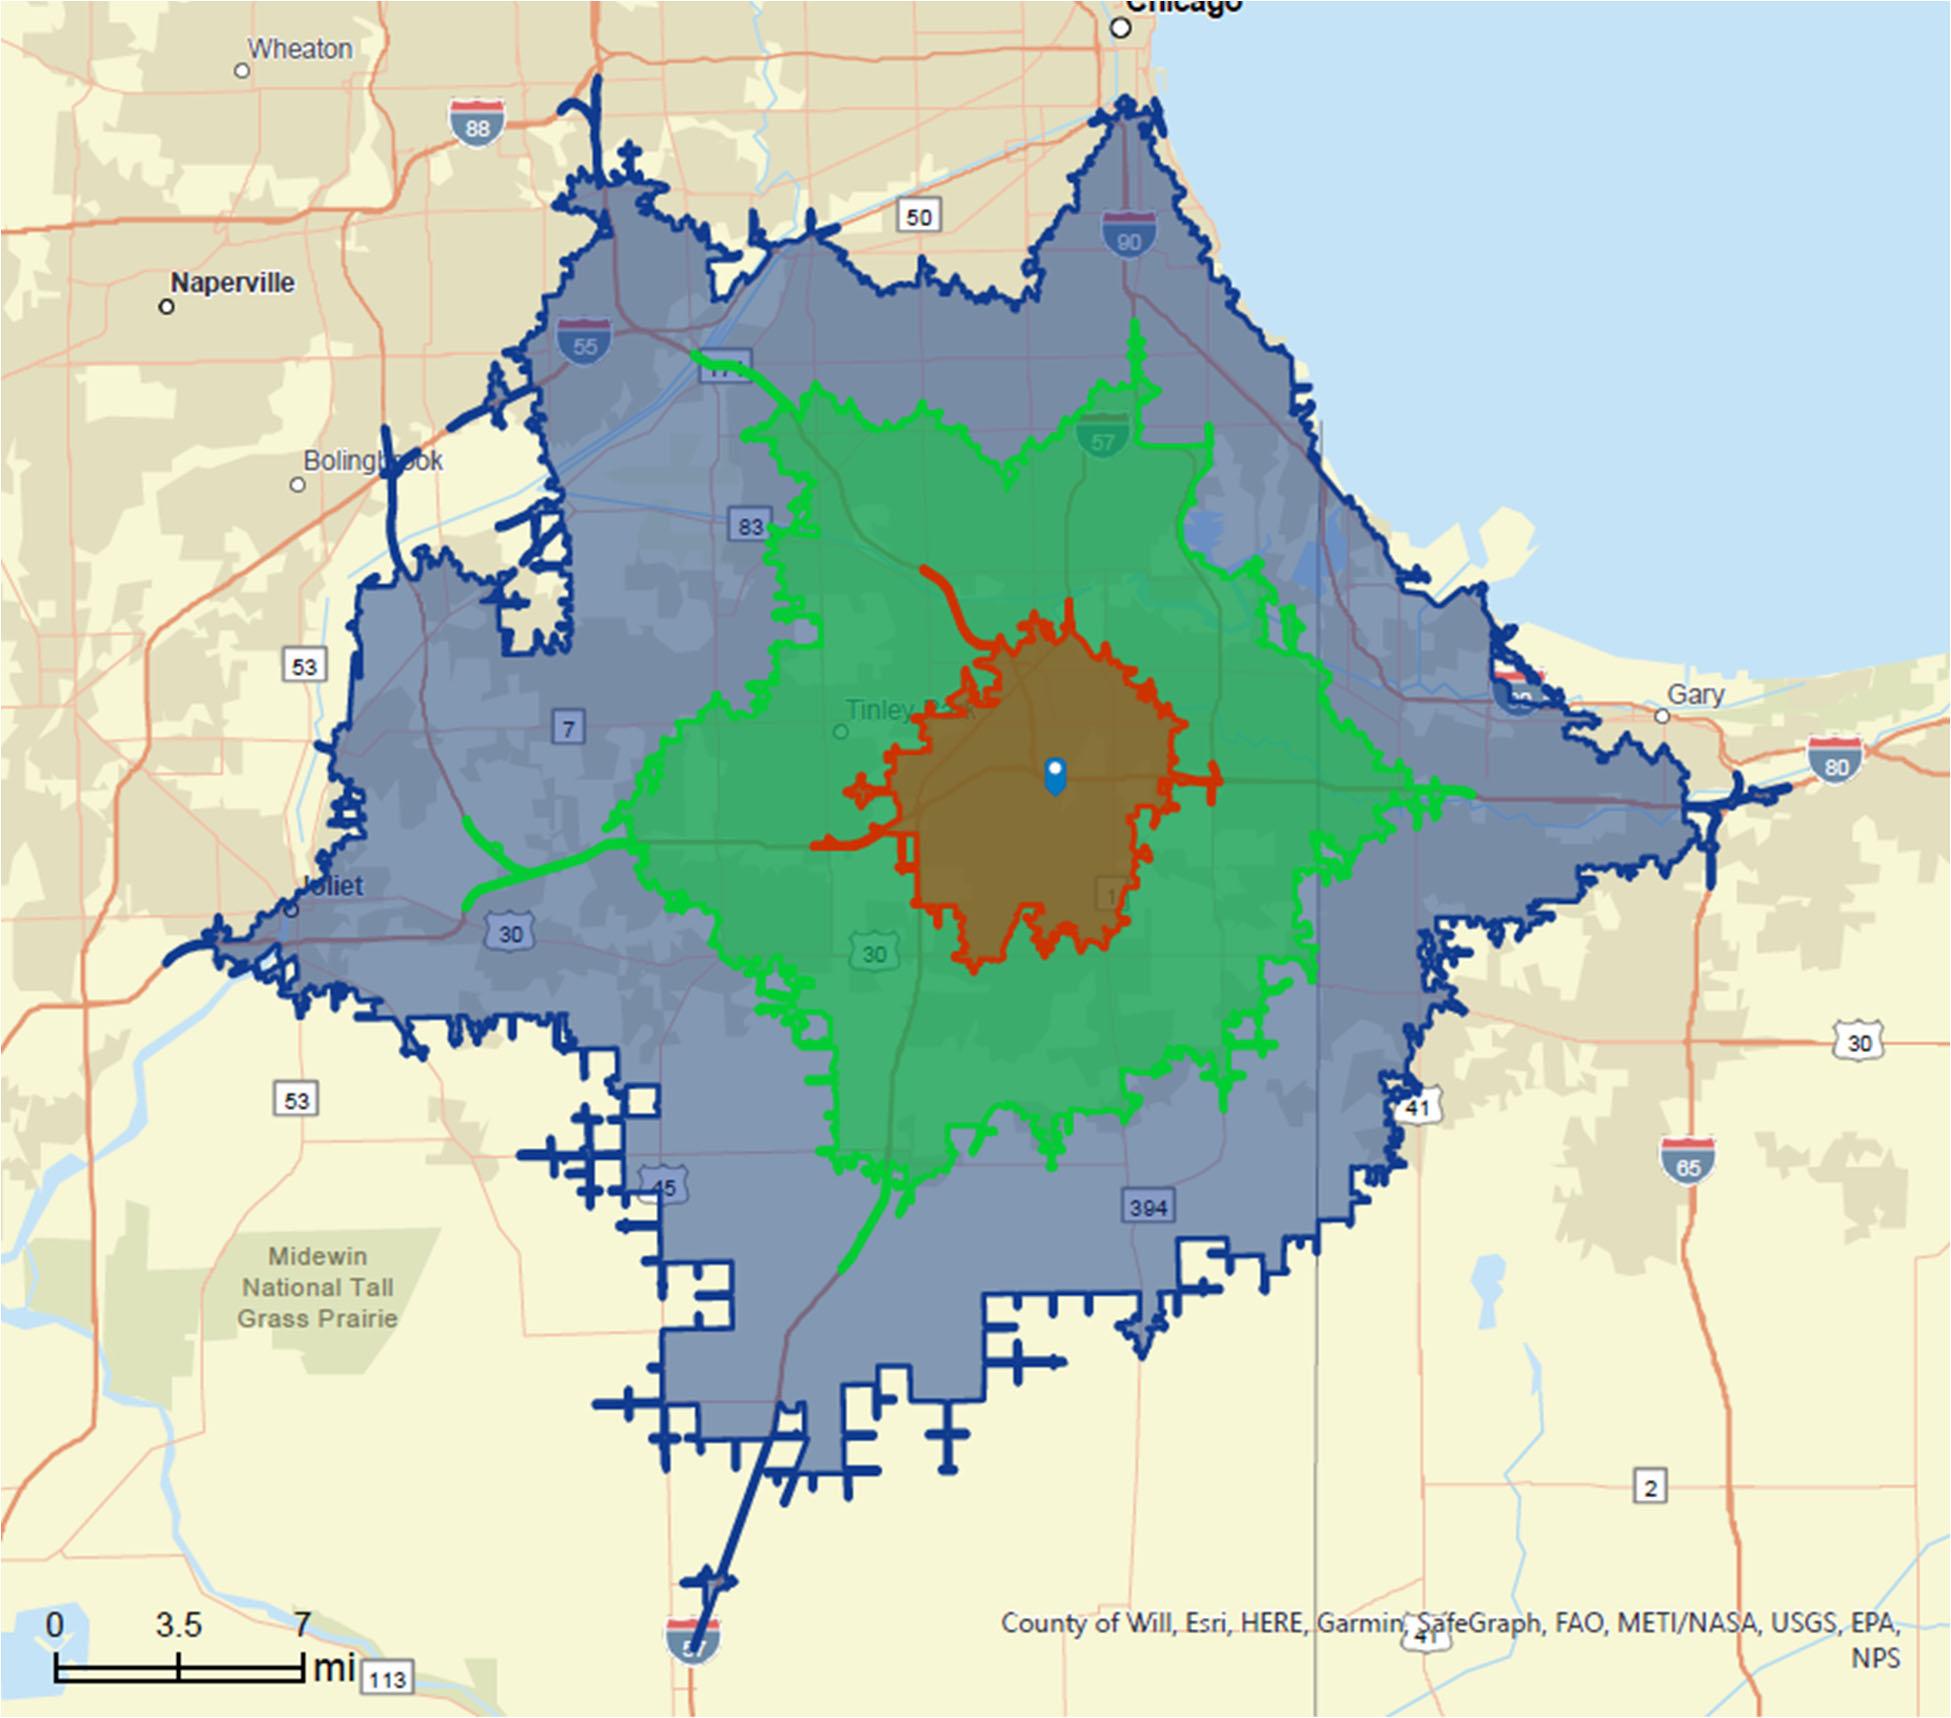
We have defined the subject site’s geographic Primary Market Area (PMA) to be a 20 minute drive time, which includes select portions of Cook County, focusing primarily on those locations within the County which have optimized access and are proximate to a concentration of commercial activity. We believe these areas are an accurate reflection of the current market environment within Cook County,
Given the proximity to several interstates, the Village of Hazel Crest/Homewood still provide the best opportunities for businesses interested in this region of Cook County.
The PMA is generally bounded as follows: Munster, IN to the East, Mokena/Orland Park to the West, Oak Lawn to the North and Steger/Crete to the South.
The subject property is proposed for a mixed use development with multiple uses including industrial, retail, commercial, hotel, aquaponics, sports complex and waterpark. It will draw demand from multiple areas. A large component of the proposed development will include industrial and commercial/retail users. The site is ideal for industrial uses given its excellent linkage with local transportation including I-94, I-80, I-294 and I-57 which connects the site to Chicago to the North, Indiana to the east and the remainder of IL and the Midwest to the south and west. It can be expected that many industrial users would prefer to be located within this area.
Another large component of the proposed subject property is retail/commercial. Many retailers look for sites that are within a 10-20 minute drive time to their customer base. Some of the other proposed uses of the site draw from larger drive times parameters, such as the hotel, entertainment venue, water park and sports complex. However, we are careful not to over extend the PMA boundaries as to cast too wide of a net in estimate local market demographics for which a majority of the subject property will draw. Therefore, we have chosen the 20-minute drive time for purposes of estimating the boundaries of the PMA. Furthermore, the area that encompassed the 20-minute drive time best fits the submarket boundaries of most of the various uses that are proposed for the subject development. Given the site is proposed for a mixed use development with over 5 different uses, we have chosen a PMA that best encompasses the subject for all proposed uses.
Furthermore, Valbridge makes comparison to broad Cook County trends and in the Chicago Metropolitan area in order to understand the near- and long-term development context. Reference is also made to Statewide trends where useful.
Our analysis uses data available from the 2020 U.S. Census and from the Census Bureau’s 2016-2020 American Community Survey. We have consulted current estimates and future projections of population, households and incomes calculated by Environmental Systems Research Institute, Inc. (ESRI), a nationally recognized data provider; the ESRI forecasts incorporate 2020 Census data.
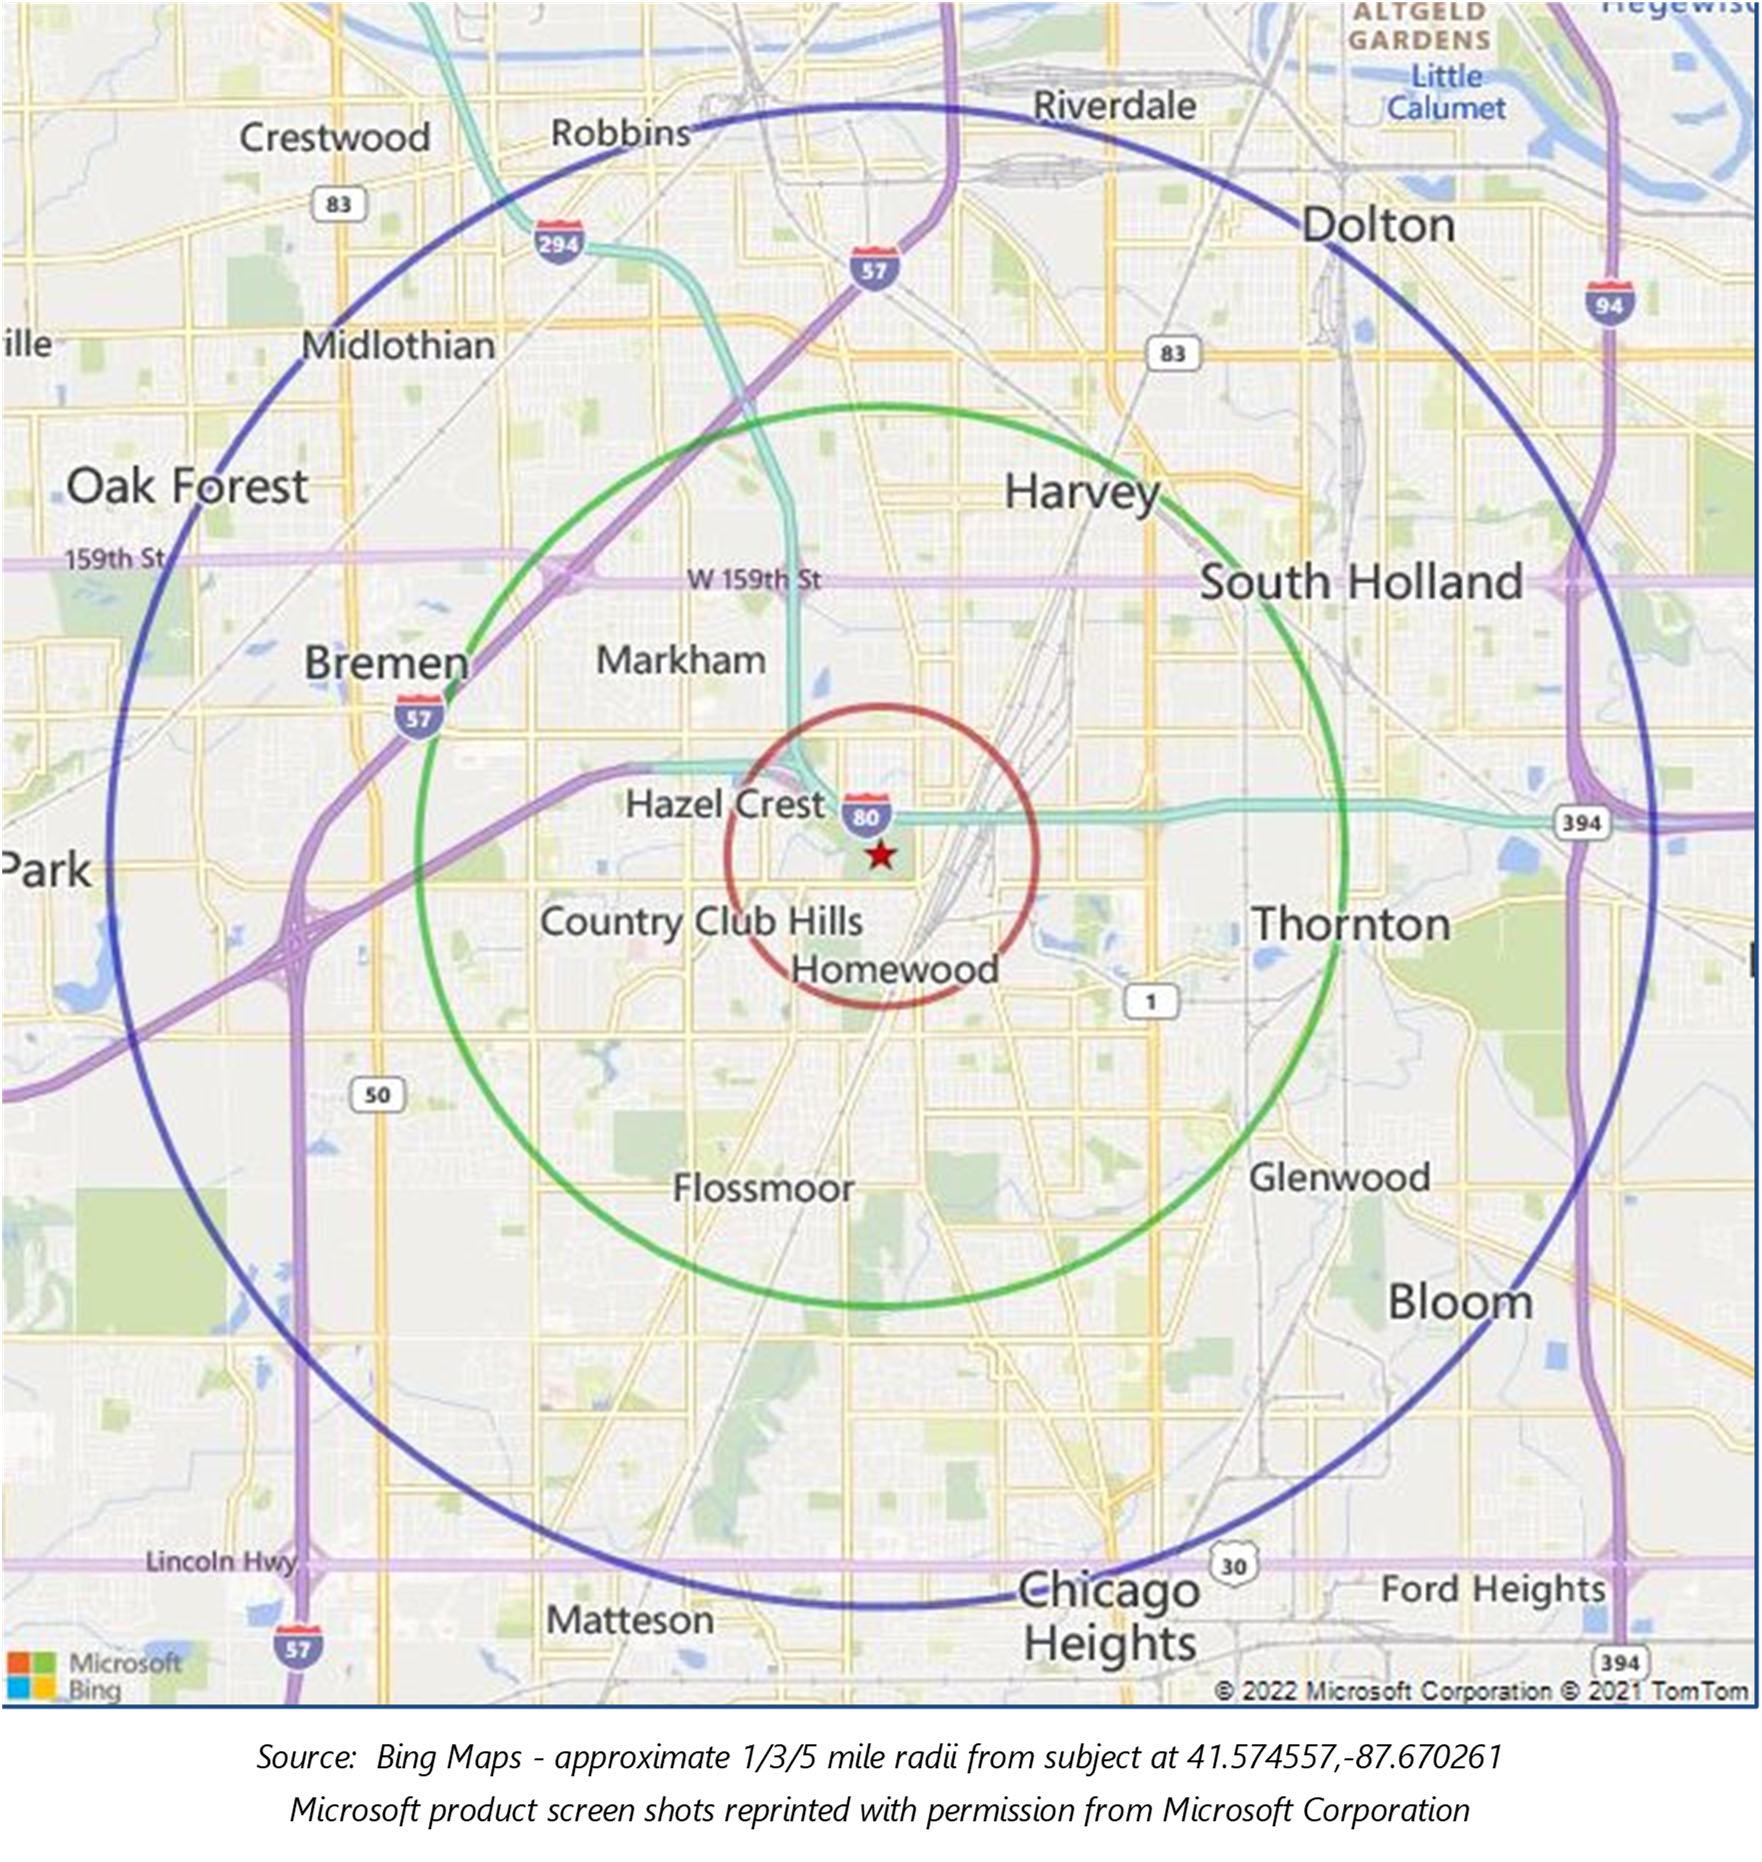
The following map depicts the boundaries of the Subject PMA. The 10-minute drive time is depicted by the red area, the 20-minute drive time is depicted by the green area and the 30-minute drive time is depicted by the blue area.
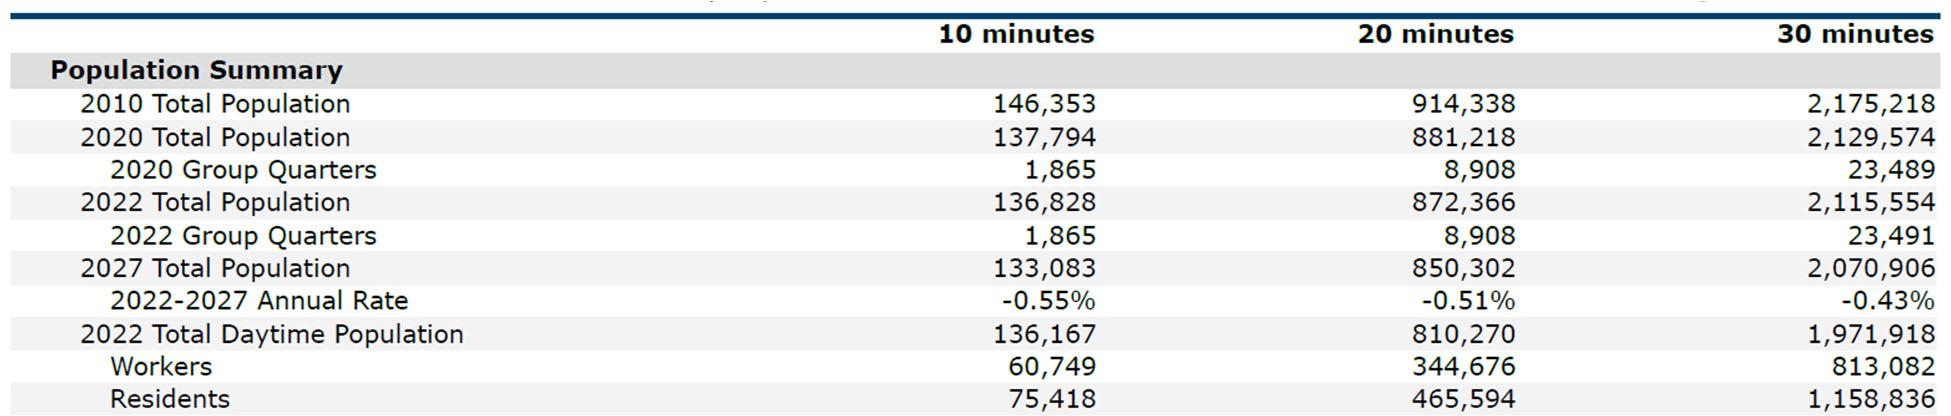
Valbridge uses ESRI projections for population, household and income estimates for 2022 and 2027. These estimates are based upon the 2020 U.S. Census data. It is important to note that the current ESRI demographic projections likely underestimate the overall growth trends within the PMA, since they are not as attuned to the market area and its surroundings as local planning officials and governments. Please note once again, we are focusing on the 20-minute drive time data.
Population and household data developed by ESRI are summarized in the table on the following below.
The total population in 2022 is estimated at 872,366, which is expected to decrease to 850,302 in 2027, indicating an annual rate of change of -0.51%.
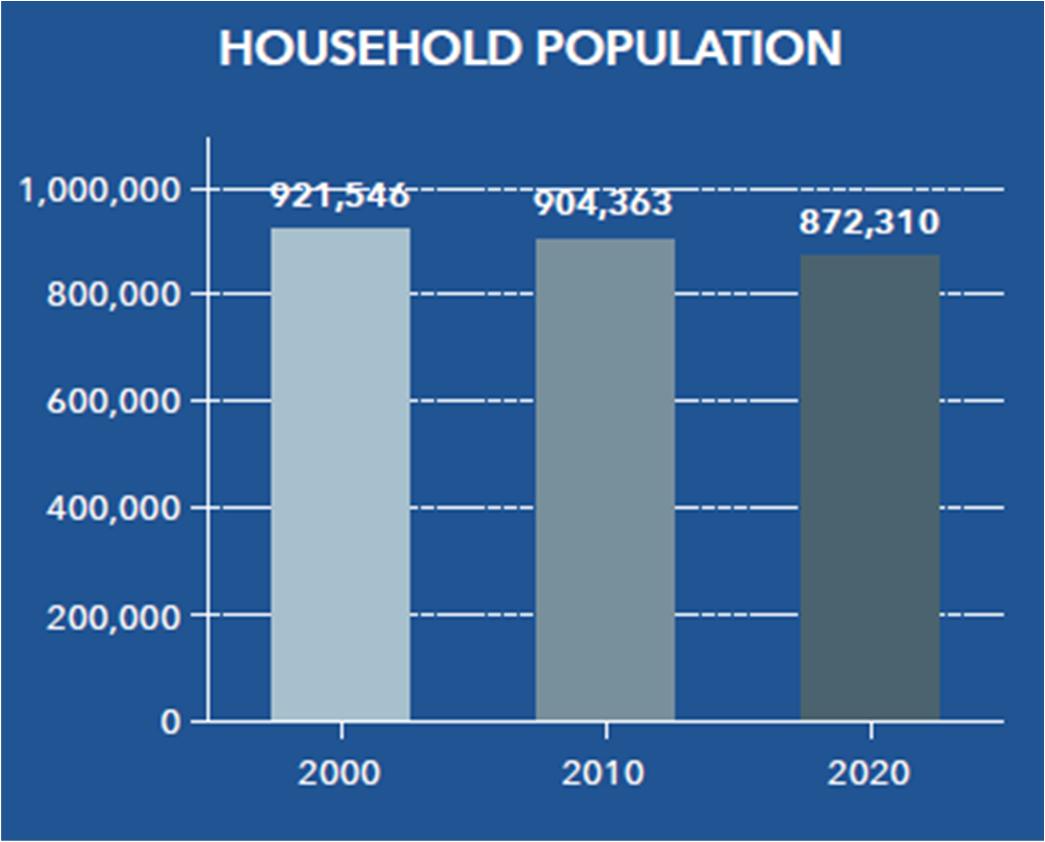
Based on 2020 Census Redistricting Data as seen below, total population in the PMA is down as compared to 2000 and 2010, when it was 921,546 and 904,363, respectively.
As can be seen from the chart above, similar population decreases have been experienced across all aforementioned geographies. The MSA is expected to expereince a decrease in population from 2022 to 2027 at an annual rate of change of -0.24%, while the county is expected to experience a slightly higher decrease with an annual rate of change of -0.41%.
Illinois adopted Tax Increment Financing (TIF) in 1977. A reform to this law was enacted in 1999. Since the first TIF statute was adopted by the State of California in 1952, 49 states have passed legislation authorizing the use of TIF. According to the most recently available data from the Illinois Office of Comptroller (IOC), there may be up to 1,490 TIF districts located in as many as 537 Illinois municipalities.
TIF is a mechanism for municipalities to spur economic development in specific geographic areas that are blighted and deteriorating. To do this, local taxing bodies create a TIF redevelopment project area, or TIF district, whereby the Equalized Assessed Value (EAV) of the property in the area is set at a base amount. Property taxes collected on properties included in the TIF district at the time of its designation continue to be distributed to the school districts and all other affected taxing districts in the same manner as if the district did not exist. Establishment of a TIF does not reduce property tax revenues available to the overlapping taxing bodies.
A tax increment is the difference between the amount of property tax revenue generated before TIF district designation and the amount of property tax revenue generated after TIF designation. Only property taxes generated by the incremental increase in the EAV of these properties after that time are available for use in the TIF district by a municipality.
In order to establish a TIF district, a local government must find that development or redevelopment of the area would not occur “but for” the creation and use of TIF. Illinois law specifies a number of requirements that must be satisfied for an area to qualify as a TIF district, beginning with identifying the district and the physical and economic deficiencies that need to be cured. Specifically, state law requires that the proposed area must meet one or more of three conditions:
1. Blighted conditions;
2. Conservation conditions; and,
3. Industrial park conservation conditions.
If one or more of these conditions is identified, municipal officials and a Joint Review Board, made up of representatives from affected local taxing bodies, must review a plan for the redevelopment of the TIF area. A public hearing must be held where residents and other interested parties can express their thoughts on the subject. If the plan for redevelopment is approved by the Joint Review Board, the municipality may adopt the plan by a majority vote of the corporate authorities. If the Joint Review Board rejects the plan for redevelopment, the municipality may proceed but the plan must be approved by a three-fifths vote of the corporate authorities. Finally, the mayor or village president will sign the ordinance into law. No state or federal approval is required for creation.
The growth of the EAV of property within the TIF district (the increment) is collected into a special fund for use by the municipality to make additional eligible investments in the TIF project areas. The reinvestment generates additional growth in property value, which results in more revenue growth for reinvestment. Once a redevelopment project is completed and has been paid for, the TIF district may be dissolved and the tax base returned to full use by all eligible taxing bodies.
Under Illinois law, a TIF district may last for up to a maximum of 23 years. This period can be extended by 12 additional years upon approval by the Illinois General Assembly. In some cases, the General Assembly has extended TIF districts twice, for a total of 47 years. Municipalities seeking extensions must receive approval from the General Assembly, which requires, by rule, letters of support from overlapping units of local government whose boundaries fall within the TIF district.
TIFs are more frequently used now because other development tools, like Industrial Revenue Bonds and Urban Development and Infrastructure Grants, are no longer readily available to local governments.
Federal and state aid to local governments has been reduced. At the same time, unfunded federal and state mandates have increased the financial burden on most municipalities. Factor in state imposed property tax caps, and the funding problems facing local governments make it obvious that local governments are left to do more with less.
TIF offers local governments a resource to revitalize their communities by expanding their tax base, offsetting, in part, the federal and state funds that are no longer available to them without imposing increased taxes on the whole community.
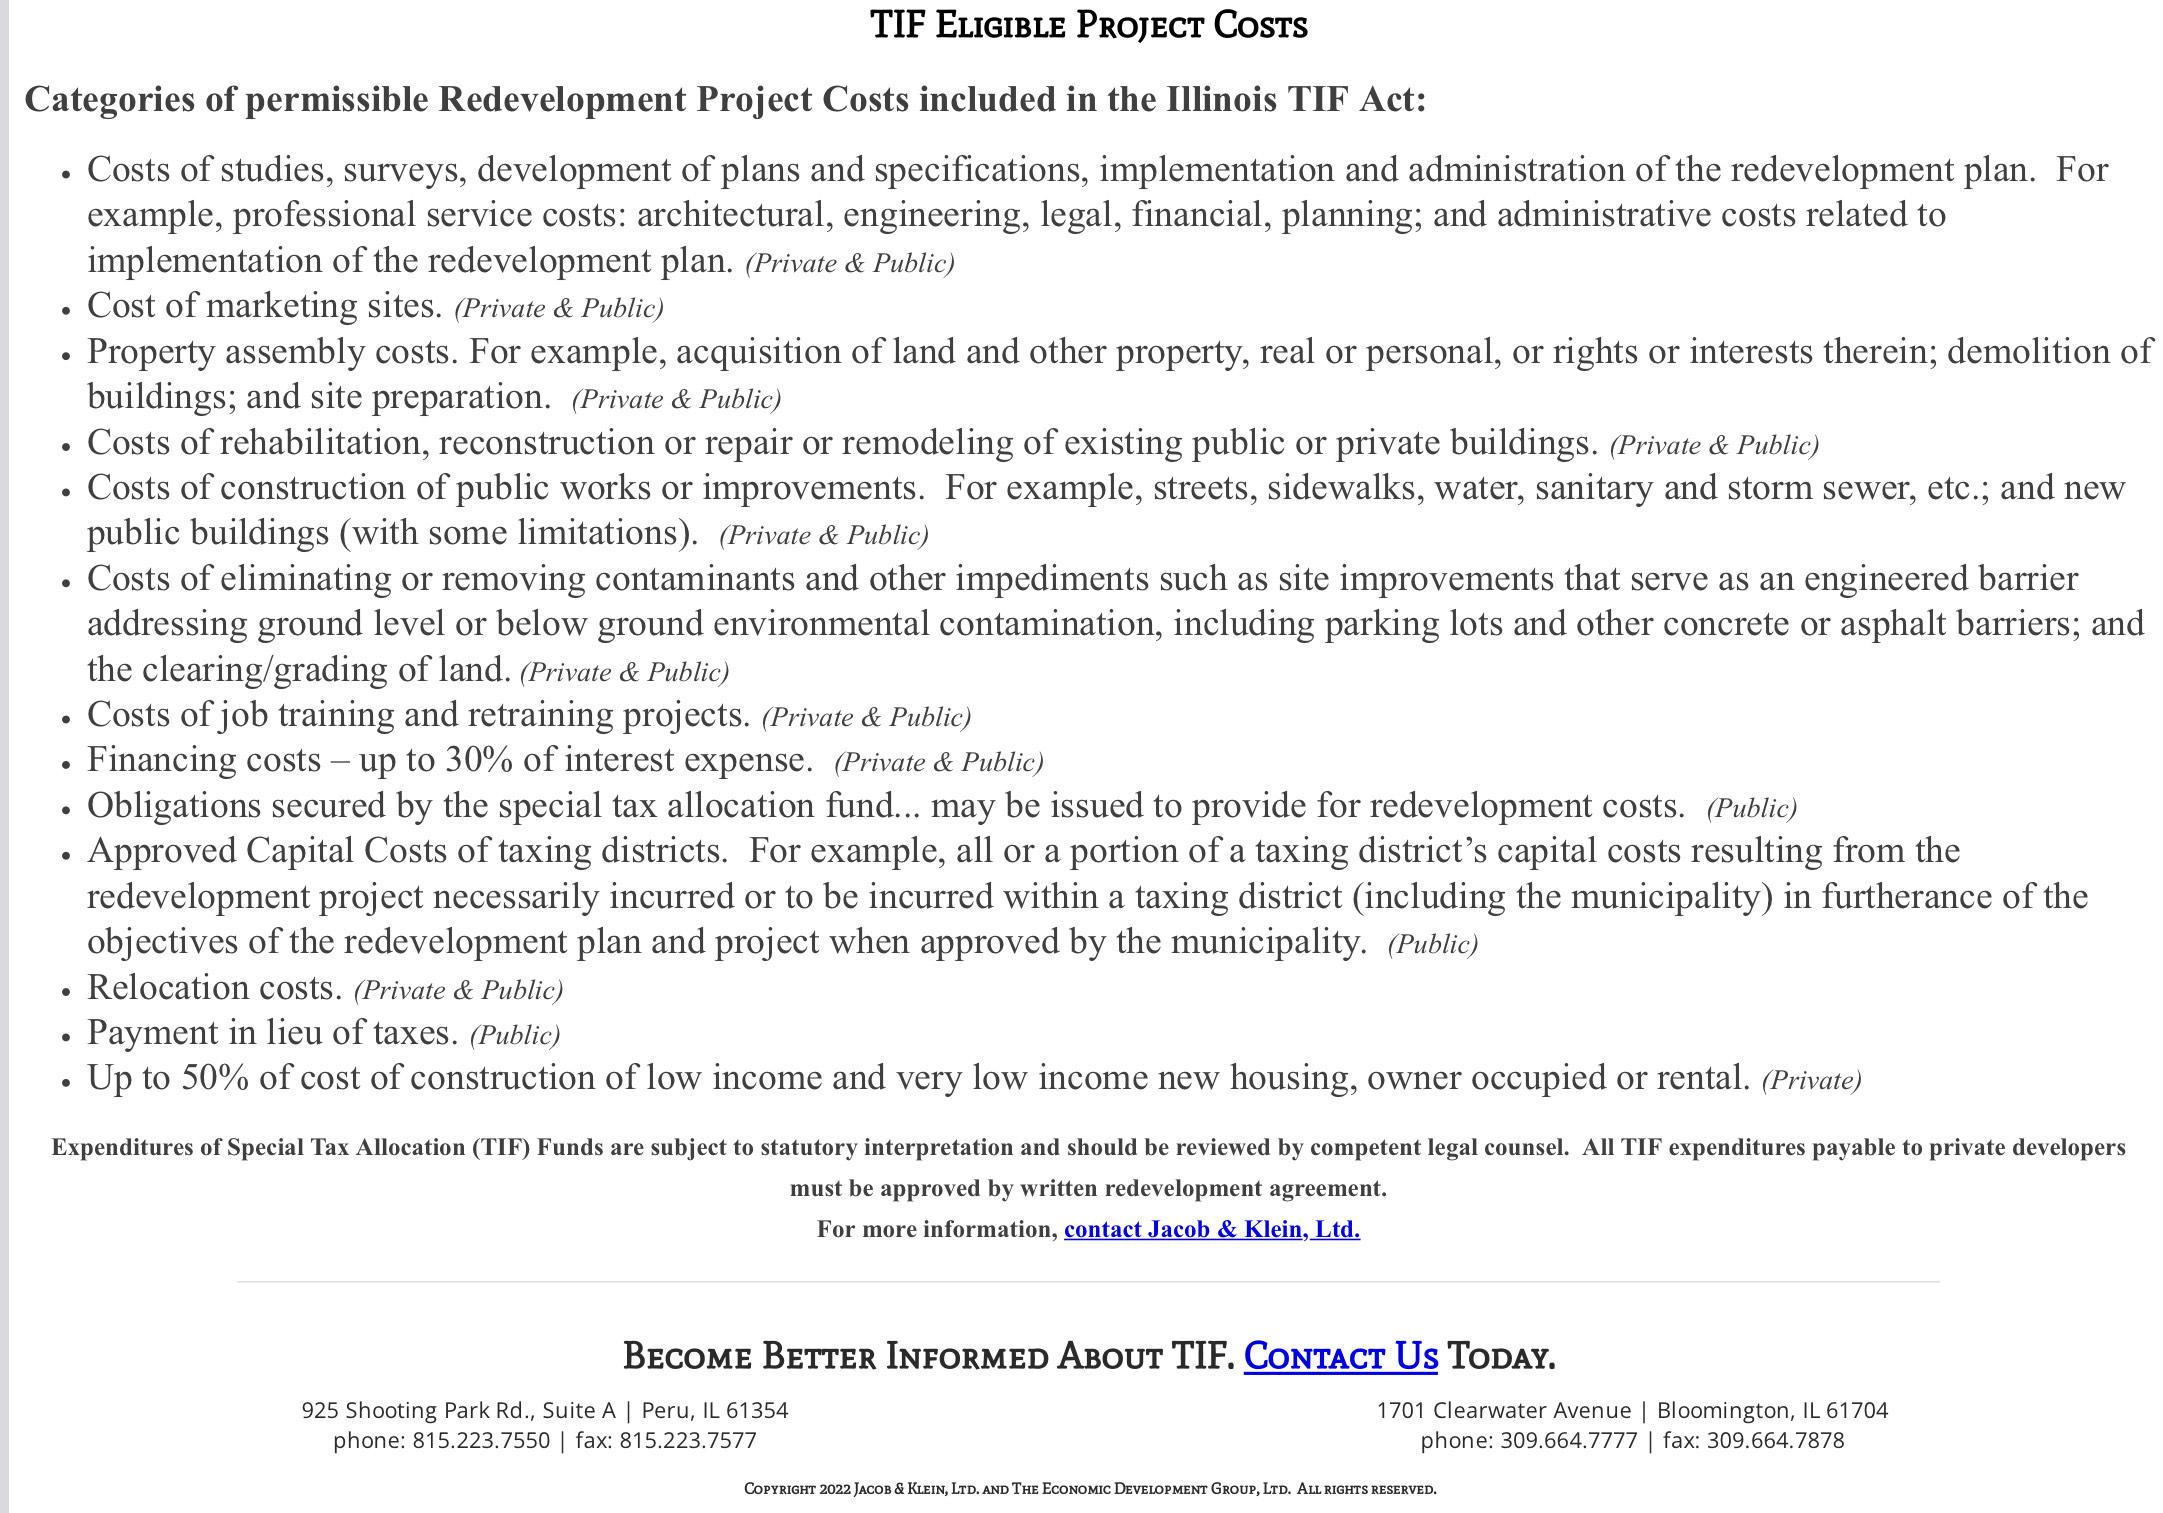
TIF funds may be used to reimburse eligible “redevelopment projects costs” as defined in the Act.1 The statute provides a comprehensive list of associated project and reimbursement costs which may include, but are not limited to, the following actions occurring within the TIF district:
• Administration of a TIF redevelopment project;
• Property acquisition, renovation, rehabilitation and demolition;
• Construction of public works or improvements;
• Job training related to the TIF area;
• Financing costs, including interest assistance;
• Studies, surveys and plans;
• Marketing related to sites within the TIF; and,
• Professional services, such as architecture and design services.
1 65 ILCS 5/11-74.4-3(q).
Illinois Municipal League | Tax Increment Financing

The TIF Act provides that any portion of an annual ending balance of a TIF fund that has not been identified (or is not identified as being required, pledged, earmarked or otherwise designated for payment or securing of obligations or anticipated redevelopment project costs) shall be designated as surplus. (Section 11-74.4-7)
The Act also provides for the distribution of surplus funds annually, within 180 days after the close of a municipality’s fiscal year. Surplus funds are paid by the municipal treasurer to the county collector, the Illinois Department of Revenue (IDOR) and to the municipality in direct proportion to the incremental tax revenue received. The county treasurer is then required to make distributions to the respective taxing districts.
The Act currently requires TIF municipalities to submit a report to IOC, and all taxing districts overlapping the redevelopment project area, no later than 180 days after the close of each municipal fiscal year detailing information about a TIF district. The report must include, but is not limited to, an analysis of the special tax allocation fund, a statement setting forth all activities undertaken in furtherance of the objectives of a TIF District Redevelopment Plan, a legal opinion that the municipality is in compliance with the TIF Act and any amendments to the redevelopment plan.
On May 28, 2021, the General Assembly passed HB 571 (Rep. Carroll, D-Northbrook/Sen. Gillespie, D-Arlington Heights). This legislation amends the TIF Act and expands mandated reporting requirements to include a comparison between the original projected increment and jobs for the TIF district, the actual amount of increment and jobs created to date, and an update on the stated rate of return for a development and the actual debt service on any notes issued by the municipality. In addition, HB 571 authorizes municipalities to select a consultant to provide an analysis of the projected increment and the actual debt service on any notes issued by the municipality. The Illinois Municipal League (IML) opposed the legislation as an unfunded mandate.
IML and numerous local elected officials, as well as the General Assembly – shown through its continued actions granting and extending TIF designations – firmly believe in the value of TIF as a mechanism to spur economic development in communities across the state.
While IML will not advocate for proposals that would be harmful to or reduce the effectiveness of TIF, we remain committed to serving as a partner with and all stakeholders in improving and addressing perceived issues with the TIF Act. iml.org
program that allocates future increases in property taxes from a designated area, or TIF district, to pay for improvements within that area. In Illinois, the TIF district can remain in place for up to 23 years after its creation. The district can be extended for another 12 years, but an extension requires an act of the state legislature. Other states’ laws regarding TIF vary, but the key principles are similar across the country.
Normally, property is taxed by several different governmental jurisdictions: the municipality (City or Village), School District, County, Park District, Water Reclamation District, etc. The taxes levied are allocated to each district in accordance with its tax rate. (In this document, we refer to the municipality as the City, but it also applies to Villages).
Under TIF, the property taxes resulting from increased value due to new development, rehabilitation or improvement, property appreciation, equalization, or rate changes are all allocated to the City. Other jurisdictions continue to receive the property taxes generated by the base value of properties in the district.
All properties in the district are assessed in the same manner as all other properties and taxed at the same rate. TIF is not an increase in taxes. It is only a re-allocation of how they are used. Increases in property taxes experienced by property owners are due to reassessment and rate increases, not TIF.
The rationale for TIF is that only the City has the responsibility and authority to support redevelopment and, more broadly, economic development. All taxing bodies benefit in the long run from the City’s activities. It is, therefore, appropriate to utilize “their taxes” to help pay for costs necessary to bring about redevelopment from which the entire City will benefit. Since only the City can incur those costs, it is fair to re-allocate those tax dollars for the use of the City for a redevelopment project.
Illinois law provides for three different potential types of eligibility analyses that could result in an area being deemed eligible for designation as a TIF district:
1. Improved land
2. Vacant Land
3. Industrial Park Conservation Area & Jobs Recovery Act Eligibilities
If an area is improved, it can qualify for TIF eligibility in one of two ways:
Conservation Area. In this finding, over 50% of buildings within the area must be 35 years old or older, AND three (3) or more eligibility factors from the list below must be found to be present to a meaningful extent and reasonably distributed through the area:
• Dilapidation
• Obsolescence
• Deterioration
• Presence of structures below minimum code standards
• Illegal use of structures
• Excessive vacancy
• Lack of ventilation, light or sanitary facilities
• Inadequate utilities
• Excessive land coverage and overcrowding of structures and community facilities
• Deleterious land use or layout
• Environmental clean-up
• Lack of community planning
• Lack of growth in EAV
Blighted Area. In this finding, five (5) or more of the eligibility factors listed above must be found to be present to a meaningful extent and reasonably distributed throughout the area.
There are two ways to qualify vacant land for TIF eligibility: the two-factor test or one-factor test.
Two-Factor Test. One way is to find that at least two (2) of the following six (6) factors are present to a meaningful extent and reasonably distributed throughout the study area:
• Obsolete platting
• Diversity of ownership
• Tax and special assessment delinquencies
• Deterioration of structures or site improvements in areas adjacent to vacant land
• Environmental issues
• Lack of growth in EAV
One-Factor Test. Vacant land may also qualify if the area meets one of the following criteria:
• Contains unused quarries, strip mines, or strip mine ponds
• Contains unused rail yards, rail tracks, or railroad rightsof-way
• Is subject to chronic flooding that adversely impacts real property or discharges water that contributes to flooding within the watershed (In order to consider this factor, the redevelopment project must provide for facility improvements that will contribute to the alleviation of all or part of the flooding)
• Contains unused or illegal dumping sites
• Was designated as a town center prior to January 1, 1982, is between 50 and 100 acres in size, and is 75% vacant land
• Qualified as blighted prior to becoming vacant
These two approaches are much less frequently utilized and are used only to designate industrial park TIF districts. They rely on findings regarding unemployment and inadequate infrastructure levels, vacant buildings, or environmentally contaminated sites.
These types of TIF districts only allow for industrial development and thus are rather limiting from a future land use perspective.
In addition to meeting the eligibility standards outlined above, to create a TIF district, the following tests must also be passed:
1. Lack of Growth & Development through Investment by Private Enterprise. This is a backward-looking finding that the area has not been subject to prior growth via private investment.
2. “But for” TIF, the study area “would not reasonably be anticipated to be developed.”
3. Contiguity. A finding must be made that only those contiguous parcels of real property that are expected to benefit substantially from the TIF district are included in the district boundary.
4. Conformance to the Plans of the Municipality. The future land use plan for a TIF district must conform to the comprehensive plan or other land use plans or regulations for a City. TIF plans are not permitted to be used to make new land use policy.
5. Housing Impact Study. If the redevelopment plan would result in the displacement of residents from 10 or more inhabited residential units, or if the redevelopment project area contains 75 or more inhabited residential units, and no municipal certification that displacement will not occur is made, then a housing impact study is required.
The review considerations for supporting a public project, such as a park, streetscape or other public capital project, are relatively simple.
1. Are there sufficient TIF funds available or projected to be available to pay for the project?
2. Does the proposed project support the goals and objective of the TIF plan?
For projects that are driven by private sector developers or business owners, providing public TIF funding should be considered an extraordinary intervention in the largely privately-driven real estate market. Accordingly, such interventions are worthy of a good deal of scrutiny, and any agreement to financially support a private project must be structured carefully to provide the City with reasonable protections and assurances regarding outcomes. We recommend that projects requesting City TIF assistance be reviewed in the following ways:
Project Feasibility Review – Before getting too far into detailed financial and legal work, some level of market and/ or other higher-level feasibility testing may be warranted. Assuming the project passes this initial test, further research and analyses may be desired.
Public Benefit – This analysis is crucial because an inability to get private financing does not necessarily mean a project warrants TIF funding. The core question here is: “What is the benefit that the City is receiving that warrants an extraordinary intervention?” Public benefits can include bringing a contaminated site back into productive use, employment growth, and tax base growth, among others.
Eligible/Extraordinary Costs – State law only allows for certain types of costs to be paid for with TIF funds. A close inspection of the project budget is required to ensure that the City is reimbursing for legally allowed costs.
Gap Analysis – Assuming a project is providing sufficient public benefits to potentially warrant TIF funding, a detailed review of the project’s financials is recommended. Examinations of projected revenues, costs, absorption pace, financing plan and other key elements of the project are necessary to determine whether the project needs TIF money to achieve a market-level return for the developer. By subjecting the project’s financial projections to close scrutiny, the City also demonstrates to taxpayers and other taxing bodies that they are careful stewards of these funds and seek to use TIF only when the project legitimately requires assistance.
TIF Revenue Projections – In addition to validating the need for assistance, a City should also assess whether there will be sufficient revenues to provide the required assistance. Revenue projections based on market-validated comparable assessments and absorption levels provide a sense of the scale of potential assistance.
Balancing Risk and Structuring Deals – Once the level of assistance has been negotiated based on the work conducted above, the form, timing and terms of that assistance must be negotiated. For example, in this process, cities often introduce “go dark” provisions; if a project stops operating within a certain period of time, the TIF payments can be stopped and prior payments can be recaptured.
If, in the course of reviewing the project’s pro forma, it is determined that TIF bonds are required by the developer and/ or desirable for the City, additional research regarding revenue projections will be required. Refined TIF revenue projections along with substantial supporting documentation must be prepared to make the bonds saleable both legally and from a market perspective.
TIF payments must be made as reimbursements for costs already incurred. Documentation of costs incurred and paid must be submitted and approved before releasing TIF funds. In addition, state law requires cities to prepare regular reports on TIF districts to help ensure that adequate public scrutiny is given to these funds.
It is common practice for a City to review the documentation regarding TIF-eligible costs prior to making a payment. Documentation of project costs often includes:
1. Lien waivers for lienable costs such as hard construction costs
2. Copies of invoices and canceled checks for non-lienable costs (soft costs)
3. Transfer tax documents for land purchases
4. Interest cost statements from lenders
Some cities require a total investment amount as a part of their agreement(s) with developers. That figure can often be verified by reviewing an Owner’s Sworn Statement in concert with other documents.
A close review of these documents ensures that a City is only reimbursing for costs that were incurred at the right time, in the right location, and used for legally allowable purposes. Again, close scrutiny of these issues can help show the care with which a City is utilizing TIF funds.
In addition to reviewing project costs to be sure that TIF funds are being spent legally, Illinois state law requires that cities generate reports to explain the activities occurring within a TIF district to other taxing bodies and the public. There are two major types of reports that must be generated:
1. Annual Reports – These reports are generated within a template provided by the State Office of the Comptroller. They provide a summary-level reporting of revenues and expenses for the most recent year and cumulatively since the creation of the TIF district. These reports must be completed prior to the annual Joint Review Board Meeting, also required by state law.
2. 10-Year Status Reports – Illinois law also requires cities to provide a status report after a TIF district has been in place for 10 years. State law provides general guidance in terms of report content. However, these reports are much more narrative in nature and can vary from one TIF district to another. For an example of a 10-Year Status Report completed for the City of Chicago, please visit: http://bit.ly/K7309A.
Tax Increment Financing (TIF) is a powerful tool that allows municipalities to make targeted investments to help spur economic development. The right combination of experience and expertise is essential to ensure that TIF districts are created and managed in accordance with applicable state statutes and maximize the public benefits of investing property tax dollars in public and private projects. In addition, following best practices in eligibility analysis and reporting can help ensure that public funds are well-managed and increase public confidence in municipalities’ TIF programs. Enabling legislation requires a variety of findings when establishing a district, defines eligible costs that can be funded with TIF money, and requires ongoing reporting and compliance to help ensure transparency and accountability to taxpayers and other taxing bodies.
A well-managed TIF program can help certain communities spur development and/or redevelopment while being sensitive to legal and public policy concerns of other local stakeholders.
Note: This document is only a brief summary of the requirements and conditions for Tax Increment Financing. The full text, including recent reforms, of the Illinois Tax Increment Allocation Redevelopment Act, 65 ILCS 5/11-74.4-1, can be found online at: http://bit.ly/1ghRAuP | http://bit.ly/K74f8B
The full text of the Industrial Jobs Recovery Law can be found online at: http://bit.ly/1dgCDek
For more information on Tax Increment Financing and/or TIF consulting services, please contact SB Friedman Development Advisors at (312) 424-4250 or info@sbfriedman.com
Heavy-duty trucks and buses drive American commerce and connect people across the country. Creating cleaner trucks is an economic opportunity to support jobs and make more efficient vehicles while reducing harmful pollution. Heavy-duty trucks and buses continue to contribute significantly to air pollution at the local, regional, and national level, often disproportionally affecting communities of color and low-income populations. As identified in President Biden’s Executive Order 14037, Strengthening American Leadership in Clean Cars and Trucks, EPA intends to issue a series of regulations over the next three years to reduce pollution from trucks and buses and to advance the transition to a zero-emissions transportation future. EPA’s “Clean Trucks Plan” would result in significant emissions reductions from new medium- and heavy-duty vehicles and will be major steps towards improving air quality and addressing the climate crisis.
The regulatory actions that make up the Clean Trucks Plan are as follows:
• Setting stronger nitrogen oxide (NOx) standards for heavy duty trucks beginning in model year (MY) 2027 and tightening the “Phase 2” greenhouse gas (GHG) emissions for MY 2027 and beyond. This fact sheet provides an overview of the proposal to address this first action.
• Setting stronger emissions standards for medium-duty commercial vehicles for MY 2027 and later. These revised standards will be proposed in combination with new standards for light-duty vehicles for MY 2027 and beyond.
• Setting “Phase 3” GHG standards for heavy-duty vehicles beginning as soon as MY 2030 that are significantly stronger than the MY 2027 GHG standards.
In developing these actions EPA is applying its Clean Air Act authority, which allows the Agency to maximize NOx and GHG emissions reductions over the short and long terms, which will promote the path to a zero-emissions transportation future.
This action, titled, Control of Air Pollution from New Motor Vehicles: Heavy-Duty Engine and Vehicle Standards, proposes stronger NOx and GHG standards to reduce pollution
from heavy-duty vehicles and engines starting in MY 2027. The proposed standards would significantly reduce emissions of NOx from heavy-duty gasoline and diesel engines and set stronger GHG standards for certain heavy-duty vehicle categories. This proposed rule would ensure heavy-duty vehicles and engines are as clean as possible while helping jump-start the transition to zero-emission vehicles in the heavy-duty fleet.
EPA last revised the NOx standards for on-highway heavy-duty trucks and engines in 2001—more than 20 years ago. Although those standards achieved important NOx reductions, new technologies that are an evolution of those available today can help achieve the additional reductions we need to improve air quality and health in our communities.
EPA intends to finalize this proposal before the end of 2022.
Emissions from heavy-duty vehicles contribute to poor air quality and health across the country, especially in overburdened and underserved communities. Without further reductions, heavy-duty vehicles will continue to be one of the largest contributors to mobile source emissions of NOx, which react in the atmosphere to form ozone and particulate matter. Heavy-duty vehicles would contribute 32 percent of the mobile source NOx emissions, and 89 percent of onroad NOx emissions, in calendar year 2045. These pollutants are linked to respiratory and/or cardiovascular problems and other adverse health impacts that lead to hospital admissions, emergency department visits, and premature deaths.
Pollution from trucks directly affects people who live near roads and other areas of high truck activity like ports. Populations who live, work, or go to school near high-traffic roadways experience higher rates of numerous adverse health effects. EPA has estimated that 72 million people live within 200 meters of a truck freight route, and relative to the rest of the population, people of color and those with lower incomes are more likely to live near truck routes. NOx pollution from heavy-duty vehicles also impairs visibility and causes damage to terrestrial and aquatic ecosystems.
Sources: MOVES3 for onroad and nonroad and 2016 Emissions Modeling Platform for all other mobile sectors.
Transportation is the largest source of GHG emissions in the United States, making up 29 percent of all emissions. Within the transportation sector, heavy-duty vehicles are the second-largest contributor, at 23 percent. Reducing GHG emissions is a critical step in reducing the probability of impacts from climate change, including heat waves, drought, sea level rise, extreme climate and weather events, coastal flooding, and wildfires. Some populations may be especially vulnerable to damages associated with climate change, such as the very young, the elderly, low-income people, the disabled, people of color, and indigenous populations.
Source: “Inventory of U.S. Greenhouse Gas Emissions and Sinks: 1990-2019,” EPA 430-R-21-005.
EPA’s goal is to deliver significant and needed public health benefits by designing a program that sets ambitious standards and that is feasible for the trucking industry, after giving appropriate consideration to cost and other factors. Under the proposal, NOx emissions from the in-use fleet of heavy-duty trucks would be reduced by as much as 60 percent in 2045 and would result in widespread air quality improvements across the U.S., especially in areas already overburdened by air pollution and diesel emissions. Reducing these emissions will provide cleaner air for communities across the country, prevent health issues like asthma, and ultimately save money, lives, and trips to the hospital.
The present value of the stream of health-related benefits for the years 2027 through 2045 for the most robust proposed option would be as much as $250 billion dollars, assuming a 3 percent discount rate. EPA estimates that in 2045, the most robust proposed option would result in public health benefits by preventing the following (annually):
• Between 860 and 2,100 premature deaths
• 6,700 hospital admissions and emergency department visits
• 18,000 cases of asthma onset in children
• 3.1 million cases of asthma symptoms and allergic rhinitis symptoms
• 78,000 lost days of work
• 1.1 million lost school days
The benefits of the proposed rule would exceed its costs by billions of dollars.
This proposed rule would reduce NOx from heavy-duty vehicles over a wide range of operating conditions, with significant emissions reductions at low speeds, idling, and in stop-and-go traffic. EPA is proposing longer useful life periods to ensure engines would meet emission standards for more of their operational lives and prompt engine manufacturers to design and build durable engines and emission controls. EPA is also proposing longer emissions warranty periods which would increase the number of useful life miles covered under warranty. Longer warranty periods may make it less likely for owners to tamper with emissions controls, and more likely that owners will make needed repairs.
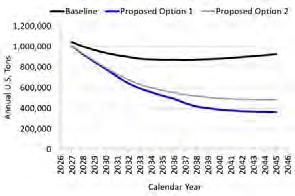
EPA is proposing two regulatory options and is requesting comment on both, as well as considering the full range of options between them. Both options would set stronger standards for NOx emissions beginning in MY 2027, increase regulatory useful life, and increase emissions-related warranty periods. Proposed Option 1 would implement stronger NOx standards in two steps. The first increase in stringency would be in MY 2027, and the second would be in MY 2031; under this Option the 2031 NOx standards would be 90% lower than today’s standards. Option 2 would immediately jump to full implementation of a NOx standard in MY 2027. As shown below, Option 2 would achieve less NOx emissions reductions than Option 1.
Heavy-Duty Highway NOx Emissions Inventory: Baseline versus Proposed Options 1 and 2
We are at the early stages of a significant transition in the history of the heavy-duty on-highway vehicle sector—a shift to zero-emission vehicle technologies. Major truck manufacturers and U.S. states have announced plans to transition the heavy-duty fleet to zero-emissions technology, and over the past few years we have seen the early introduction of zero-emission technologies in several commercial vehicle market segments. In light of these developments, the agency is now proposing targeted updates to the “Phase 2” GHG standards to reflect these market shifts to zero-emission
technologies, which the agency did not foresee when it issued the “Phase 2” GHG emission standards. The “Phase 2” standards began in 2021 and become stronger every three years through 2027. The fully phased-in Phase 2 standards will achieve up to 24-25 percent lower CO2 emissions compared to the previous GHG standards. The existing Phase 2 standards are still phasing-in, with the next change in stringency coming in 2024.
This proposal would further tighten the “Phase 2” GHG standards for MY 2027 for 17 of the 33 subcategories of vocational and tractor vehicles. These subsectors include school buses, transit buses, commercial delivery trucks, and short-haul tractors. EPA is also requesting comment on whether it would be appropriate in the final rule to increase the stringency of the standards even more than what we propose for MYs 2027 through 2029, including the potential for progressively stronger CO2 standards across these three model years.
The agency aims to finalize standards that are as strong as possible in the near term and that provide a robust starting point for ambitious GHG standards for the truck industry as soon as MY 2030.
As noted above, EPA is developing two additional regulations under President Biden’s Clean Trucks Plan. As part of a proposal for light- and medium-duty vehicles, EPA will consider new, stronger emission standards for MY 2027 and later commercial pickup trucks and vans. EPA is also developing “Phase 3” GHG emissions standards for heavy-duty engines and vehicles starting as early as MY 2030. These three rulemaking actions provide the opportunity for EPA to establish comprehensive, multipollutant standards for the near term and the long term, all while considering the significant potential for emission reductions that zero-emission technology can provide.
EPA welcomes public input into this rulemaking and looks forward to continuing its engagement with stakeholders throughout the rulemaking process. Today’s proposal reflects input from stakeholders including community groups, the trucking industry, environmental and public health organizations, and state, local, and tribal governments gathered through comments in response to the Advance Notice of Proposed Rulemaking and through meetings with stakeholders throughout the development of the proposal.
EPA plans to hold a virtual public hearing for this proposal. EPA will begin registering speakers for the hearing upon publication of the proposal in the Federal Register. To register, please use the registration link that will be available on the EPA rule webpage once registration begins: www.epa.gov/regulations-emissions-vehicles-and-engines/proposed-rule-and-related-materials-control-air-1. Written comments must be received on or before 46 days after publication in the Federal Register.
You can access the Notice and related documents on the U.S. Environmental Protection Agency, Office of Transportation and Air Quality webpage at: www.epa.gov/regulations-emissions-vehicles-and-engines/proposed-rule-and-related-materials-control-air-1.

An Analysis of the Impacts of Zero-Emission Medium- and Heavy-Duty Trucks on the Environment, Public Health, Industry, and the Economy

This report summarizes the projected environmental and economic effects of Illinois adopting policies requiring manufacturers to sell a greater number of M/HDV low- and no-emission vehicles over the next 30 years. Three specific Clean Truck policy scenarios, representing increasing levels of ambition, were evaluated.
• ACT Rule: Illinois adopts requirements analogous to those adopted by California under the Advanced Clean Trucks Rule, which requires an increasing percentage of new trucks purchased in the state to be ZEVs beginning in the 2025 model year.6 The percentage of new vehicles that must be ZEV varies by vehicle type, but for all vehicle types the required ZEV percentage increases each model year between 2025 and 2035 (see Figure 1).
• ACT Rule plus NOx Omnibus Rule: In addition to adopting the ACT Rule, Illinois adopts requirements analogous to those adopted by California under the Heavy-Duty Omnibus Rule (referred to herein as the NOx Omnibus Rule). This rule requires an additional 75 percent reduction in nitrogen oxide (NOx) emissions from the engines in new gasoline and diesel trucks sold between model year 2025 and 2026, and a 90 percent reduction for trucks sold beginning in the 2027 model year.7
• 100 x 40 ZEV + Clean Grid: In addition to adopting the ACT and NOx Omnibus Rules, Illinois takes further actions to ensure more rapid and continued increases in new ZEV sales, such that virtually all new trucks are ZEV by 2040 (see Figure 1), with Class 2b–3 achieving 100 percent ZEV sales in 2038 and Class 4
8 (non-tractors) achieving 100 percent ZEV sales in 2035. In addition, an aggressive federal Clean Energy Standard is assumed to ensure that electricity generation in the state is carbon free and over 90% renewable by 2050. State-specific, renewable portfolio standards that could increase the renewable electricity levels even more were not analyzed as part of this study.
All three of these Illinois policy scenarios are compared with a baseline “business as usual” scenario in whichall newtrucks soldinthestatecontinue to meet existingEPANOx emissionstandards and ZEVsales increase only marginally, never reaching more than 1 percent of new vehicle sales each year.8
The analysis assumes that M/HD annual vehicle miles traveled (VMT) in Illinois will continue to grow by approximately 0.3 percent annually through 2050, as projected by the Energy Information Administration (EIA), as the economy and population continue to grow. The modeled policy scenarios do not include freight system enhancements or mode shifting to slow the growth of, or reduce, M/HD truck miles; this would be expected to provide additional emission reductions.
The analysis was conducted using ERM’s STate Emission Pathways (STEP) Tool. The climate and air quality impacts of each policy scenario were estimated on the basis of changes in M/HD fleet fuel use and include both tailpipe emissions and “upstream” emissions from production of the transportation fuels used in each scenario. These include petroleum fuels used by conventional internal combustion engine vehicles (gasoline, diesel, natural gas) and electricity and hydrogen used by ZEVs, which are assumed to include both battery electric (EV) and hydrogen fuel cell electric (FCV) vehicles.
6 If theACT is adopted in Illinois in 2022, the first year of compliance will be model year 2026. The modeling assumes the first compliance year is 2025.
7
8 The baseline ZEV sales assumptions are consistent with projections in the Energy Information Administration’s Annual Energy Outlook 2021.
Reductions are relative to current federal EPA new engine emission standards. This rule does not require additional PM reductions but includes anti-backsliding provisions to ensure that PM emissions do not increase compared with engines designed to meet current federal standards.
To evaluate climate impacts, the analysis estimated changes in all combustion related GHGs, including carbondioxide(CO2),methane (CH4),andnitrousoxide (N2O).Toevaluateairqualityimpacts, theanalysis estimated changes in total nitrogen oxide (NOx) and particulate matter (PM) emissions and resulting changes in ambient air quality and health metrics such as premature deaths, hospital visits, and lost workdays.
The economic analysis estimated the change in annual M/HD fleet-wide spending on vehicle purchase, charging/fueling infrastructure to support ZEVs, vehicle fuel, and vehicle and infrastructure maintenance under each scenario. Currently ZEVs are more expensive to purchase than equivalent gasoline and diesel vehicles, but they have lower fuel and maintenance costs. Over time the incremental purchase cost of ZEVs is also projected to fall. Technologies required to meet the more stringent NOx standards of the NOx Omnibus Rule are also projected to increase purchase costs for compliant vehicles.
On the basis of estimated changes in fleet spending, the analysis estimated the macroeconomic effects of each scenario on national jobs, wages, and gross domestic product (GDP).
The analysis also estimated the impact of each scenario on Illinois’s electric utilities, including the total state change in power demand (kW) and energy consumption (kWh) for M/HD EV charging, as well as the additional revenue and net revenue that would be received by the state’s electric utilities for providing this power. On the basis of projected utility net revenue, the analysis estimates the potential effect on state electricity rates for residential and commercial customers.
In addition, the analysis estimated the total number of vehicle chargers that will be required to support the increase in M/HD EVs under each scenario both depot-based chargers and shared public chargers compared with the existing charging network in the state.
For a full description of the modeling approach and sources of assumptions used for this analysis, see the report: Clean Trucks Analysis: Costs & Benefits of State-Level Policies to Require No- and Low-Emission Trucks, Technical Report Methodologies and Assumptions, May 2021 (https://www.erm.com/globalassets/documents/mjba-archive/reports/2021/clean-trucks-technical-report-final09jun21.pdf).
The Illinois electric grid mix and energy cost assumptions used can also be found in the Appendix to this report.

The sections below detail the results of the Illinois Clean Trucks analysis, beginning with a description of the current Illinois M/HDV fleet and the projected fleet under each modeled policy scenario. This is followed by a summary of the environmental and public health benefits of each scenario and the economic impacts of the modeled fleet transitions.


Table 1 summarizes the current M/HD fleet in Illinois, broken down by the four major vehicle types used to frame the Clean Trucks analysis.

Approximately 24 percent of the in-use M/HD fleet are Class 2b vehicles (8,500–10,000 in gross vehicle weight rating, GVWR), which are mostly heavy-duty pickup trucks and vans.9 These vehicles account for 12 percent of annual M/HD miles and 5 percent of annual fuel use. Approximately 7 percent of the fleet are buses, which account for 6 percent of annual VMTand 5 percent of annual fuel use.This includes relatively small shuttle buses (class 3–5) as well as school buses, transit buses, and intercity/charter coach buses.10 Forty-six percent of the fleet are single-unit freight andwork trucks, which account for 24 percent of annual VMT and 23 percent of annual fuel use. These vehicles come in a wide variety of sizes (Class 3–8) and have a wide variety of uses, from vans and box trucks used to deliver freight, to sanitation and construction trucks, to boom-equipped utility trucks. Only 23 percent of the fleet are combination truck-tractors, but thesevehicles account for59 percent of annualVMTand 67 percent ofannual fueluse,since approximately two-thirds of these vehicles are used primarily for long-distance freight hauling and typically log many more daily and annual miles than other M/HD vehicles.
Today less than 1 percent of the national M/HD fleet is powered by electricity or alternative fuels (natural gas and propane). Approximately 64 percent of the fleet have diesel engines and 36 percent use gasoline.11 The largest Class 7 and 8 vehicles are almost all diesel, while almost 50 percent of the smaller Class 2b–5 trucks have gasoline engines, with most of the remainder diesel.
Figure 2 summarizes the modeled turnover of the Illinois in-use fleet to zero-emission and low-NOx trucks under the three Clean Truck policy scenarios. Fleet turnover to new trucks is based on historical average turnover rates and projected fleet growth rates, along with the new vehicle ZEV purchase percentages shown in Figure 1. Approximately 6.1 percent of existing Class 2b trucks and 4.7 percent of Class 3–8 trucks and buses are retired each year and replaced with new vehicles.12 The ACT + NOx Omnibus scenario and the 100 x 40 ZEV + Clean Grid scenario further assume that all new vehicles purchased in 2024 and later years that are not ZEV will have low-NOx engines compliant with the NOx Omnibus standards.
As shown, under the ACT Rule policy scenario, 31 percent of the in-use M/HD fleet will turn over to ZEV by 2040, and 54 percent are ZEV by 2050; all of these ZEVs are assumed to be electric vehicles. Under the ACT+NOxOmnibuspolicyscenario,thesamepercentage ofthefleet turns overtoZEV,but theremaining internal combustion engine vehicles in the fleet turn over to low-NOx engines by 2044. Under the 100 x 40 ZEV + Clean Grid policy scenario, 49 percent of the in-use fleet turns over to ZEV by 2040 and 91 percent do so by 2050. This scenario assumes that new ZEVs will include both EV and fuel cell vehicles powered by hydrogen. In 2050, 6.9 percent of in-use ZEVs are assumed to be FCV and 82 percent are EV.
11 These figures are based on state registration data collected by IHS Markit.
12 This is a long-term average. Actual annual turnover is highly correlated to economic conditions and can vary widely from year to year.
PostedonFebruary23 2022
ItseemslikeonethemostnotablevanguardsofdieselengineshasbegunpreparationsforanupcomingTesla-likedisruptioninthe truckingsector.Inarecentpressrelease,dieselenginegiantCumminsannouncedthatitwasacquiringMeritor,acompanythatmakes drivetrain,mobility,braking,aftermarket,andelectricpowertrainsolutionsforcommercialvehicleandindustrialmarkets Thedealis valuedatapproximately$37billion


WiththeMeritordealinplace,Cumminswouldbeabletoaddtransmissions,brakes,andaxlestoitsownlineofelectricmotors It wouldalsoallowthecompanytoofferelectrictruckmanufacturerstheoptiontosourcetheirdrivetrainfromCummins Thisisfamiliar groundforthedieselenginegiant.IntheUS,afterall,customershavetheoptionofacquiringatruckfromamanufacturerlike FreightlinerwhilespecifyingadieselenginefromacompanylikeCummins
CumminsnotedthatitsacquisitionofMeritorwouldallowthecompanytoacceleratetherampofitsNewPowerbusiness,which involvesthedevelopmentofmotorsandaxlesfortrucksthatarepoweredbyelectricandhybridpowertrains Inthecompany’spress release,CumminsChairmanandCEOTomLinebargerexplainedthatMeritor’sacquisitionplacesthedieselenginemakerinafavorable positionforthefuture


“TheacquisitionofMeritorisanimportantmilestoneforCummins Meritorisanindustryleader,andtheadditionoftheir complementarystrengthswillhelpusaddressoneofthemostcriticaltechnologychallengesofourage:developingeconomicallyviable zero-carbonsolutionsforcommercialandindustrialapplications Climatechangeistheexistentialcrisisofourtime,andthisacquisition acceleratesourabilitytoaddressit Ourcustomersneedeconomicallyviabledecarbonizedsolutions,”Linebargersaid
SeeingCumminsinvest$37billionintheupcomingelectrictruckmarketbodeswellfortheupcomingsegment,whichisarguablystillin itsveryearlystages EvenEVleaderslikeTeslaareseeingchallengesinenteringthetruckingmarket TheTeslaSemi,forexample,has becomeoneofthecompany’smostdelayedproducts,withtheClass8truckinitiallyscheduledtostartdeliveriesbackin2019 CEO ElonMuskhasexplainedthattheSemi’sdelaysarepartlyduetobatterysupply
Despitethesedelays,however,thetruckingmarketmayseearapidadoptionofelectricvehicles Fleetownerstypicallyviewtruck purchasesbasedonthetotalcostofownership,whichcouldbefavorabletovehiclesliketheTeslaSemiandCummins’upcomingelectric products Onceitbecomesevidentthatelectrictrucks’totalcostofownershipislowerthanthatofdieseltrucks,customerswouldlikely switchovertoelectricsolutions Andwhenitdoes,itwouldlikelybecompanieslikeTesla,andnowperhapsCummins,thatwouldbe readytotakeadvantageoftheemergingelectrictruckingmarket

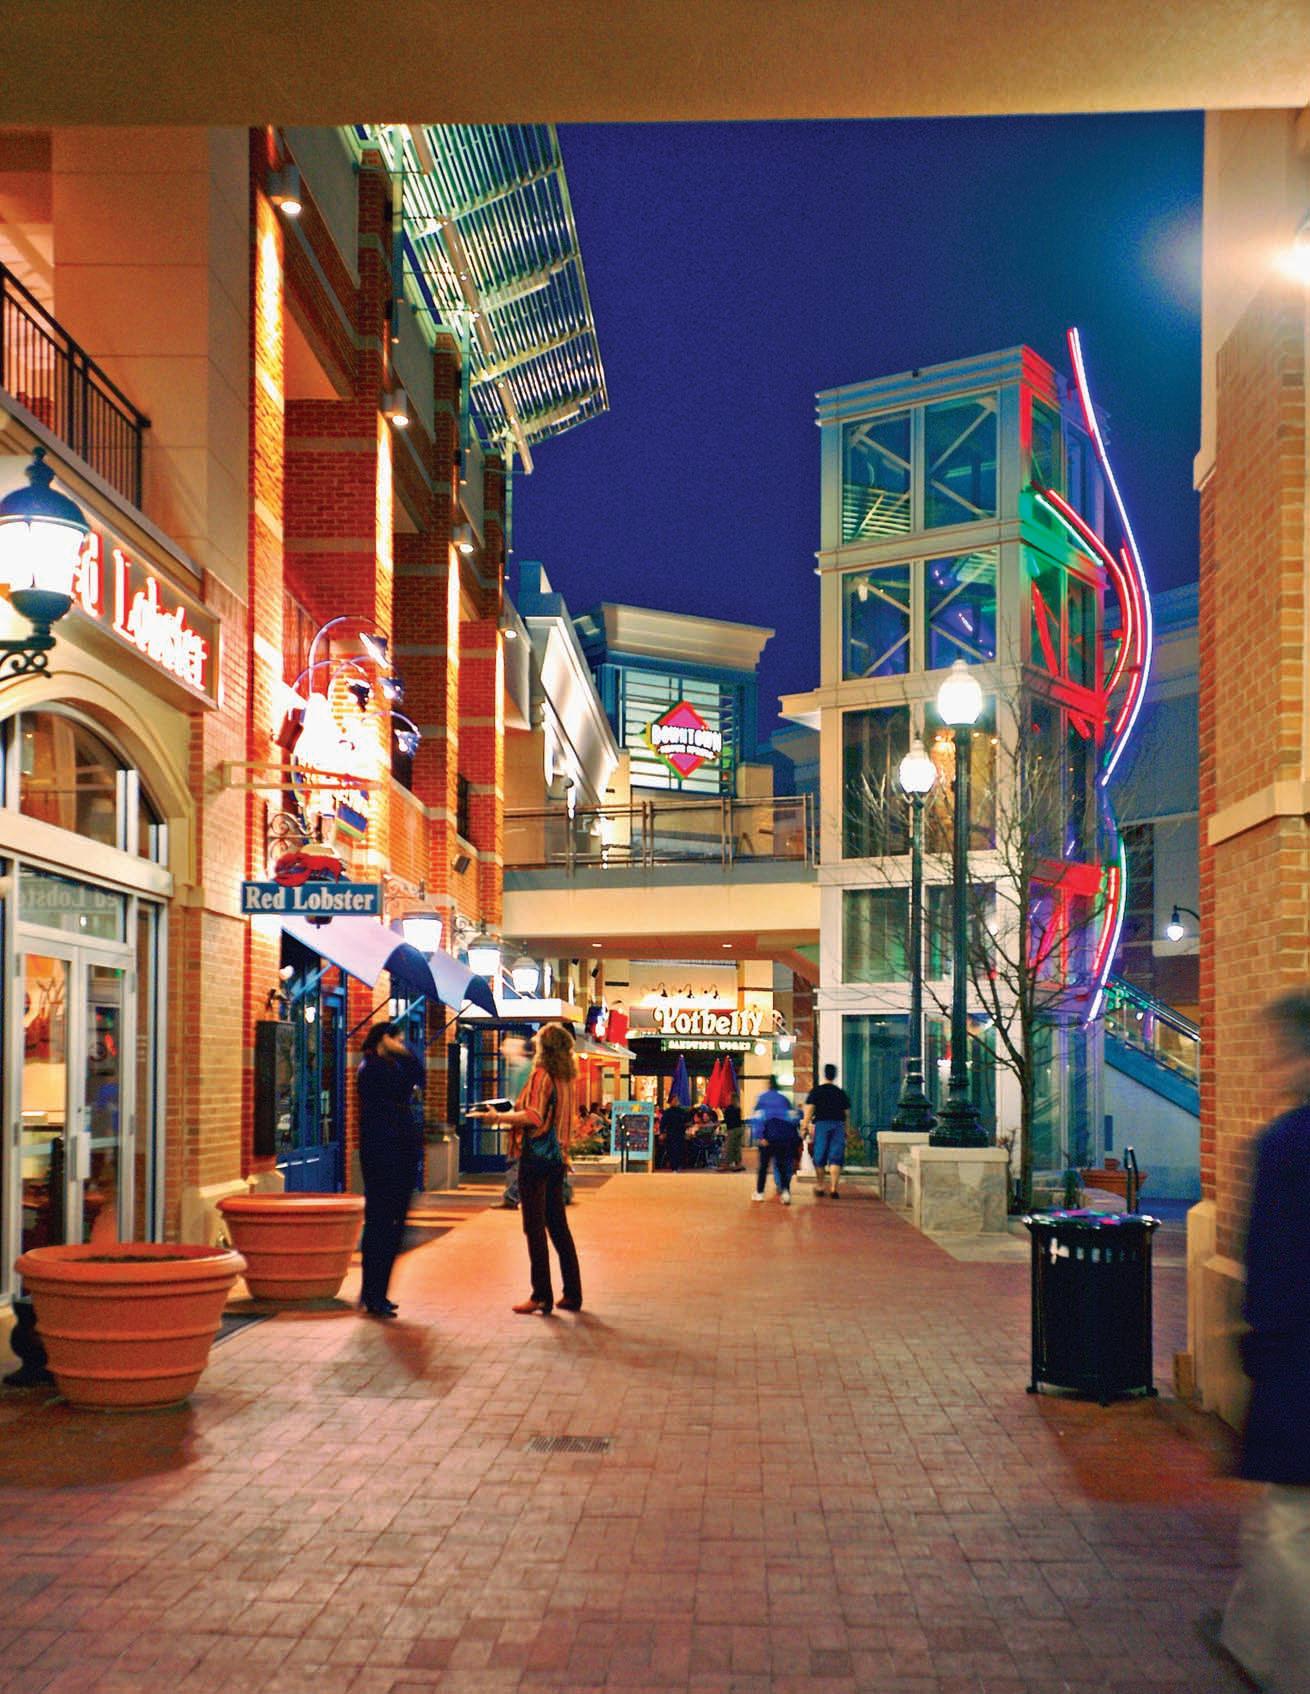
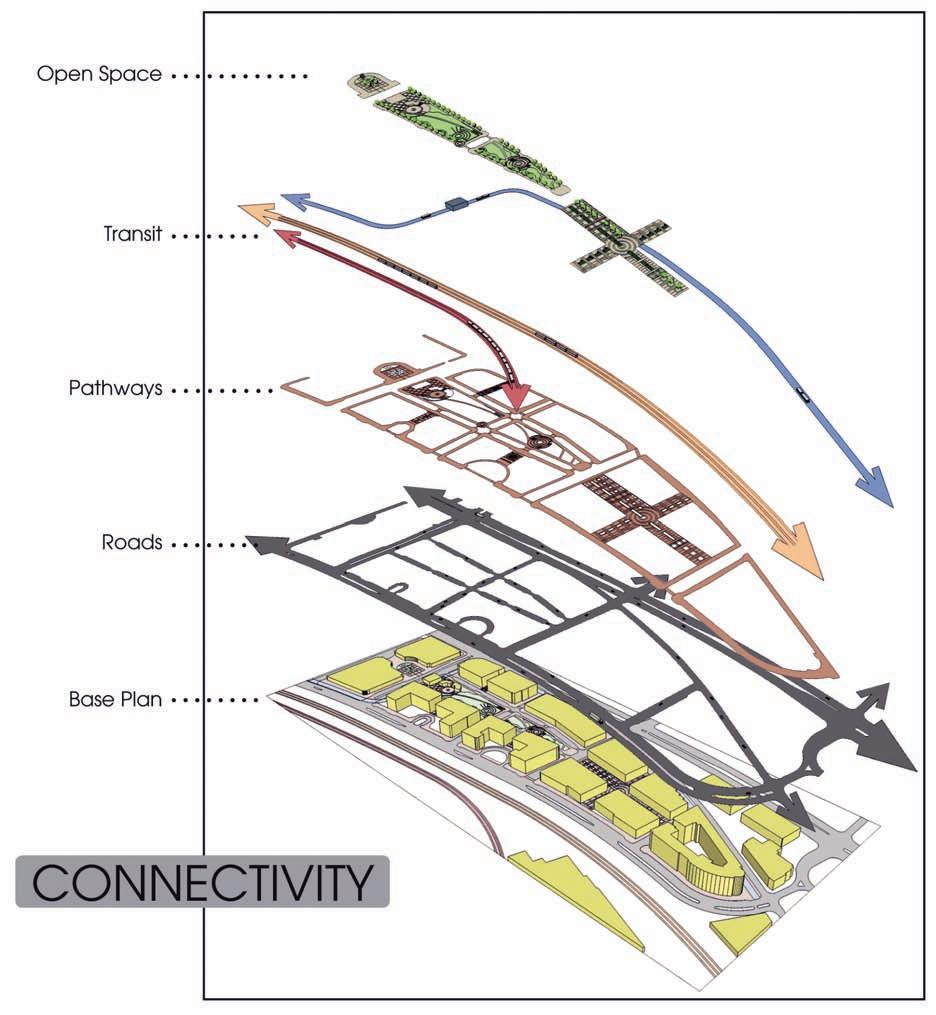
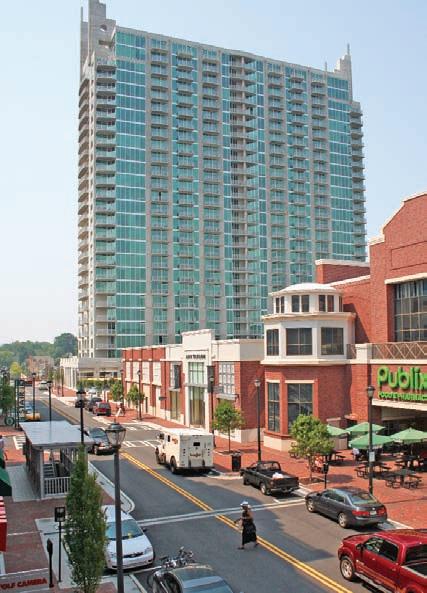
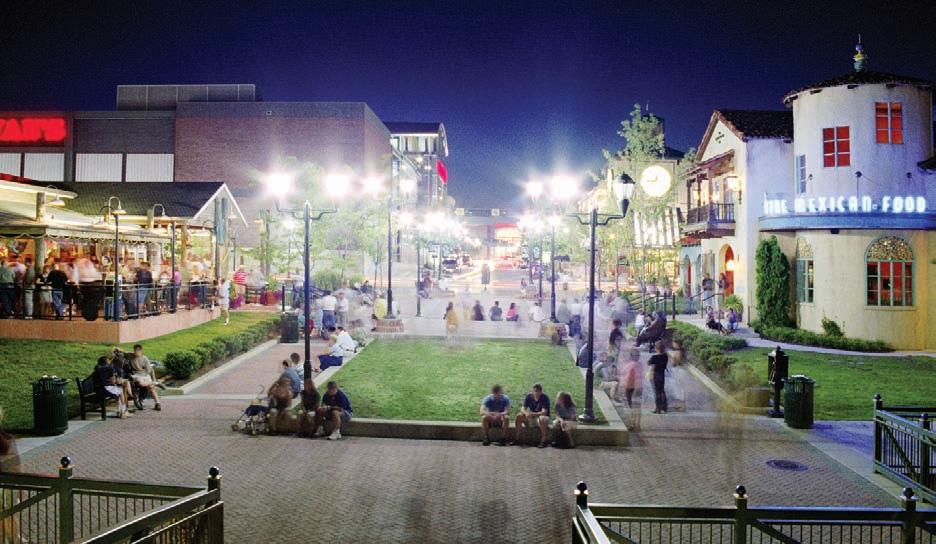
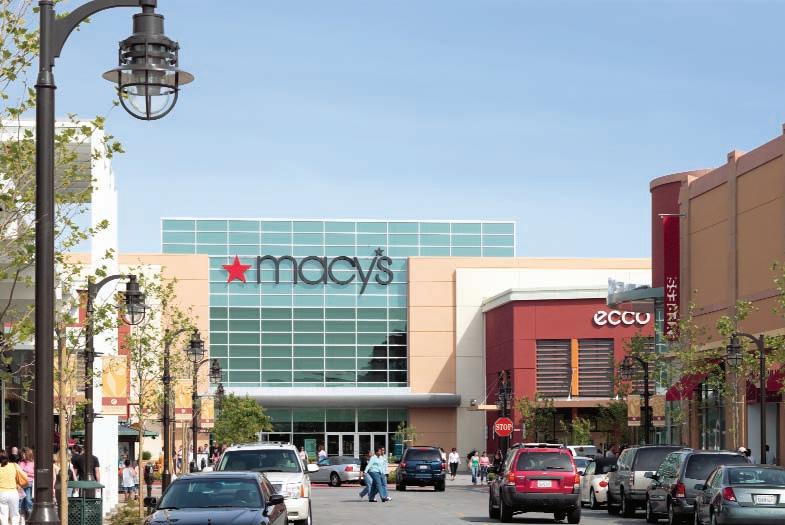
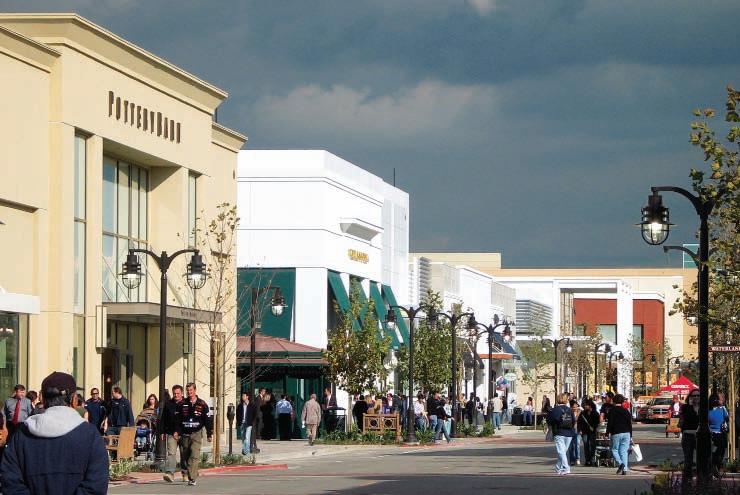
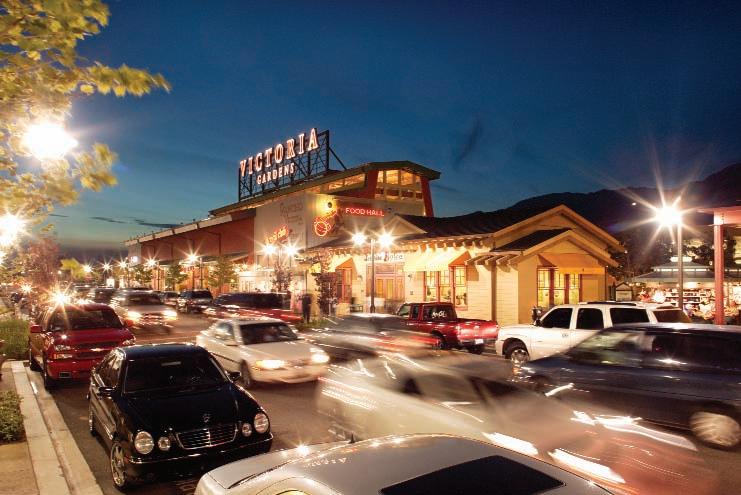
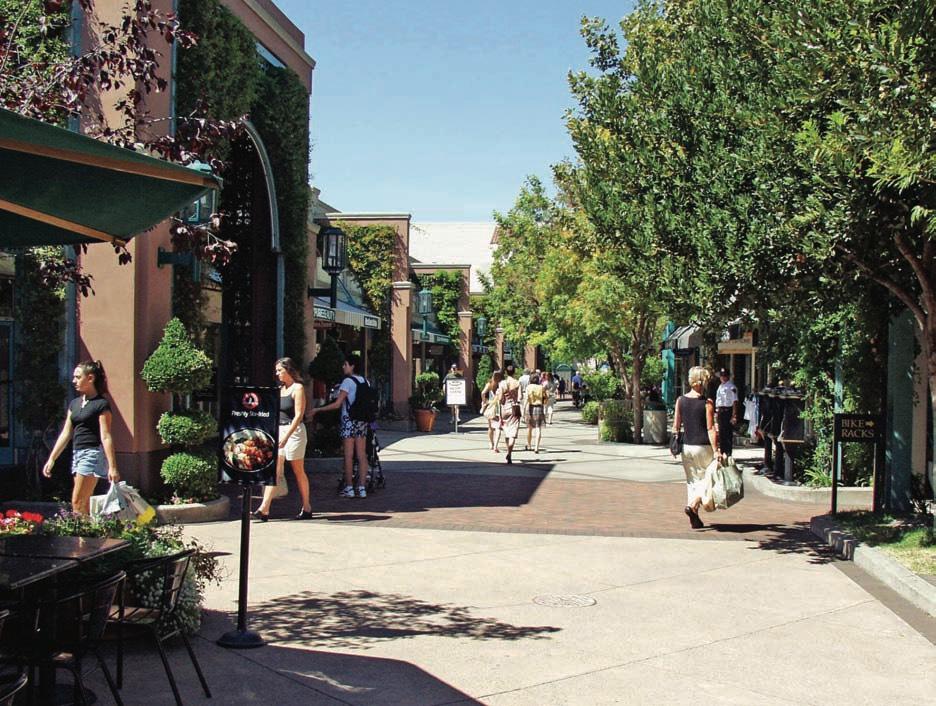
One of the defining characteristics of town center developments is that they are very public and have strong connections with the surrounding community. The fact that patrons look on town centers as public centers, not as managed shopping centers or private commercial developments, is an important distinction. Strong connections to surrounding neighborhoods, commercial areas, and park systems help reinforce the view that the town center is accessible to all users. A sense of ownership and belonging separates and characterizes town centers from traditional and lifestyle-based centers.
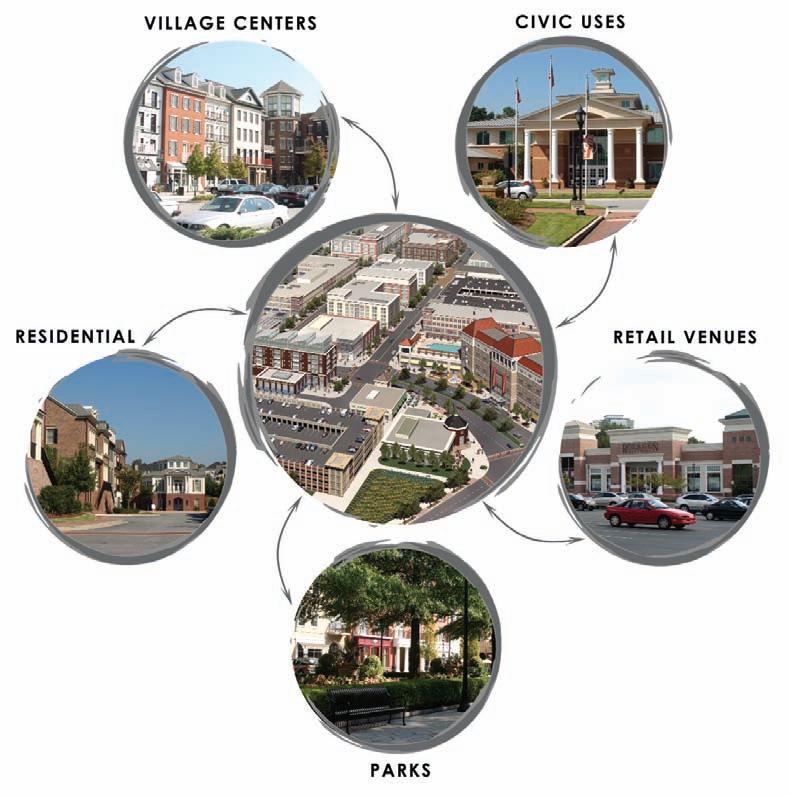
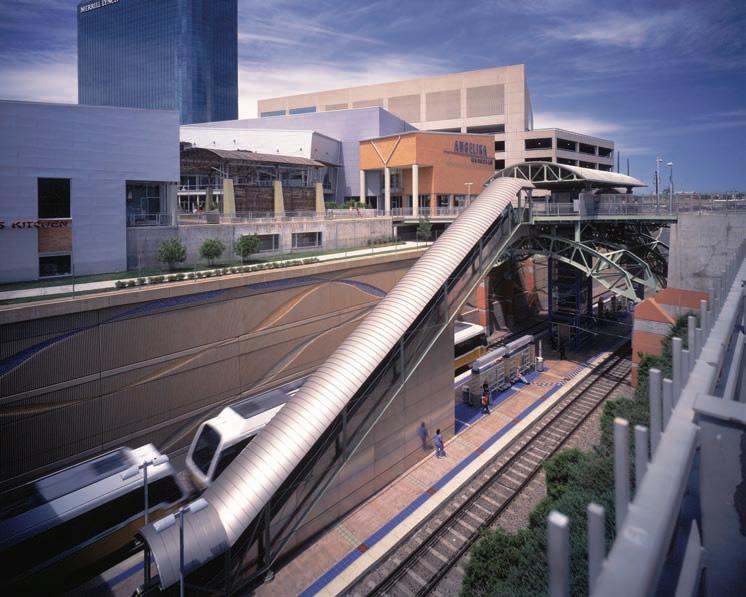
Connectivity to a town center occurs at a variety of levels. The most obvious connection is through a well-designed series of roads at the arterial, collector, and local scales. Town centers, like other regional or semiregional destinations, can generate a high volume of vehicular traffic. Designing roads that are adequate to handle and distribute the traffic that feeds these centers is very similar to designing roads in conventional projects, until the roads diminish to a local capacity and the interface with pedestrian traffic intensifies. Town centers require an effective balance between pedestrian and vehicular traffic. Sidewalks, walkways, and bike trails are also key components that feed into and connect a town center to surrounding neighborhoods and other communities.
Town center developments typically have a retail and commercial component that is place based. High volumes of pedestrian traffic and a great sidewalk experience are critical to the success of these uses. The sidewalk environment should not be overlooked as an element that can fascinate and amuse pedestrians. Given enough width, sidewalks offer opportunities to accommodate small parks, fountains, cafés, and resting areas. Along with clear sight lines into the adjacent retail spaces,
Washingtonian Center, in Gaithersburg, Maryland, was one of the first town centers to mix big-box discount stores with full-price and neighborhood convenience stores in a pedestrian environment.

The development of Market Common, Clarendon in Arlington, Virginia, involved a complex arrangement and integration of different types of housing and retail uses around an energized public square.
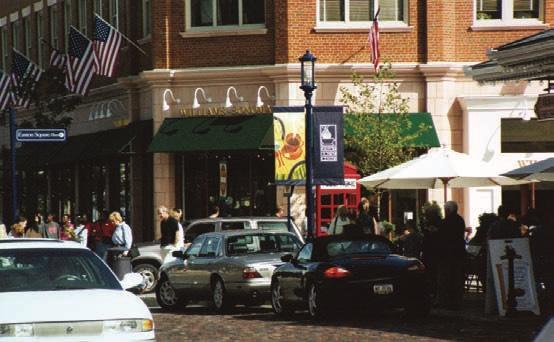

town center creates strong emotional connections with the surrounding community. A sense of uniqueness and specificity are characteristics that separate a town center from other developments or centers. Reinforcing connections at the physical and emotional levels strengthens the position of the center in the market and helps ensure its continued long-term viability.