1 minute read
With the convective-adiabatic model one can calculate the temperatures on all planets


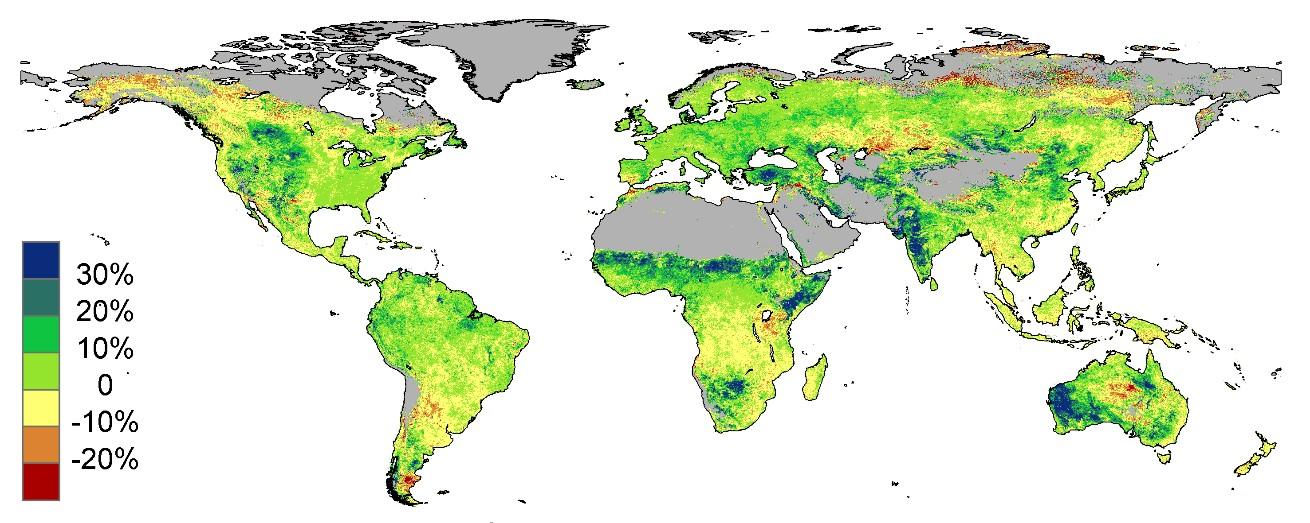
Carbon dioxide is not a "climate killer" but the basis of all life. It has been known for more than 100 years that plants grow faster when there is more CO2 in the air. This positive effect has been documented in several publications. NASA and the Australian national research agency CSIRO have found that the fertilization effect and increased precipitation as a result of rising temperatures have made the earth greener in recent decades. The next image shows the change in vegetation density from 1982 to 2010 in percent (green indicates growth in vegetation; deserts and icy areas are gray, © Copyright CSIRO Australia). Specifically arid regions such as the Sahel, the Indian subcontinent, and most of Australia benefit from higher temperatures and fertilization by CO2 , clearly seen in
the large green areas.
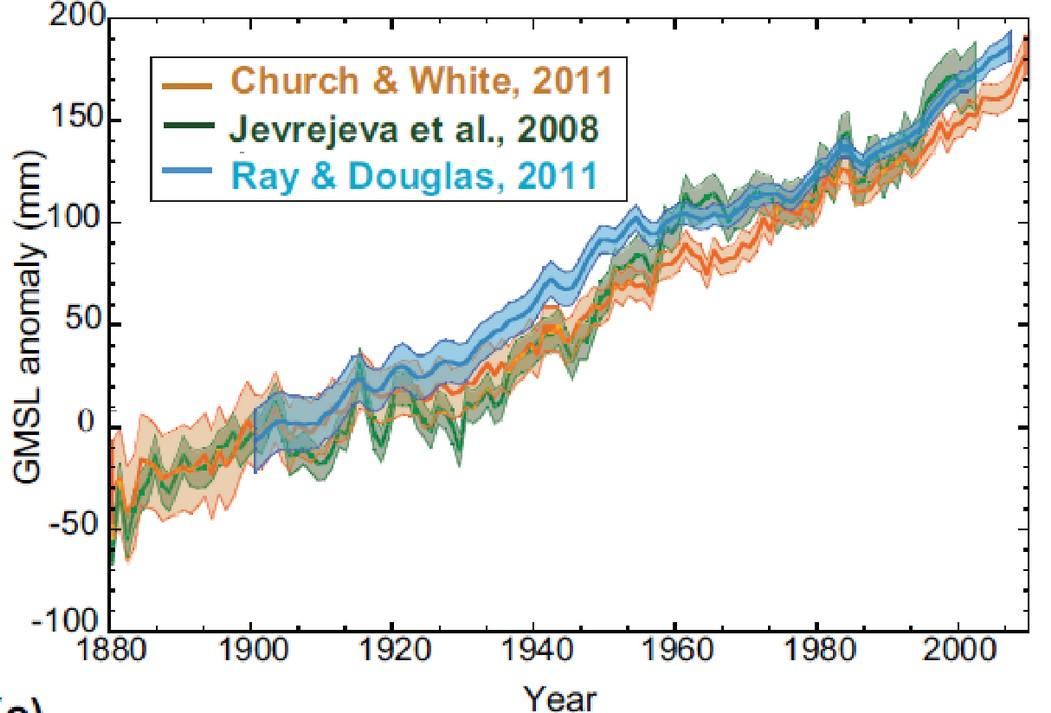
18. Global sea level change from 1880 to 2010: no acceleration of rise!
The evaluation of globally distributed measuring stations since 1880 results in the left figure, in which the sea level curves of three research groups are superimposed (IPCC AR5, https://tinyurl.com/y3k3dnd5, Figure 3.13a). Over the past 140 years, ocean levels have risen at an average rate of about 1.8 mm per year. From the mid-1950s to about 1990, the rise was reduced primarily by the many dam projects. These held back much of the rainwater (NASA, https://tinyurl.com/yxvg994b). Since 1990, the rise has been as steep again as it was from 1880 to 1905, when CO2 levels increased by only 7 ppm in 25 years. Now, however, CO2 levels are rising seven times as fast.
There is no acceleration of sea level rise and thus no correlation with the CO2 content of the atmosphere.
On the contrary, for the years 2005 to 2012, an analysis of satellite data (Altimeter, GRACE) and buoys (ARGO) shows an increase of only 1 mm per year (also from the IPCC report of 2013, Figure 3.13d, GMSL = Global Mean Sea
Level). It is easy to see the influence of the El Niño of 2010 and the La Niñas (with reduced sea level) of 2008 and 2011.