2 minute read
First the temperature rises, then the CO2 -content of the atmosphere


And why do we always read and hear in the media about a 3 mm per year rise? Because the NASA satellites Topex, Jason-1 and Jason-2 delivered this result. Okay, that was worded incorrectly. Of course, the measuring instruments on board these satellites do not deliver such a result. One must filter quite a lot, select values and interpret until a halfway useful value results. In the end, the satellites flew at 1340 km altitude and were able to measure the distance from the sea surface with an alleged accuracy of about 2 cm, which I think is optimistic, considering that the radar altimeters had a wavelength of 6 cm (https://en.wikipedia.org/wiki/Ocean_Surface_Topography_Mission#Ocean_altimetry). This is like using a meter rule to measure the thickness of a hair. Again, the annual change is -4 mm to +6 mm and each year the winds, currents, temperatures, waves, humidity, sea ice cover, etc. are different. The Europeans also had a satellite for such measurements. It was called Envisat, cost 2.3 billion Euro and originally "delivered" a result of 0.48 mm per year.
Because the ESA apparently does not have as much confidence in its algorithms as NASA, an "adjustment" (increase) of 2 mm per year was made after the end of the mission so that it "fits" with
the NASA data (https://tinyurl.com/y8scdf2d). The "data reprocessing" is unfortunately not explained.
This raises the question of whether the result has anything to do with science or rather with politics.
19. "The polar ice caps are melting faster and faster" is Fake News!
"All the glaciers in East Greenland are melting rapidly... It can be said without exaggeration that the glaciers, like those in Norway, face the possibility of catastrophic collapse" said Prof. Hans Ahlmann,
Swedish geologist (https://www.newspapers.com/newspage/89276088/). He said this in 1939, at the last peak of the Atlantic Multidecadal Oscillation (see above). A 2012 paper that evaluated all of
Greenland's long-term weather stations concludes that Greenland's winter/spring/summer/fall temperatures have increased by only about 1.6/0.1/0.8/0.5 °C since 1940 (https://tinyurl.com/uaqr8h8).
The temperature increase in more than 70 years was only about 0.5 °C for the months when ice
melts.
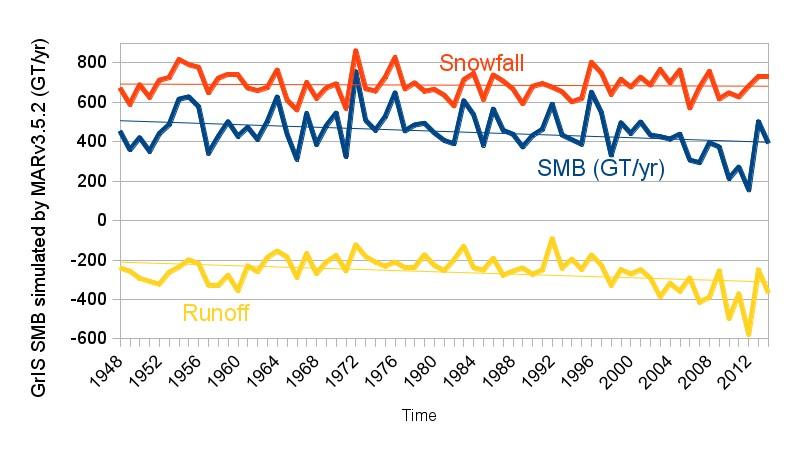
Greenland's ice cap has a north-south extension of 2400 km and extends from sea level to almost 3700 m above zero. The fact that weather and climate are not the same everywhere and that the glaciers melt in summer in Greenland's green south - when solar insolation is stronger than at the equator - is logical. That is why it is called Greenland (grøn = green) and not Greyland or Pinkland. So what do calving glaciers and meltwater streams on the ice mean for Greenland's ice mass? A model calculation gives an average of 700 gigatons (GT) per year of ice accretion from snowfall. Here is the graphic (https://tinyurl.com/yd65bmw2): The blue curve (SMB = Surface Mass Balance) is the result of increase due to snowfall (red) and ice loss due to melting (runoff, yellow). The increase in surface ice over the last 20 years has averaged 400 GT per year. For the total balance, the ice loss due to glacier calving is missing. Overall, Greenland's ice cap has been losing an average of 100 GT of mass annually since the end of the Little Ice Age


