LUXURY MARKET TRENDS
HAPPY SPRING!
As we kick off the prime-time season for the luxury market, which runs from March through October in many markets across the Pacific Northwest, buyer demand will increase over the months ahead, as will the number of new luxury listings coming on the market.
Following the winter cleanup of unsold luxury properties, we often see a shortage of inventory of luxury listings. As more properties come onto the market, buyers will find some relief and a greater selection this time of year.
Spring is truly the best time of year to showcase your home if you’re looking to sell. Whether you’re looking to sell your family home or purchase a vacation property in a destination location, our John L. Scott luxury broker associates are here to help.
We hope you enjoy this edition of our Luxury Market Trends report!
 J. Lennox Scott Chairman and CEO
John L. Scott Real Estate

EXCEPTIONAL HOMES
BY JOHN L. SCOTT
Exceptional Homes is John L. Scott’s luxury real estate brand. Together with our luxury broker associates, our global partners at Luxury Portfolio International, and our support staff, we strive to provide concierge-level service by putting clients first.
We can ensure you that we are here for you and your family. The real estate market is fast-paced and ever changing, but what hasn’t changed, is our commitment to exceed your expectations when you are ready to buy or sell your home.
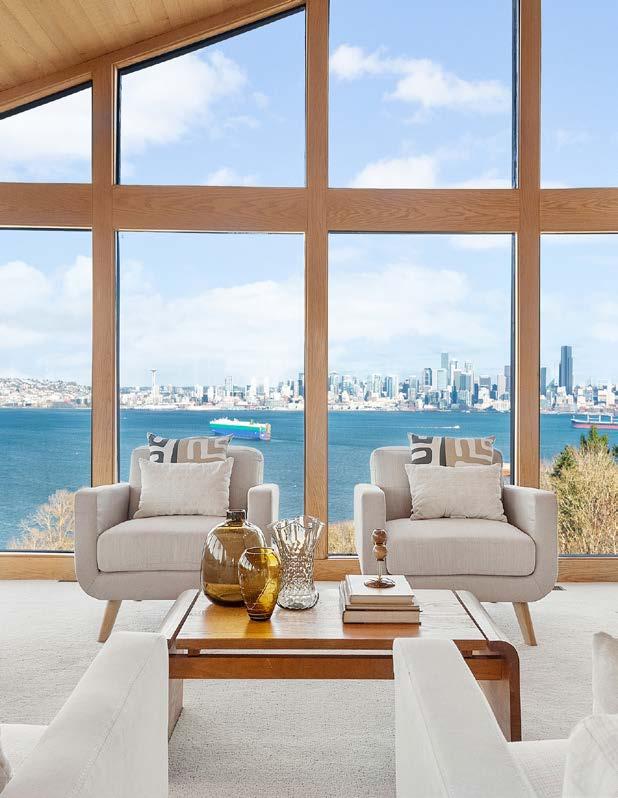
ON THE RIGHT: PENDING | JOHNLSCOTT.COM/36315
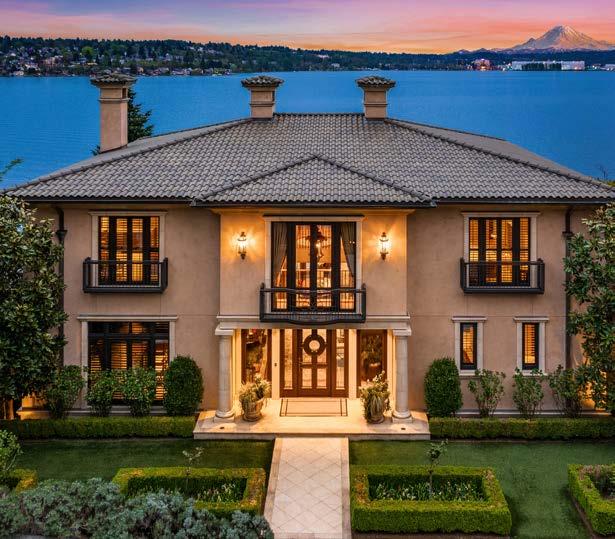
ON THE COVER: OFFERED AT $14,900,000 | JOHNLSCOTT.COM/10869
Luxury
LIVE YOUR
WE ARE GLOBAL
John L. Scott is a founding member of the international organization Leading Real Estate Companies of the World®.

Founded in 1931, JLS operates over 100 offices with over 3,000 agents throughout WA, OR, ID & CA

A global community of over 565 real estate companies awarded membership based on rigorous standards for service and performance

BY THE NUMBERS
550 Member Firms
John L. Scott’s luxury brand, providing our agents with tools and data to help each and every client live their luxury

The luxury division of LeadingRE & the largest global network of the most powerful, independent luxury firms
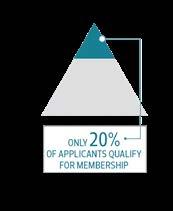
80% of applicants to this network are turned down
4,600 Offices Worldwide
Total Inventory
$58 BILLION
Our invitation-only network was responsible for $353 billion in annual home sales volume among the top 500 U.S. real estate firms in 2022.

Continents with Member Companies

6
Associates Worldwide
130,000 Average Property $2.6 MILLION INDUSTRY-LEADING SALES.
For informational
only.
compiling this report, LeadingRE relies on third party sources. The information set forth in the chart above is sourced from the 2023 RealTrends 500, showcasing production for calendar year 2022, accessible via realtrends com. Neither LeadingRE nor its member companies are responsible for the accuracy of third-party data presented herein. 2022 U S H O M E SALE S VO LU M E AM O N G TH E TO P 50 0 U S R E AL E STATE FI RM S $312 K E LL E R W I L LI A M S $353 L E A D IN G R E $124 S OT H E BY’ S I NT E R N ATI O NA L R E A LT Y $120 B E R K S H I R E H AT H AWAY HO M E S E RV I C E S $97 R E / M A X $24 CO R CO R A N $32 C E N T U RY 2 1 $21 U N IT E D R E A L E S TAT E $18 R E A LT Y O N E G R O U P $12 E R A $12 B E T T E R HO M E S A N D GA R D E N S HO M E S MA R T I NT E R N ATI O NA L $30 CO L DW E L L BA N K E R $233 NE T W O R K S , F R A N C H I S E S A N D C O M P A N IE S
Volume shown in billions of dollars.
purposes
In
JOHN L. SCOTT LUXURY SPECIALISTS SCHOLARS OF THE MARKET
Curious about luxury trends in your neighborhood? See what some of our real estate specialists had to say about the luxury market in their area.

PATTI
Overall, the Eastside market, including the luxury market, took off like a rocket after the first of the year despite 7% interest rates. Buyers have decided to resume their home search/buying, which has led to multiple offers over the list price in the $2-3M range. Above $3M, we saw strong offers (waiving all contingencies, releasing earnest money), more cash offers, or high down payments. In January, February, and early March, low inventories drove the zealous buyers, and as inventories have started to build over the last few weeks, it seems to have taken some pressure off. Q1 of 2024 does feel like Q1 of 2022, right before interest rates rose sharply. Over the next few months, if interest rates tick down and inventories continue to rise, we could have a typical, more balanced spring market.

TRACY
In my local market of Bend, Oregon in Deschutes County, the first quarter of 2024 continued to offer a limited number of luxury listings for buyers. This low inventory is keeping luxury pricing at a premium in our area. Our spring season is off to a great start with some beautiful new luxury listings already coming on the market. I do anticipate that this spring will continue to be as competitive as the past couple of years. However, the key difference for this year is that despite the lack of inventory, buyers are taking their time before deciding to write an offer. We are definitely ramping up for a very busy quarter ahead in Bend, Oregon.


 CHALKER Redmond
SORIANO Central Oregon

CINDY VERSCHUEREN
Q1 in the Mercer Island luxury market continued to have low inventory, high prices, and a two-week market. I think this spring market will be similar to last spring; it is an excellent time to put a home on the market. Buyers are prequalified and ready to buy with few contingencies to get the deal. The lack of inventory in the luxury market has put pressure on buyers to be prepared to move quickly, know the current market value of the property, and offer that amount.

CINDY THACKERY
During the first quarter, the luxury housing market in Beaverton, Oregon, experienced consistent activity, marked by an increase in demand for high-end properties driven by affluent buyers seeking spacious living spaces and premium amenities. Despite some fluctuations in inventory, the market maintained its allure, showcasing upscale homes characterized by contemporary designs and scenic surroundings.


2024 Q1 LUXURY MARKET TRENDS
Mercer Island
Sunset Corridor
PUGET SOUND

FIRST QUARTER HIGHLIGHTS
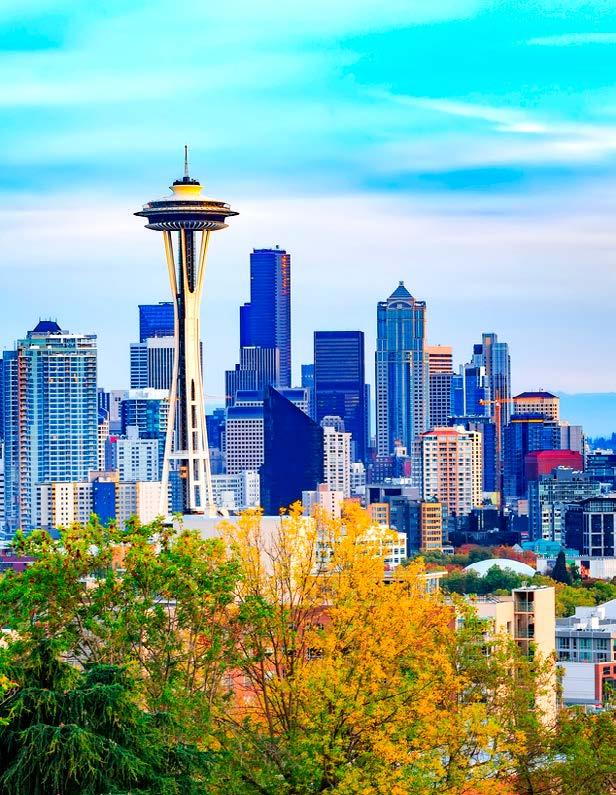
The luxury market in Seattle over the first quarter of 2024 experienced an increase in inventory compared with the same period in 2023, with more closed transactions and an increase in active listings on the market to start the second quarter.

2024 Q1 LUXURY MARKET TRENDS Q1 2024 Q1 2023 % Change Number of Sales 93 52 78.8% Total Dollar Volume $279,750,000 $162,002,190 72.6% Average Sales Price $3,008,065 $3,115,427 -3.4% Average Days On Market 45 27 68.1% Sold / List Price % 98.7% 97.1% 1.7% Average Price per SQFT $795 $762 4.3% Quarter-end inventory 101 92 9.7%
SEATTLE
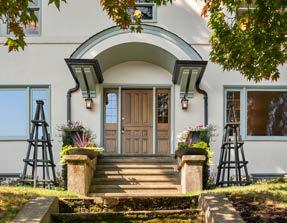
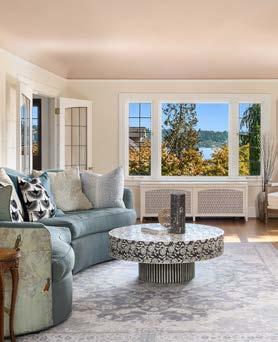
The data is for single family residences over $2M in MLS areas 140, 380, 385 390, 700, 701, 705, 710. Some John L. Scott offices are independently owned and operated. All reports presented are based on data supplied by the NWMLS, RMLS, Spokane MLS, and Central Oregon MLS. Neither the Associations nor the MLS guarantees or is in anyway responsible for its accuracy. Data maintained by the Associations or the MLS may not reflect all real estate activities in the market. Information deemed reliable but not guaranteed. OFFERED AT $2,899,950 | JOHNLSCOTT.COM/51274
WEST BELLEVUE

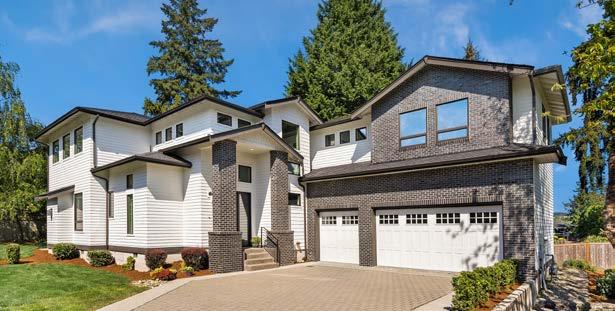
West Bellevue is a coveted luxury market and demand rarely falters at nearly all price points. As we enter the busy sales season, inventory is expected to continue its seasonal upward trend as competition typically also tightens as more buyers enter the market as well.
Q1 2024 Q1 2023 % Change Number of Sales 43 29 48.2% Total Dollar Volume $227,199,983 $188,364,800 20.6% Average Sales Price $5,283,721 $6,495,338 -18.6% Average Days On Market 35 40 -13.5% Sold / List Price % 97.7% 97.4% 0.2% Average Price per SQFT $1,069 $1,400 -23.6% Quarter-end inventory 56 55 1.8%
The data is for single family residences over $2M in MLS area 520. Some John L. Scott offices are independently owned and operated. All reports presented are based on data supplied by the NWMLS, RMLS, Spokane MLS, and the Central Oregon MLS. Neither the Associations nor the MLS guarantees or is in anyway responsible for its accuracy. Data maintained by the Associations or the MLS may not reflect all real estate activities in the market. Information deemed reliable but not guaranteed. PENDING
| JOHNLSCOTT.COM/72555
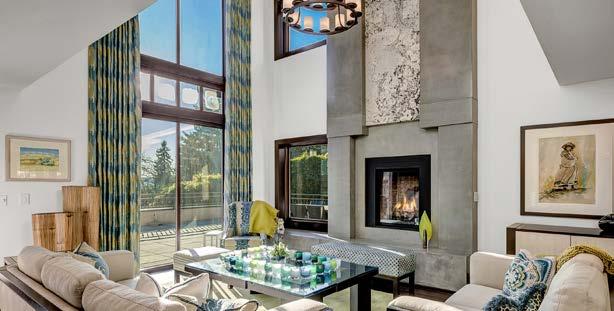
MERCER ISLAND

Mercer Island’s luxury market remains competitive and has held steady with what we saw during the first quarter of 2023. As we progress into the spring and summer months, inventory should increase in alignment with the annual sales cycle.
2024 Q1 LUXURY MARKET TRENDS
Q1 2024 Q1 2023 % Change Number of Sales 24 24 N/A Total Dollar Volume $74,909,614 $77,376,000 -3.1% Average Sales Price $3,121,234 $3,224,000 -3.1% Average Days On Market 35 41 -15.8% Sold / List Price % 99.0% 99.2% -0.2% Average Price per SQFT $836 $847 -1.1% Quarter-end inventory 13 31 -58.0% PENDING | JOHNLSCOTT.COM/62585
The data is for single family residences over $2M in MLS area 510. Some John L. Scott offices are independently owned and operated. All reports presented are based on data supplied by the NWMLS, RMLS, Spokane MLS, and the Central Oregon MLS. Neither the Associations nor the MLS guarantees or is in anyway responsible for its accuracy. Data maintained by the Associations or the MLS may not reflect all real estate activities in the market. Information deemed reliable but not guaranteed.

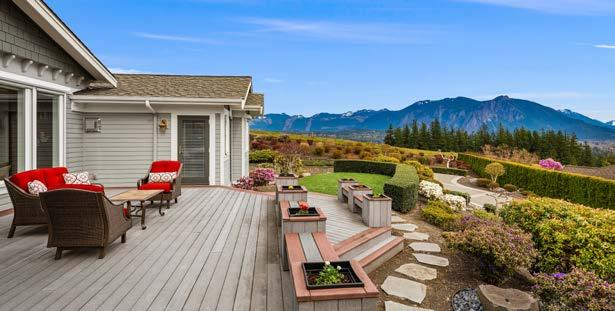
EASTSIDE OFFERED AT $2,800,000 | JOHNLSCOTT.COM/32134 Q1 2024 Q1 2023 % Change Number of Sales 269 196 37.2% Total Dollar Volume $889,361,028 $656,885,070 35.3% Average Sales Price $3,306,175 $3,351,454 -1.3% Average Days On Market 35 45 -22.2% Sold / List Price % 98.5% 96.6% 1.9% Average Price per SQFT $789 $789 N/A Quarter-end inventory 195 260 -25.0% The data is for single family residences over $2M in MLS areas 500, 510, 520, 530, 540, 550, 560, 600. Some John L. Scott offices are independently owned and operated. All reports presented are based on data supplied by the NWMLS, RMLS, Spokane MLS, and the Central Oregon MLS. Neither the Associations nor the MLS guarantees or is in anyway responsible for its accuracy. Data maintained by the Associations or the MLS may not reflect all real estate activities in the market. Information deemed reliable but not guaranteed. 37.2% NUMBER OF SALES -1.3% AVERAGE SALES PRICE

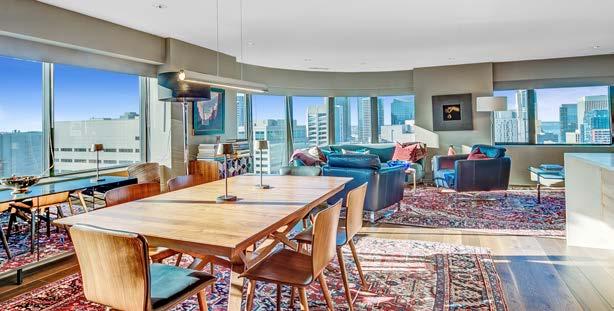
2024 Q1 LUXURY MARKET TRENDS KING COUNTY CONDO Q1 2024 Q1 2023 % Change Number of Sales 29 4 625.0% Total Dollar Volume $70,323,666 $10,645,000 560.6% Average Sales Price $2,424,954 $2,661,250 -8.8% Average Days On Market 58 87 -32.9% Sold / List Price % 97.5% 94.0% 3.7% Average Price per SQFT $1,113 $1,207 -7.8% Quarter-end inventory 39 43 -9.3% The data is for condominiums over $2M in King County. Some John L. Scott offices are independently owned and operated. All reports presented are based on data supplied by the NWMLS, RMLS, Spokane MLS, and the Central Oregon MLS. Neither the Associations nor the MLS guarantees or is in anyway responsible for its accuracy. Data maintained by the Associations or the MLS may not reflect all real estate activities in the market. Information deemed reliable but not guaranteed. 625.0% NUMBER OF SALES -8.8% AVERAGE SALES PRICE PENDING | JOHNLSCOTT.COM/52380

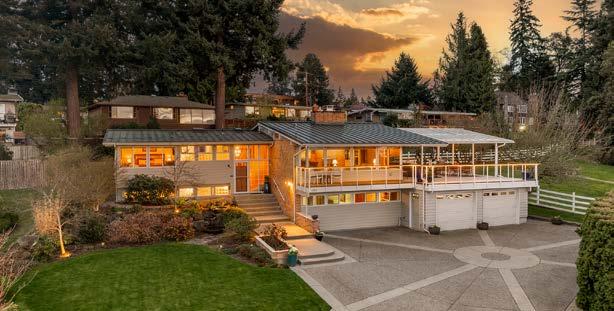
The data is for single family residences over $1M in MLS areas 100, 110, 120, 130, 140, 300, 310, 320, 330, 340, 350, 360. Some John L. Scott offices are independently owned and operated. All reports presented are based on data supplied by the NWMLS, RMLS, Spokane MLS, and Central Oregon MLS. Neither the Associations nor the MLS guarantees or is in anyway responsible for its accuracy. Data maintained by the Associations or the MLS may not reflect all real estate activities in the market. Information deemed reliable but not guaranteed. Q1 2024 Q1 2023 % Change Number of Sales 135 121 11.5% Total Dollar Volume $177,403,795 $168,545,896 5.2% Average Sales Price $1,314,102 $1,392,941 -5.6% Average Days On Market 44 60 -26.6% Sold / List Price % 98.8% 98.2% 0.6% Average Price per SQFT $405 $387 4.5% Quarter-end inventory 121 130 -6.9% PENDING | JOHNLSCOTT.COM/68349 SOUTH KING COUNTY IN Q1, WE SAW A 5.6% DECREASE IN THE AVERAGE SALES PRICE FOR SOUTH KING COUNTY

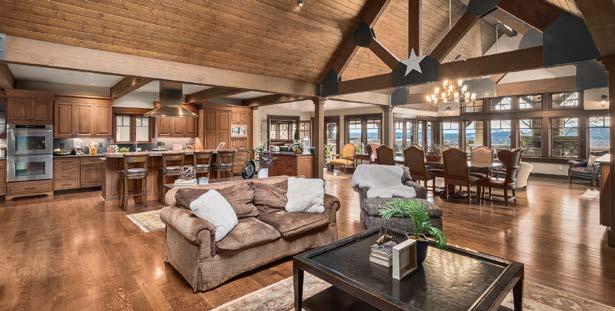
2024 Q1 LUXURY MARKET TRENDS Q1 2024 Q1 2023 % Change Number of Sales 119 98 21.4% Total Dollar Volume $157,058,220 $137,492,456 14.2% Average Sales Price $1,319,817 $1,402,984 -5.9% Average Days On Market 78 62 26.1% Sold / List Price % 97.7% 97.0% 0.7% Average Price per SQFT $376 $373 0.6% Quarter-end inventory 180 164 9.7% PIERCE COUNTY The data is for single family residences over $1M in Pierce County. Some John L. Scott offices are independently owned and operated. All reports presented are based on data supplied by the NWMLS, RMLS, Spokane MLS, and the Central Oregon MLS. Neither the Associations nor the MLS guarantees or is in anyway responsible for its accuracy. Data maintained by the Associations or the MLS may not reflect all real estate activities in the market. Information deemed reliable but not guaranteed. THE AVERAGE DAYS ON MARKET INCREASED BY 26.1% IN Q1 IN PIERCE COUNTY PENDING | JOHNLSCOTT.COM/52790

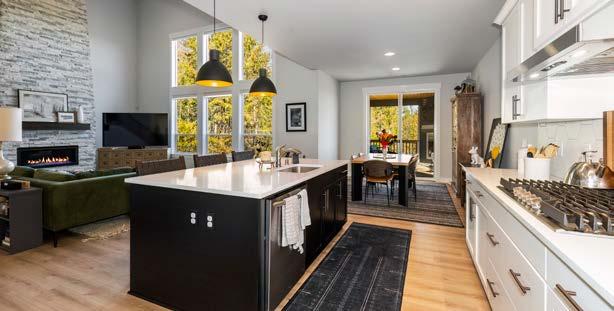
The data is for single family residences over $1M in Kitsap County. Some John L. Scott offices are independently owned and operated. All reports presented are based on data supplied by the NWMLS, RMLS, Spokane MLS, and Central Oregon MLS. Neither the Associations nor the MLS guarantees or is in anyway responsible for its accuracy. Data maintained by the Associations or the MLS may not reflect all real estate activities in the market. Information deemed reliable but not guaranteed. Q1 2024 Q1 2023 % Change Number of Sales 50 45 11.1% Total Dollar Volume $78,439,567 $69,915,775 12.1% Average Sales Price $1,568,791 $1,553,684 0.9% Average Days On Market 46 63 -27.3% Sold / List Price % 97.2% 98.5% -1.3% Average Price per SQFT $499 $483 3.3% Quarter-end inventory 70 64 9.3% OVERALL, THE AVERAGE PRICE PER SQUARE FOOT INCREASED 3.3% IN KITSAP COUNTY KITSAP COUNTY OFFERED AT $1,184,900 | JOHNLSCOTT.COM/45120
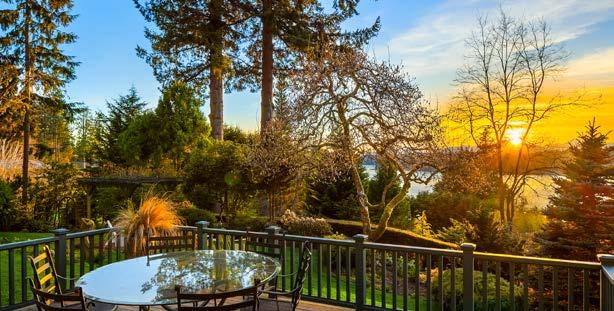
Bainbridge Island is always a sought-after destination for luxury buyers pursuing the lifestyle that only Bainbridge can offer. Demand remains high as we start the second quarter with even lower inventory than we had during the same period in 2023.

2024 Q1 LUXURY MARKET TRENDS Q1 2024 Q1 2023 % Change Number of Sales 7 5 40.0% Total Dollar Volume $18,960,000 $17,830,700 6.3% Average Sales Price $2,708,571 $3,566,140 -24.0% Average Days On Market 55 3 1509.2% Sold / List Price % 94.7% 101.7% -6.9% Average Price per SQFT $895 $833 7.5% Quarter-end inventory 10 15 -33.3% The data is for single family residences over $2M in MLS area 170. Some John L. Scott offices are independently owned and operated. All reports presented are based on data supplied by the NWMLS, RMLS, Spokane MLS, and the Central Oregon MLS. Neither the Associations nor the MLS guarantees or is in anyway responsible for its accuracy. Data maintained by the Associations or the MLS may not reflect all real estate activities in the market. Information deemed reliable but not guaranteed.
PENDING | JOHNLSCOTT.COM/11273
BAINBRIDGE ISLAND

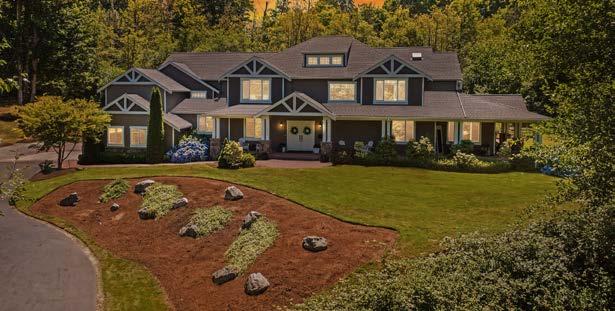
The data is for single family residences over $1M in Snohomish County. Some John L. Scott offices are independently owned and operated. All reports presented are based on data supplied by the NWMLS, RMLS, Spokane MLS, and Central Oregon MLS. Neither the Associations nor the MLS guarantees or is in anyway responsible for its accuracy. Data maintained by the Associations or the MLS may not reflect all real estate activities in the market. Information deemed reliable but not guaranteed. Q1 2024 Q1 2023 % Change Number of Sales 287 276 3.9% Total Dollar Volume $397,391,508 $349,287,723 13.7% Average Sales Price $1,384,639 $1,265,535 9.4% Average Days On Market 35 51 -31.2% Sold / List Price % 100.2% 98.2% 2.0% Average Price per SQFT $463 $418 10.9% Quarter-end inventory 173 201 -13.9% Q1 SAW A 31.2% DECREASE IN DAYS ON MARKET IN SNOHOMISH COUNTY PENDING | JOHNLSCOTT.COM/17212 SNOHOMISH COUNTY


2024 Q1 LUXURY MARKET TRENDS Q1 2024 Q1 2023 % Change Number of Sales 11 20 -45.0% Total Dollar Volume $14,765,500 $32,120,500 -54.0% Average Sales Price $1,342,318 $1,606,025 -16.4% Average Days On Market 70 53 32.7% Sold / List Price % 97.1% 98.1% -1.0% Average Price per SQFT $430 $506 -15.0% Quarter-end inventory 60 44 36.3% ISLAND COUNTY The data is for single family residences over $1M in Island County. Some John L. Scott offices are independently owned and operated. All reports presented are based on data supplied by the NWMLS, RMLS, Spokane MLS, and the Central Oregon MLS. Neither the Associations nor the MLS guarantees or is in anyway responsible for its accuracy. Data maintained by the Associations or the MLS may not reflect all real estate activities in the market. Information deemed reliable but not guaranteed.
PENDING | JOHNLSCOTT.COM/24272
OVERALL, THE AVERAGE SALES PRICE DECREASED BY 16.4% IN ISLAND COUNTY
LUXURY WATERFRONT
KING COUNTY

Q1 2024 Q1 2023 % Change Number of Sales 16 15 6.6% Total Dollar Volume $99,884,000 $144,538,000 -30.8% Average Sales Price $6,242,750 $9,635,867 -35.2% Average Days On Market 23 44 -48.7% Sold / List Price % 98.6% 97.3% 1.3% Average Price per SQFT $1,521 $1,741 -12.6% Quarter-end inventory 29 40 -27.5%
Q1 2024 Q1 2023 % Change Number of Sales 9 3 200.0% Total Dollar Volume $35,934,000 $7,050,000 409.7% Average Sales Price $3,992,667 $2,350,000 69.9% Average Days On Market 68 40 67.7% Sold / List Price % 95.6% 90.4% 5.7% Average Price per SQFT $1,050 $535 96.2% Quarter-end inventory 14 12 16.6% LAKE SAMMAMISH Q1 2024 Q1 2023 % Change Number of Sales 27 26 3.8% Total Dollar Volume $143,468,000 $174,453,000 -17.7% Average Sales Price $5,313,630 $6,709,731 -20.8% Average Days On Market 45 41 10.8% Sold / List Price % 97.4% 97.0% 0.4% Average Price per SQFT $1,319 $1,395 -5.4% Quarter-end inventory 58 67 -13.4%
LAKE WASHINGTON
The data is for waterfront single family residences and condos over $2M. Lake Washington is MLS areas 500, 510, 520, 560, 600, 350, 380, 390, 710, 720. Lake Sammamish is MLS areas 530, 540. Some John L. Scott offices are independently owned and operated. All reports presented are based on data supplied by the NWMLS, RMLS, Spokane MLS, and the Central Oregon MLS. Neither the Associations nor the MLS guarantees or is in anyway responsible for its accuracy. Data maintained by the Associations or the MLS may not reflect all real estate activities in the market. Information deemed reliable but not guaranteed.
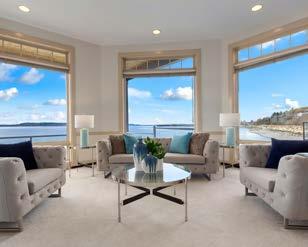

2024 Q1 LUXURY MARKET TRENDS OFFERED AT $2,995,995 | JOHNLSCOTT.COM/76751
FEATURED LUXURY LISTINGS
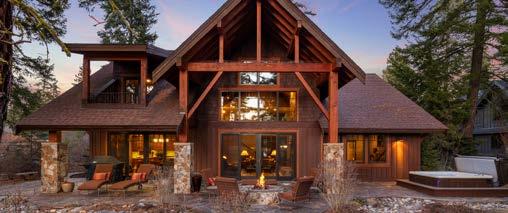
CLE ELUM, WA | $2,100,000 | JOHNLSCOTT.COM/73549
640 SPRAGGER WAY, CLE ELUM, WA 98922
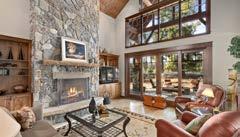

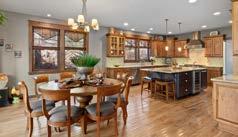
Experience luxury living at this extraordinary custom home situated on the 6th fairway of the Rope Rider golf course at Suncadia. Embrace outdoor living on the spacious walk-out patio with flagstone, fire pit, and hot tub. Unwind in the elegant great room with the huge stone fireplace, soaring ceilings, and solid wood floors. The chef’s kitchen is appointed with top-of-the-line appliances, gorgeous granite counters, and custom finishes. The upper level features two guest ensuites, a bunkroom, and a loft. This residence offers sprawling living spaces perfect for everyone, or explore the resort’s amenities, including golf, spa, winery, and hiking trails. Your dream home awaits in Suncadia!

SUSAN WEST 509.304.4007
susanwest@johnlscott.com
OLYMPIA, WA | $1,395,000 | JOHNLSCOTT.COM/24121
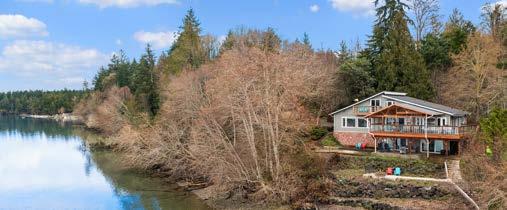
4305 79TH AVE NW, OLYMPIA, WA 98502
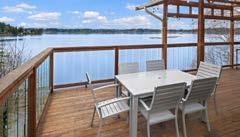
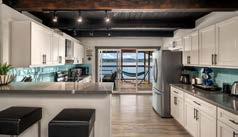
Explore waterfront living at its finest in a home fully renovated in 2022! The home features over $200K in upgrades, including custom lighting and sweeping windows throughout. On the main level, the gourmet kitchen features high-end appliances and opens to an expansive covered deck for year-round enjoyment. The open great room boasts a brand-new electric fireplace with abundant space for living and dining. Retreat to the lavish primary suite with a private deck, bay windows, and a spa inspired bath. The lower level offers two bedrooms and bath with a covered patio. The upper level is complete with two beds, a powder room, and a balcony. Outdoors, repose in the serene garden or around the fire pit with picturesque views and concrete stairs for easy access. The property is equipped with a new EV charger and newer Presidential roof. A unique private end retreat with panoramic water views, this property is ideally suited for exploring shellfish beds, enjoying the beach, kayaking, and paddle boarding.


TUAN & TUYET
206.551.8841
team@tuantuyet.com
2024 Q1 LUXURY MARKET TRENDS
EASTERN WASHINGTON & IDAHO


2024 Q1 LUXURY

COEUR D’ALENE, IDAHO Q1 2024 Q1 2023 % Change Number of Sales 59 57 3.5% Total Dollar Volume $74,082,772 $94,714,996 -21.7% Average Sales Price $1,255,640 $1,661,667 -24.4% Average Days On Market 117 55 114.3% Sold / List Price % 78.7% 89.8% -12.3% Average Price per SQFT $359 $23 1468.8% Quarter-end inventory 230 205 12.2% The data is for single family residences over $1M in Kootenai County. Some John L. Scott offices are independently owned and operated. All reports presented are based on data supplied by the NWMLS, RMLS, Spokane MLS, and Central Oregon MLS. Neither the Associations nor the MLS guarantees or is in anyway responsible for its accuracy. Data maintained by the Associations or the MLS may not reflect all real estate activities in the market. Information deemed reliable but not guaranteed. THE NUMBER OF SALES IN COEUR D’ALENE INCREASED 3.5%

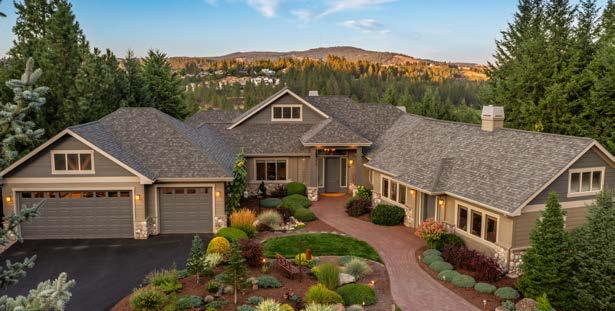
2024 Q1 LUXURY MARKET TRENDS SPOKANE COUNTY Q1 2024 Q1 2023 % Change Number of Sales 22 23 -4.3% Total Dollar Volume $24,670,575 $29,241,296 -15.6% Average Sales Price $1,121,390 $1,271,361 -11.8% Average Days On Market 80 91 -12.0% Sold / List Price % 88.6% 93.2% -5.0% Average Price per SQFT $266 $47 464.4% Quarter-end inventory 111 56 98.2% The data is for single family residences over $1M in Spokane County. Some John L. Scott offices are independently owned and operated. All reports presented are based on data supplied by the NWMLS, RMLS, Spokane MLS, and Central Oregon MLS. Neither the Associations nor the MLS guarantees or is in anyway responsible for its accuracy. Data maintained by the Associations or the MLS may not reflect all real estate activities in the market. Information deemed reliable but not guaranteed. OFFERED AT $1,275,000 | JOHNLSCOTT.COM/60879 THE AVERAGE SALES PRICE IN SPOKANE COUNTY DECREASED 11.8%
OREGON & SOUTHWEST WASHINGTON

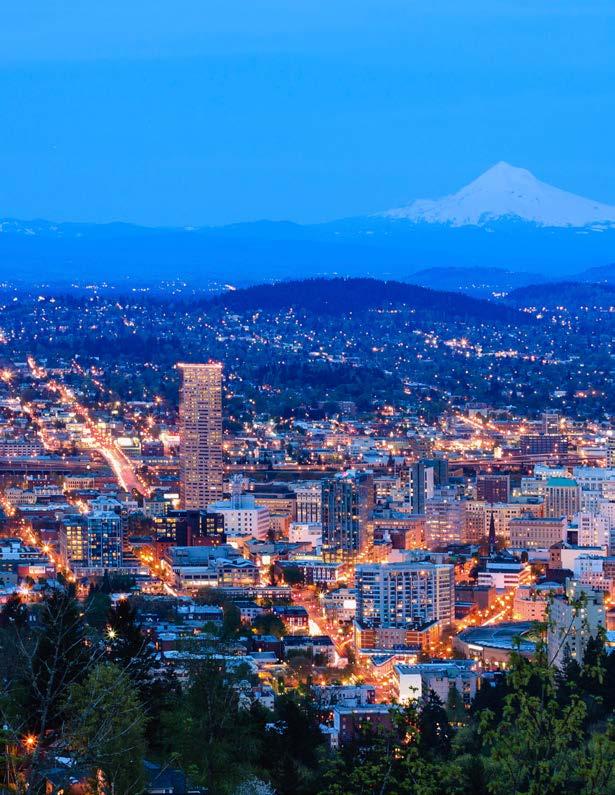
The first quarter of 2024 provided more inventory and options for buyers in the luxury price ranges, which also led to an increase in closed transactions and the number of active listings available as we enter the second quarter.
PORTLAND METRO
In Lake Oswego, closed transactions increased when compared with 2023 and the average number of days on the market decreased, signaling that competition amongst buyers is still present. Relief may come for buyers as inventory typically increases in the spring and summer months.
LAKE OSWEGO

2024 Q1 LUXURY MARKET TRENDS Q1 2024 Q1 2023 % Change Number of Sales 78 72 8.3% Total Dollar Volume $102,457,877 $100,643,201 1.8% Average Sales Price $1,313,563 $1,397,822 -6.0% Average Days On Market 60 50 20.9% Sold / List Price % 96.8% 96.6% 0.1% Average Price per SQFT $474 $469 1.1% Quarter-end inventory 171 135 26.6%
The data is for single family residences over $1M in Clackamas, Multnomah, Washington and Columbia Counties. Some John L. Scott offices are independently owned and operated. All reports presented are based on data supplied by the NWMLS, RMLS, Spokane MLS, and Central Oregon MLS. Neither the Associations nor the MLS guarantees or is in anyway responsible for its accuracy. Data maintained by the Associations or the MLS may not reflect all real estate activities in the market. Information deemed reliable but not guaranteed. PENDING | JOHNLSCOTT.COM/34823
FIRST QUARTER HIGHLIGHTS
Q1 2024 Q1 2023 % Change Number of Sales 57 50 14.0% Total Dollar Volume $106,161,745 $87,222,350 21.7% Average Sales Price $1,862,487 $1,744,447 6.7% Average Days On Market 45 60 -25.3% Sold / List Price % 97.4% 96.8% 0.6% Average Price per SQFT $723 $672 7.5% Quarter-end inventory 99 88 12.5%
OFFERED AT $1,495,000 | JOHNLSCOTT.COM/75501

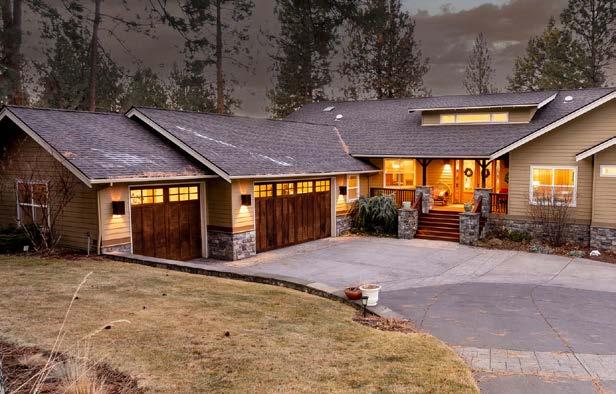
The data is for single family residences over $1M in Bend Oregon. Some John L. Scott offices are independently owned and operated. All reports presented are based on data supplied by the NWMLS, RMLS, Spokane MLS, and the Central Oregon MLS. Neither the Associations nor the MLS guarantees or is in anyway responsible for its accuracy. Data maintained by the Associations or the MLS may not reflect all real estate activities in the market. Information deemed reliable but not guaranteed. Q1 2024 Q1 2023 % Change Number of Sales 137 107 28.0% Total Dollar Volume $209,973,733 $162,674,455 29.0% Average Sales Price $1,532,655 $1,520,322 0.8% Average Days On Market 80 67 19.9% Sold / List Price % 96.9% 96.3% 0.5% Average Price per SQFT $516 $496 4.1% Quarter-end inventory 265 215 23.2%
IN Q1, THE AVERAGE SALES PRICE INCREASED BY 0.8% IN BEND
BEND

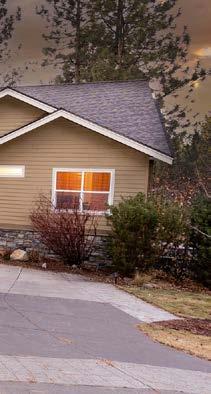

After the annual winter clean-up activity in Bend, the listings and buyers are starting to appear out of hibernation. An increase in closed transactions during the first quarter of 2024, when compared with the same period in 2023, reinforces the desirability of this destination market.
Bend will continue to draw high-net-worth individuals who are seeking to relocate, retire or purchase a second home, due to the area’s appealing lifestyle for residents.
2024 Q1 LUXURY MARKET TRENDS
OFFERED AT $1,850,000 | JOHNLSCOTT.COM/62540

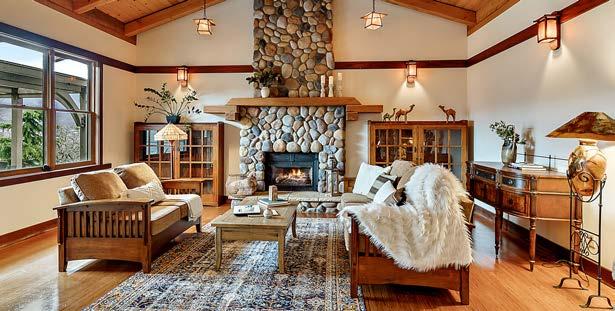
The data is for single family residences over $1M in Jackson County. Some John L. Scott offices are independently owned and operated. All reports presented are based on data supplied by the NWMLS, RMLS, Spokane MLS, and Central Oregon MLS. Neither the Associations nor the MLS guarantees or is in anyway responsible for its accuracy. Data maintained by the Associations or the MLS may not reflect all real estate activities in the market. Information deemed reliable but not guaranteed. Q1 2024 Q1 2023 % Change Number of Sales 17 8 112.5% Total Dollar Volume $24,602,784 $11,624,500 111.6% Average Sales Price $1,447,223 $1,453,063 -0.4% Average Days On Market 131 131 N/A Sold / List Price % 103.0% 89.4% 15.2% Average Price per SQFT $411 $339 20.9% Quarter-end inventory 90 86 4.6% JACKSON COUNTY OFFERED AT $1,925,000 | JOHNLSCOTT.COM/73380 THE NUMBER OF SALES INCREASED BY 112.5% IN Q1 IN JACKSON COUNTY

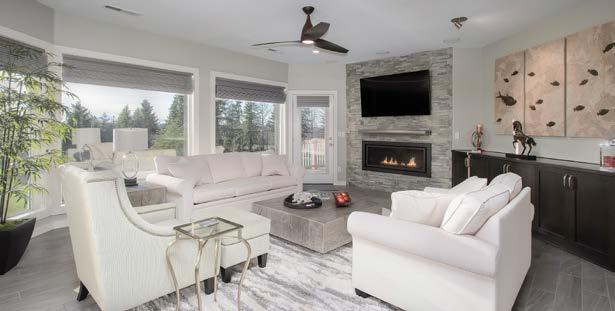
2024 Q1 LUXURY MARKET TRENDS Q1 2024 Q1 2023 % Change Number of Sales 58 55 5.4% Total Dollar Volume $72,277,036 $73,831,725 -2.1% Average Sales Price $1,246,156 $1,342,395 -7.1% Average Days On Market 103 75 38.2% Sold / List Price % 94.3% 98.1% -3.8% Average Price per SQFT $458 $485 -5.5% Quarter-end inventory 220 162 35.8% CLARK COUNTY The data is for single family residences over $1M in Clark County. Some John L. Scott offices are independently owned and operated. All reports presented are based on data supplied by the NWMLS, RMLS, Spokane MLS, and the Central Oregon MLS. Neither the Associations nor the MLS guarantees or is in anyway responsible for its accuracy. Data maintained by the Associations or the MLS may not reflect all real estate activities in the market. Information deemed reliable but not guaranteed. IN Q1, THE AVERAGE SALES PRICE DECREASED 7.1% IN CLARK COUNTY OFFERED AT $2,100,000 | JOHNLSCOTT.COM/47266

WONDERS DOWN UNDER
UNIQUE WAYS TO TAKE ON THE WILDS OF AUSTRALIA
By Lisa Klein
The entire continent of Australia is a wonderland of rare sights: Kangaroos, koalas, platypuses and other animals that only live there; a giant, untamed countryside known for its harsh weather and terrain; and the diving site to top them all, the Great Barrier Reef. While Sydney, or another city, often serves as a base to take in the urban atmosphere and worldfamous beaches with a quick venture into the wild, these off-the-beaten-path experiences will have travelers seeing all that Australia is in a new light.
Track through the outback by train
The fabled Australian outback stretches across the remote and expansive interior of the continent. The Ghan, an allinclusive luxury train just as momentous as the land it intersects from north to south, has been crossing the “Red Center” since 1929, taking its name from the route used by Afghani cameleers in the 1800s. A trip on its epic four-day, 1,851-mile Ghan Expedition from Darwin to Adelaide (shorter trips are also available) takes travelers to numerous awe-inspiring sights beyond the bush.
According to Journey Beyond, the Ghan’s parent company, “Australia’s interior is as vast as it is diverse — arid, dry plains are juxtaposed against lush, green vistas, with two coastlines framing each side. There’s something special about traveling across Australia by train and looking out the window at an endless horizon full of possibilities.”
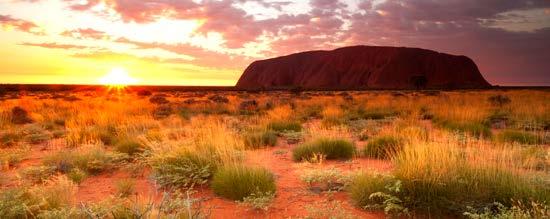
On the Ghan, those possibilities include a stop in Katherine, where guests will cruise through the Nitmiluk Gorge to take in its natural beauty and indigenous cultural significance, and have a true outback experience at a working cattle ranch, complete with stockman stories, live music and horseback riding and cattle dog demonstrations. In Alice Springs, a deeper look at the landscape and First Nations cultures unfolds on walks through Standley Chasm and Simpsons Gap. An optional add-on flight to the iconic Uluru — the massive, red rock standing alone in the desert — tops many a bucket list, with the day’s adventures ending with an outdoor barbeque under a blanket of stars. And in one of Australia’s quirkiest towns, the opal mining outpost of Coober Pedy, guests can try their hand at finding their own opal and eat lunch like a local — underground, where half of its residents live.
“While there are many ways to see [the outback], there’s only one way to do it with ease and in comfort,” says Journey Beyond. “That’s the fabulous fun of rail travel, where everything comes together in a theater-like performance. On board, the stage is set as your backdrop whistles by.”
Bask in the bush on a safari
Australia’s tropical “Top End,” in the northern reaches of the Northern Territory, is filled with parks teeming with both biodiversity and enormous cultural significance. Kakadu National Park, a UNESCO World Heritage Site, is the oldest known human-occupied place in Australia, with over 2,000 plant species and a large chunk of the continent’s bird and mammal species — many found nowhere else. On the edge of the park, on the Mary River floodplain, the all inclusive Bamurru Plains is a luxury safari camp ripe for experiencing all this rich area has to offer.
“The true luxury of Bamurru Plains is its location, a beautiful wilderness region of over [115 square miles], home to one of the largest crocodile populations in the world and the annual migration of over 100,000 magpie geese — an incredible sight and sound to behold,” says Matthew Bowen, general manager of Bamurru Plains, operated by Wild Bush Luxury.

The camp’s bungalows, and new Jabiru Retreat that has a private plunge pool and walkway connecting two of them, have mesh walls on three sides to fully take in the surrounding wilderness. Twice-daily safaris bring guests into the bush and include guided walks, open-top drives, airboat rides, crocodile-spotting river cruises and birdwatches. From the swarms of magpie geese and whistling ducks to brolgas and jabirus, the skies are full of avian life. Water buffalo, brahman cattle, wallabies and giant termite mounds are also just beyond the bungalow flaps. An add-on trip to Kakadu allows guests an inside look at Aboriginal culture, mythology and 20,000-year-old rock paintings.
“Situated on the edge of Kakadu National Park, this ‘Luxury Lodge of Australia’ is truly a unique experience that must be seen to be believed,” Mr. Bowen says. “Arrive in true outback style along the dirt roads while water buffalo graze along the roadside. As the lodge comes into view, so does the incredible Mary River floodplain that the safari bungalows overlook. There is nowhere else in the world like the ‘Top End’ of Australia — and nowhere like Bamurru.”
Sleep with the fish on a Great Barrier Reef-stay
As the only living thing visible from space, one of the most diverse ecosystems on Earth and a UNESCO World Heritage Site, the Great Barrier Reef is a must-visit in Australia. And it gets even more epic: Floating 39 nautical miles from the Queensland shore on the northeast coast, just beyond the white-sand Whitsunday Islands, is a once-in-a-lifetime chance to spend a night on — or underwater in — the reef, thanks to Cruise Whitsundays’ Reefworld. A permanently docked pontoon sits above Hardy Reef, offering two-day, one-night stays: Reefsleep, in which guests get to take in the stars on the boat’s deck from their personal, outdoor sleep pod, and Reefsuites, Australia’s first underwater accommodations.
“Featuring floor-to-ceiling glass walls, the room acts like a personal underwater observatory, allowing you to wake up to an aquatic wonderland surrounded by calm, blue water and an abundance of marine life,” says Cruise Whitsundays’ parent company, Journey Beyond, of the two Reefsuites. “If you’re lucky, you may even be graced with an appearance by the resident rockstar himself, ‘George the Grouper.’”
Overnight adventurers will spend their days in the water swimming, snorkeling and scuba diving, along with a semi-submarine ride and access to an underwater observatory on board. And if sleeping underneath the waves, guests can view the abundant sea life right from bed. The list of creatures of the Great Barrier Reef is long (25 percent of known marine species live there), but frequent sightings at Reefworld include sea turtles, clownfish, giant clams and Māori wrasse, over-six-foot-long fish with bumpy heads and giant lips known as the “big, friendly puppies” of the reef, who follow divers and snorkelers around. For a view from above, helicopter rides over the famous Heart Reef are also available.
PER JOURNEY BEYOND, “It’s an underwater world just below the blue water’s surface, nd the Whitsundays are the gateway to explore it. Reefworld allows a completely immersive experience in the world’s largest coral reef system, a spectacular marine life force that rules the waters off the coast of Queensland.”
2024 Q1 LUXURY MARKET TRENDS
reproduced with permission from Luxury Portfolio International and Luxury Portfolio magazine. © Luxury Portfolio International. All rights reserved. Photo credit: istock.com
Text
@JLSexceptionalhomes @exceptional_homesjls Connect with us: PENDING |
JOHNLSCOTT.COM/66859


 J. Lennox Scott Chairman and CEO
John L. Scott Real Estate


 CHALKER Redmond
SORIANO Central Oregon


