LUXURY MARKET TRENDS
THE NEW YEAR IS HERE!
The year 2022 was a dynamic year for luxury real estate and moving forward many eyes will be on the market to see what happens next!
After two years of frenzied markets and low inventory, the end of 2022 presented us with a calming of the “COVID boom” and brought more stability to many neighborhoods and communities. We’ve seen an increase in demand for homes in major cities near the business centers and a stabilization in some of the second-home markets.
We begin 2023 with a low level of luxury inventory combined with healthy buyer demand to set the stage for the upcoming seasonal increase of activity. As inflation continues to roll over, we will see two items occur. Home mortgage interest rates will lower and at some point, the stock market will surge. At the tail end of the first quarter in March, the prime luxury market season will begin and run through September.
We hope you’ll find the market information and luxury insights in this report helpful as you look to buy or sell your next home!
J. Lennox Scott Chairman and CEO John L. Scott Real Estate

EXCEPTIONAL HOMES
BY JOHN L. SCOTT
Exceptional Homes is John L. Scott’s luxury real estate brand. Together with our luxury broker associates, our global partners at Luxury Portfolio International, and our support staff, we strive to provide concierge-level service by putting clients first.
We can ensure you that we are here for you and your family. The real estate market is fast-paced and ever changing, but what hasn’t changed, is our commitment to exceed your expectations when you are ready to buy or sell your home.
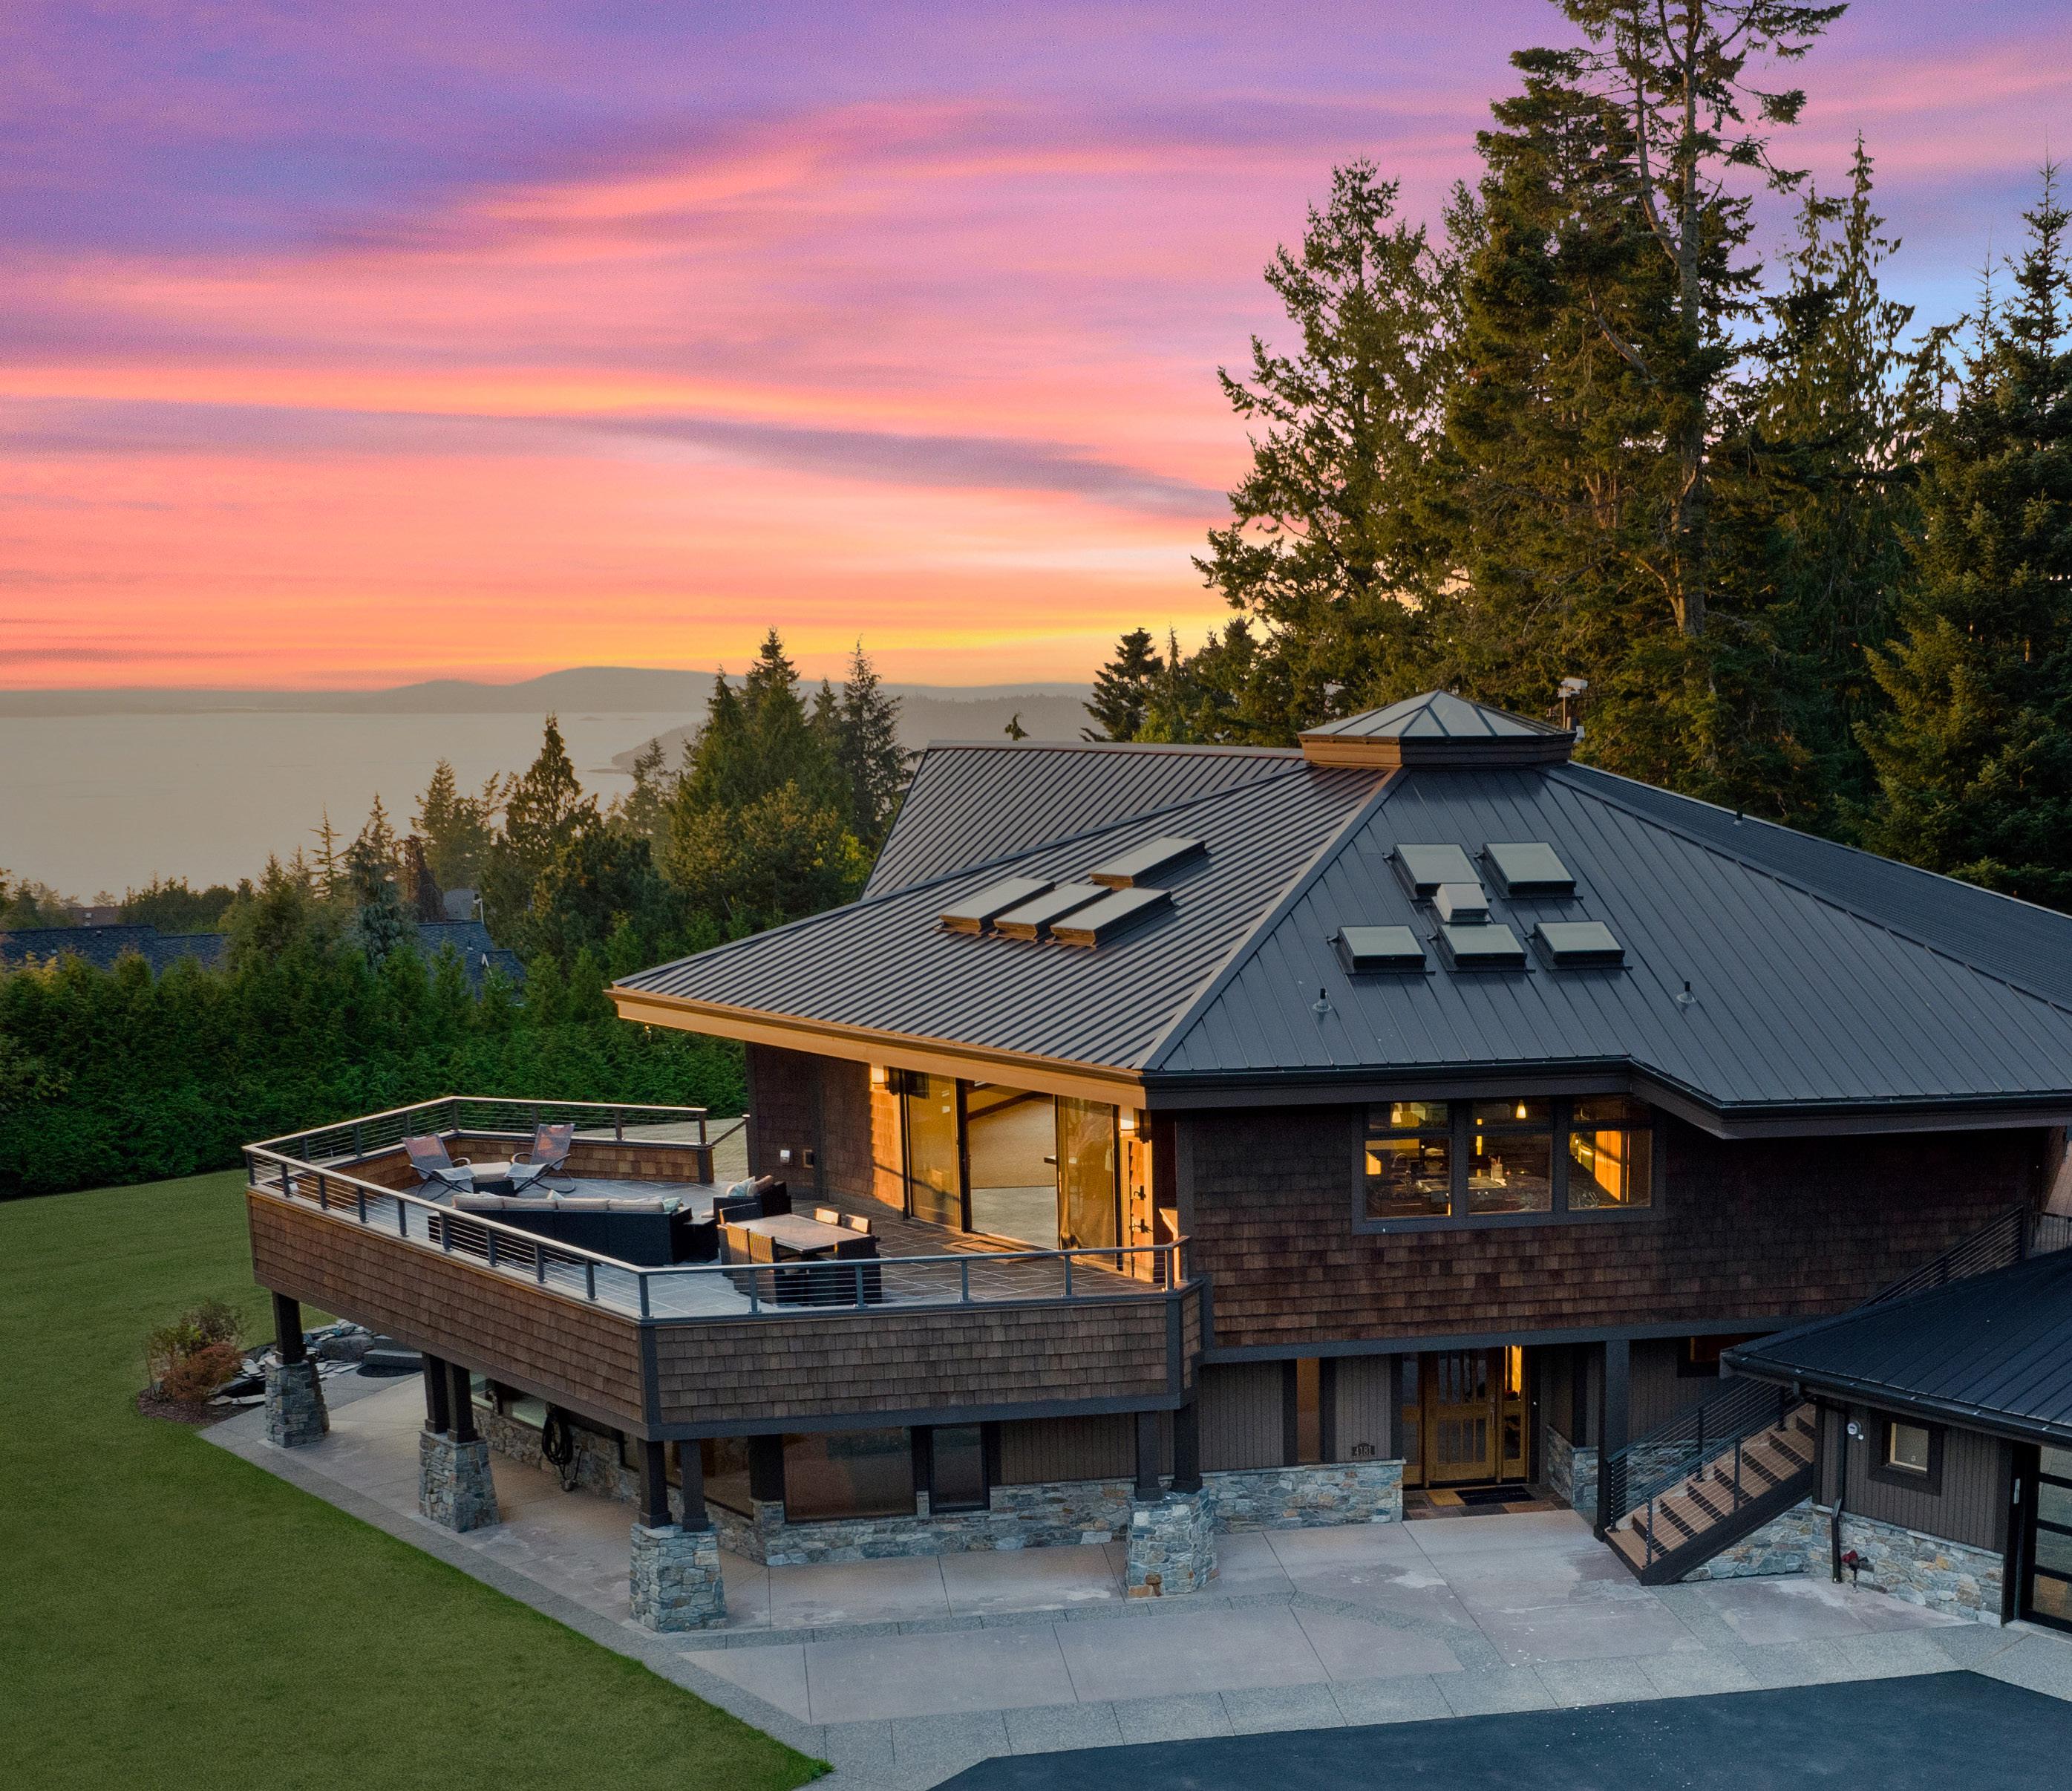
ON THE COVER: OFFERED AT $2,250,000 | JOHNLSCOTT.COM/19862
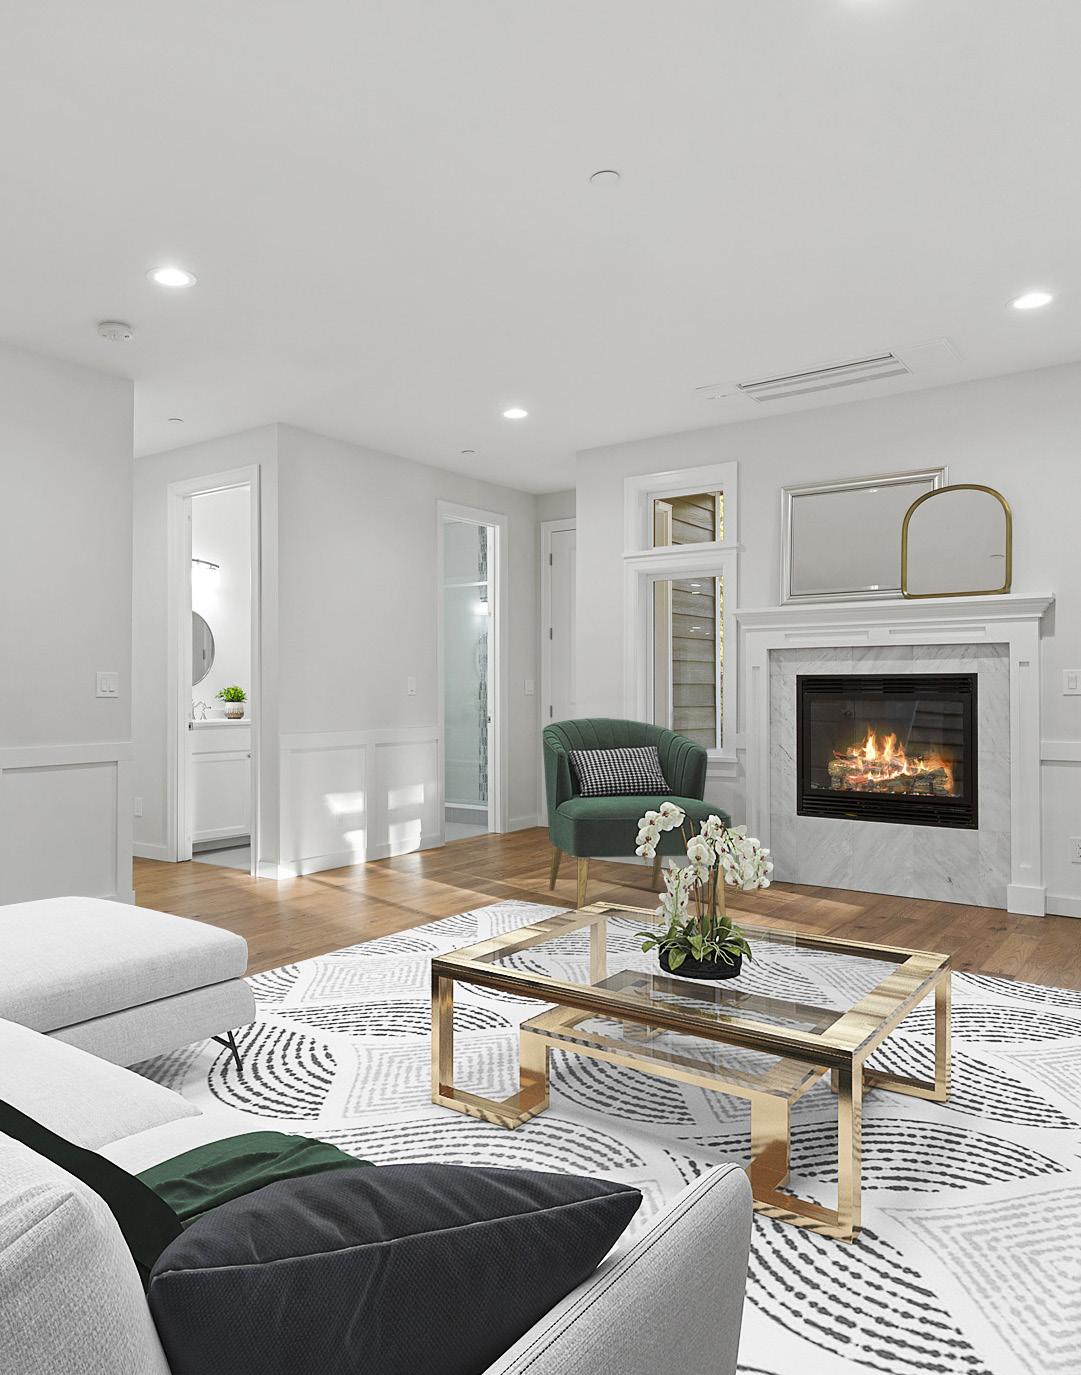
ON THE RIGHT: OFFERED AT $3,750,000 | JOHNLSCOTT.COM/17331
LIVE YOUR
Luxury
John L. Scott is a founding member of the international organization Leading Real Estate Companies of the World®.

Founded in 1931, JLS operates over 100 offices with over 3,000 agents throughout WA, OR, ID & CA

John L. Scott’s luxury brand, providing our agents with tools and data to help each and every client live their luxury
A global community of over 565 real estate companies awarded membership based on rigorous standards for service and performance

The luxury division of LeadingRE & the largest global network of the most powerful, independent luxury firms

550 Member Firms BY THE NUMBERS 4,600 Offices Worldwide Total Inventory $58 BILLION
ARE
WE
GLOBAL
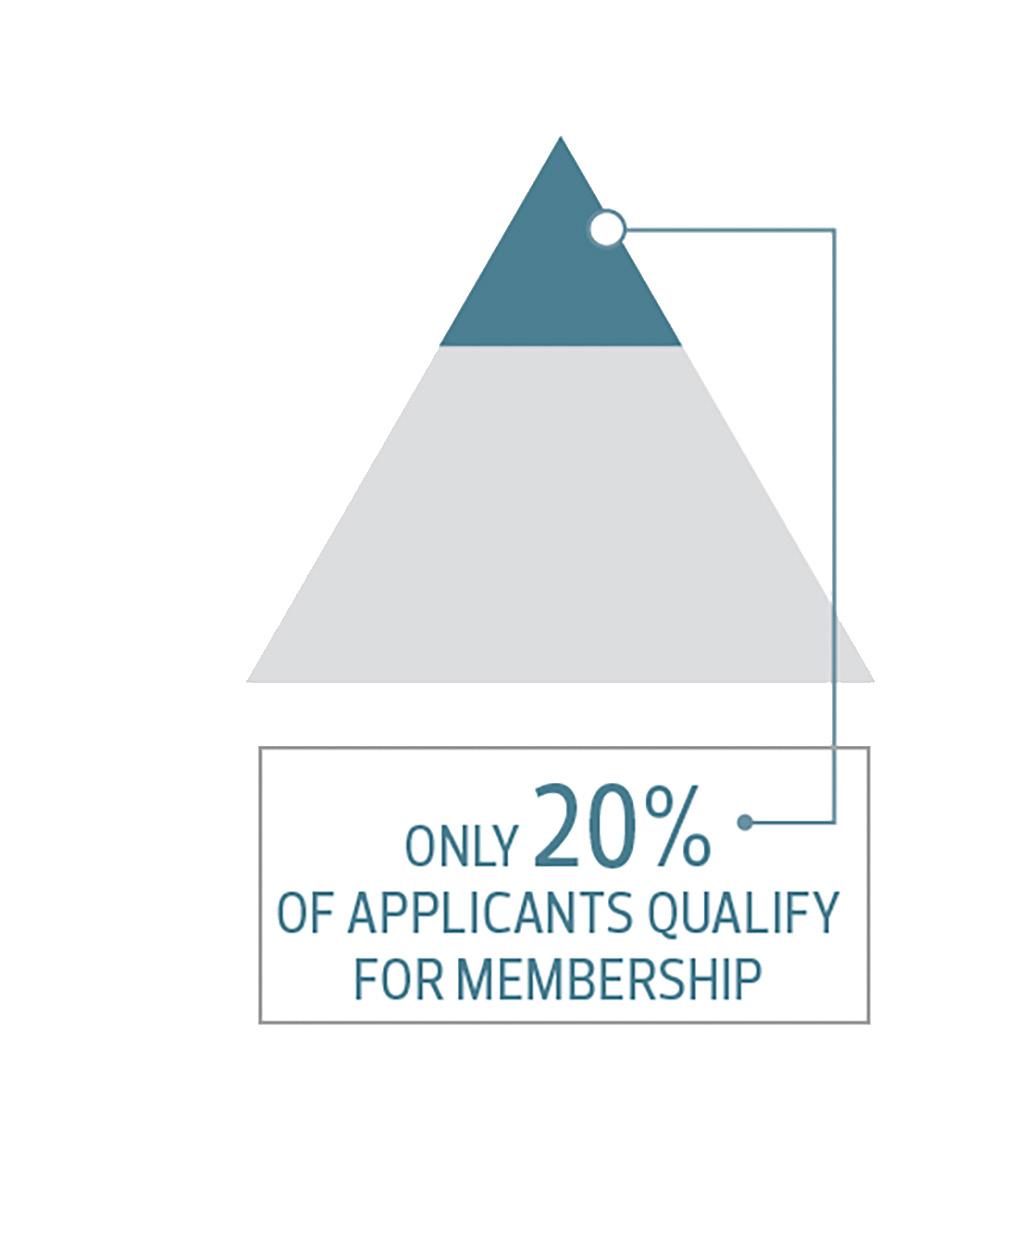
80% of applicants
this network are turned down
to



Associates Worldwide 6 Continents with Member Companies 130,000 Average Property $2.6 MILLION
MORE U.S. HOME SALES VOLUME
THAN ANY OTHER REAL ESTATE NETWORK, FRANCHISE OR BROKERAGE BRAND. $296 BILLION IN U.S. HOME SALES VOLUME.
JOHN L. SCOTT LUXURY SPECIALISTS SCHOLARS OF THE MARKET
Curious about luxury trends in your neighborhood? See what some of our real estate specialists had to say about the luxury market in their area.


The upper end of the market remained very selective in the 4th quarter, with buyer uncertainty about the future and higher interest rates fueling the fire for exacting negotiations on almost all properties. Some homes priced appropriately or with recent price reductions obtained offers at list price, while others that have been on the market longer and had ‘slight’ price adjustments sold with more aggressive offers.
ANNALEE BAGLIO


The luxury real estate market went still in Q3 and remains the same. Many luxury listings went off the market until after the first of the year in hopes of more post-holiday buyers/shoppers. High-end purchasers are sitting back and seeing how the first 6 months to 1 year shakes out in this corrective market. They are also eyeing the back foreclosure lists closely. Depending on rates and inventory, I anticipate there to be a spring/summer uptick in luxury purchases, but that is standard.
I expect the luxury custom home construction market to rise in Kitsap County as there are some lovely estate-worthy sized parcels coming available in the Fiber Optic zones. I also anticipate if the spring proves productive that we may see a liquidation of luxury homes in the higher age bracket.
Port Orchard
PATTI
CHALKER
Redmond
In Q4, many prospective buyers expressed uncertainty in the stock market, and hesitation to move money around. We also have a number of clients relocating from larger markets who were affected by recent layoffs. Luxury homes are taking longer to sell than in 2021, but not significantly longer than in years past. We’re seeing fewer multiple-offer scenarios, so pricing strategy has become more important. We have a number of high-end buyers who remain interested in purchasing this year, but seem to be waiting for interest rates to come down. We expect more conversations about seller-carried financing as interest rates continue to rise.



2022 Q4 LUXURY MARKET TRENDS
ROWE
TEAM Ashland
PUGET SOUND


The luxury real estate market in Seattle, West Bellevue and on the Eastside continued the intensity adjustment which began in the previous quarter of 2022. Over the winter fewer listings came on the market with many buyers waiting in the wings and taking their time.
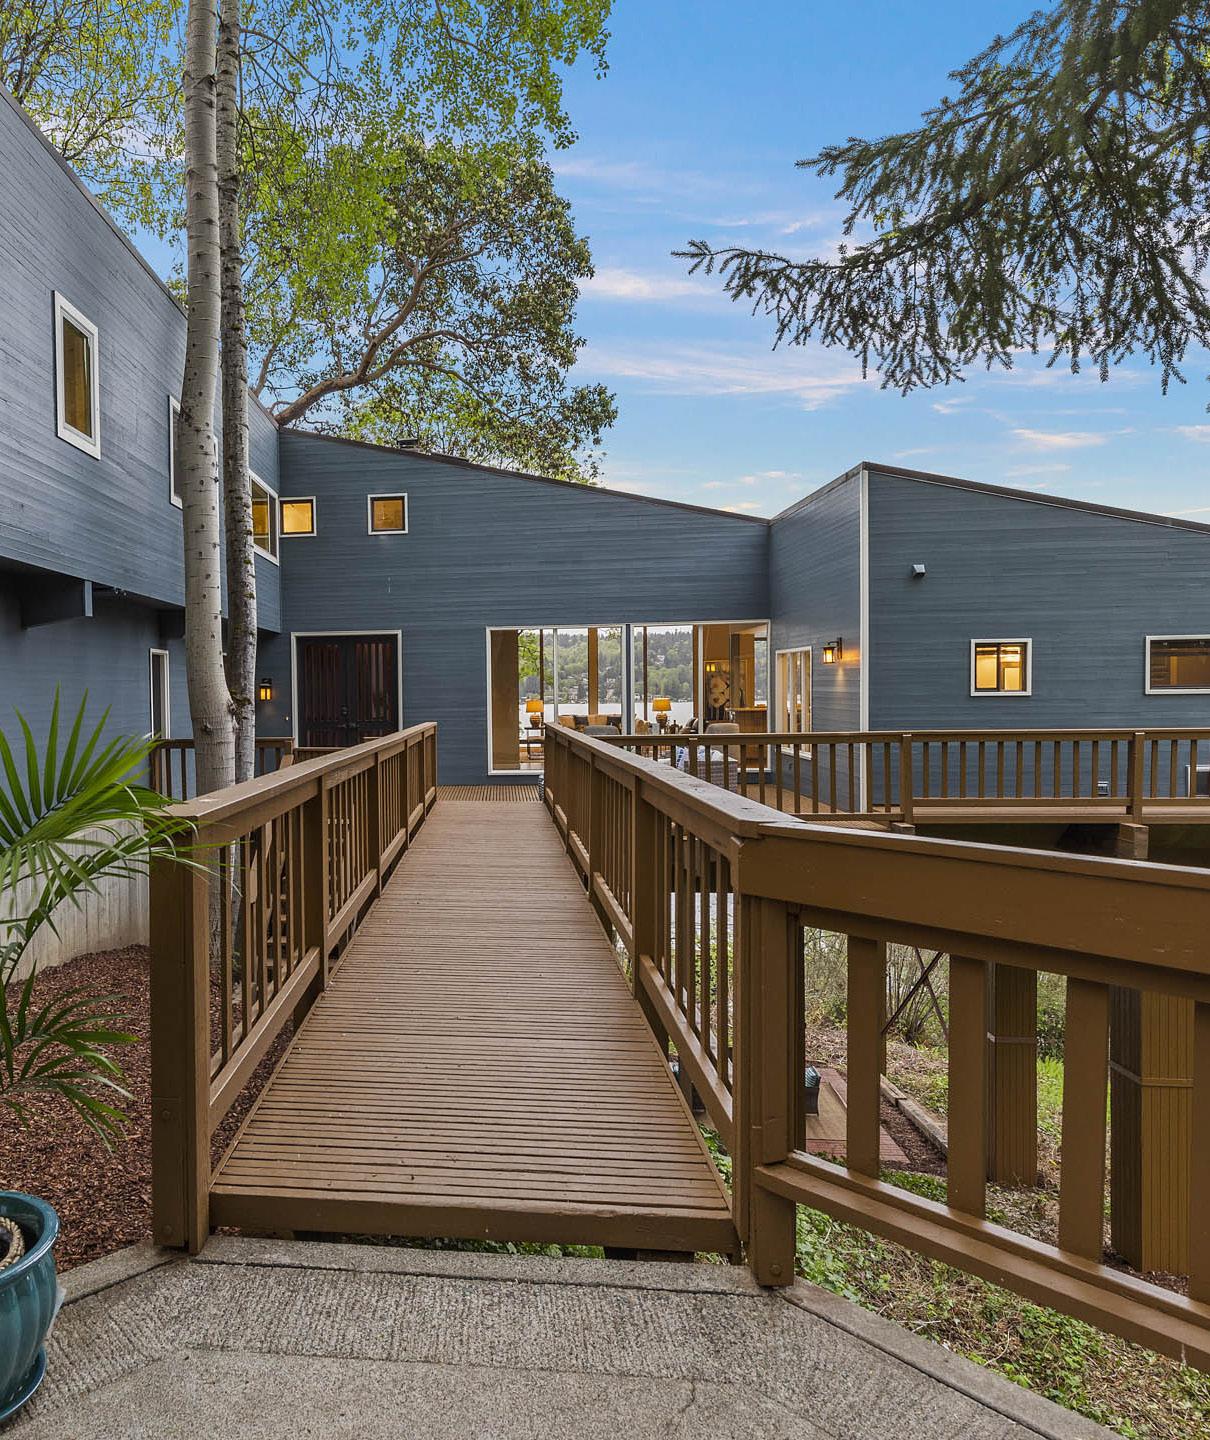

Active inventory has continued to tick upwards as we’ve seen increased days on market for many listings in Seattle, West Bellevue and Mercer Island. The seasonality of the closing months of the year typically results in a slower pace for sellers and buyers alike.

2022 Q4 LUXURY MARKET TRENDS Q4 2022 Q4 2021 % Change
of Sales 76 122
Volume
Average Sales Price
Average Days On Market 30
Sold / List Price %
99.7%
Price per SQFT $696 $768
63 31
QUARTER
Number
-37.7% Total Dollar
201,694,000 398,055,888 -49.3%
2,653,868 3,262,753 -18.6%
21 42.6%
96.2%
-3.5% Average
-9.3% Quarter-end inventory
103.2% SEATTLE FOURTH
HIGHLIGHTS
The data is for single family residences over $2M in MLS areas 140, 380, 385 390, 700, 701, 705, 710. Some John L. Scott offices are independently owned and operated. All reports presented are based on data supplied by the NWMLS, RMLS, Spokane MLS, and Central Oregon MLS. Neither the Associations nor the MLS guarantees or is in anyway responsible for its accuracy. Data maintained by the Associations or the MLS may not reflect all real estate activities in the market. Information deemed reliable but not guaranteed. SOLD | JOHNLSCOTT.COM


Q4 2022 Q4 2021 % Change Number of Sales 38 74 -48.6% Total Dollar Volume 160,026,990 345,451,688 -53.6% Average Sales Price 4,211,237 4,668,266 -9.7% Average Days On Market 33 24 38.3% Sold / List Price % 94.9% 102.2% -7.2% Average Price per SQFT $1,000 $1,141 -12.3% Quarter-end inventory 39 6 550.0% WEST BELLEVUE OFFERED AT $2,448,000 | JOHNLSCOTT.COM/42965 In West Bellevue during the fourth quarter we saw a return to a less frenzied sales activity intensity. The data is for single family residences over $2M in MLS area 520. Some John L. Scott offices are independently owned and operated. All reports presented are based on data supplied by the NWMLS, RMLS, Spokane MLS, and the Central Oregon MLS. Neither the Associations nor the MLS guarantees or is in anyway responsible for its accuracy. Data maintained by the Associations or the MLS may not reflect all real estate activities in the market. Information deemed reliable but not guaranteed.


2022 Q4 LUXURY MARKET TRENDS MERCER ISLAND Q4 2022 Q4 2021 % Change Number of Sales 23 43 -46.5% Total Dollar Volume 89,062,300 144,482,290 -38.3% Average Sales Price 3,872,274 3,360,053 15.2% Average Days On Market 43 12 274.6% Sold / List Price % 96.50% 102.40% -5.7% Average Price per SQFT $954 $759 25.7% Quarter-end inventory 23 2 1050.0% SOLD | JOHNLSCOTT.COM In
The data is for single family residences over $2M in MLS area 510. Some John L. Scott offices are independently owned and operated. All reports presented are based on data supplied by the NWMLS, RMLS, Spokane MLS, and the Central Oregon MLS. Neither the Associations nor the MLS guarantees or is in anyway responsible for its accuracy. Data maintained by the Associations or the MLS may not reflect all real estate activities in the market. Information deemed reliable but not guaranteed.
contrast to the boom of the past two years, Mercer Island luxury home buyers have a selection of unsold inventory available consistent with pre-pandemic levels for this time of year.

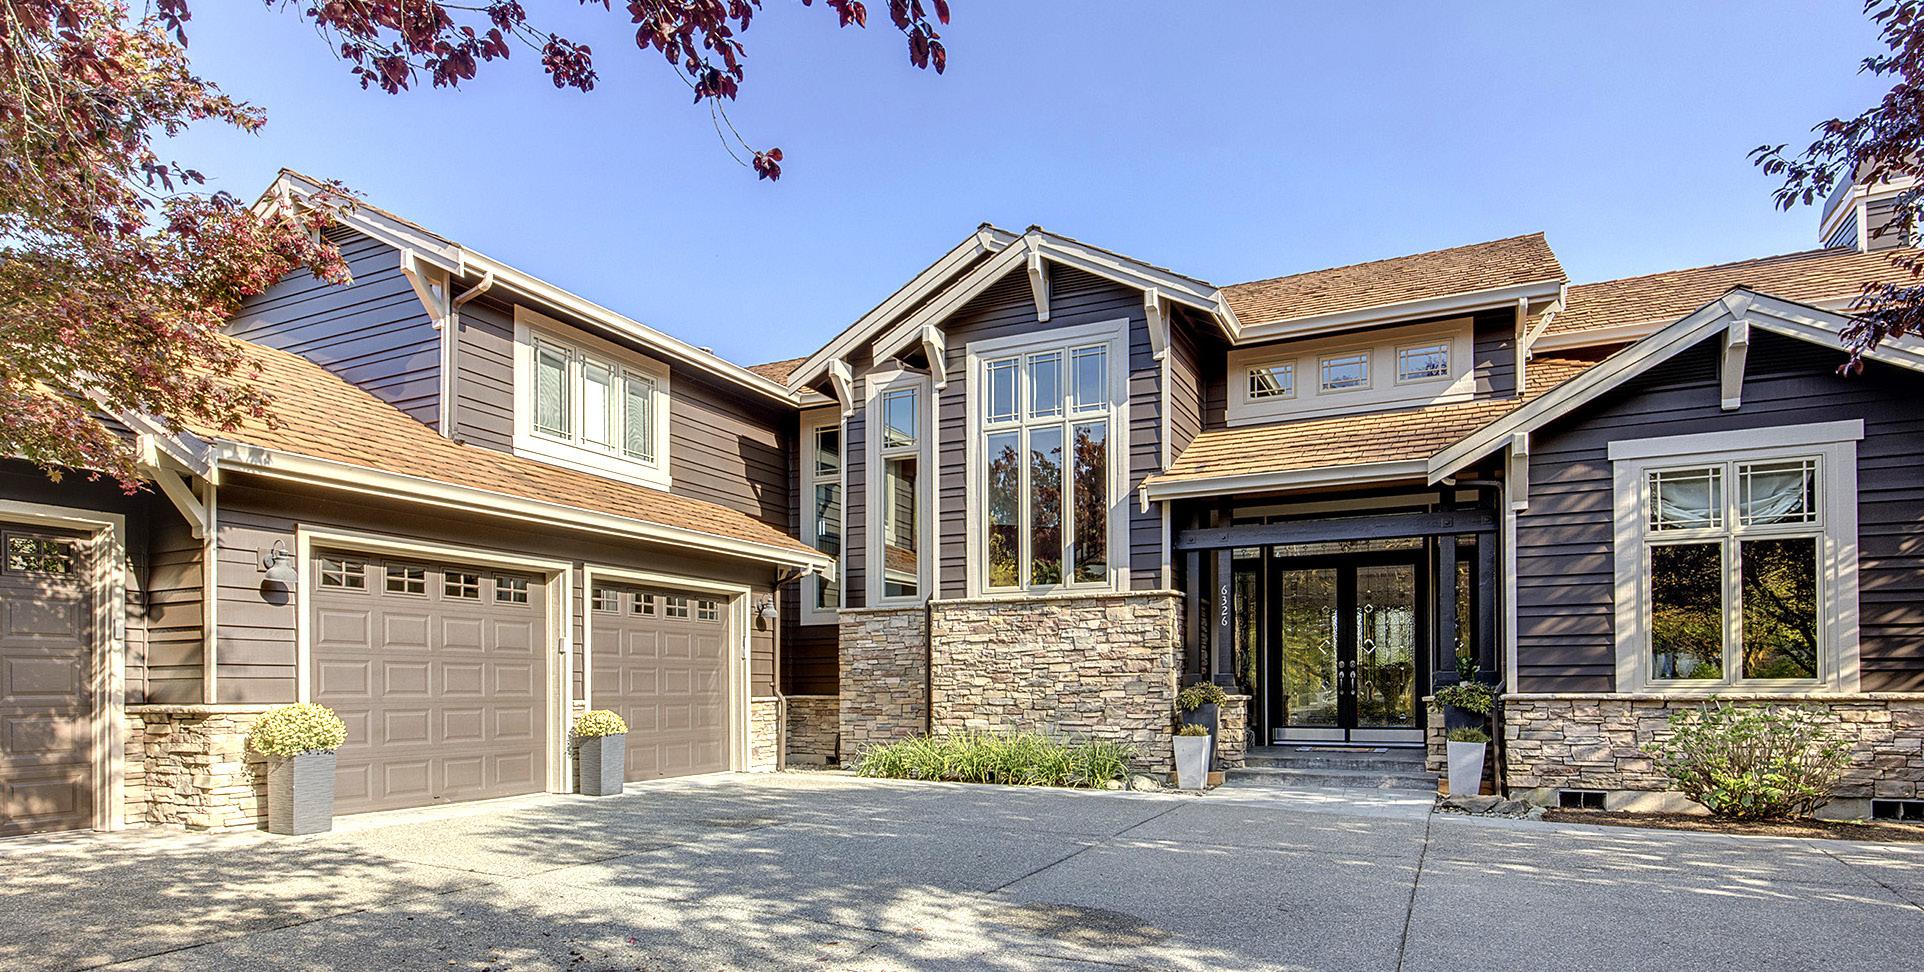
EASTSIDE OFFERED AT $2,599,900 | JOHNLSCOTT.COM/35754 Q4 2022 Q4 2021 % Change Number of Sales 254 353 -28.0% Total Dollar Volume 778,651,624 1,189,097,515 -34.5% Average Sales Price 3,065,558 3,368,548 -8.9% Average Days On Market 35 18 94.3% Sold / List Price % 95.8% 102.5% -6.6% Average Price per SQFT $749 $787 -4.8% Quarter-end inventory 193 30 543.3% The data is for single family residences over $2M in MLS areas 500, 510, 520, 530, 540, 550, 560, 600. Some John L. Scott offices are independently owned and operated. All reports presented are based on data supplied by the NWMLS, RMLS, Spokane MLS, and the Central Oregon MLS. Neither the Associations nor the MLS guarantees or is in anyway responsible for its accuracy. Data maintained by the Associations or the MLS may not reflect all real estate activities in the market. Information deemed reliable but not guaranteed. 94.3% DAYS ON MARKET -8.9% AVERAGE SALES PRICE


2022 Q4 LUXURY MARKET TRENDS KING COUNTY CONDO SOLD | JOHNLSCOTT.COM Q4 2022 Q4 2021 % Change Number of Sales 15 23 -34.7% Total Dollar Volume 38,809,000 64,768,000 -40.0% Average Sales Price 2,587,267 2,816,000 -8.1% Average Days On Market 17 73 -76.3% Sold / List Price % 96.8% 98.3% -1.6% Average Price per SQFT $1,003 $1,079 -7.0% Quarter-end inventory 22 28 21.4% The data is for condominiums over $2M in King County. Some John L. Scott offices are independently owned and operated. All reports presented are based on data supplied by the NWMLS, RMLS, Spokane MLS, and the Central Oregon MLS. Neither the Associations nor the MLS guarantees or is in anyway responsible for its accuracy. Data maintained by the Associations or the MLS may not reflect all real estate activities in the market. Information deemed reliable but not guaranteed. -76.3% DAYS ON MARKET -7.0% PRICE PER SQUARE FOOT


The data is for single family residences over $1M in MLS areas 100, 110, 120, 130, 140, 300, 310, 320, 330, 340, 350, 360. Some John L. Scott offices are independently owned and operated. All reports presented are based on data supplied by the NWMLS, RMLS, Spokane MLS, and Central Oregon MLS. Neither the Associations nor the MLS guarantees or is in anyway responsible for its accuracy. Data maintained by the Associations or the MLS may not reflect all real estate activities in the market. Information deemed reliable but not guaranteed. Q4 2022 Q4 2021 % Change Number of Sales 156 165 -5.4% Total Dollar Volume 209,967,150 235,858,863 -10.9% Average Sales Price 1,345,943 1,429,448 -5.8% Average Days On Market 35 23 49.7% Sold / List Price % 96.20% 102.00% -5.6% Average Price per SQFT $398 $406 -2.0% Quarter-end inventory 124 39 217.9% SOLD | JOHNLSCOTT.COM/71142 SOUTH KING COUNTY IN Q4, WE SAW A -5.8% DECREASE IN THE AVERAGE SALES PRICE FOR SOUTH KING COUNTY


2022 Q4 LUXURY MARKET TRENDS Q4 2022 Q4 2021 % Change Number of Sales 140 143 -2.1% Total Dollar Volume 198,480,333 210,571,683 -5.7% Average Sales Price 1,417,717 1,472,529 -3.7% Average Days On Market 49 19 152.5% Sold / List Price % 96.3% 100.7% -4.3% Average Price per SQFT $374 $393 -4.8% Quarter-end inventory 170 57 198.2% PIERCE COUNTY The data is for single family residences over $1M in Pierce County. Some John L. Scott offices are independently owned and operated. All reports presented are based on data supplied by the NWMLS, RMLS, Spokane MLS, and the Central Oregon MLS. Neither the Associations nor the MLS guarantees or is in anyway responsible for its accuracy. Data maintained by the Associations or the MLS may not reflect all real estate activities in the market. Information deemed reliable but not guaranteed. THE AVERAGE DAYS ON MARKET INCREASED BY 152.5% IN Q4 IN PIERCE COUNTY OFFERED AT $1,500,000 | JOHNLSCOTT.COM/29178


The data is for single family residences over $1M in Kitsap County. Some John L. Scott offices are independently owned and operated. All reports presented are based on data supplied by the NWMLS, RMLS, Spokane MLS, and Central Oregon MLS. Neither the Associations nor the MLS guarantees or is in anyway responsible for its accuracy. Data maintained by the Associations or the MLS may not reflect all real estate activities in the market. Information deemed reliable but not guaranteed. Q4 2022 Q4 2021 % Change Number of Sales 63 90 -30.0% Total Dollar Volume 90,882,651 159,548,568 -43.0% Average Sales Price 1,442,582 1,772,762 -18.6% Average Days On Market 45 16 192.3% Sold / List Price % 97.4% 105.1% -7.4% Average Price per SQFT $483 $558 -13.3% Quarter-end inventory 46 22 09.1% OFFERED AT $1,055,000 | JOHNLSCOTT.COM/45899 OVERALL, THE AVERAGE PRICE PER SQUARE FOOT DECREASED 13.3% IN KITSAP COUNTY KITSAP COUNTY
SOLD
BAINBRIDGE ISLAND
Bainbridge Island remains a top luxury destination in the Pacific Northwest due to its enchanting island lifestyle and proximity to Seattle. Residents also enjoy the scenery and opportunity to build community locally.
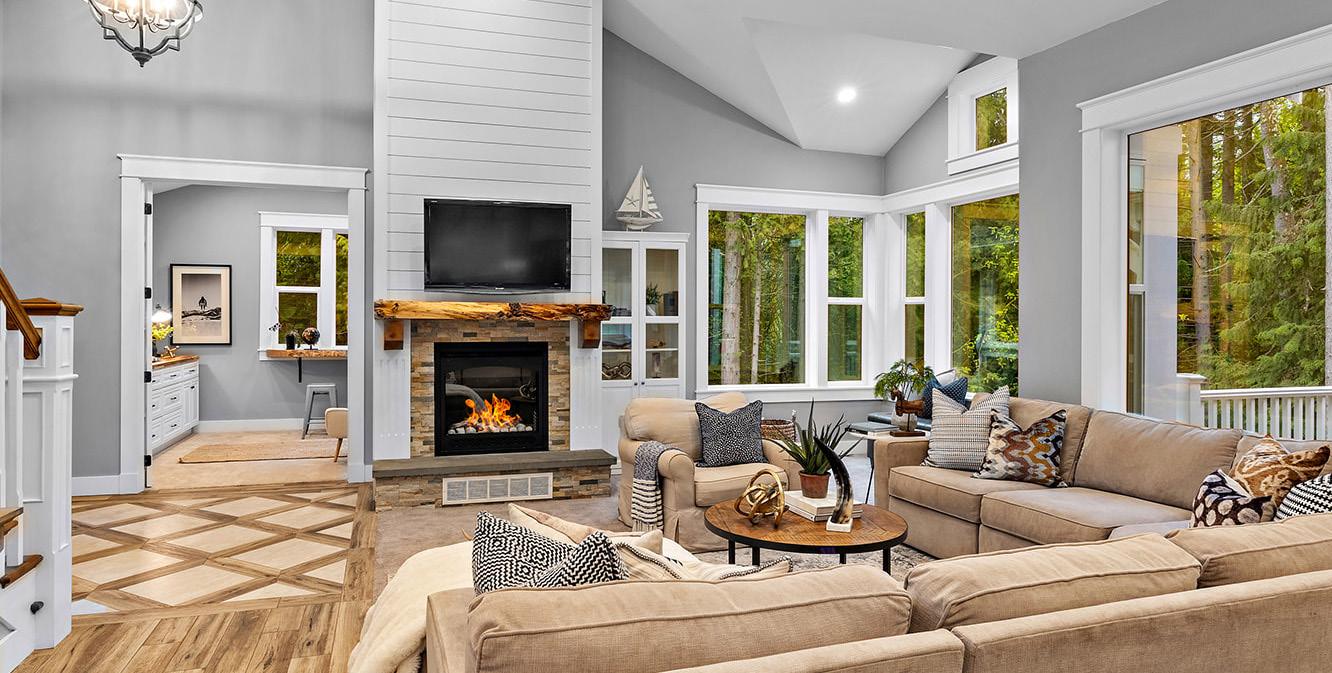
During the fourth quarter of 2022 we saw fewer new listings come on the market, however inventory to start 2023 remains extremely low. Buyers locally will likely face scarce luxury inventory until the luxury season really kicks off in 2023, during the months of March, April and May.

2022 Q4 LUXURY MARKET TRENDS Q4 2022 Q4 2021 % Change Number of Sales 4 17 -76.4% Total Dollar Volume 9,815,000 49,341,000 -80.1% Average Sales Price 2,453,750 2,902,412 -15.4% Average Days On Market 31 13 134.2% Sold / List Price % 94.1% 101.3% -7.1% Average Price per SQFT $976 $751 30.0% Quarter-end inventory 3 2 50.0% The data is for single family residences over $2M in MLS area 170. Some John L. Scott offices are independently owned and operated. All reports presented are based on data supplied by the NWMLS, RMLS, Spokane MLS, and the Central Oregon MLS. Neither the Associations nor the MLS guarantees or is in anyway responsible for its accuracy. Data maintained by the Associations or the MLS may not reflect all real estate activities in the market. Information deemed reliable but not guaranteed.
| JOHNLSCOTT.COM

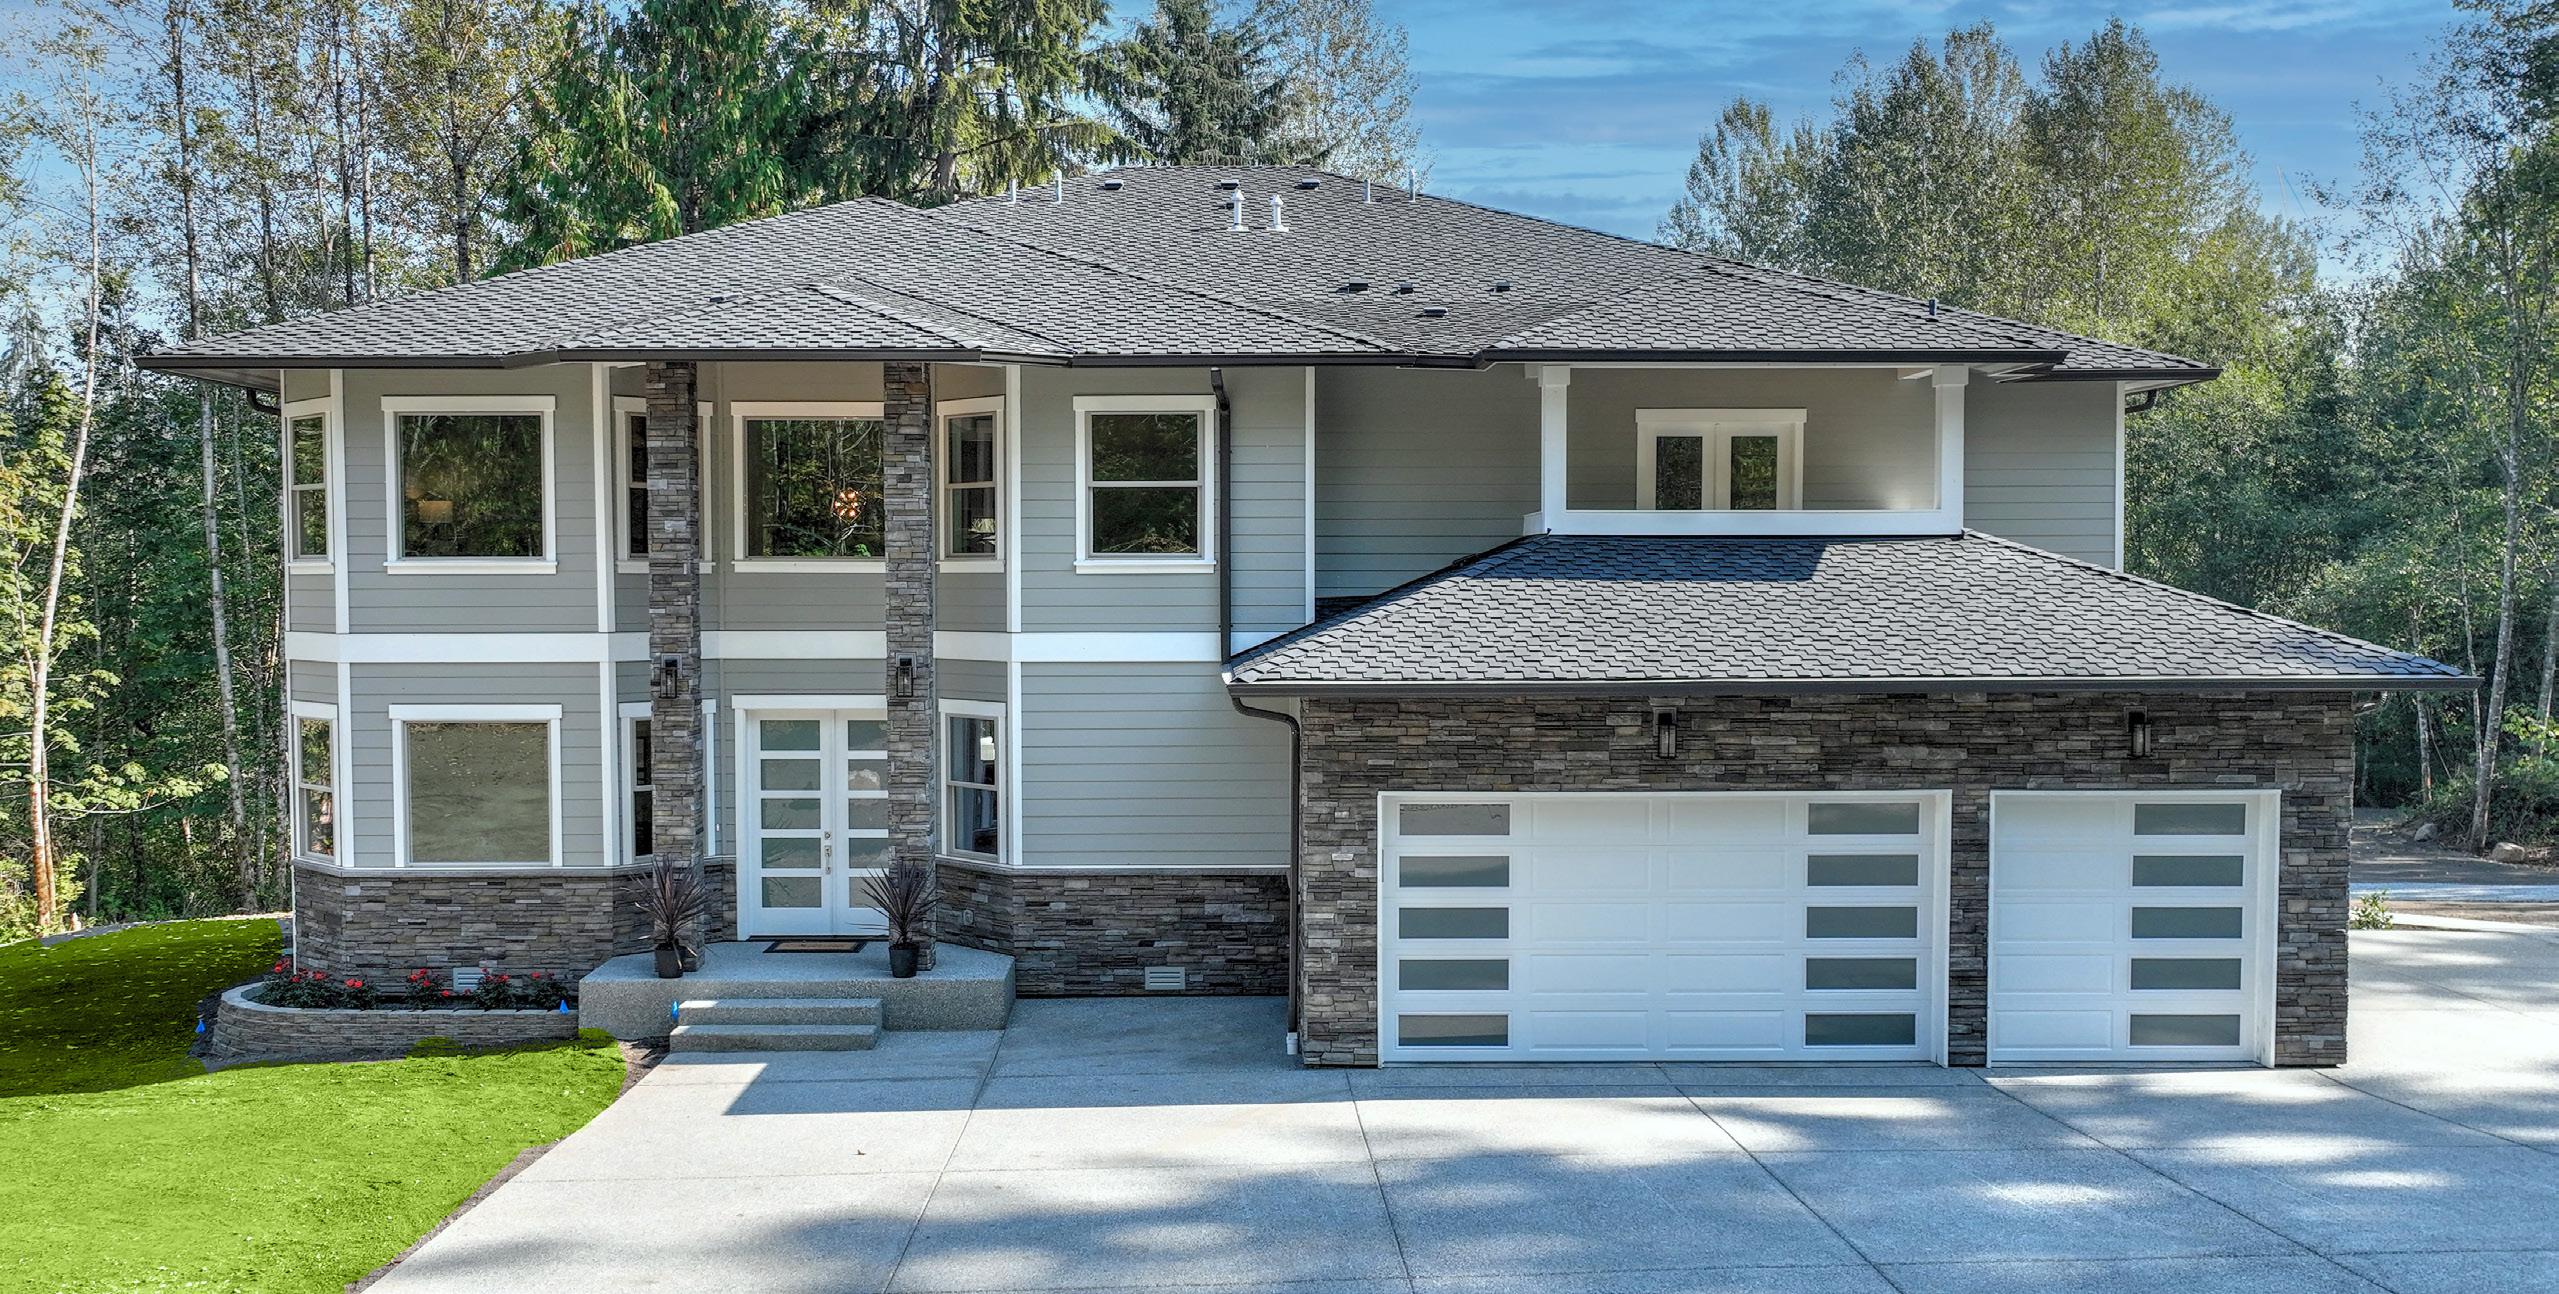
The data is for single family residences over $1M in Snohomish County. Some John L. Scott offices are independently owned and operated. All reports presented are based on data supplied by the NWMLS, RMLS, Spokane MLS, and Central Oregon MLS. Neither the Associations nor the MLS guarantees or is in anyway responsible for its accuracy. Data maintained by the Associations or the MLS may not reflect all real estate activities in the market. Information deemed reliable but not guaranteed. Q4 2022 Q4 2021 % Change Number of Sales 384 390 -1.5% Total Dollar Volume 496,028,287 535,264,574 -7.3% Average Sales Price 1,291,740 1,372,473 -5.8% Average Days On Market 36 19 91.1% Sold / List Price % 96.0% 102.6% -6.5% Average Price per SQFT $405 $418 -2.9% Quarter-end inventory 227 58 291.4% Q4 SAW A 91.1% INCREASE IN DAYS ON MARKET IN SNOHOMISH COUNTY OFFERED AT $2,650,000 | JOHNLSCOTT.COM/12859 SNOHOMISH COUNTY


2022 Q4 LUXURY MARKET TRENDS Q4 2022 Q4 2021 % Change Number of Sales 29 26 11.5% Total Dollar Volume 40,439,000 38,336,550 5.4% Average Sales Price 1,394,448 1,474,483 -5.4% Average Days On Market 52 35 51.0% Sold / List Price % 93.0% 100.7% -7.7% Average Price per SQFT $456 $491 -7.1% Quarter-end inventory 39 12 225.0% ISLAND COUNTY The data is for single family residences over $1M in Island County. Some John L. Scott offices are independently owned and operated. All reports presented are based on data supplied by the NWMLS, RMLS, Spokane MLS, and the Central Oregon MLS. Neither the Associations nor the MLS guarantees or is in anyway responsible for its accuracy. Data maintained by the Associations or the MLS may not reflect all real estate activities in the market. Information deemed reliable but not guaranteed. OVERALL, THE AVERAGE SALES PRICE DECREASED BY -5.4% IN ISLAND COUNTY OFFERED AT $1,175,000 | JOHNLSCOTT.COM/51111
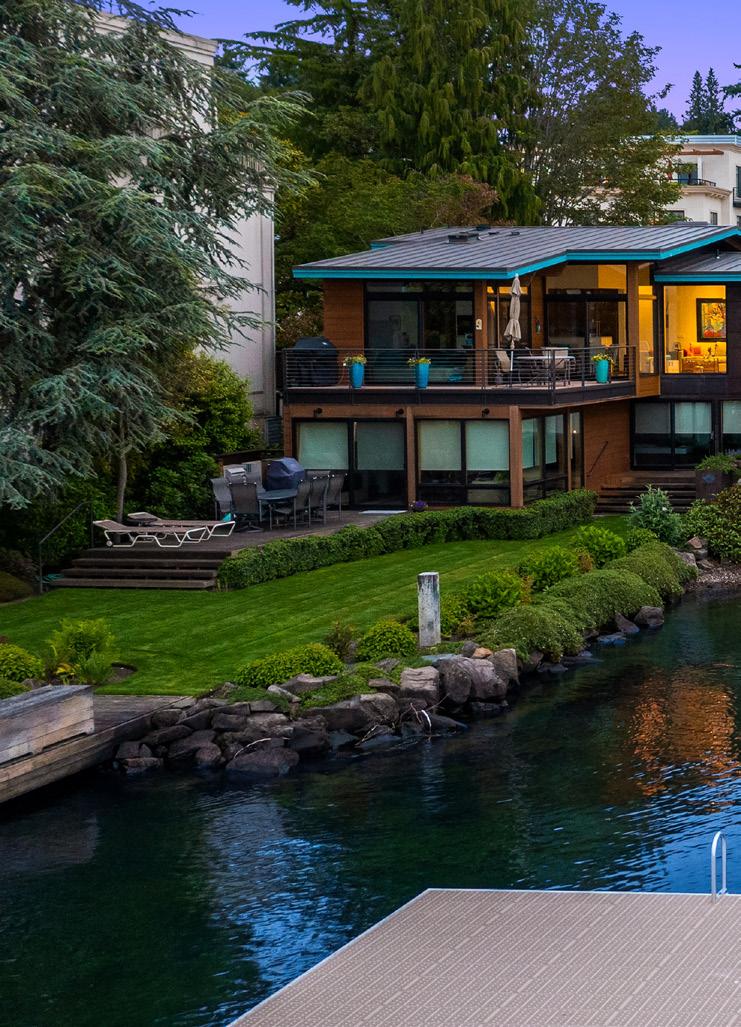
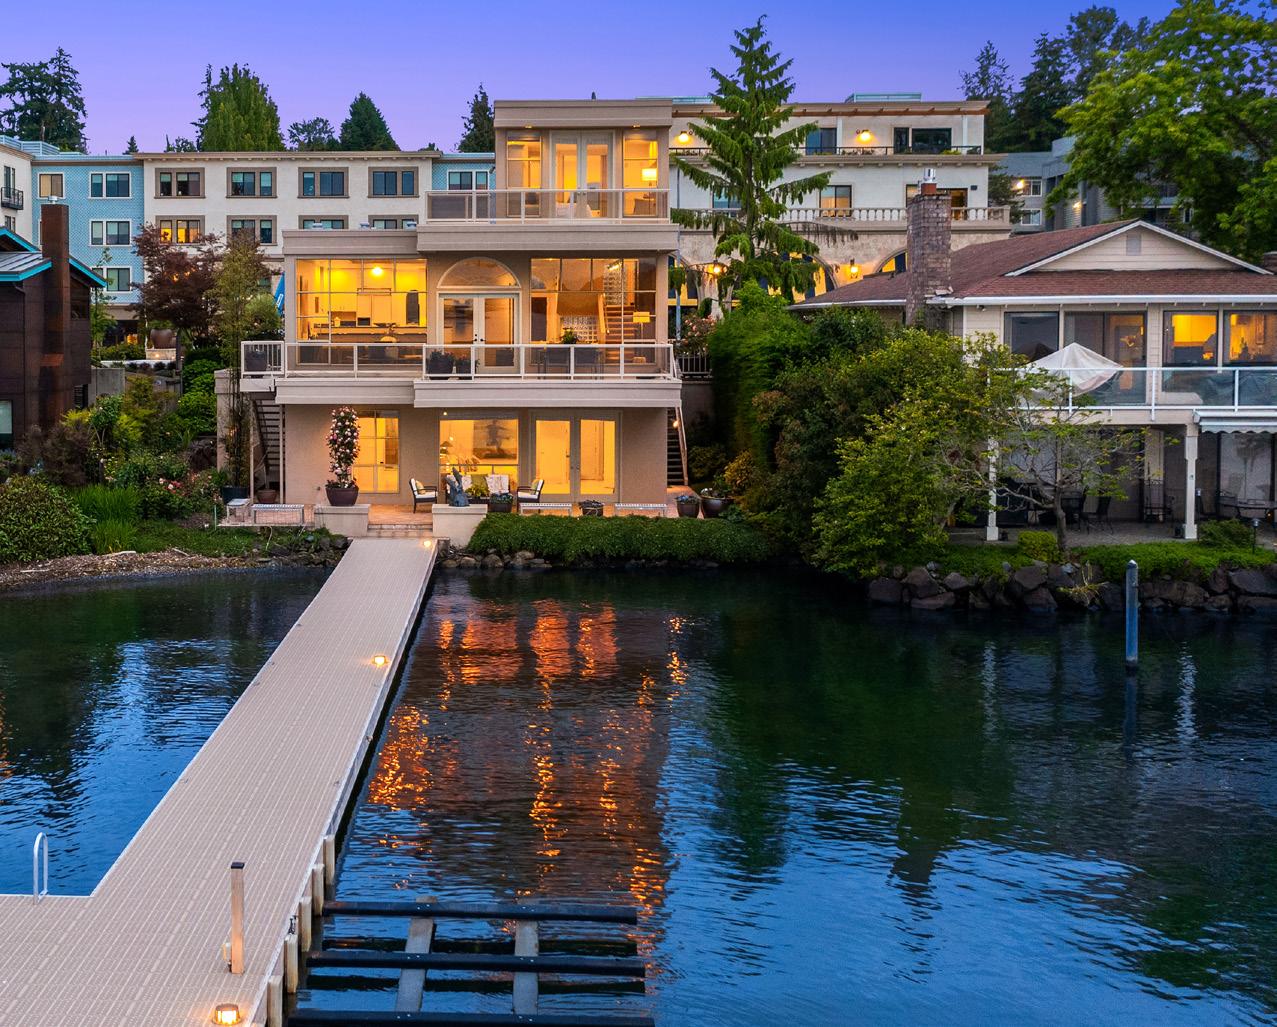
LUXURY WATERFRONT

LAKE WASHINGTON
Q4 2022 Q4 2021 % Change
Number of Sales 10 11 -9.0%
Total Dollar Volume 45,376,800 93,667,000 -51.5%
Average Sales Price 4,537,680 8,515,182 -46.7%
Average Days On Market 36 23 55.0%
Sold / List Price % 95.1% 96.6% -1.6%
Average Price per SQFT $1,311 $1,460 -10.2%
Quarter-end inventory 10 3 233.3%
LAKE SAMMAMISH
Q4 2022 Q4 2021 % Change
Number of Sales 3 7 -57.1%
Total Dollar Volume 8,298,000 39,421,000 -78.9%
Average Sales Price 2,766,000 5,631,571 -50.8%
Average Days On Market 55 16 242.7%
Sold / List Price % 97.8% 101.2% -3.4%
Average Price per SQFT $1,009 $1,053 -4.0%
Quarter-end inventory 9 3 200.0%
KING COUNTY
Q4 2022 Q4 2021 % Change
Number of Sales 28 42 -33.3%
Total Dollar Volume 124,175,800 260,942,803 -52.4%
Average Sales Price 4,434,850 6,212,924 -28.6%
Average Days On Market 53 22 147.9%
Sold / List Price % 94.1% 98.7% -4.7%
Average Price per SQFT $1,224 $1,298 -5.7%
Quarter-end inventory 41 18 127.7%
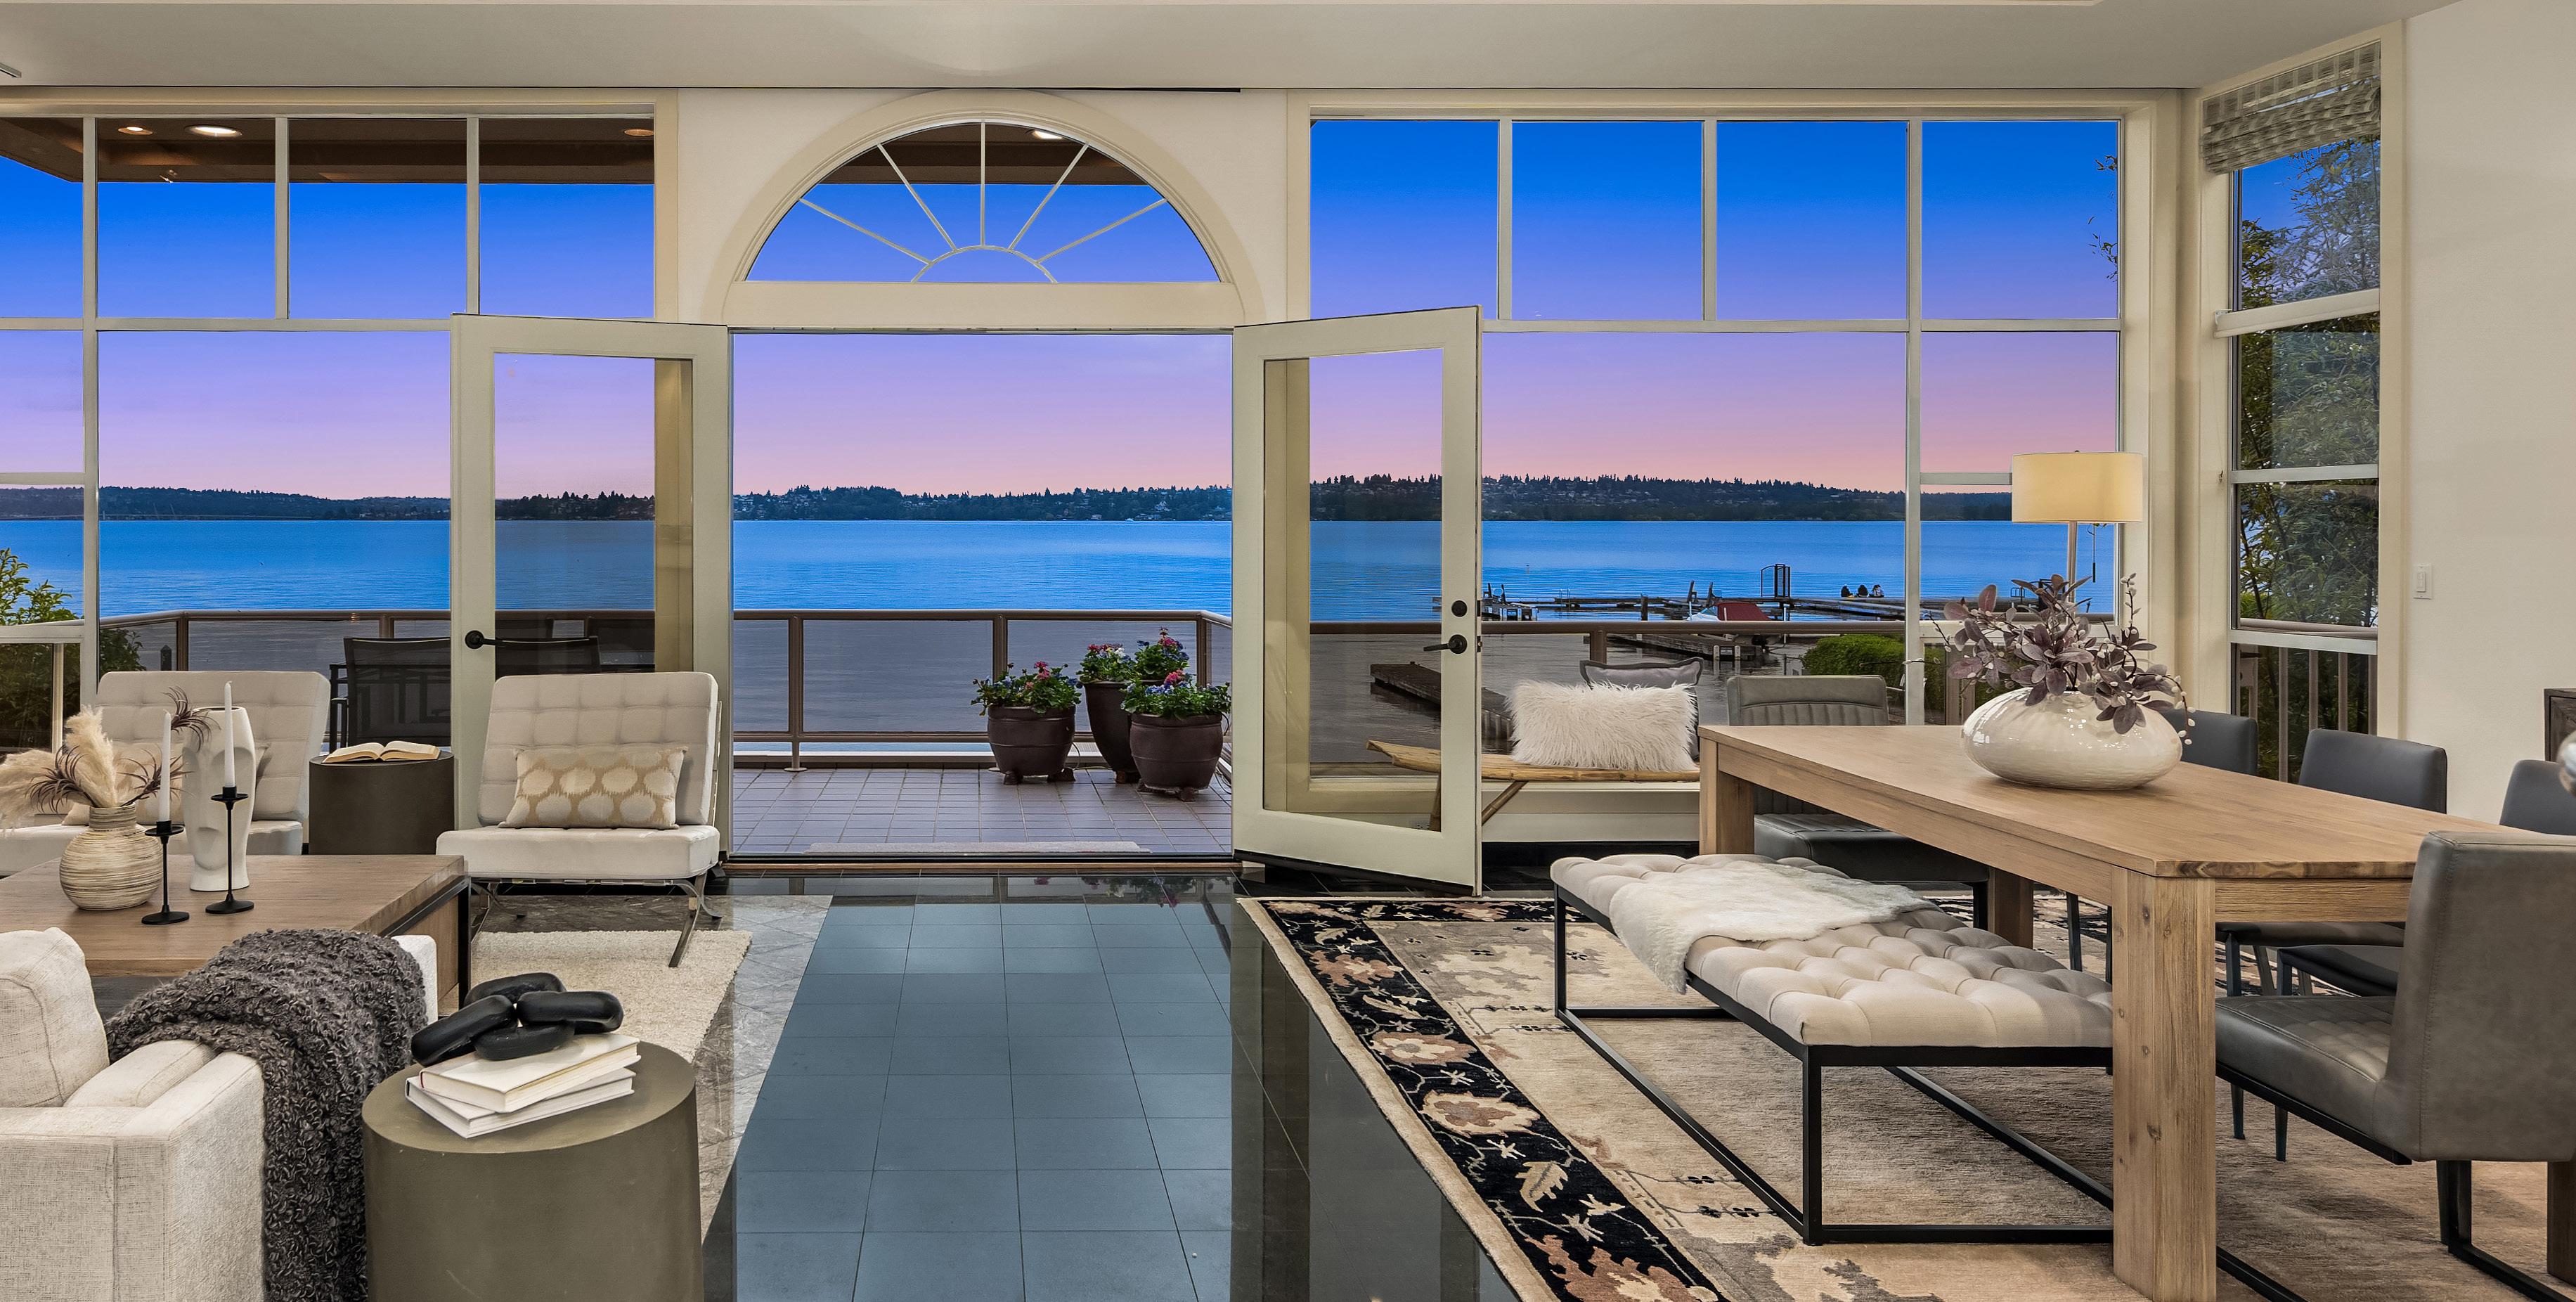
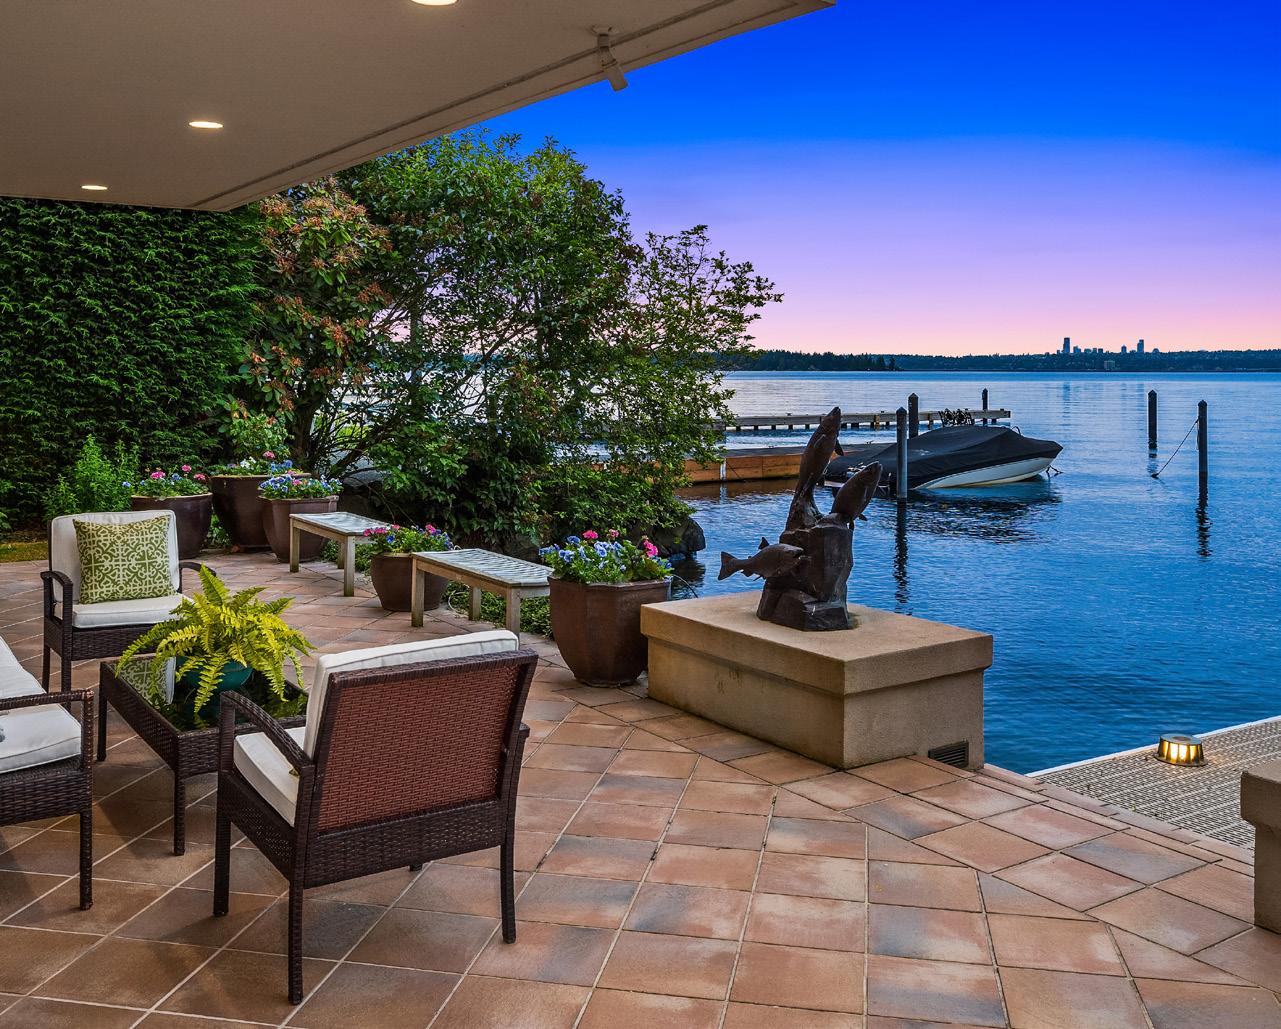
The data is for waterfront single family residences and condos over $2M. Lake Washington is MLS areas 500, 510, 520, 560, 600, 350, 380, 390, 710, 720. Lake Sammamish is MLS areas 530, 540. Some John L. Scott offices are independently owned and operated. All reports presented are based on data supplied by the NWMLS, RMLS, Spokane MLS, and the Central Oregon MLS. Neither the Associations nor the MLS guarantees or is in anyway responsible for its accuracy. Data maintained by the Associations or the MLS may not reflect all real estate activities in the market. Information deemed reliable but not guaranteed.

2022 Q4 LUXURY MARKET TRENDS SOLD | JOHNLSCOTT.COM/11544
FEATURED LUXURY LISTINGS


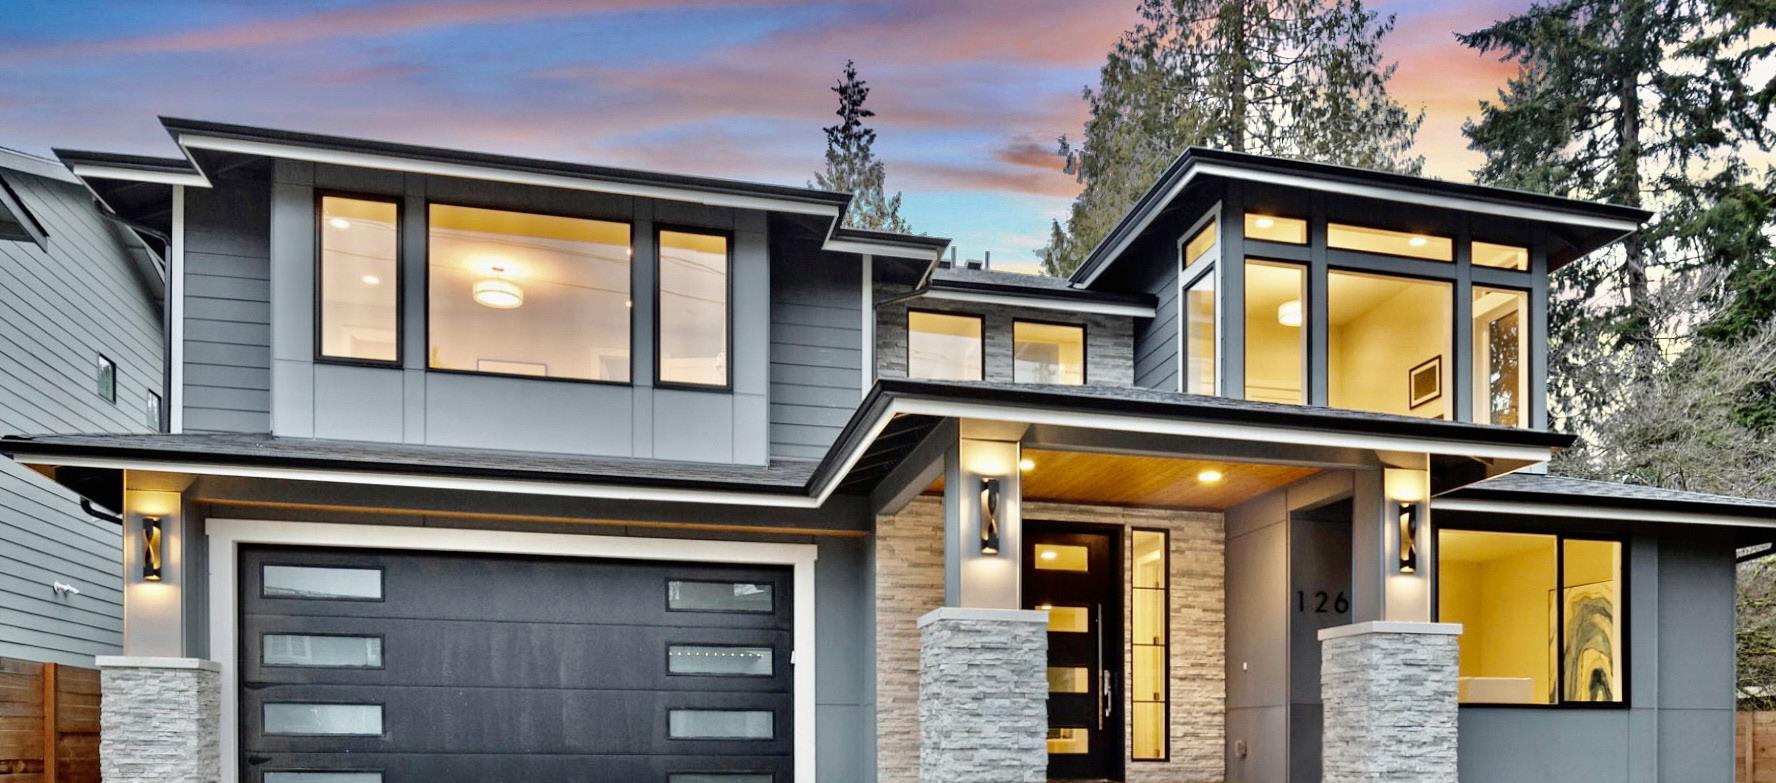


KIRKLAND, WA | $2,688,000 | JOHNLSCOTT.COM/70455 12630 NE 80 ST, KIRKLAND, WA 98033
Stunning new construction home built by a premier local builder in sought-after South Rose Hill. Functional and thoughtfully designed layout is perfectly executed with luxury and lifestyle in mind. Expansive floorplan captures easy living at its finest with custom finishes including a high-end chef’s kitchen with top-end appliances. Soaring 9’ and 10’ ceilings with wall-length windows flood the home with natural light. The lavish primary suite features a spa-like bath with heated tile floors, a fireplace with floor-to-ceiling marble wall, and an oversized walk-in closet. The main-level den is ideal for working from home, with additional entertainment spaces and spacious bedrooms providing room for everyone. Enjoy year-round entertainment on the covered outdoor living space with a custom gas fireplace, while the fully-fenced private yard is perfect for warm summer days. Convenient location near 405, DT Kirkland, major employers, Costco, and the elementary school within walking distance.
HELENA CHEN 425.283.2569 ychen@johnlscott.com

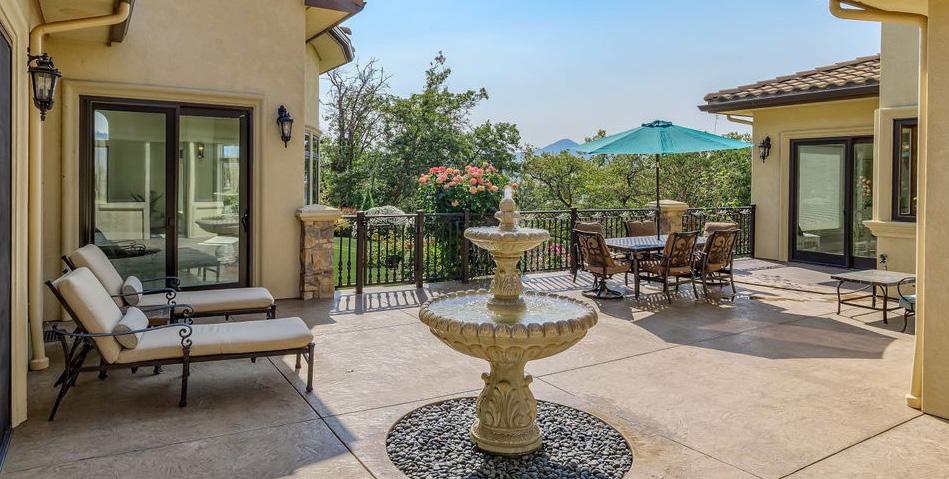
Welcome to Villa Encanto, a truly signature property in Ashland, Oregon providing elegance, comfort, and prestige just over 1 mile from the renowned Oregon Shakespeare Festival. Escape the hustle of town to a world away with unparalleled panoramic views. This Mediterranean masterpiece offers the highest quality fit and finish, all in a warm, modern and comfortable country style. Our Mediterranean climate also polishes this jewel here in wine country. Single-level main living and no-step entry from all doors. The gourmet kitchen offers a copper sink, 6-burner Wolf range, and Sub-Zero refrigerator. The formal dining room showcases a geothermally cooled wine cellar. French doors and windows seamlessly blend the inside with the outside. Take in the sweeping views from the heated pool, hot tub, and sauna with a strong private well, perfect for the raised bed gardens and 500 lavender plants. SCOTT LEWIS 541.821.8284 scottlewis@johnlscott.com


2022 Q4 LUXURY MARKET TRENDS
ASHLAND, OR | $3,390,000 | JOHNLSCOTT.COM/56063 1001 STRAWBERRY LN ASHLAND, OR 97520
EASTERN WASHINGTON & IDAHO


2022 Q4 LUXURY MARKET TRENDS


COEUR D’ALENE, IDAHO Q4 2022 Q4 2021 % Change Number of Sales 89 120 -25.8% Total Dollar Volume 150,008,812 213,709,897 -29.8% Average Sales Price 1,685,492 1,780,916 -5.3% Average Days On Market 46 47 -2.3% Sold / List Price % 92.6% 96.9% -4.4% Average Price per SQFT $504 $479 5.2% Quarter-end inventory 153 60 155.0% The data is for single family residences over $1M in Kootenai County. Some John L. Scott offices are independently owned and operated. All reports presented are based on data supplied by the NWMLS, RMLS, Spokane MLS, and Central Oregon MLS. Neither the Associations nor the MLS guarantees or is in anyway responsible for its accuracy. Data maintained by the Associations or the MLS may not reflect all real estate activities in the market. Information deemed reliable but not guaranteed. SOLD | JOHNLSCOTT.COM/22580 THE AVERAGE SALES PRICE IN COEUR D’ALENE DECREASED 5.3%

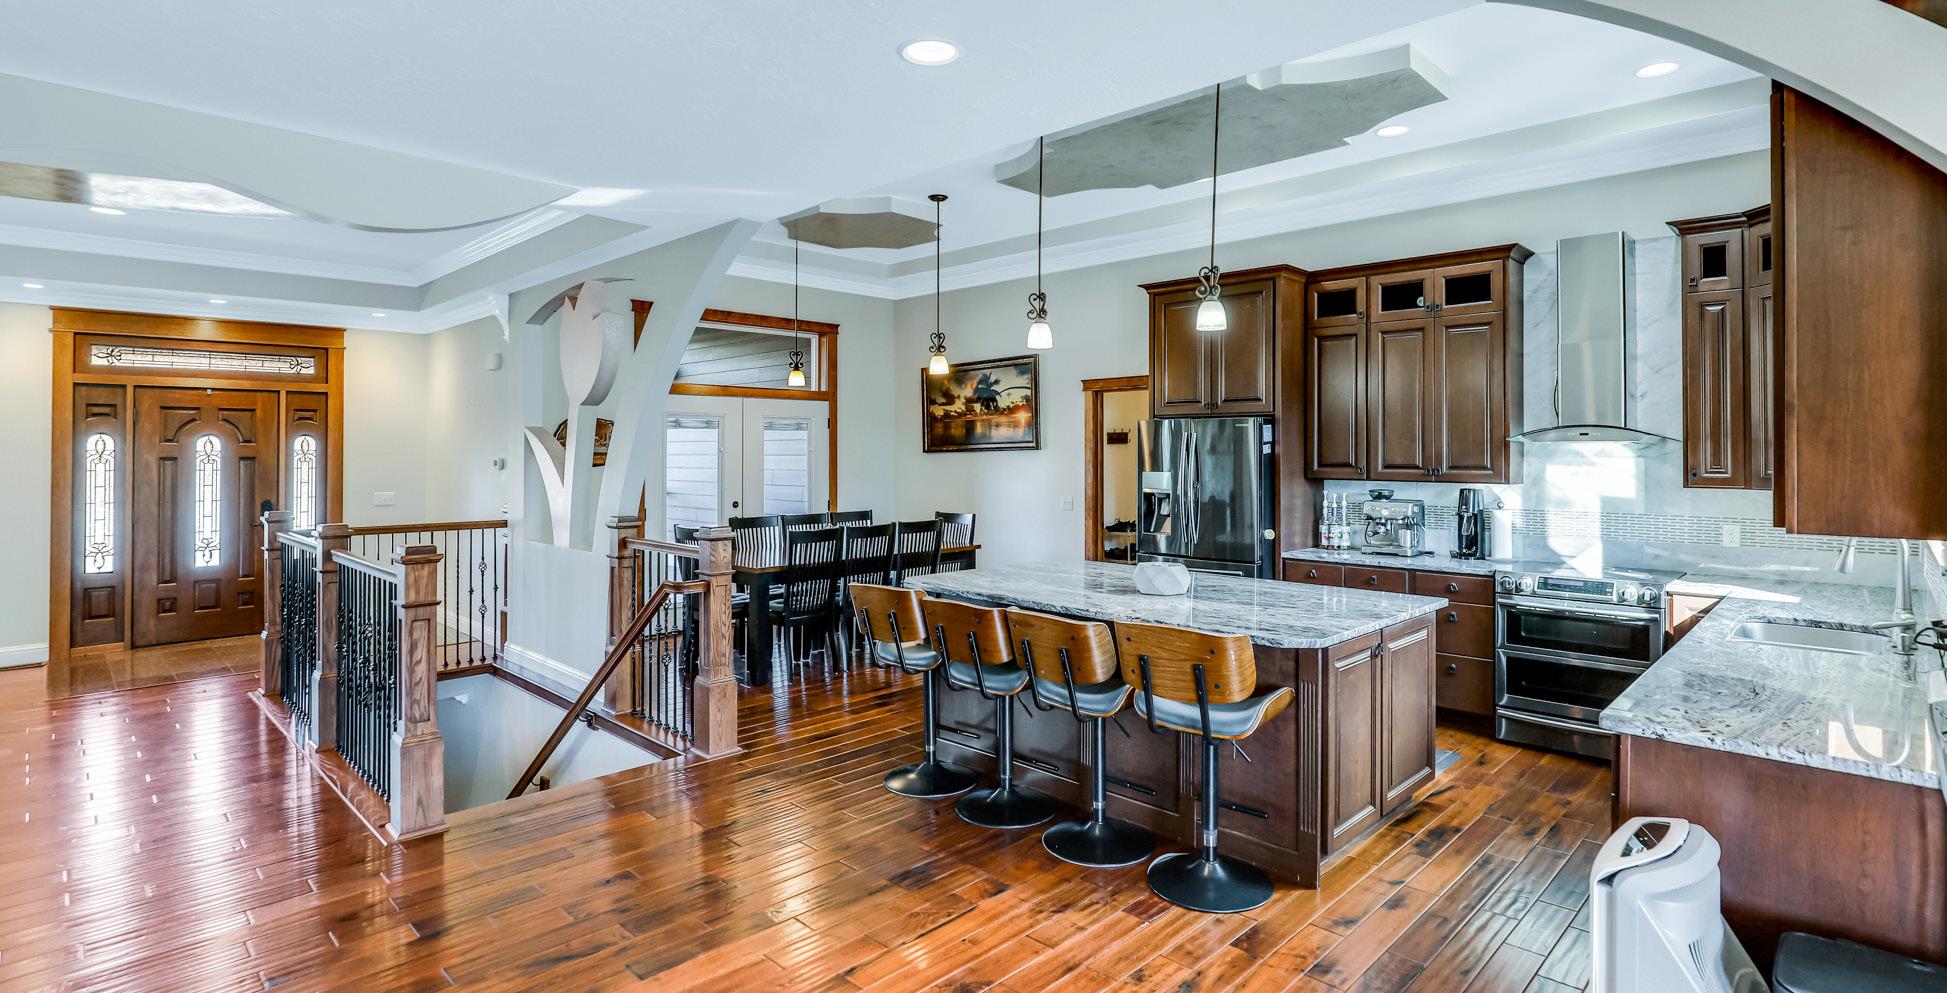
2022 Q4 LUXURY MARKET TRENDS SPOKANE COUNTY Q4 2022 Q4 2021 % Change Number of Sales 49 46 6.5% Total Dollar Volume 72,735,142 75,541,915 -3.7% Average Sales Price 1,484,391 1,642,216 -9.6% Average Days On Market 48 54 -11.6% Sold / List Price % 94.5% 95.5% -1.0% Average Price per SQFT $423 $295 43.2% Quarter-end inventory 44 14 214.3% The data is for single family residences over $1M in Spokane County. Some John L. Scott offices are independently owned and operated. All reports presented are based on data supplied by the NWMLS, RMLS, Spokane MLS, and Central Oregon MLS. Neither the Associations nor the MLS guarantees or is in anyway responsible for its accuracy. Data maintained by the Associations or the MLS may not reflect all real estate activities in the market. Information deemed reliable but not guaranteed. OFFERED AT $1,700,000 | JOHNLSCOTT.COM/45077 THE AVERAGE SALES PRICE IN SPOKANE COUNTY DECREASED 9.6%
OREGON & SOUTHWEST WASHINGTON


FOURTH QUARTER HIGHLIGHTS
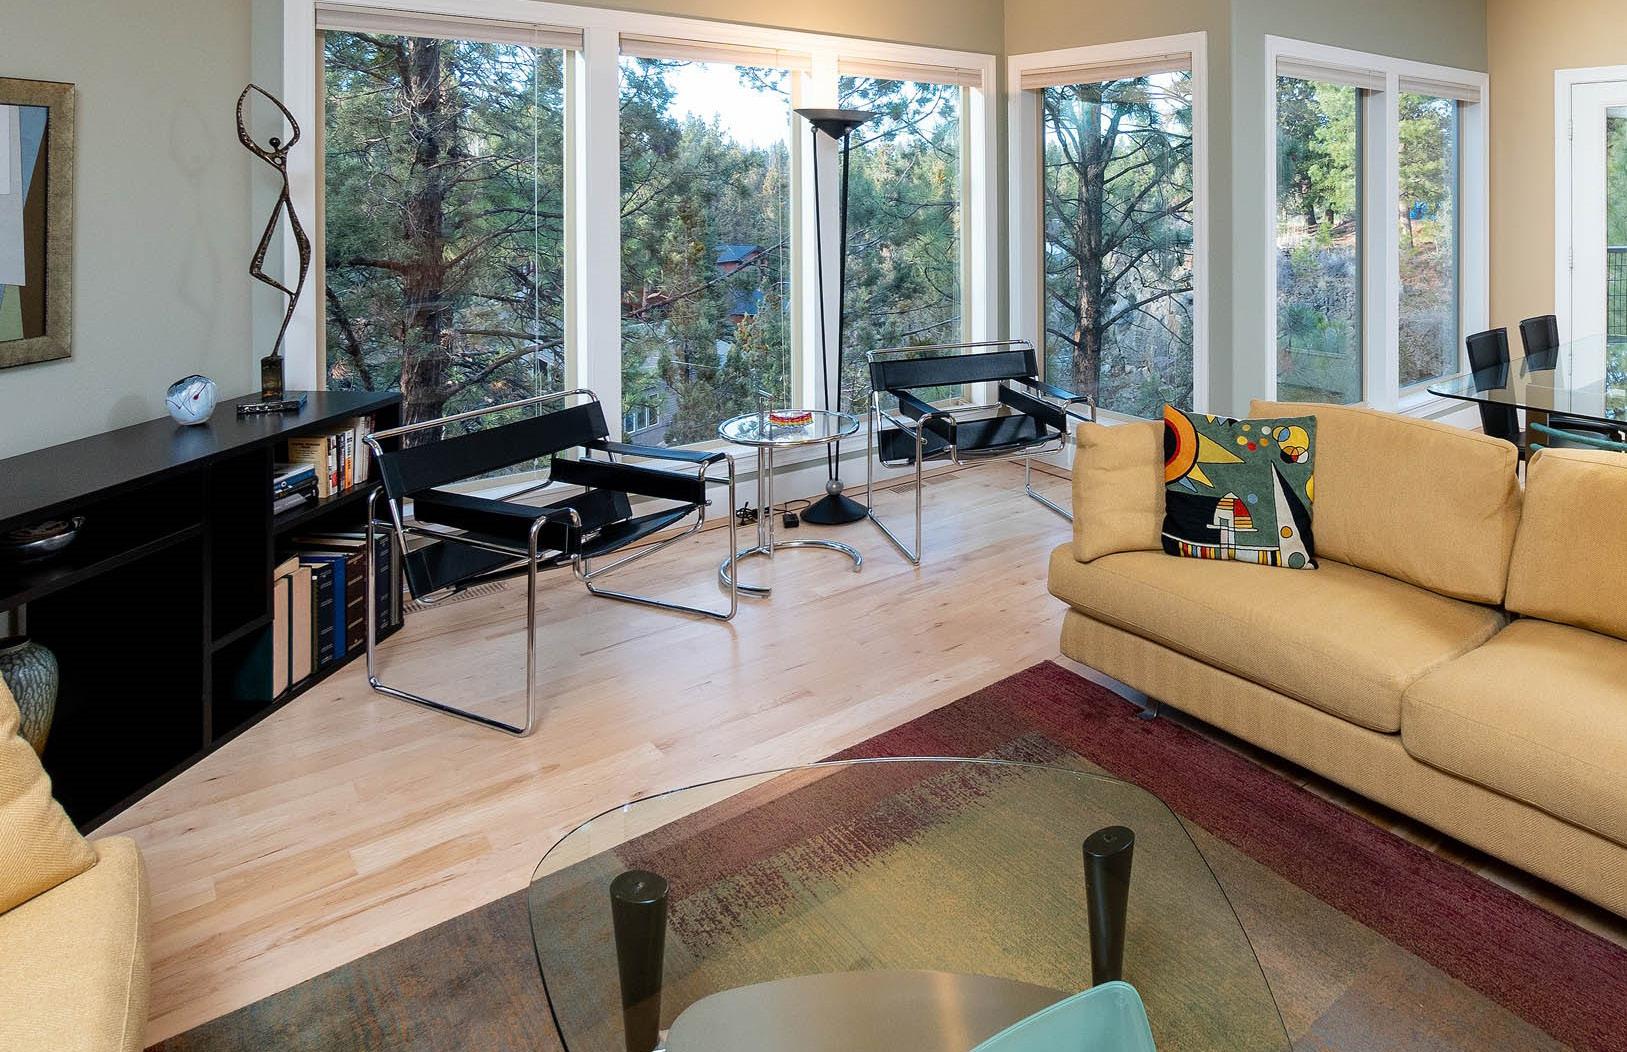
In the fourth quarter of 2022, luxury sales activity in the Portland Metro area has remained steady with a healthy supply of inventory up to $1.5M. The area has a good amount of inventory compared to similar metro areas, which translates to great opportunities for luxury buyers.


OFFERED AT $1,099,000 | JOHNLSCOTT.COM/70146
PORTLAND METRO
Q4 2022 Q4 2021 % Change
Number of Sales 127 183 -30.6%
Total Dollar Volume 176,148,637 266,284,484 -33.8%
Average Sales Price 1,386,997 1,455,106 -4.6%
Average Days On Market 44 33 34.3%
Sold / List Price % 95.9% 99.2% -3.3%
Average Price per SQFT $524 $367 42.6%
Quarter-end inventory 137 87 57.5%
Luxury inventory continues to build slowly as a result of the intensity adjustment which began earlier in the year. Buyers in Portland, Lake Oswego and West Linn will be waiting patiently for each listing until the luxury market kicks into gear beginning in March 2023.
LAKE OSWEGO
Q4 2022 Q4 2021 % Change
Number of Sales 69 112 -38.3%
Total Dollar Volume 113,119,562 203,529,494 -44.4%
Average Sales Price 1,639,414 1,817,228 -9.7%
Average Days On Market 42 34 25.7%
Sold / List Price % 97.7% 98.2% -0.5%
Average Price per SQFT $633 $436 45.0%
Quarter-end inventory 88 56 57.1%
2022 Q4 LUXURY MARKET TRENDS
The data is for single family residences over $1M in Clackamas, Multnomah, Washington and Columbia Counties.
John
Scott offices are independently
and
All reports presented are based on data supplied by the NWMLS, RMLS, Spokane MLS, and Central Oregon MLS. Neither the Associations nor the MLS guarantees or
anyway responsible for its accuracy. Data maintained by the Associations or the MLS may not reflect all real estate activities in the
Information deemed reliable but not guaranteed.
Some
L.
owned
operated.
is in
market.
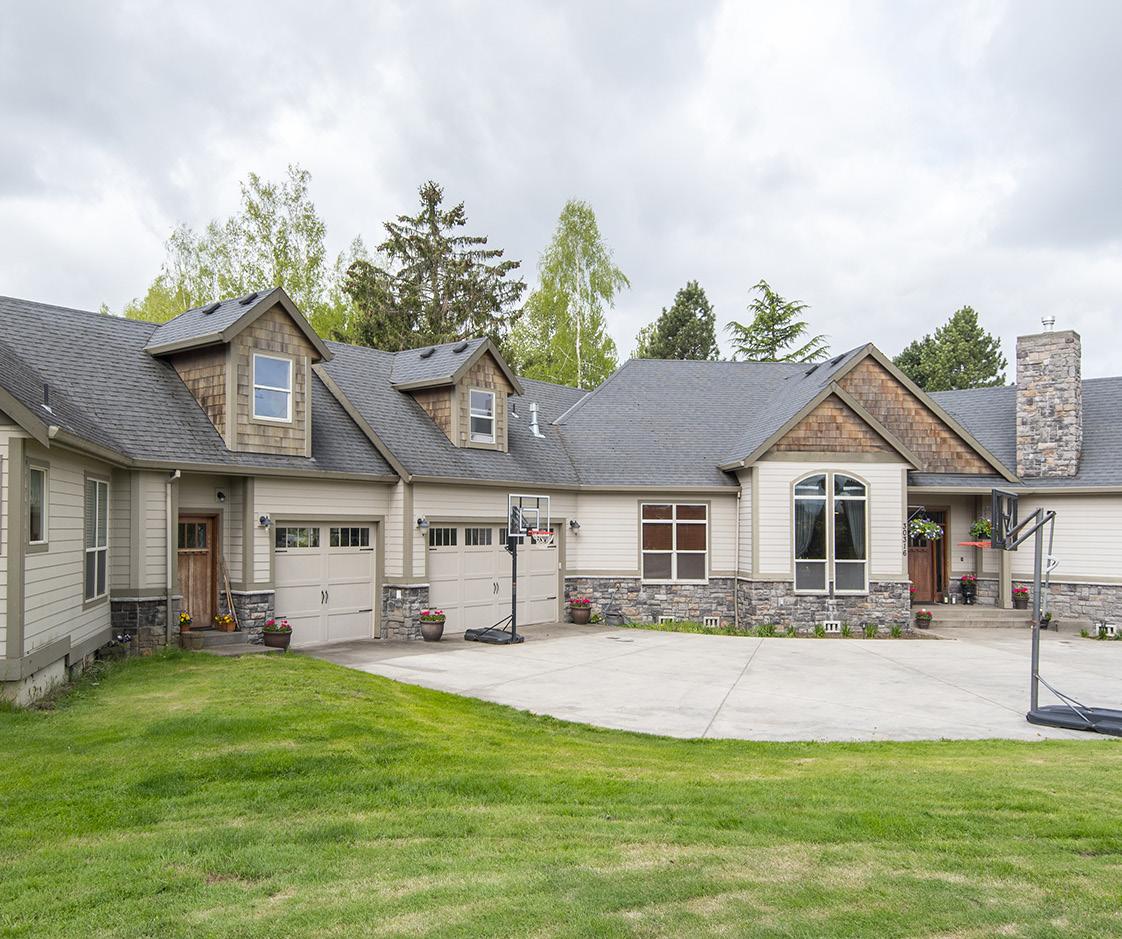
OFFERED AT $1,699,900 | JOHNLSCOTT.COM/13488

The
are
data
the NWMLS, RMLS, Spokane
and the
Neither the
nor the MLS guarantees or
anyway
the
or the MLS may
activities
the market. Information
guaranteed. Q4 2022 Q4 2021 % Change Number of Sales 170 232 -26.7% Total Dollar Volume 259,278,167 349,498,081 -25.8% Average Sales Price 1,525,166 1,506,457 1.2% Average Days On Market 60 46 30.9% Sold / List Price % 96.7% 97.4% -0.7% Average Price per SQFT $494 $475 4.0% Quarter-end inventory 182 90 102.2% BEND IN Q4, THE AVERAGE SALES PRICE INCREASED BY 1.2% IN BEND
data is for single family residences over $1M in Bend Oregon. Some John L. Scott offices are independently owned and operated. All reports presented
based on
supplied by
MLS,
Central Oregon MLS.
Associations
is in
responsible for its accuracy. Data maintained by
Associations
not reflect all real estate
in
deemed reliable but not
In the fourth quarter of 2022, we once again experienced the seasonal occurrence during which some sellers in Bend opted to take their homes off the market to reposition them in the spring. This phenomenon is known as the winter clean-up.

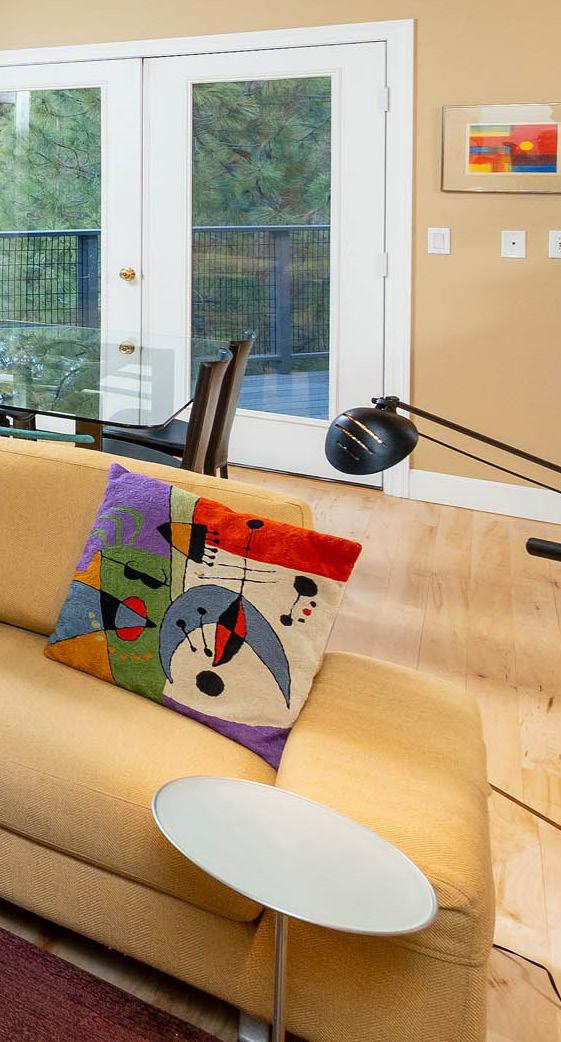
In a change of pace from the frenzy of the past two years, the available inventory as we start 2023 is healthy and offers options for buyers. Once the luxury market kicks off in March, April and May of this year, it will really be “go time” for buyers looking to buy a slice of Central Oregon living.

2022 Q4 LUXURY MARKET TRENDS
| JOHNLSCOTT.COM
SOLD

The data is for single family residences over $1M in Jackson County. Some John L. Scott offices are independently owned and operated. All reports presented are based on data supplied by the NWMLS, RMLS, Spokane MLS, and Central Oregon MLS. Neither the Associations nor the MLS guarantees or is in anyway responsible for its accuracy. Data maintained by the Associations or the MLS may not reflect all real estate activities in the market. Information deemed reliable but not guaranteed. Q4 2022 Q4 2021 % Change Number of Sales 19 28 -32.1% Total Dollar Volume 23,253,628 39,604,250 -41.2% Average Sales Price 1,223,875 1,414,438 -13.4% Average Days On Market 96 54 78.5% Sold / List Price % 94.6% 98.0% -3.4% Average Price per SQFT $303 $362 -16.4% Quarter-end inventory 61 42 45.2% JACKSON COUNTY OFFERED AT $5,750,000 | JOHNLSCOTT.COM/10202 THE AVERAGE DAYS ON MARKET INCREASED BY 78.5% IN Q4 IN JACKSON COUNTY

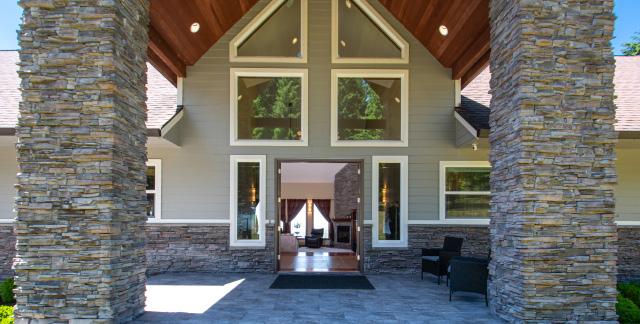
2022 Q4 LUXURY MARKET TRENDS Q4 2022 Q4 2021 % Change Number of Sales 86 125 -31.2% Total Dollar Volume 122,037,794 176,802,901 -30.9% Average Sales Price 1,419,044 1,414,423 0.3% Average Days On Market 42 57 -27.6% Sold / List Price % 96.4% 95.6% 0.8% Average Price per SQFT $490 $334 46.7% Quarter-end inventory 147 71 107.0% CLARK COUNTY The data is for single family residences over $1M in Clark County. Some John L. Scott offices are independently owned and operated. All reports presented are based on data supplied by the NWMLS, RMLS, Spokane MLS, and the Central Oregon MLS. Neither the Associations nor the MLS guarantees or is in anyway responsible for its accuracy. Data maintained by the Associations or the MLS may not reflect all real estate activities in the market. Information deemed reliable but not guaranteed. OFFERED AT $1,275,000 | JOHNLSCOTT.COM/32336 IN Q4, THE AVERAGE SALES PRICE INCREASED 0.3% IN CLARK COUNTY
Convert Luxury Leads to Top Dollar Sales


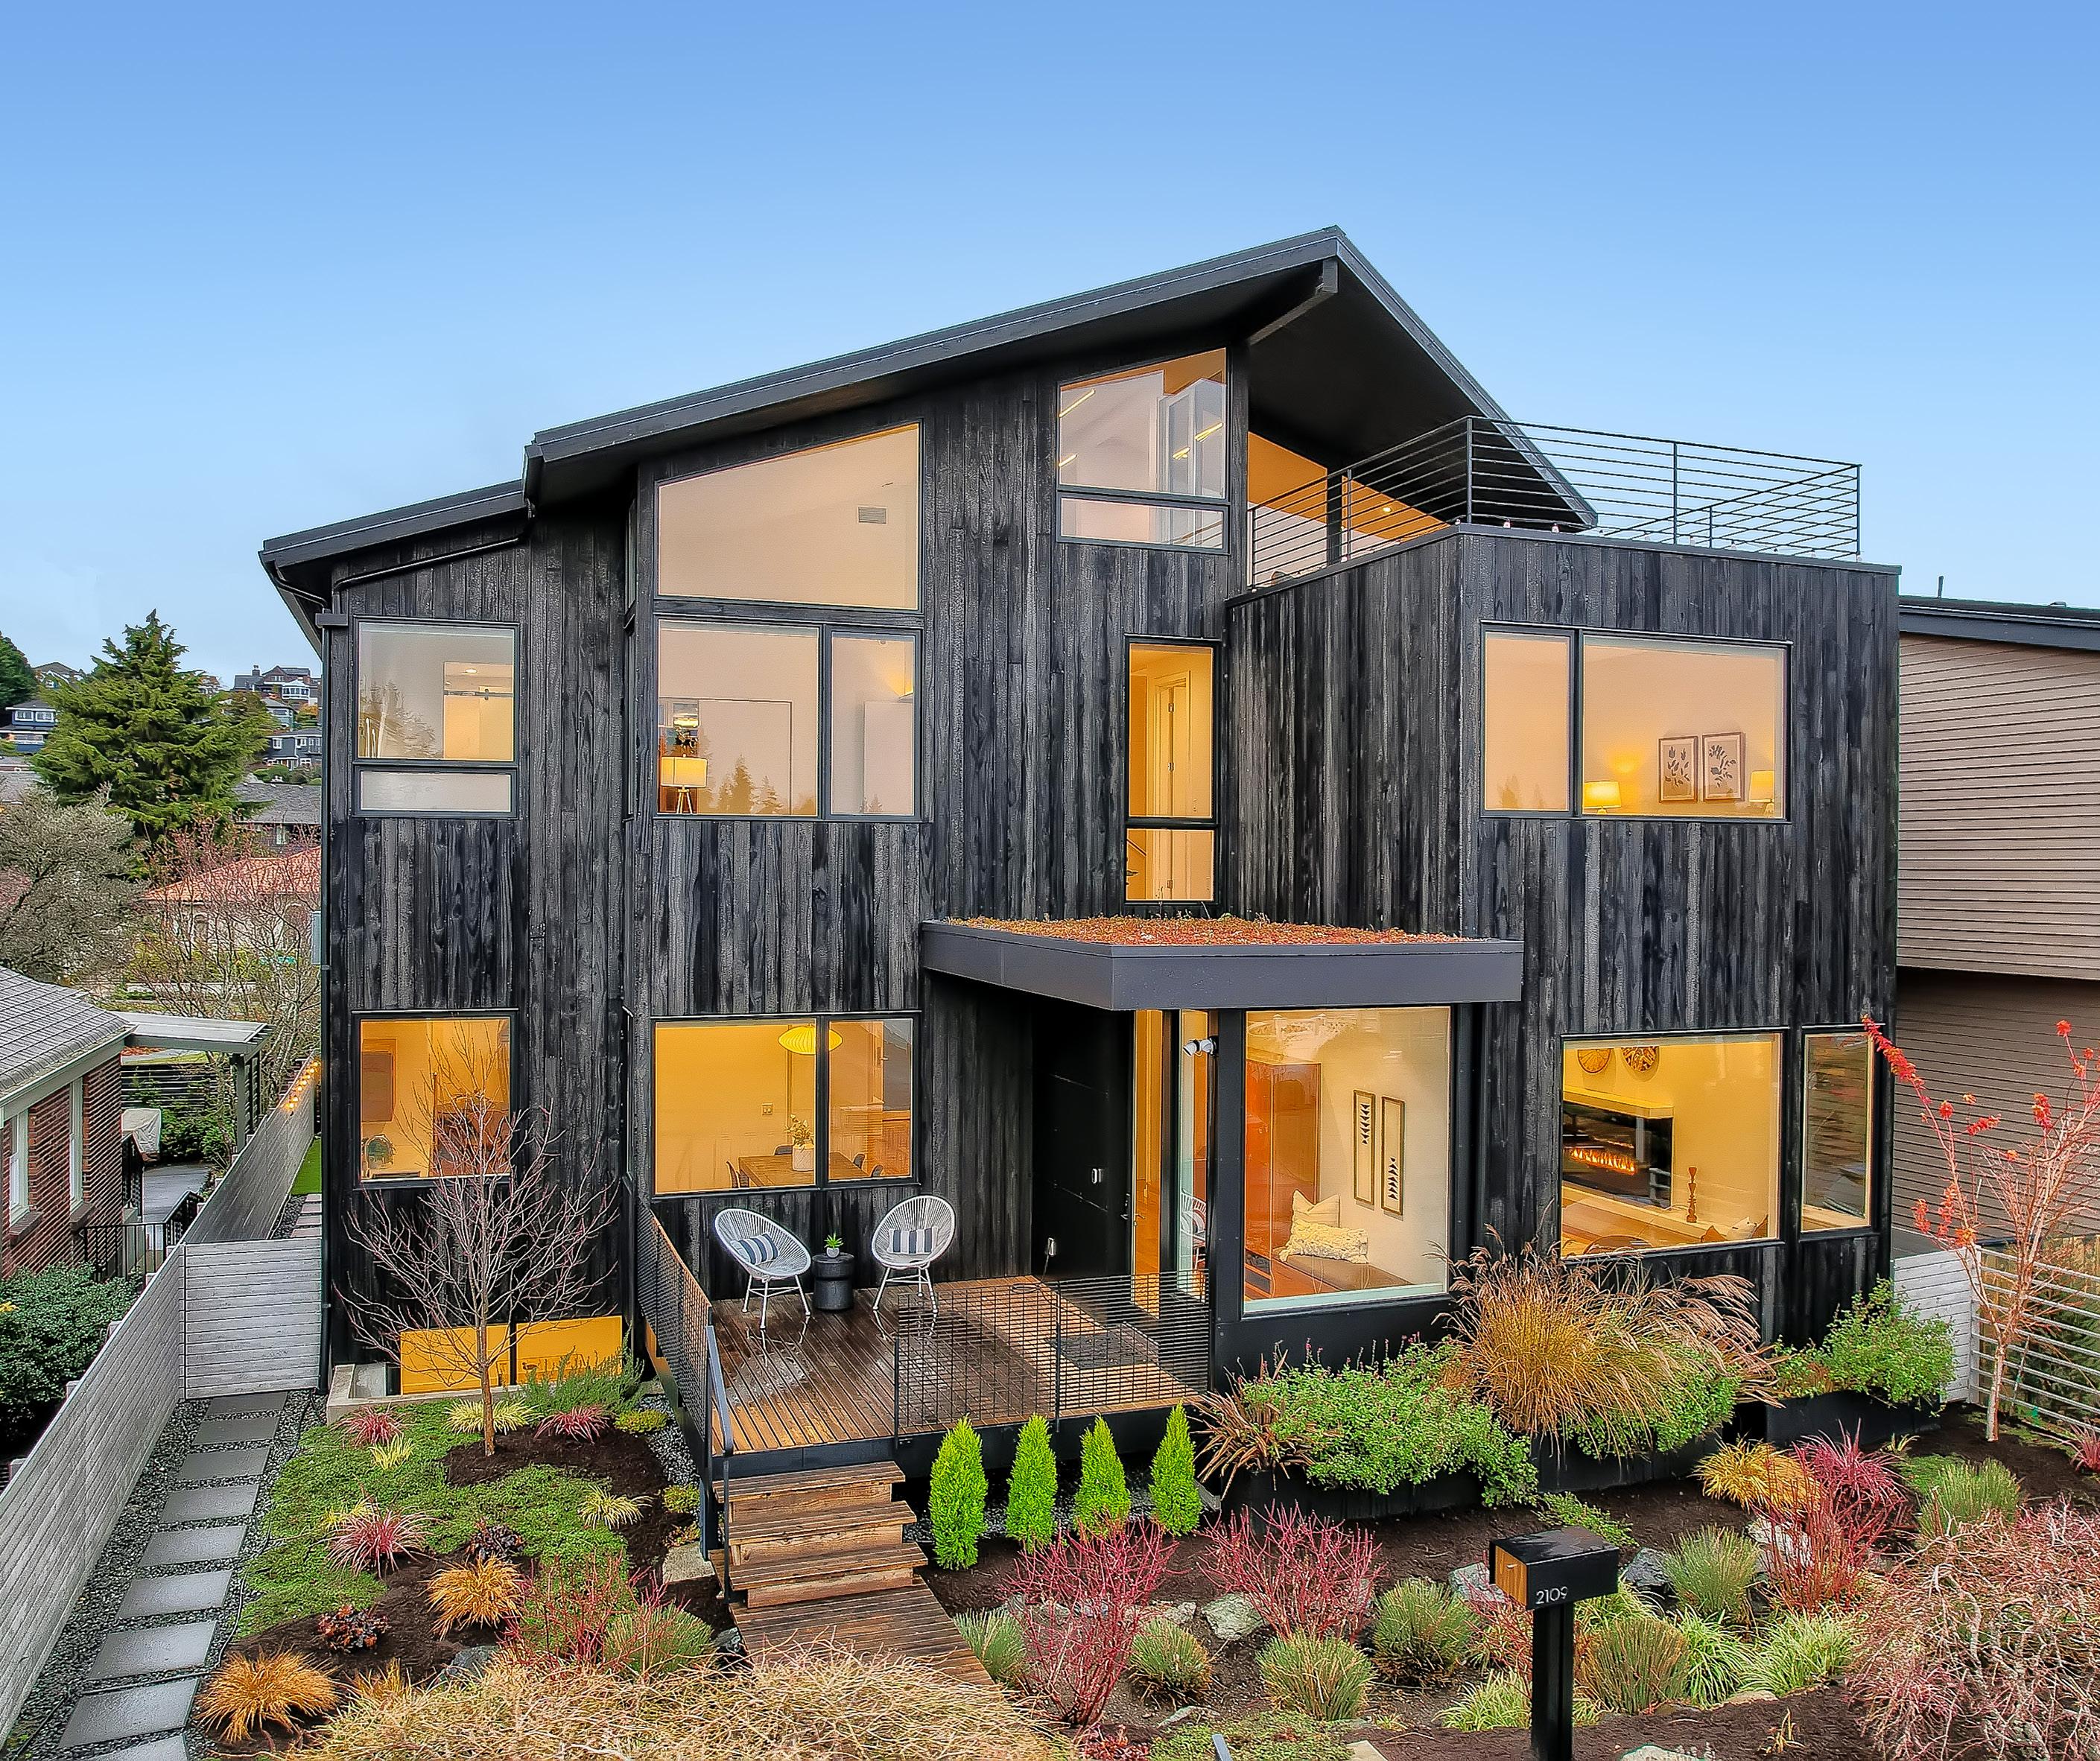

Virtuance is one of the fastestgrowing real estate photography companies in the world. Creator of HDReal®, an image processing system that combines master photographers with machinelearning algorithms, Virtuance helps luxury real estate professionals win more listings and sell them faster with images proven to capture 2x more attention. 1-844-443-7325 info@virtuance.com virtuance.com

Why Quality Visuals Matter in Luxury Property Marketing
MAKE A DIFFERENCE IN YOUR PROPERTY’S MARKETABILITY
By: Virtuance
When marketing luxury properties, quality visuals are essential. In today’s market, to establish an emotional connection with potential buyers, quality visuals are crucial to conveying the opulence and elegance of luxury properties. Furthermore, quality visuals can improve your luxury property’s marketing results in the following ways:
Communicate the property’s uniqueness
In creating quality visuals for luxury real estate marketing, every detail must be considered to ensure the property is accurately represented. From lush landscapes and picturesque views to tasteful décor and architectural elements, there is so much to show potential buyers.
Promote a lifestyle instead of a home
The right visuals can add a level of sophistication and elegance to your advertising. When viewing pictures of a property, luxury homebuyers expect the same quality as other high-end brands. Moreover, quality photos and videos create an emotional connection with buyers and a realistic picture of their lives on the property.
Expand your buyer base
Advertising luxury real estate should take into account that potential buyers may be from different parts of the world and may not have access to the property in person. Thus, the use of quality photos as marketing tools can help you reach a wider audience and increase your sales.
Provide dynamic views of the property
A property should be photographed from many angles, showing every aspect that makes it unique. 3D home tours, drone shots, and aerial photography are incredibly effective in providing buyers with a dynamic and comprehensive overview of the property.
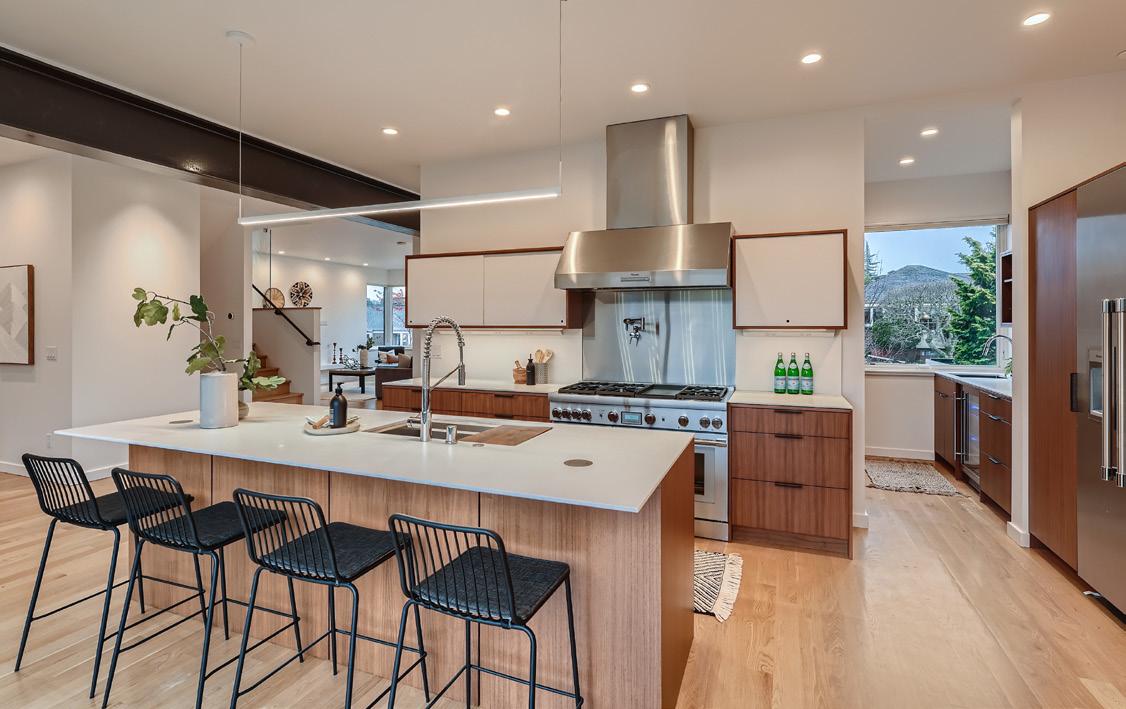
By investing in quality visuals when marketing your luxury real estate property, you will no doubt reap great rewards, like higher sale prices and quicker turnarounds for completing transactions!
Elevating your luxury real estate marketing with Virtuance

Your luxury property’s incredible details can be captured with Virtuance’s five-star visuals, such as aerial photography, 3D home tours, and HDReal® images, which set you apart from your competition and offer a truly luxurious experience. Moreover, Virtuance offers marketing enhancements such as social media packages and YouTube videos to help you showcase your property to its fullest potential.
Virtuance is an exclusive partner of John L. Scott Real Estate, providing JLS professionals and their clients with the highest quality visual marketing solutions.
2022 Q4 LUXURY MARKET TRENDS
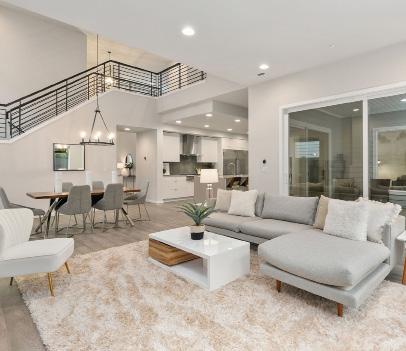
@JLSexceptionalhomes @exceptional_homesjls Connect with us: OFFERED AT $2,635,000 | JOHNLSCOTT.COM/18935


