JUST VOL VIII // ISSUE I // FALL 2022 Journal of Undergraduat e Science & TechnologyJ
Cover photograph by Andrew Nerness: "Sh2-132" aka "The Lion Nebula"
JUST VOL VIII // ISSUE I // FALL 2022 2 J


Dear Reader,
I am delighted to present you Volume VIII, Issue I of the Journal of Undergraduate Science and Technology (JUST). The existence of JUST on UW campus is truly a campus wide effort and a celebration of not only the extraordinary research that takes place on this campus, but the work conducted by undergraduates specifically. Moreover, I would like to extend my sincerest thanks to the undergraduate researchers who submitted their work along with the faculty and staff who supported them. Furthermore, I would like to express all my gratitude towards the JUST staff who are extremely dedicated to JUST and choose to make JUST an integral part of their undergraduate experience. The JUST staff have worked relentlessly, day and night, throughout the semester to bring you this publication. Additionally, without the generous support of the Wisconsin Institute of Discovery, the Holtz Center for Science and Technology Studies, the College of Agriculture and Life Sciences, and Associated Students of Madison, the publication of this journal would not have been possible.
The mission of JUST has always been to provide undergraduate researchers a platform and to make science accessible to broader audiences, not solely confined to UW campus. The presence of JUST at UW-Madison provides the opportunity for UW undergraduates to publish their work in a peer-reviewed journal and gives students a glimpse into the publication process of an academic journal. Contrastingly, our staff is able to display their outstanding talent as well as gain exceptional skills and experience regarding the publication process from the perspective of a producer in a scholarly journal. We believe that these experiences are a valuable asset to a traditional undergraduate education, especially for those students who wish to continue research.
In regard to the second part of our mission, we believe that scientific literacy is more important than ever, especially since STEM topics have become increasingly prevalent in all facets of society. Through methods such as effective communication of research and science, all of our lives can be enriched by the solid understanding of scientific thought. The JUST team is honored to be a small part in a much larger effort to make research and scientific achievement more accessible to non-expert communities beyond academia. In many ways, the space we occupy on campus mirrors the tenets of the Wisconsin Idea: that the influence of the university should better people's lives outside of the classroom and across the state. We believe that by helping to train the next generation of researchers and assisting in the dissemination of scientific knowledge, JUST is helping to realize and further advance the Wisconsin Idea.
In this issue of JUST, you will find a wide variety of scientific disciplines represented in our peer reviewed reports, our editorials, and our assortment of scientific imagery. Therefore, we ask you to please join us in continuing the tradition of recognizing the incredible research presented by UW-Madison undergraduates, and the overall pursuit of science communication.
Sincerely,
Naba Rao JUST Editor-in-Chief
EDITOR-IN-CHIEF
Naba Rao
MANAGING EDITOR
Manasi Simhan, Lucas Chini
DIRECTOR OF MARKETING


Hannah Landsly
MARKETING ASSISTANT
Chloe Hansen
DIRECTOR OF DESIGN
Jennifer Schaller
WEBMASTER
Ethan Wang
EDITORS OF CONTENT
Manasi Simhan
Lucas Chini
Adina Shaikh
Dima Hamdan
Riya Anandpara
Siya Mahajan
Trang Pham
HEAD STAFF WRITER
Tala Shaibi
STAFF WRITERS
Amy Li
Mahak Kathpalia
Khadijah Dhoondia
Zane Brinnington
Natalie Martinson
Yeoeun Kim
We would like to sincerely thank the Integrated Studies in Science, Engineering, and Society Undergraduate Certificate Program [ISSuES] at UW-Madison; The College of Agriculture and Life Sciences [CALS]; The Wisconsin Institute for Discovery; the Associated Students of Madison (ASM) and Wisconsin Alumni Research Foundation for financially supporting the production of JUST’s Fall 2022 issue. Thank you!


The Journal of Undergraduate Science and Technology (JUST) is an interdisciplinary journal for the publication and dissemination of undergraduate research conducted at the University of Wisconsin-Madison. Encompassing all areas of research in science and technology, JUST aims to provide an open-access platform for undergraduates to share their research with the university and the Madison community at large.
How to be creative and effective Integrated Studies in Science, Engineering, Undergraduate Certificate Program
ISSuES offers undergraduate engineering an opportunity to interact with the
7. The General Gist of the Uncanny Effect
11. A Picture’s Worth a Thousand Words
14. Smelling Cancer
Khadijah Dhoondia
17. Making Brains From Scratch: How Cerebral Organoids Will Revolutionize Neuroscience
Zane Brinnington
22. Artificial Sweeteners: A Trick or A Treat?
Natalie Martinson
25. Courtesy of The Badger Herald, Manasi Simhan
29. CA Commercially Viable Speech Query to Video Response Model
Palash Goyal
35. Ocypode gaudichaudii as a Bioindicator of Urbanization on the Sandy Beaches of Manabí, Ecuador
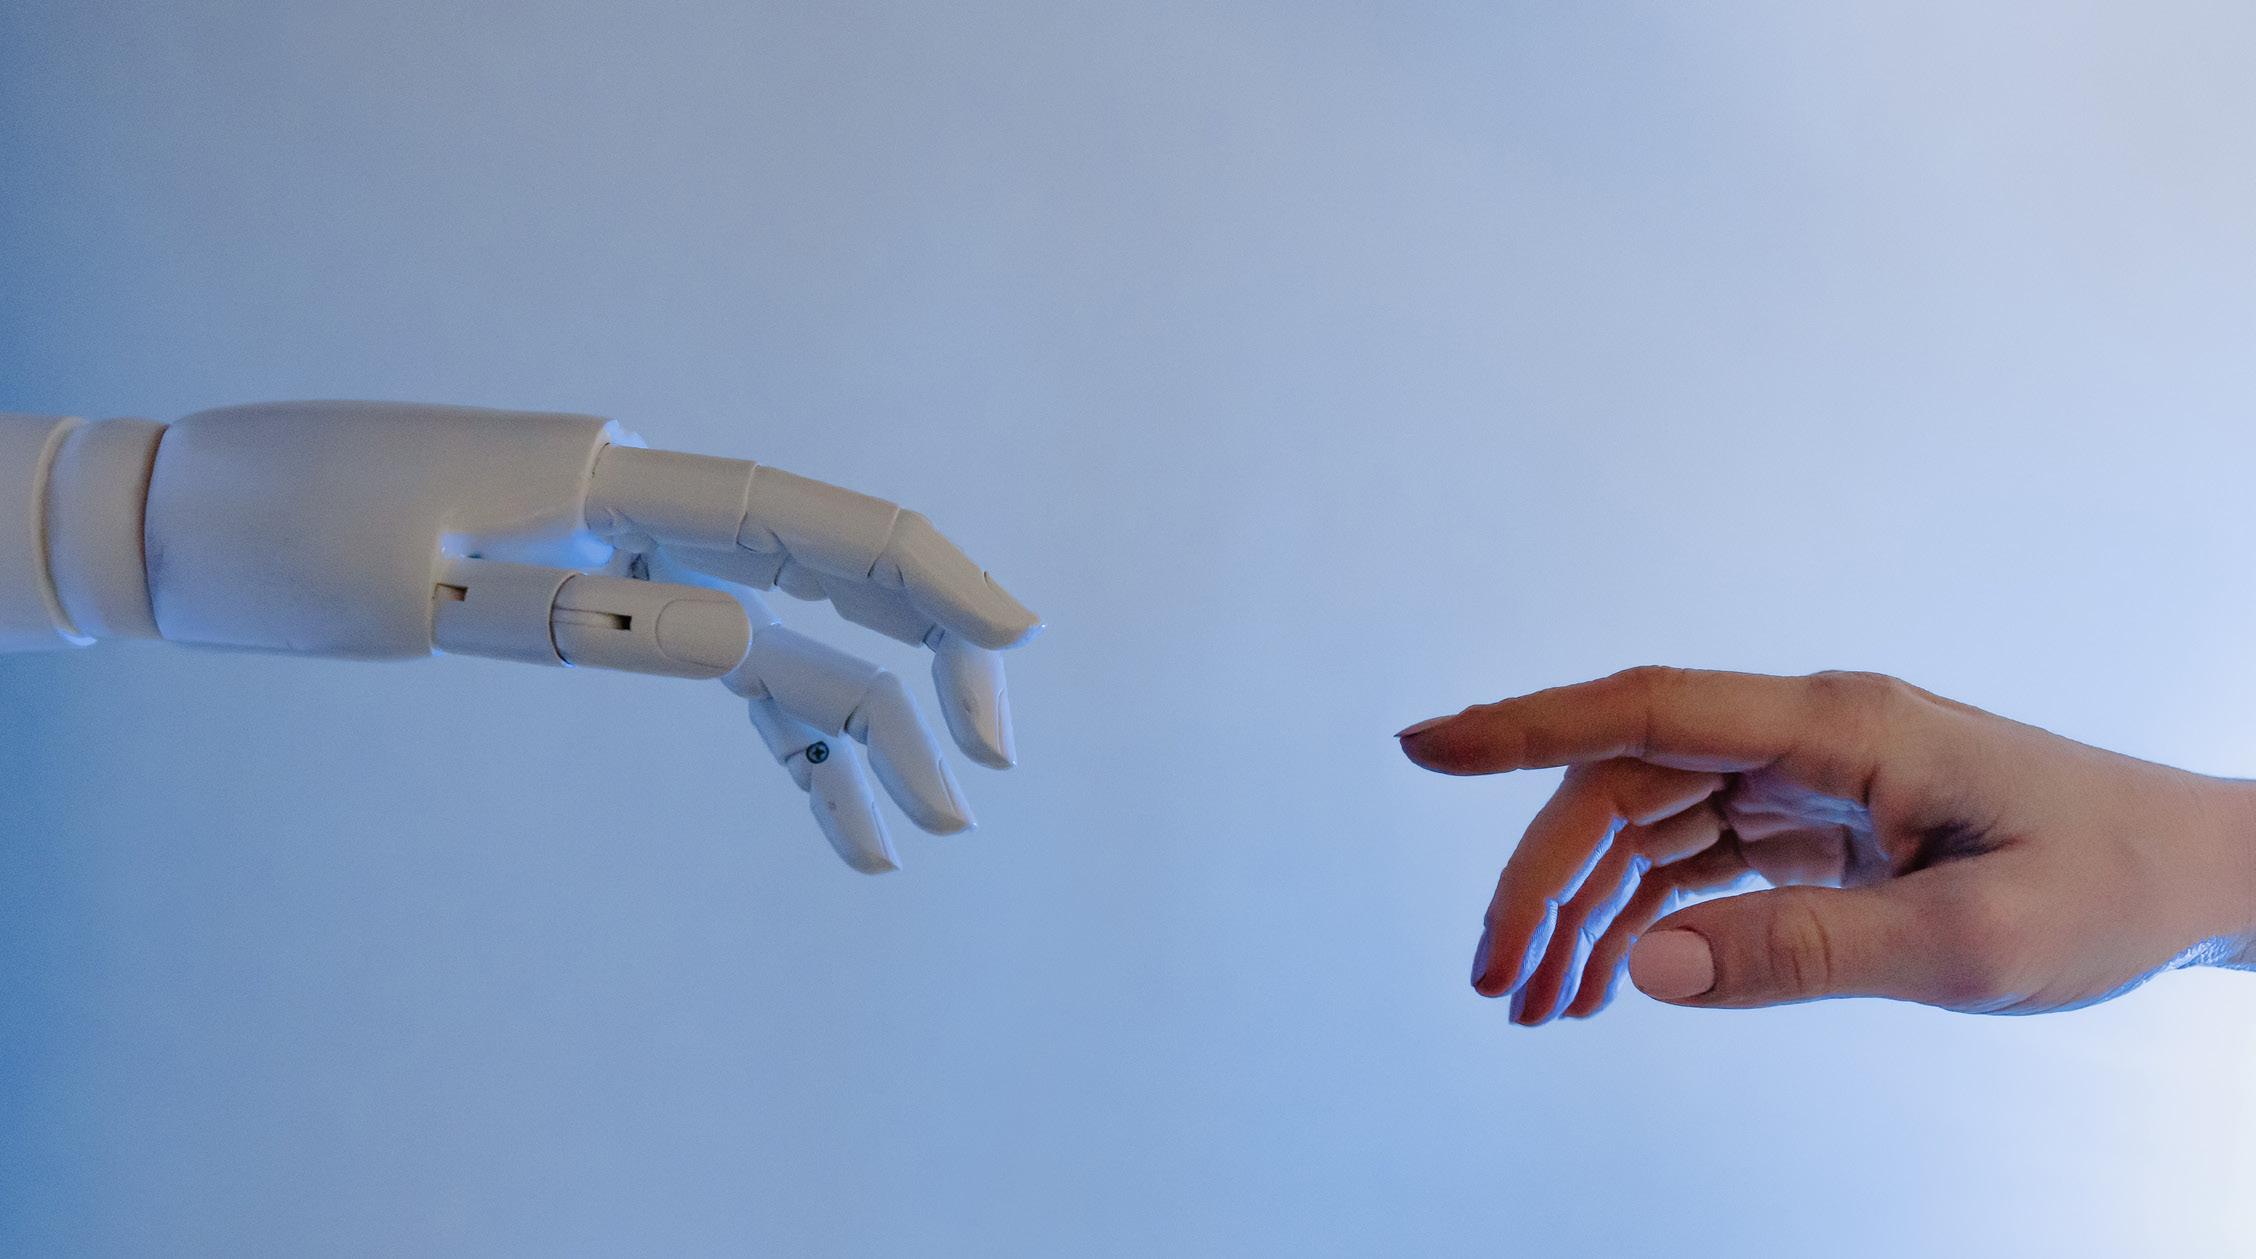
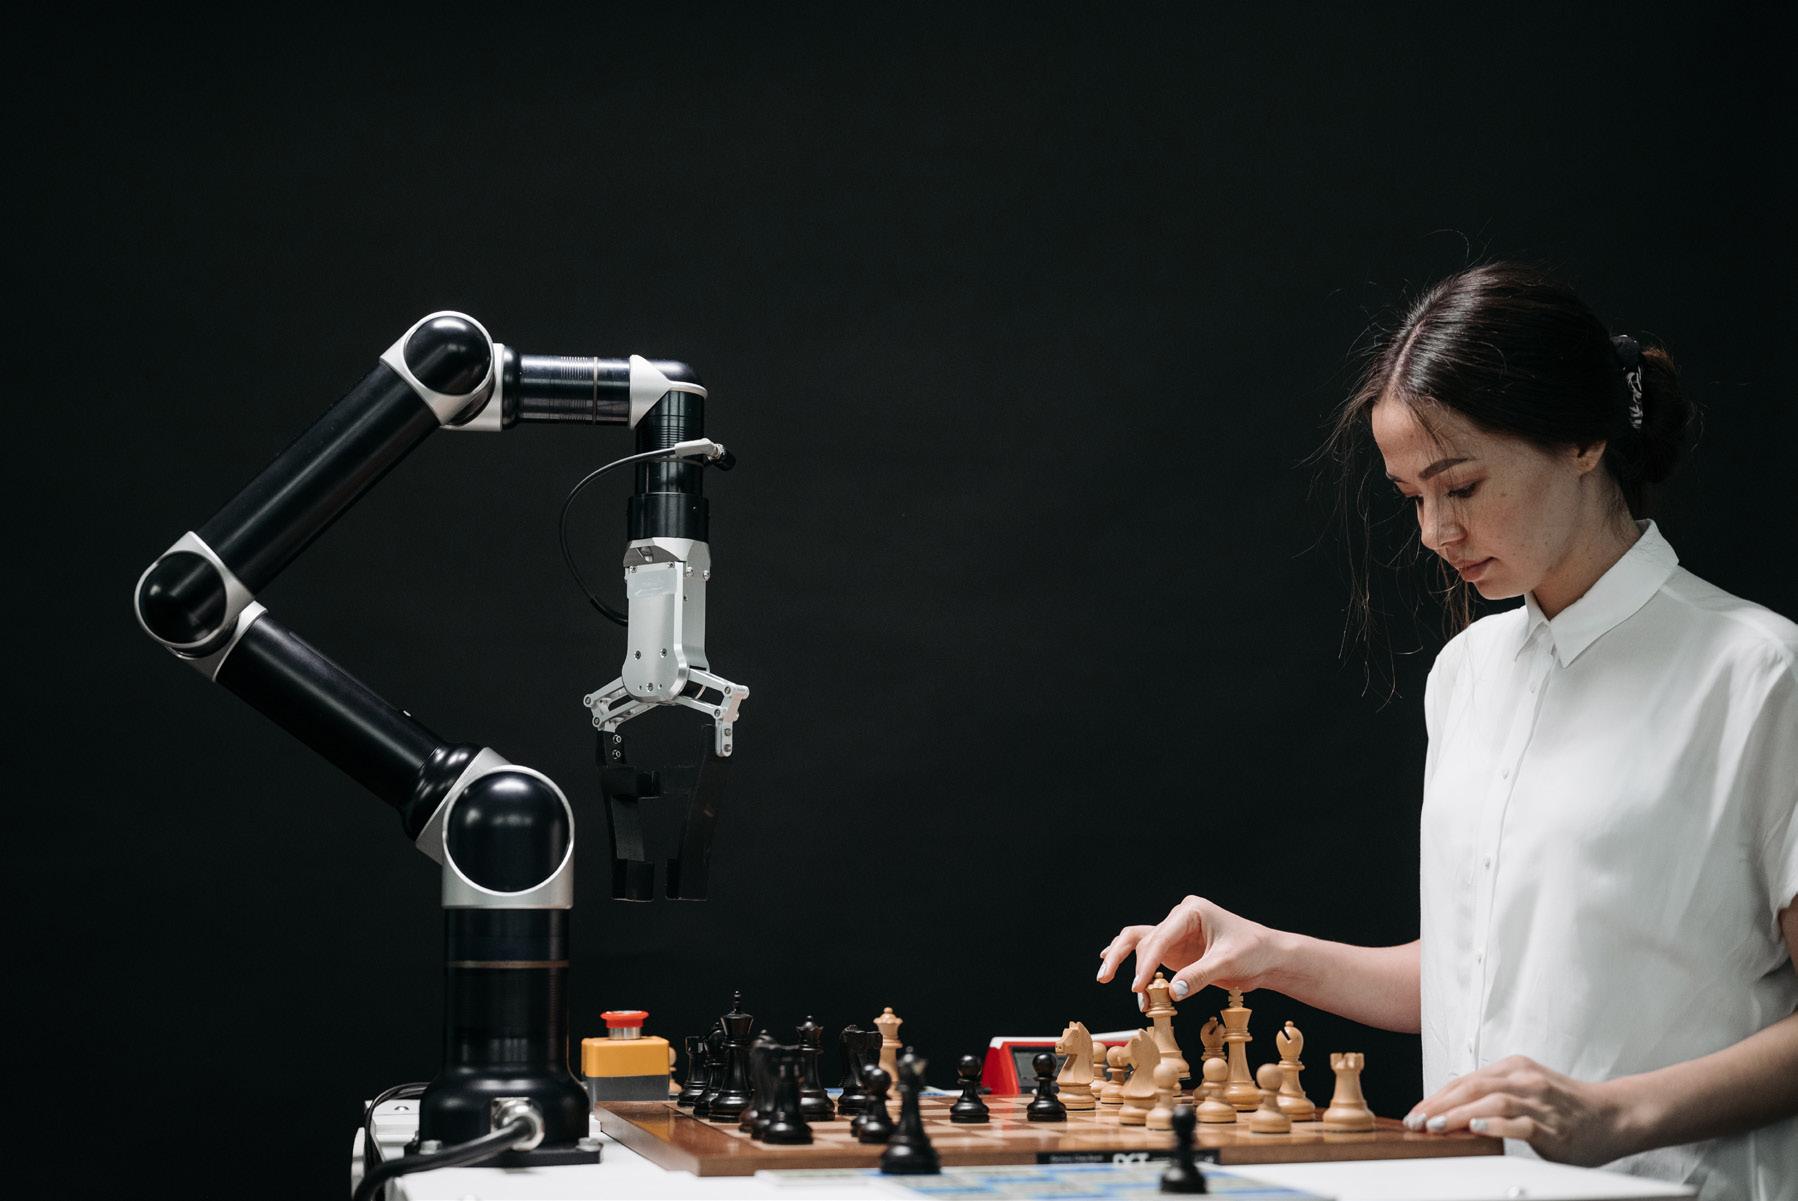
How would you feel if robots started looking more human? How would you feel if they began to talk, act, and think the exact same way that we do? Fear of artificial intelligence has slowly grown over the recent decade as companies race to create realistic robots with the purpose of replacing humans in careers from retail to the culinary world. Games like Detroit: Become Human tell of a near future where machines look exactly like humans and have even become more intelligent than humans. When we see such realistic human-like robots, a sense of uneasiness often settles over us. Why do we feel this way?
Prior to their advancement, people used to describe robots as “cold and difficult to interact with” since many were only programmed to carry out tedious human tasks.
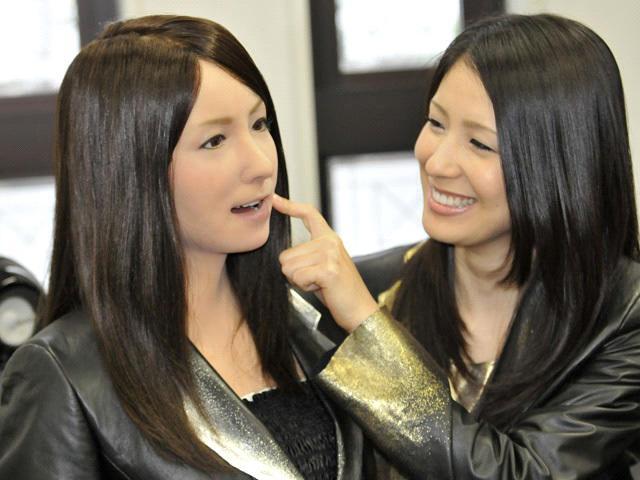
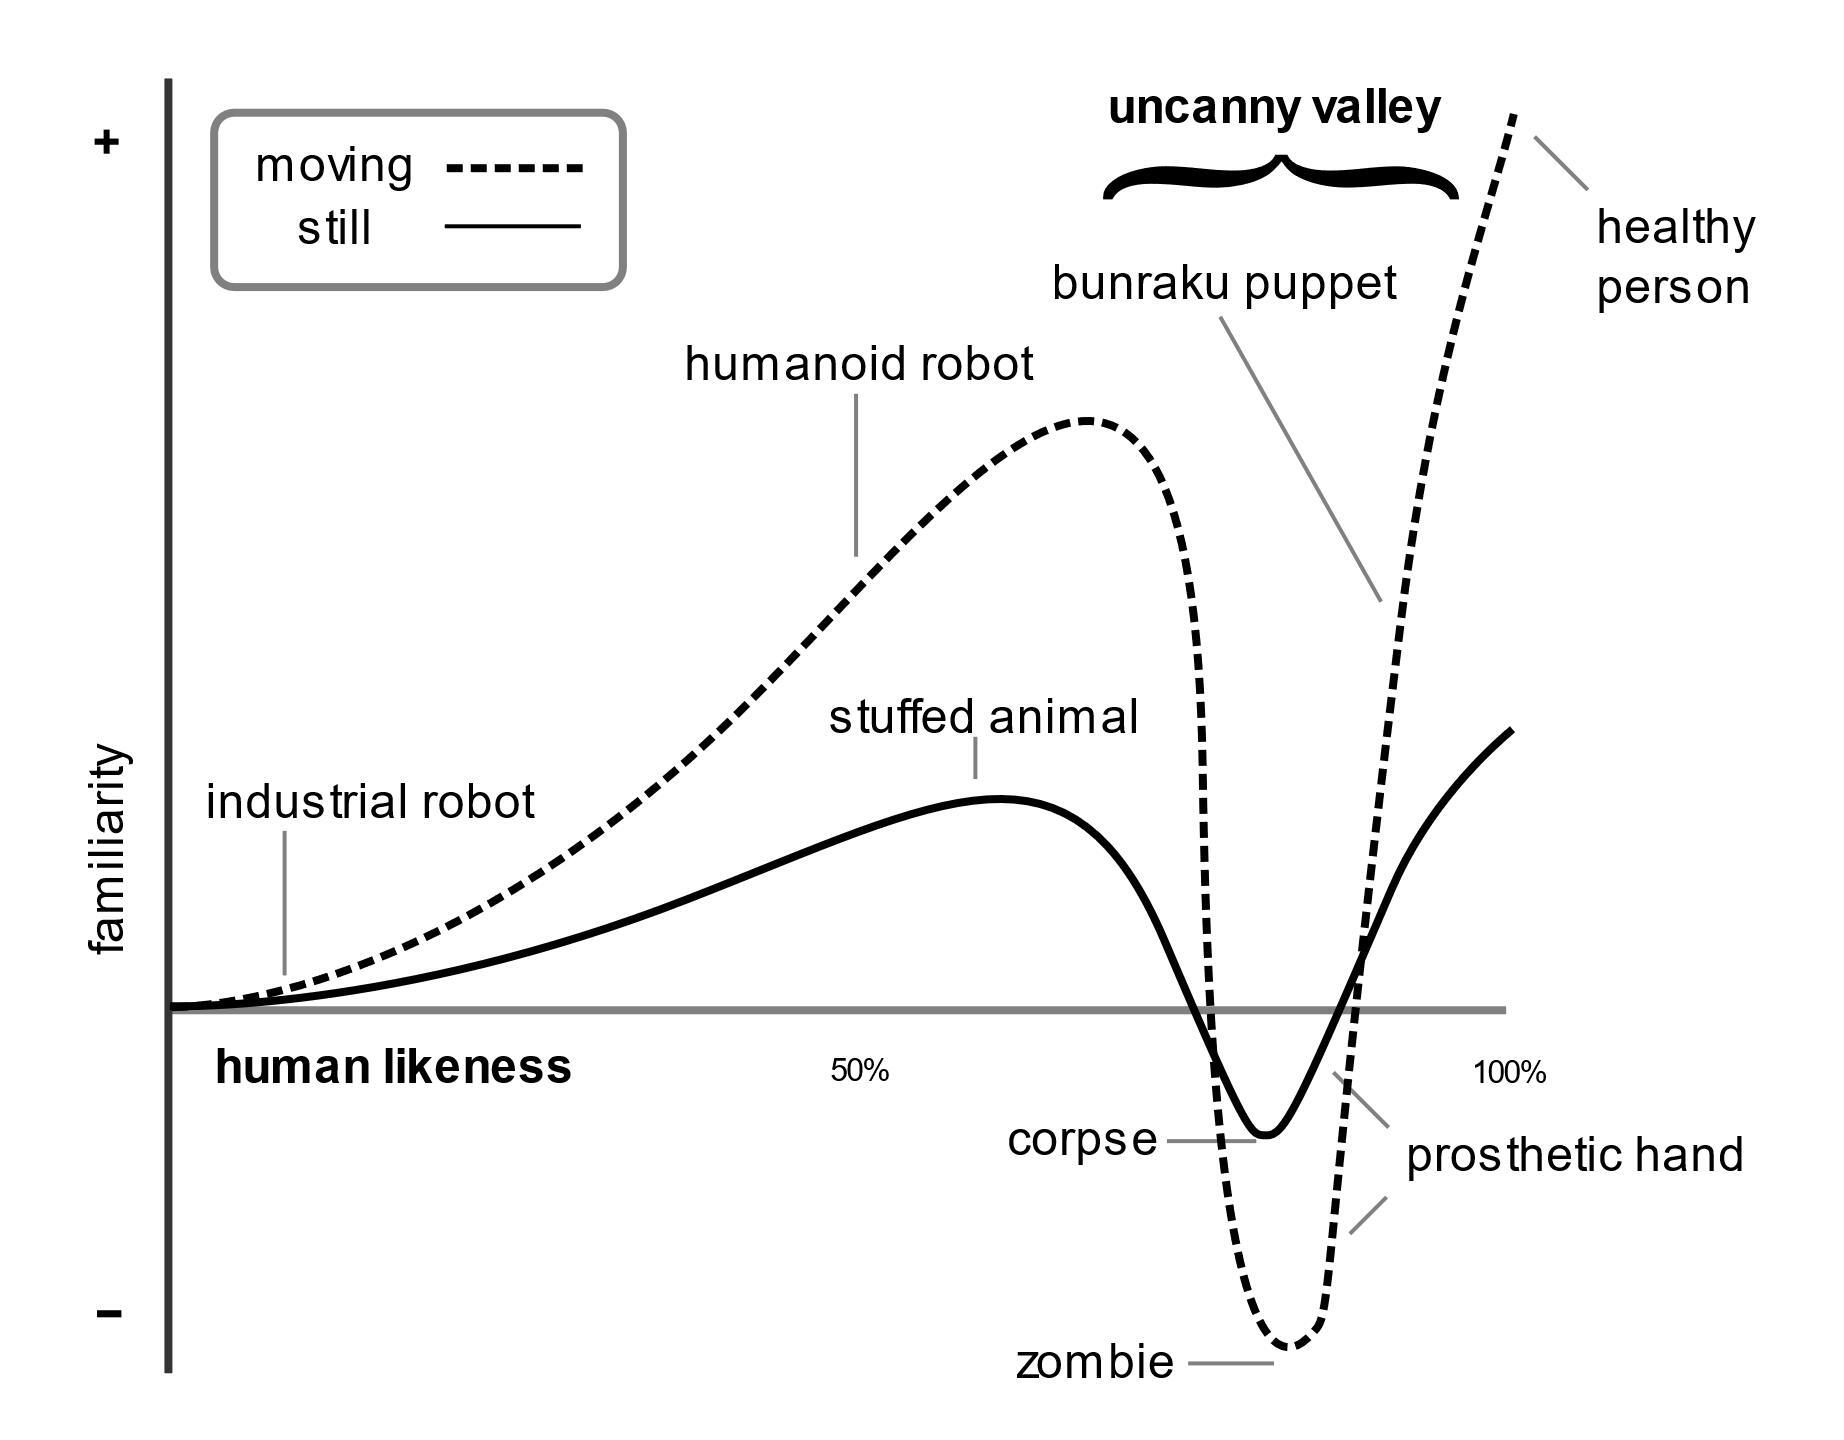
Due to such complaints, engineers set out to improve human robot interactions by designing androids – robots that bear resemblance to human beings physically and behaviorally. As a result of the birth of this new generation of robots, people began to feel emotional connections to androids because of how similar they were to humans, while also simultaneously leading to a growth in negative feelings that were the first hints pointing to the formation of the “uncanny valley hypothesis”. In 1970, Masahiro Mori, a Japanese roboticist, introduced the uncanny valley hypothesis in his essay Bukimi No Tani. In his paper, he represented this hypothesis as a graph that grows from an increasing slope to a sudden valley in the middle before increasing again (Figure 2). In a paper by Emory University researchers, they explained that the hypothesis “posits that as a robot increasingly resembles a person, its familiarity increases until a point at which it
"When we see such realistic human-like robots, a sense of uneasiness often settles over us. Why do we feel this way?"
abruptly drops to a negative value and elicits strong repulsion,” which we can see as the dip below the x-axis in Mori’s graph (Figure 2). They continue by describing that “as the robot’s resemblance to a person continues to increase, its familiarity increases again and eventually reaches the level of a person,” which is when the line because to increase again (Wang et al., 2022). Originally, Mori’s theory on how humans would interact with human-like robots did not have statistical data to support it as he did not perform any specific experiments. As a result, people did not pay attention to this theory until a few decades later where researchers started to conduct experiments to test the plausibility of uncanny valley hypothesis. Many experiments would take participant ratings on familiarity or eeriness of androids and try to match the curve Mori presented. Some experiments toyed with mismatched features in robots like voice with appearance, and researchers found that this could also evoke the uncanny feeling (Mitchell et al., 2011). Others looked at infant responses with human and avatar faces with unusual features; the infant experience showed that they preferred looking at human faces (Lewkowicz & Ghazanfar, 2012). Even today, studies on human responses to human-like machines are being conducted, but because of inconsistent empirical evidence, there is still an ongoing debate about the existence of the uncanny valley effect and when it appears.
In a 2022 meta-analysis, researchers Martina Mara, Markus Appel, and Timo Gnambs presented a quantitative review of the assumptions of the Uncanny Valley with a deeper focus on low human-likeness. Low human-likeness can be
seen in robots like industrial robots or humanoid robots, which are robots that have a human body, but appearance-wise don’t match a human’s features. In their study, they hypothesized that the graph would look the same as Mori’s proposed graph and assumed that robot motion would play a moderating role in amplifying the Uncanny Valley effect (Figure 2). The researchers performed a literature search for studies where at least one robot was evaluated with reference to the Godspeed questionnaire – an assessment of human-likeness and likeability in human-robot interaction research. The questionnaire included an assortment of words that described people’s impressions of robots under various categories such as likeability, animacy, and perceived safety (Bartneck, 2022). Participants chose what words accurately described how they felt by picking from a list of given options. For example, under the category “perceived safety”, the choices for words included anxious, calm, still, surprised, and agitated. Researchers only accepted studies under the following criteria: involved the Godspeed questionnaire, subjects interacted with robots, included statistical information, and had no subjects with psychological disorders. The database consisted primarily of participants from Germany and the United Kingdom. Many of the samples consisted of students or university personnel with only a few studies including people with low income, children, and senior citizens.
Researchers found that static robots, or robots that don’t move, were evaluated as less human-like, but that physical characteristic had no effect on likeability ratings (Mara et al., 2022). They concluded that in low to moderate levels of human-likeness, the available research found reflected the original graph proposed by Mori. Like Mori’s
graph, the likeability ratings initially increased and then leveled off to a plateau. Not many robots were rated as highly human-like in the studies chosen, which led to inconclusive results on whether perfect-resemblance human robots would lead to an eventual grow or drop in acceptance. Currently available research covers mostly low to moderate human likeability, where robots with high human likeness are uncharted territory. In this meta-analysis, researchers observed that many publications failed to report basic information on the sample along with descriptive results. Additionally, they found that the samples sizes were very small. Similar problems were cited in other meta-analyses that reviewed human-robot interactions (Leichtmann & Nitsch, 2020; Oliveira et al., 2021; Stower et al., 2021).
Scientists have come up with many reasons to explain why we, as humans, experience the uncanny phenomenon. The mortality salience hypothesis proposes that by looking at a robotic face that’s uncanny or unnatural in resemblance to humans, we are reminded of our own inevitable mortality leading to fears of death (Ho et al., 2008; MacDorman & Ishiguro, 2006). Another theory is the evolutionary aesthetics hypothesis, which states that due to selection pressures, people are more attracted to characteristics that represent good health and fertility (Hanson, 2005). Therefore, an uncanny human robot has low attractiveness because it does not have these characteristics. While plausible, these hypotheses cannot be said
to successfully show a strong relationship to the uncanny phenomenon due to insufficient research results.
Researchers continue to not only evaluate the uncanny effect at large, but also have begun to delve into the issue of racial bias associated with AI, and AIs within virtual assistants, robots, and games. While significant exploration has been carried out on human-robot interaction, we still have no concrete findings that are backed solidly by most research. Many meta-analysis and literatures searches prove helpful in identifying what future researchers must do. With previous studies and new counseling, the future of AI-based science has more hope in finally proving whether the uncanny valley hypothesis exists and the extent of it. The human response to the Uncanny Effect phenomenon only adds to the list of mysteries of the human response.
A model pokes the face of a lookalike humanoid robot called “Geminoid-F.” (2017, August 1). CBS News. https://www. cbsnews.com/pictures/creepily-human-like-robots-2/2/.
Bartneck, C. (2021, February 10). The godspeed questionnaire series. Retrieved November 5, 2022, from https://www. bartneck.de/2008/03/11/the-godspeed-questionnaire-series/.
Hanson, D. (2005, December). Expanding the aesthetic possibilities for humanoid robots. In IEEE-RAS international conference on humanoid robots (pp. 24-31). Citeseer.
Leichtmann, B., & Nitsch, V. (2020). How much distance do humans keep toward robots? Literature review, meta-analysis, and theoretical considerations on personal space in human-robot interaction. Journal of Environmental Psychology, 68, 101386. https://doi.org/10.1016/j. jenvp.2019.101386.
Lewkowicz, D. J., & Ghazanfar, A. A. (2011, July 14). The development of the Uncanny Valley in infants - lewkowicz - 2012 ... Retrieved November 10, 2022, from https://onlinelibrary.wiley.com/doi/pdf/10.1002/dev.20583.
Mara, M., Appel, M., Psychology of Communication and New Media, Gnambs, T., Appel, Avelino, . . . Steinmetz, H. (2022, February 02). Human-like robots and the Uncanny Valley. Retrieved November 5, 2022, from https://econtent. hogrefe.com/doi/full/10.1027/2151-2604/a000486#c58.
Mitchell, W. J., Szerszen, K. A., & MacDorman, K. (2011, January 1). A mismatch in the human realism of face and voice ... - sage journals. Retrieved November 10, 2022, from https://journals.sagepub.com/doi/10.1068/i0415.
Mori, M. (2021, November 01). The uncanny valley: The original essay by Masahiro Mori. Retrieved November 5, 2022, from https://spectrum.ieee.org/the-uncanny-valley.
Oliveira, R., Arriaga, P., Santos, F. P., Mascarenhas, S., & Paiva, A. (2021). Towards prosocial design: A scoping review of the use of robots and virtual agents to trigger prosocial behaviour. Computers in Human Be -
havior, 114, Article 106547. https://doi.org/10.1016/j. chb.2020.106547.
Stower, R., Calvo-Barajas, N., Castellano, G., & Kappas, A. (2021). A meta-analysis on children’s trust in social robots. International Journal of Social Robotics. Advance online publication. https://doi.org/10.1007/s12369-02000736-8.
Wang, S., Lilienfeld, S. O., & Rochat, P. (2015, December 1). The uncanny valley: Existence and explanations - sage journals. Retrieved November 10, 2022, from https://journals.sagepub.com/doi/10.1037/gpr0000056.
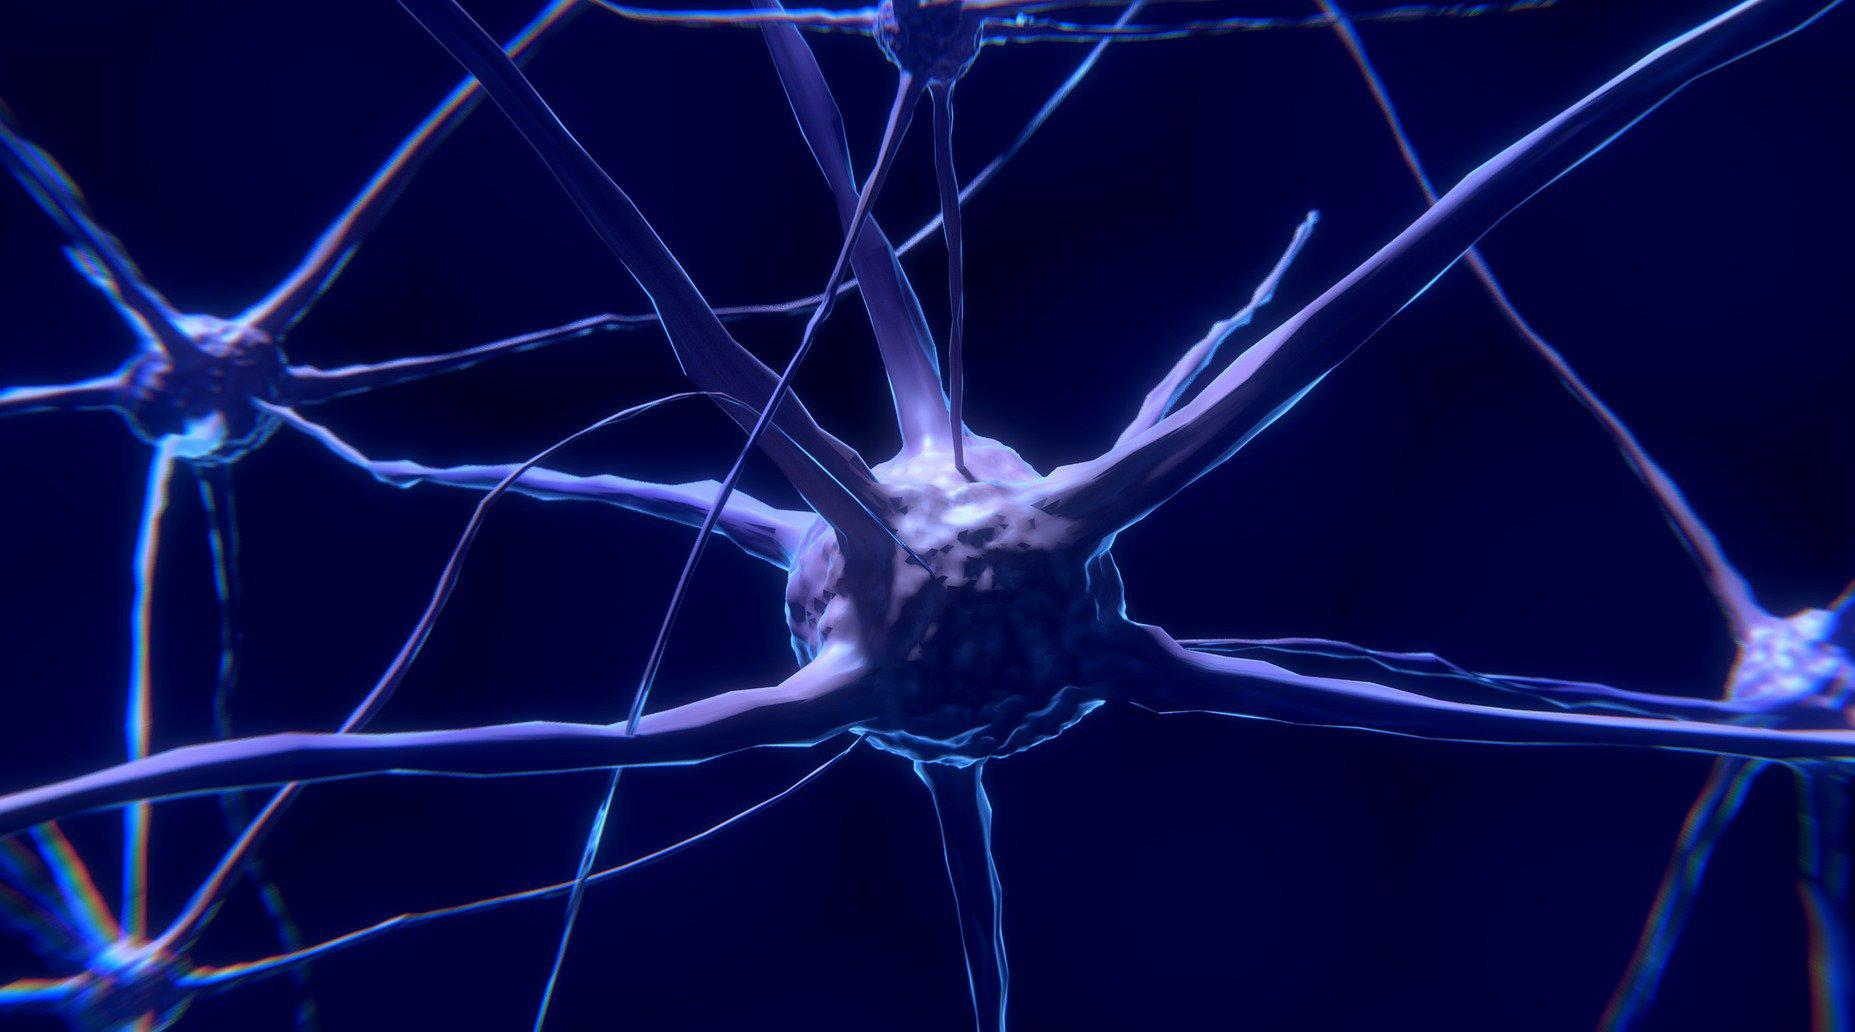
As technology’s horizons expand, the line between what is technologically feasible and what is not is rapidly blurring. In a recent study by Russian researchers from HSE University and Open University for the Humanities and Economics, a trained cascade of artificial neural networks (interconnected systems of artificial neurons that aim to simulate the way the human brain analyzes information) successfully predicted the personalities of 12,000 volunteers who participated in the study better than human raters. These predictions were solely based on the participants’ selfies. So, how did a bunch of computing systems develop these pseudo-cognitive abilities?
Over the years, many neuroscientific studies have derived meaningful associations between morphological features,
such as height-to-length ratio or face symmetry, and one’s personality traits. Neuroscientists propose several theoretical reasons underlying this correlation.
It is known that multiple features of our facial structure and behavior have a genetic basis. Genes play a crucial role in shaping our facial characteristics and influencing aspects of our personalities. For instance, the brain’s supraorbital region, the area located immediately above our eye sockets, is thought to have evolved as a means of social communication.
Another plausible relationship between appearance and personality is a psychoanalytic theory that describes the changes observed in someone’s personality and behavior based on their and others’ perceptions of their facial features. This can lead to a personality phenomenon called the
"Genes play a crucial role in shaping our facial characteristics and influencing aspects of our personalities."
‘Quasimodo complex’ where an individual is abnormally concerned about a defect in their physical appearance and end up developing maladaptive personality characteristics.
Lastly, some habitually expressed emotions also often modify our static features like wrinkles or the appearance of facial muscles which may assist in the AI’s prediction (Kachur et al., 2020).
Drawing on this body of scientific evidence, a research group at the HSE University and Open University for the Humanities and Economics used these statistically significant associations and integrated them with machine learning.
The group started off by getting 12,000 volunteers to turn in their selfies along with a self-report measure of the Big Five personality traits in psychology – extraversion, agreeableness, openness, conscientiousness, and neuroticism. The images were randomly divided into a training group and a test group. A series of neural networks were used to filter the pictures and ensure comparable and consistent characteristics. After this, the team designed an image classification network to decompose the image into 128 distinct features. Multi-layer Perceptrons (algorithms that take inputs with several layers to generate a set of outputs by learning non-linear functions) were used to determine personality traits by the image invariants (Ujjwalkarn, 2016).
When analyzing individuals' faces, the model had a success rate of correctly interpreting images with neutral expressions 8% higher than the probability of guessing by chance,
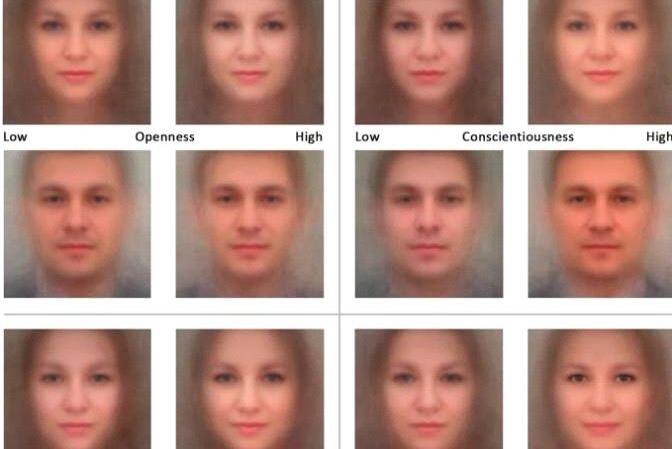
a statistically significant difference, though not particularly high. Additionally, conscientiousness was the most accurately predicted trait based on images and self-assessment.
This technology is an attractive alternative for several personality assessment applications where high speed and low cost are more crucial than significant accuracy. For instance, this combination of machine learning and artificial neural networks could be used in dating apps to find ‘best matches’ by testing compatibility of personality simply through images, or in customer service to determine recommendations of products, services, etc (Tech Xplore, 2020).
Despite the potential for optimization, major concerns surrounding making judgements off of physical appearances alone continue to persist.
The field of phrenology, the pseudoscience of measuring bumps in the skull to indicate one’s mental abilities, has now been widely scrutinized despite its initial widespread popularity. Phrenologists were often accused of using models and measurements that resembled those put forward by eugenicists to justify their views on racial discrimination in the early 20th century (Hayes, 2019). This led to false scientific claims strengthening the idea of White superiority and promoting institutions like slavery (Cherry, 2022).
The lasting effects of phrenology’s use in the 20th Century compel ethicists to ask today’s scientific community a burning question: are such trained algorithms capable of aggravating existing marginalization in society? After all, manufacturers could use this technology to institutional-
ize bias into the underwriting process of the algorithm, promoting discrimination against race, biological sex, or differently-abled people through their appearance while hiding this fact behind a supposedly objective AI. Besides, disclosure issues always exist in today’s AI-driven world. Companies may violate privacy guidelines and use the collected data for purposes that the users are not aware of or distribute and sell it. Ultimately, the AI’s predictions of personality based on facial features are still false for a significant proportion of cases, but the results are morally reprehensible almost every time. How such exacerbation of societal divides can be avoided continues to perplex data scientists as they strive to refine their technology.

Cherry, K. (2022, March 23). Phrenology's History and Influence. Verywell Mind. Retrieved November 20, 2022, from https://www.verywellmind.com/what-is-phrenology-2795251.
Hayes, S. (2019, January 20). Phrenology: A cautionary tale for Data Science and how ethics can help. LinkedIn. Retrieved November 20, 2022, from https://www. linkedin.com/pulse/phrenology-cautionary-tale-data-science-how-ethics-can-sherrill-hayes.
Hays, B. (2020, May 22). Artificial intelligence can predict a person's personality using only a selfie. Retrieved April 10 from https://www.upi.com/Science_News/2020/05/22/
Artificial-intelligence-can-predict-a-persons-personality-using-only-a-selfie/4981590158009/?spt=su.
Kachur, A., Osin, E., Davydov, D., Shutilov, K., & Novokshonov, A. (2020). Assessing the Big Five personality traits using real-life static facial images. Scientific Reports, 10(1). https://doi.org/10.1038/s41598-020-65358-6.
Rayne, E. (2020, December 15). AI just got way creepier because it can now read your personality from a selfie. SYFY WIRE. Retrieved April 10 from https://www.syfy.com/syfywire/ai-can-now-read-your-personality-from-a-selfie.
Tech Xplore. (2020, May 22). Artificial intelligence can make personality judgments based on photographs. Tech Xplore - Technology and Engineering news. Retrieved April 10 from https://techxplore.com/news/2020-05-artificial-intelligence-personality-judgments-based.html.
Ujjwalkarn. (2016, August 10). A Quick Introduction to Neural Networks. The Data Science Blog. Retrieved April 10 from https://ujjwalkarn.me/2016/08/09/quick-intro-neural-networks/.
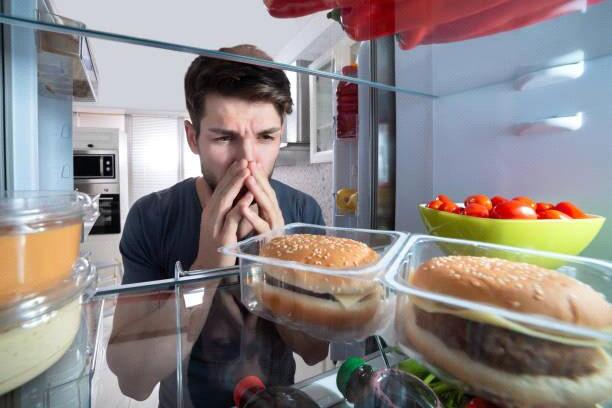
After the aching exhaustion of a long day, you reach for the leftovers that have been sitting in the back corner of your fridge. Hungrily, you lift the styrofoam lid of the takeout box and take a deep breath. Suddenly, a pungent odor fills your nostrils and alarms go off in your brain. Your meal goes straight to the trash—moldy food makes for some incredibly unappetizing leftovers.
Be it the stench of a spoiled meal keeping us from food poisoning or the acrid smell of smoke saving us from a fire, our sense of smell is essential to keeping us out of danger. However, as useful as our noses are, they do have their limitations – there are just certain scents that we can’t detect.
But what if we could find a way to detect even the most unnoticeable smells? What other dangers could we prevent?
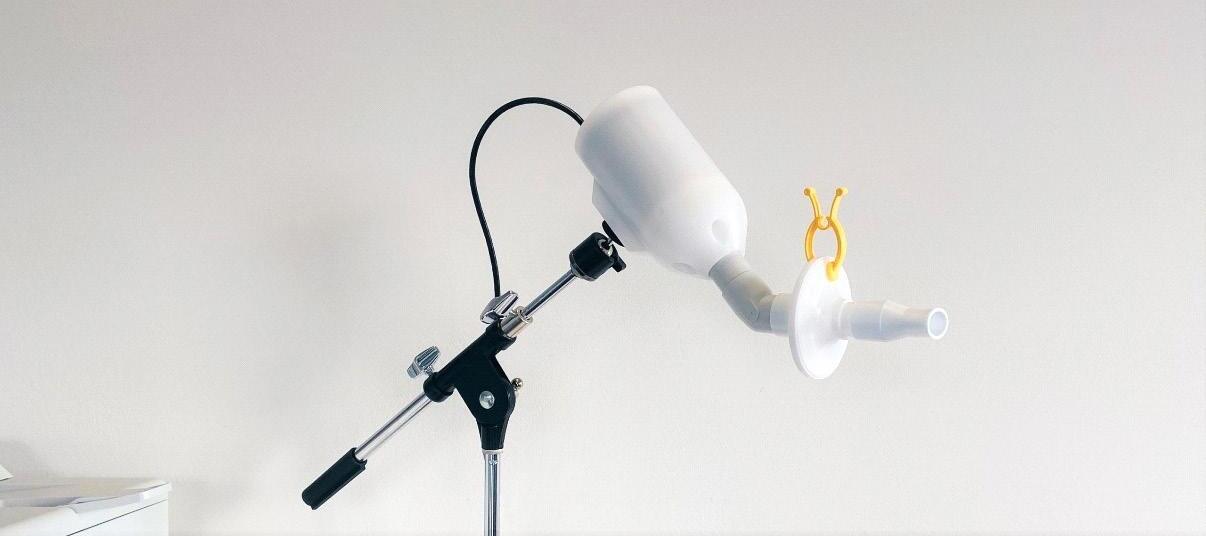
The development of electronic noses, also known as e-noses, can help us answer some of these questions.
Much like the human nose, e-noses also have receptors –electronic chips known as sensor arrays – that can detect odor molecules. These electronic chips have a wide variety of sensors that react with specific kinds of molecules, based on their chemical properties (Santos et al., 2017). Once the odor molecules interact with the sensors, the sensors undergo either a chemical or physical change that sends a signal to a computer. This step is similar to how our noses work; once our olfactory neurons (neurons found in the nose) are stimulated, they too send signals to our brain.
"When it comes to even the most undetectable of odors, e-noses will be there to pick up on what smells fishy."
Upon receiving signals from the e-nose, the computer uses an artificial intelligence system called Artificial Neural Networks (ANNs) to identify the smell (Illahi et al., 2021). Much like the interconnected neurons in the brain, ANNS have nodes that receive and transmit signals (Illahi et al., 2021). By processing and interpreting information similar to how our brains do so, ANNs use pattern recognition to ultimately identify the odor (Baldwin et al., 2011).
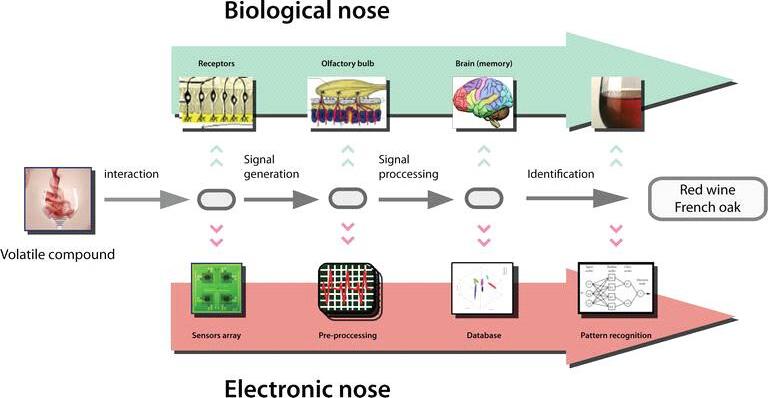
The ability to recognize types of chemicals based on a substance’s odor is a powerful tool for quality control in a variety of fields, especially in the food industries and military (Anzivino et al., 2022). However, in recent years, attention has primarily been focused on applying e-noses in the field of healthcare–specifically, to “sniff out” cancer.
According to the World Health Organization (WHO), a biological marker is “any substance, structure, or process that can be measured in the body or its products and influence
or predict the incidence of outcome or disease,” (Strimbu). When cancer cells are metabolized (the process in which cancer cells obtain the energy they need to grow) or when the immune system responds to disease, the body produces odor molecules known as volatile organic compounds (VOCs) (Janfaza et al., 2019). Although there are “a combination of around 3000” VOCs, only a small number have been associated with disease (Anzivino et al., 2022, p.1). Because there are specific VOCs associated with cancer, some odor molecules have the potential to be characterized as a biological marker (Janfaza et al., 2019). This understanding has been the foundation of current research that aims to test the efficacy of e-noses as a cancer diagnostic tool.
One clinical study published in August 2022 investigated if an e-nose was able to distinguish between healthy patients, patients with head and neck cancer, and patients with allergic rhinitis (seasonal allergies) (Anzivino et al., 2022). The 45 participants of this study attended two checkups within a ten day window. In the first appointment, patients underwent screening to ensure they met all criteria for the study. During the second appointment, a sample of the patient’s exhaled breath was obtained using an e-nose – a process that took about five minutes. From here, a software program called SPSS was then used to analyze the data collected by the e-noses. The study found that the results from head and neck cancer patients were distinguishable not only from the healthy patients, but also patients who experienced a different airway associated disease (allergic rhinitis). This means that e-noses can potentially serve as accurate and efficient diagnostic tools for head and neck cancers.
Another clinical study published in May 2022 has also assessed e-noses as a tool to identify prostate cancer (Taverna et al., 2022). However, instead of obtaining patient breath samples, the e-noses were used to identify VOCs in the patients’ urine. Urine samples were taken from 88 patients currently diagnosed with prostate cancer and 86 healthy patients. The e-nose’s performance was then evaluated based on its ability to correctly identify prostate cancer patients (sensitivity) as well as any misdiagnoses (Taverna et al., 2022). The study ultimately found a high degree of sensitivity at 85.2% (Taverna et al., 2022). Even though this study differed from the previous study by testing urine instead of exhaled breath, the researchers were in agreement – e-noses have high potential to be an efficient, cost-effective, and accurate diagnostic alternative for cancer diagnoses.
Testing of the e-nose is still in its early phases – large scale studies and clinical trials are needed before e-noses can
be confidently used to detect cancer. However, the future for e-nose technology is promising. For many cancers, traditional diagnostic methods are incredibly invasive. For example, head and neck cancers are typically diagnosed using a surgical biopsy during which “a surgeon removes a small amount of abnormal tissue from the area where the cancer is suspected” (Memorial Sloan Kettering Cancer Center). Biopsies are also a primary method of diagnosing prostate cancers (CDC). However, e-noses provide a noninvasive alternative, which can serve to reduce patient pain and the potential for complications to arise during a procedure. The fact that e-noses are non-invasive also means that this technology can be used repeatedly as a method of tracking cancer progression (Janfaza et al., 2019).
By modeling the human sense of smell, e-noses have the potential to be powerful diagnostic tools. Although further research is necessary before e-noses can be applied in the clinical setting, recent studies have highlighted the high degree of accuracy demonstrated when using VOCS as a method of identifying cancer. Furthermore, e-noses may be more advantageous than traditional diagnostic methods due to their efficiency and non-invasive sampling methods.
While human noses are critical to assessing immediate danger, there are some threats that we remain nose blind to. Fortunately, when it comes to even the most undetectable of odors, e-noses will be there to pick up on what smells fishy.
Anzivino, R., Sciancalepore, P. I., Dragonieri, S., Quaranta, V. N., Petrone, P., Petrone, D., Quaranta, N., et al. (2022). The role of a polymer-based e-nose in the detection of head and neck cancer from exhaled breath. Sensors, 22(17), http:// dx.doi.org/10.3390/s22176485.
Baldwin, E. A., Bai, J., Plotto, A., & Dea, S. (2011). Electronic noses and tongues: applications for the food and pharmaceutical industries. Sensors (Basel, Switzerland), 11(5), 4744–4766. https://doi.org/10.3390/s110504744.
Head and Neck Cancer Diagnosis. (n.d.). Memorial Sloan Kettering Cancer Center. https://www.mskcc.org/cancer-care/ types/head-neck/diagnosis.
How Is Prostate Cancer Diagnosed? (2022, March 14). Centers for Disease Control and Prevention. https://www.cdc. gov/cancer/prostate/basic_info/diagnosis.htm.
Illahi, A. A. C., Dadios, E. P., Bandala, A. A., & Vicerra, R. R. P. (2021). Electronic nose technology and application: A review. IEEE 13th International Conference on Humanoid, Nanotechnology, Information Technology, Communication and Control, Environment, and Management (HNICEM), doi: 10.1109/HNICEM54116.2021.9731890.
Janfaza, S., Khorsand, B., Nikkhah, M., & Zahiri, J. (2019). Digging deeper into volatile organic compounds associated with cancer. Biology methods & protocols, 4(1), https://doi. org/10.1093/biomethods/bpz014.
Santos, J. P. , Lozano, J., & Aleixandre, M. (2017). Electronic noses applications in beer technology. IntechOpen. https:// doi.org/10.5772/intechopen.68822.
Strimbu, K., & Tavel, J. A. (2010). What are biomarkers?. Current opinion in HIV and AIDS, 5(6), 463–466. https://doi. org/10.1097/COH.0b013e32833ed177.
Taverna, G., Grizzi, F., Tidu, L., Bax, C., Zanoni, M., Vota, P., Lotesoriere, B. J., Prudenza, S., Magagnin, L., Langfelder, G., Buffi, N., Casale, P., & Capelli, L. (2022). Accuracy of a new electronic nose for prostate cancer diagnosis in urine samples. International Journal of Urology: Official Journal of the Japanese Urological Association, 29(8), 890–896. https://doi.org/10.1111/iju.14912.
Sánchez C, Santos JP, Lozano J. Use of Electronic Noses for Diagnosis of Digestive and Respiratory Diseases through the Breath. Biosensors. 2019; 9(1):35. https://doi.org/10.3390/.
To be blunt, the human brain is a miracle of nature. The product of billions of years of evolution, it boasts 86,000,000 neurons and trillions of connections between them, enabling a spectrum of observation, logical reasoning, and creativity unparalleled in the animal kingdom. Considering that neuroscience only seriously emerged as a scientific
field in the 1950s, the notion that scientists have managed to discover anything about an organ that had millions of years to develop in under 70 decades is impressive; the suggestion that they might be able to synthesize brains in a laboratory setting is fantastical. The thought alone conjures up images of brains suspended in ooze that might decorate
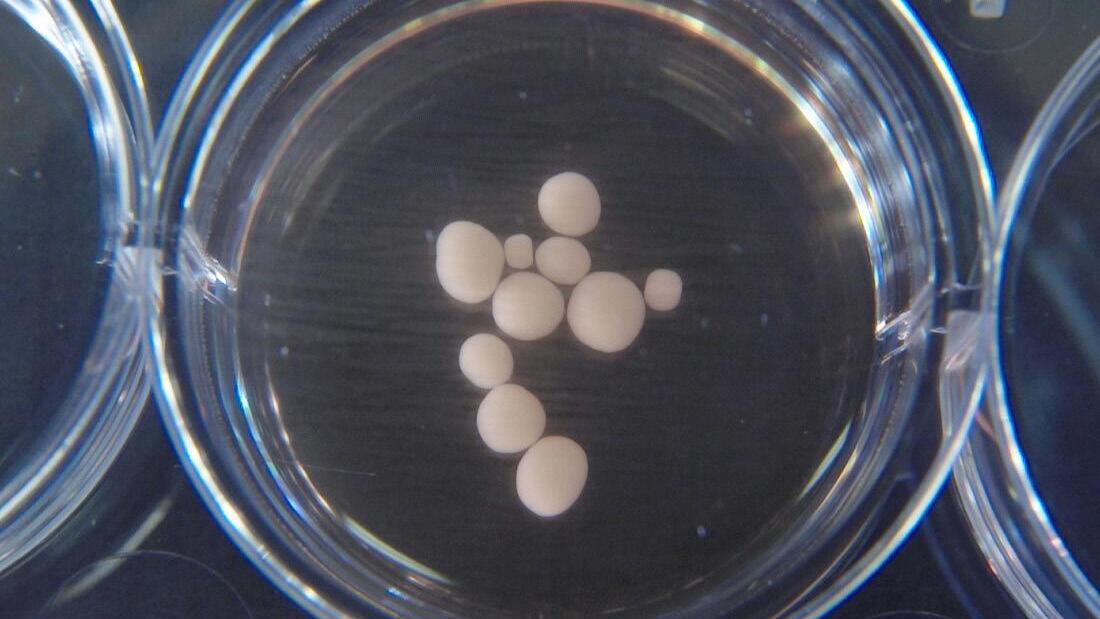
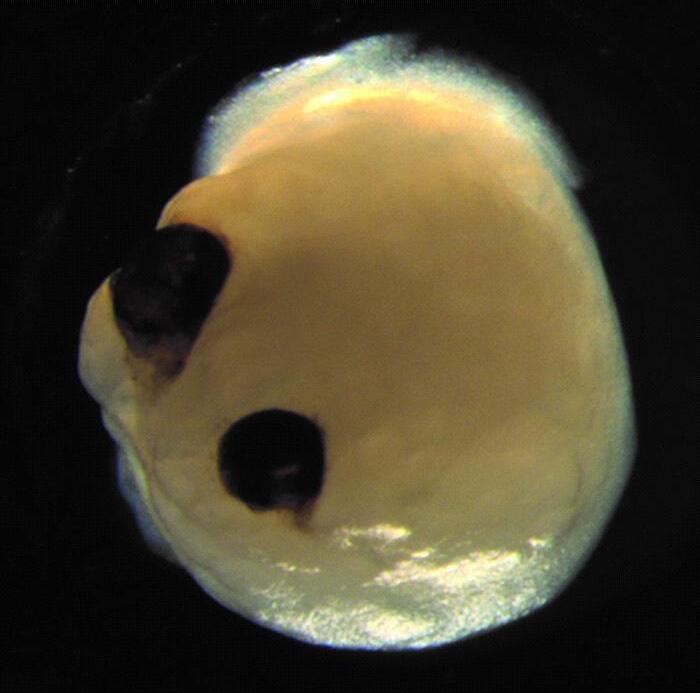
"These brains are not the typical wrinkly, purple, two-fist-size organs that sit behind your eyes; these cerebral organoids can typically be found in a petri dish as pink circles no more than 4 millimeters in diameter. "
Dr. Frankenstein’s lab, or perhaps be written in the pages of a Philip K. Dick novel. But in reality, creating brains has generally been perceived to be a scientific impossibility.
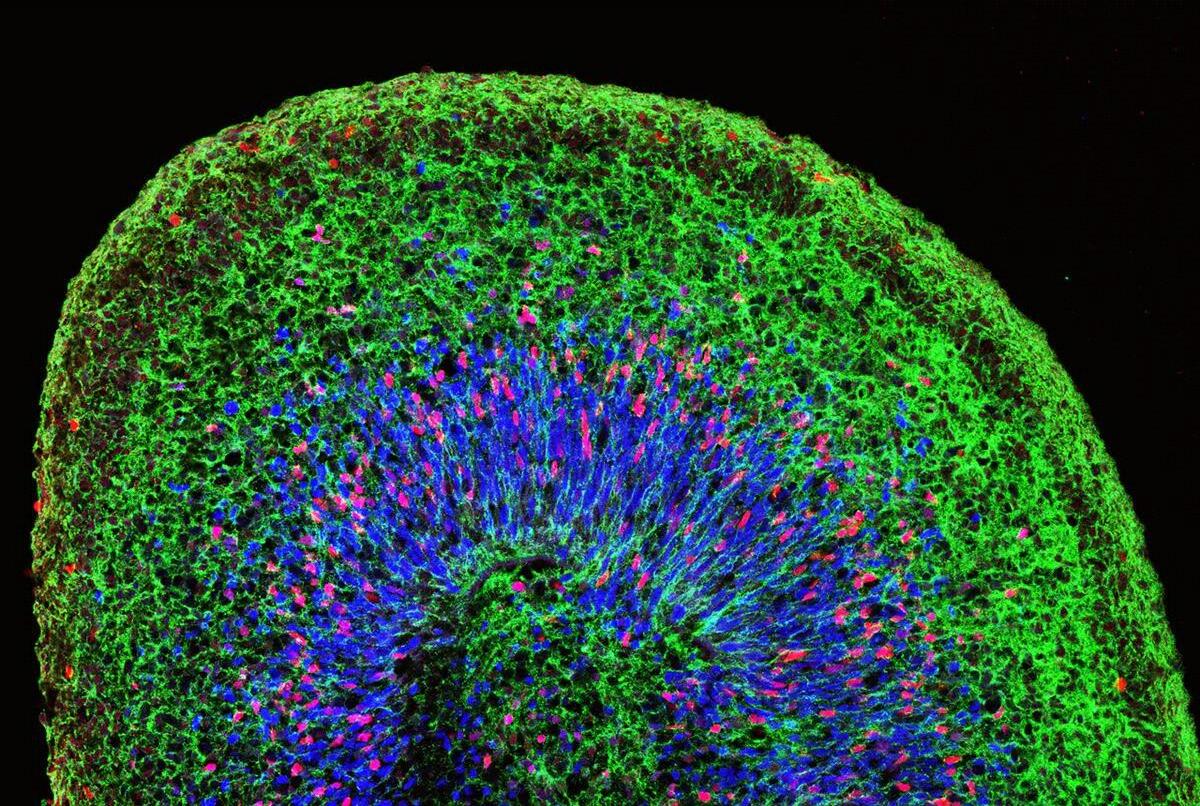
That is not exactly true. In fact, scientists have been challenging this claim for almost a decade with cerebral organoids, also known as brain organoids or “mini brains.” These brains are not the typical wrinkly, purple, two-fist-size organs that sit behind your eyes; these cerebral organoids can typically be found in a petri dish as pink circles no more than 4 millimeters in diameter, as in the image above. On the surface, they look more like bubblegum than anything else. You might never guess that each blob contains a network of neural connectivity as complex as a 5-week-old fetus.
To say that brain organoids are made from scratch is not 100% true. Scientists need some human genetic material to build from.
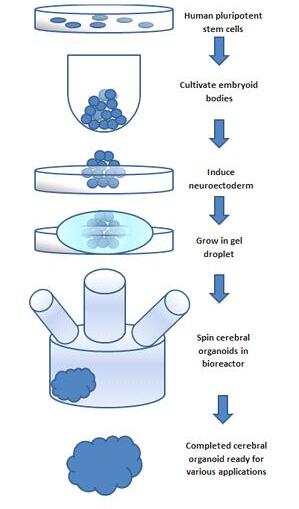
They get this in the form of cells called Human Pluripotent Stem Cells (hPSC). These are cells that scientists can harvest from human beings – usually through easily accessible means like skin or blood – and expose to various formulas that enable them to revert back to their embryonic state. From there, these stem cells have the freedom to grow into any human cell possible such as bone cells, liver cells, muscle cells, and, of course, brain cells (Koo et. al., 2019).
As early as the start of the 2000s, scientists began using these hPSCs in vitro to form 2-dimensional cultures that were extremely helpful for showing how and why cells behaved as they did (Corrò et. al., 2020). Unfortunately, being stuck in a single plane meant that they weren’t nearly as helpful as they could be, as they gave little information regarding extracellular matrix interactions between cells nor the specific properties of cells. To truly replicate the complexity of the human brain, it was vital that scientists took these cultures to the third dimension.
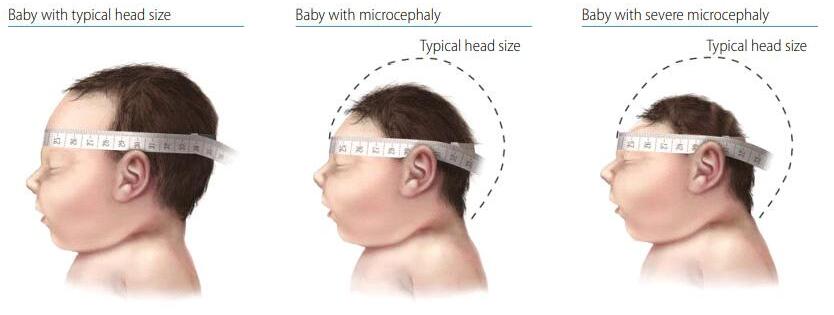
In 2013, researchers at the University of Cambidge finally discovered how to induce hPCS into forming threedimensional brain-like structures. Their aim was to study the cognitive development of individuals afflicted with Microcephaly, a condition that leads to babies having significantly smaller heads than average, generally caused by an issue with brain development (Lancaster et. al., 2013).
Similar to creating 2-D structures, the researchers started with hPSCs, harvested from the skin of an individual suffering from Microcephaly, in order to capture its genome. They added a specialized concoction of nutrients like sugars, proteins, minerals, and vitamins to these cells that triggered them to grow into brain cells. The cells were then placed within a gel (Matrigel) that enables them to move in all directions, facilitating the development of 3-dimensional structures. To both speed up the process and
control any external factors, the scientists then placed these cells into a bioreactor, a machine designed to keep the cells at a constant body temperature and move in a way that mimics blood flow. In doing so, they allowed the growth factors added to the stem cells to be properly dispersed and ensure their equal presence throughout the organisms.
In under 22 days, the contents of these petri dishes transformed from stem cells into 100,000 neurons that organized themselves into layers similar to those in the brain cortex with fully formed connected neural networks (Lancaster et. al., 2013). The process strongly resembled fetal brain development (Koo et al., 2019) – they had successfully synthesized a brain nearly identical to a baby in the womb.
Since their creation almost 10 years ago, mini brains have been put to numerous uses. Per their initial purpose, they were used in analyzing the development of cerebral organoids with microcephaly to potentially determine causes Comparing the development of a brain organoid based on the cells of someone suffering from microcephaly with a control brain organoid revealed abnormalities in a protein that could be a cause for the disorder (Lancaster et. al, 2013).
Cerebral organoids’ ability to show the development of brains afflicted with neurological/neurodegenerative disorders has proven valuable to examine other conditions. Scientists have been able to study conditions known to originate in brain development, like schizophrenia. Disorders that can emerge later in life, like alzheimer’s and cerebral palsy, also have had cerebral organoids created and studied for them. (Song et. al., 2021).
Cerebral organoids have also been used to examine conditions that individuals are not born with or contract later in life. For example, during the 2016 Zika virus outbreak in South America that threatened to develop into a world-wide pandemic, scientists had difficulty determining how Zika damaged the neural pathways of babies within impregnated mothers. Utilizing mini brains, scientists discovered the cell-signaling pathway for viral infection and the mechanism through which infected newborns were neurodevelopmentally affected by the virus. Additionally, scientists used brain organoids to screen numerous medications and compounds targeted to fight Zika and its effects (Qian et. al., 2017).
Brain organoids also provide a unique tactic in the fight against brain cancer, providing a means to both replicate the genetics of a cancer sufferer and the 3D environment. Studies of the cancer glioblastoma have revealed the flexibility of cerebral organoids in oncological research. One application of the technology involved replicating a tumor in organoid form through the same mechanisms that were used to create organoids from healthy brains. Another was grafting a glioblastoma tumor to a healthy brain organoid and tracing its development. These min-brains created to be afflicted with glioblastoma were also treated with a variety of drug and radiation methods to determine which were the most effective at targeting and killing the cancerous cells (Song et. al, 2017).
Evidently, there is a lot that brain organoids are capable of. But it is notable that the technology is still in its infancy, and that there are numerous factors responsible for their limitations. For instance, unlike human brains, brain organoids have no source of blood flow to sustain them. This means that they have a relatively short lifespan, at max surviving a few months (Koo et. al., 2019). Almost every significant neurological disorder takes significantly longer to develop. Brain organisms thus do net yet provide a means to observe the complete lifespan and progression of neurological disorder development– a process essential to truly understanding them.
Brain organoids are not nearly complex enough; they are significantly smaller than real brains, which contain nearly one million times more neurons than their lab grown counterparts, and their connectivity is, as a whole, not organized (Qian et. al., 2019). While brain organoids are great at mimicking the tissue and function of many parts of the normal brain, they are not put together in the same meaningful way. While every part of a real human brain has a purposeful location that allows for incredibly complex neural networks to develop and communicate, these parts are ordered randomly in organoids so that these connections are not possible.
Of course, these are all limitations that we can expect to be improved with time and technology. That said, increasing complexity goes hand-in-hand with increasing ethical concern. Debates over how far we should go with these minibrains are rampant in the field, with particular concern given to the fact that these brains are capable of demonstrating electrical communications similar to those theorized to be responsible for consciousness. After all, we are already capable of creating brains equal in complexity to a fetus. (Koo et al., 2019). How long will it be until we can create a brain as complex as that of a newborn? It seems likely that synthesizing a brain as advanced as a living humans would raise ethical contentions in the community.
The field has a lot of development to do before it ever reaches a point where it is possible to create brains as advanced as a newborn baby. That’s not to say that brain organoid research has ground to a halt, either. On the contrary, new developments regarding brain organoids are being made daily. Recently, scientists have been able to connect brain
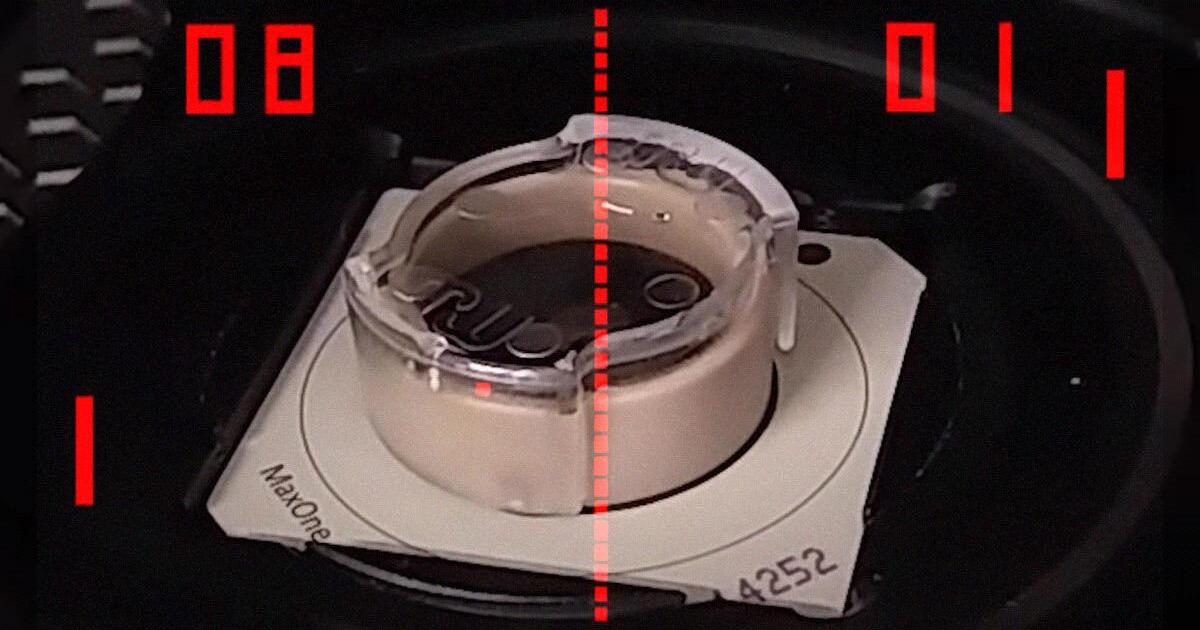
organoids to other synthetic organoids like eyes to examine the connectivity between sight and the developing brain (Gabriel et. al, 2021). Just months ago, scientists connected brain organoids to an Atari and managed to teach it how to play the classic game “Pong” (Zuk et. al., 2022).
Prior to the inception of these organoids, researching the brain had been extraordinarily difficult. Scientists were limited to autopsies– which give little information regarding the living brain– animal studies, which give little information about the human brain, and MRI scans– which give little information about the processes of the brain. Brain organoids show promise in conquering all of these setbacks.
The technology is not even ten years old– who knows what their future holds?
Muotri, A. (n.d.). Organoid [Review of Organoid]. https:// d2r55xnwy6nx47.cloudfront.net/uploads/2020/01/ Muotri_1800_02-Organoid.jpg
University of California, San Diego.
(2013). Cerebral Organoid Flowchart (K. Tilva, Ed.) [Review of Cerebral Organoid Flowchart]. https://commons.wikimedia. org/wiki/File:Cerebral_organoid_flowchart.png#filelinks.
CDC. (2021). Newborn with a normal head size, microcephaly, and severe microcephaly [Review of Newborn with a normal head size, microcephaly, and severe microcephaly]. https:// www.cdc.gov/ncbddd/birthdefects/surveillancemanual/ quick-reference-handbook/microcephaly.html.
UCLA Broad Stem Cell Research Center. (n.d.). Brain Organoid [Review of Brain Organoid]. https://newsroom. ucla.edu/file?fid=59dd0a092cfac2292701fe74.
Gabriel, E. (2021). This image shows a brain organoid with optic cups [Review of This image shows a brain organoid with optic cups].
New Scientist. (2021). Brain Organoid Pong [Review of Brain Organoid Pong].
Sun, N., Meng, X., Liu, Y., Song, D., Jiang, C., & Cai, J. (2021). Applications of brain organoids in neurodevelopment and neurological diseases. Journal of Biomedical Science, 28(1). https://doi.org/10.1186/s12929-021-00728-4 (Song et. al., 2019).
Qian, X., Song, H., & Ming, G. (2019). Brain organoids: advances, applications and challenges. Development, 146(8), dev166074. https://doi.org/10.1242/dev.166074 (Qian et al., 2019).
Koo, B., Choi, B., Park, H., & Yoon, K.-J. (2019). Past, Present, and Future of Brain Organoid Technology. Molecules and Cells, 42(9), 617–627. https://doi.org/10.14348/ molcells.2019.0162 (Koo et. al., 2019).
Lancaster, M. A., Renner, M., Martin, C.-A., Wenzel, D., Bicknell, L. S., Hurles, M. E., Homfray, T., Penninger, J. M., Jackson, A. P., & Knoblich, J. A. (2013). Cerebral organoids model human brain development and microcephaly. Nature, 501(7467), 373–379. https://doi.org/10.1038/nature12517.
Corrò, C., Novellasdemunt, L., & Li, V. S. (2020). A brief history of organoids. American Journal of Physiology-Cell Physiology, 319(1), C151-C165.
Qian, X., Nguyen, H. N., Jacob, F., Song, H., & Ming, G.-L. (2017). Using brain organoids to understand Zika virusinduced microcephaly. Development (Cambridge, England), 144(6), 952–957. https://doi.org/10.1242/dev.140707.
Gabriel et al., (2021). Human brain organoids assemble functionally integrated bilateral optic vesicles. (2021). Cell Stem Cell. https://doi.org/10.1016/j.stem.2021.07.010.
Zuk, P., Stertz, L., Walss-Bass, C., & Lázaro-Muñoz, G. (2022). Research Comparing iPSC-Derived Neural Organoids to Ex Vivo Brain Tissue of Postmortem Donors: Identity After Life?. AJOB neuroscience, 13(2), 111-113.

 By Natalie Martinson, Edited by Manasi Simhan & Lucas Chini
Introduction
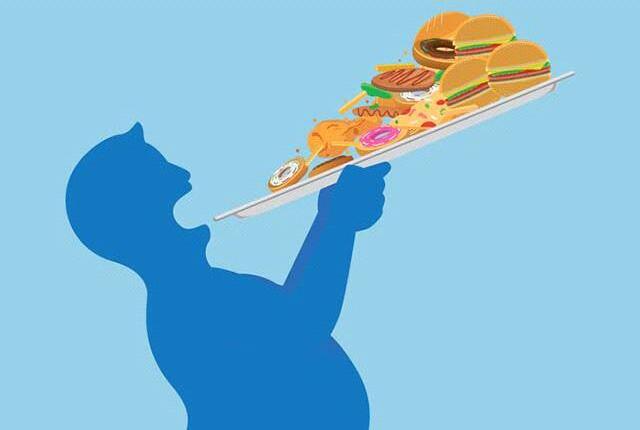
It is no secret that artificial sweeteners are helpful in the path to losing weight while still providing the benefits of a delightfully sweet treat. They may, however, be doing more harm than good. With artificial sweeteners found in energy drinks, coffee drinks, soft drinks, candy, baked goods, dairy, and so many more processed, delicious foods, it is no surprise that they account for a significant portion of a college students’ diet. With the rise in artificial sweetener presence in mainstream food over the past years, long-term research has
been conducted on the neurological effects of consuming these sugar substitutes, and the results are not so sweet.
A 2017 Harvard study found that people who consumed at least one diet drink per day suffered from three times as many strokes and were three times more likely to develop dementia than their peers. Even when variables such as gender, diet, smoking, and exercise were controlled, the results of the study remained significant (Shmerling, 2017). The outcome of this study parallels recent statements made
"People who consumed at least one diet drink per day suffered from three times as many strokes and were three times more likely to develop dementia than their peers."
by the CDC that announce that “people who often drink sugary drinks are more likely to face health problems, such as weight gain, obesity, type 2 diabetes, heart disease, cavities, and gout, a type of arthritis” (Rethink Your Drink, 2022). This statement, along with many others on the correlation between artificial sweeteners and diabetes, obesity, and high blood pressure make news headlines all the time. With so many declarations being thrown around, a deep dive into some actual studies is necessary.
Experimental studies carried out on rats reflect the effects of sugar-calorie intake on humans. A study in rat models showed a diminished ability to recognize satiety (the feeling of fullness) after rats were exposed to artificially sweetened food sources. Some rats were given food with glucose, a sugar with calories, and some were given artificially sweetened food, in which the sweetener had no calories. Both rat groups then fasted before being exposed to food containing only glucose.
The rats exposed to glucose during the initial round did not eat significant amounts of the second portion of food as they were able to make a connection between the sweetness levels and calorie intake – only eating until full. The rats who had been exposed to artificial sweeteners, however, ate significantly more total calories over both servings. These rats were unable to connect sweetness and calorie intake, as the zero-calorie sweetener did not adequately fill them up, causing them to eat until they no longer wanted to eat, not just until they had enough glucose to function at healthy levels (Hout, 2019).
The tendency to overeat after being exposed to artificial sweeteners is rooted in basic physiology. Glucose receptors on the tongue and in the gut connect to the brain and help us satisfy our sweet cravings. Artificial sweeteners do not follow the same pathway to our brain as real glucose does and are only sensed by the tastebuds on our tongue
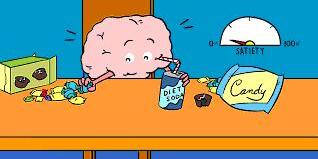
(Villareal et al., 2016). This makes artificial sweeteners less fulfilling to us, tricking us into overeating to compensate for the unfulfillment.
Along with their inability to make us full, sweeteners do not help our bodies function to the same degree that glucose does. As humans, we need glucose to survive. Glucose is broken down all throughout our body and converted into ATP to fuel us with the energy we need to function. In fact, our brain needs 70% of our total glucose intake to keep itself in tip-top shape and maintain healthy neuronal firing, allowing our brain to communicate with our body (“Longterm study”). Artificial sweeteners cannot be converted into ATP in the same way as glucose. In fact, some studies have even suggested that artificial sweeteners may decrease our guts’ ability to digest glucose (Van Opstal et al., 2019). This, however, is an ongoing topic of research.
While the cards may be stacked against artificial sweeteners, it’s important to recognize that they are not the end of the world and consuming them is not likely to send you into an instantaneous stroke. In fact, Harvard Medical School sincerely warns us that their dementia and stroke results are a matter of correlation with artificial sweeteners, rather than a proven causation (Shmerling, 2017). It would take a great deal more time to account for every factor that could have skewed their results making the study of artificial sweeteners on human health a developing subject. The biological rationale behind artificial sweeteners and satiety has, however, been proven true.
To summarize, although negative neurological effects have been linked to artificial sweeteners, most of the terrifying statements about them are theoretical. While they may cause you to eat a little bit more than you need to, there are worse things you can consume. Until more research has been conducted into the effects of consuming calorie-less sugars, the general advice is to consume artificial sweeteners in careful moderation. Or, if you’re looking for a brighter phrase: have your artificially sweetened dessert and eat it too.
Gordon-Seymour, Nicola (2021, December 15). Long-term study alludes to artificial sweeteners and cognitive decline link. https://www.nutraingredients.com/Article/2021/12/15/ Long-term-study-alludes-to-artificial-sweeteners-andcognitive-decline-link.
Rethink Your Drink. (2022, June 21). Centers for Disease Control and Prevention. https://www.cdc.gov/healthyweight/ healthy_eating/drinks.html.
Shmerling, R. H., MD. (2017, June 7). Could artificial sweeteners be bad for your brain? Harvard Health. https:// www.health.harvard.edu/blog/could-artificial-sweeteners-bebad-for-your-brain-2017060711849.
Hout, M. and Myüz, H. (2019, March 29). MyTrick or Treat? How Artificial Sweeteners Affect the Brain and Body. (n.d.). Frontiers for Young Minds. Retrieved November 2, 2022, from https://kids.frontiersin.org/articles/10.3389/frym.2019.00051.
Van Opstal, A. M., Hafkemeijer, A., van den Berg-Huysmans, A. A., Hoeksma, M., Mulder, T. P. J., Pijl, H., Rombouts, S. A. R. B., & van der Grond, J. (2019). Brain activity and connectivity changes in response to nutritive natural sugars, non-nutritive natural sugar replacements and artificial sweeteners. Nutritional Neuroscience, 24(5), 395–405. https:// doi.org/10.1080/1028415x.2019.1639306.
Villareal, L. M. A., Cruz, R. A. M., Ples, M. B., & Vitor, R. J. S. (2016). Neurotropic effects of aspartame, stevia and sucralose on memory retention and on the histology of the hippocampus of the ICR mice ( Mus musculus ). Asian Pacific Journal of Tropical Biomedicine, 6(2), 114–118. https://doi. org/10.1016/j.apjtb.2015.11.001.
Plant growth progression measured within test tubes under a controlled environment.
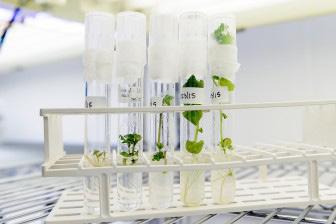
Katie Cooney, The Badger Herald
Science Hall, home to the Department of Environmental Studies and Geography at the University of Wisconsin-Madison.

Manasi Simhan
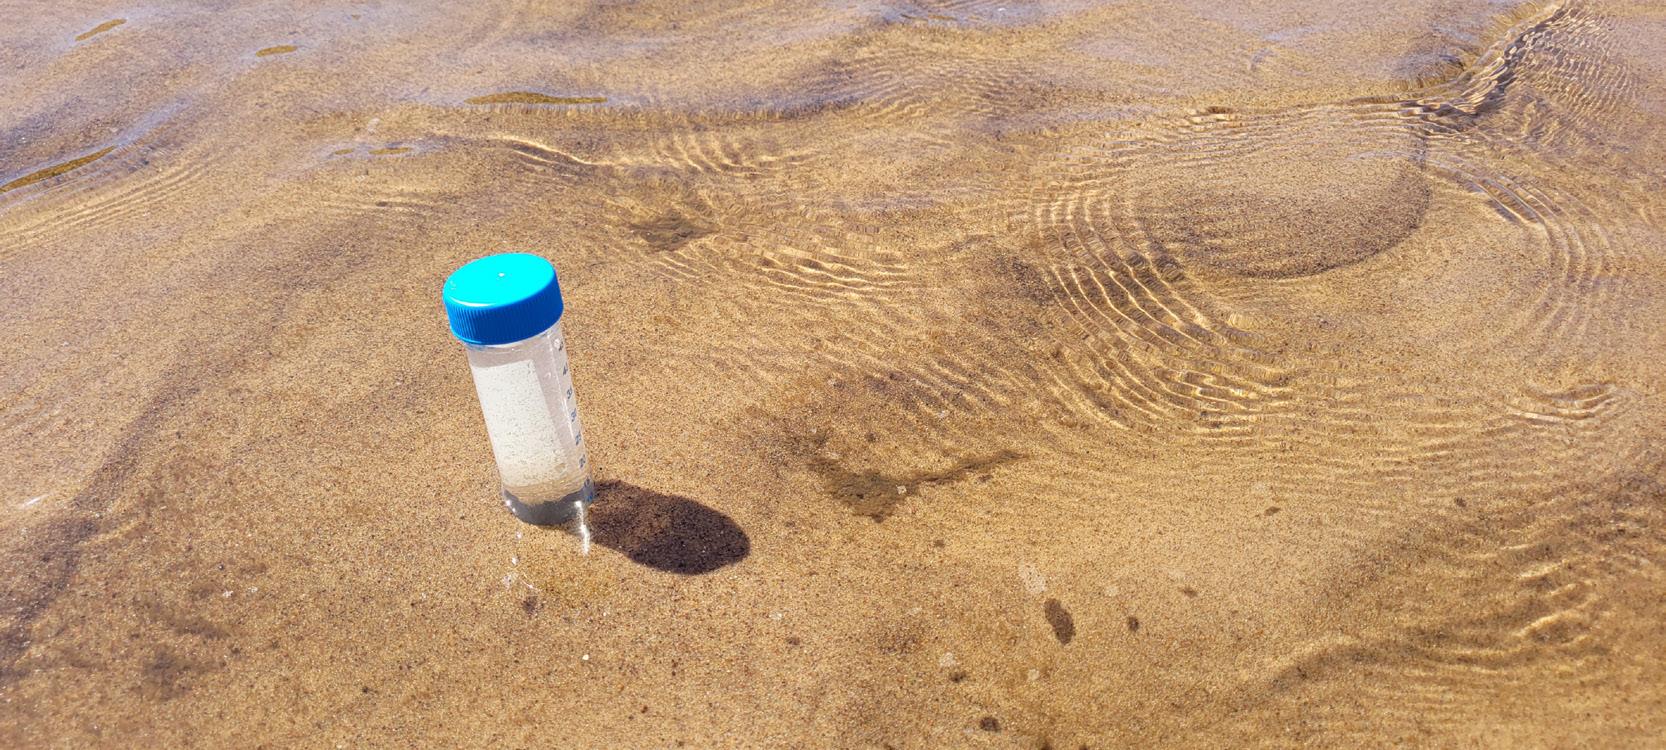
Riverbed sediment and organic matter collected in sample tubes at the Wisconsin River.
Manasi Simhan
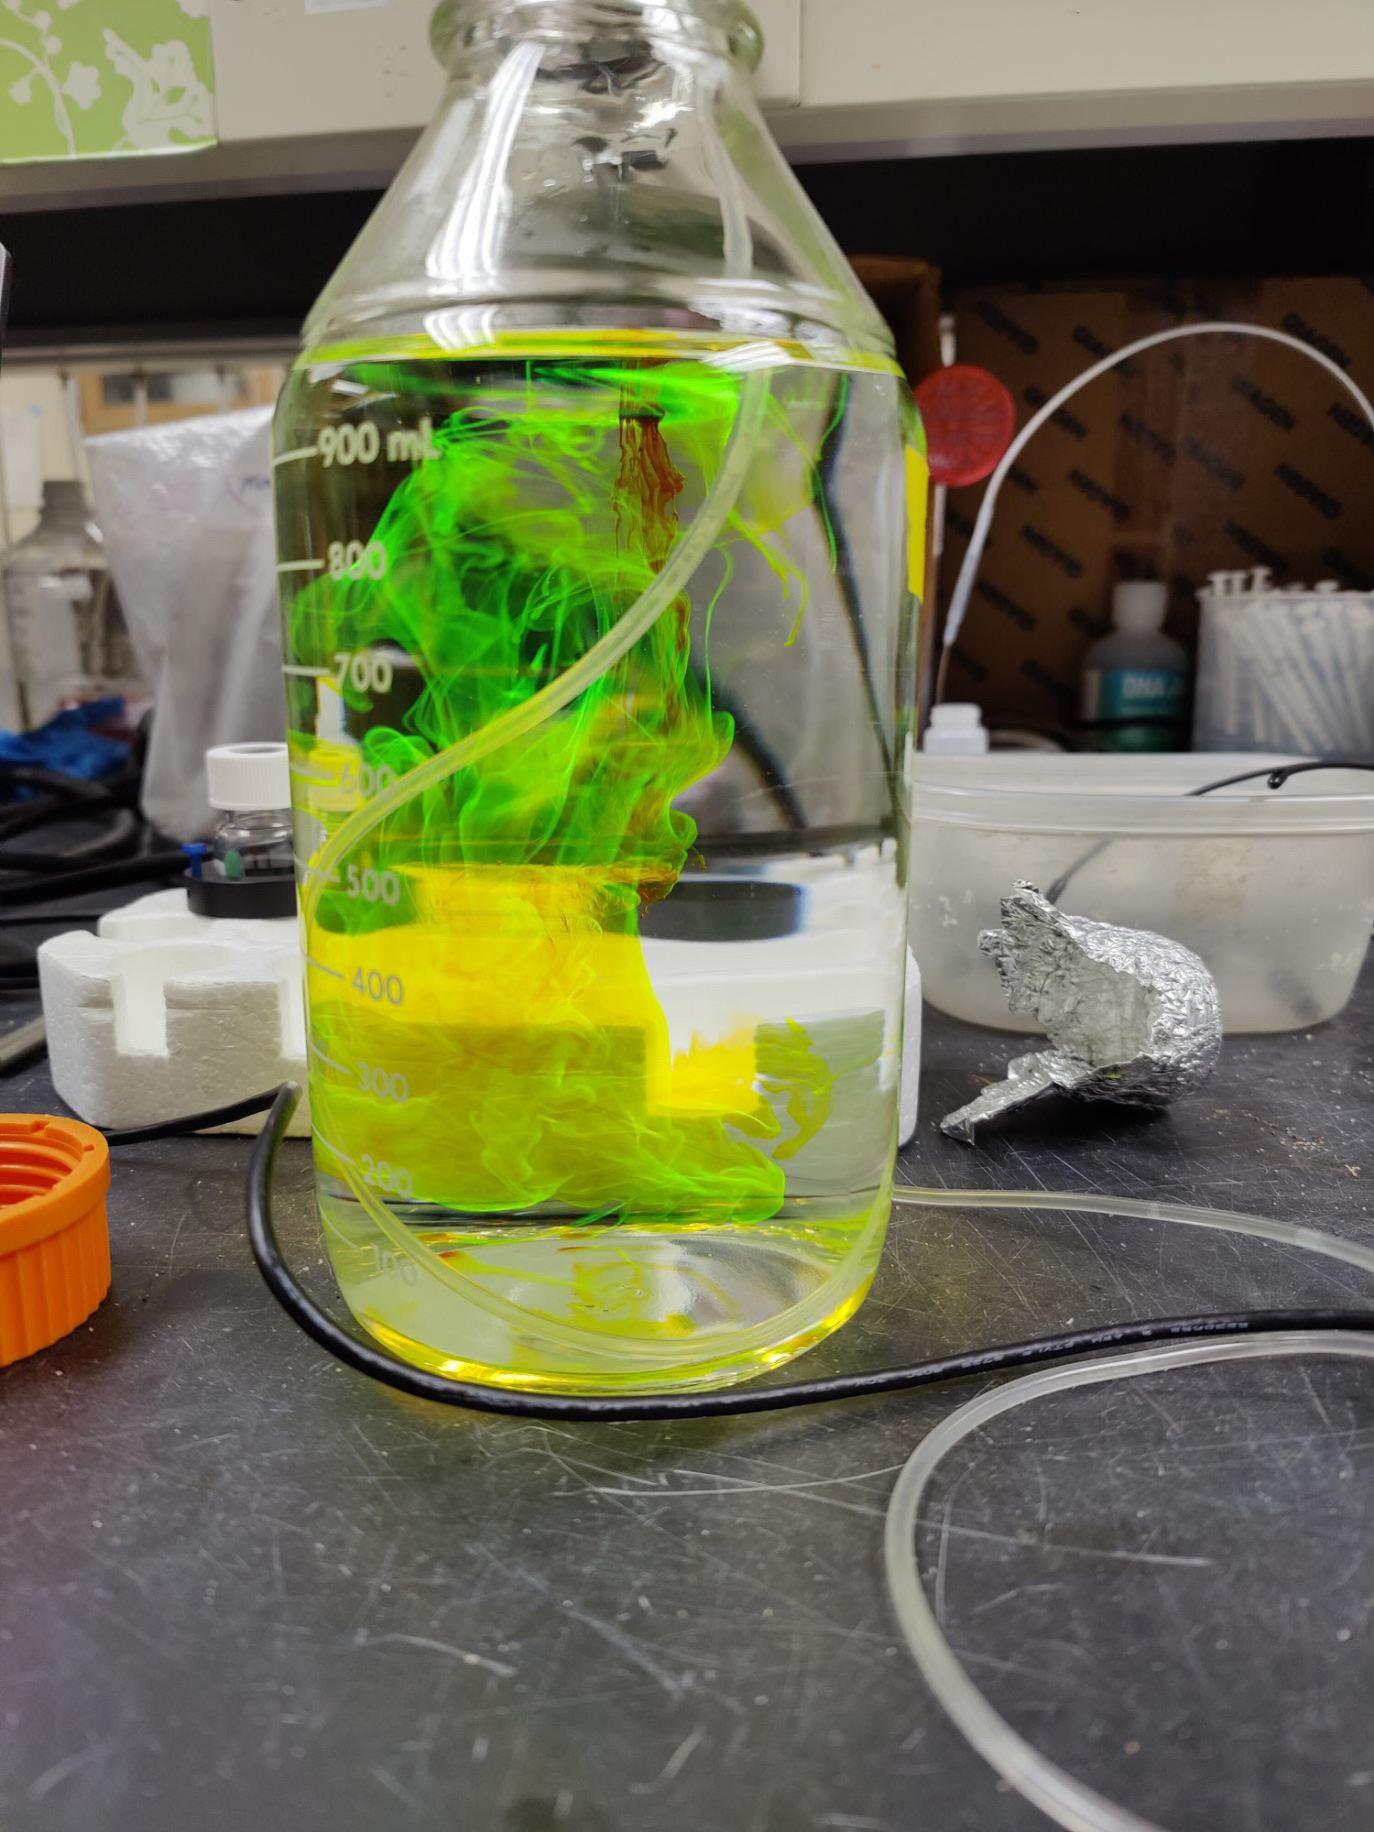
Fluorescein, an environmental contrast agent used to track the movement of water through riverbed sediment.
This paper presents a speech query to video response model with emotions and creativity. This model is used to generate human like speech in a chat bot. The bot can be used as a part of customer relationship management. The unique architecture generates 3D holographic video responses of the query asked by a user through voice. The approach is composed of traditional machine-learning methods as well as fully trainable neural modules in different sections. More precisely, six main modules are used: a speech to text[16] network, rule-based chat bot model[15], a text-to-speech network[22] that is emotional based on the PALASH framework[1], a time-delayed LSTM to generate mouth-key points synced to the audio[14], a network based on Pix2Pix GAN to generate the video frames conditioned on the key points[10] and a hologram-based model to produce 3D video[13].
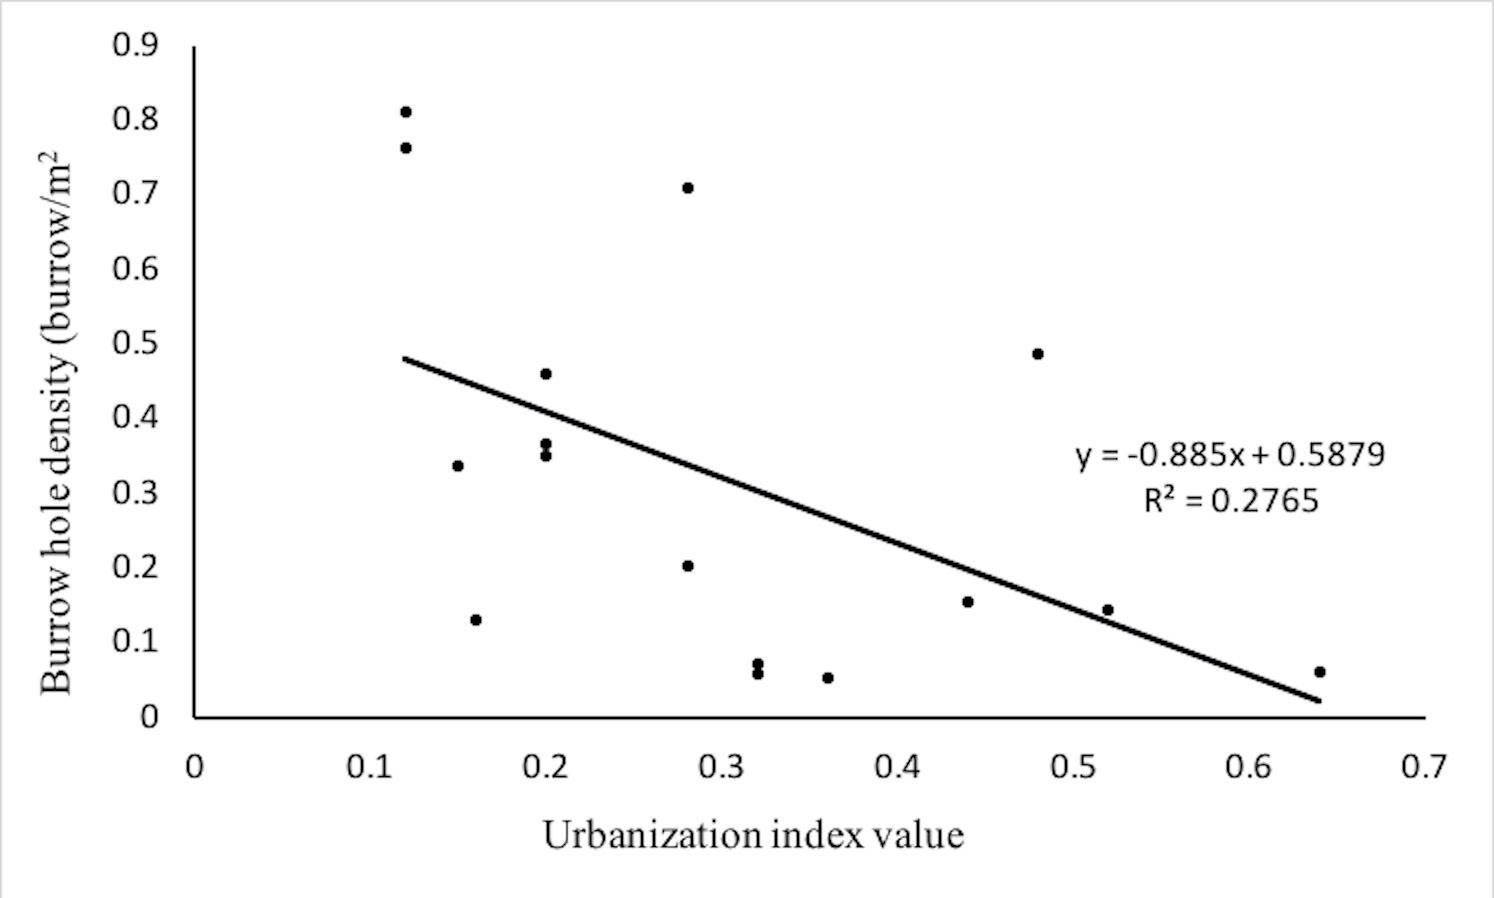
Latin American countries are undergoing rapid urbanization and increasing development of “sun and sand” tourism, making them some of the most threatened coastal regions in the world (Chatwin and Rybock, 2007; Mestanza-Ramón et al., 2020). We examined the ability of the painted ghost crab (Ocypode gaudichaudii) to serve as a bioindicator of urbanization using burrow hole densities as a proxy for ghost crab abundance at eight sandy beaches of varying human impact along the coast of Manabí, Ecuador. We categorized the impact level of our study sites integrating five variables: (1) vehicle tire tracks, (2) animal/human prints, (3) litter, (4) infrastructure, and (5) visitors per minute in an urbanization index adapted from Gonzalez et al., (2014). This urbanization index was negatively correlated with burrow hole density (R2= 0.276492802, n=16, p=0.03644), showing that O. gaudichaudii can be used as a simple, cost-effective bioindicator of sandy beach health along the Pacific coast of South America. We identify natural debris, anthropogenic litter, and human/ animal prints as key variables of human impact. Our urbanization index provides a quantitative method to categorize sandy beaches based on the degree of human impact. The broad applicability of this index may facilitate research on the effects of anthropogenic activity on sandy beach ecosystems.
Latin American countries are undergoing rapid urbanization and increasing development of “sun and sand” tourism, making them some of the most threatened coastal regions in the world (Chatwin and Rybock, 2007; Mestanza-Ramón et al., 2020). We examined the ability of the painted ghost crab (Ocypode gaudichaudii) to serve as a bioindicator of urbanization using burrow hole densities as a proxy for ghost crab abundance at eight sandy beaches of varying human impact along the coast of Manabí, Ecuador. We categorized the impact level of our study sites integrating five variables: (1) vehicle tire tracks, (2) animal/human prints, (3) litter, (4) infrastructure, and (5) visitors per minute in an urbanization index adapted from Gonzalez et al., (2014). This urbanization index was negatively correlated with burrow hole density (R2= 0.276492802, n=16, p=0.03644), showing that O. gaudichaudii can be used as a simple, cost-effective bioindicator of sandy beach health along the Pacific coast of South America. We identify natural debris, anthropogenic litter, and human/ animal prints as key variables of human impact. Our urbanization index provides a quantitative method to categorize sandy beaches based on the degree of human impact. The broad applicability of this index may facilitate research on the effects of anthropogenic activity on sandy beach ecosystems.
This paper presents a speech query to video response model with emotions and creativity. This model is used to generate human like speech in a chat bot. The bot can be used as a part of customer relationship management. The unique architecture generates 3D holographic video responses of the query asked by a user through voice. The approach is composed of traditional machine-learning methods as well as fully trainable neural modules in different sections. More precisely, six main modules are used: a speech to text[16] network, rule-based chat bot model[15], a text-to-speech network[22] that is emotional based on the PALASH framework[1], a time-delayed LSTM to generate mouth-key points synced to the audio[14], a network based on Pix2Pix GAN to generate the video frames conditioned on the key points[10] and a hologram-based model to produce 3D video[13].
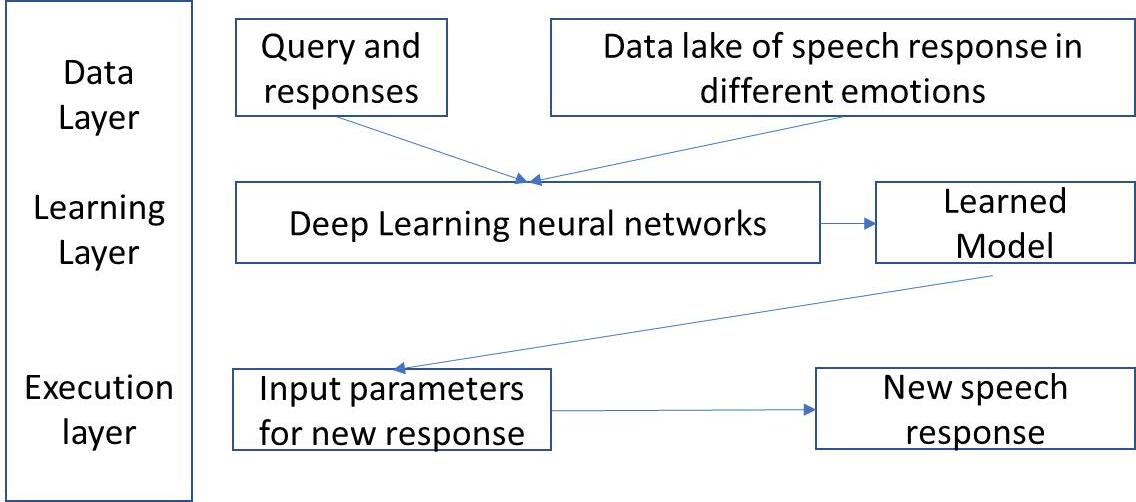
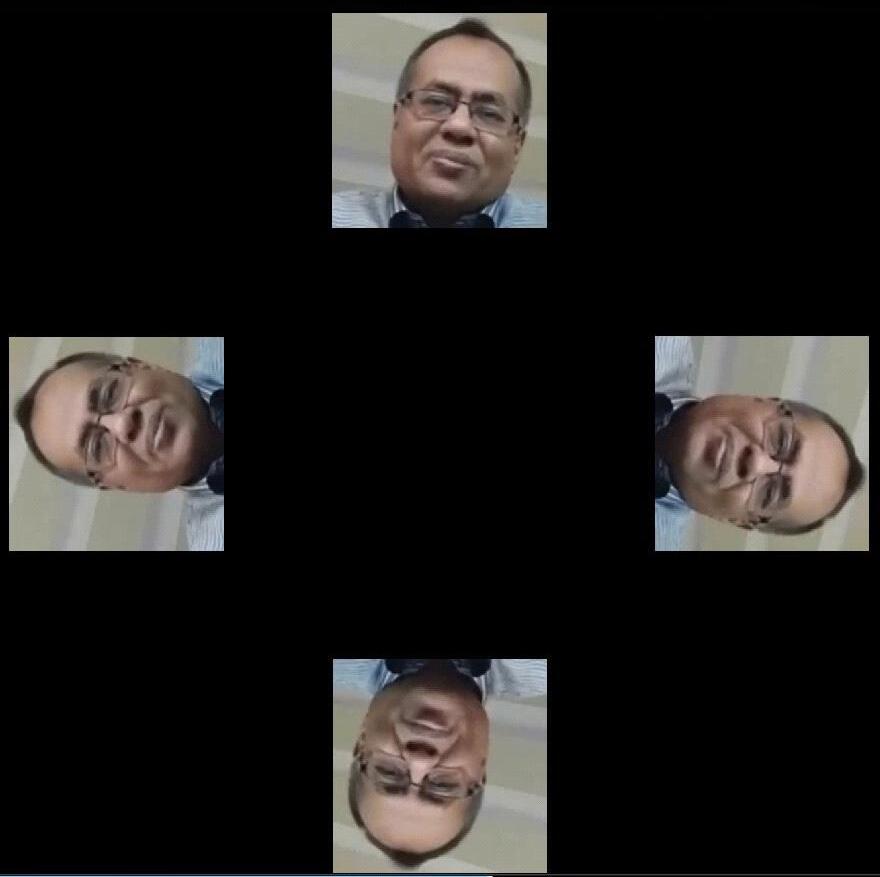
A conscious and emotional 3D chat bot is the need of the hour to make interactions with customers more human-like. By utilizing data-driven approaches for speech recognition [3], chat bot development and AI generated images have recently surpassed traditional ways of computing writing and speech. This work shows how one can combine some of the independent AI structures to generate artificial 3D holographic videos of a person reading aloud the response to a query asked by the user. The video generation model can be trained on any set of closely shot videos of an actual person speaking. The result is a system that displays speech from the text generated by the bot. The bot is then trained on a data lake (all of the data) based on a framework that makes the bot conscious and emotional. This training allows a Long Short-Term Memory (LSTM) model to modify the mouth area of one of the videos so that it looks natural and realistic. Although this paper showcases the method on a male whose videos were available as per requirement, the approach can be used to generate videos of anyone.
Recently, there have been important advances in the generation of photo-realistic videos [24][5]. A merged speech synthesis model[19][22] is used with a rule-based chat bot[15], a 3D holographic video generation model and a gradient boosting model for chat bot section and neural network for
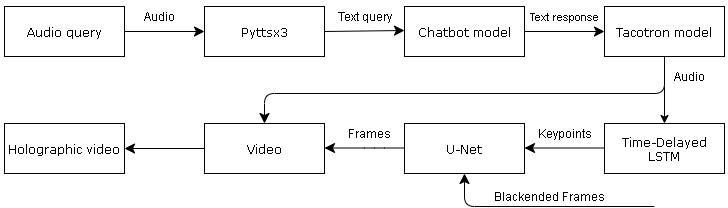
video generation. The gradient boosting model is suitable for fast processing of the large number of datasets required for emotion analysis and image regeneration. All the models are engineered into a logical flow. Figure 1 shows the schematic flow and engineering of all the components from an audio query input to a 3D holographic video bot response.
To convert speech to text, Google Audio Recognizer extracts features required by the hologram model. While for text-tospeech, the open-source converter pyttsx3, converts this text back into speech. Further, a Convolutional Neural Network (CNN) does the in-between clustering and training to generate the emotional audio [12]. This CNN is trained on data and inputs as per the PALASH framework [1], as shown in Figure 2.
A rule-based text chat bot [15] will be utilized for part of the model. This bot uses a tree flow structure, called the Decision Tree Model, where the bot asks for follow-up questions influenced by previous questions to arrive at the correct resolution. By using the text generated by speech-to-text as input in a Gradient Boosting Classification Model (Figure 4), which combines separate features to create a stronger predictive model, all features and parameters of the text are assigned weights after its evaluation with features playing a more significant role being assigned a higher weight. This flow continues until the final tree predicts the output. Because of this learning feature and tree flow, this model stands out from the other machine learning algorithms that inject emotion in speech and is hence used in the Holographic Model for higher accuracy and better utility.
For each category there are several predefined output responses which will be used to get more information from the user to send to the chatbot.
Now that the text response generated from the chat bot is ready, it is converted to audio using the text-to-speech [4] system. For the visual representation, mouth shapes are calculated using
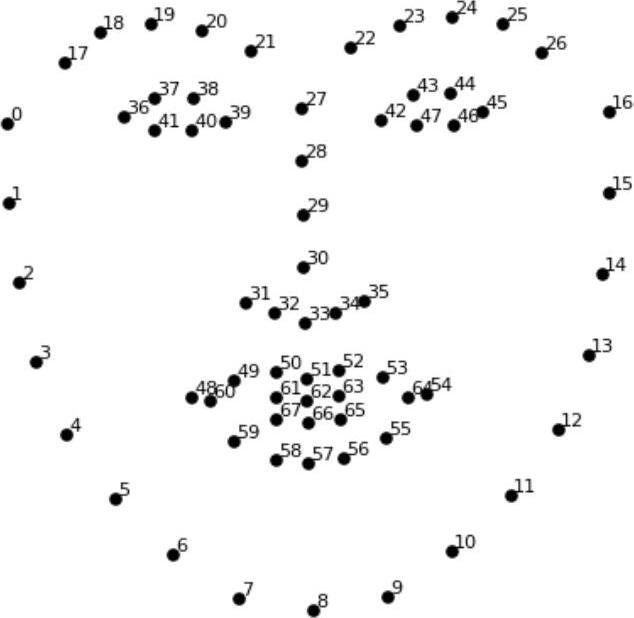
the normalized mouth key points [6] extracted from the face, face location, face rotation and face size. Dlib 68 points (Figure 4) Face Landmark Detection [18][8][20] is used to outline the mouth section of the face (points 48-68).[14]
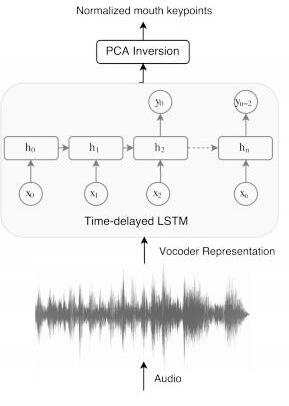
Principal Component Analysis (PCA), a technique to increase interpretability of data, is applied over the normalized key points to de-correlate the features and reduce the dimension, making the data more readable while minimizing information loss. This is required for a better facial reconstruction. For this model, only the most important principal components for mouth shape representation are considered and kept.
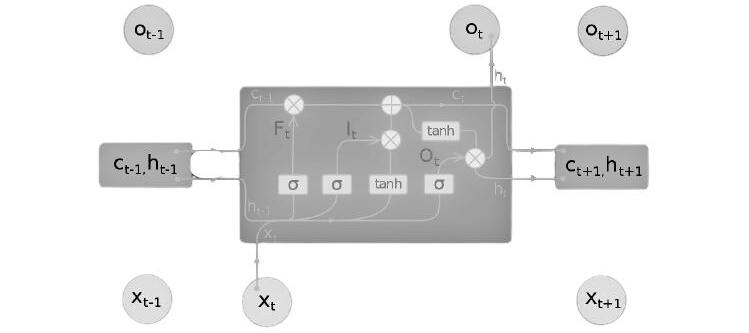
Long Short Term Memory model (LSTM) (Figure 5) [17] is one of the prominent neural network models which is mostly used in long term dependencies like image processing [11][23]. LSTM can process an entire sequence of data with feedback connections instead of single data points. Here, the LSTM network predicts the mouth shape [2] of each instance with the audio features as input (Figure 6). Audio input is analyzed and based on self-supervised learning reconstruction of generated mouth movement. LSTM retains this information and generates the next image accordingly to make the video fluid.
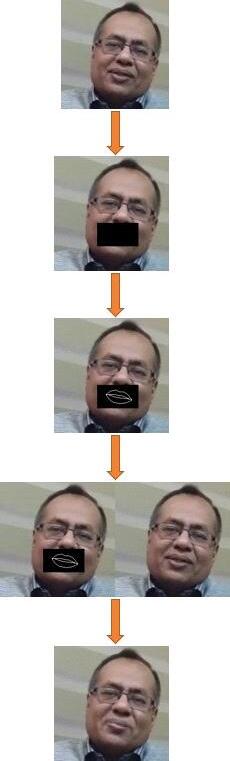
For video generation, pix2pix [10] a prominent model, was used as a solution for image-to-image translation problems. Figure 6 defines the key point generation which will now be used to produce audio-synced patch images [7][9]. Using another convolution neural network called U-Net, a biomedical image segmentation draws the lips over the cropped mouth (Figure 7). U-Net only uses empty pixel space (the cropped mouth), which is sufficient to learn the in-painting of the mouth and does not require the extra GAN objective: painting the mouth from scratch, as originally proposed in pix2pix [10]. Each frame is processed and merged in parallel to form the video [21]. This video is combined with the audio [2] to get the output. The videos were converted to images using FFmpeg software and vice versa [14] and further processed to generate the final 3D holographic video.
The fully functional 3D chat bot was deployed for a customer of Gazelle Information Technologies. The technical and product-related queries asked by prospective customers were efficiently handled by this 3D chat bot (Figure 8). The result was increased interaction with the prospects who converted into customers for the futuristic product. This is an improvement over the existing 3D animated models, as these have been deployed in the real world.
Goyal et al. creativity in machines: Music composition using artificial intelligence. 1.
Generation by adversarially disentangled audio-visual representation. arXiv preprint arXiv:1807.07860, 2018. 2, 3.
Triantafyllos Afouras, Joon Son Chung, and Andrew Zisserman. Lrs3-ted: a large-scale dataset for visual speech recognition. arXiv preprint arXiv:1809.00496, 2018. 1.
Sakshi Bhargava, Sravya Tummala, Shravani S, Shivam Koul, and Nilima Kulkarni. PDF to AudioBook Converter. 1, 2.
Joon Son Chung, Amir Jamaludin, and Andrew Zisserman. You said that? arXiv preprint arXiv:1705.02966 (2017), 2017. 1.
Joon Son Chung and Andrew Zisserman. Lip reading in the wild. in asian conference on computer vision. Springer, pages 87–103. 2.
Joon Son Chung and Andrew Zisserman. Out of time: automated lip sync in the wild. in workshop on multi-view lip- reading, accv. 2016. 3.
Brian Dolhansky, Joanna Bitton, Ben Pflaum, Jikuo Lu, Russ Howes, Menglin Wang, and Cristian Canton Ferrer. The deepfake detection challenge dataset. arXiv:2006.07397 [cs.CV], 2020. 2.
Ohad Fried, Ayush Tewari, Michael Zollho¨fer, Adam Finkelstein, Eli Shechtman, Dan B Goldman, Kyle Genova, Zeyu Jin, Christian Theobalt, and Maneesh Agrawala. Text-based editing of talking-head video. ACM Transactions on Graphics (TOG) 38, 4 (2019), pages 1–14. 3.
Phillip Isola, Jun-Yan Zhu, Tinghui Zhou, and Alexei A Efros. Image-to-image translation with conditional adver- sarial networks. arXiv preprint arXiv:1611.07004, 2016. 1, 3.
Byeong-Ho KANG. A Review on Image and Video processing. 2.
Tero Karras, Timo Aila, Samuli Laine, Antti Herva, and Jaakko Lehtinen. Audio-driven facial animation by joint endto-end learning of pose and emotion. ACM Trans. Graph., 36(4):94:1– 94:12. July 2016. 1.
Prajwal KR, Rudrabha Mukhopadhyay, Jerin Philip, Abhishek Jha, Vinay Namboodiri, and CV Jawahar. To- wards automatic face-to-face translation. in proceedings of the 27th acm international conference on multimedia. acm, 1428–1436. 2019. 1.
Rithesh Kumar, Jose Sotelo, Kundan Kumar, Alexandre de Bre´bisson, and Yoshua Bengio. Obamanet: Photo-realistic lipsync from text. arXiv preprint arXiv:1801.01442, 2017. 1, 2, 3.
Maali Mnasri. Recent advances in conversational NLP : Towards the standardization of Chat bot building. 1, 2.
Shivangi Nagdewani and Ashika Jain. A Review on methods for speech to text and text to speech conversion. 1.
Alex Sherstinsky. Fundamentals of Recurrent Neural Net- work (RNN) and Long Short-Term Memory (LSTM) Network. 2.
Shenghao Shi. Facial Keypoints Detection. 2.
Jose Sotelo, Soroush Mehri, Kundan Kumar, Joao Felipe Santos, Kyle Kastner, Aaron Courville, and Yoshua Bengio. Char2wav: End-to-end speech synthesis. 2017. 1.
Ruben Tolosana, Ruben Vera-Rodriguez, Julian Fierrez, Aythami Morales, and Javier Ortega-Garcia. Deepfakes and beyond: A survey of face manipulation and fake detection. arXiv:2001.00179 [cs.CV], 2020. 2.
Konstantinos Vougioukas, Stavros Petridis, and Maja Pantic. Realistic speech-driven facial animation with gans. International Journal of Computer Vision (2019), pages 1–16, 2019. 3.
Yuxuan Wang, RJ Skerry-Ryan, Daisy Stanton, Yonghui Wu, Ron J. Weiss†, Navdeep Jaitly, Zongheng Yang, Ying Xiao, Zhifeng Chen, Samy Bengio, Quoc Le, Yannis Agiomyrgiannakis, Rob Clark, and Rif A. Saurous. Tacotron: To- wards end-to-end speech synthesis. 1.
Zhou Wang, Alan C Bovik, Hamid R Sheikh, and Eero P Simoncelli. Image quality assessment: from error visibility to structural similarity. IEEE transactions on image processing 13, 4 (2004), pages 600–612. 2.
Hang Zhou, Yu Liu, Ziwei Liu Ping Luo, and Xiaogang Wang. Talking face. 2018. 1.

Latin American countries are undergoing rapid urbanization and increasing development of “sun and sand” tourism, making them some of the most threatened coastal regions in the world (Chatwin and Rybock, 2007; Mestanza-Ramón et al., 2020). We examined the ability of the painted ghost crab (Ocypode gaudichaudii) to serve as a bioindicator of urbanization using burrow hole densities as a proxy for ghost crab abundance at eight sandy beaches of varying human impact along the coast of Manabí, Ecuador. We categorized the impact level of our study sites integrating five variables: (1) vehicle tire tracks, (2) animal/human prints, (3) litter, (4) infrastructure, and (5) visitors per minute in an urbanization index adapted from Gonzalez et al., (2014). This urbanization index was negatively correlated with burrow hole density (R2= 0.276492802, n=16, p=0.03644), showing that O. gaudichaudii can be used as a simple, cost-effective bioindicator of sandy beach health along the Pacific coast of South America. We identify natural debris, anthropogenic litter, and human/animal prints as key variables of human impact. Our urbanization index provides a quantitative method to categorize sandy beaches based on the degree of human impact. The broad applicability of this index may facilitate research on the effects of anthropogenic activity on sandy beach ecosystems.
The expansion of human populations has caused coastal ecosystems world-wide to be profoundly altered by urbanization (Bulleri and Chapman, 2010; McDonald et al., 2008; McKinney, 2002). In 2019, tourism constituted 10.3% of the total global GDP, with marine and coastal tourism the lead contributor among the industry (UNWTO, 2020). The socioeconomic value of tropical sandy beaches as popular tourism destinations inherently subjects these ecosystems to increasing human disturbance and impact, making them some of the most vulnerable marine ecosystems (Halpern et al., 2007; Ruttenberg and Granek, 2011). Such strong human impacts have resulted in a profound decline in species abundance and biodiversity throughout these ecologically rich ecosystems worldwide (Martínez et al., 2020; Costa et al., 2017; Schooler et al., 2019; Halpern et al., 2018). In
recent years, Latin American countries have become subject to rapid urbanization and increasing development of “sun and sand” tourism, making the coastal ecosystems of Brazil, Peru, and Ecuador some of the most threatened coastal regions in the world (Chatwin and Rybock, 2007; MestanzaRamón et al., 2020).
Our study examines the effects of urbanization on sandy beaches within the province of Manabí, Ecuador, where the provincial government has based a large portion of their recent economic development goals on the expansion of the tourism industry (Ministerio de Turismo del Ecuador, 2004). While sustainable tourism is listed as a project initiated by the ministry of tourism of Ecuador, development plans lack clearly defined conservation goals. Thus, the goal of the present study is to provide defensible and biologically relevant information regarding the effects of urbanization on Manabí’s coastal ecosystems to guide future management decisions.
We seek to provide guidance for coastal management using the ghost crab (Crustacea: Ocypodidae), one of the most widely studied invertebrate bioindicators used worldwide to detect and monitor human disturbance on sandy shores (Schlacher et al., 2016). The fossorial nature of ghost crabs allows burrow hole surveys that visually count the number of ghost crab burrow holes within a given area of beach to serve as accurate proxies for direct measures of ghost crab abundance and density (Costa and Zalmon, 2019). Resulting metrics such as ghost crab burrow abundance consistently demonstrate a negative response to increased urbanization (Schlacher et al., 2016; Barros, 2001; Gül and Griffen, 2020; Barboza et al., 2021), making burrow hole surveys a simple, and low-cost technique used in urbanization impact assessments of sandy beaches (Pombo and Turra, 2013). Urbanization is often defined through related single factors that correspond to burrow abundance such as the amount of anthropogenic litter (Widmer and Hennemann, 2010; Suciu et al., 2018) vehicle/tire tracks (Costa et al., 2020), human/ animal trampling (Lucrezi et al., 2009; Schlacher et al., 2011), proximity to urban centers and the total number of beach visitors (González et al., 2014). In the present study,
we include anthropogenic litter, vehicle/tire tracks, and human/animal trampling as parameters of urbanization. Furthermore, we opt to measure the presence of infrastructure as opposed to proximity to urban centers and define the total number of beach visitors as beach visitors per minute when characterizing urbanization.
The vast majority of studies thus far have centered around the Atlantic ghost crab, Ocypode quadrata; however, due to physical and behavioral similarities between ghost crab species as well as the strength of response these crabs show to human disturbances, we predict the efficacy of ghost crabs as bioindicators to be ubiquitous across species of the genus (Schlacher et al., 2016). In this study, we examine the ability of the painted ghost crab (Ocypode gaudichaudii), a species native to the western coasts of Latin America and distributed from El Salvador to Chile, to serve as an effective bioindicator of urbanization. Assuming O. guadichaudii is an effective indicator, we test the hypothesis that beaches with higher urbanization, signaling greater human impact, correspond to lower densities of ghost crab burrows.
Study location
We investigated the effect of urbanization on O. gaudichaudii at eight sandy beaches of varying human impact levels along the coast of the Manabí province of Ecuador from 06/14/2021 to 07/14/2021. These beaches included Tasaste, Don Juan, Punta Prieta/Blanca, Cabuya, Pedernales, Canoa, Jaramijó, and Manta (Fig. 1). To ensure we collected data from beaches spanning a wide spectrum of urbanization, we evaluated the amount of development on each beach a priori, based on the presence of built infrastructure, proximity to populated areas, and popularity before beginning data collection. Manta, Pedernales, Canoa, and Jaramijó thus were considered high impact beaches while Punta Prieta/Blanca, Cabuya, Don Juan, and Tasaste were categorized as low impact beaches.
Within a single beach, we selected low and high impact areas separated by a minimum of 300m based on initial observation of human activity and nearby infrastructure. We implemented this design to include each beach’s full range of human impact and allow for a maximum variation of human impact factors in our urbanization index.
In order to quantify ghost crab burrow density and urbanization, we employed a transect-quadrat design (Barros, 2001). We selected the starting point of the first transect by walking directly up the beach (perpendicular from the water) until we reached a physical, continuous barrier (e.g. sea wall, natural sand dune, river, building etc.). If the physical barrier was continuous vegetation or rock cover, we then began the transect at the point where 75% of the first quadrat was covered by the barrier. If the barrier was uniform, such as a
sea wall, we started that transect at the base of the wall. If the first transect border consisted of boats, we first verified that we would not be interfering with the local fishermen (i.e. getting in the way of taking out/putting in boats) and moved the transect accordingly. If the upper limit consisted of tourists, we began at the end of the recreational zone.
To quantify the density of crab burrow holes, we sampled both the high and low impact areas of each beach using a transectquadrat design exemplified in Figure 2. Similar to Lucrezi et al., 2009, a single 5m wide belt transect was split into 3 x 5-meter quadrats that extended continuously down the beach perpendicular to the shoreline with the 5m edge oriented parallel and the 3m side perpendicular to the shoreline. GPS coordinates were recorded using a handheld Garmin GPS at the start of the first transect within each impact level.
In each 15m2 quadrat, we counted the number of active burrow holes, identified by traces of characteristic ghost crab activity around the hole such as tracks and excavated sand, to avoid overestimating the number of burrow holes (Schlacher et al., 2016; Pombo and Turra, 2013). We ended a single transect when no crab burrows were found in both the last quadrat and the remaining distance to the water’s edge. We repeated this procedure beginning five meters south of the previous transect for a total of six transects at each impact level on all eight beaches or 12 transects total on each beach. These same transects were used for all subsequent data collection.
All beaches were sampled at low tide and all transect data from a single beach was collected within the span of three days to minimize major beach geological changes. Sampling at low tide ensured the maximum number of burrows would be present and the beach was as wide as possible for sampling.
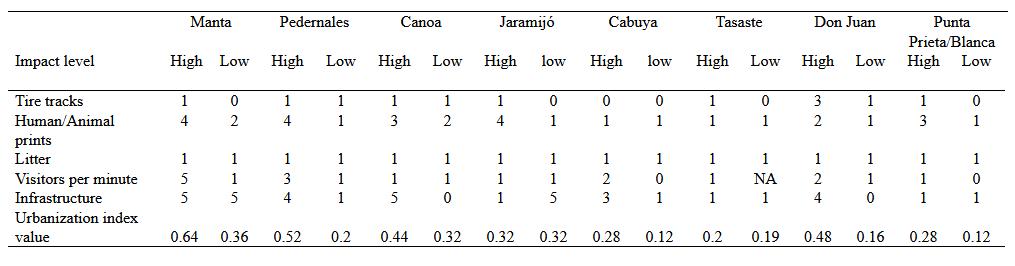
The level of urbanization was determined by six separate variables of human impact including (1) vehicle tire tracks, (2) human/animal prints, (3) litter, (4) infrastructure, (5) visitors, and (6) natural debris (González et al., 2014). Variables 1, 2, 3, and 6 were based on direct observations taken on site between the hours of 9:22 and 16:14 depending on the time low tide occurred the date the beach was sampled. Two observers independently estimated the percent coverage of tire tracks, human/animal prints, litter, and natural debris within each quadrat and the average of the two estimates was used in further analyses.
Frequency of visitors was estimated using a BlazeVideo 4G LTE Cellular trail camera deployed upon arrival at each beach. The camera was set in Time-Lapse mode recording a five-minute video every 30 mins for the duration of sampling (Sunger et al., 2012). Footage taken ranged from five to 25 minutes and was later viewed to calculate the average
number of visitors per minute at each beach. Because all sampling took place during low tide, the time of day varied between each site; however, all footage was shot within the hours of 9:00 and 17:00.
We quantified the surface area at each beach occupied by infrastructure using QGIS software. The GPS start and end coordinates bounded the 55m total length of the five transects parallel to the shore in each impact zone on each beach. These coordinates were superimposed on high resolution georeferenced satellite imagery (Google Earth). Using these coordinates, we created a 165m x 165m plot by extending the sampling area 55m beyond both the start and end points parallel to shore, as well as 165m inland perpendicular to shore. Using the area measuring tool, we calculated the total area of buildings and impervious surfaces within the square (m2). Dividing this coverage by the total plot area (m2) yielded the percent coverage of buildings and impervious surfaces within each plot. This percentage represented the infrastructure factor in our urbanization index.
We categorized the impact level at each of our study sites by integrating five variables: The % cover of (1) vehicle tire tracks, (2) animal/human prints, (3) litter, and (4) infrastructure, and (5) the number of visitors per minute, into an urbanization index adapted from González et al. (2014). In order to assign each variable an urbanization score, we put the compiled quadrat data of all beaches and impact zones into six bins. Bin values were determined by dividing the compiled data for a single variable into five bins of equal range except for the first bin, 0, which represented the complete absence of the variable. Each subsequent bin was assigned a number 1-5 in ascending order with 1 representing the lowest values greater than zero and 5 the highest values observed for that variable. These bins and rating scale were then used to assign each urbanization predictor a score based on the average of all quadrats for that beach and impact zone. The maximum and minimum of each impact variable can be seen in Table 1. The final urbanization index score of each beach was calculated using the method of Gover (Legendre and Legendre, 1998): X = ∑((X–Xmin)/(Xmax–Xmin)), where x is the score of each category and Xmin-Xmax are the extreme values of the range (0-5) yielding a standardized score between 0 and 1.
Paired T-tests
Before creating our urbanization index, we conducted paired t-tests between the high and low impact transects across all beaches. Human/animal prints (p-value: 0.0091), tire tracks (p-value: 0.0159), and visitors per minute (p-value: 0.0348) were shown to be statistically different (p-value < 0.05) between beaches identified a priori as having low or high
human impact. To avoid oversimplifying a single beach, we chose to keep the high and low impact regions of each beach separate in the following analyses.
Burrow density was positively correlated with natural debris (R2=0.358695523, n=16, p = 0.0142) and litter (R2=0.223112103, n=16, p = 0.0361; Table 2). Human/animal prints, infrastructure, and tire tracks showed weakly negative, but non-significant correlations to burrow hole density.
Of our multiple linear regression models, the only significant impact variable was natural debris in the model containing natural debris and human/animal prints (Table 2). This model had the single greatest explanatory power with an R2 value of 0.4394. While not significant, the subsequent models including human/animal prints and litter (R2=0.4326), and natural debris and litter showed similar strength in explanatory power (R2=0.4222). Infrastructure and tire tracks were not present in any of these top three models, but rather in models containing R2 values less than 0.395. The impact variable most frequently included in our models with the most explanatory power was natural debris, present in four of the top six models. Litter was the next most frequent variable included in three of these models, followed by human/animal prints present in two of these models.
The values estimated from our urbanization index values ranged from 0.12 to 0.64 (Table 3). All beaches demonstrated greater or equal urbanization index values for the high impact section of the beach than the low impact section. The beaches with the highest impact level included Manta, Pedernales, Don Juan, Canoa, and Jaramijó. The beaches with the lowest impact levels included Cabuya, Punta Prieta/ Blanca, and Tasaste. We were unable to obtain data on visitors per minute from the low impact region of Tasaste due to equipment failure.
Burrow hole density was negatively correlated with the urbanization index (R2= 0.276492802, n=16, p=0.03644; Fig. 3), demonstrating that ghost crab burrows are an indicator of urbanization as we hypothesized.
This is the first study to demonstrate the efficacy of the painted ghost crab (O. gaudichaudii) as a bioindicator for sandy beach health along the Pacific coast of South America. Our data shows a significant inverse relationship between human urbanization and ghost crab burrow hole density, supporting our hypothesis that painted ghost crab populations are negatively impacted by human disturbances (Fig. 3). Our results are consistent with previous studies that demonstrate
multiple ghost crab species as effective bioindicators of beach health (Barros, 2001; Blankensteyn, 2006) and further supports the idea that this quality is ubiquitous across Ocypode species around the world (Schlacher et al., 2016). However, it should be noted that there remains uncertainty on the efficacy of burrow counts in accurately representing ghost crab densities, especially as unoccupied burrows can endure longer on beaches with less human activity (Costa et al., 2021). Thus, we suggest future studies and management that use burrow hole density as a proxy for ghost crab populations to consider including species and site-specific conversion factors to avoid biased extrapolation at larger scales (Costa et al., 2021).
Of the simple linear regressions using single impact variables, only natural debris and litter were significantly correlated with burrow hole density (Table 2). The top three multiple linear regression models had similar explanatory power and contained different combinations of the same three impact variables: human/animal prints, natural debris, and litter. These results highlight the importance of including these impact variables in assessments of human impact on sandy beaches. Although our data on tire tracks and infrastructure appear to have less explanatory power in our models, this could be due to sampling biases associated with our small sample size. For these reasons, we discuss only the impact variables, human/animal prints, natural debris, and litter, in the context of our linear regression results.
Among the human impact variables studied, natural debris (vegetation and beach wrack) was the most significant predictor of beach health and was positively related to burrow hole density, describing 35.9% of burrow hole density variation (Table 2). Natural debris was also the impact variable most frequently included in our multiple linear regression models. The heightened prevalence of natural debris to burrow hole density is consistent with the idea that natural debris serves as a marine subsidy initiating primary production and providing allochthonous sources of organic material and nutrients vital to ecological processes that can dramatically alter the abundances of key species (Dugan et al., 2003; Dugan and Hubbard, 2010). This positive relationship is unsurprising as ghost crabs, along with many other invertebrates, are known to use vegetation as a temporary refuge from predators and the sun (Schlacher et al., 2011), as well as consume beach wrack as vital dietary components (Gül and Griffen, 2020; McDermott, 2013; Morrow et al., 2014). Considering these differences, it may be helpful to segregate “natural debris” into two distinct categories: natural vegetation and beach wrack. While the overall relationship of natural debris was positively related to burrow density, one of these variables may have had a stronger relationship with ghost crab burrow abundance, potentially obscuring differences between these two variables. Thus, for conservation and management purposes, we recommend further studies to quantify the individual effect each variable has on ghost crab abundance.
This separation will help to illuminate negative impacts on sandy beach ecosystems related to wrack removal and beach cleaning. While we were unable to directly characterize beach cleaning among beaches in this study, our results concur with studies that indicate negative impacts of beach wrack removal (chiefly performed for aesthetics in tourist areas) on the health of sandy beach ecosystems (Robbe et al., 2021). As wrack removal often involves large machinery (Schooler et al., 2019), beaches may be additionally degraded due to additive effects of vehicle traffic. While non-significant, our finding of an inverse relationship between tire track presence and burrow hole density (Table 2) aligns with previous literature documenting the direct mortality of ghost crabs from vehicle traffic (Costa et al., 2020; Schlacher et al., 2014) among other indirect effects that negatively impact the health of sandy beach ecosystems [Petch et al., 2018; Knisley and David, 2018; Schlacher et al., 2008). We advise future research on the effects of beach cleaning to inform local conservationoriented management.
The human/animal print variable included in our study was used to evaluate the broadly categorized action of “trampling”, shown to be a near-ubiquitous disturbance agent across sandy shore ecosystems (Schlacher et al., 2016). Our analyses resulted in a non-significant inverse relationship between human/animal prints and burrow hole density, explaining 23.7% of the variation in burrow density. Moreover, the variable human/animal prints was present in the top two of the six most explanatory models from our multiple linear regression analysis. Our results are thus consistent with previous research identifying negative impacts on ghost crab populations following acute events of intense trampling at small scales or sustained trampling over a long period of time (Lucrezi et al., 2009; Schlacher et al., 2011; Turra et al., 2005). Due to the short time period of data collection in this study, we cannot assess the long-term effects of trampling on the beaches in this study. Single trampling events by people have not been shown to have strong effects on ghost crabs (Schlacher et al., 2016). Therefore, we must consider the possibility that the negative relationship between human/animal prints and ghost crab burrows may not be a direct result of trampling but rather a result of other stressors superimposed on the same site. For these reasons, we recommend future research to extend sampling periods over multiple days, seasons, and years for a more comprehensive analysis.
Alternatively, our human/animal print data could indicate other indirect effects animals have on sandy beaches. During data collection, we anecdotally noted that many beaches in Ecuador had large populations of stray dogs, especially those near urban centers. In addition to trampling, these dogs behaved as predators consuming ghost crabs and directly impacting population sizes (Schlacher et al., 2007). This leads us to believe that predation may have other indirect effects on ghost crab behavior, potentially obscuring the true impact of human trampling on burrow hole density alone. Therefore, future studies may benefit from the dissociation of these variables and methods that measure predator presence in an alternate format.
Analyses included litter which generally correlates with higher levels of urbanization and recreation (Suciu et al., 2018). Despite anthropogenic litter being identified as impacting coastal habitats in association with high urbanization (Romiti et al., 2021), we demonstrated a positive relationship between litter and burrow hole density, with litter explaining 22.3% of the variation in burrow hole density observed. These results align with multiple studies that suggest ghost crabs make use of beach litter either as potential food sources or homing landmarks (Costa and Zalmon, 2018; Costa et al., 2019). However, recent research on the swamp ghost crab (Ucides cordatus) indicates that microplastics may carry contaminants and have adverse effects on crabs and other organisms (Nobre et al., 2022). Further research is needed to separate positive and negative effects of beach litter on ghost crabs and other coastal organisms.
As expected, our results indicate that increased urbanization negatively impacts populations of Ocypode gaudichaudii, and as such, the painted ghost crab can serve as a bioindicator of human impact on beaches. The urbanization index we developed adequately represents the wide variation of development levels seen across the sandy beaches of Manabí, Ecuador and shows a significant inverse relationship to O. gaudichaudii burrow hole density. The artificial bin method we created effectively systematized the transect and quadrat data into a simple scaling system that can be expanded and used to evaluate beaches exposed to higher and lower human impact levels than that seen in this study.
We did not include visitors per minute in our analyses due to natural inconsistencies in beach visitation during busier times of the day, week, and season. However, this variable has been shown to be an important indicator of human impact (Teles da Mota et al., 2022; Machado et al., 2016). Therefore, we recommend sampling over a longer period of time than that capable during this study to ensure visitation data is obtained in a representative manner for inclusion into urbanization indices. Alternatively, future management may obtain information on visitors through municipal or tourism offices.
Overall, measuring urbanization through this index allows for a quick, inexpensive, and quantitative method to evaluate sandy beach health in both urban and remote areas (González et al., 2014). Moreover, this method can be adapted to include more anthropogenic impact variables such as beach cleaning, night sky quality, solid waste and microplastic abundance, and sand removal for a more comprehensive evaluation of sandy beach health (González et al., 2014). Given much of the Ecuadorian coastline remains relatively unaffected by intense tourism, this replicable index will provide a method to monitor human impacts and inform conservation objectives for effective management of this region following increases in tourism.
As sun and sand tourism expands in Latin America, the quick and inexpensive nature of monitoring ghost crab abundance through borrow hole surveys provides a method to monitor human impacts on coastal environments in remote and developing areas. In Manabí specifically, it is important that conservation measures are put in place to combat the potentially harmful effects of a booming tourism industry. Future conservation efforts within Manabí, Ecuador should center around beach usage that does not disturb natural vegetation or beach wrack. In addition, we recommend that management considers restricting or limiting access to beaches in touristic areas (Martínez et al., 2020). A simple coastal management framework may be used to help develop these policies and can be briefly summarized into the following points: 1.) leave beach wrack on beaches so long as it does not pose an environmental or health risk 2.) increase awareness and environmental education around the importance of beach wrack 3.) restrict access to beaches in touristic areas.
As urbanization rates continue to surge along sandy beaches in Latin America, it is more important than ever to develop simple and cost-effective frameworks to monitor the health of these threatened ecosystems (Chatwin and Rybock, 2007; González et al., 2014). Our findings suggest that O. gaudichaudii can be used as a simple, cost-effective bioindicator of sandy beach health along the Pacific coast of South America. While our results identify natural debris, anthropogenic litter, and human/animal prints as key variables of human impact, our data was not sufficient to determine if ghost crab density can indicate the effect of visitors, vehicle traffic, and infrastructure on sandy beach ecosystems. Thus, we highlight the need for research in these subject areas. Our urbanization index adapted from Gonzalez et al., (2014) provides a quantitative method to categorize sandy beaches based on the degree of human impact they receive. The broad applicability of this index may facilitate such research on the effects of anthropogenic activity on sandy beach ecosystems.
The authors would like to thank Ceiba Foundation for Tropical Conservation for facilitating this research project as well as the summer 2021 intern students, Grace Shay, Harley Wahl, Greta Schiewsow, Conner Simon and Maya Gonzalez for contributing to project development and field data collection in Manabí, Ecuador. A special thank you to María José Rendón for assisting in project development and organizing logistics that permitted the data collection within Ecuador. Finally, they thank Nicolas Keuler and the Statistical Consulting lab (CALS UW-Madison) for statistical consult during data analyses.
Bulleri F. and Chapman M.G. The introduction of coastal infrastructure as a driver of change in marine environments. J Appl Ecol. 2010;47: 26-35.
McDonald R.I., Kareiva P., Forman R.T. The implications of current and future urbanization for global protected areas and biodiversity conservation. Biological Conservation 2008;141(6): 1695-1703.
McKinney M.L. Urbanization, biodiversity, and conservation: the impacts of urbanization on native species are poorly studied, but educating a highly urban human population about these impacts can greatly improve species conservation in all ecosystems. Bioscience. 2002;52(10): 883-890.
UNWTO World Tourism Barometer and Statistical Annex, Jan 2020. UNWTO World Tour. Barom. (English Version) 2020;18: 1-6.
Halpern B.S., Selkoe K.A., Micheli F., Kappel C.V. Evaluating and ranking the vulnerability of global marine ecosystems to anthropogenic threats. Conserv Biol. 2007;21(5): 1301-1315.
Ruttenberg B.I. and Granek E.F. Bridging the marine–terrestrial disconnect to improve marine coastal zone science and management. Mar. Ecol. Prog. Ser. 2011;434: 203-212.
Martínez A., Eckert E.M., Artois T., Careddu G., Casu M., Curini-Galletti M., et al. Human access impacts biodiversity of microscopic animals in sandy beaches. Commun Biol. 2020;3: 175.
Costa L., Tavares D., Suciu M., Rangel D., Zalmon I. Humaninduced changes in the trophic functioning of sandy beaches. Ecol Indic. 2017;82: 304-315.
Schooler N., Dugan J., Hubbard D. No lines in the sand: Impacts of intense mechanized maintenance regimes on sandy beach ecosystems span the intertidal zone on urban coasts. Ecol indic. 2019;106: 105457.
Halpern B.S., Walbridge S., Selkoe K.A., Kappel C.V., Micheli F., D’Agrosa C., et al. A global map of human impact on marine ecosystems. Science. 2018; 319: 948-952.
Chatwin A. and Rybock D. South American marine conservation priorities: an ecoregional assessment. Priorities for Coastal and Marine Conservation in South America. 2007;1-14.
Mestanza-Ramón C., Pranzini E., Anfuso G., Botero C., Chica-Ruiz J., Mooser A. An Attempt to Characterize the “3S” (Sea, Sun, and Sand) Parameters: Application to the Galapagos Islands and Continental Ecuadorian Beaches. Sustainability. 2020;12(8): 3468.
What we do: within the institution. n.d. [cited 15 February 2022]. In: Ministerio de turismo [Internet]. Ministerio de Turismo del Ecuador- MINTUR 2004. Available from: https:// vivecuador.com/html2/eng/what_we_do.htm#.
Schlacher T.A., Lucrezi S., Connolly R.M., Peterson C.H., Gilby B.L., Maslo B., et al. Human threats to sandy beaches: a meta-analysis of ghost crabs illustrates global anthropogenic impacts. Estuar Coast Shelf Sci. 2016;169: 56-73.
Costa L. and Zalmon I. Multiple metrics of the ghost crab Ocypode quadrata (Fabricius, 1787) for impact assessments on sandy beaches. Estuar Coast Shelf Sci. 2019;218: 237-245.
Barros F. Ghost crabs as a tool for rapid assessment of human impacts on exposed sandy beaches. Biological Conservation. 2001; 97: 399-404.
Gül M. and Griffen B. Diet, energy storage, and reproductive condition in a bioindicator species across beaches with different levels of human disturbance. Ecological Indicators. 2020;117: 106636.
Barboza C., Mattos G., Soares-Gomes A., Zalmon I., Costa L. Low Densities of the Ghost Crab Ocypode quadrata Related to Large Scale Human Modification of Sandy Shores. Front Mar Sci. 2021;8.
Pombo M. and Turra A. Issues to Be Considered in Counting Burrows as a Measure of Atlantic Ghost Crab Populations, an Important Bioindicator of Sandy Beaches. PLOS ONE. 2013;8(12): e83792.
Widmer W. and Hennemann M. Marine Debris in the Island of Santa Catarina, South Brazil: Spatial Patterns, Composition, and Biological Aspects. J Coast Res. 2010;26: 993-1000.
Suciu M.C., Tavares D.C., Zalmon I.R. Comparative evaluation of crustaceans as bioindicators of human impact on Brazilian sandy beaches. J Crustac Biol. 2018;38: 420-428.
Costa L., Secco H., Arueira V., Zalmon I. Mortality of the Atlantic ghost crab Ocypode quadrata (Fabricius, 1787) due to vehicle traffic on sandy beaches: A road ecology approach. J Envirn Manag. 2020;260: 110168.
Lucrezi S., Schlacher T., Walker S. Monitoring human impacts on sandy shore ecosystems: a test of ghost crabs (Ocypode spp.) as biological indicators on an urban beach. Environ Monit Assess. 2009;152: 413-424.
Schlacher, T, de Jager R., Nielsen T. Vegetation and ghost crabs in coastal dunes as indicators of putative stressors from tourism. Ecol Indicators. 2011;11: 284-294.
González S., Yáñez-Navea K., Muñoz M. Effect of coastal urbanization on sandy beach coleoptera Phaleria maculata (Kulzer, 1959) in northern Chile. Mar Pollut Bull. 2014;83: 265-274.
Sunger N., Teske S., Nappier S., Haas C. Recreational use assessment of water-based activities, using time-lapse construction cameras. J Expo Sci Environ Epidemiol. 2012;22: 281-290.
Google Earth. 2022. [cited 25 August 2022]. Available from: https://earth.google.com/web/ data=CiQSIhIgOGQ2YmFjYjU2ZDIzMTF1OThiNTM2YjMz
NGRiYmRhYTA.
Legendre P. and Legendre L. Variation partitioning of species data matrices: estimation and comparison of fractions. Ecology. 1998;87: 2614-2625.
Blankensteyn A. O uso do caranguejo maria-farinha Ocypode quadrata (Fabricius) (Crustacea, Ocypodidae) como indicador de impactos antropogênicos em praias arenosas da Ilha de Santa Catarina, Santa Catarina, Brasil. Rev Bras Zool [online]. 2006;23(3): 870-876.
Costa L., Soares-Gomes A., Zalmon I. Burrow occupation rates and spatial distribution within habitat of the ghost crab Ocypode quadrata (Fabricius, 1787): Implications for impact assessments. Reg Stud Mar Sci. 2021;44: 101699.
Dugan J.E., Hubbard D.M., McCrary M.D., Pierson M.O. The response of macrofauna communities and shorebirds to macrophyte wrack subsidies on exposed sandy beaches of southern California. Estuar Coast Shelf Sci. 2003;58: 25-40.
Dugan J.E. and Hubbard D.M. Loss of coastal strand habitat in southern California: the role of beach grooming. Estuaries Coasts. 2010;33: 67-77.
Schlacher T.A., de Jager R., Nielsen T. Vegetation and ghost crabs in coastal dunes as indicators of putative stressors from tourism. Ecol Indic. 2011;11(2): 284-294.
McDermott J. The Distribution of Ocypode quadrata, Atlantic Ghost Crab (Decapoda: Brachyura: Ocypodidae) Megalopae, beyond the Presumptive Northern Boundary of Adult Populations in the Northwest Atlantic. Northeast Nat (Steuben). 2013;20: 578-586.
Morrow K., Bell S., Tewfik A. Variation in ghost crab trophic links on sandy beaches. Mar Ecol Prog Ser. 2014;502: 197-206.
Robbe E., Woelfel J., Balciunas A., Schernewski G. An Impact Assessment of Beach Wrack and Litter on Beach Ecosystem Services to Support Coastal Management at the Baltic Sea. Environmental Management. 2021;68: 835-859.
Schlacher T., Schoeman D., Jones A., Dugan J., Hubbard D., Defeo., et al. Metrics to assess ecological condition, change, and impacts in sandy beach ecosystems. J Environ Manag. 2014;144: 322-335.
Petch N., Maguire G., Schlacher T., Weston M. Motivations and behavior of off-road drivers on sandy beaches. Ocean Coast Manag. 2018;163: 82-91.
Schlacher T. and Thompson L. Physical Impacts Caused by Off-Road Vehicles to Sandy Beaches: Spatial Quantification of Car Tracks on an Australian Barrier Island. J Coast Res. 2008; 234-242.
Knisley C. and David B. Habitat, Distribution, Biology, and Conservation of the Miami Tiger Beetle, Cicindelidia floridana(Cartwright) (Coleoptera: Carabidae: Cicindelinae). Coleopt Bull. 2018;72: 1-8.
Schlacher T., Thompson L., Walker S. Mortalities caused by off-road vehicles (ORVs) to a key member of sandy beach assemblages, the surf clam Donax deltoides. Hydrobiologia. 2008;610: 345-350.
Turra A., Gonçalves M., Denadai M. Spatial distribution of the ghost crab Ocypode quadrata in low energy tide dominated sandy beaches. J Nat His. 2005;39: 2163-2177.
Schlacher T.A., Thompson L. and Price S. Vehicles versus conservation of invertebrates on sandy beaches: mortalities inflicted by off-road vehicles on ghost crabs. Marine Ecology. 2007;28: 354-367.
Romiti F., Pietrangeli E., Battisti C. et al. Quantifying the entrapment effect of anthropogenic beach litter on sanddwelling beetles according to the EU Marine Strategy Framework Directive. J Insect Conserv. 2021;25: 441-452.
Costa L., Rangel D., Zalmon I. Evidence of marine debris usage by the ghost crab Ocypode quadrata (Fabricius, 1787). Mar Poll Bull. 2018;128: 438-445.
Costa L., Madureira J., Di Beneditto A., Zalmon I. Interaction of the Atlantic ghost crab with marine debris: Evidence from an in situ experimental approach. Mar Pollut Bull. 2019;140: 603-609.
Nobre C., Moreno B., Alves A., Rosa J., Fontes M., Campos B., et al. Combined effects of polyethylene spiked with the antimicrobial triclosan on the swamp ghost crab (Ucides cordatus; Linnaeus, 1763). Chemosphere. 2022;304: 135169.
Teles da Mota V., Pickering C., Chauvenet A. Popularity of Australian beaches: Insights from social media images for coastal management. Ocean Coast Manag. 2022;217: 106018.
Machado P.M., Costa L.L., Suciu M.C., Tavares D.C., Zalmon I.R. Extreme storm wave influence on sandy beach macrofauna with distinct human pressures. Mar Pollut Bull. 2016; 107(1): 125-135.
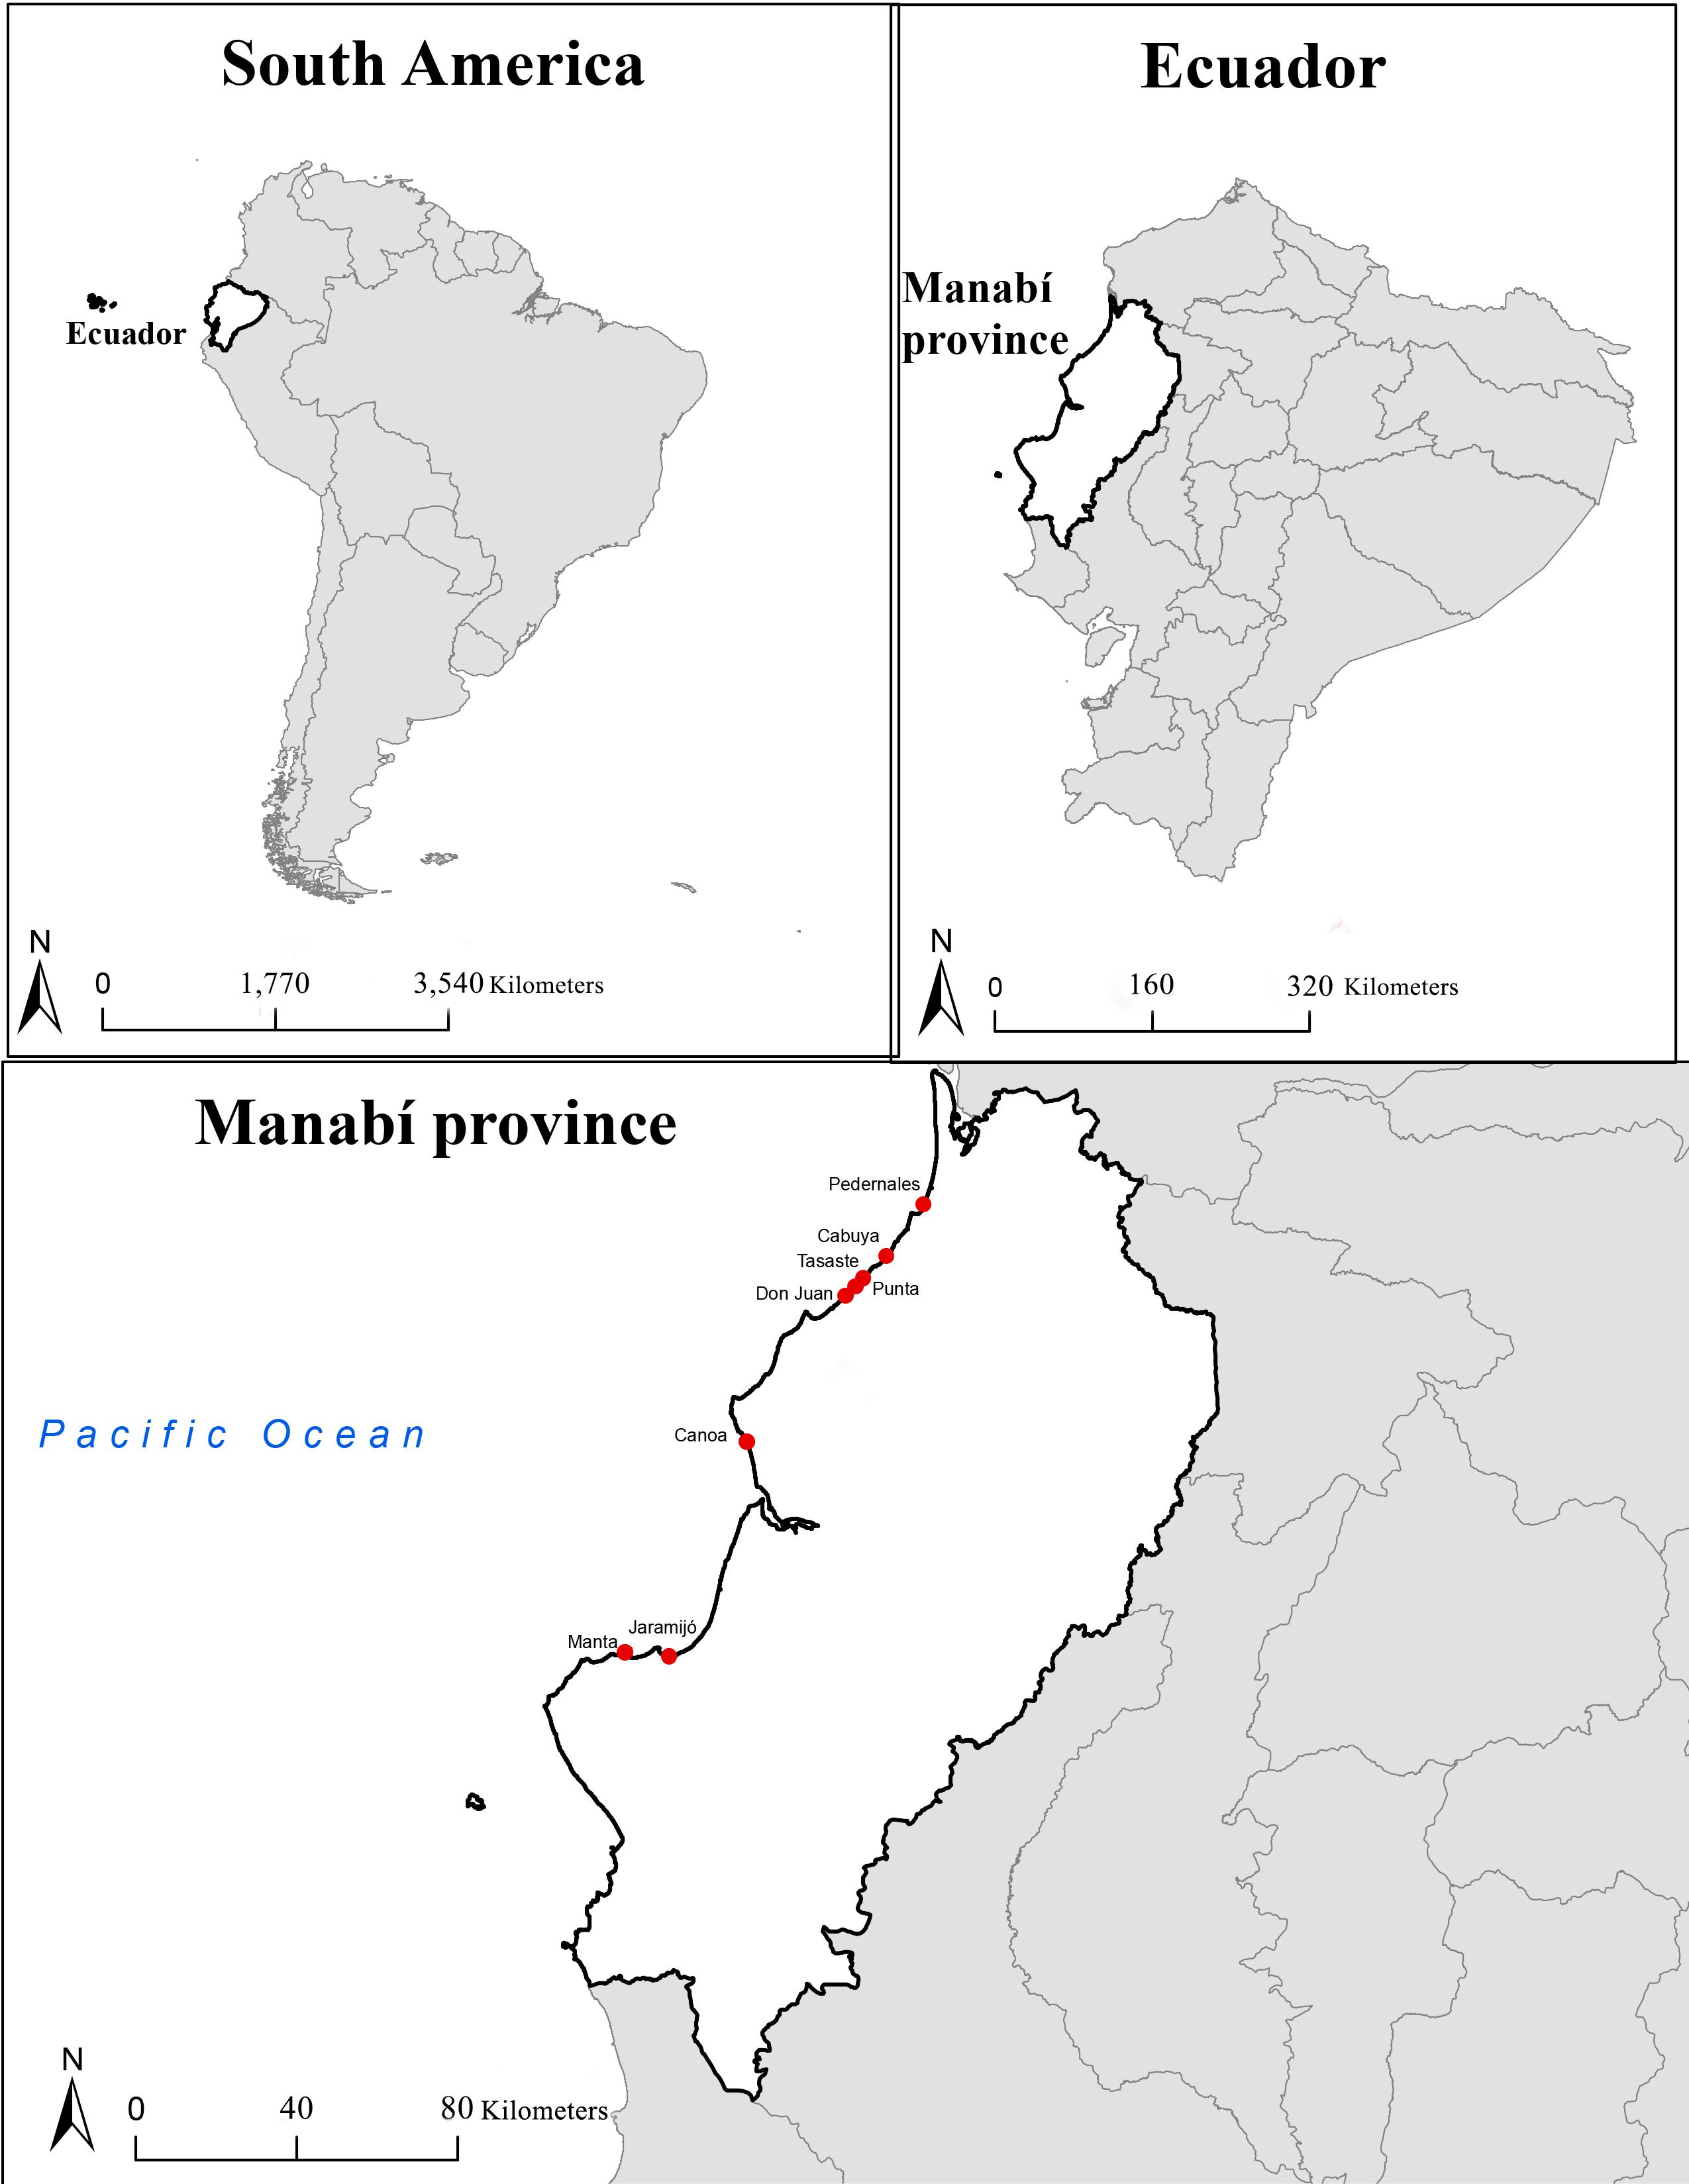
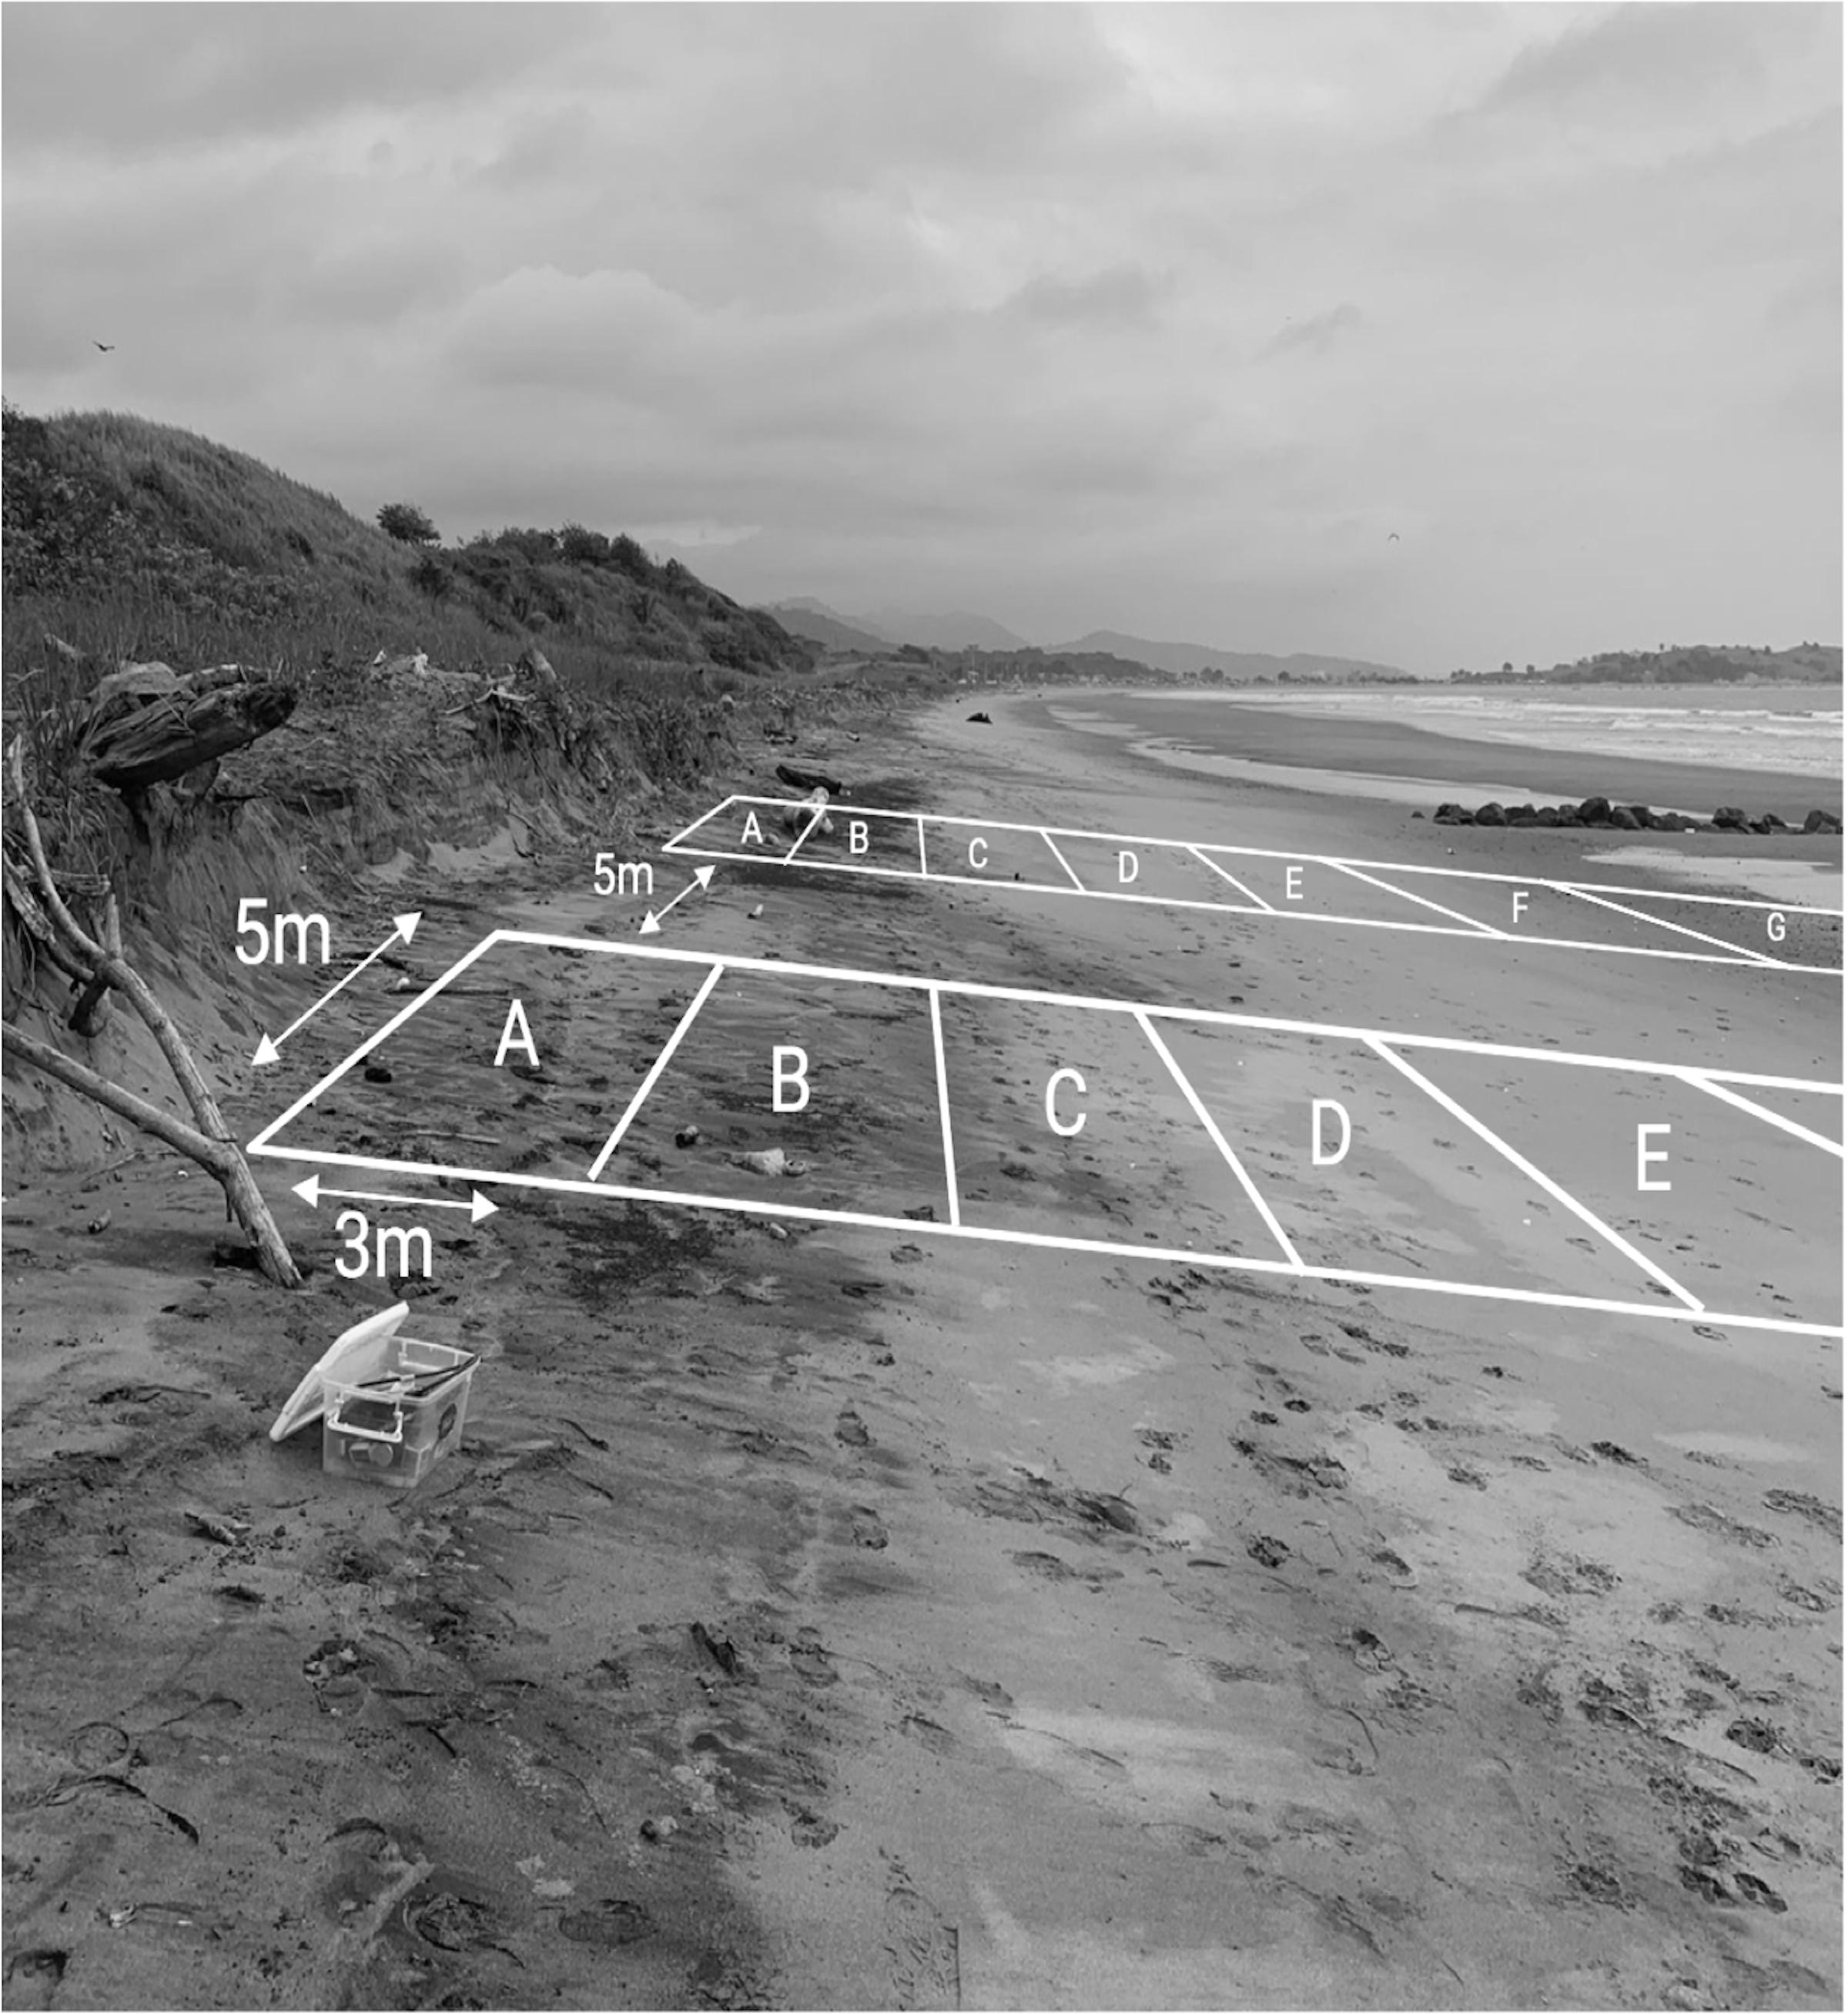
Table 1: Maximum and minimum values of human impact variables used to calculate bins for categorization in the urbanization index (see Table 3 for index) from compiled data across eight beaches sampled in Manabí, Ecuador (see Fig. 1 for sites). Percent tire tracks, human/animal prints, and litter values were calculated at the quadrat level (15m2). Infrastructure was calculated in QGIS using satellite imagery as m2 of buildings and impervious surfaces per 27,225m2. Visitors per minute was calculated using a 4G LTE Cellular trail camera.
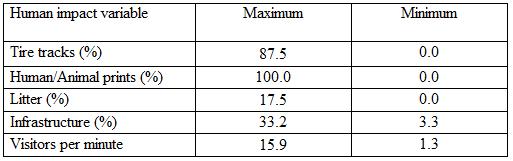
Table 2: Summary of top four simple and multiple linear regression models using burrow hole abundance as a dependent variable (N=16 beach samples). Independent variables used in the models were measures of human impact included in the urbanization index. Significant predictions are marked in bold. The signal of the estimate indicates the positive or negative influence of the predictors.
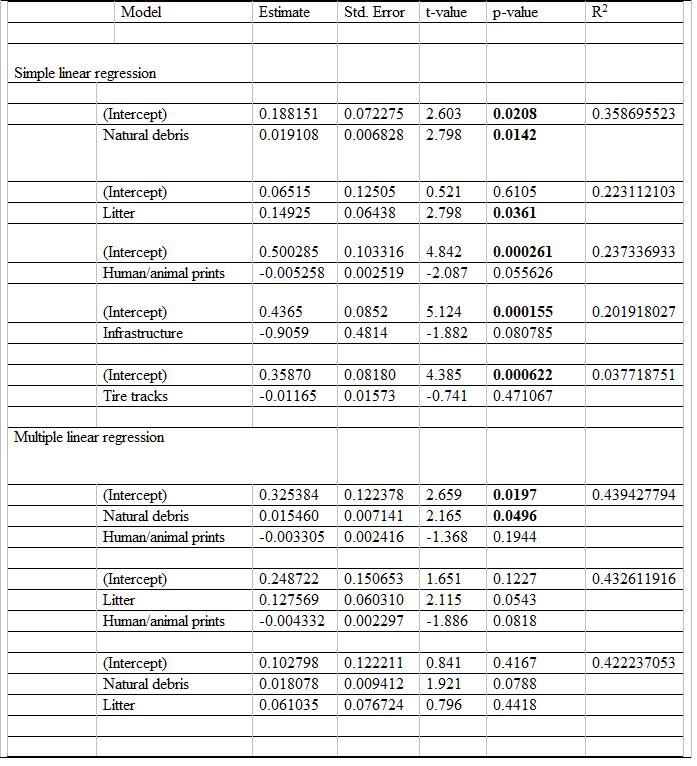
Table
of urbanization indicators (0 corresponds to the total absence and 5 to extremely high level of urbanization) and estimation of urbanization index value on eight beaches in Manabí, Ecuador (see fig. 1 for sites). Each beach was sampled twice within a high impact area and low impact area determined from initial observations and a minimum of 300m apart. NA represents a lack of data due to equipment failure.