February 2025 Market Report San Francisco Bay Area
San Francisco Bay area
Jump to Alameda Report Alameda
Contra Costa
Jump to Contra Costa Report
Jump to Napa Report Napa County
San Francisco County
Jump to San Francisco County Report
San Mateo
Jump to San Mateo Report
Santa Clara
Jump to Santa Clara Report
Solano County
Jump to Solano Report
Sonoma County
Jump to Sonoma Report
Jump to Marin Report Southern/Central Marin
What’syourhome reallyworthin today’smarket?
That's the question you should be asking yourself.
Our market is incredibly diverse and rapidly changing. Values vary not just by neighborhood but by street. Your home isn't necessarily worth what your neighbors' home is. It's the current market that sets the value of your home.
So, do you know what your home is worth in today's market?
Icanhelp...
Contact me for a confidential, no obligation assessment of your home's value.
BuyerBrightSpot: ThereAreMoreHomesonthe Market
The past few years have been challenging for homebuyers, especially with higher home prices and mortgage rates. And if you’re trying to buy a home, it’s easy to worry you won’t be able to find something in your budget.
But here’s what you need to know. The number of homes for sale has grown a whole lot lately and that’s true for both existing (previously lived-in) and newly built homes. Here’s a look at those two bright spots for buyers right now and why they may make it a bit easier to find the home you’re been looking for.
Smart Strategies for a Mortgage Application
Avoid paying off debts or collections without professional advice.
Don't have your credit report pulled too many times - this can hurt your credit score. 3 4 5 6 1 2
Always consult your mortgage professional before making large financial moves. Use verified funds for deposits to prevent closing delays.
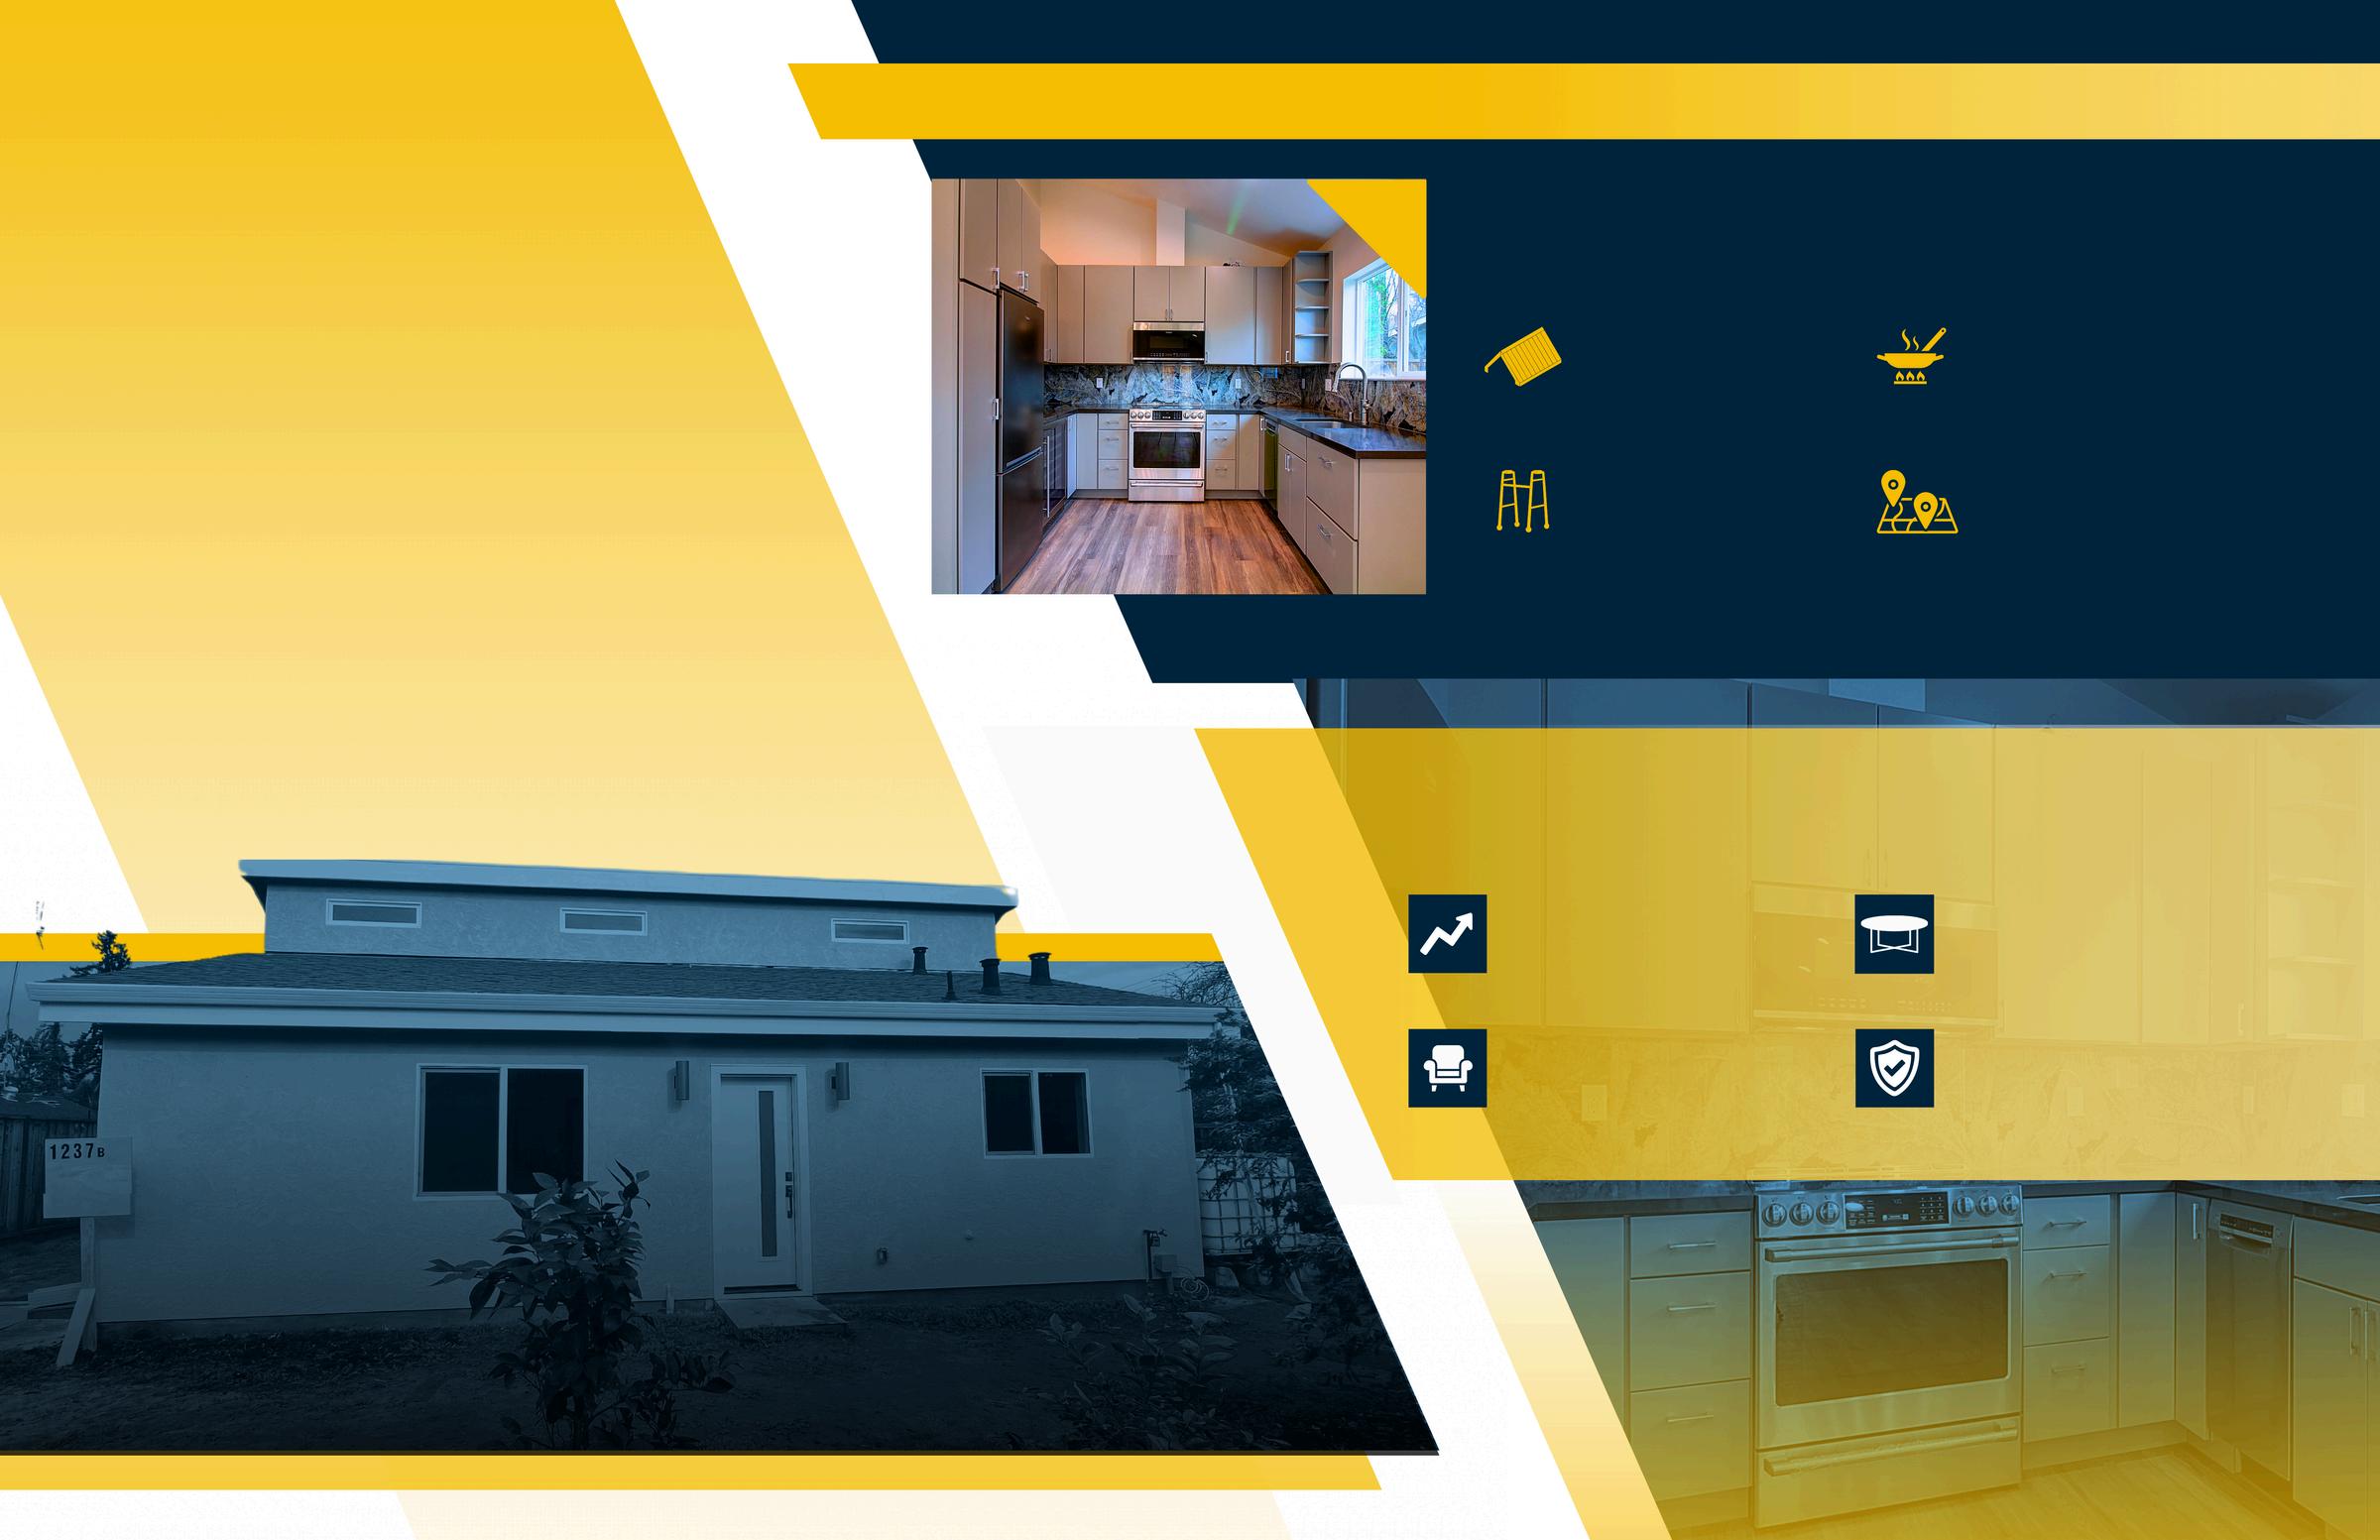
HomeRenovationsThatCanMakea BIG IMPACT AccordingtoExperts
Enhancing Property Value and Family Living Space with an Acton ADU
The Anenberg-Essert family in Campbell collaborated with Acton ADU to create a versatile, comfortable, and valuable addition to their property. This ADU project is a shining example of how a well-designed accessory dwelling unit can increase property value and serve a family’s unique needs.
GoalsandVision
The family envisioned an ADU that would function as an independent living space for family members, enhance their property’s worth, and provide seamless integration with the main home They wanted a space that balanced privacy with connectivity, feeling like a natural extension of their residence
Design and Construction Details
Constructed at 747 square feet, this ADU was designed with modern, high-quality finishes to serve both aesthetic and practical needs. Key features include:
Vaulted Ceilings
Creates a spacious, open atmosphere
Senior-Friendly Living
Safe, independent space for elderly family members
Fully Equipped Kitchen
Modern amenities for everyday convenience
Open Living Area
Multipurpose area for relaxation and entertainment
Results and Impact
The completion of the Anenberg-Essert ADU led to several valuable outcomes:
Increased Property Value
The ADU addition significantly boosted property value
Flexible Living Space
A versatile space for family, guests, or as a rental
Modern Comforts
High-end finishes and amenities enhance both function and style.
Enhanced Family Living
The ADU enriches the AnenbergEssert family’s home with both privacy and connection
VENDOR DIRECTORY
When it comes to home ownership, knowing who you can trust is crucial. That's why we've curated a select list of trusted vendors who are ready to help with your home goals.
Alameda
What's in the Alameda data?
There were 1,305 single-family homes for sale, providing 1.8 months of inventory. There were 773 new listings, and 324 homes sold at a median price of $1.1m. The median overbid percentage was at 101%, with an average of 27 days on the market.
There were 777 condo and townhome units for sale, providing 3 months of inventory There were 387 new listings and 143 units sold at a median sale price of $680k. The median overbid percentage was at 97.7%, with an average of 40 days on the market.
He-Family Homes
3 ings
324 Sold Listings
8 of Inventory
$1.1M Median Sale Price
1% Sale vs List
27 Avg Days on Market
sourced from InfoSparks, includes all single-family homes, condos and in the California Area above from January 2024 to January 2025. This may minary data, and may vary from the time the data was gathered. All data is reliable but not guaranteed. DRE# 01995149. Copyright KW Advisors San Francisco | Napa Valley 2025. Each office is independently owned and operated.
387 New Listings 3 Months of Inventory
Listings
AlamedaCounty
JANUARY 2024 - JANUARY 2025
Single-Family Homes
Last 12 months, year-over-year.
Condos & Townhomes
Last 12 months, year-over-year
Single-Family Homes
The median sale price has increased from $1 10m last January 2024, to $1 12m as of January 2025
Condos & Townhomes
The median sale price has decreased from $690k last January 2024, to $680k as of January 2025
AVGDays OntheMarket
Single-Family Homes
The average time spent on the market went up from 24 days last January 2024, to 27 days as of January 2025
Condos & Townhomes
The average time spent on the market went up from 35 days in January 2024, to 40 days as of January 2025.
Overbids
Single-Family Homes
The overbid percentage has decreased from 101 1% last January 2024, to 101% a year later
Condos & Townhomes
The overbid percentage has decreased from 98.9% last January 2024, to 97.7% a year later.
Contra Costa
What's in the Contra Costa data?
There were 927 single-family homes for sale, providing 1.5 months of inventory. There were 786 new listings, and 325 homes sold at a median price of $784k. The median overbid percentage was at 100%, with an average of 42 days on the market.
There were 420 condo and townhome units for sale, providing 2.4 months of inventory. There were 299 new listings and 108 units sold at a median sale price of $650k. The median overbid percentage was at 100%, with an average of 41 days on the market
Single-Family Homes
786 New Listings
325 Sold Listings
1.5 Months of Inventory
$784K
Median Sale Price
100%
Median Sale vs List
42 Avg Days on Market
The data, sourced from InfoSparks, includes all single-family homes, condos and townhomes in the California Area above from January 2024 to January 2025. This may include preliminary data, and may vary from the time the data was gathered. All data is deemed reliable but not guaranteed. DRE# 01995149. Copyright KW Advisors San Francisco | Napa Valley 2025. Each office is independently owned and operated.
299
New Listings
108
Sold Listings
2.4
Months of Inventory
$650K
Median Sale Price
100%
Median Sale vs List
41 Avg Days on Market
ontraCosta
JANUARY 2024 - JANUARY 2025
TINGS FOR SALE SOLD LISTINGS
Family Homes
2 months, year-over-year.
s & Townhomes
2 months, year-over-year
Median SalesPrice
Single-Family Homes
The median sale price has increased from $770k last January 2024, to $784k as of January 2025
Condos & Townhomes
The median sale price has increased from $590k last January 2024, to $650k as of January 2025
AVGDays OntheMarket
Single-Family Homes
The average time spent on the market went up from 37 days last January 2024, to 42 days as of January 2025
Condos & Townhomes
The average time spent on the market went up from 40 days in January 2024, to 41 days as of January 2025.
Overbids
Single-Family Homes
The overbid percentage has remained the same from 100% last January 2024, to 100% a year later
Condos & Townhomes
The overbid percentage has remained the same from 100% last January 2024, to 100% a year later.
Napa County
What's in the Napa County data?
There were 242 single-family homes for sale, providing 3.4 months of inventory. There were 79 new listings, and 44 homes sold at a median price of $880k. The median overbid percentage was at 98 7%, with an average of 87 days on the market
There were 37 condo and townhome units for sale, providing 3.8 months of inventory. There were 6 new listings and 5 units sold at a median sale price of $910k. The median overbid percentage was at 98.9%, with an average of 111 days on the market.
Single-Family Homes
79 New Listings
44 Sold Listings
3.4 Months of Inventory
$880K
Median Sale Price
98.7%
Median Sale vs List
87 Avg Days on Market
The data, sourced from InfoSparks, includes all single-family homes, condos and townhomes in the California Area above from January 2024 to January 2025. This may include preliminary data, and may vary from the time the data was gathered. All data is deemed reliable but not guaranteed. DRE# 01995149. Copyright KW Advisors San Francisco | Napa Valley 2025. Each office is independently owned and operated.
New Listings
5 Sold Listings
3.8
Months of Inventory
$910K
Median Sale Price 98.9%
Median Sale vs List 111 Avg Days on Market
NapaCounty
JANUARY 2024 - JANUARY 2025
Single-Family Homes
Last 12 months, year-over-year.
Condos & Townhomes
Last 12 months, year-over-year
Median SalesPrice
Single-Family Homes
The median sale price has decreased from $980k last January 2024, to $880k as of January 2025
Condos & Townhomes
The median sale price has increased from $617k last January 2024, to $910k as of January 2025
AVGDays OntheMarket
Single-Family Homes
The average time spent on the market went down from 109 days last January 2024, to 87 days as of January 2025
Condos & Townhomes
The average time spent on the market went up from 67 days in January 2024, to 111 days as of January 2025.
Overbids
Single-Family Homes
The overbid percentage has decreased from 99 2% last January 2024, to 98 7% a year later
Condos & Townhomes
The overbid percentage has decreased from 99% last January 2024, to 98.9% a year later.
San Francisco County
What's in the San Francisco County
data?
There were 204 single-family homes for sale, providing 1.1 months of inventory. There were 217 new listings, and 110 homes sold at a median price of $1.4m. The median overbid percentage was at 102%, with an average of 49 days on the market.
There were 484 condo and townhome units for sale, providing 2.7 months of inventory. There were 354 new listings and 102 units sold at a median sale price of $977k. The median overbid percentage was at 98.6%, with an average of 102 days on the market.
Single-Family Homes
217 New Listings
110 Sold Listings
1.1 Months of Inventory
$1.4M Median Sale Price
101.6%
Median Sale vs List
49 Avg Days on Market
The data, sourced from InfoSparks, includes all single-family homes, condos and townhomes in the California Area above from January 2024 to January 2025. This may include preliminary data, and may vary from the time the data was gathered. All data is deemed reliable but not guaranteed. DRE# 01995149. Copyright KW Advisors San Francisco | Napa Valley 2025. Each office is independently owned and operated.
354
New Listings
102 Sold Listings
2.7
Months of Inventory
$977K
Median Sale Price 98.6%
Median Sale vs List
102 Avg Days on Market
SanFranciscoCounty
JANUARY 2024 - JANUARY 2025
LISTINGS FOR SALE SOLD LISTINGS
Single-Family Homes
Last 12 months, year-over-year.
Condos & Townhomes
Last 12 months, year-over-year
Median SalesPrice
Single-Family Homes
The median sale price has decreased from $1 5m last January 2024, to $1 4m as of January 2025
Condos & Townhomes
The median sale price has decreased from $1 1m last January 2024, to $977k as of January 2025
AVGDays OntheMarket
Single-Family Homes
The average time spent on the market went down from 58 days last January 2024, to 49 days as of January 2025
Condos & Townhomes
The average time spent on the market went up from 80 days in January 2024, to 102 days as of January 2025.
Overbids
Single-Family Homes
The overbid percentage has increased from 100 1% last January 2024, to 102% a year later
Condos & Townhomes
The overbid percentage has increased from 97.4% last January 2024, to 98.6% a year later.
SanMateo County
What's in the San Mateo Cou data?
There were 278 single-family homes for sale, providing 0.9 months of inventory. There wer new listings, and 152 homes sold at a media price of $1.8m. The median overbid percenta was at 100 4%, with an average of 38 days on market.
There were 178 condo and townhome units f sale, providing 1.9 months of inventory. Ther were 133 new listings and 44 units sold at a median sale price of $919k. The median over percentage was at 100%, with an average of days on the market
323 New Listings
152 Sold Listings
0.9 Months of Inventory
$1.8M Median Sale Price
100.4%
Median Sale vs List
38 Avg Days on Market
133
New Listings
1.9
Months of Inventory
$919K Median Sale Price 100%
Median Sale vs List 58 Avg Days on Market 44 Sold Listings
SanMateoCounty
JANUARY 2024 - JANUARY 2025
LISTINGS FOR SALE SOLD LISTINGS
Single-Family Homes
Last 12 months, year-over-year.
Condos & Townhomes
Last 12 months, year-over-year
Median SalesPrice
Single-Family Homes
The median sale price has decreased from $1 84m last January 2024, to $1 80m as of January 2025
Condos & Townhomes
The median sale price has increased from $772k last January 2024, to $919k as of January 2025
AVGDays OntheMarket
Single-Family Homes
The average time spent on the market went down from 45 days last January 2024, to 38 days as of January 2025
Condos & Townhomes
The average time spent on the market went down from 68 days in January 2024, to 58 days as of January 2025.
Overbids
Single-Family Homes
The overbid percentage has increased from 100% last January 2024, to 100 4% a year later
Condos & Townhomes
The overbid percentage has increased from 99.6% last January 2024, to 100% a year later.
SantaC County
What's in the Sant County data?
There were 490 single-family providing 0.7 months of inve new listings, and 363 homes price of $1.8m. The median o was at 101 4%, with an avera market.
There were 432 condo and to sale, providing 1.4 months of were 463 new listings and 16 median sale price of $920k. T percentage was at 100%, wit days on the market
673 New Listings
0.7 Months of Inventory
101.4%
Median Sale vs List
363 Sold Listings
$1.8M Median Sale Price
28 Avg Days on Market
homes, condos and January 2025. This may was gathered. All data is Copyright KW Advisors San Francisco | Napa Valley 2025. Each office is independently owned and operated.
463
New Listings
169
Sold Listings
1.4
Months of Inventory
$920K
Median Sale Price 100%
Median Sale vs List 45 Avg Days on Market
antaClaraCounty
JANUARY 2024 - JANUARY 2025
TINGS FOR SALE SOLD LISTINGS
Family Homes
2 months, year-over-year.
s & Townhomes
2 months, year-over-year
Median SalesPrice
Single-Family Homes
The median sale price has increased from $1 7m last January 2024, to $1 8m as of January 2025
Condos & Townhomes
The median sale price has decreased from $922k last January 2024, to $920k as of January 2025
AVGDays OntheMarket
Single-Family Homes
The average time spent on the market went up from 25 days last January 2024, to 28 days as of January 2025
Condos & Townhomes
The average time spent on the market went up from 39 days in January 2024, to 45 days as of January 2025.
Overbids
Single-Family Homes
The overbid percentage has increased from 100 8% last January 2024, to 101 4% a year later
Condos & Townhomes
The overbid percentage has remained the same from 100% last January 2024, to 100% a year later.
Solano County
What's in the Sola
data?
There were 560 single-family providing 1.9 months of inve new listings, and 179 homes price of $566k. The median o was at 100%, with an average market.
There were 80 condo and tow sale, providing 3 months of in 39 new listings and 16 units price of $382k. The median o was at 100%, with an average market
315 New Listings
1.9 Months of Inventory
100%
Median Sale vs List
179 Sold Listings
$566K Median Sale Price
59 Avg Days on Market
homes, condos and January 2025. This may was gathered. All data is Copyright KW Advisors San Francisco | Napa Valley 2025. Each office is independently owned and operated.
Median SalesPrice
Single-Family Homes
The median sale price has decreased from $575k last January 2024, to $566k as of January 2025
Condos & Townhomes
The median sale price has increased from $335k last January 2024, to $382k as of January 2025
AVGDays OntheMarket
Single-Family Homes
The average time spent on the market went up from 55 days last January 2024, to 59 days as of January 2025
Condos & Townhomes
The average time spent on the market went up from 68 days in January 2024, to 81 days as of January 2025.
Overbids
Single-Family Homes
The overbid percentage has remained the same from 100% last January 2024, to 100% a year later
Condos & Townhomes
The overbid percentage has remained the same from 100% last January 2024, to 100% a year later.
Sonoma County
What's in the Sonoma data?
There were 544 single-family homes for sale, providing 1.8 months of inventory. There were 221 new listings, and 173 homes sold at a median price of $818k. The median overbid percentage was at 100%, with an average of 64 days on the market.
There were 83 condo and townhome units for sale, providing 2 months of inventory. There were 46 new listings and 25 units sold at a median sale price of $445k. The median overbid percentage was at 100%, with an average of 54 days on the market.
Single-Family Homes
221 New Listings
173 Sold Listings
1.8 Months of Inventory
$818K
Median Sale Price
100%
Median Sale vs List
64
Avg Days on Market
The data, sourced from InfoSparks, includes all single-family homes, condos and townhomes in the California Area above from January 2024 to January 2025. This may include preliminary data, and may vary from the time the data was gathered. All data is deemed reliable but not guaranteed. DRE# 01995149. Copyright KW Advisors San Francisco | Napa Valley 2025. Each office is independently owned and operated.
SonomaCounty
JANUARY 2024 - JANUARY 2025
LISTINGS FOR SALE SOLD LISTINGS
Single-Family Homes
Last 12 months, year-over-year.
Condos & Townhomes
Last 12 months, year-over-year
Median SalesPrice
Single-Family Homes
The median sale price has decreased from $829k last January 2024, to $818k as of January 2025
Condos & Townhomes
The median sale price has decreased from $460k last January 2024, to $445k as of January 2025
AVGDays OntheMarket
Single-Family Homes
The average time spent on the market went down from 70 days last January 2024, to 64 days as of January 2025
Condos & Townhomes
The average time spent on the market went up from 51 days in January 2024, to 54 days as of January 2025.
Overbids
Single-Family Homes
The overbid percentage has increased from 99 3% last January 2024, to 100% a year later
Condos & Townhomes
The overbid percentage has remained the same from 100% last January 2024, to 100% a year later.
Southern/ Central Marin
What's in the Southern/Central Marin data?
There were 148 single-family homes for sale, providing 1 month of inventory. There were 68 new listings, and 63 homes sold at a median price of $1.4m. The median overbid percentage was at 100%, with an average of 80 days on the market.
There were 91 condo and townhome units for sale, providing 2 1 months of inventory There were 33 new listings and 26 units sold at a median sale price of $712k. The median overbid percentage was at 99%, with an average of 73 days on the market.
Single-Family Homes
68 New Listings
63 Sold Listings
1 Month of Inventory
$1.4M
Median Sale Price
100%
Median Sale vs List
80 Avg Days on Market
The data, sourced from InfoSparks, includes all single-family homes, condos and townhomes in the California Area above from January 2024 to January 2025. This may include preliminary data, and may vary from the time the data was gathered. All data is deemed reliable but not guaranteed. DRE# 01995149. Copyright KW Advisors San Francisco | Napa Valley 2025. Each office is independently owned and operated.
New Listings 2.1
Months of Inventory
Median Sale vs List 73 Avg Days on Market 26 Sold Listings
Median SalesPrice
Single-Family Homes
The median sale price has decreased from $1 5m last January 2024, to $1 4m as of January 2025
Condos & Townhomes
The median sale price has decreased from $868k last January 2024, to $712k as of January 2025
AVGDays OntheMarket
Single-Family Homes
The average time spent on the market went up from 69 days last January 2024, to 80 days as of January 2025
Condos & Townhomes
The average time spent on the market went up from 70 days in January 2024, to 73 days as of January 2025.
Overbids
Single-Family Homes
The overbid percentage has increased from 98 9% last January 2024, to 100% a year later
Condos & Townhomes
The overbid percentage has increased from 98.9% last January 2024, to 99% a year later.