FUNDAMENTAL AND PROFESSIONAL X-RAY

FOR PHYSICS, BIOLOGY, MEDICINE, CHEMISTRY, MINERALOGY AND MATERIAL SCIENCES


FOR PHYSICS, BIOLOGY, MEDICINE, CHEMISTRY, MINERALOGY AND MATERIAL SCIENCES


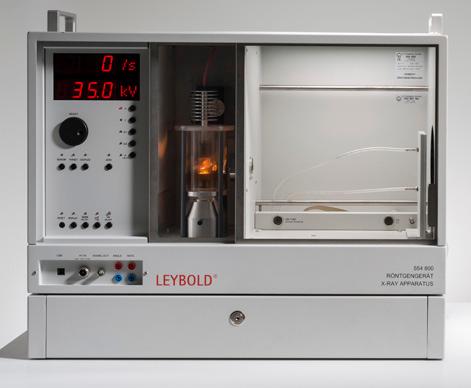
The LEYBOLD X-ray apparatus is setting new standards in resolution and intensity in the field of education worldwide. Not only the high resolution of the Bragg spectra is impressive, but also the new high-resolution X-ray image sensor, the reliable X-ray energy detector and the gold tube.
The modular structure of the system enables both a low-cost introduction (FUNDAMENTAL Experiments) and advanced applications (PROFESSIONAL Experiments) for several different test subjects.
FUNDAMENTALS
Radiography
X-ray photography
Ionisation and Dosimetry
Attenuation of X-ray beams
Bragg: Determining the lattice constants of monocrystals
Laue: Investigating the lattice structure of monocrystals
Debye-Scherrer: Determining the lattice planespacings of polycrystalline powder samples
APPLICATIONS
Radiology
Mineralogy
Radiation protection
X-ray fluorescence analysis
Non-destructive material analysis
Non-destructive testing
Computed tomography also in 3D
THERE IS A WIDE RANGE OF APPLICATIONS.
Depending on the focus, you will find the appropriate overview either via the specialist field or via a topic.

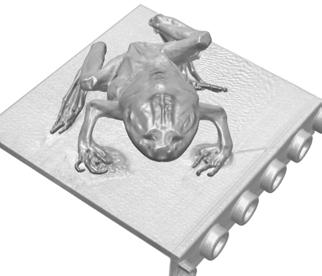
3D reconstruction of an irradiated frog with the LEYBOLD Computed Tomography software.
Bragg: Diffraction on X-ray beams on a monocrystal Investigating the energy spectrum of an X-ray tube
Duane-Hunt: Determination of h from the threshold wavelength
Energy-dependent absorption, K- and L-edges
Moseley's law and determination of the Rydberg constants
Fine structure of X-ray spectra
X-ray fluorescence
Compton effect on X-ray radiation
SCOPE OF APPLICATION
and Dosimetry (Page 20)
and Radiography (Page 22)
Bragg reflection (Page 24)
Laue diagrams (Page 26)
and fluorescence (Page 28)
(Pages 8 + 30)
The LEYBOLD X-ray system has a modular structure and enables the individual configuration of the separate appliances, so that you only buy what you actually need.
In addition to the basic equipment, you can choose your accessories for basic experiments (FUNDAMENTAL Experiments) or advanced applications (PROFESSIONAL Experiments) depending on the experiment requirements.

Goniometer
No matter whether you are interested in Bragg spectra, X-ray energy spectra or computed tomography, you will be happy with the precision and high resolution of the goniometer.

The X-ray apparatus is available in two variants - as a basic apparatus or as a complete apparatus with a Mo tube, goniometer and NaCl monocrystal. If you wish to use other tubes, the X-ray basic apparatus is the most flexible solution.
You can extend the X-ray apparatus with a drawer for your accessories irrespective of this.
In addition to the Mo tube, there are other tubes, which are more suitable for special areas of application, e.g. Cu tube for Debye-Scherrer diagrams, Ag tube for X-ray fluorescence due to its high energy K-lines, W or Au tubes for radiation and computed tomography due to their high intensity.

The X-ray apparatus has a laterally installed fluorescent screen, on which X-rays can be seen directly. The computed tomography module captures this visible X-ray image and the software provided there controls the rotation of the object in the X-ray apparatus through 360° and carries out the back projection of the X-ray image for the real-time 3D reconstruction.
The X-ray energy detector exposes energy-dispersive X-ray spectra with the CASSY system. Using the X-ray energy spectra, various chemical elements can be easily distinguished by means of their characteristic X-ray radiation and their mass fraction can also be determined. This also confirms the Compton effect.
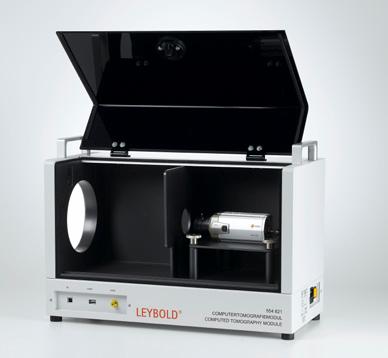
With the complete apparatus with a Mo tube, you have everything you need for capturing your first Bragg spectrum. Other available monocrystals and/or X-ray tubes offer several possible variations.
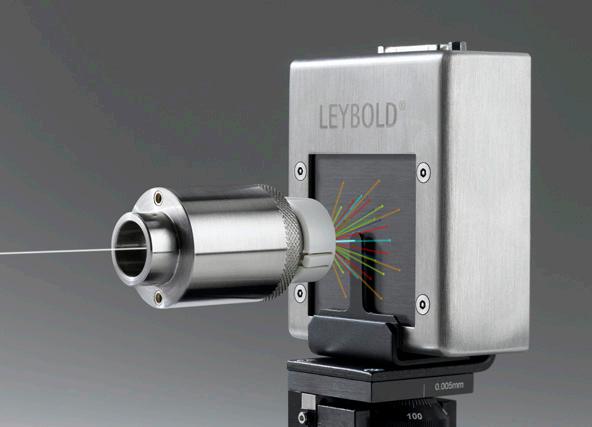
If the resolution of the computed tomography module is insufficient, the X-ray image sensor provides the solution with its megapixel resolution and its 12-bit grey scale. With this, voxel resolutions up to an edge length of below 50 µm are possible. The X-ray image sensor also provides a comfortable and fast solution for Laue diagrams.

With the HD accessory consisting of a high-resolution collimator and counter tube holder with narrow gaps and new software, the angular resolution of the goniometer increases to 0.01°. Bragg spectra with a 4-fold resolution are possible with this.
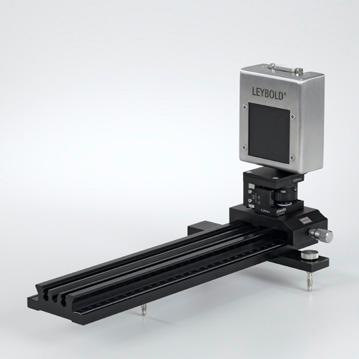
The gold tube is the Leybold tube with the highest intensity. It is particularly suitable for capturing X-ray images, Laue diagrams or computed tomograms. In addition to the Tungsten tube, it is also the only tube whose Bragg spectra consist of L-lines.

LARGE DISPLAY
INTUITIVE OPERATION
ONE TOUCH
ONE FUNCTION
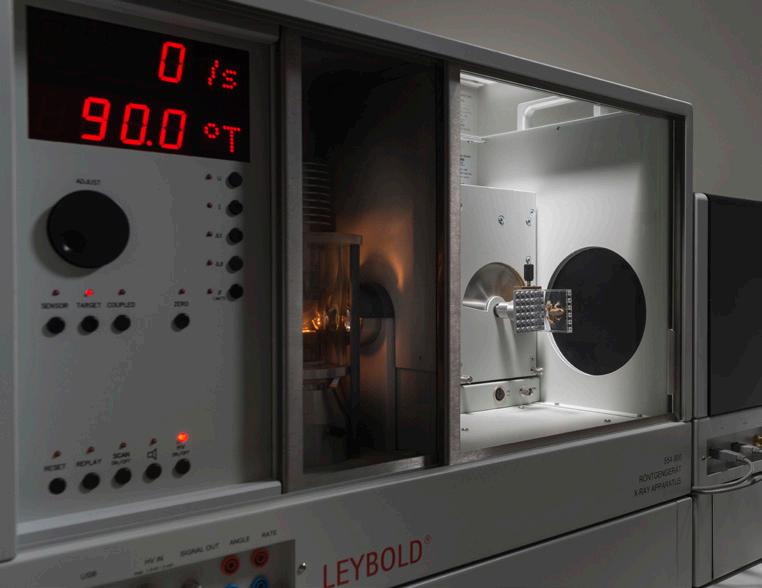
All parameters on the X-ray apparatus can be set manually. There is an immediately reachable button for every function and an integrated control knob for changing the selected parameter. The current settings are shown on a large and clearly visible digital display. Of course, the setting of the X-ray apparatus can be performed in parallel using a connected PC.
The centrepiece of any X-ray apparatus is its X-ray tube. It is situated behind a large lead glass pane in clear view so that it can be observed when in service. The higher the anode current, the more brightly the cathode illuminates.
The large drawer with an apparatus-shaped inlay ensures tidiness. With this, you can safely store up to two more tubes and lots of accessories including crystals, filters and sets of targets.
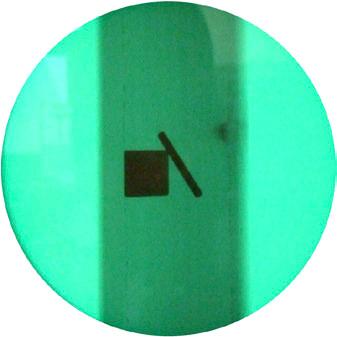
The large luminescent screen for radiation experiments is already integrated in the X-ray basic apparatus as standard.
With the HD accessory, Bragg spectra with a 4-fold resolution are possible due to its narrow gap and the high-resolution goniometer. As a result, not only are the lines 4 times sharper, but the contrast between the sharp line and the broad continuum increases accordingly.
The LEYBOLD X-ray tubes are available with the anode materials copper, iron, silver, molybdenum, tungsten and gold. In this way, you will always be able to use the tube that is best suited to the particular application.
Changing an X-ray tube is like changing a light bulb, except that the former is not screwed in. In comparison to the light bulb, an X-ray tube merely requires a high-voltage connection, which accelerates the electrons towards the anode.

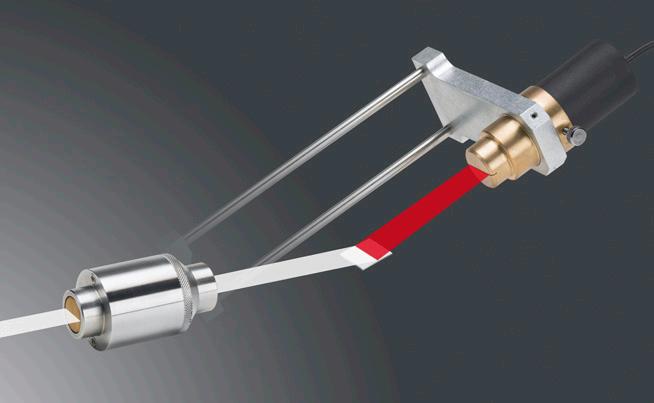

The LEYBOLD X-ray apparatus has been checked by the PTB (PhysicalTechnical Federal Agency) and approved by the BfS (Federal Office for Radiation Protection) in accordance with the specifications of the current Röntgenverordnung (German X-ray Ordinance).
The doors are automatically locked and monitored by two independent safety circuits. These safety circuits are independently checked before switching on the high voltage.
Similarly, after switching off the high voltage, the doors are only automatically unlocked when the high voltage has dropped and no more X-ray radiation can occur.
This automatically processing safety monitoring enables a simple and safe operation with just a press of a button.
The X-ray apparatus is controlled in selectable angular steps to capture the X-ray images. The back projection process is visualised in realtime either in two or three dimensions during the capture. Both sectional images and 3D images of the unfinished 3D object are therefore available with all viewing tools (rotate, zoom, transparency effects, intersections, stereoscopic display, illumination similar to the Heidelberg Ray Tracing model). With each additional angular step, the back projection process advances to completion of the 3D object. This procedure and the completed object can be stereoscopically observed with a pair of red-cyan 3D glasses.


image
and 3D view of this
Despite the low X-ray energy of a school X-ray apparatus of 35 keV, computed tomograms of various objects with a good resolution can be captured as well as qualitatively and quantitatively analysed. The focus is on the didactic preparation of the capturing process and the analysis.
When selecting the image sensor, you have the choice between the FUNDAMENTAL and the PROFESSIONAL variant. The FUNDAMENTAL variant impresses with its simple didactic structure: The X-ray image is visible on the fluorescent screen and is captured by a camera and transmitted to the PC. With the PROFESSIONAL solution, this intermediate image is generated in the sensor and is digitalised with a much higher resolution.


after addition of
Please also visit our CT page on the internet at www.ld-didactic.de/ct
The practical LEGO adapter enables the simple object detection of the most diverse objects. Here, a frog is rotating in front of the high-resolution X-ray image sensor.


Target group
Computed tomogram of the same frog captured, once with the computed tomography module and once with the X-ray image sensor from the Computed Tomography Pro package.
COMPUTED TOMOGRAPHY MODULE
COMPUTED TOMOGRAPHY PRO
Grammar school / College College / University
X-ray image can be observed on fluorescent screen cannot be observed in the image sensor
Image sensor light-sensitive camera CMOS image sensor
Resolution
Sensitivity
Pixels x 480 Pixels
Pixels x 1000 Pixels
(including for Laue diagrams) max. object

Various objects for a computed tomography, which can simply be attached to the LEGO adapter.


High-resolution computed tomograms of a frog and a snail shell. 3D image also stereoscopic for red-cyan glasses (right).

The CT algorithm seen in action: The images show the same sectional image of a LEGO brick after the back projection from 1, 4, 15, 45, 90 and 360 angles.

Ionisation and Dosimetry
(cf. Page 20)
Radiation and Radiography
(cf. Page 22)

Depending on their atomic number, chemical elements show various fluorescent lines with which they can be identified.
Detection and effect of X-ray radiation x
Determination of the dose rate (X-ray dosimetry) x
Shielding of X-ray radiation x
Blackening of films using X-ray radiation x Basic principles of digital X-ray images x x
Determination of attenuation coefficients x x
Resolution power of an X-ray image x x
Effect of high voltage on contrast and intensity of the X-ray image x x
Impact of beam hardening of X-ray radiation on the X-ray image x
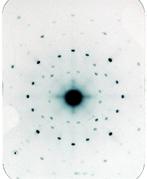
Laue diagrams of NaCl and LiF on X-ray film (100 min. exposure time).


Bragg Reflection (cf. Page 24)
Laue diagrams (cf. Page 26)
X-ray energy spectra (cf. Page 28)
Computed tomography (cf. Pages 8 and 30)
Digital Laue diagrams of NaCl and LiF (1 min. exposure time).


Au spectrum with LiF monocrystal shown with similar angles. The red spectrum was captured using the HD accessory.
Diffraction on various monocrystals (spectrum of bremsstrahlung) x x
Comparison of spectra of various anode materials x x
Effect of a filter on the energy spectrum of an X-ray tube (hardening of X-ray radiation) x x
Fine structure analysis of anode materials x
Moseley's law + Rydberg constants (via K-edges) x
Duane-Hunt law x
Investigating the lattice structure of substances with an X-ray film x
Debye-Scherrer diagrams x
Quick investigation of crystal lattices through digital Laue diagrams x
Analysis of digital Laue diagrams x
Comparison of energy spectra of various anode materials x
K- and L-line fluorescence of metals x
Non-destructive investigation of the chemical composition of objects (X-ray fluorescence analysis) x
Moseley's law + Rydberg constants (X-ray fluorescence analysis) x
Compton effect x
Capture and display of a CT scan x x
Development of the 3D reconstruction and the 2D sectional images for the CT x x
Visualisation of the CT algorithm x x
Resolution power of a CT scan x x
Radiation hardening and other artefacts x x
Measurement of absorption coefficients x x
Impact of beam hardening of X-ray radiation on the CT x
Radiation and Radiography (cf. Page 22)
X-ray energy spectra (cf. Page 28)
Computed tomography (cf. Pages 8 and 30)
Capture of X-ray images of plants and animals x x
Resolution power of an X-ray image
X-ray fluorescence analysis in environmental analyses
Detection of chemical elements in foods
Capture and display of a CT scan
Development of the 3D reconstruction and the 2D sectional images for the CT
Visualisation of the CT algorithm
Resolution power of a CT scan
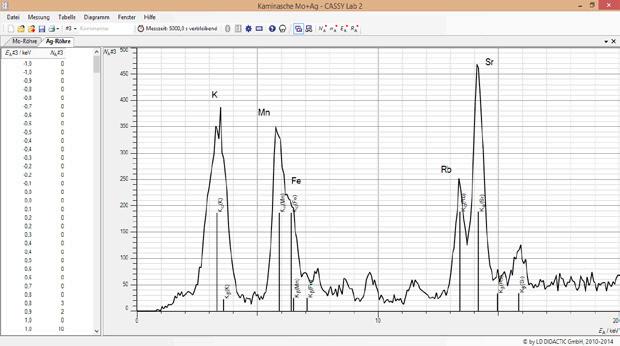

X-ray fluorescence analysis of dietary supplementsin this case, zinc tablets.

X-ray fluorescence analysis of chimney ash. In the course of its life, the beech wood has not only enriched potassium and manganese, but also considerable amounts of rubidium and strontium.

Various objects for a computed tomography, which can simply be attached to the LEGO adapter.

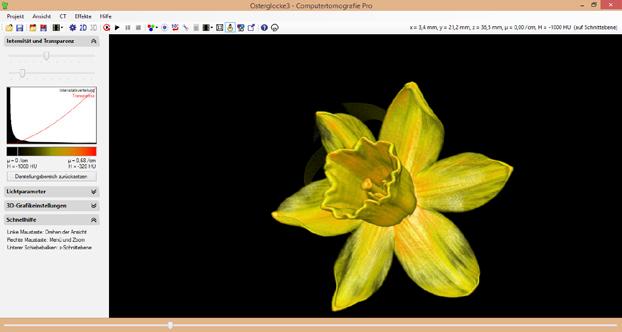

3D image of the computed tomogram of a daffodil.
The physalis in 3D view (left). The correct spatial impression is only created in the stereoscopic image with red-cyan glasses (right).

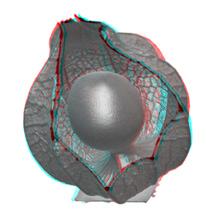
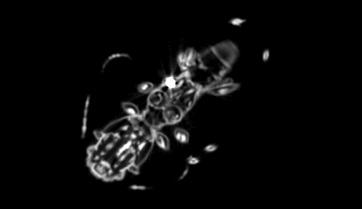
3D image of the computed tomogram of a dried beetle on a cork. The thickness of the exoskeleton of the beetle can be measured in the sectional image. The thickness is around 100 µm.

Ionisation and Dosimetry (cf. Page 20)
Radiation and Radiography (cf. Page 22)
Detection and effect of X-ray radiation x
Determination of the dose rate (X-ray dosimetry) x
Shielding of X-ray radiation x
Blackening of films using X-ray radiation
Basic principles of digital X-ray images x
Capture of X-ray images of plants and animals
Determination of attenuation coefficients x
Use of contrast agents in the blood vessel model
Measurement and orientation of objects (implant) on the X-ray image
Resolution power of an X-ray image
Effect of high voltage and current on contrast and intensity of the X-ray image
Impact of beam hardening of X-ray radiation on the X-ray image
Bragg Reflection (cf. Page 24)
Computed tomography (cf. Pages 8 and 30)
Effect of a filter on the energy spectrum of an X-ray tube (hardening of X-ray radiation) x
Capture and display of a CT scan
Development of the 3D reconstruction and the 2D sectional images for the CT
Visualisation of the CT algorithm
Resolution power of a CT scan
Radiation hardening and other artefacts
Determination of Hounsfield units
Impact of beam hardening of X-ray radiation on the CT


The effect of contrast agents is demonstrated with the blood vessel model.
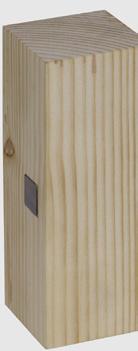

The nail in the implant model can be located and measured using X-ray images of different sides.
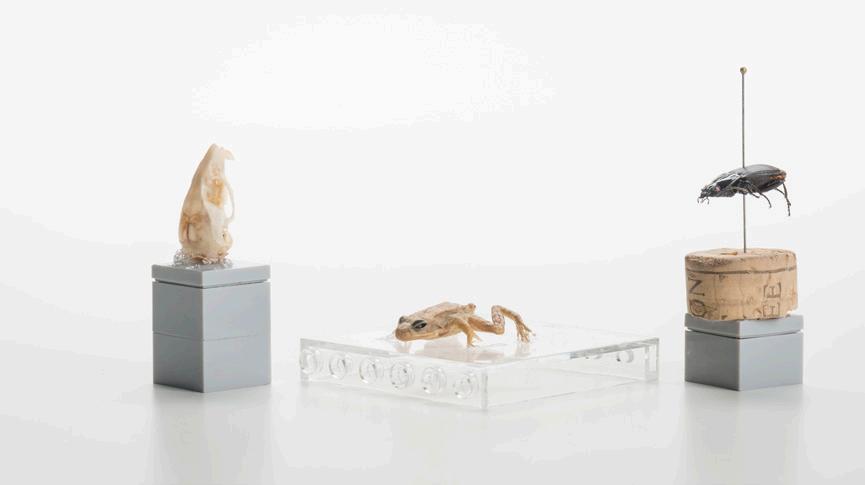
Various objects for a computed tomography, which can simply be attached to the LEGO adapter.

Two X-ray spectra of the same gold tube. The black curve shows the unfiltered X-ray radiation. For the red curve, 1 mm of aluminium was brought into the beam projection. The high-energy portion (hard) of the X-ray radiation outweighs the filter significantly.


Aluminium plates of various sizes generate different densities in the X-ray image. The exponential attenuation law is confirmed by the proportions.
In the comparison of both X-ray images of a chicken's leg, captured with a soft (far left) and hardened X-ray radiation (left), the hard X-ray radiation shows a higher contrast in the bone area.
X-ray exposure of a bone fracture (right).

The CT algorithm seen in action: The images each show the same sectional image of a LEGO brick after the back projection from 1, 4, 15, 45, 90 and 360 angles.

3D view of the computed tomogram of a mouse's skull. In the sectional image of the mouse's skull, a bony nose structure of below 100 µm can be measured.

Bragg Reflection (cf. Page 24)
Laue diagrams (cf. Page 26)
X-ray energy spectra (cf. Page 28)
Diffraction on various monocrystals (spectrum of bremsstrahlung) x
Comparison of spectra of various anode materials x
Investigating the lattice structure of substances with an X-ray film x
Debye-Scherrer diagrams x
Quick investigation of crystal lattices through digital Laue diagrams x
Analysis of digital Laue diagrams x
X-ray fluorescence analysis in environmental analyses x
Detection of chemical elements in foods x
Comparison of energy spectra of various anode materials x
K- and L-line fluorescence of metals x
Non-destructive investigation of the chemical composition of objects (X-ray fluorescence analysis) x
Geological rock analysis x
Mineral deposit examination x

Bragg spectrum of a Cu tube with an NaCl monocrystal. The K-lines are displayed up to the third diffraction order.


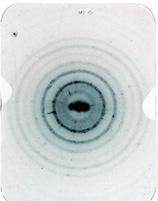
Laue diagrams of NaCl and LiF on X-ray film (100 min. exposure time).
Debye-Scherrer exposure of NaCl on X-ray film (500 min. exposure time).

Digital Laue diagrams of NaCl and LiF (1 min. exposure time).

Various objects for a non-destructive material analysis using X-ray fluorescence.
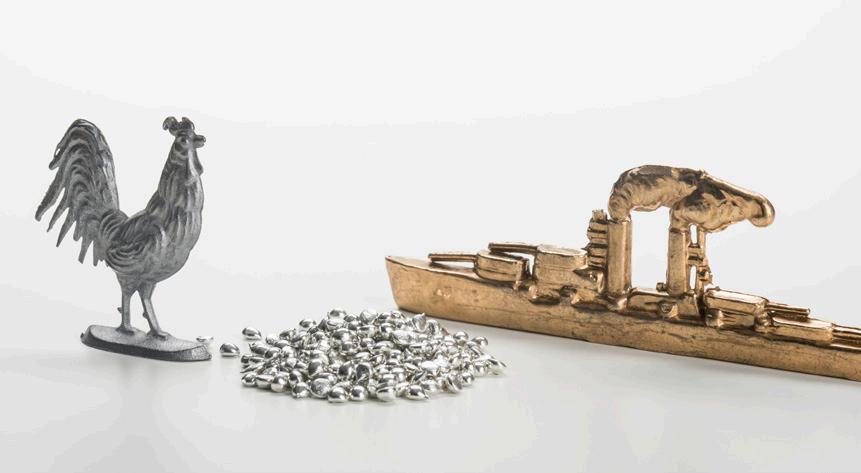


X-ray fluorescence spectra of the minerals tourmaline and galenite, whose components iron and lead are immediately visible through the captured K- and L-lines.

Depending on their atomic number, chemical elements show various fluorescent lines with which they can be identified.


Why is there titanium and iron in a banknote?
Radiation and Radiography (cf. Page 24)
X-ray energy spectra (cf. Page 28)
Basic principles of digital X-ray images x
Quality control, point of fracture, material defects on the X-ray image x x
Determination of attenuation coefficients x
Measurement and orientation of objects (implant) on the X-ray image x x
Resolution power of an X-ray image x x
Effect of high voltage and current on contrast and intensity of the X-ray image x x
K- and L-line fluorescence of metals x
Non-destructive investigation of the chemical composition of objects (X-ray fluorescence analysis) x
Examination of coloured plastics x
Computed tomography (cf. Pages 8 and 30)
Capture and display of a CT scan x x
Development of the 3D reconstruction and the 2D sectional images for the CT x x
Visualisation of the CT algorithm x x
Resolution power of a CT scan x x


Titanium dioxide dyes many banknotes white and can be quickly detected by the characteristic K-lines of the titanium.

Depending on their atomic number, chemical elements show various fluorescent lines with which they can be identified.


It can be seen from the different minima of the line profile in the X-ray image that the leads of the pencils are multicoloured. The different dyestuffs of the leads absorb at different strengths.

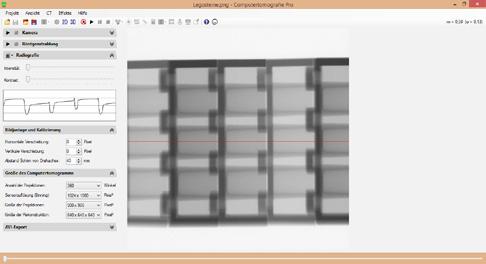
In the X-ray image of the Lego bricks, not only can the different dyestuffs be identified but also the course of the material thickness of the conical cylinder.

Various interesting objects for a computed tomography, which can simply be attached to the LEGO adapter.


The internal structure of a circuit board in the X-ray image.

The X-ray image of a sample made of different metals of the same thickness. For metals with a higher atomic number or attenuation coefficient µ, the intensity can no longer be measured in the radioscopy (right-hand side of the line profile).

The resolution power is sufficient for measuring the grooves in the sectional image of the fragment of a gramophone record, although they are only around 100 µm deep.

Due to the relatively low X-ray energies of up to 35 kV, plastics are particularly suitable for the computed tomography - this is a small part of a children's toy. Other formed components can also be easily examined and measured at inaccessible points.

X-ray radiation ionises atoms and molecules in the irradiated matter. It makes no difference whether this is an X-ray film or just air.
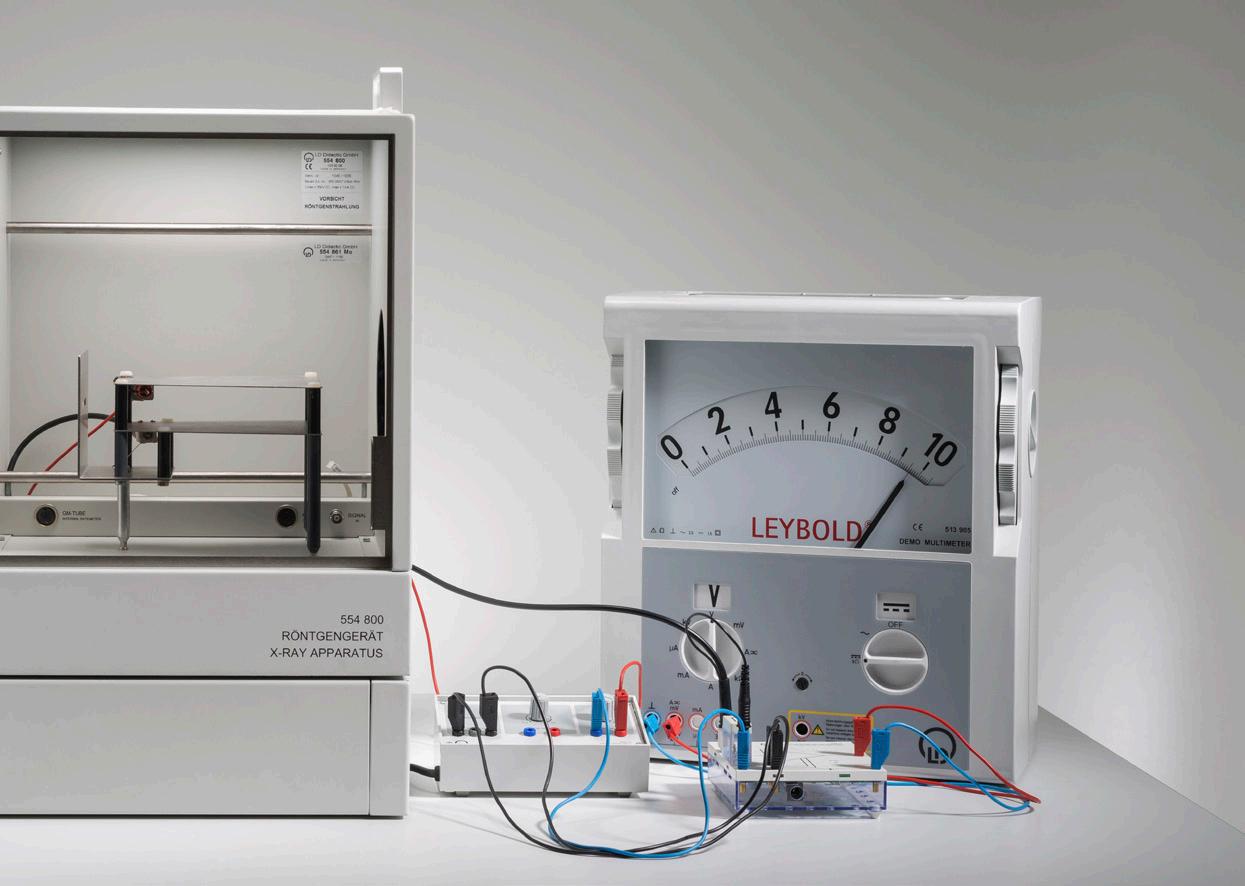
The degree of ionisation of the air by the ionisation current is measured in a plate capacitor. This ionisation current in nA can be directly converted into the dose rate in Sv/h.

Typical equipment
554 800 X-ray apparatus
554 861 X-ray tube, Mo
554 840 Plate capacitor, X-ray
522 27 Power supply, 450 V
532 14 Electrometer amplifier
577 02 Resistor, 1 G Ohm
575 24 Screened cable, BNC/4 mm
Voltmeters
X-ray radiation ionises air between both capacitor plates. If voltage is applied, an ionisation current flows through the capacitor, which is amplified and measured.
EXPERIMENTS
Detection and effect of X-ray radiation
Determination of the dose rate (X-ray dosimetry) x x
Shielding of X-ray radiation

The nail in the implant model can be located and measured using X-ray images of different sides.

The effect of contrast agents is demonstrated with the blood vessel model.
EXPERIMENTS
Blackening of films using X-ray radiation x x
Basic principles of digital X-ray images x x x
Capture of X-ray images of plants and animals x x
Quality control, points of fracture, material defects on the X-ray image x
Use of contrast agents in the blood vessel model x
Typical equipment
554 800 X-ray apparatus
554 866 X-ray tube, Au
554 821 Computed tomography module
*recommended for quantitative evaluations
Measurement and orientation of objects (implant) on the X-ray image x x
Resolution power of an X-ray image x x x x
Effect of high voltage on contrast and intensity of the X-ray image x x x


The X-ray image is measured directly on the computer. In this way, the size of the nail in the implant model can be determined.

Thanks to the X-ray image sensor, the image resolution and number of grey scales satisfy the highest demands.
Basic principles of digital X-ray images x x x
Capture of X-ray images of plants and animals x x
Quality control, point of fracture, material defects on the X-ray image x
Determination of attenuation coefficients x x
Use of contrast agents in the blood vessel model x
Measurement and orientation of objects (implant) on the X-ray image x x
Resolution power of an X-ray image x x x x
554
Effect of high voltage on contrast and intensity of the X-ray image x x x
Impact of beam hardening of X-ray radiation on the X-ray image x x
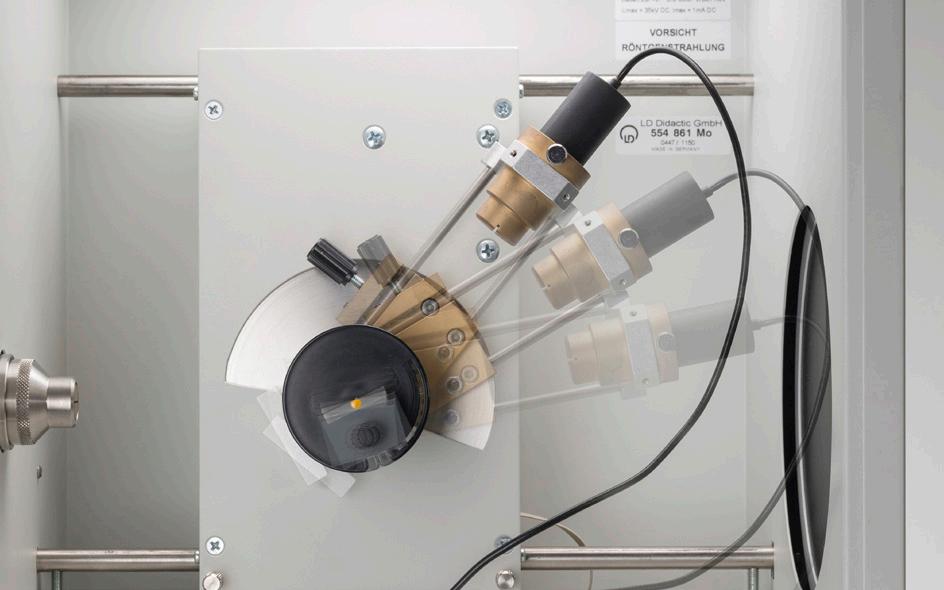
For the recording of a Bragg spectrum, a monocrystal is rotated in a collimated X-ray beam. The X-ray apparatus records the count rate for each double incidence angle behind the monocrystal automatically.

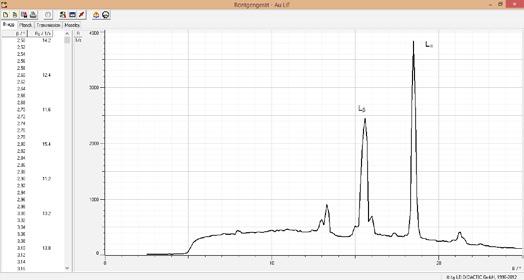
Au spectrum with LiF monocrystal in normal resolution.
EXPERIMENTS
Diffraction on various monocrystals (spectrum of bremsstrahlung) x x
Typical equipment
554 801 X-ray apparatus, Mo, complete
559 01 End-window counter
554 77 LiF crystal for Bragg reflection
Comparison of spectra of various anode materials x x
Effect of a filter on the energy spectrum of an X-ray tube (hardening of X-ray radiation) x x
Moseley's law + Rydberg constants (via K-edges) x Duane-Hunt law x
Au spectrum with LiF monocrystal shown with similar angles. The red spectrum was captured using the HD accessory.

Typical equipment
554 801 X-ray apparatus, Mo, complete
559 01 End-window counter
554 77 LiF crystal for Bragg reflection
554 835 HD Accessory, X-ray

Au spectrum with LiF monocrystal in high resolution. The fine structure splitting of the Lα- and Lβ-line is already visible in the first order.
Diffraction on various monocrystals (spectrum of bremsstrahlung) x x
Comparison of spectra of various anode materials x x
Effect of a filter on the energy spectrum of an X-ray tube (hardening of X-ray radiation) x x
Fine structure analysis of anode materials x
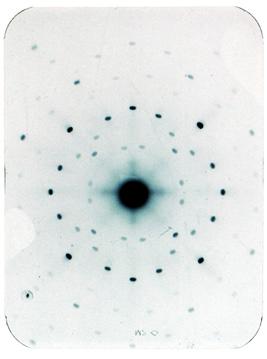
The space lattice structure of crystalline substances was first verified using Laue diagrams in 1912. To do this, a crystal is brought into a collimated X-ray beam and discrete reflexes are monitored.
The intensity of these discrete reflexes is very small. If an X-ray film is used to expose the reflexes, it requires an exposure time of around an hour and the reflexes must be measured manually after the film development (FUNDAMENTAL Experiments).
equipment
554 800 X-ray apparatus
554 861 X-ray tube, Mo
554 838 Film holder, X-ray
554 895 X-ray film
554
554
When using the X-ray image sensor, the X-ray film is not required and the reflexes can be directly detected in the computer after an exposure time of just around a minute and precisely measured using the mouse (PROFESSIONAL Experiments).


The X-ray image sensor is sensitive enough to expose the discrete reflexes behind a crystal. The zero order is shielded by a metal plate.

Fast creation of a Laue diagram with the X-ray image sensor.

Digital Laue diagram of NaCl (1 min. exposure time) with angle and distance measurement between selectable reflexes. The zero order was shielded by a metal plate.
EXPERIMENTS

The X-ray energy detector captures X-ray spectra. In this way, it can be easily determined which X-ray energies are emitted by an X-ray tube.
An important use of X-ray energy spectra is the X-ray fluorescence analysis for material examination. When irradiating the sample to be examined with X-ray photons, it emits characteristic X-ray lines, whose energy depends on the atomic number of the element of the sample material.
If the sample constitutes a chemical compound or a mixture, its X-ray fluorescence spectrum is also more complex. In a good approximation, X-ray fluorescence spectra of a chemical compound are an overlay of the spectra of its components.

The primary X-ray beam of the X-ray tube hits the target to be examined. Here, the characteristic X-ray beam of the fluorescent sample is measured below an angle of 90° and recorded as an X-ray fluorescence spectrum using CASSY.


The X-ray fluorescence spectrum of galvanised sheet steel.
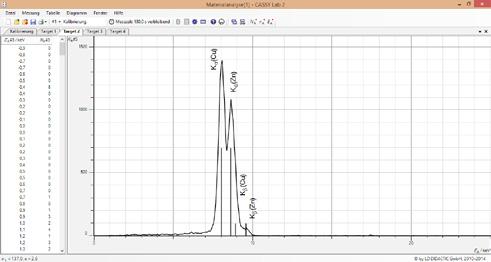
The X-ray fluorescence spectrum shows the components of brass CuZn36. By comparing the intensities of pure copper and zinc, the mass fractions can also be determined (in this case 64% Cu and 36% Zn).
EXPERIMENTS
X-ray fluorescence analysis in environmental analyses
Detection of chemical elements in foods
Comparison of energy spectra of various anode materials
K- and L-line fluorescence of metals
Non-destructive investigation of the chemical composition of objects (X-ray fluorescence analysis)
Moseley's law + Rydberg constants (X-ray fluorescence analysis)
Compton effect
Geological rock analysis
Mineral deposit examination
Examination of coloured plastics
Typical equipment
554 801 X-ray apparatus, Mo, complete
559 938 X-ray energy detector
554 844 Set of targets for K-line fluorescence
554 846 Set of targets for L-line fluorescence
554 848 Set of target alloys
501 02 BNC cable, 1 m
524 058 MCA box CASSY
Whilst the frog rotates in front of the fluorescent screen, its X-ray images are visible fluorescent screen. The camera in the computed tomography module captures these
When selecting the image sensor you have the choice between the FUNDAMENTAL and the PROFESSIONAL variant.
The FUNDAMENTAL variant impresses with its didactic setup: The X-ray image is visible on the fluorescent screen and is captured by a camera and transmitted to the PC. In the PROFESSIONAL solution, this intermediate image is formed in the sensor and is digitalised with a much higher resolution.
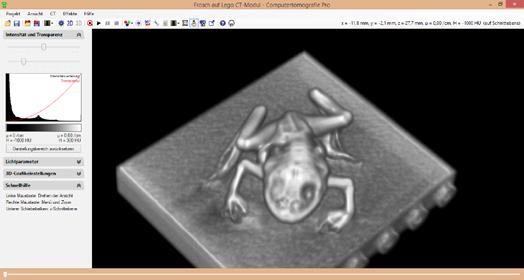
The small frog has an overall length of 3.5 cm and has been reconstructed here by the computed tomography module with a resolution of around 0.3 mm.
Typical equipment
554 800 X-ray apparatus
554 831 Goniometer
554 866 X-ray tube, Au
554 821 Computed tomography module
554 825 LEGO adapter
visible behind the these visible images.

Whilst the frog rotates in front of the X-ray image sensor, the software assesses the computed tomogram in real time.


The same frog recorded by the X-ray image sensor shows in the 3D view much more details due to the high resolution of up to 0.05 mm. Of course, this also applies to 2D sectional images.
Capture and display of a CT scan x x x x
Development of the 3D reconstruction and the 2D sectional images for the CT x x x x
Typical equipment
554 800 X-ray apparatus
554 831 Goniometer
554 866 X-ray tube, Au
554 820P Computed Tomography Pro package
Visualisation of the CT algorithm x x x x
Resolution power of a CT scan x x x x
Radiation hardening and other artefacts x x
Measurement of absorption coefficients x
Determination of Hounsfield units x
Impact of beam hardening of X-ray radiation on the CT x x

GERMANY:
LD DIDACTIC GmbH
Leyboldstr. 1
D‐50354 Hürth
Tel.: +49 2233 604 0
Fax: +49 2233 604 222
Email: info@ld‐didactic.de www.ld‐didactic.com

