Urban Growth Plan: Public Engagement Update


We’re a nonprofit working to improve the civic health of Lexington-Fayette County, Kentucky.
We help residents understand local government, help local government connect with residents, and are building a community in which everyone can meaningfully participate in the decisions that shape where they live.

• High quality and accessible public engagement benefits residents, stakeholders, and decision makers
• Layering what we know from the Comprehensive Plan onto the sites recommended for inclusion
Project Staf
• Kit Anderson, Deputy Director
• Richard Young, Executive Director
• Haley Wartell, Communications and Social Media
• Megan Gulla, Director of Programs

Phase 1 (40%)
• Urban Growth Kickof Meeting
• Urban Growth Website
• Deep dive into OTT Data
• Urban Growth Survey 1
• Tabling and in-person engagement

Phase 2 (35%)
• Design Workshop
• Focus Groups
• Urban Growth Festival
• Maintenance of Urban Growth Website
Phase 3 (20%)
• Final Urban Growth Survey
• Open House event
• Urban Growth Festival
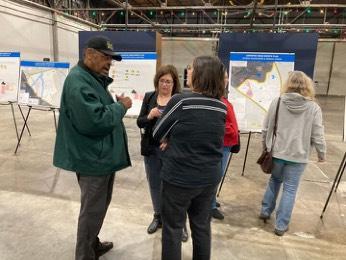

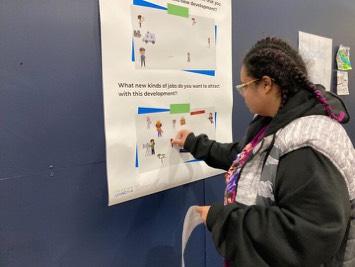
UGP Kickof at Greyline Station
December 6, 2023
Estimated residents engaged: 90
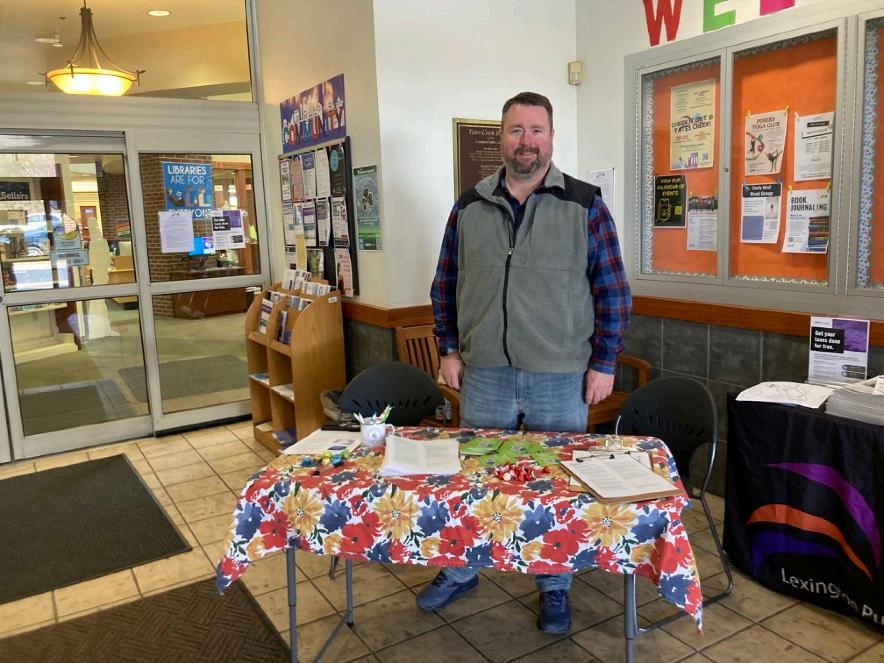
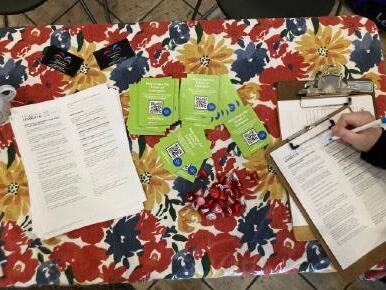
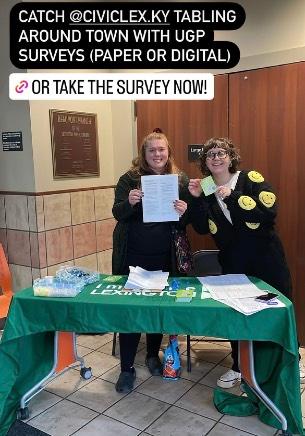
Tabling at Beaumont Library, Tates Creek Library, Whitaker YMCA, North Lexington YMCA, Julietta Market
February and March, 2024
Estimated residents engaged: 300


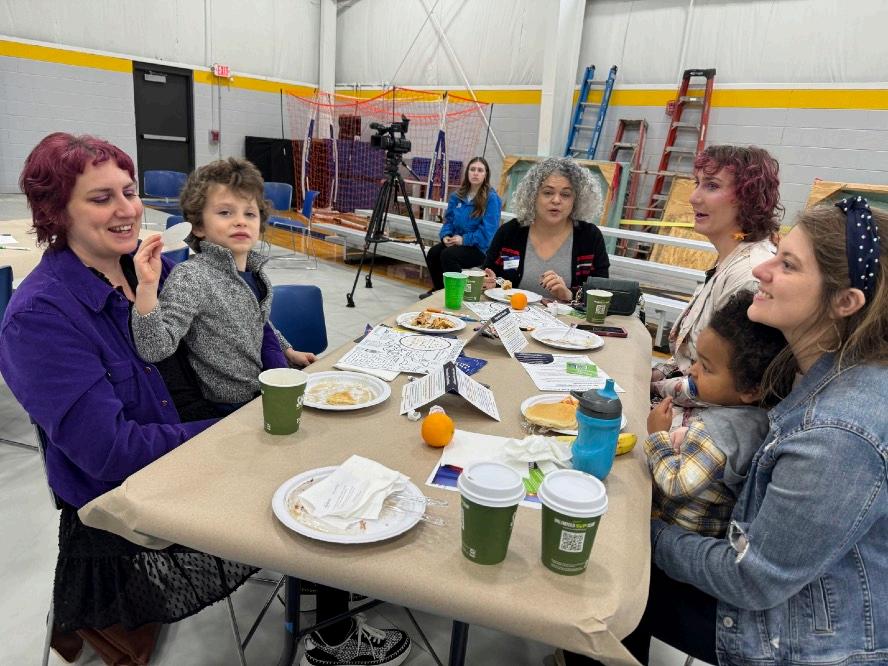
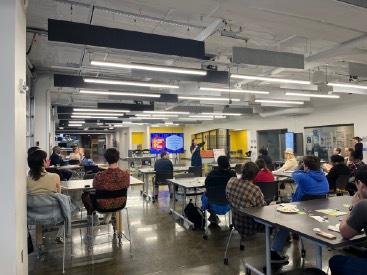
Other in-person events hosted by CivicLex, including City Budget Price is Right at UK and Civic Breakfast at Woodhill Community Center February and March, 2024
Estimated residents engaged: 160
• The original On the Table data was organized by 31 commonly occurring topics (“codes”)
• Two key concessions of initial codes: no value judgements, not a detailed understanding
• In partnership with the University of Kentucky’s College of Community and Leadership Development, we investigated the top seven most popular codes to get a more detailed, value based understanding of what respondents were saying inside these codes
• Supervised by Kit Anderson, Dr. Karen Rignall, and Dr. Nicole Brezeale
Please note: The following slides contain preliminary findings


• 1,789 responses
• Codes:
1. More bike lanes: bike lanes, trails, and paths
2. More sidewalks: walking paths and trails
3. Better bike lanes: more protected, better maintained, more accessible/connected, “more bikeability”
4. More walkable destinations: businesses, parks, neighborhoods, “more walkability”
5. Better sidewalks: safer, better maintained, more ADA accessible, with landscaping

More Walkable Destinations
Against/
• 1,744 responses
• Codes:
1. Bus: Improve or increase bus service, adding stops, adding routes, more consistency
2. Bikeability: add, connect, improve bike lanes and trails
3. Walkability: adding, connecting sidewalks and walking paths
4. Decrease trafc/ car reliance: less trafc, less carcentric developments, more trafc management
5. Other Improvements: trolley, light rail, scooters
6. Against public transportation: reduce/remove public transportation, don’t add more

Other improvements (trolley, light rail, scooters, etc)
Against public transportation
*Public Transportation analysis completed by Krasi Staykov, OTT Microgrant Recipient
• 1,263 responses
• Codes:
1. More things to do: activities, events, festivals, entertainment
2. Commerce: retail, restaurants, nightlife, local businesses
3. Quality of life: not included in other codes, includes noise, “vice”, general health
4. Sense of community: sense of connection, belonging, neighborhood pride
5. Arts/Culture: events and venues for arts and culture, concerts, public art, museums
6. Basic needs: grocery stores, laundromats, healthcare, childcare
7. Afordable: activities and amenities that are low cost or free
8. Diversity/Equity/Unity: increasing or celebrating diversity or equity, bringing people together
9. No improvements: satisfied with current level of amenities and quality of life

Preliminary Findings
More things to do
Commerce
Afordable Arts/Culture
Diversity/ Equity/ Unity Sense of Community
Basic Needs Quality of Life
No improvements
• 1,263 responses
• Codes
1. Waste management: recycling, composting, litter
2. Renewable energy: solar panels, electric vehicles, other “clean energy sources”
3. General environmental protection, not specific to other codes
4. Air and water quality: pollution, waterway preservation, harmful materials
5. Yards/lawns: pollinator friendly yards, eco friendly fertilizes, grass alternatives, gardens, native plants
6. Anti/other priorities: against environmental protection or specifically state need to prioritize other things

Preliminary Findings
Anti/
• 1,188 responses
• Codes:
1. Increase density: more denser, development including infill, up not out, missing middle, smart growth
2. Decrease density/ development: concerns about overdevelopment, including overcrowding, historic preservation, safety of density
3. Environmental Sustainability: eco friendly development, LEED certification, environmental context
4. Development for Equity: specifically increase equity, decrease segregation, increase accessibility

• 1,188 responses
• Codes:
1. More Parks/Greenspaces: more parks, more green spaces, requesting a specific new type of park
2. Protect existing parks/greenspaces: maintain existing PGS
3. Better parks/ greenspaces: better maintained, safer, open more, better infrastructure, adding features
4. Expansion parks/ greenspaces: specifically requesting PGS in newly developed areas
5. Anti/other priorities: against PGS, specifically reference prioritizing other things

Preliminary Findings
More Parks/Greenspaces
Better Parks/Greenspaces
Protect Existing Parks/Greenspaces
Activation of Parks/Greenspace
Expansion Parks/Greenspaces
Anti/Other Priorities
• 874 responses
• Codes:
1. More afordable housing: more afordable housing for renting or owning, lower cost housing, more afordable units, “housing is too expensive”
2. Solutions/ideas: specific policy suggestions or ideas to increase afordable housing
3. Better afordable housing: improving the location, condition, accessibility, or safety of existing afordable housing
4. Contributing factors: other topics that make housing more difcult (wages, cost of living, childcare)
5. Anti/other priorities: against afordable housing, explicitly state to prioritize other things

Preliminary Findings
Contributing Factors
Solutions/Ideas
Anti/ Other Priorities
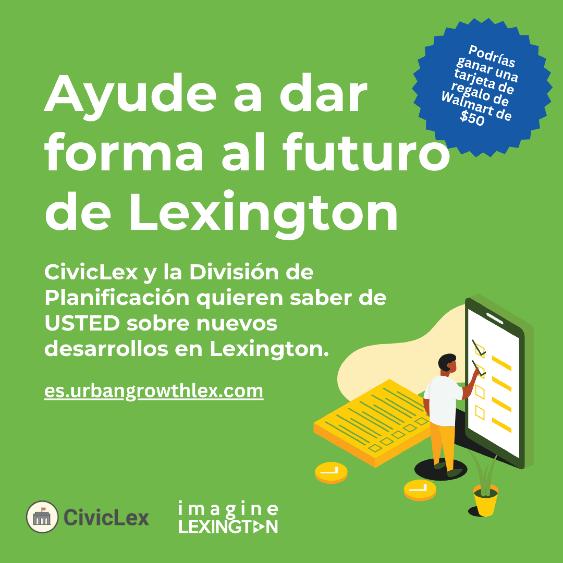
• Opened late November 2023, 984 responses*
• Designed to add clarity, prioritization to public input from Comprehensive Plan
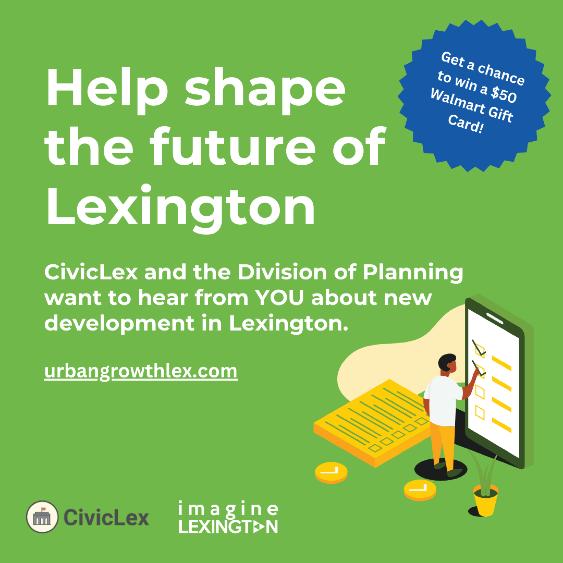
• Includes information about Urban Growth Plan, prize drawing
• Promotion methods:
• In-person engagement
• Social media
• Newsletters/mailing lists
• Flyers
• Cards
• 667 respondents gave email address to receive updates about the plan

*Preliminary findings. Last updated 3/15/24



• 824 of 984 answered open response
• Other common priorities:
• Housing afordability + distribution
• Environmental conservation
• Trafc congestion
• Aesthetics
• Trees
• Density and infill
• Transit access
• Grocery stores

• 631 of 994 answered open response
• Other common topics:
• No priorities/no other priorities
• Public transportation
• Solar energy
• Water pollution
• Erosion and watersheds
• Infill development
• Wildlife protection
• Walkability

Preliminary findings. Last updated 3/15/24
• 522 of 994 answered open response
• Other common topics:
• Small businesses
• Roads and trafc
• Transportation access
• Quality/ type of jobs
• Cost of living
• Farmland conservation

Preliminary findings. Last updated 3/15/24
• 511 of 994 answered open response
• Other common topics:
• Further elaboration on listed topics
• Trafc congestion specific to new developments
• Speeding in rural areas
• Bicycle and pedestrian safety
• Regional connectivity

Preliminary findings. Last updated 3/15/24
• 376 of 994 answered open response
• Other common topics:
• Emphasis on housing, diferent development types
• Equity as a lower concern
• Access to mental health services
• Education funding and access

Preliminary findings. Last updated 3/15/24
Age Range
Gender
17 or younger
18-34
35-54
55-74
75 or older
No response

Female
Male
Nonbinary
Other
No response
Preliminary findings. Last updated 3/15/24
Race/Ethnicity
White/Caucasian Black/African American Hispanic/Latino(a)
Asian/Pacific Islander
American Indian/Native Middle Eastern
Other
No response

