2. DYNAMICS OF CHANGE
DATE:
10/04/22 CLASS: PLAN7007 – Plan Workshop, Climate Studio Project Group: Anna Mueller, Scarlet Andrzejczak, Lizzy Geraghty
A strategically planned and managed network of targeted natural and semi-natural areas.


Created with a combination of engineered features and natural systems in low, medium, and high density locations, within the built environment. Used to strengthen the resilience of communities from climate change by managing and protecting against natural disasters such as flooding, high temperatures, and landslides..
GREEN INFRASTRUCTURE CAN HELP CINCINNATI
ITS ENVIRONMENTAL RESILIENCE

2 Regular Title1 CAN CINCINNATI BE A SUCCESSFUL CLIMATE HAVEN?RECAP - WHAT IS GREEN INFRASTRUCTURE?
FIVE WHY’S ASSIGNMENT ONE RECAP: OBJECTIVES MAINTAIN ADAPT BALANCE ATTRACT CONNECT 4. Comprehensive Environmental Guidelines 5. Expand equitable green space access 6. Conserve land for greenspaces and green infrastructure 1. Improve environmental protection infrastructure 2. Stimulate economic growth 3. Connect network of existing greenspaces
STRENGTHEN
Regular Title2.1 SOCIAL AND ENVIRONMENTAL PATTERNS IN CINCINNATI
THE 4 INDICATORS OF WHERE GREEN INFRASTRUCTURE IS NEEDED

SOCIAL NEEDS NATURAL DISASTERS


Includes: Population and Age.
Includes: Landslides and Flooding.
LAND AVAILABILITY ENVIRONMENTAL WELLNESS

Includes: Vacancy and Impervious Surfaces.
Includes: Tree Canopy, Average Temperature, and Greenspace.
3
Regular Title2.2 OUR INDICATORS & METRICS
INDICATORS DATA COLLECTEDMETRICS
A system or standard of measurement. A thing, especially a trend or fact, that indicates the state or level of something.
SOCIAL NEEDS
AGE
SURFACES
A thing, especially a trend or fact, that indicates the state or level of something
POPULATION CHANGES OVER TIME
AGE RANGE IN GIVEN AREAS
OPPORTUNITIES FOR VACANT LAND
AMOUNT OF IMPERVIOUS SURFACES
LOW, MEDIUM, & HIGH SUSCEPTABILITY
FLOOD HAZARDS, 500 YEAR FLOOD, 100
YEAR FLOOD, WITHIN FLOODWAY
CANOPY
AMOUNT OF TREE CANOPY
AMOUNT OF GREENSPACE
AVERAGE ANNUAL TEMPERATURE
4
LAND AVAILABILITY DISASTER MITIGATION ENVIRONMENTAL WELLNESS POPULATION
VACANCY IMPERVIOUS
LANDSLIDE FLOODING TREE
GREENSPACE TEMPERATURE
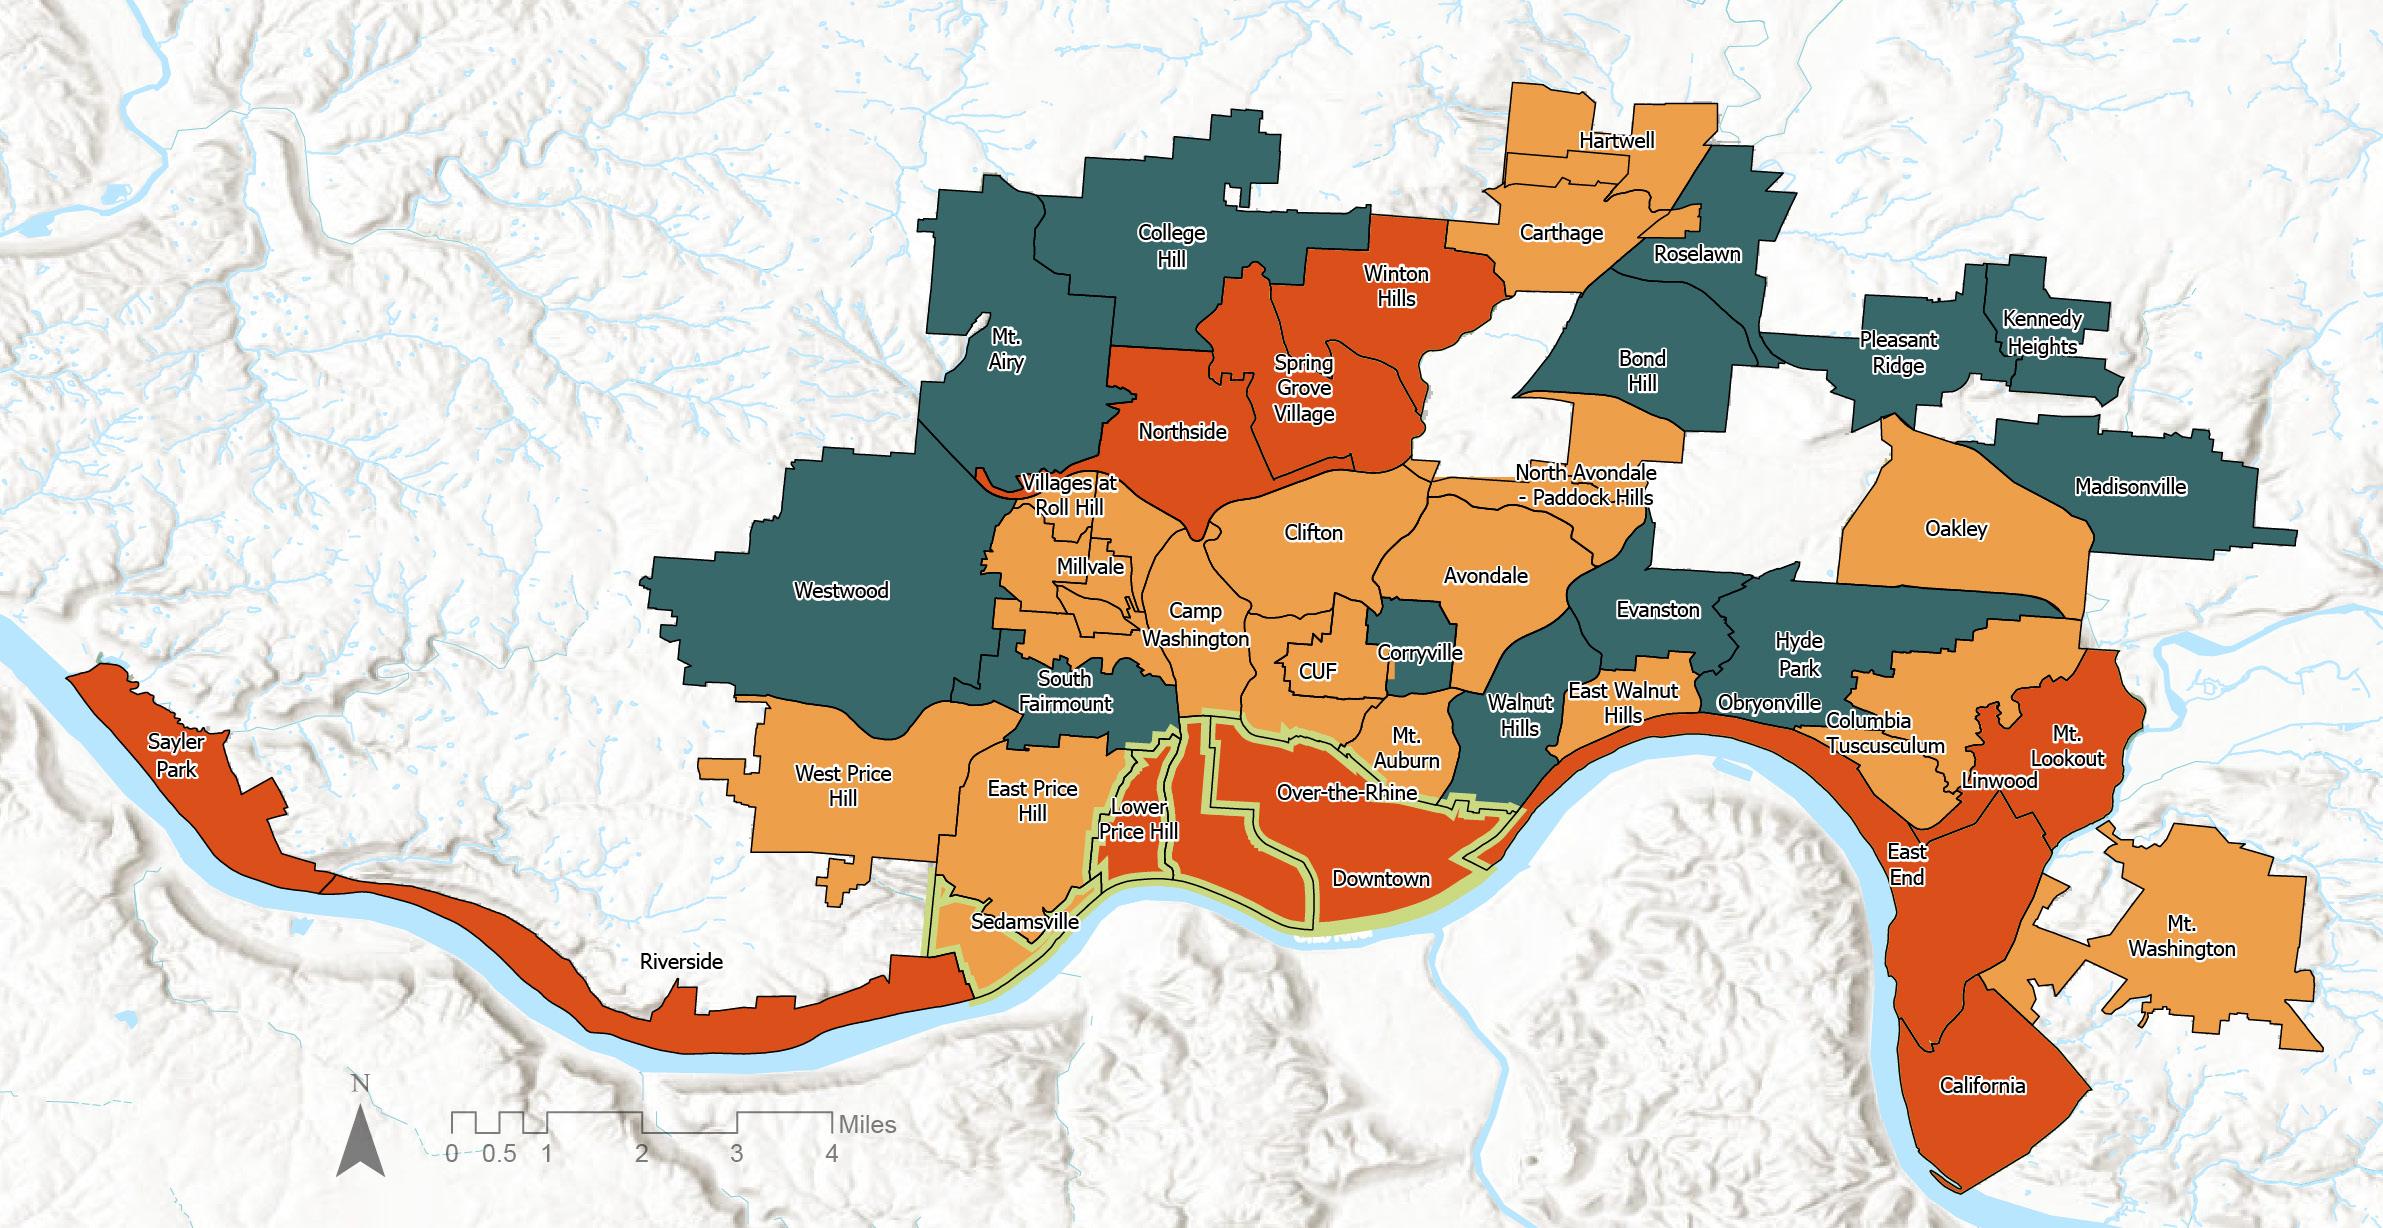
Regular Title2.3 OUR SYSTEM FOR CATEGORIZING PLACE TYPOLOGIES
3 GENERAL CATEGORIES & 1 CATEGORY OUTLIER
Based on Social Needs, Disaster Mitigation, Land Availability, & Environmental Wellness
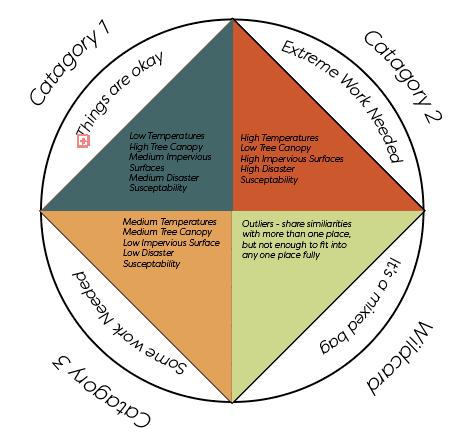
5
6 The population is steadily growing, the main age range is in all of the neighborhoods represented is 18-64. Regular Title2.4 CINCINNATI DEMOGRAPHICS TAKEAWAY(S) POPULATION 1950 - 2022 0 500,000 1,000,000 1,500,000 2,000,000 1950 1665 1980 1996 2011 2022 2,000,000 1,500,000 1,000,000 500,000 0 01 02 03 04 05 06 07 08 09 01 00 East P rice Hill West Pri ce H ill Sedams ville West End OTR Do wntown Pendleto n Colu mbia Tus culum Mt. Look out Mt Ada ms Age Trend s 65+ 4 AGE RANGE 65+ 18-64 Under 18 POPULATION TRENDS IN CINCINNATI AND AGE VULNERABILITY IN SELECTED NEIGHBORHOODS
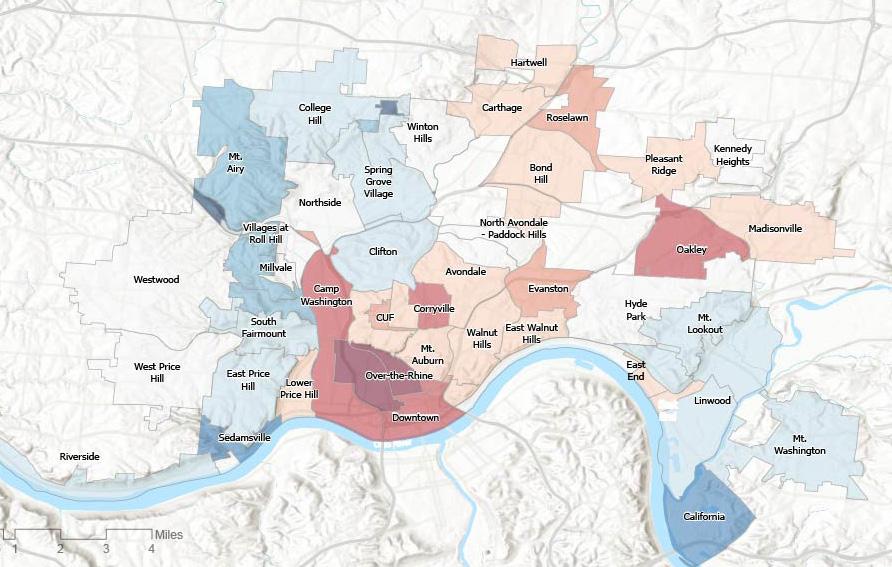
Regular Title2.5 PROJECTED TRENDS
WHAT WE KNOW
• Temperatures, landslides, flooding are on the rise
• Population has grown 200% since 1950
• If population trends continue, project at least a 3% increase residents per year
• With in-migration, we can project population to increase by 5% per year
Population & Density Map by neighborhood
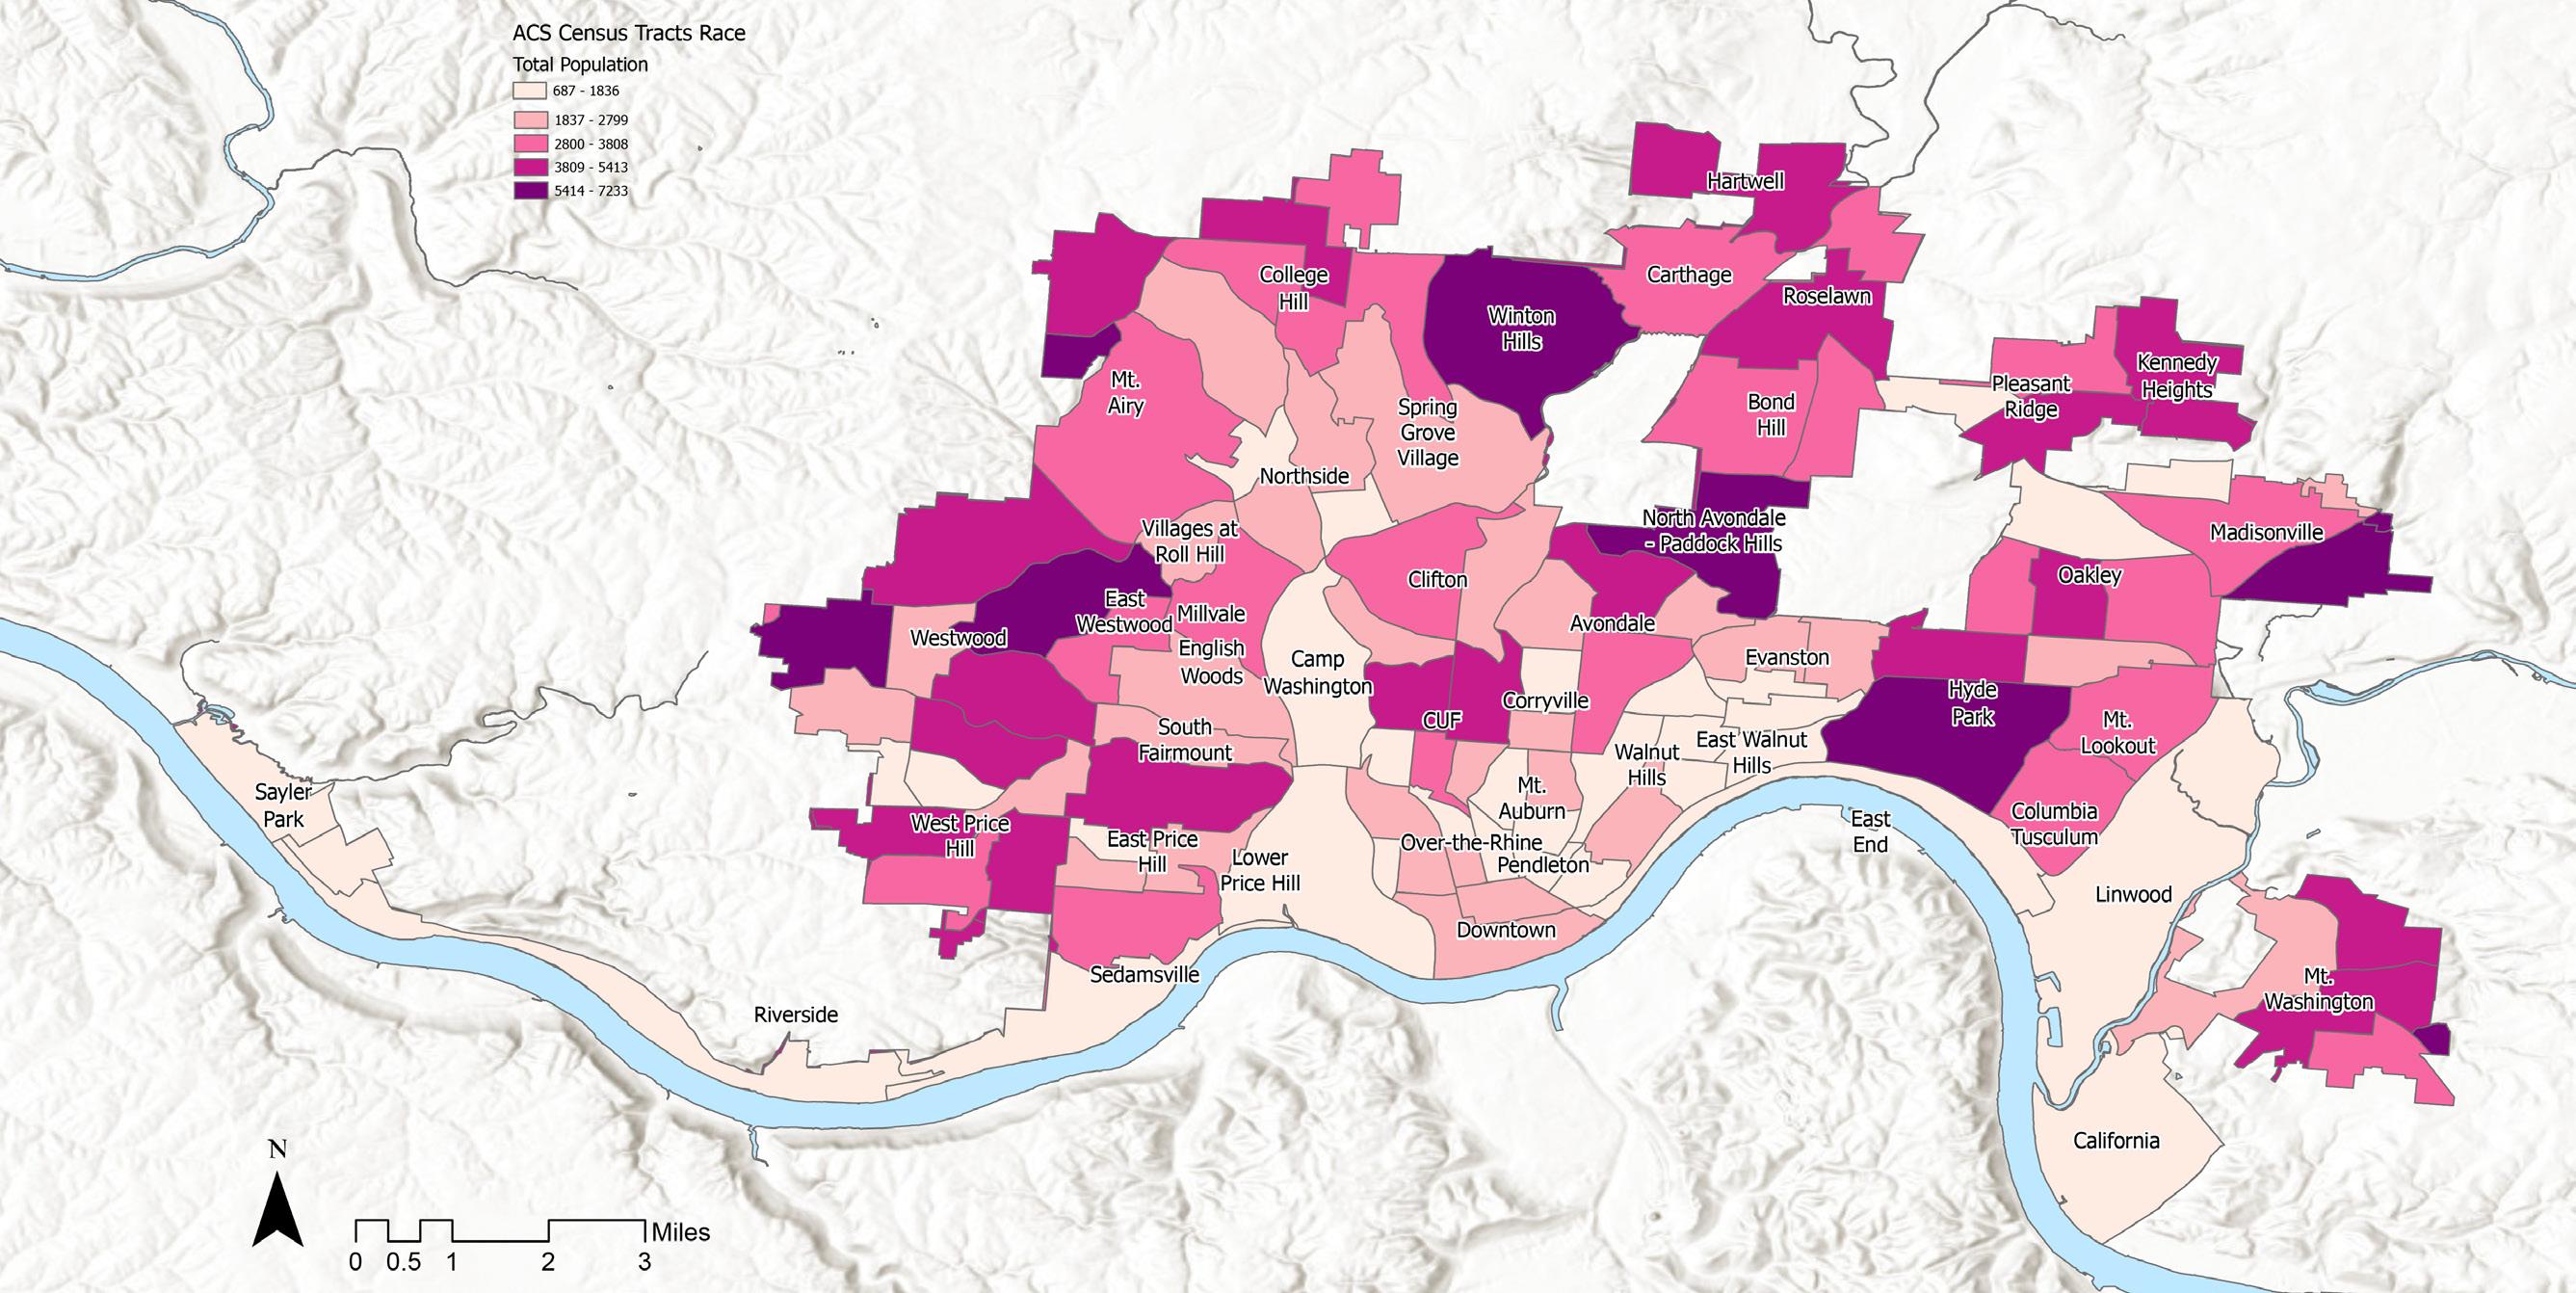
7
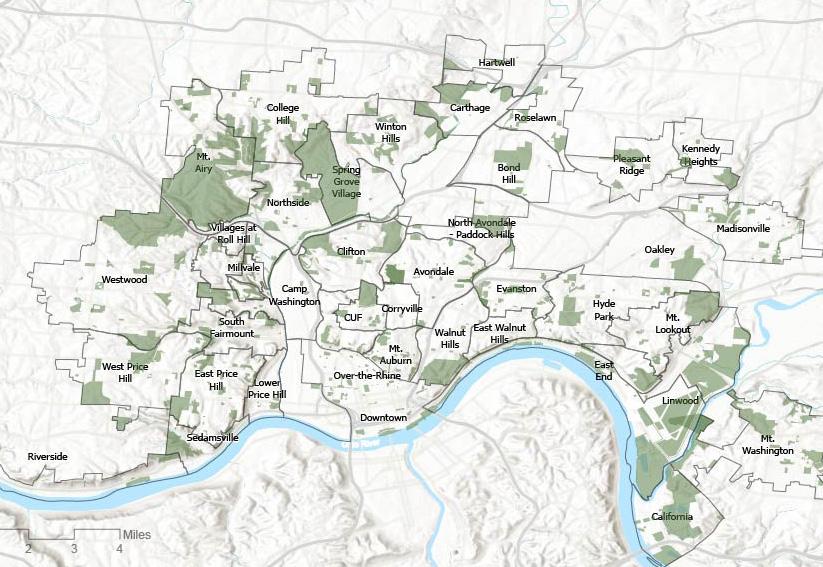
Regular Title2.6 LAND AVAILABILITY STUDIES
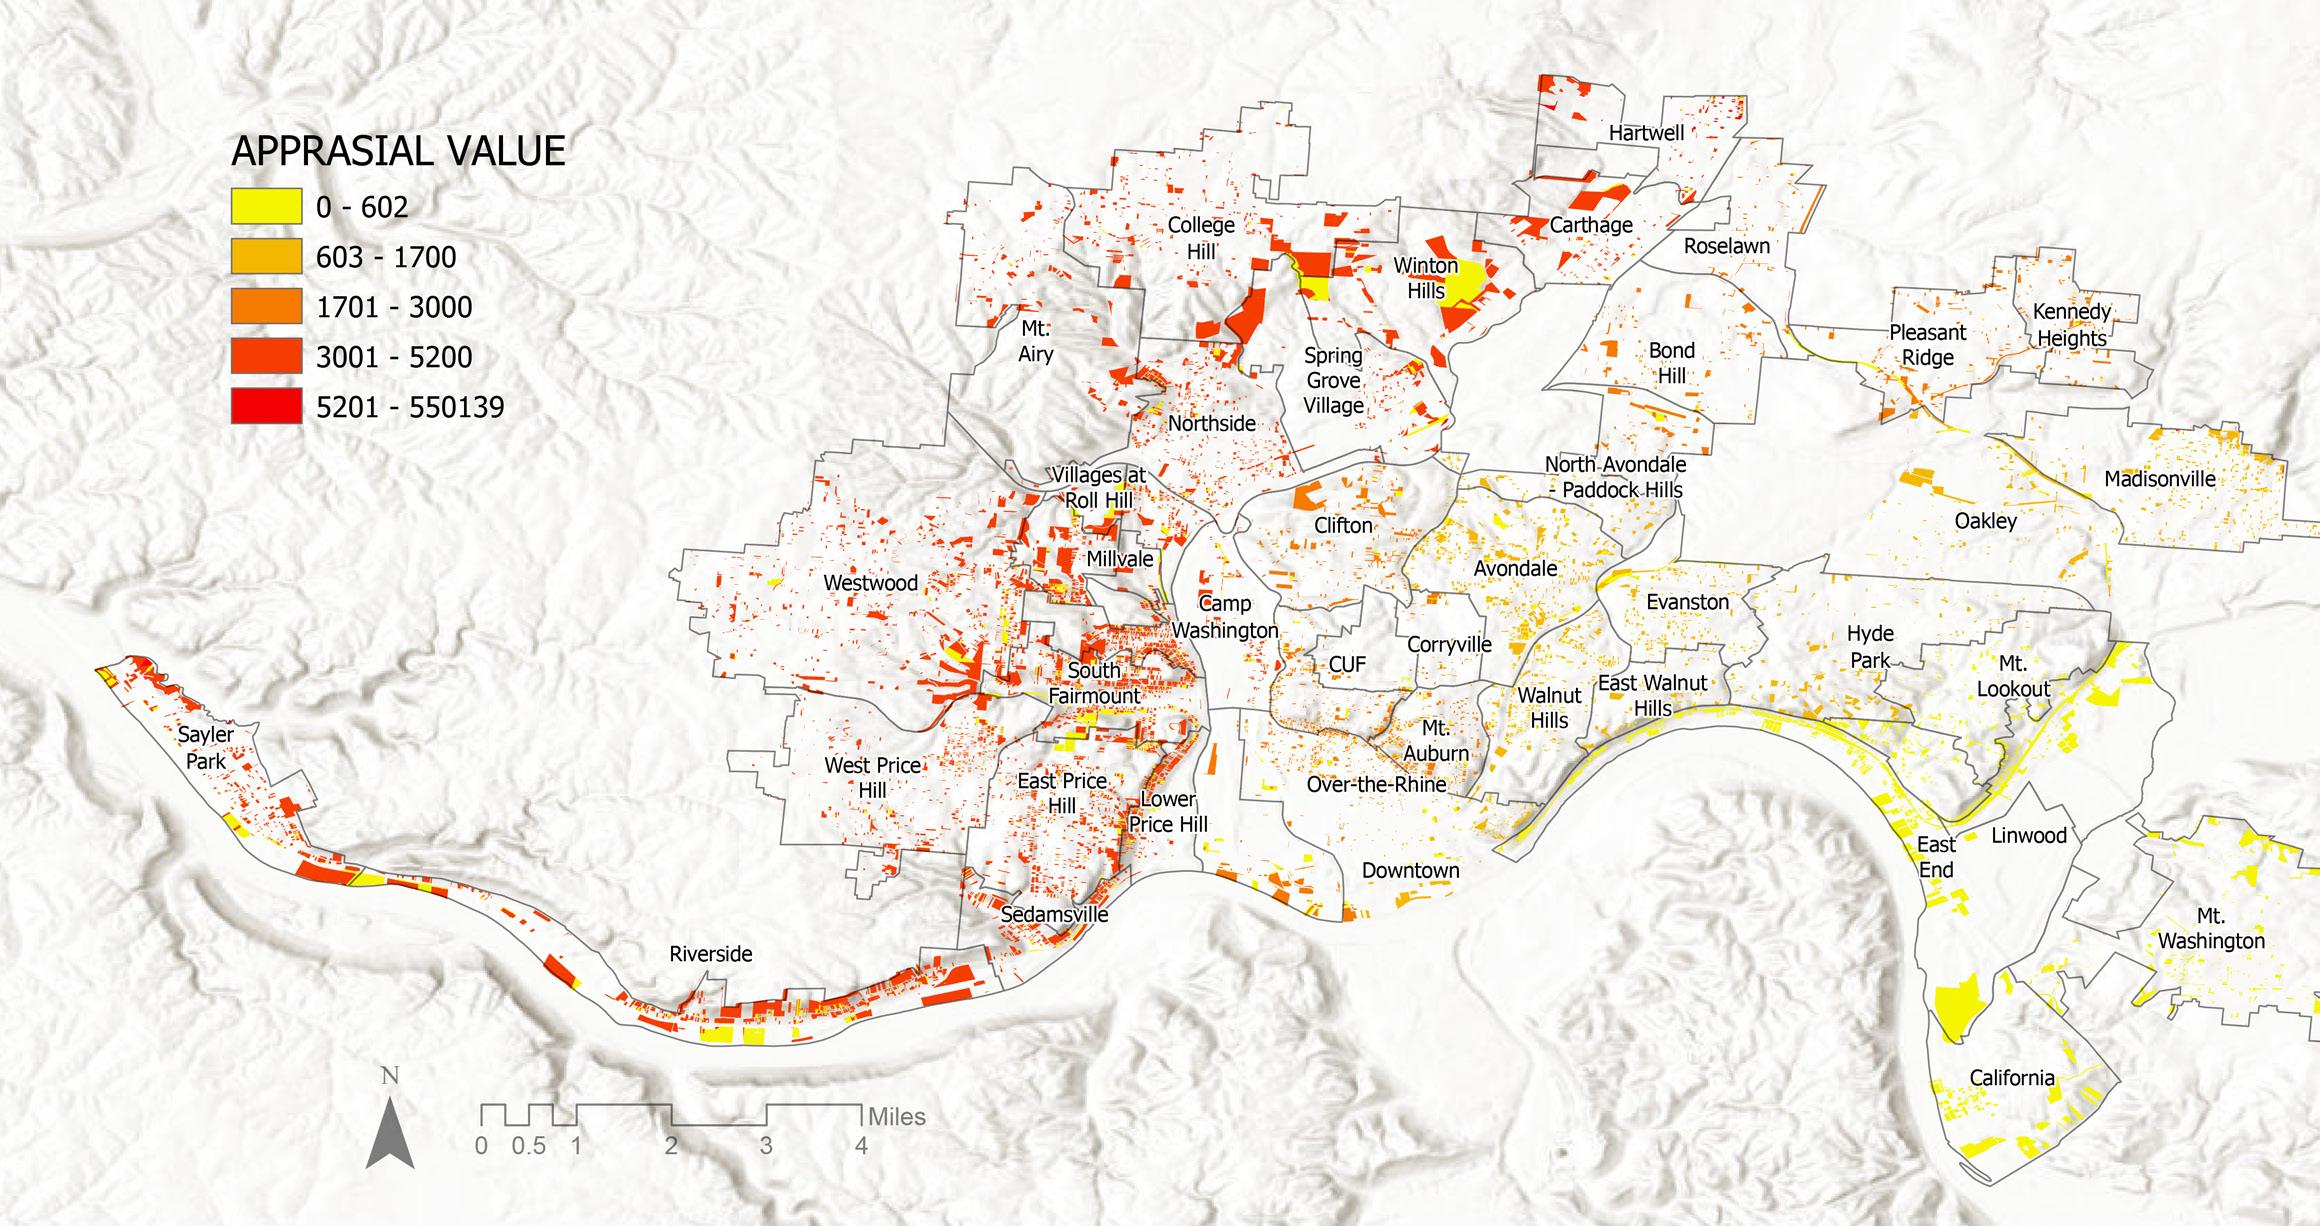
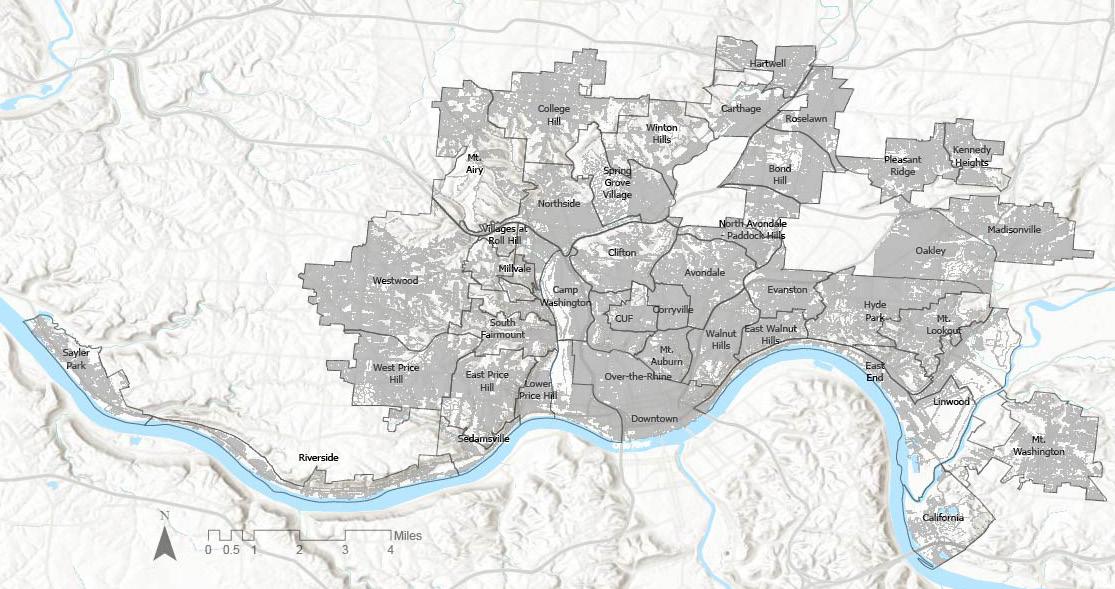
8
GREEN INFRASTRUCTURE PLACEMENT OPPORTUNITIES VACANCIES IMPERVIOUS SERVICES
Regular Title2.7 NATURAL DISASTER SUSCEPTIBILITY STUDIES
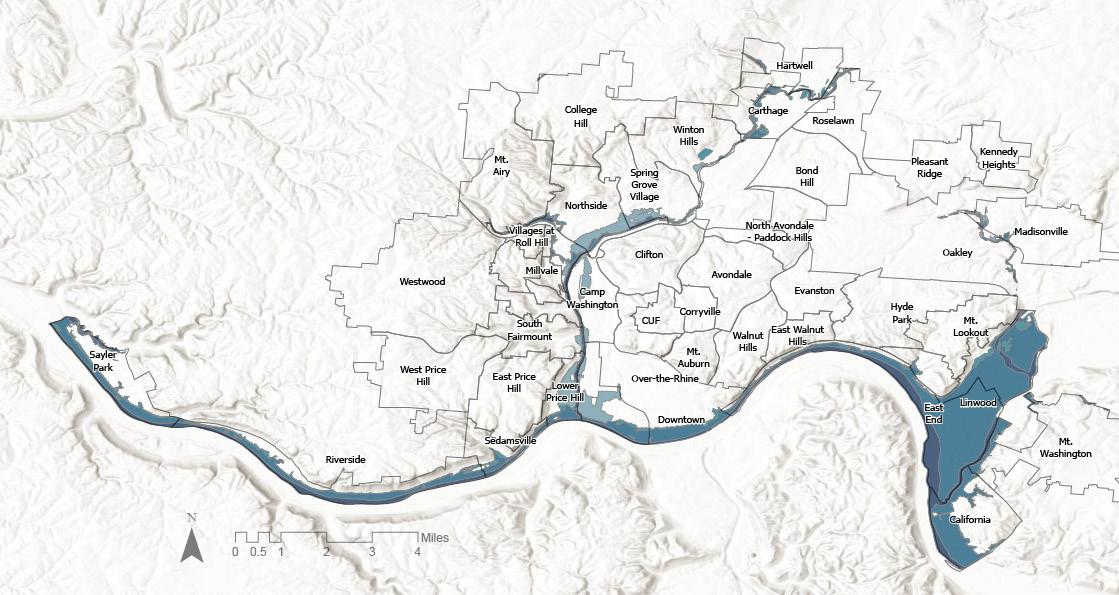
9
SUSCEPTIBLE DISASTER AREAS FLOODING LANDSLIDES
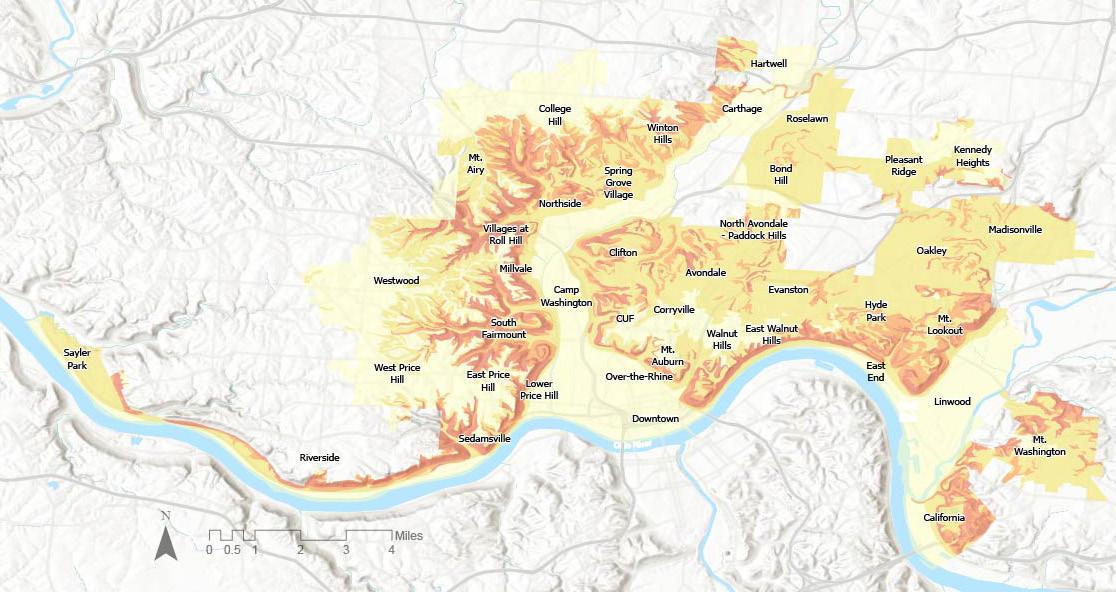
Regular Title2.8 ENVIRONMENTAL WELLNESS STUDIES
HEALTH OF THE
DUE TO SURROUNDING
AVERAGE TEMPERATURES GREENSPACES TREE CANOPY
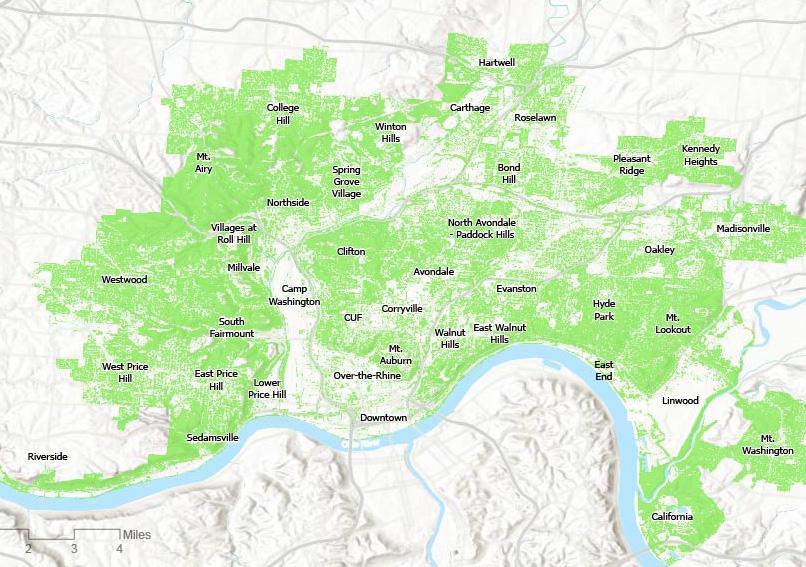
TAKEAWAY
All three of these diagrams show the systematic relationship between the overall health of the natural environment compared to its constraints.
10
THE
ENVIRONMENT AND COMMUNITIES
CONDITIONS
Regular
11
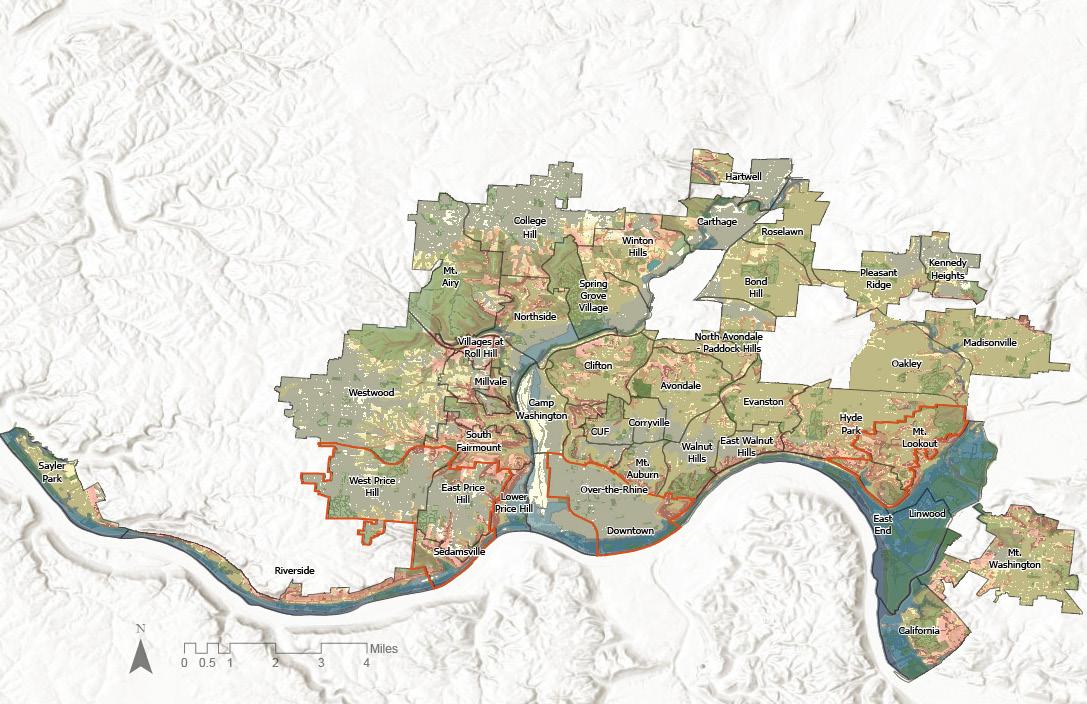
Title2.9 OUR SELECTED PLACES 3 REPRESENTATIVE AREAS OF ALL CINCINNATI NEIGHBORHOODS 1 2 3
Legend

Landslide Suscept.
Landslide Suscept.


Landslide Suscept.


High Landslide
FLOODING
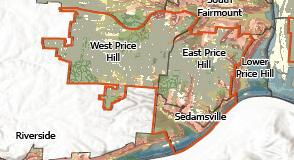
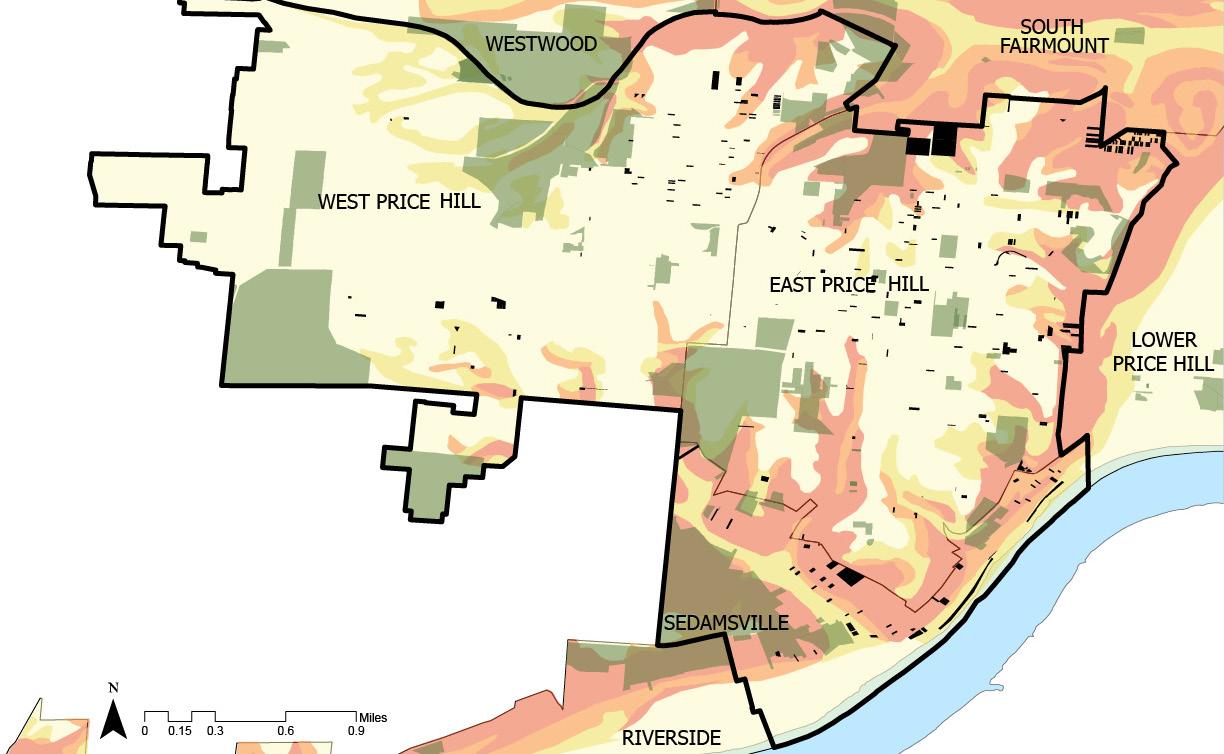
12 Regular Title3.1 PLACE ONE WEST PRICE HILL, EAST PRICE HILL, SEDAMSVILLE Main Greenspace include: Rapid Run Park, Mt Echo Park, St. Joseph Cemetery (Old and New), Near Lick Run Greenway MORE INFORMATION REGIONAL PROFILE Minimal Flood Hazard Reduced Flood Risk due to Levee 500 year flood 100 year flood Within Floodway Low Susceptabilty Medium Susceptability High Susceptability Extremely High LANDSLIDES
• Landslides • Vacancy • Lack of Greenspace Connectivity MAIN CONCERNS ENVIRONMENTAL LAND USAGE DEMOGRAPHIC BREAKDOWN 28% 33% 4.6K SQMI 43% 35K GREENSPACE IMPERVIOUS SURFACE TREE CANOPY AGE VUNERABILITY DENSITY INCOME
Low
Med
High
Extremely
Suscept. Vacancies Greenspaces River Region Boundary
MORE INFORMATION

MAIN CONCERNS
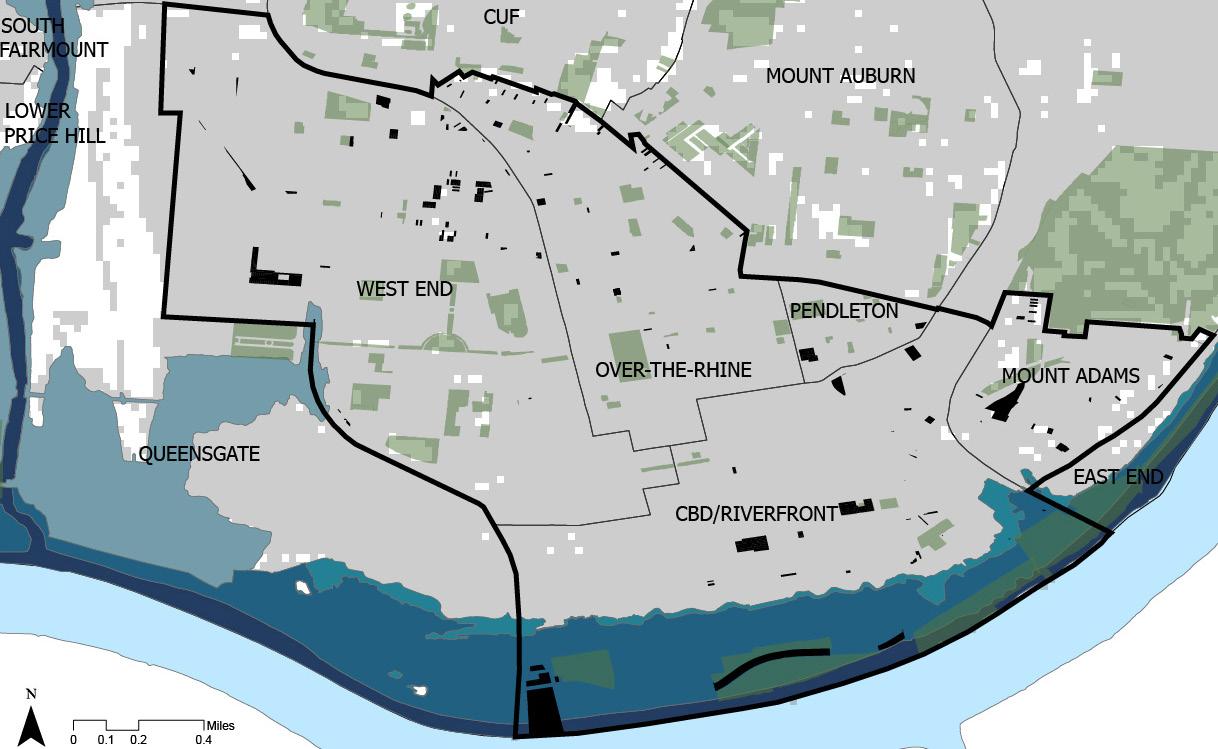
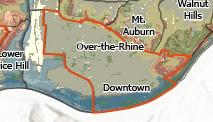
13 Regular Title3.2 PLACE TWO DOWNTOWN, OTR, PENDLETON, MT. ADAMS & WEST END REGIONAL PROFILE Minimal Flood Hazard Reduced Flood Risk due to Levee 500 year flood 100 year flood Within Floodway Low Susceptabilty Medium Susceptability High Susceptability Extremely High LANDSLIDES FLOODING ENVIRONMENTAL LAND USAGE DEMOGRAPHIC BREAKDOWN 18% 76% 9% 80K GREENSPACE IMPERVIOUS SURFACE TREE CANOPY AGE VUNERABILITY DENSITY INCOME 8.0K SQMI Main Greenspace include: Washington Park, Ziegler Park, Sawyer Point Park, Lytle Park, Filo Field, Laurel Playground, Queensgate Playfield, Garfield Park, Smale Riverfront Park
• Flooding • Impervious Surfaces • Vacancy • Lack of Greenspace • High Temperatures
Legend Low Flooding Suscept. Med Flooding Suscept. High Flooding Suscept. Extremely High Flooding Suscept. Vacancies Greenspaces River Region Boundary
Legend
Low Landslide
FLOODING
MORE INFORMATION
MAIN CONCERNS
and
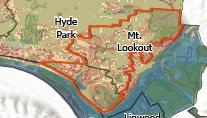
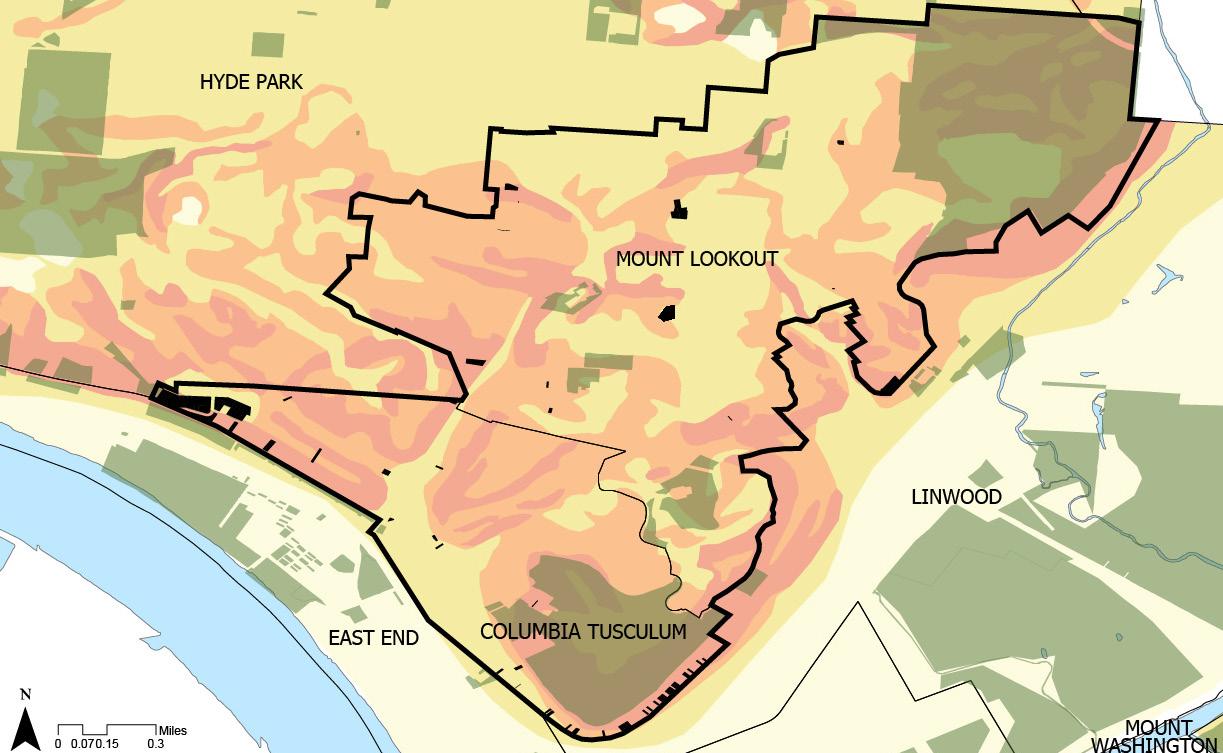
14 RegularPLACETitleTHREE3.3 COLUMBIA TUSCULUM, MT. LOOKOUT REGIONAL PROFILE Minimal Flood Hazard Reduced Flood Risk due to Levee 500 year flood 100 year flood Within Floodway Low Susceptabilty Medium Susceptability High Susceptability Extremely High LANDSLIDES
ENVIRONMENTAL LAND USAGE DEMOGRAPHIC BREAKDOWN 24% 32% 55% 122K GREENSPACE IMPERVIOUS SURFACE TREE CANOPY AGE VUNERABILITY DENSITY INCOME 3.5K SQMI Main Greenspace include: Alms Park, Oakley Playground, East Hyde Park Commons Playground, Ault Park
• Landslides • Vacancy • Greenspace Connectivity
Access
Suscept. Med Landslide Suscept. High Landslide Suscept. Extremely High Landslide Suscept. Vacancies Greenspaces River Region Boundary
Regular Title4.1
15
GREEN INFRASTRUCTURE LAND USAGE EACH OF THE FOUR FACTORS BELOW RELATES TO GREEN INFRASTRUCTURE AND HOW MUCH OF EACH COULD BE IMPROVED TO REACH OUR DESIRED SCENARIO IN THE PLACE ONE: PLACE TWO: PLACE THREE: EFFICIENCY OF SPACE EFFICIENCY OF SPACE EFFICIENCY OF SPACE CONNECTIVITY CONNECTIVITY CONNECTIVITY CLIMATE RESILIENCE CLIMATE RESILIENCE CLIMATE RESILIENCE SMALL VS. LARGE SURFACE AREA SMALL VS. LARGE SURFACE AREA SMALL VS. LARGE SURFACE AREA
GREEN INFRAST. PROJECTS, POLICIES, EVENTS, ETC
SHELTERING FROM NATURAL DISASTERS
EVERYTHING ELSE
INFRASTRUCTURE

GREEN INFRAST. PROJECTS, POLICIES, EVENTS, ETC

SHELTERING FROM NATURAL DISASTERS

NEIGHBORHOOD VITALITY

REMAINS
SAME
SUCCESSFUL CENTRAL BUSINESS DISTRICTS
EVERYTHING ELSE
NEIGHBORHOOD VITALITY REMAINS
SAME
SUCCESSFUL CENTRAL BUSINESS DISTRICTS

RESOURCE AVAILABILITY BALANCED WITH MITIGATION EFFORTS RESOURCE AVAILABILITY BALANCED WITH MITIGATION EFFORTS


ACCESS TO GREENSPACE ACCESS TO GREENSPACE
Regular Title ? 4.2 WHAT IS THE PREFFERED SCENARIO? BEING REALISTIC WHILE ALSO PRIORITIZING GREEN INFRASTRUCTURE EVERY NEIGHBORHOOD SHOULD HAVE: • AT LEAST A 15% INCREASE OF GREEN INFRASTRUCTURE & • 5% INCREASE IN GREEN SPACE SCENARIO STATEMENT: IDEAL WORLD: REALISTIC WORLD: GREEN INFRASTRUCTURE GREEN
16
17 Regular Title4.3 WHERE DO WE WANT TO IMPROVE SPECIFICALLY? CURRENT CONDITIONS OUR IMPROVEMENT GOALS Topics Greenspaces Percentage Impervious Surfaces Average Low Temperature Average High Temperature Landslide Susceptability Flood Susceptability Vacancy Rate Tree Canopy Place 1 28 % 33 % 77 ° 84 ° 37 % 4 % 16.6 % 43 % Place 2 18 % 76 % 89 ° 92 ° 14 % 15 % 17.7 % 9 % Place 3 24 % 32 % 81 ° 82 ° 100 % 1.6 % 6.5 % 55 % Topics Greenspaces Percentage Impervious Surfaces Average Low Temperature Average High Temperature Landslide Susceptability Flood Susceptability Vacancy Rate Tree Canopy Place 1 29.4 % 28.05 % 65 ° 71 ° 31.45 % 4.6 % 14.1 % 49.5 % Place 2 18.9 % 64.6 % 75 ° 78 ° 11.9 % 17.25 % 15 % 10.4 % Place 3 25.2 % 27.2 % 68 ° 69 ° 85 % 1.84 % 5.6 % 63.3 % 15% INCREASE IN GREEN INFRASTRUCTURE IMPROVEMENT GOAL 5% INCREASE IN GREENSPACES
Regular Title4.4 METHODOLOGY
MAGNITUDE PHYSICAL CHANGES AREAS OF STUDY
The scale for magnitudes of green infrastructure implementation in each place was determined based on potential impact on types of changes, land vacancies, and efficiency/resilience. CAGIS data was used to identify magnitudes.
The types that were established guided the areas for physical change. CAGIS data, census data, landslide surveys, and flood data gathered from the National Weather Service were analyzed to find areas of concern. Based on this data, three general areas were identified. Neighborhoods with similar characteristics were grouped together.
USE OF SPACE EFFICIENCY CONNECTIVITY PRIORITY CLIMATE RESILIENCE EFFECTIVENESS
18
SURFACE AREA LARGE VS SMALL
Regular Title4.5 SOURCES
City of Cincinnati City Planning and Engagement. (2021). 2020 census data. Home - City of Cincinnati. Retrieved September 22, 2022, from https://www.cincinnati-oh.gov/planning/maps-and-data/census-demographics/2020-census-data/
Ohio History Central. (2020). Landslides. Landslides - Ohio History Central. Retrieved October 4, 2022, from https:// ohiohistorycentral.org/w/Landslides
US Department of Commerce, N. O. A. A. (2022, April 22). Ohio River History - Cincinnati. National Weather Service. Retrieved October 4, 2022, from https://www.weather.gov/iln/ohioriverhistory
Mahon, M. (2018). Cincinnati’s Craziest Weather Days. The Purple Quill. Retrieved October 4, 2022, from https://elderhsquill. org/17535/features/cincinnatis-craziest-weather-days/
CAGIS. (2022). Cincinnati Data. CAGIS. Retrieved October 4, 2022, from http://cagismaps.hamilton-co.org/cagisportal
Hamilton County Department of Planning . (2020). Planning + Development Annual Report. Hamilton County Department of Planning. Retrieved October 4, 2022, from https://www.hamiltoncountyohio.gov/government/departments/planning_and_ development
Baum, R., Johnson, A., & U.S. Geological Survey, Information Services. (1996). Overview of landslide problems, research, and mitigation, Cincinnati, Ohio, area. Overview of landslide problems, research, and mitigation, Cincinnati, Ohio, area | U.S. Geological Survey. Retrieved October 4, 2022, from https://www.usgs.gov/publications/overview-landslide-problems-research-and-mitigationcincinnati-ohio-area
19
