SUSTAINABLE SYSTEMS
TSM2001 ENVIRONMENTAL PORTFOLIO ROSE MAUNDER


SECTION 0 | A LITTLE BIT ABOUT ME
SECTION 01 | COTE CASE STUDY
SECTION 02 | IN CLASS EXERCISES
>WWR & SHADING DEVICES
>RAINWATER CALCULATIONS
>WATER FIXTURE CALCULATIONS
>ENERGY & PV ARRAY CALCULATIONS
>EMBODIED CARBON CALCULATIONS & EC3
Location: St John, US Virgin Islands
4,170 Residents ~28,000 tourists/day on a 25 mi2 island
Experience: 22 years in A.E.C.
Leisure Fun: Hiking,Sailing,&Snorkeling

“Pushing the Envelope” was the name of my first design project, and I haven’t stopped pushing it since.
We were tasked with building envelope & energy evaluation of an old residence converted to offices.
Before this project I was passionate about habitat reclamation & environmental design; through this, I became passionate about designing the built environment as an intrinsic part of the larger environmental system.
I am often out hiking or I can be found in and near the water, teaching my kids & their friends about plants, animals, habitats and environmental systems.
>Creating my own design build company.
>Designing Net-zero water and often net-zero energy in operations is the norm.
>Building community through resiliency & recovery.
>Operate my design & construction firm carbon positive, produce more electricity than the business uses to give back to the grid and design all our projects to do the same.
>Realize the island supply chain & mitigate wasteful construction practices.
>Attract like-minded clients. If not amenable to regenerative design, convert them.
>Continue to work with community partners to build a recycling center, local agriculture, watershed management and interweave the built environment with island ecology
“Don’t just make a living. Make a difference.”~Denzel Washington

https://www.caribbeanclimate.bz/blog/2018/02/20/carbon-footprint-calculator/
When you live on a rock the supply chain is more obvious, as is the waste disposal. Everything and everyone is shipped in. Islanders know which day to go food shopping because that’s the day the container arrives on island.
The Caribbean Climate Calculator reports that I contribute 7.82 tonnes of CO2 equivalents of global greenhouse gases each year.
Average Energy Use 30 kWh/day
My Energy Use 22 kWh/day
Average Water Use 200 Gal/day
My Water Use <50 Gal/day
LIFETIME CARBON CONTRIBUTION: 684 tonnes of CO2e
MY FOOTPRINT IS 7.82 TONS/YEAR
AVG FOR THE E.U. IS 6.4 TONS/YEAR
WORLDWIDE AVG IS 4.8 TON/YEAR
WORLD TARGET BY 2050 IS 0

>Transition to all renewable energy, both in our office and on all of our build sites with net positive renewable energy production. Reduction of 6.12 tonnes CO2e/year
>Phase out all propane gas in projects. Spec on-site biogas production or electrical alternatives. Reduction of 4.68 tonnes of CO2e/year.
>Complete engineering research and spec for rammed earth and minimize concrete use. Reduction of 0.2 tonnes of CO2e/yard, approx 28 tonnes CO2e/year at current project rate.
>Spec greywater reclamation and design stormwater systems to maximize on-site absorption. CO2 Sequestration through seagrass habitat preservation & restoration, cannot calculate yet.
I COULD BE OUT OF GHG DEBT

CLIENT: Chesapeake Bay Foundation
LOCATION: Lynnhaven River, Virginia Beach, VA
ARCHITECT & DESIGN TEAM: Smith Group JJR, Greg Mella
ENGINEER: Smith Group JJR
PROJECT MANAGEMENT: Skanska, Curtis Elswick
CONTRACTOR: Hourigan Construction
GREEN BUILDING CONSULTANT: Janet Harrison, Architect
SITE DESIGN & CIVIL ENGINEERING: WPL Site Design

CLIMATE: CfaTemperate/Mid-latitude Humid & Wet with Hot Summers
COMPLETED: 2015
COST: $7,300,000
The Chesapeake Bay Foundation’s core mission is to protect the threatened natural resources of the Chesapeake Bay. In order to model true sustainability, CBF charged the Smith Group with creating an architecture that can produce a positive, regenerative impact on the environment and society, so the center had to not only support itself and do no harm in its fragile environment, it also had to “give back” and regenerate the site.
As a home to CBF’s education, advocacy and restoration initiatives, the Brock Environmental Center succeeds. The Center surpasses LEED Platinum, achieving zero-net-CO2 emissions, zero waste, and Living Building Challenge certification.
LARGE DENSELY GROWING TREES PROVIDE A WINDBREAK
UNDER THE ADJACENT PARKING AREA PROVIDE HEAT & COOLING
WIND TURBINES FOR COMPLEMENTARY ELECTRICAL PRODUCTION
THE NARROWEST PART OF THE BUILDING IS EXPOSED TO THE WIND OFF THE WATER WITH A SHALLOW CURVE OPENING THE BUILDING TO THE SOUTH AND PROTECTING OUTDOOR GATHERING AREAS
OUTDOOR COVERED CLASSROOM OR GATHERING AREA
LOCAL WOOD FOR CLADDING & BEAMS
LONG CURVED RAMP TO FULLY EXPERIENCE THE EXPANSE OF THE SITE: MARSH, BAY, HABITAT

THE SOUTH FACING PV ARRAY IS TILTED TO MAXIMIZE SOLAR EXPOSURE PROVIDES ELECTRICITY
WHITE REFLECTIVE ROOFING TO REDUCE THE HEATING & COOLING NEEDS OF THE BUILDING AND MINIMIZE THE HEAT ISLAND EFFECT
THE DEEPLY SHADED SOUTHERN VERANDA REDUCES SUMMER HEAT GAINS & EXPANDS COVERED EXTERIOR GATHERING SPACES
HIGH PIERS MINIMIZE EXCAVATION & IMPACT TO SITE WHILE RAISING BUILDING ABOVE PROJECTED FUTURE FLOODING AND SEA LEVEL RISE.
OPERABLE CLERESTORY WINDOWS FOR LIGHT AND VENTILATION
NATIVE MARSHLAND PLANTINGS TO SUPPORT & ENHANCE THE LOCAL ECOSYSTEM
SAND PATHWAYS OF LOCAL SAND, PERMEABLE & PART OF THE LOCAL ENVIRONMENT
Outside the Brock Environmental Center perches on spindly piles to minimize site impact in its marine locale, yet still gives its habitat restoration programs an ideal location to launch regenerative projects.
Geothermal heating, wind turbines and a PV array provide more energy than the center uses and sends the excess into the grid to mitigate non-renewable power sources.

Rainwater catchment, storage and filtration provides all water use on site and aggressive rain garden and wetland techniques process all excess stormwater and greywater from the site.
The deliberate solar design of verandas, porticoes and clerestory windows provide or prohibit seasonal heat gains as needed.

The orientation and gentle curve of the building orient to the southern sun and prevailing winds to maximize natural ventilation and minimize negative climatic effects.


https://www.floornature.com/media

The Please House Point Parcel has been hotly contested and slated for development since the 1970s. However, after the salt marsh was filled with dredge sludge, it was left undeveloped. The community fought to preserve this piece of undeveloped land and worked with the Chesapeake Bay Foundation to create a place at the intersection of natural recreation, restoration, education, outreach and advocacy can meet in a building that exemplifies the goals of the foundation and community it houses.
Twenty-Five full time staff have offices here; however, these headquarters are much more than an office building. The two conference rooms and the 80 person multipurpose room can host large meetings, and the education pavilion sees nearly daily use as nearby schools arrive with their students to learn about sustainable and renewable design. Over 25,000 students visit the center every year.
Creating inspiration through access and immersion in the natural bayside environment


36.9 N, 76.1 W
Throughout the year the Brock Environmental center site is only in the human comfort range for 580/8760 hours, just 7% of the time, so design strategies are employed to make the a building feel a comfortable temperature & humidity.
The southern facade has deep shade awnings to minimize summer heat gain providing 970/8760 comfortable hours, increasing comfort to 18% of the year.
Operable clerestory windows and long spans of fold away doors allow the cooling breezes off the water to circulate through the building both low, at occupant level, and high, near the ceiling to cool the building when needed. 81/8760 hours
These same operable windows seal tightly and work with the insulated building envelope to conserve the internal heat of the building, allowing the building to remain a comfortable temperature much longer. 2119/8760 hours. Combined strategies now make the building comfortable 43% of the time.
a larger part of the year due to the wind protection provided by the shape and orientation of the building. 140/8760 hours
In the winter the low azimuth of the sun allows the southern facade to absorb solar heat. 898/8760 hours. These combined strategies provide 55% of the year in a comfortable temperature and humidity range without using any operation energy.
The access road to the north contains geothermal wells which power the heating, cooling and humidification system that provides mechanical temperature & humidity control to bring the remaining 5,610/8760 hours into the human comfort range. A total annual use of 16,915 kWh per year. On average 46 kWh per day are used to heat and cool over 10,500 sq ft of conditioned space.
The outdoor gathering spaces are situated on the leeward and south side of the building allowing them to be utilized for


DURING MOST OF THE YEAR THE ENVIRONMENTAL TEMPERATURES HERE ARE OUTSIDE THE HUMAN COMFORT ZONE. GEOTHERMAL HEATING & COOLING IS EMPLOYED IN THE BROCK ENVIRONMENTAL CENTER WHEN MECHANICAL HEATING & COOLING IS NEEDED.


GEOTHERMAL SYSTEMS USE ABOUT 80%90% LESS ENERGY THAN OTHER SYSTEMS THUS REDUCING THE ENERGY DEMAND OF THE WHOLE BUILDING

WIND DOMINATES ENERGY PRODUCTION IN FEBRUARY AS IT IS THE CLOUDIEST MONTH OF THE YEAR IN THIS LOCATION

THE BROCK ENVIRONMENTAL CENTER IS AN EXCELLENT EXAMPLE OF LEVERAGING THE EARTH’S THERMAL MASS FOR OUR THERMAL COMFORT
Air temperature extremes on an otherwise nominal site make geothermal heating & cooling incredibly viable.
The combination of geothermal heating with natural ventilation on cooling days allows the Brock Environmental Center to produce all the energy on site necessary to maintain building operations.
During high wind days or sunny days the building actually produces more electricity from its wind turbines and solar array than it uses.
ANNUAL DEMAND: 43,522 kWh

ANNUAL PRODUCTION:
PV PRODUCTION: 54,684 kWh
WIND PRODUCTION: 24,864 kWh
TOTAL PRODUCED: 79,548 kWh
ANNUAL SURPLUS: 36,026 kWh GOES INTO THE GRID
THE MAXIMUM INCREASE RESULTS FROM ORIENTING THE BUILDING 10! TO THE EAST AND UP-TILTING SOLAR PANELS ~25!


The solar study at the Brock Environmental Center Chesapeake Bay site shows that summer shading is necessary to prevent uncomfortable heat gains during the summer months.
The solar shading designed by Greg Mella at the Smith Group provides for shade from the high summer sun and allows the lower angle winter sunlight to provide heat in the winter.

www.cbf.org
https://www.cbf.org/assets/images/695-x-352-px/Daylighting-and-Sunshading


The orientation of the building not only catches the winter sun, it also allows for operable ventilation to catch the cooling winds in the summer, allowing the whole building to be naturally ventilated and cooled.
The environmental system inside the building monitors temperature and sends an email to the staff when windows need to be opened or closed for optimal comfort.


The roof provides the catchment area for water inflows into the system which purifies, filters and stores the rain for potable use. Grey water is then processed on site and absorbed back into the water table in the water Infiltration Garden.
As part of their educational mission, the Brock Environmental Center has a visible cistern adjacent to the educational pavilion and visible as visitors approach the main entrance.
The Brock Environmental Center harvests and treats rainwater to provide all water used on site.
www.cbf.org
For the Brock Environmental Center materials selection played several important roles. Reclaimed materials were sought to lower the embodied carbon in the finished building, and the methods employed to do so increased community involvement and education around green building practices.
Donated materials were a significant part of the building finishes and furnishings. Each material that could be reused or recycled was carefully considered for suitability for the finished center and analyzed to make sure it contained no “Red-List” chemicals which are more
than 300 materials often used in the built environment that pose a toxic risk to humans.
In addition, creative finish ideas were sought from the community, such as re-purposing wine and champagne corks as drawer pulls instead of typical chromeplated hardware systems, reducing the demand & manufacture of environmentally detrimental production and plating processes.

Students were the go-to research team for tracing red-list containing products which served a double purpose of supplying an intelligent research team and educating the students on both why it was important
to know the contents of their environment and how to conduct thorough research. Verification of red list free products is hampered as the customer service personnel of many building material manufacturers do not even know the contents of their own products.
Thanks to the work of the student cohort from all the schools surrounding the Brock Environmental Center in Virginia Beach, none of the materials in the entire building contain any “Red-List” chemicals.
For an example of the exhaustive research completed by these students and guided by their teachers please see the Living Building Institutes Red List at living-future. org/declare/declare-about/redlist/
THE BROCK ENVIRONMENTAL CENTER SIGN WAS CREATED OUTOF SALVAGED REDROOD FROM A WATER BARRELhttps://www.cbf.org/document-library/cbf-guides-fact-sheets/BEC-salvaged-material-fact-sheet-Nov-2014FINAL85c5.pdf

THE AIA COMMITTEE ON THE ENVIRONMENT (COTE) CREATED A DYNAMIC SPREADSHEET TO AID THE DESIGN PROCESS
Using the Top Ten Super Spreadsheet and the AIA Framework for Design Excellence a project is evaluated in each category.
>Design for Integration
>Design for Equitable Communities
>Design for Ecosystems
>Design for Water
>Design for Economy

>Design for Energy
>Design for Wellness
>Design for Wellness
>Design for Change
>Design for Discovery
This tool has been created by COTE members to help architects calculate project performance metrics. After entering information on each measure tab, the "Results" tab will graphically display the holistic project's performance across all 10 COTE measures of sustainable design.
Whether it's used to better understand a design's performance or to streamline the process of submitting for the COTE Top Ten award, this tool will allow easy, consistent calculation and evaluation of project performance metrics and bechmarking.
Note: This version is not compatible with Excel2016 or older. For questions email cote@aia.org, we are looking to improve the tool, and appreciate your feedback! This
Explanations
HOLISTIC SUSTAINABILITY
Sustainability strategies can affect and involve multiple COTE measures. As an example: think how many measures are influenced by carbon metrics? The chart below represents the interconnectivity of the COTE measures.
Place based. ECOLOGY
Aquifer/watershed, shared resource.
Climate appropriate landscape. Rainwater harvesting. WATER
Financial resilience. Economic benefits of biophilic design. Low maintenance design. Water savings, water independence.
District systems. Bioclimatic and passive design.
Inputs: Describe your project's big idea on integrating design and sustainability in the green cell below. Look at chart below for inspiration.
1 - What is the big idea?
transcending LEED, achieving zero-net-CO2 emissions and zero waste leaving the site—a new and significant paradigm for sustainability
Energy savings from transportation and treatment of water.
Carbon emissions from transportation. Air quality. Connection to nature.Water quality.
Locally sourced materials. Environmentally conscious material extraction, mfg., transp. and disposal.
Social equity is a major component of resilience.
Life cycle cost, Life cycle analysis.
Daylighting as energy conversation measure. WELLNESS
Climate change: fires, earthquakes, floods, ocean rise.
User groups, profiles, heat maps. Biodiversity.Mindful presence of water.
Aquifer conservation, surface water quality and enjoyment, watershed protection.
Water resilience. Flooding, precipitation changes, drought.
Durability and maintenance of materials.
Operational costs and costs from productivity of building occupants. nature.quality. Environmentally Biodiversity.Mindfpresence
Embodied carbon of materials. Safer material selection, material transparency. RESOURCES
Right sizing, flexibility for growth and change.
necn ers.Mindful impacts.aptabiy. lth adaptability.
Replicable, cost effective strategies.
Carbon's role in climate change. Passive survivability. Embodied energy savings from adaptive reuse. CHANGE
Measurement and verification. Tracking health impacts.Future adaptability. Post-occupancy evaluations. DISCOVERY
The Living Building Challenge (LBC), like the COTE Design for excellence framework, addresses numerous facets of sustainable design.
The areas highlighted in green above are areas of design and operation created within the Brock Environmental Center. However, those areas not highlighted, specifically transportation and a previously
unbuilt building site, must be offset in the Living Building Challenge.
The Brock Environmental Center footprint is on a greysite. Originally a marsh, it was filled in the 1970s but never developed.
Today the developed footprint is offset by recreating habitat through the center’s habitat reclamation programs.
core.comgeneratesascorefor walkabilityandcommunityresources foranyaddressintheUS.Thehigher thescore,themorepedestrianfriendly thesite.
core.comgeneratesascorefor walkabilityandcommunityresources foranyaddressintheUS.Thehigher thescore,themorepedestrianfriendly thesite.
Walkscore.comgeneratesascorefor walkabilityandcommunityresources foranyaddressintheUS.Thehigher thescore,themorepedestrianfriendly thesite.
Basedon"Arnstein'sLadderofSocial ement",howmuchsaydidthe communityhaveduringthedesignand constructionprocess?
Basedon"Arnstein'sLadderofSocial ement",howmuchsaydidthe communityhaveduringthedesignand constructionprocess?
Basedon"Arnstein'sLadderofSocial Engagement",howmuchsaydidthe communityhaveduringthedesignand constructionprocess?
numberofoccupantscommutingby anymeansotherthansingleoccupancy vehicleonanygivenday.Includes walking,cycling,publictransit,etc.
numberofoccupantscommutingby anymeansotherthansingleoccupancy vehicleonanygivenday.Includes walking,cycling,publictransit,etc.
Thenumberofoccupantscommutingby anymeansotherthansingleoccupancy vehicleonanygivenday.Includes walking,cycling,publictransit,etc.
simplecalculatorcomparesyour project'scommutingpatternsto publishednationalaverages.Usea survey(oraneducatedguess)to determineaveragecommutingdistance andaveragempgofthebuilding's occupants.
simplecalculatorcomparesyour project'scommutingpatternsto publishednationalaverages.Usea survey(oraneducatedguess)to determineaveragecommutingdistance andaveragempgofthebuilding's occupants.
Thissimplecalculatorcomparesyour project'scommutingpatternsto publishednationalaverages.Usea survey(oraneducatedguess)to determineaveragecommutingdistance andaveragempgofthebuilding's occupants.
Ifnoinformationisavailable,usethe baseline(USnationalaverage).Though itsdesignedforofficeprojects,the calculatorcanproducegoodresultsfor buidlingsthatpeopletraveltoand from.
Ifnoinformationisavailable,usethe baseline(USnationalaverage).Though itsdesignedforofficeprojects,the calculatorcanproducegoodresultsfor buidlingsthatpeopletraveltoand from.
Ifnoinformationisavailable,usethe baseline(USnationalaverage).Though itsdesignedforofficeprojects,the calculatorcanproducegoodresultsfor allbuidlingsthatpeopletraveltoand from.
erminethenumberofparking spacesthatarerequiredonsitebylocal zoningcode.Thisnumberiscompared totheactualnumberofspaces provided.
erminethenumberofparking spacesthatarerequiredonsitebylocal zoningcode.Thisnumberiscompared totheactualnumberofspaces provided.
Determinethenumberofparking spacesthatarerequiredonsitebylocal zoningcode.Thisnumberiscompared totheactualnumberofspaces provided.
Recordthenumberofbikeracksand commutershowersprovidedfor buildingoccupants.
Recordthenumberofbikeracksand commutershowersprovidedfor buildingoccupants.
Recordthenumberofbikeracksand commutershowersprovidedfor buildingoccupants.
ExplanationsCalculators: Enter your values intothe yellow cells
Record the area of the site that was tation, both before n roofs
lanationsCalculators: Enter your values into the yellow cellsReasonableRanges ated Area
Record the area of the site that was reserved for vegetation, both before and after development. Green roofs are included in vegetated area
1 - Vegetated Area
Native plants include those that are genous to a specific geographic adapted for the ecosystems. Use "turf grass" for any landscape areas with decorative plants not adapted he local climate.
Native plants include those that are indigenous to a specific geographic location and are adapted for the local climate and ecosystems. Use "turf grass" for any landscape areas with decorative plants not adapted to the local climate.
Native Plantings
2 - Native Plantings
Reasonable Ranges
st cases, it's desirable to rease a site's vegetated area.
In most cases, it's desirable to increase a site's vegetated area.
of area sf
ootprint area 10000 sf rking area- sf
Green roof area 0 sf
a of additional on site hardscapes- sf
Building footprint area 10000 sf Surface parking area- sf
a of the total site that is vegetated - Post Development425,600 sf Area435,600 sf
Area of additional on site hardscapes- sf
Area of the total site that is vegetated - Post Development425,600 sf Site Area435,600 sf
Vegetated - Post Development97.7%
a of the total site that is vegetated - Pre Development0sf
Percent Vegetated - Post Development97.7%
Vegetated - Pre Development0.0%
Vegetated Area Increase97.7%
Area of the total site that is vegetated - Pre Development0sf
Percent Vegetated - Pre Development0.0%
Vegetated Area Increase97.7%
a of the total site covered by native plants- Post Development ,195 sf a of the total site covered by turf grass - Post Development sf
Native plantings - Percent of vegetated area83.0%
centage of native ercentage of turf grass is usually e.
Area of the total site covered by native plants- Post Development 353,195 sf
Turf grass - Percent of Site0.0%
Native plantings - Percent of site81.1%
Area of the total site covered by turf grass - Post Development - sf
Native plantings - Percent of vegetated area83.0%
Turf grass - Percent of Site0.0%
Native plantings - Percent of site81.1%
A greater percentage of native plants and a smaller percentage of turf grass is usually preferable.
From its inception, community interaction has guided the design of the Chesapeake Bay Foundation headquarters on the hotly debated Pleasure Point Parcel into the completion of the Brock Environmental Center
In those community meetings the emphasis on preserving and protecting the local bay ecology and on creating an
interface for education and enjoyment of the Pleasure Point Parcel has been foremost throughout the project.
Community involvement continued into the construction phase, researching and selecting materials, and is ongoing with on-site educational programs.
Thissimple calculator willgiveanestimate of abuilding's waterconsumption. Three uses aretakeninto account for this calculation,indoorwater use,irrigation, and cooling. For the sakeof simplicity, other water uses,suchaspoolsor commercialkitchens arenot included. If yourprojecthas had amore sophisticated wateruseanalysis,youcanskipthe calculatorandenterthe modeledvalues below insection3.
CommercialvResidential: Chooseeither "Commercial" or "Residential"fromthe dropdownfor "Water UseProfile" under section 1ofthis tabandinput the flowratesfor the corresponding table. Residentialincludes singlefamily,multifamily,and lodging.
FixtureFlowRates (GPF/ GPM)
Ispotablewaterusedforirrigation (aftera twoyearestablishment period)?
From water-free toilets, to rainwater catchment and low-flow water fixtures thoughtful and conservative water design dominates this project.

Enter the monthly modeled and measured water consumption for each water source.
1 - Modeled potable water use is preentered from the above calculator and only takes into account bathroom use, Irrigation, and an order of magnitude estimate for cooling tower use.(Note: Due to complexity and variability, water used in restaurants, laboratories, or industrial processes, is not take into account.)
2 - Measured potable use can be read off utility bills.
3 - For grey/black water and rainwater, only include the purified water that is reused for another purpose and offsets a potential potable use, such as irrigation. Condensate and foundation water that offsets potential potable water use can be included here as well
January5,85505,8551,513 February5,85505,8551,513
March5,85505,8551,513 April5,85505,8551,513 May5,85505,8551,513 June5,85505,8551,513 July5,85505,8551,513 August5,85505,8551,513 September5,85505,8551,513 October5,85505,8551,513 November5,85505,8551,513 December5,85505,8551,513 Total (Gal)70,263270,2600018,1560
Two 1650 gallon cisterns store collected rainwater for use within the building.

Through careful design, the Brock Environmental Center uses 80% less water than a typical building of the same size and all of the water is harvested, processed and absorbed on-site.
https://www.resilientdesign.org/thebrock-environmental-center-a-pinnacleof-sustainability-and-resilience/
6,000 6,854


Measure 9 - Design for
How much floor area was already existing?

The building is elevated 14 feet above sea level—exceeding the 500-year FEMA flood elevation, building in resiliency for projected sea level rise. Although, no one seems to have elevated the access road, so access to the building may be hampered unless you come by boat.
30 SECTION 01 | COTE CASE STUDY ENVIRONMENTAL PORTFOLIO | ROSE MAUNDER
Explanations
Select all the post occupancy strategies that were employed.
Calculators: Enter your values into the yellow cells. Enter non-numerical data into the green cells occupancy employed. transparency employed.
ulators: Enter your values into the yellow cells. Enter non-numerical data into the green cells
vel of Post Occupancy Engagement
Which of the following did you do to stay engaged with the building?
Contact the owner / Occupant to see how things are goingYes1
Formal post occupancy air quality testingYes1
occupancy
Which of the following did you do to stay engaged with the building?
Contact the owner / Occupant to see how things are goingYes1
Obtain utility bill to determine actual performanceYes1Data logging of indoor environmental measurements Yes1 Survey building occupants on satisfactionYes1 Post occupancy energy analysisYes1 Formal onsite daylight measurementsYes1Develop and share strategies to improve the building's Performance0 Share collected data with building occupantsYes1Teach occupants and operators how to improve building performance Yes1
Obtain utility bill to determine actual performanceYes1Data Survey building occupants on satisfactionYes1 Formal onsite daylight measurementsYes1Develop and Share collected data with building occupantsYes1Teach occupants
Which of the following did you do to share the lessons of the project?
Select all the transparency strategies that were employed.
Present the design of the project to the officeYes1 Publish post occupancy data from the buildingYes1 Present the design of the project to the publicYes1 Publish any lessons learned from design, construction, or occupancyYes1 Present outcomes and lessons learned to the officeYes1other: 0 Present outcomes and lessons learned to the publicYes1other: 0
Select the level of occupancy feedback.
vel of Transparency
Transparency score 75%
Which of the following did you do to share the lessons of the project?
Present the design of the project to the officeYes1
Present the design of the project to the publicYes1 Publish any
Choose one Relative ranking (Score 0-5)5 Even passive occupants are presented with performance feedback
Present outcomes and lessons learned to the officeYes1other: Present outcomes and lessons learned to the publicYes1other: sparency score
vel of Occupant feedback
e one
n passive occupants are presented with performance
Relative ranking (Score 0-5)5

1 - A building has a floor slab that is 20’ x 30’. Each exterior wall is 20’ tall. Windows comprise 25% of the walls. There are two (2) doors and each is 3’ wide by 7.5’ tall. The hip roof is 1,400 sf total. What percentage of the overall building is each component?
WALLS = 43%
2 - A building with a flat roof has the elevations below. What is the WWR (Window Wall Ratio)?
Calculate for each facade and for all walls combined. We are only looking at walls
WINDOWS = 15%
DOORS = 1%


1 - A building has a floor slab that is 20’ x 30’. Each exterior wall is 20’ tall. Windows comprise 25% of the walls. There are two (2) doors and each is 3’ wide by 7.5’ tall. The hip roof is 1,400 sf total. What percentage of the overall building is ea component?
1 - A building has a floor slab that is 20’ x 30’. Each exterior wall is 20’ tall. Windows comprise 25% of the walls. There are two (2) doors and each is 3’ wide by 7.5’ tall. The hip roof is 1,400 sf total. What percentage of the overall building is ea component?
= 41%
2 - A building with a flat roof has the elevations below. What is the WWR (Window Wall Ratio)?
Calculate for each facade and for all walls combined. We are only looking at walls
2 - A building with a flat roof has the elevations below. What is the WWR (Window Wall Ratio)?
Calculate for each facade and for all walls combined. We are only looking at walls in this case.
NorthEast West South
IMAGE: Caption Caption
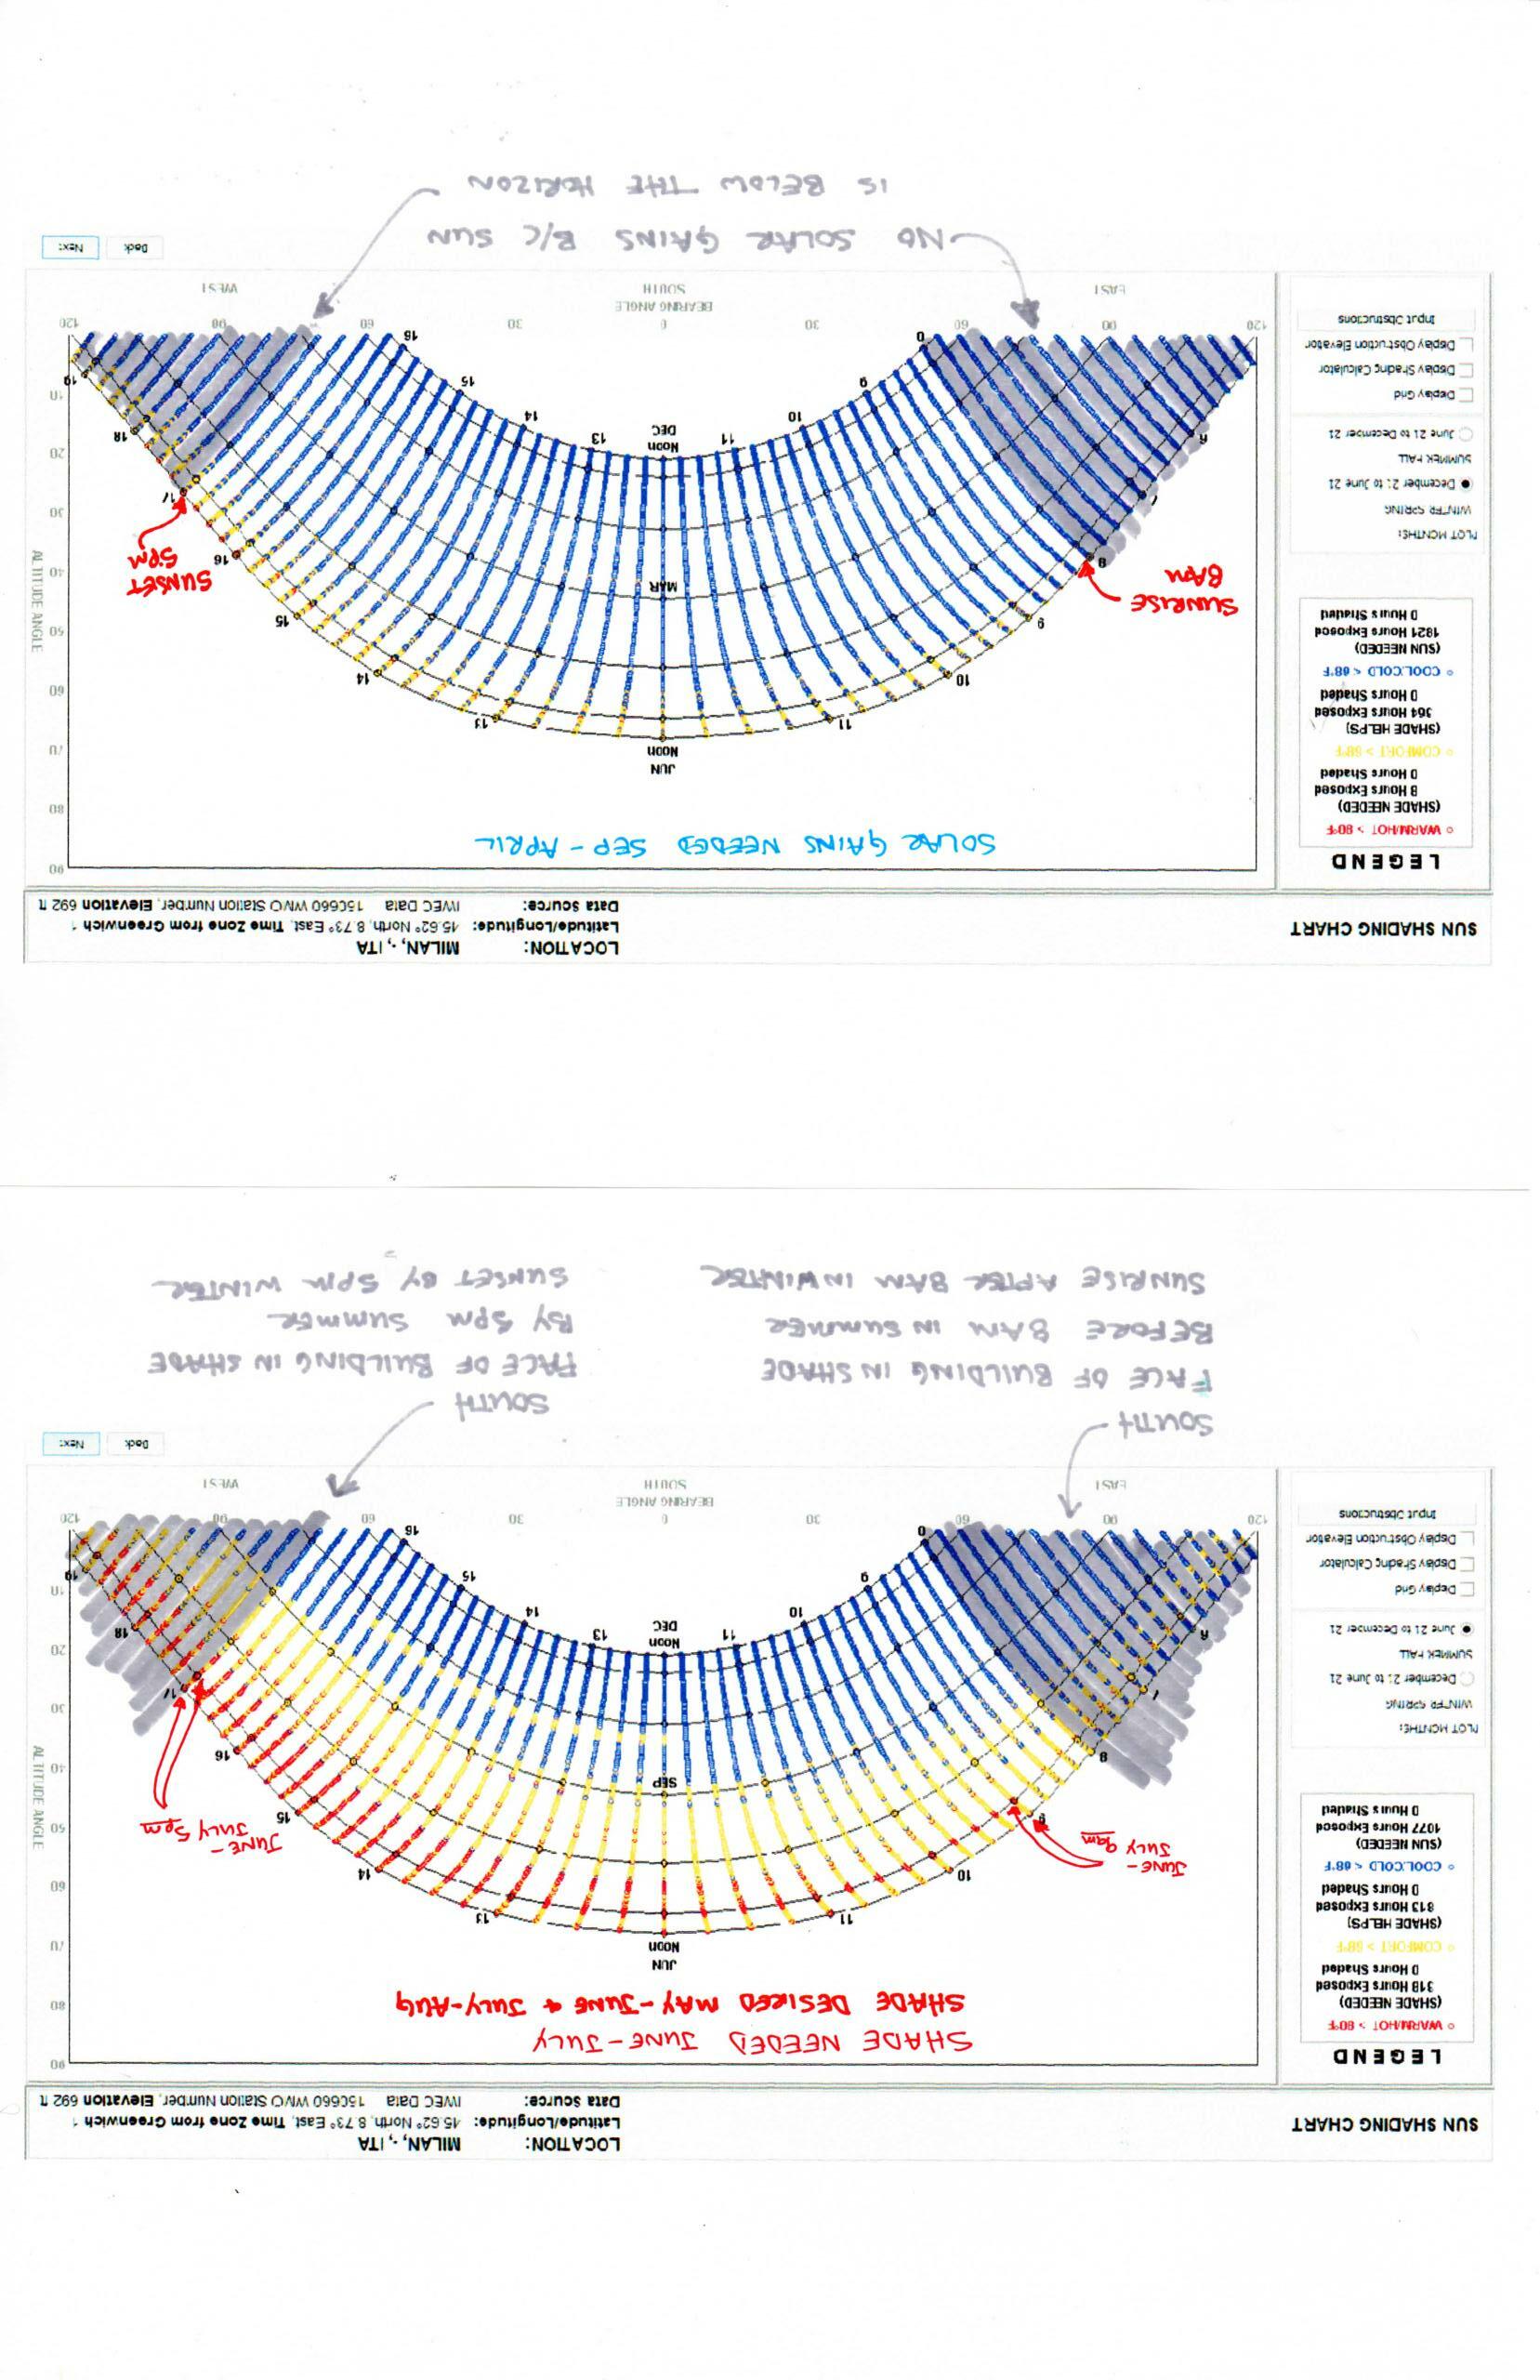
Solar shading is most needed in Milan during June & July, with shading preferred during May & August.
Since all direct sunlight cannot be blocked by horizontal shading alone, vertical fins provide additional shading in the morning and afternoon.


Despite the shading required on cooling degree days during the summer months, Milan’s climate is dominated by heating degree days.
Solar gains are most needed by direct sunlight September through April. (shown opposite page)
VERTICAL FINS


SEPTEMBER 21, 1PMOCTOBER 21, 1PMNOVEMBER 21, 1PM
VERTICAL FINS DECEMBER 21, 1PM
JANUARY 21, 1PMFEBRUARY 21, 1PMMARCH 21, 1PMAPRIL 21, 1PM

IMAGE: Caption Caption

Solar shading is most needed in Santiago during December through February, with some shading preferred during March.


Solar gains are most needed by direct sunlight June, July and August.


OPERABLE VERTICAL FIN


MARCH 21, 12PM
JUNE 21, 12PM
MARCH 21, 4PM JULY 21, 4PMAUGUST 21, 4PM
OPERABLE VERTICAL FIN EXTENDED TO PROVIDE ADDITIONAL SHADING

OPERABLE VERTICAL FIN FLAT ON WALL TO PROVIDE ADDITIONAL HEAT GAIN


However, in Boston, a substantial amount of precipitation is stored as snow for 4-5 months of the year. Please calculate storage and retention/absorbtion systems for greater influx during spring melt.


IMAGE: Caption Caption
IMAGE: Caption Caption

1. Using the Global Solar Atlas Tool, find the Global Horizontal Irradiation for Boston, Massachusetts, USA:
However, this building has a "sawtooth" roof design for optimal PV tilt & northern daylighting giving 1,707.3 kWh/m2
2. What is the baseline energy consumption (EUI) for this building type?
a. Source EUI: b. Site EUI: 3. If you design your building to consume 70% less energy than the baseline (via passive strategies, high efficiency mechanical equipment, LED lighting, natural daylighting and ventilation, etc.), what is your pEUI?
1,443.4 kWh/m2 per year 5,274,251.5 kBtu/ft2 2,661,688.6 kBtu/ft2
a. Source EUI: b. Site EUI: For the next two steps, first do the calculation for the baseline source energy use intensity. Then redo the calculations for the 70% reduction from the baseline.
2,306 panels can fit on the roof
Baseline = 60,126,466 kWh/year Reduction from Baseline = 18,037,940 kWh/year
4. Due to cost restrictions, you choose Panel Type A, 0 degree tilt angle. How much energy are you able to generate? Have you achieved net zero source energy?
Panel A, 0 degree tilt: 766,606 kWh/year
Panel A, optimal tilt: 1,079,406 kWh/year
Not net-zero energy for baseline or for reduction
5. Using Panel B, 0 degree tilt angle, how many panels are needed? Does this array fit on your roof?
Panel B, 0 degree tilt: 1,054,109 kWh/year Panel B, optimal tilt: 1,247,252 kWh/year
Not net-zero energy for baseline or for reduction
33,350 panels, type B would be needed to meet reduction from baseline energy use which is 538,267 sqft of array at optimal tilt
Utilizing the reference below embodied carbon CO2 equivalents were calculated for various parts of the building assembly and energy consumption during construction.
Complete Tasks A, B, and C:
Task A Find the embodied carbon in this wall.
Steps
1 - Establish the building materials that make up the wall.
2 - Calculate the weight of each material in your wall.
3 - Apply the embodied carbon factor to each material.


4 - Add all of the embodied carbon together.
CONCRETE BLOCKS = 8.38kg CO2e
MINERAL WOOL = 9.23kg CO2e
BRICKS = 94.74kg CO2e WALL TIES = 1.44kg CO2e
Quantities
ConcreteBlocks(Area) 1.05squaremeters
MineralWoolInsulation(Area) 1.03squaremeters
Bricks(Quantity) 60bricks
Mortar(Volume) 0.033cubicmeters
WallTies(Quantity) 5wallties
Weight/Mass
ConcreteBlocks 60kg/squaremeter
MineralWoolInsulation 7kg/squaremeter
Bricks 2.3kg/brick
Mortar 1,650kg/cubicmeter
WallTies 0.04409kg/walltie
Sample Embodied Carbon Factors (kg CO2e/kg)
ConcreteBlocks 0.133kgCO2e/kg
MineralWoolInsulation 1.28kgCO2e/kg
Bricks 0.5512kgCO2e/kg Mortar* 0.174kgCO2e/kg
WallTies*
COMBINED CO2e = 189.79 CO2e
Task B
4,500 kWh of electricity was used to power site lighting during construction. Construction site lighting is powered by fossil fuels. How much embodied carbon is in the site lighting?
4,500kWh = 2,700kg C02e
Task C
ery other year for the e. The lifetime of the office space is 20 years. What is the total embodied carbon for the carpet e?
CARPET TILES = 67,130kg CO2e
Notes
Early on in a project, some elements are omitted (*) Quantities of some materials do not always have to be converted to weights as their embodied carbon factors are
CARPET TILES HAVE MORE THAN 23 TIMES AS MUCH EMBODIED CARBON AS THE WALL ASSEMBLY AND SITE LIGHTING COMBINED!

The EC3 tool was used to measure and record estimated embodied carbon of a Studio project.
Considerations including the type of foundation, the type of structure, the longevity of the materials chosen, their ability to be obtained, recycled or reused, and the embodied carbon content were some of the considerations used to select the foundation & structural system.
As development of the Studio project continues, more information and material selection will be added to the Sankey diagram, eventually approaching a visual similar to the comparison project, and also hopefully approaching or surpassing the C02e reduction targets as well.
SANKEY DIAGRAM OF STRUCTURAL & FOUNDATION SYSTEMS OF STUDIO PROJECT
SANKEY DIAGRAM OF COMPARISON PROJECT OF SIMILAR SIZE AND USE


A reclaimed industrial site where nautical cordage was manufactured, our waterfront site touches a neighborhood in need of refreshed growth: social, economical and ecological.

The site is south of Boston, yet connected via the commuter rail, and north of downtown Plymouth connected by the rail trail, bike path and highway 3A


There are dramatic tidal changes in the bay, and the non-point source pollution from the agricultural and industrial development throughout the area has caused severe losses to the native Eelgrass beds, Zostera Marina.
Healthy Eelgrass beds are incredibly effective at cleaning the water, producing oxygen and sequestering carbon dioxide.
In addition, local industry utilizes the bay for aquaculture beds, shown in yellow, and both recreational and commercial boating; channel are shown in orange.


While the town of Plymouth as a whole has only a 7.53% poverty rate, North Plymouth, where our site is located, has a 21.9% poverty rate. Even more concerning, due to the high cost of housing 68% of the people who live in North Plymouth are “cost burdened”, meaning they pay more than 30% of their income for their housing. This means that affording other necessities such as food, clothing and medical care can be more difficult. Also, this segment of the population is more often dependent on weekly paychecks and has been hardest hit during the Covid-19 pandemic.


Create a living resiliency between the site and the bay with salt tolerant xeriscape, stormwater retention, and an active replanting program to revitalize Zostera Marina in the bay.

Weave sustainable homes and business together in resident communities that interact at the village scale, like historical communities with homes above and commercial shops below and beyond.
Low-impact water recreation & community involvement through conservation & leisure with a youth sailing program, daycare & holiday education camps.

Buildings on site are placed above projected sea level rise on piers, and cisterns store rainwater for on-site use while a central catchment basin stores additional stormwater for natural filtration & absorption.

The current & waves already show a resculpting of the shoreline over the last 200 years, so the design will incorporate this ability to change over time with a seaside berm liberally plated with native shoreline plants, to encourage reclamation of this intersecting habitat by native species.

Throughout the site native textures abound. The palette consists of native succulents, trees, rocks, sedges & grasses. Each one carefully selected for the specific seaside niche it flourishes in and the interweaving of the species into a native ecology, both above and below the waterline.
Each moment is a plethora of experiential materiality geared toward inviting and educating the human community about the natural processes.

The central green is a gathering area and playground. It is interactive on many levels. Not a homogeneous turf; instead it is a richly diverse absorption lawn valley. Dry in the summer, so residents can gather for games. It is a pond during mud-season when everything is coldly wet & overflowing, yet it transforms to a winter wonderland for snow play in the cold.


Interstitial spaces are filled with carefully considered plantings, gardens & experiential paths that vary season to season. Bare winter makes way for vivid spring, lush summer and vibrant autumn while visitors, employees and residents meander.


The event center is topped by a flowering seaside meadow with a cascading path through native tumbled rocks.


Through imaginative exploration three personas epitomize the community & population using the site.


• 39 YEARS OLD
• TEACHER, FATHER, HUSBAND
• VALUES KNOWLEDGE & LEARNING
• ENJOYS THE OUTDOORS, CHILDREN & PEOPLE
“There’s nothing more important, and fun, than family”
WORKS IN THE NEIGHBORHOOD & WALKS OR BIKES.
LIVES ON SITE, MARKETS HERE AND ENJOYS RECREATION THROUGHOUT THE REGION. TAKES THE TRAIN INTO THE CITY FOR WEEKEND FUN WITH THE FAMILY OR GOES BOATING ON THE BAY WITH HIS KIDS.
Through imaginative exploration three personas epitomize the community & population using the site.
• 72 YEARS OLD

• RETIRED, LIVES ALONE
• VALUES SUSTAINABILITY & HUMANITARIANISM
• ENJOYS HIKING, BIRDING, PLAYING MUSIC & DANCING
“When we try to pick out any one thing, instead we find it hitched to every thing”
CAR-SHARE OR WALKING LIVES ON SITE, MARKETS HERE, GOES VISITING TO FAR FLUNG FRIENDS ON THE TRAIN OR OUT IN GROUPS VIA THE CAR SHARE. PARTICIPATES IN THE LOCAL HIKING CLUB AND VOLUNTEERS TO TAKE KIDS AND FAMILIES ON NATURE WALKS.
ENTERS SITE FROM CAR SHARE ENTRY AND GOES TO MARKET FOR GROCERIES

Through imaginative exploration three personas epitomize the community & population using the site.
• 10 YEARS OLD

• LIVES WITH MOM & SIBS
• VALUES PLAY & FRIENDSHIP
• ENJOYS READING, HIKING, SAILING & COMPUTER GAMES
“Let’s explore & play”
BIKING! ITS MORE FUN AND FASTER. LIVES ON SITE AND LOVES BEING ALLOWED TO GO DOWN TO THE MARKET TO SPEND HIS OWN MONEY ON WHATEVER HE WANTS. SPENDS MOST OF HIS TIME ON THE BEACH OR THE DOCK WITH HIS FRIENDS, OR IF IT’S TOO COLD, INSIDE THE LOUNGE PLAYING VIDEO GAMES OR MAKING FORTS OUT OF THE LOUNGE FURNITURE.


Use effective solar strategies to:
>Perform site analysis
>Design building orientation & form
>Decide room placement
>Choose window placement to reduce solar gain, maximize ventilation, & effectively daylight

>Design shading, facade & building color
>Understand the building assembly & design it for site-specific climate
>Utilize passive systems
>Effective electrical lighting
>Design photovoltaic and solar thermal systems & choose mechanical equipment within electrical budget.
The prevailing climate in the Virgin Islands is Warm & Humid with seasonal trade winds. Although there is no distinct seasonality; summer months are generally wetter and leaves fall from deciduous every year coordinating with the lack of precipitation rather than the length of day.
The weather station is located on the westernmost point of the westernmost island, as prevailing winds and rains come from the east, there is significant variation in the amount of rainfall and wind experienced on eastern sites. Additionally, the topography of these islands is very mountainous, contributing to significant micro-climate conditions on differently oriented slopes and at different elevations.
Although, various guidelines and books state that the human comfort range is between 68-85 degrees F, temperatures as low as 68 in the islands are very rare and very uncomfortable for residents. Indeed, heating is desired at temperatures below 72-74 degrees. However, temperatures warmer than low to mid eighties easily cause overheating, so a comfort range of 74-83 degrees F is most desirable.

>Preventing unwanted solar gains
>Maintaining a comfortable humidity
>Creating comfortable interior daylighting
>Reducing glare
Climatic temperatures generally fall within the human comfort range; however, overheating is difficult to avoid during the months of June-October due to increased temperature, increased humidity and the seasonal decrease in prevailing wind.
CLIMATE CONSULTANT DESIGN GUIDELINES:
>Operable walls & shaded outdoor porches, raised above the ground to minimize dampness & maximize ventilation.
>High ceilings & tall operable windows protected by deep overhangs & verandas designed for this latitude or operable
sunshades increase interior thermal comfort. Orient windows to catch prevailing winds.
>Screened porches and patios increase ventilation & comfort cooling while protecting from insect problems.
>Window overhangs Long narrow building plan and location of doors and windows on opposite sides of building can help maximize cross ventilation.
>Orient most of the glazing to the north shaded by vertical fins because there are essentially no passive solar needs.
>Highly insulated roofs & a radiant barrier will help reduce radiated heat gain through the roof. White matte roof finish will also reduce heat gains.


SKETCHUP: 2-10 CONCORDIA STJOHN,U.S.V.I

Estate Concordia, St John, VI
18.3 North Latitude


Mitigating solar gains is the major priority on this site.
Despite the favorable slope facing northeast, solar gains are not mitigated by the topography.
Unique to the tropics is that during the month of June, the southern exposure of a building can receive shade and the northern facade receives direct sunlight. This requires shading on all faces of a building to reduce unwanted solar gains and creates challenges for daylighting throughout the year.


The topography has no easily discernible benefits on mitigating solar heat gains.
Additionally, site has steep topography which is typical for residential zoning in the Virgin Islands. Please see except from VI zoning code below:
“Much of the land in the Virgin Islands is mountainous with steep slopes and a minimum amount of soil over rocky subsurface. These areas are used for residential purposes.”
Also, by code, “all principal residential structures shall occupy not more than 25% of the area of the zoning lot”

This lot has 10,171 sq.ft.; therefore, 2.542 sq.ft. is the maximum area of structures.
Despite the inclusion of some shading in this study there is minimal benefit as all building faces still experience direct solar gains. Orientation with the narrowest parts of building to east-west will mitigate, benefits balanced with loss of ventilation.
Despite orienting the building for natural ventilation, with the narrowest part of the structure perpendicular to the prevailing winds to increase natural ventilation, this orientation is counter to the necessary solar orientation.

This site is an excellent candidate for a photo voltaic array and solar HW system.


The sound of the waves on an arid-tropical, rocky ridge.
• Site faces the prevailing winds to bring excellent natural ventilation
• Views to the north of ocean and islands without glare caused by sunlight refracting off water.
• Native arid plants abound and offer attractive xeriscape & landscape opportunities.
• Site experiences solar gains year-round
• Neighbors are separated more by elevation than distance; noise pollution.
• Unpaved road below causes dust pollution to site.
• Less wind in hottest months of year.
• Salt corrosion from marine breezes
• No existing large trees on site to provide shade and windy, arid environment is prohibitive to shade tree growth.

NORTH-WEST CORNER OF SITE, LOOKINGEAST NOV7,2021-ENDOFWETSEASON


Determined by solar shading study in Sketchup

Began with 25% glazing on each side of building.
>Additional glazing on North wall for daylighting
>Additional glazing on northfacing roof for daylighting
More glazing exploration needed to improve daylighitng without glare.
BENCHMARK ENERGY 24 kBTU/sf/yr
Change roofing and wall insulation to code: no change in KBTU/sf/yr
Change glazing u-factor to low-e: -1 KBTU/sf/yr
EQUIPMENT & LIGHTING
Change to “Excellent”: -15 kBTU/sf/yr
IMPROVED ENERGY
9 kBTU/sf/yr

Using Sefaira was a challenge. I think this tool could be really useful; however, my ineptitude made utilizing it frustrating.
Sefaira would not install. At all. Still will not on the computer furnished by the school with Sketchup for use during schoolwork.
I installed a trial sketchup on a work computer and was finally able to install Sefaira on the work computer.
However, Sefaira kept crashing Sketchup. Anytime I opened the Sefaira Plugin, Sketchup would crash. I kept removing and removing from the model and going over the provided links and any additional information i could glean from the internet for solutions.

Eventually, I was able to get Sefaira Plugin open long enough to upload. Once on the
internet application, I was able to compare strategies.
Originally I compared three different types of HVAC systems; however, I only included the most efficient system in these pages.
STRATEGY
Improve envelope so cooling equipment works less.
BASELINE
Walls U-value = 0.38; Floors U-value = 1.86
OPTIMIZED
Walls U-value = 0.30; Floors U-value = 0.38

REALISTIC?
Yes; insulation is code required
STRATEGY
Shade glazing to reduce solar gain
BASELINE No shading
OPTIMIZED Horizontal Shading at 1.25 depth of window

REALISTIC?
Yes; facades are often entirely shaded
STRATEGY
Specify actual designed use of space
BASELINE
Occupant density = 50m2/person
OPTIMIZED

Occupant density = 37 m2/person
REALISTIC?
Yes; building is designed for this occupancy, 7 days a week.
STRATEGY
Minimize energy expenditure for HW
BASELINE Gas-fired boiler
OPTIMIZED
Hot Water Heat Pump
REALISTIC? Sometime; solar abundance makes solar thermal HW a resilient option
STRATEGY
Utilize natural ventilation
BASELINE No natural ventilation
OPTIMIZED


Natural ventilation & cooling as needed REALISTIC? Yes; occupants adjust natural ventilation or mechanical cooling as needed
STRATEGY
Utilize solar abundance to produce energy
BASELINE No PV
OPTIMIZED 187 m2 of PV
REALISTIC? Yes; solar abundance make PV feasible and often cost-effective as well
STRATEGY
Utilize zones


BASELINE No natural ventilation
OPTIMIZED No change from baseline REALISTIC? Yes


Because of the latitude of the site, 18’N, there is direct sunlight on an unshaded north wall during some of the hottest months of the year, May June and July.


The first north horizontal shade was not nearly deep enough and was increased to a depth of 10’ which made it deep enough to shade the north facade in June.

Louvers hang from the end of the western horizontal projection, and trees will be planted for shade to the west. Also, the topography to the west provides an additional hour of relief from the hottest western sun.
On the east, shade curtains hang from the end of the horizontal overhang, as needed.
Additional fin walls direct natural ventilation and provide oblique shading.


Due to our tropical location, we have fairly consistent sunlight hours and angles throughout the year, and due to our excessively high electrical grid costs of $0.47 per kWh plus fees and taxes, the payoff time for photovoltaics is typically less than 7 years.
In buildings such as schools and offices which are mainly operating during the day, photovoltaics are clearly the best energy solution in this area. However, the biggest barriers to switching to photovoltaic production is the high upfront costs.
The combination of calculation of energy use for the designed building coupled with actual electrical bills for a building of similar size and equipment seems likely to give a fair estimate of electrical demand. However, the meters provided by the electrical utility are inaccurate, and most solar installers meter typical use in existing structures using their own meters. This invariably results in the design of a system to produce approximately 120% of the annual electrical requirements in a system that is 80-90% of the size that would be required based on an estimate from the utility billing. The end result is that a small PV array will provide all the annual electrical needs.
Interestingly enough, of the three photovoltaic array estimates provided for the same residence from three different solar installers, the battery backup was $24,000-$25,000 for two batteries and the PV panels were slightly more than $1,000 each totaling between $19,000-$20,000 for an 18 panel array, which combined to make a 6-7 kW array. What this tells me is that I can purchase an additional panel for every two months of electrical utility I am not paying. However, to purchase the battery storage, I would need a large lump sum totaling 44 months of electrical utility service. This cost distribution of storage vs production creates a bias for grid tied systems.
In direct contrast, a grid tied system here has to pay a monthly connection fee that cannot be paid for with credits earned through electrical production feeding back into the grid, and credits accrued do not roll over from one month to the next. You are paid a whopping $0.123 for the energy you feed into the grid, yet you have to pay $35 each month for this size of system in order to continue to be grid tied. In order to earn enough money through excess production to offset the cost to be grid tied the array would need to produce 9.5 kWh per day in excess of what is used by the building to earn $35. So, the array size would have to increase from 7 kW to 16.5 kW or more.
IMAGE: Caption Caption
Amazingly this makes the overall cost between being grid tied or battery storage effectively the same. A 16.5 kW array would be about 44 panels; at approximately $1,000 per panel the array would cost around $44,000. All three of the estimates by solar installers provided for battery storage and 18 panels, costing about $44,000.
So, the relevant question is how to pay for such a system. Since panels are considerably less expensive than batteries, a grid tied system could be purchased one or two panels at a time eventually lowering the utility bill to the grid access charge. This process would allow someone to purchase a PV array over time, as the money to pay for it was earned. This
make economic
process also qualifies for the federal credit, for as long as the credit is active, currently until 2023.


Additionally, a grid tied system increases the productivity of the grid as a whole which is a non-monetary, societal benefit. However, without on-site battery storage, the resiliency of the system decreases. When the grid goes down, electricity is unavailable, an occurrence which happens randomly but at least once a week in the Virgin Islands. Which encourages on-site battery storage and off-grid systems for those who can afford them.
A few years ago the Virgin Islands offered several very effective incentive programs. There was Net-metering, which paid $0.46/kWh and there was no grid access charge, making a grid tied system an effective financial step from installation of the first panel, controller and inverter. In addition, the VI also offered a solar rebate program offering a 40% rebate, cash in hand, for every energy star appliance, electric vehicle or renewable energy system purchased in the VI. Both of these incentives were massively effective at increasing renewable energy and energy efficacy.


Renewing these incentives would foster both renewable energy, energy efficiency and energy resiliency since the rebates and the net-metering system provided cash in hand quickly, giving immediate reward for environmental responsible choices.
https://www.watercalculator.org/wfc2/complete/


http://www.freehotwater.com/solar-calculators/solar-thermal-calculator/
Solar thermal hot water systems make both environmental and economic sense in the VI.
A thermosiphon system, the simplest of the solar thermal hot water systems is an excellent choise for domestic hot water heating in the climate of the Virgin Islands. These systems are available from local resellers, and there are still territorial incentives for purchasing a solar thermal hot water heater, and the entire system is eligible for the current federal tax credit.
The Solar collector Estimator is sadly inaccurate for the VI. No price is listed for the system and the state rebate amount is reported as a fixed amount rather than the percent of cost which is the current rebate system. Likewise, the federal tax credit is still reported as 30% on the web estimator when the actual federal tax credit in 2021 is 26% and will reduce to 22% in 2022. The other deductions, 179 and MACRS are not eligible for the primary residence. These federal tax depreciations generally apply to business property, so they would only be viable if the existing building the solar thermal system was installed on were a business or rental income property.

THE APPROXIMATE COST: 2021 estimated cost in the VI is: $2,400 for thermosiphon hot water heater $600 for installation $3,000 total (less $600 if bought in the VI) With $780 deductible from your taxes due on your next tax return.
PAYBACK PERIOD: ~2 YEARS
A base comparison of an equivalent system typically sold in the VI in 2021 is a 1500 watt electrical water heater. Calculated annual cost is $772 per year.
Calculated payoff after credits & rebates for the thermosiphon system is $1,620
Money saved from the electrical bill will payoff the thermosiphon in 2.1 years.
https://energyusecalculator.com/electricity_waterheater.htm
>AIA FRAMEWORK FOR DESIGN EXCELLENCE; https://www.aia.or g/resources/6077668framework-for-design-excellencethe
>ANEROBIC DIGESTION OF BLACKWATER AND KITCHEN REFUSE, Claudia Wendland
>ARCHITECT MAGAZINE: The Climate is Changing. So Must Architec ture, Oct 04, 2017
>ARCHITECT MAGAZINE: https://www.architectmagazine.com/project- gallery/brockenvironmental-center_o
>BIOHABITATS: https://www.biohabitats.com/project/brock-enviro nmental-centerrainwater-harvesting-reuse/
> BREATHE ARCHITECTURE: https://www.breathe.com.au/purpose
>CHESAPEAKE BAY FOUNDATION; https://www.cbf.org/about-cbf/locations/virginia/ facilities/brock-environmental-center/welcome-to-one-of-the-worlds.html
>CLIMATE CHANGE WHAT EVERYONE NEEDS TO KNOW; Joseph Rom m
>CLIMATE CONSULTANT; https://climate-consultant.informer .com/6.0/
>CORDAGE COMMERCE CENTER: www.cordagecc.com
>COTE Super Spreadsheet; https://content.aia.org/node/60935 16
>A DESIGN TOOL FOR MEETING THE 2030 CHALLENGE; Murray Milne; A merican Solar Energy Association Conference 2007; Revised July 17, 2007
>ECOLOGICAL FOOTPRINT CALCULATOR: https://www.caribbeanclimate.bz/ blog/2018/02/20/carbon-footprint-calculator/
>EC3 TOOL: https://www.buildingtransparency.org/
>ENERGY USE CALCULATOR: https://energyusecalculator.com/electricity_w aterheater. htm
>HEATING COOLING LIGHTING, SUSTAINABLE DESIGN METHODS; Norbert Lechner
>INTERNATIONAL LIVING FUTURE INSTITUTE; https://living-fu ture.org/lbc/casestudies/the-chesapeake-bay-brock-environmental-center/
>JASON MCLENNAN - LIVING BUILDINGS AND A REGNERATIVE WOR LD: https://www. youtube.com/watch?v=tjtV4GnepAk
> NIGHTINGALE HOUSING: https://nightingalehousing.org/
>NOAA WEATHER DATA FOR PR AND VI: https://www.weather .gov/sju/climo_pr_usvi_ normals
>NOAA WEATHER EXTREMES FOR PR & VI: https://www.weather .gov/sju/climo_pr_ usvi_records
>OUR WORLD IN DATA; https://ourworldindata.org/
>PHI PUBLISHES RESEARCH ON PASSIVE HOUSE IN TROPICAL CLIMATES: https:// passivehouseplus.ie/blogs/phi-publishes-new-research-on-passive-house-in-tropicalclimates
>POLAR SUN CHART BY ZIP CODE: http://solardat.uoregon.edu/PolarSunCh artProgram. html
>SITE ENGINEERING FOR LANDSCAPE ARCHITECTS; excerpt page s 157-187
>SOLAR COLLECTOR ESTIMATOR: http://www.freehotwater.com/solar-cal culators/ solar-thermal-calculator/
>SMITH GROUP: https://www.smithgroup.com/news/2016/smithgroup-designed-brockenvironmental-center-certified-as-one-of-the-greenest-buildings
>SMITH GROUP: https://www.smithgroup.com/projects/brock-environmental-center
> SMITHSONIAN: Underwater Meadows of Seagrass Could Be the Ide al Carbon Sinks; https:// www.smithsonianmag.com/science-nature/underwater-meadows-seagrass-could-be-idealcarbon-sinks-180970686/
>SUSTAINABLE URBANISM; Farr, excerpt pages 174-178
>TOOLS FOR DESIGNING ZERO ENERGY HOMES; 25th Conferen ce on passive and Low Energy Architecture, Dublin Oct 22-24 2008
>US RAINFALL DATA; https://hdsc.nws.noaa.gov/hdsc/pfds/pfds_map_cont. html?bkmrk=va
>VIRGINIA BEACH, LIVE THE LIFE: https://www.visitvirginiabeach.com/listing/ chesapeake-bay-foundations-brock-environmental-center/979/
>WATER FOOTPRINT CALCULATOR: https://www.watercalculato r.org/wfc2/complete/ >WHOLE BUILDING DESIGN GUIDE: https://www.wbdg.org/additional-resources/casestudies/brock-environmental-center