
ENVIRONMENTAL PORTFOLIO
SAMANTHA AHMED

BIO CARBON & ECOLOGICAL FOOTPRINT
PROJECT INFORMATION
DESIGNING FOR INTEGRATION
COMMUNITIES
SUN SHADING, PSYCHROMETRIC CHARTS
DESIGN FOR ECOLOGY
DESIGN FOR WATER DESIGN FOR ECONOMY DESIGN FOR ENERGY
MATERIAL ASSEMBLIES
WINDOWS AND DAYLIGHTING
DESIGN FOR WELLNESS
BIBILIOGRAPHY
5 7-9 11-14 17-26 29-30 33-37 39-40 41-49 00-00 51-55 57-60 63-66 68-72 74
SAMANTHA AHMED
Biography
Currently an associate architect at John Schimenti, PC, Samantha previously worked in visual displays for retail brands. She graduated with a BFA from Pratt Institute, where she was in the Interior Design program at the School of Fine Arts. Samantha is currently in her thesis year of the MArch program at the Boston Architectural College (Distance).
On her free time, Samantha enjoys spending time with her four year old boy, finds cooking to be very therapeutic, and likes to visit farms and national parks. On a perfect day, she would be outdoors with her sketchbook.
Samantha’s hometown is Brooklyn, New York, where she spent most of her life. She resides in Lindenhurst, New York on the South Shore of Long Island.

EDUCATION
Boston Architectural College Masters of Architecture (Thesis Research) Currently Enrolled
Pratt Institute - BFA Interior Design
Graduate
EMPLOYMENT
JOHN SCHIMENTI ARCHITECTURE
Associate Architect
> Residential Design
> Health Facilities
A WEEKEND STROLL Planting Fields Arboretum Oyster Bay, New York 2021CARBON AND ECOLOGICAL FOOTPRINT
CARBON AND ECOLOGICAL FOOTPRINTS


summation - pending
CARBON
AND ECOLOGICAL FOOTPRINTS


summation - pending

PROJECT INFORMATION
PROJECT INFORMATION
summation

Whether it's used to better understand a design's performance or to streamline the process of submitting for the COTE Top Ten award, this tool will allow easy, consistent calculation and evaluation of project performance metrics and benchmarking.
Note: This version is not compatible with Excel 2016 or older.
For questions email cote@aia.org, we are looking to improve the tool, and appreciate your feedback!
This
Development team
Helena Zambrano, AIA (Project Lead)
Mahlum Architects, Portland, OR
Corey Squire, AIA
Bora Architects, Portland, OR
Tate Walker, AIA
OPN, Madison, WI
Z Smith, FAIA EDR, New Orleans, LA
Billie Faircloth, FAIA
KieranTimberlake, Philadelphia, PA
Janki A Vyas, AIA
KARMA co/lab, Philadelphia, PA
Ryan Welch
KieranTimberlake, Philadelphia, PA
Note:
summation - pending

DESIGNING FOR INTEGRATION
DESIGNING
FOR
INTEGRATION summation - pending
DESIGNING FOR INTEGRATION summation - pending
IMAGE: Topography and Hydrography TNM Download V2, accessed February 4855
IMAGE: Sun Path - Winter Solstice https://www.suncalc.org/#/40.5269,-
IMAGE: Sun Path - Summer Solstice https://www.suncalc.org/#/40.5269,-

IMAGE: Rainfall - January 2022
NCEI GIS Team, “Monthly Summaries,”


IMAGE: Temperature Average NCEI GIS Team, “Monthly Summaries,”

IMAGE: Wind Data https://globalwindatlas.info/National Centers
IMAGE: Vegetation John Schimenti PC
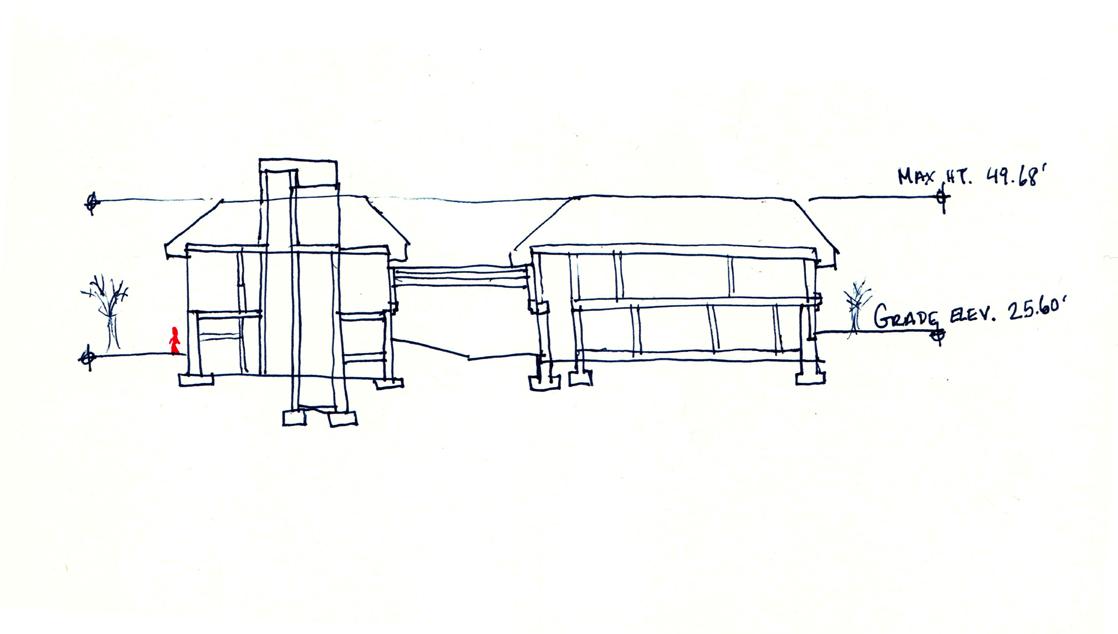
IMAGE: Section Sketch Grade Conditions


DESIGNING FOR INTEGRATION
summation - pending
NEIGHBORHOOD AND COMMUNITY
From the Spanish Colony, to upscale residential.
10132 RICHMOND HILL
HISTORY AND GEOGRAPHY
> The community of Annadale was named circa 1860 after Anna Seguine, a descendant of French Huguenots who were among the South Shore’s earliest settlers. In 1929, immigrants from Spain purchased land along the Annadale shoreline, which became known as the Spanish Colony. In early years of the settlement, bungalows were built at the site. Buildings, as well as the abundant woodland, were demolished at the end of the 20th century to make room for large, upscale homes. A city park in the heart of the neighborhood was converted into a wildlife preserve; known as Blue Heron Park Preserve. This park spans 222 acres, and has ponds, swamps and small streams which empty into Raritan Bay.


> Hurrican Sandy significantly damaged the Ocean View Estates, however many were repaired and rebuilt.

> The creation of the South Shore Business Improvement District will mean additional resources for sanitation, security, holiday tree lighting and events ina small green space called Annadale Green.

citation-pending
citation-pending
DESIGNING FOR INTEGRATION
summation - pending
ECONOMIC HISTORY AND DEMOGRAPHICS
10132 Richmond Hill POPULATION AND INCOME
2020 CENSUS DEMOGRAPHICS


> Annadale is a middle class neighborhood on the South Shore of Staten Island, NY.


> This area of Richmond Hill has a higher median household income and average household income than New York State. Furthermore, within the 10312 zip code, the median income is higher than the outlying areas.
> With a population of 61,392, the majority is White, followed by Hispanic and Asian populations.

DESIGNING FOR INTEGRATION
summation - pending
REGIONAL MATERIALS
Timber, stone, brick, concrete and sand.
NEW YORK
MATERIAL CULTURE AND HISTORY
> Frame constructions dominate for dwelling unit materials. The concentration of stone structures is in urban centers, due to availability and urban affluence.


> Tabby concrete is a more local material used at the coast, where the use of a waste marine sea shell product is incorporated into a concrete mix as an aggregate replacement. Utilising shells reduces the storage of shell waste, also reducing the need for quarried aggregate.

DESIGNING FOR INTEGRATION
summation - pending
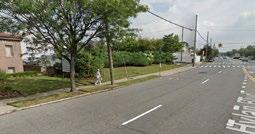
TRANSPORTATION: WALK SCORE 31 TRANSIT SCORE 50
The Staten Island Railway serves the Annadale location of this site. Local and express buses are also stationed throughout. Although ample public transportation is available, people are prone to drive for transportation. The neighborhood is bike friendly.


 citation-pending
Sketch of an Albany Brick Cottage
New York: Stone Dwellings 1855, By County
New York: Frame Dwellings 1855, By County
New York: Brick Dwellings 1855, By County
citation-pending
Sketch of an Albany Brick Cottage
New York: Stone Dwellings 1855, By County
New York: Frame Dwellings 1855, By County
New York: Brick Dwellings 1855, By County
DESIGNING FOR INTEGRATION
summation - pending
NARRATIVE
The community of Annadale was named circa 1860 after Anna Seguine, a descendant of French Huguenots who were among the South Shore’s earliest settlers. In 1929, immigrants from Spain purchased land along the Annadale shoreline, which became known as the Spanish Colony. In early years of the settlement, bungalows were built at the site. Buildings, as well as the abundant woodland, were demolished at the end of the 20th century to make room for large, upscale homes. A city park in the heart of the neighborhood was converted into a wildlife preserve; known as Blue Heron Park Preserve. This park spans 222 acres, and has ponds, swamps and small streams which empty into Raritan Bay.
The median household income for Richmond Hill is $82,783, which is higher than the New York state average ($63,998). The average income for the Annadale community is higher than that, at approximately $97,000. The site has an income population that falls within the majority clientele of fertility clinics. The accessibility by train, bus and bike allows for people in neighboring Brooklyn and Manhattan to get treatment in a more serene natural environment. While a higher income population is desirable for profit in a fertility clinic, this site can be reached by lower income neighborhoods
easily, removing urban stressors that can harm results in the fertility process. Beyond client satisfaction, staff satisfaction is also critical. Research shows that indoor environmental quality correlates with job satisfaction and worker productivity. The environmental comfort variables, such as temperature, air quality, and access to natural light and views, are all intended to increase patient and staff satisfaction.
Climate-disrupting greenhouse gases and other harmful emissions are directly and indirectly generated by raw extraction, production, transport, and disposal of materials across the globe. Impacts felt at the local level includes deforestation, water contamination, and soil degradation. Using locally extracted and manufactured products and materials; incorporating materials generated by local salvage operations and recyclers; and creative reusing materials existing on-site can also greatly reduce energy use and harmful emissions associated with transporting construction materials while saving money. Responsible material and waste management also lessens burden on landfills. The use of a waste marine sea shell product is incorporated into a concrete mix as an aggregate replacement. Utilizing shells reduces the storage of shell waste, also reducing the need for quarried aggregate. This is known as Tabby concrete, which is used
in combination with timber to is used as a structural material in place of traditional concrete. Other locally available materials in the region are timber, stone, brick, concrete and sand. The design of the building follows historical guidelines, and is inspired by the residential surrounding frame construction houses.
COMMUNITIES
summation - pending
Measure 2
‐
Design for Equitable Communities
Walkscore.com generates several scores for walkability and community resources for any address in the US.
The higher the score, the more pedestrian‐friendly the site.
Based on Sherry A Arnstein's, "A Ladder of Citizen Participation", what was the level of community engagement during the design and construction process?
This simple calculator compares your project's commuting patterns to published national averages. Use a survey (or an educated guess) to determine the average commuting distance and average mpg of the building's occupants.
If no information is available, use the baseline (US national average). Though it's designed for office projects, the calculator can produce good results for all buildings that people travel to and from.
SUN SHADING AND PHSYCHROMETRIC CHARTS
SUN SHADING CHART
DATA SOURCE TMY3
J F Kennedy Intl Airport, NY, USA
40.65 DEG NORTH, 73.8DEG WEST
The TMY3 data for JFK is used for this site as it is the most similar available conditions to Staten Island Site. While EWR Airport data is available, JFK is likely to have a more similar climate due to it’s proximity to the ocean.

J F Kennedy Intl Airport, NY, USA
40.65 DEG NORTH, 73.8DEG WEST
December 21 to June 21
NORTH Shade Needed
FINS FOR SHADING
AT 60 DEG. 18 HRS EXPOSED
> Horizontal Fins: Minimal horizontal fins is needed, as the North facing side does not get much sun. NOTE: Chart shown has a shade angle of approximately 60 degrees.
> Vertical Fins: Approx. 15-17 degrees
SOUTH Shade Needed
FINS FOR SHADING
TO ACHIEVE 0 HRS EXPOSED
> Horizontal Fins: 50-55 degrees
> Vertical Fins: Horizontal fins bring the exposed hours to zero, therefore vertical fins are not needed in this scenario.
> This facade receives the most sun and will need the most intervention.
REIMAGINING THE WOMEN’S FERTILITY CLINIC SAMANTHA AHMED
SUN SHADING CHART
EAST
Shade Needed
FINS FOR SHADING
TO ACHIEVE 0 HRS EXPOSED
> Horizontal Fins: 20 degrees
> Vertical Fins: Horizontal fins bring the exposed hours to zero, therefore vertical fins are not needed in this scenario.
PSYCHROMETRIC CHART DESIGN STRATEGIES
100% COMFORTABLE HOURS
TARGET OF DESIGN STRATEGIES
> #16 - Heating and Humidification (3937 hrs) - Priority 1
> #9 Internal Heat Gain (1856 hrs)Priority 2
STRATEGY #19 Addressing heat gain
PASSIVE SOLAR HEATING

GLASS AREA TO SOUTH
> This strategy will allow for full shade in the summer, which treats the issue of the South facade of the building being the most exposed to the sun.
WEST
Shade Not Needed
FINS FOR SHADING
TO ACHIEVE 0 HRS EXPOSED
> Horizontal Fins: 0 degrees = No fins
> Vertical Fins: 0 degrees = No fins
STRATEGY #20 Addressing heat gain
DOUBLE PANE HIGH PERFORMANCE GLAZING

GLAZING AT WEST, NORTH AND EAST
> This strategy further refines strategt #19, and provides a typical solar heat gain coefficient of .42 (at 58%, or 10% higher than at the clear face at the South).
DESIGN FOR ECOLOGY
DESIGN FOR ECOLOGY
LEVEL OF ECOLOGICAL DESIGN
Intentional Design Strategies Landscape and Zoning
INTEGRATED DESIGN PLANNING
The Fertility Clinic that I am introducing is an addition to an existing medical center. Therefore, some of the existing building will remain. The site has topographic and tree regulations, so it is mandatory to preserve trees that are on site. One tree for each 25’ of street frontage is required, and while 10 trees exist, 2 new trees will be planted to comply. Special landscaping and buffering of 4’ is required, which will also be in compliance. The zoning requires 1 car per 400sf for parking. There is existing parking for 9 cars, and 12 total car parking spots are being provided at grade to meet the new occupancy. Given these zoning requirements, the level of ecological design is impacted by habitat conservation and the abatement of specific regional environmental concerns. plan to design for soil conservation, which works well with the conservation of the vegetation.
Measure 3 ‐ Design for Ecology
Determine the area of the site reserved for vegetation, both before and after development by subtracting all impervious areas from the site area. Green roofs are included in the percent vegetated calculations.
1 ‐ Vegetated Area
Green roof area 5,000 sf sf
In most cases, it's desirable to increase a site's vegetated area.
Native plants include those that are indigenous to a specific geographic location and are adapted for the local climate and ecosystems. Use "turf grass" for any landscape areas with decorative plants not adapted to the local climate.
Identify the strategies implemented by the project to help users become more aware or connected with the site and their regional ecosystems.
2 ‐ Native Plantings
Building footprint area12,247 sf 3,708 sf Surface parking area 4,830 sf 3,708 sf Area of additional on site hardscapes 400 sf sf Area of the total site that is vegetated 7,842 sf 12,903 sf Site Area20,319 sf 20,319 sf Percent vegetated38.6% 63.5% Increase in Percent of vegetated area ‐24.9% Area of the total site covered by native plants‐ Post Development 8,000 sf Area of the total site covered by turf grass ‐ Post Development ‐ sf Native plantings ‐ Percent of vegetated area102.0% Turf grass ‐ Percent of Site0.0% Native plantings ‐ Percent of site39.4% Intentional design strategies were used to promote: BiodiversityNo
DESIGN FOR WATER
A greater percentage of native plants and a smaller percentage of turf grass is usually preferable. 3 ‐ Level of Ecological Design
are all areas of ecological concern, so a higher score is good.
SkiesNo
SafetyNo
ConservationYes
SequestrationNo
Conservation, Flora/FaunaYes
of Specific Regional Environmental ConcernsYes
Ecological Design Score37.5%
January31% 178.1 February38% 218.3 March60% 344.7 April77% 442.4 May88% 505.6 June99% 568.8 July100% 574.5 August100% 574.5 September77% 442.4 October60% 344.7 November38% 218.3 December30% 172.4
Month
January11,710 10,021 1,689
February11,750 10,061 1,689
March11,876 10,187 1,689
April11,974 10,285 1,689
May12,037 10,348 1,689
June12,100 10,411 1,689
July12,106 10,417 1,689
August12,106 10,417 1,689
September11,974 10,285 1,689
October11,876 10,187 1,689
November11,750 10,061 1,689
December11,704 10,015 1,689
17,000 1,900
17,000 1,900
17,000 1,900
17,000 1,900
17,000 1,900
17,000 1,900
17,000 1,900
17,000 1,900
1,900
17,000 1,900
17,000 1,900
17,000 1,900
204,00022,800
IMAGE: CIRCULATION PERCENTAGE 28%
CALCULATION METHOD:

THE PROPOSED BUILDING AREA IS 12,246.6 SQ. FT. INCLUDED THE ELEVATORS, STAIRS AND CORRIDORS IN THE CIRCULATION AREA. THE CELLAR IS NOT INCLUDED AS FLOOR AREA FOR THIS SITE, WHERE THERE IS A PARKING GARAGE.

LOOKING AT EFFICIENCY, DO NOT THINK MOVING THE CIRCULATION TO THE EXTERIORS WILL IMPROVDE THE CONDITIONS. THE CIRCULATION ALLOWS FOR TREATMENT AREAS ON BOTH SIDES OF THE CORRIDORS, CLOSEST TO WINDOWS, WHICH IS PREFERRED FOR HEALTH FACILITIES.


THE INSULTECH SYSTEM IS MANUFACTURED LOCALLY. THIS IS THE HIGHEST PERFORMING INSULATED SYSTEM AVAILABLE ON THE MARKET. THE SYSTEM IS INSTALLED AS A COMPLETE ASSEMBLY, WHICH ELIMINATES THE INEFFICIENCIES IN CONSTRUCTING CAVITY WALLS. THE R-VALUE IS 16.2 AT 75 DEGREES FARENHEIGHT. THIS PRODUCT IS OFFERED IN A RANGE OF FINISHES. MASONRY IS HIGHLY ENVIRONMENTALLY FRIENDLY DUE TO ITS REDUCED EMBODIED ENERGY COMPARED TO OTHER STRUCTURAL MATERIALS.

ACACIA TREES CAPTURE CARBON FROM THE ATMOSPHERE, AND PRODUCTS BUILT WITH THIS WOOD WORK AS LONG LASTING CARBON STORAGE. THE TREES ARE FAST GROWING, WHICH MAKE IT A SUSTAINABLE SUPPLY OF TIMBER. MANUFACTURING WITH THIS WOOD HAS A LOW CARBON FOOTPRINT WHEN WOOD WASTE IS USED TO MAKE BY-PRODUCTS.

BUILDERS CAN WORK FASTER WITH CLT, WHICH SAVES MONEY AND CONSTRUCTION TIME. CLT HAS EXCELLENT STRENGTH AND DURABILITY, AS WELL AS HIGH THERMAL AND INSULATING PROPERTIES. SINCE THE PANELS ARRIVE ON THE SITE PREFABRICATED, THERE IS LESS WASTE ON BUILDING SITES. THE PRODUCT ALSO RESISTS MOISTURE WELL.

DAYTIME
IMAGE: HEAT MAP DAYTIME USE NIGHTTIME USE
THE HEAT MAP WAS CREATED BY ASSUMING THAT THE STAIRS AND ELEVATOR THAT PROVIDES MORE PATIENT ACCESS WILL HAVE MORE CIRCULATION. THE TREATMENT AREAS HAVE HIGHER CIRCULATION ACTIVITY.

THE OPERATION AREAS ARE LIKELY TO BE USED LESS FREQUENTLY, AS APPOINTMENTS ARE SPACED FURTHER APART. STAFF AREAS WOULD HAVE LESS ACTIVITY THAN PATIENT/STAFF INTERACTION.
AT NIGHT, THERE WOULD BE LITTLE TO NO PATIENTS IN THE SPACE. THE BOH OPERATIONS WOULD BE MORE OCCUPIED.
Step
or generation per fuel type. Use energy model outputs for predicted energy and a utility bill for measured energy. On‐site renewables calculations in this spreadsheet require gross metering, not net‐metering values. If an energy model was not completed for the project, just fill out the measured energy use. fuel type was not used, leave the monthly inputs as Zero.
Step ‐ Enter the local energy cost for each fuel type available. The cost of renewables calculated as negative.
projects using Chilled Water for cooling, use the dropdown to assign the appropriate carbon conversion factor by system type. The default natural gas absorption chiller.
January15,000.0 2,500.0 12,000.0
February15,000.0 2,500.0 11,000.0
March15,000.0 2,500.0 13,500.0
April15,000.0 2,500.0 14,900.0
May15,000.0 2,500.0 17,800.0 June15,000.0 2,500.0 21,300.0 July15,000.0 2,500.0 24,100.0
August15,000.0 2,500.0 21,800.0
September15,000.0 2,500.0 19,400.0 October15,000.0 2,500.0 16,700.0 November15,000.0 2,500.0 13,300.0 December15,000.0 2,500.0 12,200.0 Total 180,000 0 0 030,000198,000 0000
IMAGE: DESIGN FOR ENERGY
Predicted Energy Consumption Measured Monthly Energy Use
The monthly grid electricity values are estimated. The lighting power density is below the benchmark.
NIGHTTIME
DESIGN FOR ENERGY
IMAGE: RESULTS/LIFE CYCLE STAGE Concrete and Carpet Itemized by Divisions
DESIGN FOR ENERGY

AND RESOURCES
Impacts and Credits
CONCRETE AND CARPET
The aspects of LCA include manufacturing, construction, use, end of life, and module D. You can trace a material’s emissions to soil, to air, and to water. The product composition includes the material itself and how it is composed. On the left side is concrete and carpet, and on the right is the wood (LVL) and vinyl. Looking at the results per Life Cycle Stage, we can see some differences in the Global Warming Potential. For the concrete material has a larger amount of maintenance and replacement.
IMAGE: RESULTS/LIFE CYCLE STAGE Wood and Vinyl Itemized by Divisions
DESIGN FOR ENERGY
AND RESOURCES
Impacts and Credits
WOOD AND VINYL
The product itself for the wood has a Module D value (reuse, recovering, recycling), meaning that there are credits towards the end of the life cycle. Wood can absorb carbon, and there is a negative indicator which is seen in the red quantity of the chart. The end of life has a large value because of some of the processing of the wood material. Wood can be recycled, and therefore has a better value in the chart than concrete.
MATERIAL ASSEMBLIES
MATERIALS
IMAGE: SANKEY AND BAR DIAGRAMS
Concrete and Carpet
EC3
MATERIAL ASSEMBLIES
Floors
CONCRETE

Pending Boxplot chart is not working
Compare Plant to Plant:
Compare by Product: GWP Sankey and LEED Bar Chart


Narrative:
IMAGE: SANKEY AND BAR DIAGRAMS Wood and Vinyl
EC3
MATERIAL ASSEMBLIES
Floors
WOOD
Pending Boxplot chart is not working
Compare Plant to Plant: Compare by Product: GWP Sankey and LEED Bar Chart Narrative:


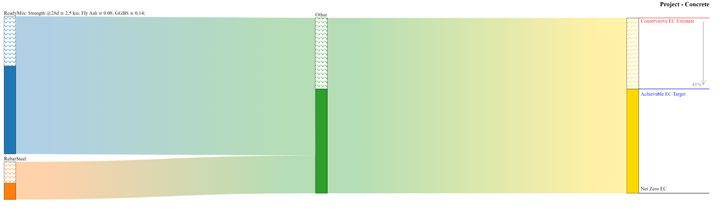
IMAGE: SANKEY AND BAR DIAGRAMS
BT Resideential Mid-Rise
EC3
MATERIAL ASSEMBLIES
Floors
BT RESIDENTIAL MID-RISE
Pending Boxplot chart is not working
Compare Plant to Plant: Compare by Product: GWP Sankey and LEED Bar Chart

Narrative:

IMAGE: Caption Caption
WINDOWS AND DAYLIGHTING
IMAGE: CALCULATIONS
Window Wall Ratio
WINDOW WALL RATIO
IMAGE: ALLIANCE KAI
By Hentrich PetschniggDAYLIGHTING PATTERN GUIDE
Facades
GLAZING CALCULATIONS

Sustainable buildings should have a WWR in the range of 25% to 40%. Glazing provides views and natural light into the building, however it does not have good insulating properties. By calculating each facade, the glazing can be reduced or increased to find a balance between the design and the insulation. In this example, the glazing on the South side is highest in square footage. For my own project, would reduce glazing on the southern facing facade where there would be stronger sun. The East, West, and North sides fall within a good range.


Program and Natural Lighting COMPARATIVE STUDY
Pattern 1 in plan relates to my project site, which is also near the water. This is a large office building, and is much larger in scale than the clinic I am proposing. However, the intervals between the masses allows for ample lighting and views. plan to introduce a courtyard to my project to work similarly in creating glazing towards the center of the mass. Similarly, the majority of the floor area will fall into a daylit zone. Glare and overheating can be controlled with blinds or other architectural shading systems.
IMAGE: HORIZONTAL BAND Glazing Solution

DAYLIGHTING

Program and Natural Lighting
COMPARATIVE STUDY
Pattern 2 in section provides 75% of the wall area as a horizontal band of windows.
This meets and exceeds the minimum daylighting recommendation at 95% illumination across 26’. The back wall is receiving some lighting, where as less glazing would leave the back wall dark, even while meeting the minimum criteria. This is for windows above 300 LUX.
[This page intentionally left blank for the purpose of double-sided printing.]
IMAGE: COTE WELLNESS Calculations
DESIGN FOR WELLNESS
VIEWS AND MATERIALS
Health Benefits Through Views and Materials
WELLNESS STUDY
The site is located in a residential area with views towards the Ocean. My building is also at the corner of a street. This allows for many opportunities for views. There is a large amount of windows, and many are operable. The windows are important for reducing stressors in a clinic environment, and provide positive distractions.
IMAGE: COTE RESOURCES Calculations


IMAGE: COTE CHANGE
Calculations

