net lease tenant report



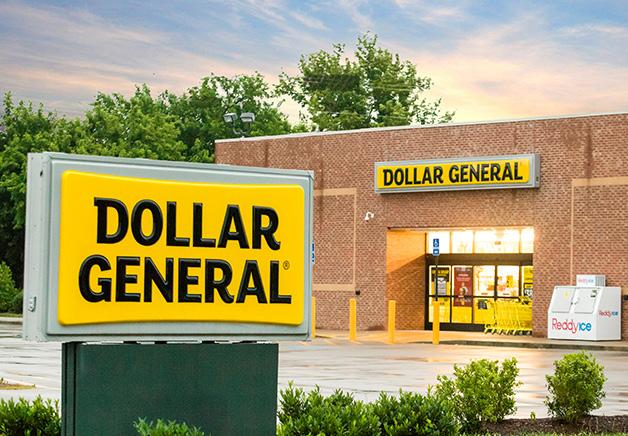


WWW.MATTHEWS.COM
current on market data


KEY STATISTICS
cap rate correlation
cap rate comparison
typical lease structure
Type NNN or Ground Lease

recent sales comparables

Net Lease Tenant Report | 2
Stock
Credit
Market
Total
Headquarters
5
10
New
Symbol SVNDF
Rating (S&P) A
Cap ±$38.87B
Locations ±78,000
Dallas, TX
Years Remaining 5.80%
Years Remaining 5.35%
Construction (15-20 Years) 5.00%
Rent
Lease
Avg.
Typical
Avg. Sales
Lease
Increases 5-10% Every 5 Years
Term 15 Years
Annual Rent $300,000
SF ±3,500
-
CITY STATE PRICE CAP TERM LEFT BUILT SOLD Rancho Cordova CA $10,200,000 4.46% 15 Years 2022 11/17/22 Perris CA $5,000,000 4.51% 15 Years 2022 11/10/22 Coconut Creek FL $7,986,500 4.25% 14 Years 2022 11/1/22 Los Angeles CA $7,320,000 5.01% 15 Years 1951/2001 10/11/22 Rosenberg TX $5,250,000 4.00% 13 Years 2020 9/29/22 Lady Lake FL $9,314,000 4.28% 15 Years 2022 9/23/22 Richmond TX $7,350,000 4.00% 15 Years 2022 9/23/22 La Salle CO $5,966,000 4.65% 15 Years 2022 9/23/22 Newport News VA $7,340,000 4.38% 15 Years 2005/2022 9/21/22 Suffolk VA $3,100,000 5.27% 7 Years 2009 9/20/22
Number of Listings 139 Avg. Cap Rate 4.90% Avg. Lease Term Remaining 13 Years Avg. Price $5,762,500 Lowest Cap Rate 3.50% Highest Cap Rate 7.00% transactions Transactions 75 68 Avg. Cap Rate 4.50% 4.40% Avg. Term Remaining 12 Years 13 Years Avg. Sale Price $5,383,135 $5,046,576 H2 2022 H1 2022 5 15 10 1 4.00% YEARS REMAINING ON LEASE 20 CAP RATE
5.00% 7.00% 6.00%
current on market data


recent sales comparables


Net Lease Tenant Report | 3 KEY STATISTICS Stock Symbol AAP Credit Rating (S&P) BBBMarket Cap ±$8.79B Total Locations ±5,060 Headquarters Raleigh, NC cap rate comparison 5 Years Remaining 6.50% 10 Years Remaining 5.75% New Construction (15-20 Years) 5.00% typical lease structure Lease Type NN or NNN Rent Increases 5% Every 5 Years and In Options Lease Term 15 Years Avg. Annual Rent $105,000 Typical SF ±7,000 Avg. Sales $1,500,000
CITY STATE PRICE CAP TERM LEFT BUILT SOLD Aurora CO $2,400,000 5.30% 10 Years 2004 11/7/22 Newnan GA $1,800,000 5.85% 10 Years 2010 2/21/22 Rocky Mount VA $1,685,000 5.50% 10 Years 1992 5/17/22 South Elgin IL $2,261,000 6.30% 5 Years 2006 7/12/22 Loris SC $1,415,000 6.18% 5 Years 2004 3/24/22 Sturgeon Bay WI $855,000 5.85% 10 Years 1973 2/25/22 Leesburg FL $2,191,000 5.75% 9 Years 2008 1/18/22 Jacksonville FL $1,750,000 6.25% 6 Years 2006 7/1/21 Richmond VA $1,309,448 5.75% 10 Years 2002 6/22/22 Morgantown KY $1,425,000 6.33% 8 Years 2015 5/11/21
Number of Listings 37 Avg. Cap Rate 5.95% Avg. Lease Term Remaining 10 Years Avg. Price $2,071,483 Lowest Cap Rate 4.50% Highest Cap Rate 7.85% transactions Transactions 32 30 Avg. Cap Rate 6.70% 6.92% Avg. Term Remaining >6 Years >6 Years Avg. Sale Price $2,682,394 $2,292,920 H2 2022 H1 2022
recent sales comparables


Net Lease Tenant Report | 4
KEY STATISTICS Stock Symbol AZO Credit Rating (S&P) BBB Market Cap ±$46.31B Total Locations ±6,700 Headquarters Memphis, TN 5 Years Remaining 6.50% 10 Years Remaining 5.25% New Construction (15-20 Years) 4.50%
structure Lease Type Ground Lease Rent Increases 10% Every 5 Years in Options Lease Term 15 Years Avg. Annual Rent $100,000 Typical SF ±6,800 Avg. Sales $2,200,000
cap rate comparison
typical lease
CITY STATE PRICE CAP TERM LEFT BUILT SOLD Muskego WI $2,025,000 5.87% 10 Years 2006 1/24/22 Alpharerra GA $2,425,000 5.49% 3 Years 1989 2/23/22 McDonough GA $1,325,000 5.50% 4 Years 2007 2/24/22 Canton OH $3,714,000 4.74% 10 Years 1987 4/12/22 Stockton CA $2,500,000 5.27% 3 Years - 4/21/22 Denton TX $2,390,000 3.95% 8 Years 2009 4/25/22 Vandalia OH $1,053,000 4.75% 9 Years 2015 5/16/22 Clermont FL $2,350,000 3.98% 15 Years 2009 5/16/22 Portland OR $3,794,697 4.45% 10 Years 1957 6/15/22 Dover TN $1,525,000 5.36% 10 Years 2010 7/29/22
data Number of Listings 21 Avg. Cap Rate 4.75% Avg. Lease Term Remaining 10 Years Avg. Price $2,100,000 Lowest Cap Rate 4.00% Highest Cap Rate 5.79% transactions Transactions 35 25 Avg. Cap Rate 4.50% 4.75% Avg. Term Remaining 12 Years 12 Years Avg. Sale Price $2,315,235 $2,278,348 H2 2022 H1 2022
rate correlation CAP RATE 6.00% 4.00% 5.00% 5 15 10 20 YEARS REMAINING ON LEASE 1 7.00%
current on market
cap
recent sales comparables

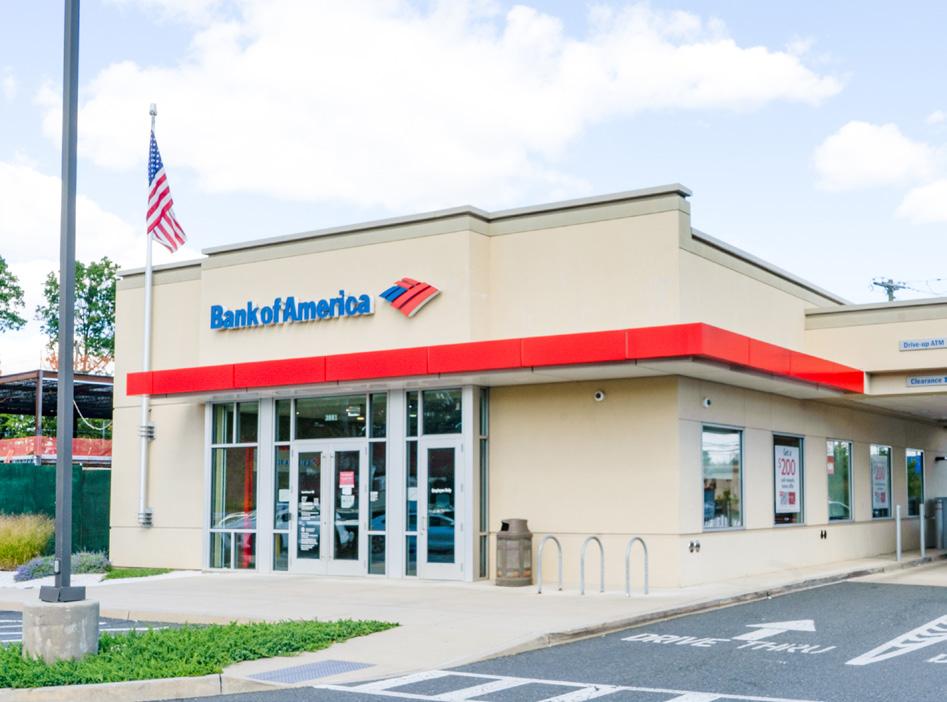


KEY STATISTICS cap rate comparison Stock Symbol BAC Credit Rating (S&P) AMarket Cap ±$289.45B Total Locations ±3,905 Headquarters Charlotte, NC 5 Years Remaining 6.00% 10 Years Remaining 5.25% New Construction (15-20 Years) 4.50%
Lease Type Ground Lease Rent Increases 10% Every 5 Years Lease Term 15 Years Avg. Annual Rent $120,000 Typical SF ±3,250 Avg. Deposits $95,000,000 Net Lease Tenant Report | 5
typical lease structure
CITY STATE PRICE CAP TERM LEFT BUILT SOLD Fort Worth TX $2,420,000 4.24% 10 Years 2017 9/30/22 Miami FL $4,570,000 5.00% 6 Years 1983 6/23/22 Saint Paul MN $6,000,000 5.08% 15 Years 2020 4/12/22 San Luis Obispo CA $12,000,000 4.20% 15 Years 2018 8/31/22 Chicago IL $4,500,000 6.05% 5 Years 2004 1/31/22 Columbus OH $1,920,000 4.50% 15 Years 2022 3/1/22 Columbus OH $2,450,000 4.40% 15 Years 2022 9/30/22
Number of Listings 12 Avg. Cap Rate 5.60% Avg. Lease Term Remaining 7 Years Avg. Price $3,800,000 Lowest Cap Rate 3.50% Highest Cap Rate 8.00% transactions Transactions 7 6 Avg. Cap Rate 5.00% 4.60% Avg. Term Remaining 9 Years 12 Years Avg. Sale Price $4,000,000 $4,500,000 H1 2022 2021 cap rate correlation CAP RATE 6.00% 3.00% 4.00% 5.00% 7.00% 5 15 10 20 YEARS REMAINING ON LEASE 1 8.00%
current on market data
typical lease structure
current on market data


recent sales comparables
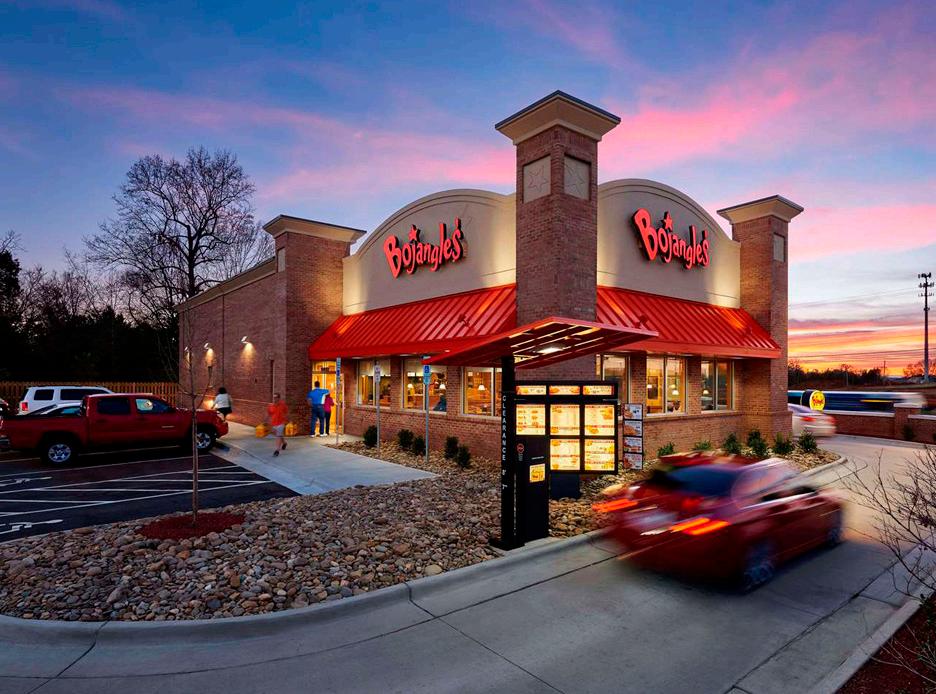
Net Lease Tenant Report | 6 KEY STATISTICS cap rate comparison Stock SymbolCredit Rating (S&P) NR Market Cap ±$604.18M Total Locations ±760 Headquarters Charlotte, NC 5 Years Remaining 5.75% 10 Years Remaining 5.40% New Construction (15-20 Years) 4.75%
Lease Type NNN or Ground Lease Rent Increases 5-10% Every 5 Years, or 1-2% Annually Lease Term 20 Years Avg. Annual Rent $145,000 Typical SF ±3,250 Avg. Sales $1,750,000
Number of Listings 18 Avg. Cap Rate 5.42% Avg. Lease Term Remaining 13 Years Avg. Price $2,278,131 Lowest Cap Rate 4.50% Highest Cap Rate 6.22% transactions Transactions 20 13 Avg. Cap Rate 5.37% 5.59% Avg. Term Remaining 15 Years 12 Years Avg. Sale Price $2,461,626 $2,508,651 H2 2022 H1 2022
CITY STATE PRICE CAP TERM LEFT BUILT SOLD Memphis TN $2,300,000 4.25% 20 Years 2022 11/1/22 Morristown TN $3,250,000 5.39% 11 Years 2012 7/20/22 Rockmart GA $3,284,211 5.70% 7 Years 2007 7/29/22 Mariett GA $3,541,700 5.60% 15 Years 2005 3/18/22 Augusta GA $2,604,000 6.00% 15 Years 1982 3/22/22 Greensboro NC $3,236,500 4.60% 15 Years 2018 3/11/22 Marion VA $2,411,323 6.65 11 Years 2017 2/24/22 McDonough GA $2,491,766 5.40 23 Years 2018 2/17/22 Fort Mill SC $3,125,000 5.24% 8 Years 2015 1/24/22 Villa Rica GA $2,200,000 5.24% 7 Years 2012 2/11/22 CAP RATE 5 15 10 1
rate correlation 4.00% YEARS REMAINING ON LEASE 7.00% 20 6.00% 5.00%
cap
typical lease structure


current

recent sales comparables
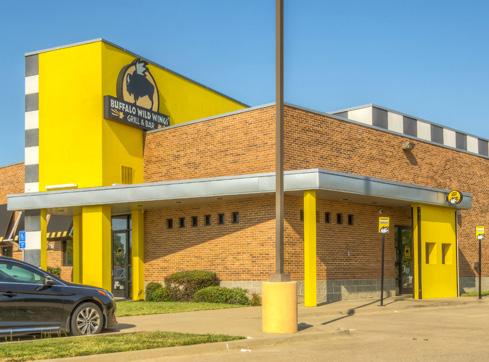
Net Lease Tenant Report | 7 KEY STATISTICS cap rate comparison Stock Symbol BWLD Credit Rating (S&P) NR Market Cap ±$2.437B Total Locations ±1,232 Headquarters Atlanta, GA 5 Years Remaining 7.00% 10 Years Remaining 6.50% New Construction (15-20 Years) 6.00%
Lease Type NN or NNN Rent Increases 10% Every 5 Years Lease Term 10 or 15 Years Avg. Annual Rent $242,386 Typical SF ±6,500 Avg. Sales $3,061,956
data Number of Listings 7 Avg. Cap Rate 6.60% Avg. Lease Term Remaining 7 Years Avg. Price $4,329,314 Lowest Cap Rate 5.95% Highest Cap Rate 8.00% transactions Transactions 3 6 Avg. Cap Rate 5.84% 6.28% Avg. Term Remaining 11 Years 14 Years Avg. Sale Price $3,755,000 $3,889,600 H2 2022 H1 2022
on market
CITY STATE PRICE CAP TERM LEFT BUILT SOLD Crystal Lake IL $4,198,000 6.55% 9 Years 2008 10/27/22 Marion IL $2,725,000 - - 2017 10/24/22 Bridgewater NJ $6,000,000 6.35% 20 Years - 9/26/22 Princeton NJ $4,000,000 6.35% 20 Years - 9/26/22 Warrensville Heights OH $2,525,000 5.85% 9 Years 2012 9/14/22 Carlsbad NM $4,065,500 5.55% - 2015 6/7/22 Indianapolis IN $4,050,000 5.97% 7 Years 2013 4/11/22 Rome GA $3,150,000 6.00% 15 Years 2022 3/30/22 CAP RATE 5 15 10 1 cap rate correlation 5.00% YEARS REMAINING ON LEASE 8.00% 20 7.00% 6.00%
current on market data


Net Lease Tenant Report | 8 KEY STATISTICS cap rate comparison Stock Symbol QSR Credit Rating (S&P) BBMarket Cap ±$30.27B Total Locations ±7,141 Headquarters Miami, FL 5 Years Remaining 6.00% 10 Years Remaining 5.50% New Construction (15-20 Years) 4.50%
Lease Type NNN or Ground Lease Rent Increases 5-10% Every 5 Years or 1-2% Annually Lease Term 20 Years Avg. Annual Rent $135,000 Typical SF ±3,000 Avg. Sales $1,400,000
typical lease structure
Number of Listings 77 Avg. Cap Rate 5.43% Avg. Lease Term Remaining 14 Years Avg. Price $2,585,530 Lowest Cap Rate 4.00% Highest Cap Rate 12.00% transactions Transactions 35 32 Avg. Cap Rate 5.30% 5.10% Avg. Term Remaining 13 Years 12 Years Avg. Sale Price $2,400,000 $2,300,000 H2 2022 H1 2022
CITY STATE PRICE CAP TERM LEFT BUILT SOLD Moreno Valley CA $2,468,000 4.00% 12 Years - 11/16/22 New Orleans CA $1,350,000 5.55% 20 Years 1980 11/2/22 Independence MO $1,500,000 5.50% 12 Years - 10/31/22 Kernersville NC $2,260,000 4.25% 16 Years 2018 10/14/22 Orlando FL $2,000,000 5.00% 7 Years 1985 9/23/22 Camden TN $1,123,000 4.65% 15 Years 2017 9/9/22 Goodyear AZ $2,350,000 4.68% 11 Years 2007 9/3/22 Kenosha WI $1,875,000 5.36% 10 Years 1985 8/26/22 Olive Branch MS $2,439,132 5.30% 15 Years 2016 8/18/22 Victoria TX $3,664,000 4.00% 20 Years 2021 8/4/22 CAP RATE 5 15 10 1 cap rate correlation 4.00% YEARS REMAINING ON LEASE 7.00% 20 5.00% 6.00%
recent sales comparables
current


recent

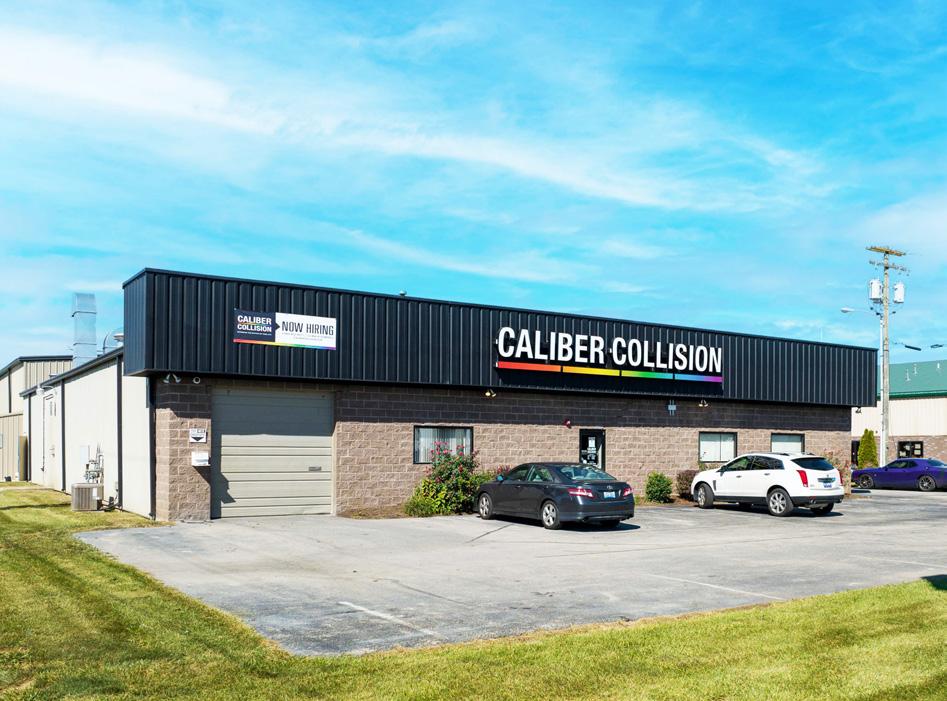


Net Lease Tenant Report | 9 KEY STATISTICS cap rate comparison Stock SymbolCredit Rating (S&P) Private Market Cap Private Total Locations ±1,500 Headquarters Lewisville, TX 5 Years Remaining 6.50% 10 Years Remaining 5.75% New Construction (15-20 Years) 5.25%
Lease Type NNN or NN Rent Increases 10% Every 5 Years Lease Term 15 Years Avg. Annual Rent $199,783 Typical SF ±15,000 Avg. Sales Does Not Report
typical lease structure
data Number of Listings 39 Avg. Cap Rate 5.73% Avg. Lease Term Remaining 13 Years Avg. Price $3,761,000 Lowest Cap Rate 5.00% Highest Cap Rate 6.50% transactions Transactions 11 20 Avg. Cap Rate 5.60% 5.40% Avg. Term Remaining 10 Years 13 Years Avg. Sale Price $3,378,000 $3,743,000 H2 2022 H1 2022
on market
sales
CITY STATE PRICE CAP TERM LEFT BUILT SOLD Deland FL $5,659,550 5.00% 15 Years 2022 12/22/22 Cudahy WI $1,986,300 5.35% 12 Years 2020 10/12/22 Orlando FL $7,800,000 4.75% 13 Years 2020 8/25/22 Dover DE $2,496,000 6.00% 8 Years 1983 8/1/22 Centennial CO $3,830,000 5.50% 3 Years 2000 7/8/22 Friendswood TX $3,550,000 5.60% 10 Years 2004 6/27/22 Milford OH $1,200,000 5.84% 6 Years 1986 6/10/22 San Antonio TX $7,100,000 4.75% 13 Years 2020 5/19/22 Schenectady NY $2,637,713 6.00% 7 Years 1970 4/4/22 Colonial Heights VA $3,840,650 5.60% 12 Years 1977 3/11/22 CAP RATE 5 15 10 1
rate correlation 5.00% YEARS REMAINING ON LEASE 7.00% 20 6.00%
comparables
cap
current
cap



recent

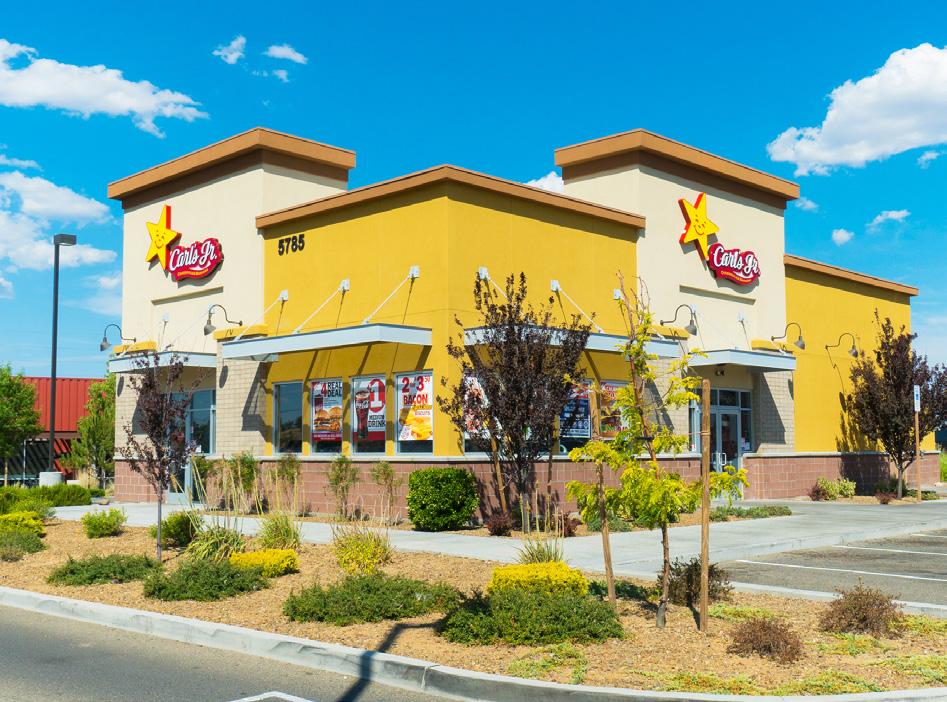
Net Lease Tenant Report | 10 KEY STATISTICS cap rate comparison Stock SymbolCredit Rating (S&P) Private Market Cap Private Total Locations ±1,100 Headquarters Franklin, TN 5 Years Remaining 6.00% 10 Years Remaining 5.25% New Construction (15-20 Years) 4.50%
Lease Type NNN Rent Increases 10% Every 5 Years Lease Term 20 Years Avg. Annual Rent $118,000 Typical SF ±3,100 Avg. Sales $1,300,000
typical lease structure
CITY STATE PRICE CAP TERM LEFT BUILT SOLD Baker CA $2,500,000 5.29% 7 Years 2010 7/5/22 Eugene OR $2,370,000 5.00% 9 Years 1994 7/18/22 Buttonwillow CA $2,467,829 5.25% 2 Years 1987 7/22/22 Oklahoma City OK $2,500,000 5.35% 11 Years 2012 8/30/22 Douglas AZ $1,656,000 6.50% 4 Years 2000 9/7/22 Murrieta CA $2,355,001 5.66% 10 Years 2013 9/16/22 Edmond OK $2,400,000 5.50% 8 Years 2009 9/28/22 Paso Robles CA $1,834,442 7.00% 12 Years 1975 9/30/22 Chino CA $3,726,000 4.00% 7 Years 2009 9/30/22 San Diego CA $2,862,155 - 3 Years 1990 10/7/22
sales comparables
Number of Listings 8 Avg. Cap Rate 4.70% Avg. Lease Term Remaining 10 Years Avg. Price $3,435,643 Lowest Cap Rate 3.75% Highest Cap Rate 5.50% transactions Transactions 15 11 Avg. Cap Rate 4.94% 5.50% Avg. Term Remaining 11 Years 8 Years Avg. Sale Price $2,874,429 $2,463,542 H2 2022 H1 2022
on market data
CAP RATE 5 15 10 1 YEARS REMAINING ON LEASE 20 4.00% 5.00% 10.00% 7.00% 8.00% 9.00% 6.00%
rate correlation
recent sales comparables


Net Lease Tenant Report | 11 KEY STATISTICS cap rate comparison Stock Symbol JPM Credit Rating (S&P) AMarket Cap ±$396.5B Total Locations ±4,818 Headquarters New York, NY 5 Years Remaining 4.75% 10 Years Remaining 4.25% New Construction (15-20 Years) 3.75%
structure Lease Type Ground Lease Rent Increases 10% Every 5 Years Lease Term 20 Years Avg. Annual Rent $125,000 Typical SF ±3,250 Avg. Deposits $95,000,000
typical lease
CITY STATE PRICE CAP TERM LEFT BUILT SOLD Aurora CO $3,100,000 4.19% 20 Years 2020 8/16/22 Oxford MS $2,900,000 5.22% 8 Years 2009 8/16/22 Matteson IL $5,200,000 4.22% 15 Years 2007 8/3/22 Denton TX $3,270,000 5.00% 6 Years 2008 6/23/22 Aurora CO $2,950,000 5.00% 6 Years 2008 5/18/22 Raleigh NC $5,700,000 3.68% 20 Years 2021 5/16/22 Ridgeland MS $3,840,000 4.00% 15 Years 2022 5/2/22 Schiller Park IL $3,050,000 4.94% 10 Years 2012 1/5/22
market data Number of Listings 11 Avg. Cap Rate 4.60% Avg. Lease Term Remaining 8 Years Avg. Price $4,700,000 Lowest Cap Rate 3.50% Highest Cap Rate 6.30% transactions Transactions 8 3 Avg. Cap Rate 4.37% 4.50% Avg. Term Remaining 10 Years 12 Years Avg. Sale Price $5,187,500 $3,733,333 H2 2022 H1 2022
rate correlation CAP RATE 6.00% 3.00% 5 15 10 20 YEARS REMAINING ON LEASE 1 8.00% 4.00% 5.00% 7.00%
current on
cap
current


recent
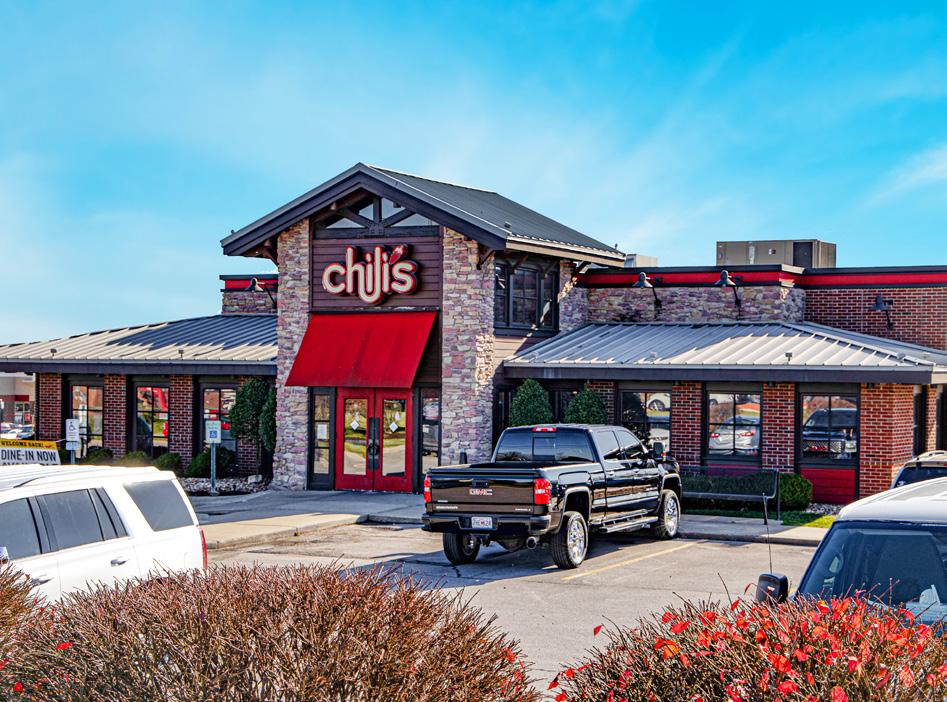

Net Lease Tenant Report | 12 KEY STATISTICS cap rate comparison Stock Symbol EAT Credit Rating (S&P) BBMarket Cap ±$1.47B Total Locations ±1,600 Headquarters Dallas, TX 5 Years Remaining 6.00% 10 Years Remaining 5.50% New Construction (15-20 Years) 5.00%
Lease Type Ground Lease Rent Increases 10% Every 5 Years Lease Term 20 Years Avg. Annual Rent $120,000 Typical SF ±5,000 Avg. Sales $2,325,877
typical lease structure
data Number of Listings 5 Avg. Cap Rate 5.90% Avg. Lease Term Remaining 6 Years Avg. Price $3,262,897 Lowest Cap Rate 5.00% Highest Cap Rate 6.60% transactions Transactions 22 23 Avg. Cap Rate 5.48% 5.23% Avg. Term Remaining 8 Years 10 Years Avg. Sale Price $2,687,760 $2,687,814 H2 2022 H1 2022
on market
sales comparables CITY STATE PRICE CAP TERM LEFT BUILT SOLD Pensacola FL $1,995,000 5.01% 11 Years 2008 11/17/22 Snellville GA $3,180,000 5.00% 10 Years 2006 11/10/22 Richmond IN $1,555,902 4.80% 3 Years 1998 9/28/22 Plainfield IL $1,936,000 5.25% 5 Years 2007 8/11/22 Kingman AZ $3,975,000 5.00% 11 Years 2008 8/1/22 Evergreen Park IL $3,275,000 4.88% 10 Years 2005 7/22/22 Ithaca NY $2,200,000 4.50% 10 Years 2011 7/11/22 Auburndale FL $2,551,020 4.90% 10 Years 2008 5/22/22 Palestine TX $1,550,000 5.10% 5 Years 2017 5/12/22 Deland FL $2,385,000 4.75% 11 Years 2008 3/31/22 CAP RATE 5 15 10 1
rate correlation YEARS REMAINING ON LEASE 20 4.00% 5.00% 7.00% 6.00%
cap
current on market data

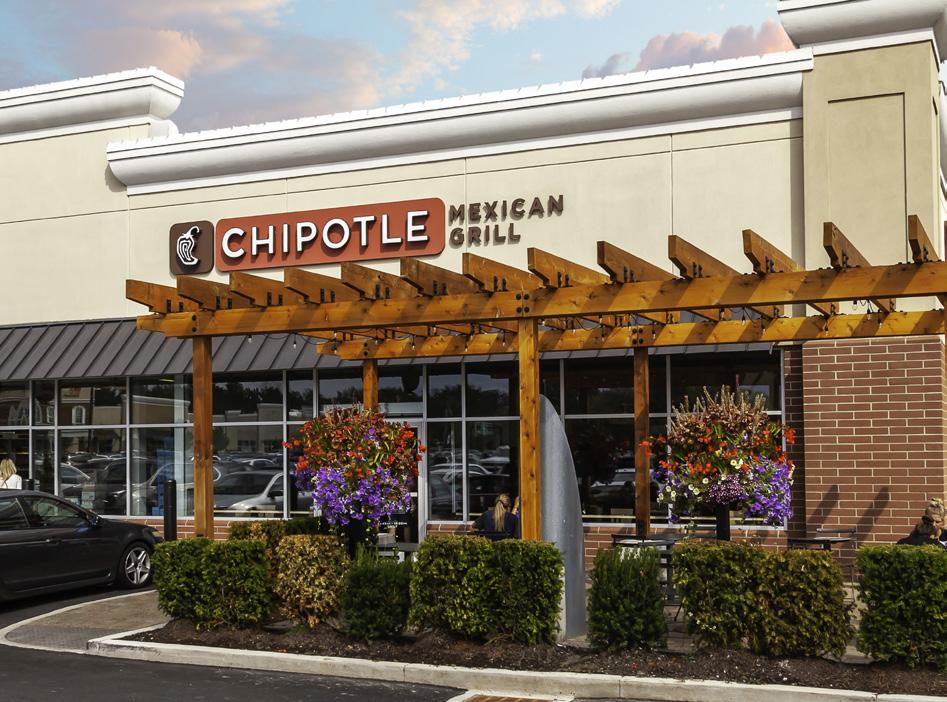


recent sales comparables
typical lease structure
Net Lease Tenant Report | 13 KEY STATISTICS
rate comparison Stock Symbol CMG Credit Rating (S&P) NR Market Cap ±$45.1B Total Locations ±3,000 Headquarters Newport Beach, CA 5 Years Remaining 5.00% - 5.50% 10 Years Remaining 4.50% New Construction (15-20 Years) 4.00% - 4.25%
cap
Lease Type NN or NNN Rent Increases 10% Every 5 Years Lease Term 15 Years Avg. Annual Rent $134,169 Typical SF ±2,400 Avg. Sales -
CITY STATE PRICE CAP TERM LEFT BUILT SOLD Fort Worth TX $2,910,000 3.65% 18 Years 2020 12/2/22 Marietta GA $4,060,000 4.00% 15 Years 2022 11/29/22 Hudson Oaks TX $3,600,000 3.75% 15 Years 2022 11/21/22 Green Bay WI $2,400,000 4.50% 10 Years 2022 10/26/22 Valrico FL $3,150,000 4.00% 15 Years 2022 10/10/22 Lee’s Summit MO $2,410,000 4.44% 15 Years 2022 9/27/22 Birmingham AL $2,890,000 4.14% 15 Years 2022 9/22/22 Lawrenceville GA $2,820,000 4.00% 11 Years 2018 8/9/22 Greenfield IN $2,960,000 4.35% 10 Years 2022 7/26/22 Casselberry FL $3,600,000 3.46% 15 Years 2022 6/17/22
Number of Listings 43 Avg. Cap Rate 4.39% Avg. Lease Term Remaining 13 Years Avg. Price $3,083,063 Lowest Cap Rate 3.90% Highest Cap Rate 5.42% transactions Transactions 24 20 Avg. Cap Rate 4.40% 4.22% Avg. Term Remaining 13 Years 14 Years Avg. Sale Price $3,000,000 $2,987,557 H2 2022 H1 2022
CAP RATE 3.00% 5 15 10 20 YEARS REMAINING ON LEASE 1 6.00% 4.00% 5.00%
cap rate correlation
KEY STATISTICS
Symbol CRK
Rating (S&P) BBB
Cap ±$47.14B
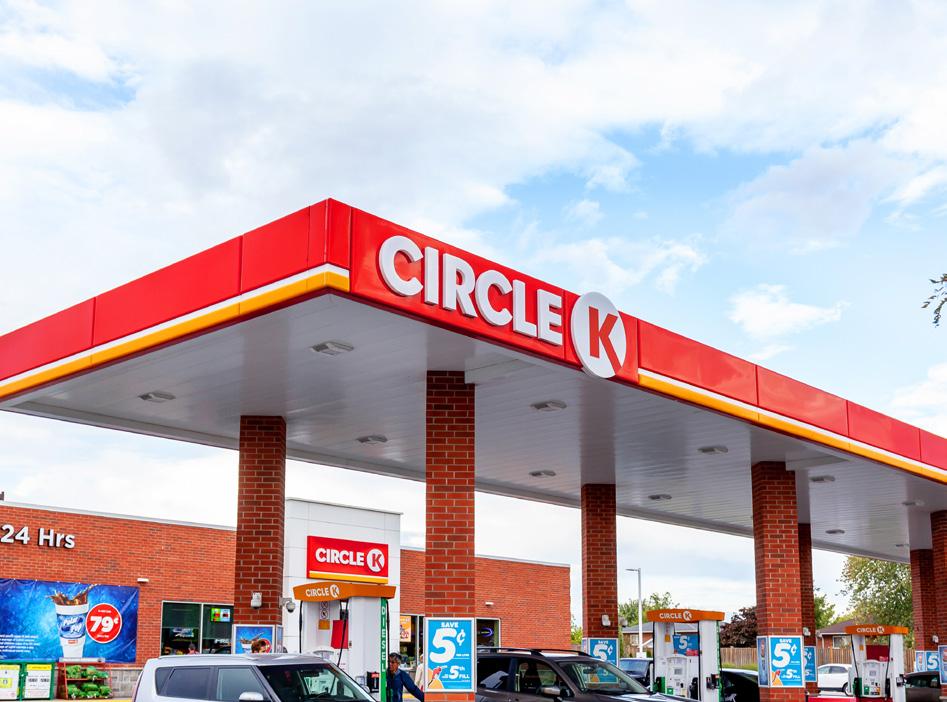
Locations ±14,850
Laval, Quebec, Canada
cap rate comparison
typical lease structure
Type NNN
current on market data


SF ±3,000
cap rate correlation
recent sales comparables
Net Lease Tenant Report | 14
Credit
Market
Total
Headquarters
5
10
New
Stock
Years Remaining 6.45%
Years Remaining 5.35%
Construction (15-20 Years) 4.70%
Lease
Rent
Lease
Avg.
Typical
Avg.
Increases Custom
Term 10-20 Years
Annual Rent $97,000
Sales -
CITY STATE PRICE CAP TERM LEFT BUILT SOLD Cary NC $2,420,000 5.05% 6 Years 1989 11/14/22 Sanford NC $1,000,000 6.83% 4 Years 2000 10/21/22 Madison AL $1,300,000 6.50% 5 Years 1998 10/4/22 Soddy Daisy TN $1,200,000 7.85% 1 Years 1982 10/16/22 Greer SC $1,200,000 7.20% 2 Years 1993 9/14/22 Streator IL $1,310,000 6.99% 4 Years 1987 9/1/22 Palmetto FL $3,160,000 4.18% 20 Years 2022 8/12/22 Tempe AZ $1,300,000 6.15% 5 Years 1980 8/10/22 Grove City OH $2,380,000 5.37% 10 Years 1997 7/26/22 Erie CO $1,860,000 5.20% 11 Years 1999 7/6/22
Number of Listings 26 Avg. Cap Rate 6.90% Avg. Lease Term Remaining 5.5 Years Avg. Price $1,950,000 Lowest Cap Rate 4.25% Highest Cap Rate 8.65% transactions Transactions 27 35 Avg. Cap Rate 6.70% 6.45% Avg. Term Remaining 7 Years 9.5 Years Avg. Sale Price $1,740,000 $2,450,000 H2 2022 H1 2022 CAP RATE
6.00% 4.00% 5.00% 5 15 10 20 YEARS REMAINING ON LEASE 1 8.00% 7.00%
typical lease structure
current on market data


recent sales comparables

Net Lease Tenant Report | 15
KEY STATISTICS
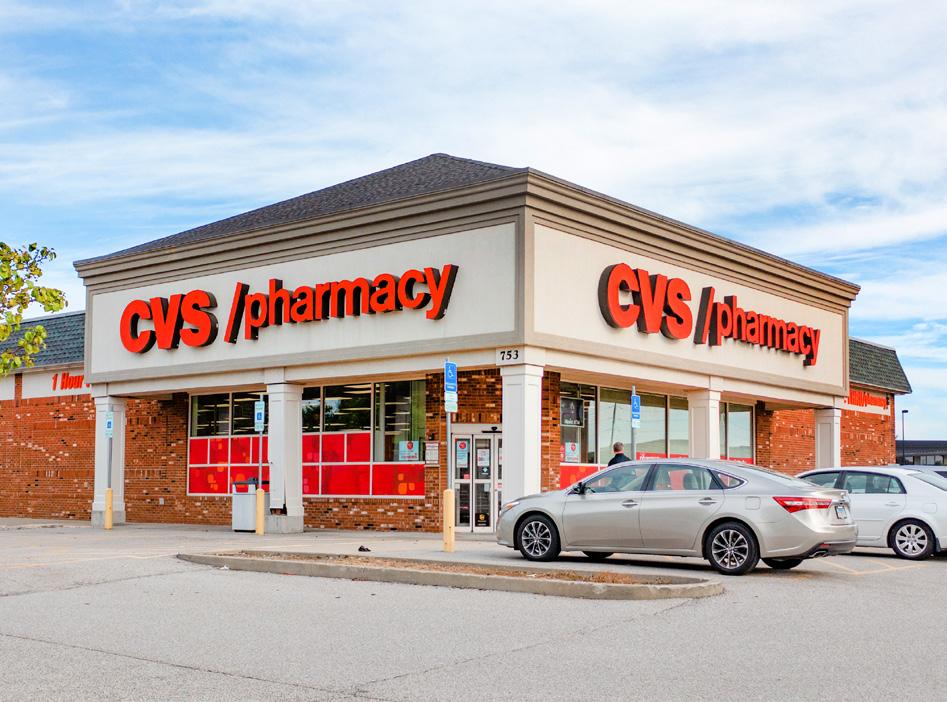
Stock Symbol CVS Credit Rating (S&P) BBB Market Cap ±$124.98B Total Locations ±9,967 Headquarters Woonsocket, RI 5 Years Remaining 6.75% 10 Years Remaining 5.65% New Construction (15-20 Years) 4.85%
cap rate comparison
Lease Type NN or NNN Rent Increases Flat or 5% Every 5 Years Lease Term 25 Years Avg. Annual Rent $350,000 Typical SF ±12,000 Avg. Sales -
CITY STATE PRICE CAP TERM LEFT BUILT SOLD Hialeah FL $10,725,000 5.59% 14 Years 2011 10/27/22 Marietta GA $7,000,000 6.06% 9 Years 2006 10/24/22 Virginia Beach VA $10,551,847 5.04% 13 Years 2009 9/29/22 Chandler AZ $5,095,836 6.25% 5 Years 2002 9/22/22 Orlando FL $6,250,000 6.50% 2 Years 2004 9/12/22 McKees Rocks PA $6,611,302 5.77% 12 Years 2008 9/8/22 Stanley NC $3,900,000 5.05% 15 Years 1998 9/2/22 Sugar Land TX $6,900,000 4.74% 15 Years 2004 8/19/22 Baltimore MD $13,437,000 5.00% 24 Years 2020 7/27/22 Naples FL $11,855,862 5.67% 12 Years 2009 7/15/22
Number of Listings 114 Avg. Cap Rate 5.25% Avg. Lease Term Remaining 10 Years Avg. Price $7,000,000 Lowest Cap Rate 4.25% Highest Cap Rate 7.00% transactions Transactions 86 59 Avg. Cap Rate 5.30% 5.60% Avg. Term Remaining 10 Years 10 Years Avg. Sale Price $5,500,000 $6,100,000 H2 2022 H1 2022 CAP RATE
6.00% 4.00% 5.00% 5 10 1 8.00% 7.00% 15 YEARS REMAINING ON LEASE 20
cap rate correlation
current on market data


KEY STATISTICS
cap rate correlation
typical lease structure
Net Lease Tenant Report | 16
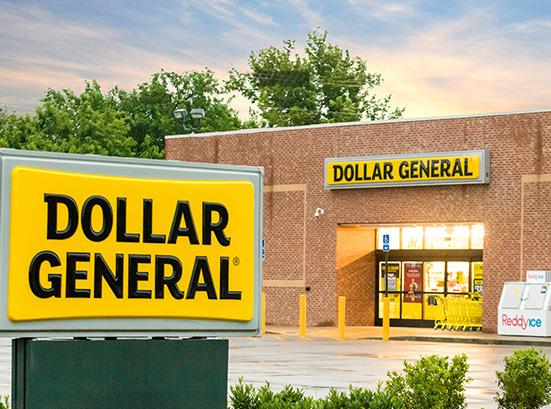
Stock Symbol DG Credit Rating (S&P) BBB Market CapTotal Locations ±18,770 Headquarters Goodlettsville, TN 5 Years Remaining 6.46% 10 Years Remaining 5.66% New Construction (10 Years) 5.48%
cap rate comparison
Lease Type NNN or NN Rent Increases 10% Increase in Options Lease Term 15 Years Avg. Annual Rent $95,000 Typical SF 9,100 or 10,640 Avg. Sales -
Number of Listings 483 Avg. Cap Rate 5.87% Avg. Lease Term Remaining 10 Years Avg. Price $1,979,109 Lowest Cap Rate 10.00% Highest Cap Rate 4.04% transactions Transactions 426 301 Avg. Cap Rate 5.74% 6.05% Avg. Term Remaining 10 Years 10 Years Avg. Sale Price $1,619,052 $1,451,825 H2 2022 H1 2022
CAP RATE 7.00% 5.00% 5 10 1 11.00% 9.00% 15 YEARS REMAINING ON LEASE 20
current on market data


KEY STATISTICS
cap rate correlation
recent sales comparables
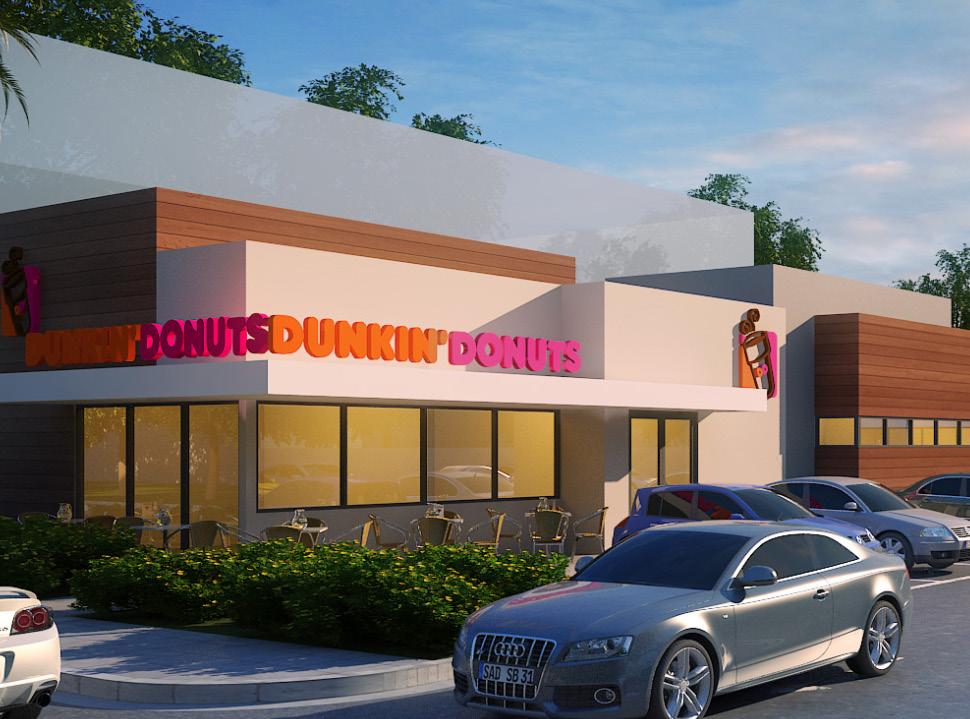
Net Lease Tenant Report | 17
Stock SymbolCredit Rating (S&P) Private Market Cap Private Total Locations ±8,500 Headquarters Canton, MA cap rate comparison 5 Years Remaining 5.50% 10 Years Remaining 5.00% New Construction (15-20 Years) 4.75% typical lease structure Lease Type NNN Rent Increases 5% Every 5 Years Lease Term 20 or 15 Years with 4-5 Year Options Avg. Annual Rent $97,000 Typical SF ±2,000 Avg. Sales $559,722 (Non-Drive-Thru) $1,336,281 (Drive-Thru)
Number of Listings 29 Avg. Cap Rate 5.35% Avg. Lease Term Remaining 11 Years Avg. Price $1,818,976 Lowest Cap Rate 3.90% Highest Cap Rate 6.50% transactions Transactions 23 12 Avg. Cap Rate 4.92% 5.76% Avg. Term Remaining 11 Years 12 Years Avg. Sale Price $1,810,000 $1,657,500 H2 2022 H1 2022
CITY STATE PRICE CAP TERM LEFT BUILT SOLD Orange Park FL $2,600,000 4.38% 12 Years 2013 5/20/22 Goshen IN $2,425,000 5.00% 20 Years 1981 5/16/22 Nutley NJ $2,000,000 5.00% 8 Years 1970 2/14/22 Birmingham AL $1,654,205 5.35% 9 Years 1997 10/25/21 Burlington NC $1,873,684 4.75% 20 Years 2022 10/26/22 Ellenville NY $1,450,000 5.15% 20 Years 1970 7/29/21 Shreveport LA $1,600,000 6.25% 5 Years 2015 12/2/21 East Peoria IL $1,365,000 4.99% 7 Years 2018 1/4/22 College Station TX $2,190,000 5.70% 10 Years 2020 1/26/21 Maryville TN $2,000,000 5.75% 15 Years - 1/22/21 CAP RATE 5 15 10 1
4.00% YEARS REMAINING ON LEASE 7.00% 20 6.00% 5.00%
typical lease structure

current on market data


cap rate correlation

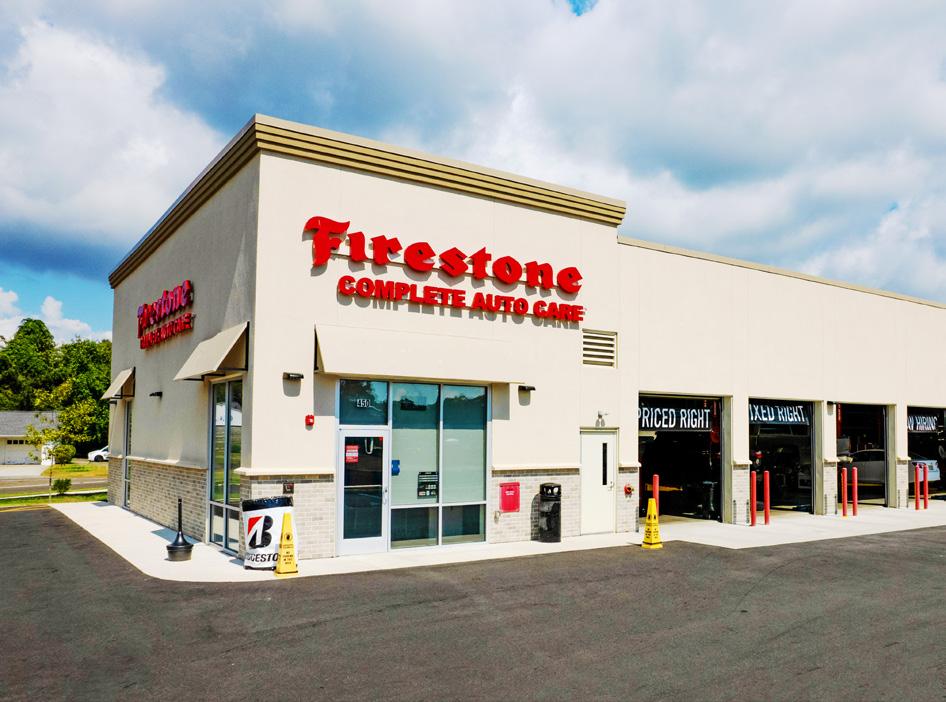
Net Lease Tenant Report | 18
cap rate comparison Stock Symbol BRDCY Credit Rating (S&P) A Market Cap ±$26.22B Total Locations ±2,200 Headquarters Nashville, TN 5 Years Remaining 6.75% 10 Years Remaining 5.75% New Construction (15-20 Years) 5.25%
KEY STATISTICS
Lease Type NNN or NN Rent Increases 5-10% Every 5 Years Lease Term 15 Years Avg. Annual Rent $180,000 Typical SF ±6,500 Avg. Sales -
Number of Listings 8 Avg. Cap Rate 5.60% Avg. Lease Term Remaining 11 Years Avg. Price $3,947,000 Lowest Cap Rate 4.50% Highest Cap Rate 7.75% transactions Transactions 23 16 Avg. Cap Rate 5.50% 5.25% Avg. Term Remaining 8 Years 12 Years Avg. Sale Price $2,954,000 $3,462,000 H2 2022 H1 2022
CITY STATE PRICE CAP TERM LEFT BUILT SOLD Newington CT $2,610,000 4.65% 18 Years 2015 12/7/22 Bluffton SC $4,074,700 5.00% 12 Years 2018 11/1/22 Colorado Springs CO $4,398,000 4.50% 13 Years 2020 11/29/22 Terrell TX $850,000 8.20% 3 Years 1973 8/25/22 Redondo Beach CA $8,421,000 4.75% 5 Years 1954 8/26/22 Lombard IL $5,125,000 6.00% 6 Years 2012 8/19/22 Nashville TN $2,331,500 7.80% 3 Years 2000 6/8/22 Eads TN $4,000,000 4.50% 15 Years 2022 8/9/22 Vestal NY $450,000 8.00% 3 Years 1994 6/17/22 Portage IN $3,866,555 4.50% 15 Years 2022 8/2/22 CAP RATE 5 15 10 1
recent sales comparables
4.00% YEARS REMAINING ON LEASE 8.00% 5.00% 6.00% 7.00% 20
KEY STATISTICS
cap rate comparison
typical lease structure
current on market data


cap rate correlation
recent sales comparables
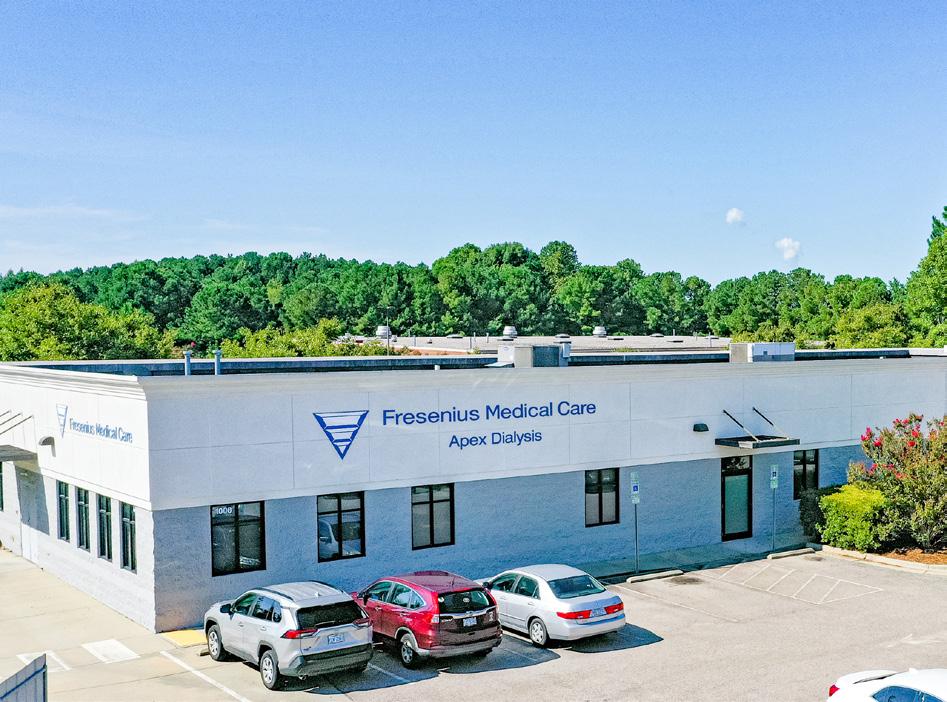
Net Lease Tenant Report | 19
Stock Symbol
Credit Rating (S&P)
Market Cap
Total Locations
Headquarters
Homburg,
5 Years Remaining 7.00% 10 Years Remaining 5.75% New Construction (15-20 Years) 5.25%
FMS
BBB
±$9.75B
±2,600
Bad
Germany
Lease Type NN or NNN Rent Increases 1-2% Annually or 10% Every 5 Years Lease Term 15 Years Avg. Annual Rent $177,520 Typical SF ±9,750 Avg. Sales -
CITY STATE PRICE CAP TERM LEFT BUILT SOLD Baton Rouge LA $1,430,000 5.84% 5 Years 2006 8/31/22 Metairie LA $2,225,000 7.20% 4 Years 1995 6/27/22 Del Rio TX $1,611,000 5.88% 3 Years 1996/2001 6/27/22 Ewing NJ $3,780,000 5.52% 8 Years 1955 6/27/22 Scranton PA $4,915,654 5.85% 9 Years 2017 6/3/22 Winslow AZ $4,555,336 6.04% 7 Years 2014 6/3/22 Suwanee GA $2,162,480 6.99% 4 Years 2006 5/25/22 Bennettsville SC $995,000 6.59% 4 Years 2000 5/12/22 Chicago IL $3,100,000 7.24% 4 Years 1988/2016 1/7/22 Kenner LA $1,800,000 7.07% 5Years 2006 1/4/22
Number of Listings 30 Avg. Cap Rate 5.56% Avg. Lease Term Remaining 7 Years Avg. Price $4,642,272 Lowest Cap Rate 3.72% Highest Cap Rate 6.68% transactions Transactions 46 36 Avg. Cap Rate 6.20% 6.50% Avg. Term Remaining 8 Years 6 Years Avg. Sale Price $4,100,000 $3,900,000 H2 2022 H1 2022 CAP RATE
7.00% 5.00% 6.00% 5 15 10 20 YEARS REMAINING ON LEASE 1 9.00% 8.00%
current


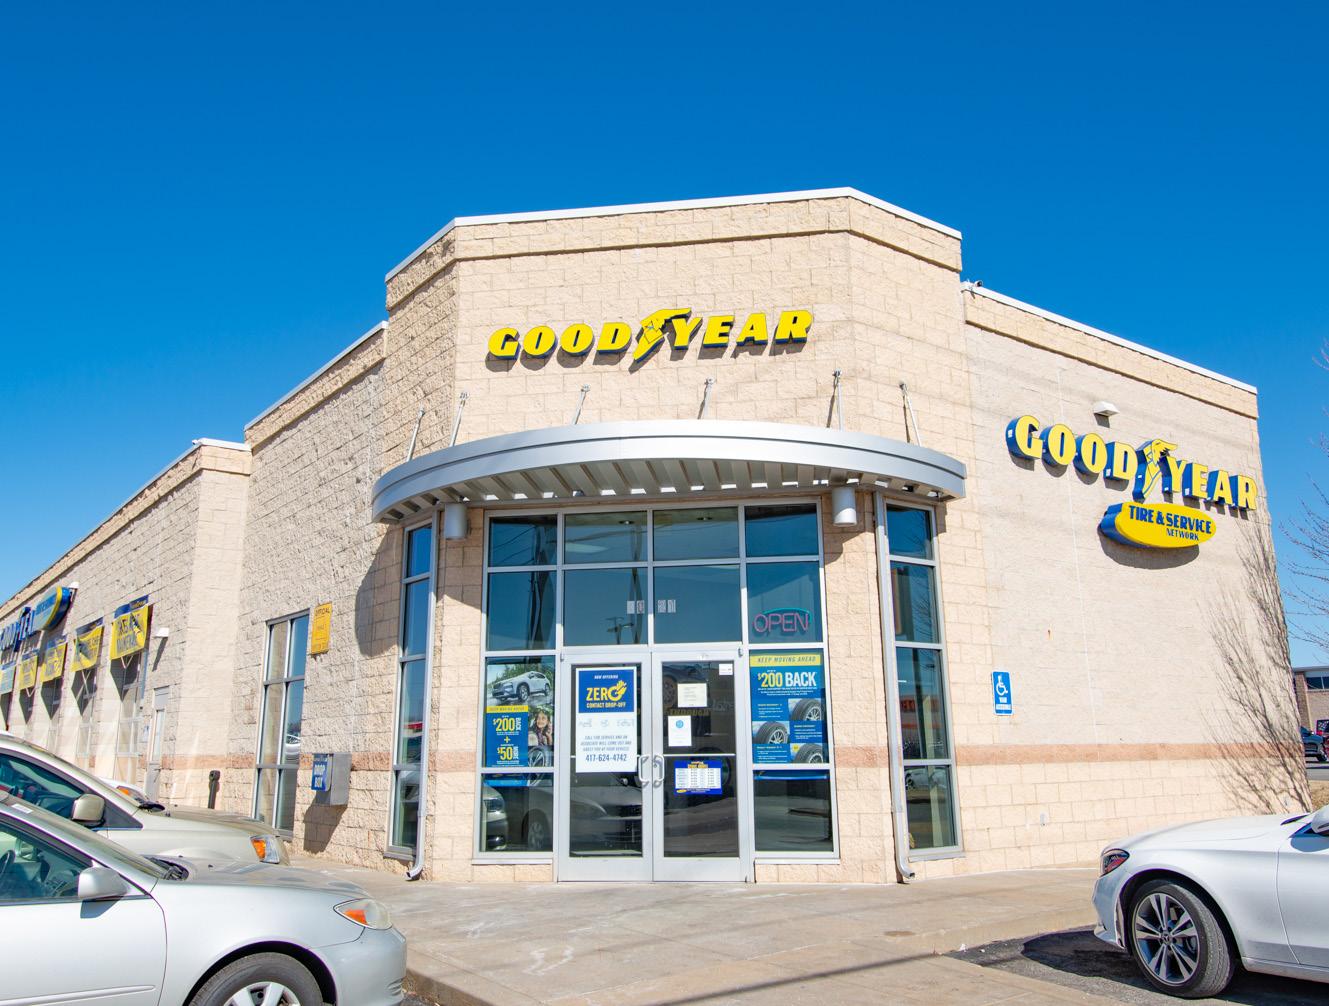


Net Lease Tenant Report | 20 KEY STATISTICS cap rate comparison Stock Symbol GT Credit Rating (S&P) BBMarket Cap ±$3.06B Total Locations ±2,000 Headquarters Akron, OH 5 Years Remaining 6.75% 10 Years Remaining 6.00% New Construction (15-20 Years) 5.50%
lease
Lease Type NN Rent Increases 5-10% Every 5 Years Lease Term 15 Years Avg. Annual Rent $140,000 Typical SF ±6,500 Avg. Sales -
typical
structure
data Number of Listings 9 Avg. Cap Rate 6.45% Avg. Lease Term Remaining 7 Years Avg. Price $1,255,332 Lowest Cap Rate 5.00% Highest Cap Rate 8.50% transactions Transactions 32 16 Avg. Cap Rate 6.75% 7.15% Avg. Term Remaining 9 Years 6 Years Avg. Sale Price $1,432,600 $1,318,400 H2 2022 H1 2022
sales
CITY STATE PRICE CAP TERM LEFT BUILT SOLD Albany GA $675,000 6.25% 4 Years 1969 7/1/22 Joplin MO $1,219,000 5.00% 4 Years 2012 7/22/22 Savannah GA $2,633,280 5.00% 10 Years 2000 9/9/22 Weslaco TX $795,257 7.00% 2 Years 1994 8/29/22 Lawton OK $620,000 6.00% 2 Years 1968 8/19/22 Rocklin CA $5,035,000 4.50% 9 Years 2016 7/14/22 Spring Hill FL $1,464,006 7.00% 3 Years 2005 10/25/22 Perrysburg OH $1,175,000 7.65% 3 Years 1992 11/26/22 Miami FL $3,813,100 6.00% 15 Years 1963 6/29/22 Jacksonville FL $2,092,200 6.00% 15 Years 1991 6/29/22 CAP RATE 5 15 10 1 cap rate correlation 5.00% YEARS REMAINING ON LEASE 8.00% 6.00% 7.00% 20
on market
recent
comparables
current on market


cap rate correlation


Net Lease Tenant Report | 21 KEY
cap rate comparison Stock SymbolCredit Rating (S&P) Private Market Cap Private Total Locations ±1,700 Headquarters Franklin, TN 5 Years Remaining 7.00% 10 Years Remaining 5.50% New Construction (15-20 Years) 4.50%
Lease Type NNN Rent Increases 10% Every 5 Years Lease Term 20 Years Avg. Annual Rent $103,000 Typical SF ±3,000 Avg. Sales $1,100,000
STATISTICS
typical lease structure
Number of Listings 18 Avg. Cap Rate 5.50% Avg. Lease Term Remaining 9 Years Avg. Price $2,031,170 Lowest Cap Rate 4.70% Highest Cap Rate 8.00% transactions Transactions 22 15 Avg. Cap Rate 5.31% 6.59% Avg. Term Remaining 10 Years 7 Years Avg. Sale Price $1,893,246 $1,400,049 H2 2022 H1 2022
data
CITY STATE PRICE CAP TERM LEFT BUILT SOLD Columbia TN $2,516,000 5.00% 16 Years 1983 4/13/22 Greensboro NC $2,275,000 4.50% 9 Years 1973 4/19/22 Madison AL $1,800,000 7.07% 2 Years 1977 5/26/22 Virden IL $1,807,900 4.00% 10 Years 1999 5/31/22 Springfield IL $960,000 10.68% 3 Years 1983 6/10/22 Laurel MS $1,000,000 5.00% 10 Years 1999 7/28/22 Huber Heights OH $1,950,000 5.46% 15 Years 2017 9/1/22 Indianapolis IN $3,100,000 4.50% 8 Years 1983 9/6/22 Columbia SC $2,300,000 5.75% 11 Years 1983 9/6/22 Morristown TN $720,000 7.00% 7 Years 1970 10/18/22 CAP RATE 5 15 10 1
recent sales comparables
YEARS REMAINING ON LEASE 20 4.00% 5.00% 11.00% 6.00% 7.00% 8.00% 9.00% 10.00%
recent sales comparables


Net Lease Tenant Report | 22 KEY STATISTICS cap rate comparison Stock SymbolCredit Rating (S&P) Private Market Cap Private Total Locations ±986 Headquarters Oklahoma City, OK 5 Years Remaining 7.25% 10 Years Remaining 6.50% New Construction (15-20 Years) 5.75%
Lease Type NNN Rent Increases Custom Lease Term 15 Years Avg. Annual Rent $486,338 Typical SF ±55,000 Avg. Sales $6,000,000
typical lease structure
CITY STATE PRICE CAP TERM LEFT BUILT SOLD Apopka FL $9,418,043 6.50% 10 Years 1985 11/1/22 Bluffton SC $9,751,940 5.95% 13 Years 2017 9/13/22 Arnold MO $8,500,000 6.70% 10 Years 1970 8/4/2022 McAlester OK $7,710,280 5.35% 15 Years 2021 6/17/2022 Jackson TN $8,250,000 5.75% 15 Years 2005 4/18/2022 Pembroke Pines FL $13,185,000 6.00% 13 Years 2020 4/6/2022 Round Rock TX $10,830,000 7.00% 6 Years 2000 3/30/2022 Holland OH $5,400,000 5.85% 15 Years 2018 3/30/2022 Great Falls MT $10,100,000 7.64% 5 Years 2005 3/18/2022 Oregon City OR $15,100,000 6.75% 8 Years 1989 1/26/2022
Number of Listings 4 Avg. Cap Rate 6.10% Avg. Lease Term Remaining 6 Years Avg. Price $9,717,750 Lowest Cap Rate 5.00% Highest Cap Rate 8.00% transactions Transactions 6 4 Avg. Cap Rate 6.50% 6.13% Avg. Term Remaining 10 Years 12 Years Avg. Sale Price $9,936,000 $8,845,065 H2 2022 H1 2022 CAP RATE 5 15 10 1
current on market data
5.00% 6.00% YEARS REMAINING ON LEASE 8.00% 20 7.00%
cap rate correlation
typical lease structure
current on market data


cap rate correlation
recent sales comparables
Net Lease Tenant Report | 23
Stock SymbolCredit Rating (S&P) Private Market Cap Private Total Locations ±420 Headquarters Atlanta, GA 5 Years Remaining 6.50% 10 Years Remaining 5.75% New Construction (15-20 Years) 5.25%
Lease Type NNN or Ground Lease Rent Increases 10% Every 5 Years Lease Term 20 Years Avg. Annual Rent $165,000 Typical SF ±5,000 Avg. Sales $2,000,000
KEY STATISTICS cap rate comparison
Number of Listings 5 Avg. Cap Rate 5.92% Avg. Lease Term Remaining 9 Years Avg. Price $3,449,678 Lowest Cap Rate 5.20% Highest Cap Rate 7.80% transactions Transactions 7 7 Avg. Cap Rate 5.44% 6.10% Avg. Term Remaining 10 Years 12 Years Avg. Sale Price $3,317,889 $2,845,714 H2 2022 H1 2022
CITY STATE PRICE CAP TERM LEFT BUILT SOLD Lubbock TX $3,317,808 6.25% 7 Years 1989 4/28/22 Mishakawa IN $3,244,000 5.25% 14 Years 2015 10/12/22 Topeka KS $2,750,000 7.13% 9 Years 2005 9/30/22 Flint MI $1,000,000 8.53% 3 Years 1979 6/29/22 Savannah GA $2,540,000 6.10% 5 Years 2001 5/17/22 Lansing IL $3,700,000 6.70% 15 Years 1982 4/22/22 Yuma AZ $3,490,000 5.99% 10 Years 2006 3/31/22 Buford GA $3,800,000 5.57% 13 Years 2015 2/15/22 San Marcos CA $1,320,000 5.25% 10 Years 1987 1/25/22 Amarillo TX $2,500,000 5.75% 8 Years 1992 1/18/22 CAP RATE 5 15 10 1
YEARS REMAINING ON LEASE 20 4.00% 5.00% 8.00% 6.00% 7.00%
KEY STATISTICS
Symbol YUM

Rating (S&P) BB
Cap -


cap rate comparison
typical lease structure
Lease Type NNN or Ground Lease
Increases 5-10% Every 5 Years
Term 15-20 Years
SF ±2,700
current on market data


cap rate correlation
recent sales comparables
Net Lease Tenant Report | 24
Stock
Credit
Market
Total
Headquarters
5
10
New
(15-20
Locations ±3,904
Louisville, KY
Years Remaining 5.65%
Years Remaining 5.15%
Construction
Years) 4.65%
Rent
Lease
Avg. Annual
Typical
Avg.
Rent $85,000
Sales -
CITY STATE PRICE CAP TERM LEFT BUILT SOLD Aurora IL $1,397,000 4.75% 20 Years 1985 9/26/22 Liberal KS $1,200,000 4.75% 15 Years 1998 9/15/22 Chicago IL $1,470,000 4.75% 15 Years 2005 9/2/22 Rosenberg TX $1,225,000 4.80% 15 Years 1986 9/1/22 Nottingham MD $1,889,000 4.50% 20 Years 1986 9/1/22 Saint Louis MO $1,375,000 4.80% 14 Years 1983 8/23/22 Dawsonville GA $3,092,000 4.50% 4 Years 2021 8/9/22 Hoffman Estate IL $1,415,000 4.95% 10 Years 1991 8/5/22 Grand Prairie TX $1,800,000 4.55% 16 Years 1997 8/4/22 Ventura CA $3,250,000 4.07% 4 Years 2010 8/1/22
Number of Listings 36 Avg. Cap Rate 5.00% Avg. Lease Term Remaining 13 Years Avg. Price $2,100,000 Lowest Cap Rate 4.00% Highest Cap Rate 5.75% transactions Transactions 32 21 Avg. Cap Rate 4.50% 4.75% Avg. Term Remaining 15 Years 15 Years Avg. Sale Price $2,300,000 $1,900,000 H2 2022 H1 2022
CAP RATE 5 10 1 4.00% 3.00% 5.00% 15 YEARS REMAINING ON LEASE 20
current on market data


cap rate correlation
recent sales comparables
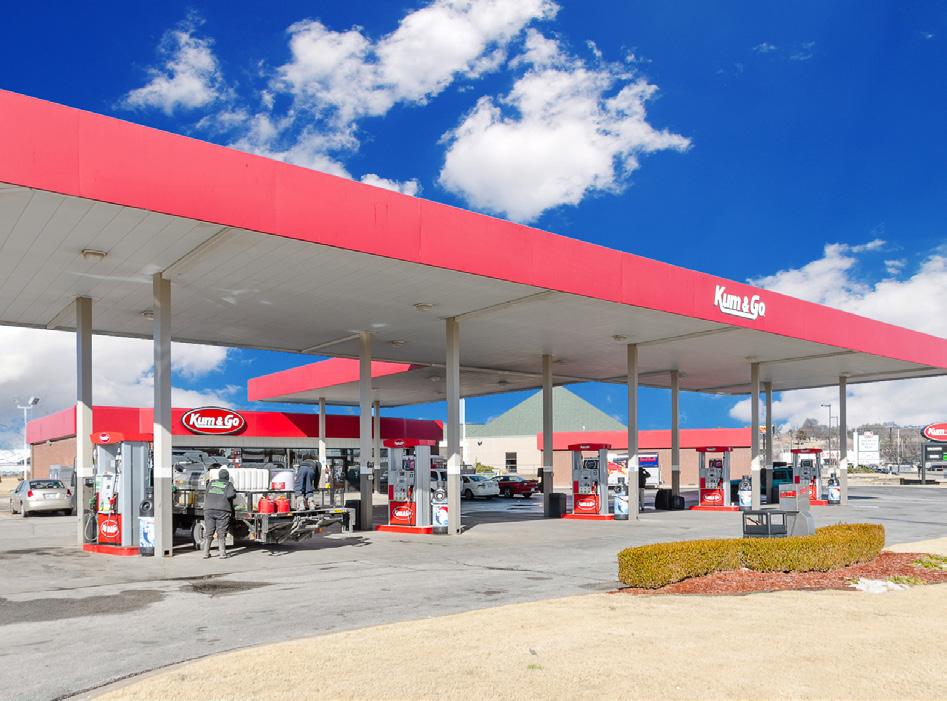
Net Lease Tenant Report | 25
cap rate comparison Stock SymbolCredit Rating (S&P) Private Market Cap Private Total Locations ±390 Headquarters Des Moines, IA 5 Years Remaining 6.00% 10 Years Remaining 5.50% New Construction (15-20 Years) 5.15% typical lease structure Lease Type NNN Rent Increases 7.5% Every 5 Years Lease Term 15 Years Avg. Annual Rent $350,000 Typical SF ±5,300 Avg. Sales $6,500,000
KEY STATISTICS
CITY STATE PRICE CAP TERM LEFT BUILT SOLD Pleasant Hill IA $7,200,000 5.00% 15 Years 2022 12/1/22 Tulsa OK $3,266,000 6.75% 4 Years 2006 10/24/22 Tulsa OK $3,821,000 5.25% 12 Years 2012 10/24/22 Jenks OK $3,334,500 6.61% 4 Years 2006 10/24/22 Williamsburg IA $5,700,000 5.10% 15 Years 2017 10/7/22 Norwalk IA $2,675,000 5.25% 11 Years 2004 10/5/22 Bono AR $3,492,500 5.00% 12 Years 2004 10/5/22 Jonesboro AR $7,770,796 5.18% 18 Years 2021 9/19/22 Joplin MO $4,308,270 5.23% 11 Years 2013 9/8/22 Johnston IA $2,791,000 5.00% 15 Years 1998 8/29/22
Number of Listings 12 Avg. Cap Rate 4.92% Avg. Lease Term Remaining 15 Years Avg. Price $7,192,493 Lowest Cap Rate 4.50% Highest Cap Rate 5.15% transactions Transactions 7 24 Avg. Cap Rate 5.02% 5.30% Avg. Term Remaining 15 Years 12 Years Avg. Sale Price $3,357,372 $5,223,164 H2 2022 H1 2022
CAP RATE 7.00% 6.00% 5 15 10 20 YEARS REMAINING ON LEASE 1 8.00% 4.00% 5.00%
current on market data


cap rate correlation
typical lease structure
Lease Type NN or NNN
10% Every 5 Years
recent sales comparables
SF ±5,000
Net Lease Tenant Report | 26
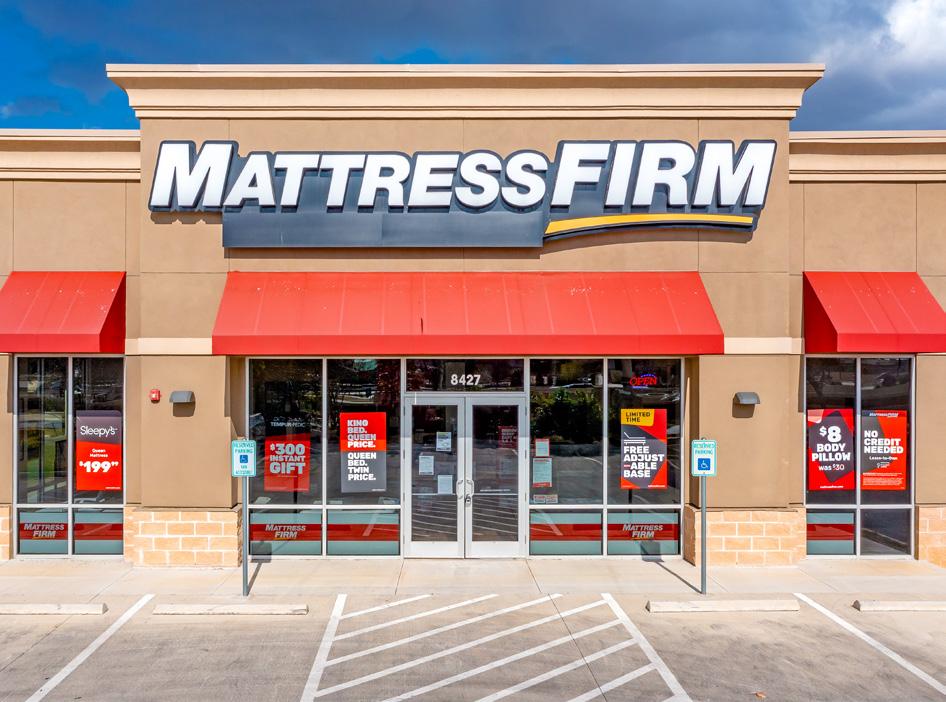
Stock Symbol MFRM Credit Rating (S&P) NR Market Cap ±$2.39B Total Locations ±2,300 Headquarters Houston, TX 5 Years Remaining 6.18% 10 Years Remaining 5.70% New Construction (15-20
KEY STATISTICS cap rate comparison
Years) -
Avg. Annual
Typical
Avg. Sales
Rent Increases
Lease Term 10 Years
Rent ±$150,000
-
CITY STATE PRICE CAP TERM LEFT BUILT SOLD Aurora CO $1,925,000 5.80% 6 Years 2003 11/16/22 Murrieta CA $3,900,000 6.17% 4 Years 2016 11/15/22 Georgetown TX $7,350,000 5.29% 10 Years 2015 9/9/22 Derby KS $2,000,000 7.76% 5 Years 2015 7/6/22 Indianapolis IN $1,850,000 6.18% 4 Years 2016 12/6/21 Reynoldsburg OH $1,700,000 7.37% 2 Years 2013 5/24/22 Vernon Hills IL $2,820,000 6.64% 5 Years 1980/2015 4/23/22 Vero Beach FL $1,703,500 6.00% 7 Years 2001 7/25/22
Number of Listings 11 Avg. Cap Rate 6.33% Avg. Lease Term Remaining 9 Years Avg. Price $2,370,217 Lowest Cap Rate 6.00% Highest Cap Rate 7.00% transactions Transactions 3 8 Avg. Cap Rate 7.13% 6.46% Avg. Term Remaining 4.3 Years 5 Years Avg. Sale Price $2,386,667 $3,375,000 H2 2022 H1 2022
CAP RATE 7.00% 6.00% 5 15 10 20 YEARS REMAINING ON LEASE 1 8.00% 4.00% 5.00%
current

recent sales comparables



Net Lease Tenant Report | 27
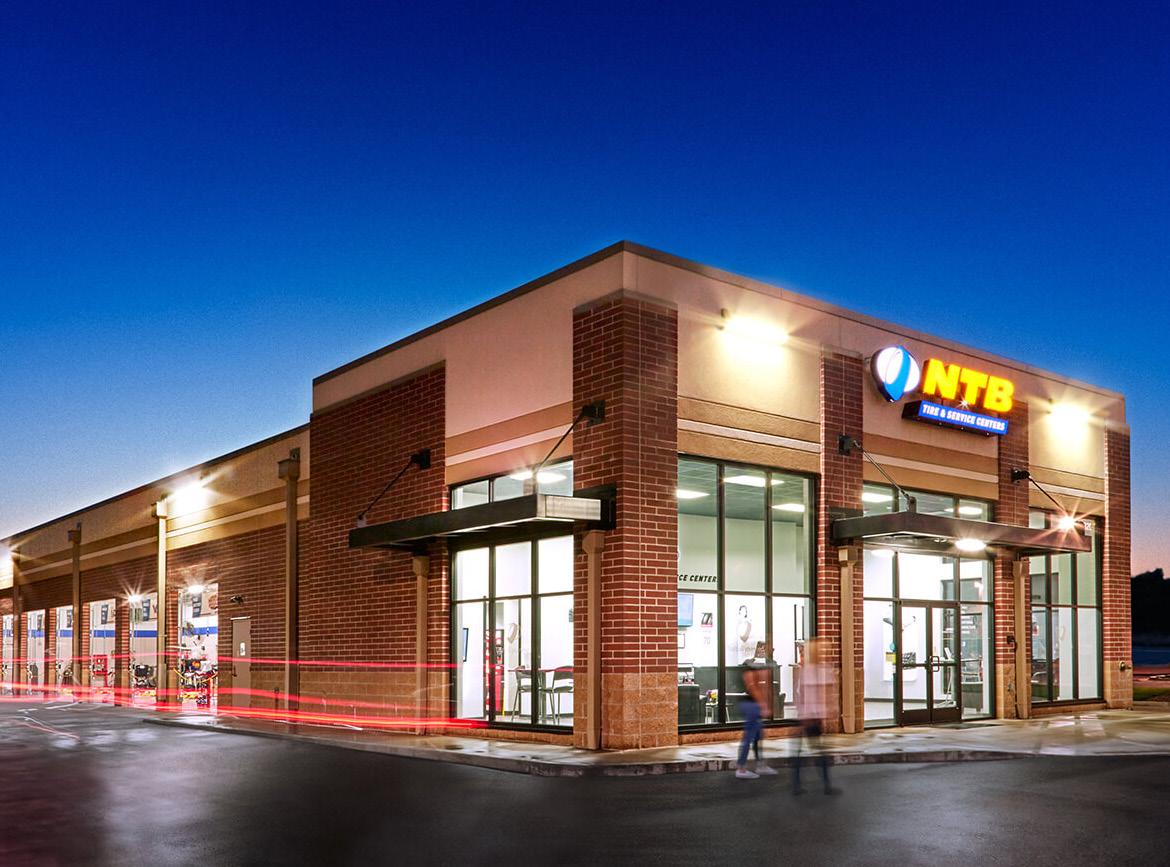
Stock SymbolCredit Rating (S&P) Private Market Cap Private Total Locations ±400 Headquarters Palm Beach Gardens, FL 5 Years Remaining 6.25% 10 Years Remaining 5.95% New Construction (15-20 Years) 4.97%
Lease Type ABS NNN Rent Increases Custom or Varies Lease Term 10-15 Years Avg. Annual Rent ±$180,000 Typical SF ±6,600 Avg. Sales -
KEY STATISTICS cap rate comparison
typical lease structure
CITY STATE PRICE CAP TERM LEFT BUILT SOLD Lynchburg VA $3,240,000 5.00% 14 Years 2020 11/23/21 Winston-Salem NC $3,045,000 5.17% 12 Years 2015 8/31/21 Fort Worth TX $2,761,000 5.88% 8 Years 2007 5/14/21 Burleson TX $4,200,000 5.95% 10 Years 2005 5/13/21 Fredericksburg VA $3,693,207 4.97% 19 Years 2014 5/13/21
Number of Listings 3 Avg. Cap Rate 6.75% Avg. Lease Term Remaining 5 Years Avg. Price $2,998,615 Lowest Cap Rate 6.25% Highest Cap Rate 7.01% transactions Transactions 5Avg. Cap Rate 6.75%Avg. Term Remaining -Avg. Sale Price $2,998,615 -
on market data
CAP RATE 5 15 10 20 YEARS REMAINING ON LEASE 1 6.00% 4.00% 5.00% H2 2022 H1 2022
cap rate correlation
current on market data


recent sales comparables

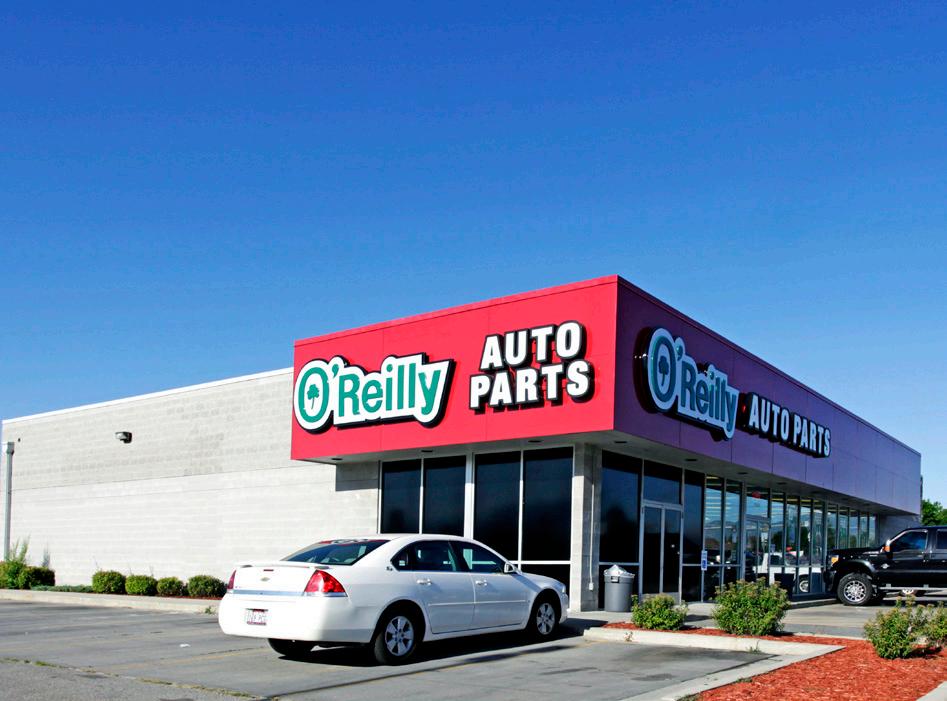
Net Lease Tenant Report | 28 KEY STATISTICS cap rate comparison Stock Symbol ORLY Credit Rating (S&P) BB+ Market Cap ±$44.7B Total Locations ±5,800 Headquarters Springfield, MO 5 Years Remaining 6.75% 10 Years Remaining 5.85% New Construction (15-20 Years) 5.00%
Lease Type NN or NNN Rent Increases 6% on Year 11 & 10% in Options Lease Term 15 Years Avg. Annual Rent $150,000 Typical SF ±7,500 Avg. Sales $2,300,000
typical lease structure
CITY STATE PRICE CAP TERM LEFT BUILT SOLD Immokalee FL $3,000,000 5.00% 15 Years 2021 2/18/22 Orem UT $2,400,000 4.50% 5 Years 2000 2/18/22 Greenfield OH $2,035,000 5.10% 14 Years 2021 3/15/22 Sun Valley NV $1,520,000 6.10% 5 Years 1997 4/27/22 Minden LA $1,190,000 6.39% 5 Years 2001 5/22/22 Tempe AZ $2,195,000 4.50% 5 Years 1980 7/28/22 Marysville CA $2,476,000 5.00% 5 Years 1997 9/9/22 Midland GA $2,524,865 5.20% 15 Years 2022 10/18/22 Jonesboro GA $1,571,000 5.50% 10 Years 2000 11/15/22 Williston FL $2,210,000 5.15% 15 Years 2022 11/30/22
Number of Listings 36 Avg. Cap Rate 5.35% Avg. Lease Term Remaining 10 Years Avg. Price $2,750,000 Lowest Cap Rate 4.00% Highest Cap Rate 5.75% transactions Transactions 99 60 Avg. Cap Rate 5.45% 5.65% Avg. Term Remaining 8 Years 7 Years Avg. Sale Price $2,165,000 $2,286,000 H2 2022 H1 2022 YEARS REMAINING ON LEASE CAP RATE 5 15 10 1
5.00% 6.00% 8.00% 20 7.00%
cap rate correlation
recent sales comparables

typical lease structure


Net Lease Tenant Report | 29
cap rate comparison Stock Symbol RAD Credit Rating (S&P) CCC Market Cap ±$210M Total Locations ±2,451 Headquarters Camp Hill, PA 5 Years Remaining 9.00% 10 Years Remaining 5.95% New Construction (15-20 Years) -
KEY STATISTICS
Lease Type NN or ABS NNN Rent Increases 5-10% Every 5 Years Lease Term 10-15 Years Avg. Annual Rent ±$294,939 Typical SF ±12,775 Avg. Sales -
CITY STATE PRICE CAP TERM LEFT BUILT SOLD Erie PA $6,000,000 6.30% 10 Years 1999 11/1/22 Detroit MI $2,550,000 6.26% 10 Years 1993 9/23/22 East Palestine OH $2,455,950 6.10% 10 Years 1999 8/30/22 Pittsburg PA $4,772,653 7.50% 6 Years 2000 8/9/22 Renton WA $6,400,000 5.54% 11 Years 2000 9/1/22 Portsmouth VA $5,342,371 7.04% 6 Years 2004 8/9/22 Richmond MI $1,738,000 7.98% 4 Years 1996 8/9/22 Belpre OH $3,600,000 6.57% 11 Years 1999 8/9/22 East Haven CT $7,800,000 8.27% 6 Years 2008 9/29/22 Vermillion OH $1,854,000 8.68% 2 Years 1997 6/28/22
Number of Listings 110 Avg. Cap Rate 7.05% Avg. Lease Term Remaining 7 Years Avg. Price $4,050,000 Lowest Cap Rate 4.05% Highest Cap Rate 9.22% transactions Transactions 55 62 Avg. Cap Rate 6.80% 7.13% Avg. Term Remaining 6 Years 6.5 Years Avg. Sale Price $4,168,504 $4,036,541 H2 2022 H1 2022 YEARS REMAINING ON LEASE CAP RATE 5 15 10 1
current on market data
5.00% 7.00% 9.00% 20 8.00% 6.00%
cap rate correlation
typical lease structure
current on market data


cap rate correlation
recent sales comparables
Net Lease Tenant Report | 30
Stock Symbol Private Credit Rating (S&P) B+ Market Cap ±$1.55B Total Locations ±3,500 Headquarters Oklahoma City, OK 5 Years Remaining 6.25% 10 Years Remaining 5.75% New Construction (15-20 Years) 5.25%
KEY STATISTICS cap rate comparison
Lease Type NNN Rent Increases 5-10% Every 5 Years, Four, 5-Year Options Lease Term 15-20 Years Avg. Annual Rent $120,000 Typical SF ±1,500 Avg. Sales $1,681,000
CITY STATE PRICE CAP TERM LEFT BUILT SOLD London KY $3,015,114 5.22% 20 Years 2017 11/1/22 Rexburg ID $2,375,000 5.14% 15 Years 2010 10/21/22 Fredericksburg VA $2,800,000 5.44% 13 Years 2015 9/30/22 Westmoreland TN $1,315,000 5.32% 10 Years 1997 8/22/22 Houston TX $900,000 6.93% 3 Years 2005 7/25/22 Lawrenceville GA $1,938,000 5.24% 20 Years 2001 6/2/22 Perry FL $2,500,000 4.80% 20 Years 2006 5/11/22 Moultrie GA $2,356,000 5.65% 20 Years 1985 4/7/22 Holly Hill GA $1,412,629 4.83% 10 Years 2004 3/22/22 Saint Charles MO $1,940,000 5.00% 19 Years 2003 1/19/22
Number of Listings 90 Avg. Cap Rate 5.19% Avg. Lease Term Remaining 18 Years Avg. Price $2,111,123 Lowest Cap Rate 4.37% Highest Cap Rate 6.75% transactions Transactions 41 23 Avg. Cap Rate 5.37% 5.44% Avg. Term Remaining 17 Years 16 Years Avg. Sale Price $2,134,639 $2,362,309 H2 2022 H1 2022 YEARS REMAINING ON LEASE CAP RATE 5 15 10 1
20 5.00% 7.00% 6.00%
typical lease structure
current on market data


cap rate correlation
recent sales comparables

Net Lease Tenant Report | 31
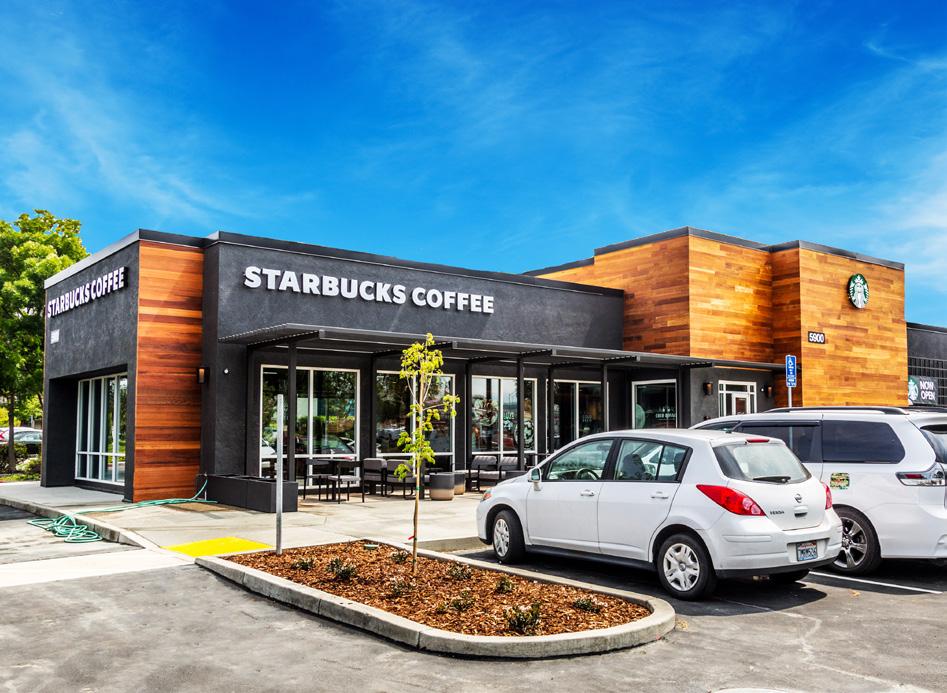
cap rate comparison Stock Symbol SBUX Credit Rating (S&P) BBB+ Market Cap ±$119.14B Total Locations ±33,833 Headquarters Seattle, WA 5 Years Remaining 5.60% 10 Years Remaining 5.25% New Construction (15-20 Years) 4.50%
KEY STATISTICS
Lease Type NN or NNN Rent Increases 10% Every 5 Years, 7.5% Every 5 Years Lease Term 10-15 Years Avg. Annual Rent $128,313 Typical SF ±2,500 Avg. Sales -
Number of Listings 126 Avg. Cap Rate 4.87% Avg. Lease Term Remaining 9.2 Years Avg. Price $4,368,030 Lowest Cap Rate 3.00% Highest Cap Rate 10.00% transactions Transactions 46 44 Avg. Cap Rate 4.78% 4.86% Avg. Term Remaining 8.4 Years 8.5 Years Avg. Sale Price $2,994,658 $4,085,808 H2 2022 H1 2022
CITY STATE PRICE CAP TERM LEFT BUILT SOLD Tampa FL $3,844,000 4.25% 10 Years 2016/2022 12/6/22 Kill Devil Hills NC $3,175,000 4.75% 10 Years 2022 11/1/22 San Bernardino CA $4,000,000 3.87% 9 Years 2021 10/25/22 McKinney TX $3,025,000 4.38% 10 Years 2022 10/12/22 Franklin VA $2,340,000 5.30% 10 Years 2022 10/12/22 Stockton CA $3,400,000 3.97% 10 Years 2022 10/10/22 Granite Bay CA $2,870,000 3.97% 10 Years 2001/2022 10/4/22 Columbia City IN $1,980,000 6.00% 10 Years 2022 9/29/22 Coachella CA $3,158,500 4.50% 10 Years 2022 9/28/22 Jacksonville FL $3,650,000 4.46% 10 Years 2014/2022 9/15/22 CAP RATE 5 15 10 1
4.00% YEARS REMAINING ON LEASE 7.00% 20 6.00% 5.00%
current


recent sales comparables
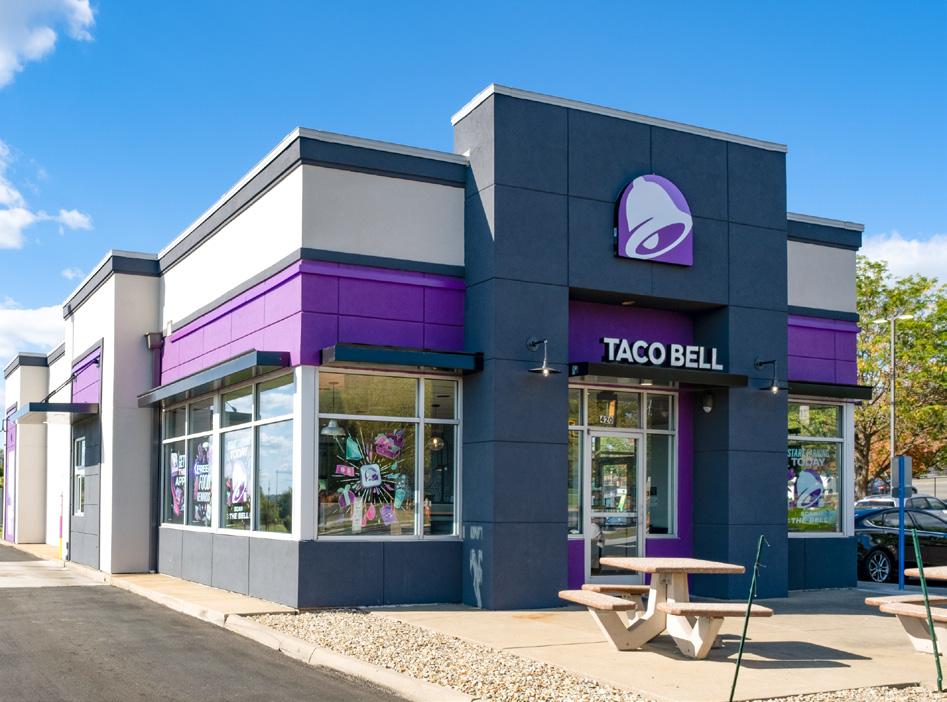


Net Lease Tenant Report | 32 KEY STATISTICS cap rate comparison Stock Symbol YUM Credit Rating (S&P) BB+ Market Cap ±$36.52B Total Locations ±7,000 Headquarters Irvine, CA 5 Years Remaining 5.25% 10 Years Remaining 5.00% New Construction (15-20 Years) 4.75%
Lease
Lease Rent Increases 5-10%
5 Years,
Annually Lease Term 20-25 Years Avg. Annual Rent $120,000 Typical SF ±3,000 Avg. Sales $1,640,000
typical lease structure
Type NNN or Ground
Every
1-2%
Number of Listings 55 Avg. Cap Rate 4.75% Avg. Lease Term Remaining 15 Years Avg. Price $2,445,193 Lowest Cap Rate 3.60% Highest Cap Rate 6.50% transactions Transactions 92 60 Avg. Cap Rate 4.53% 4.86% Avg. Term Remaining 15 Years 12 Years Avg. Sale Price $2,568,382 $2,323,805 H2 2022 H1 2022
on market data
CITY STATE PRICE CAP TERM LEFT BUILT SOLD Long Beach CA $3,696,000 4.00% 19 Years 1972 11/4/22 Portland OR $3,200,000 5.78% 20 Years 1995 11/17/22 Dallas TX $2,830,000 3.89% 25 Years 2017 8/15/22 Lake City FL $3,619,775 4.00% 17 Years 2018 7/16/22 Clearwater FL $2,500,000 4.50% 8 Years 2007 11/16/22 Henderson KY $1,686,746 4.15% 20 Years 2021 7/29/22 Wake Forest NC $2,590,000 4.25% 20 Years 2022 8/8/22 Dunn NC $2,200,000 4.60% 20 Years 2021 12/2/22 Anderson IN $1,350,000 5.00% 11 Years 1996 12/5/22 Pittsburg PA $2,300,000 4.54% 22 Years 2006 8/22/22 CAP RATE 5 15 10 1
4.00% YEARS REMAINING ON LEASE 7.00% 20 5.00% 6.00%
cap rate correlation
current

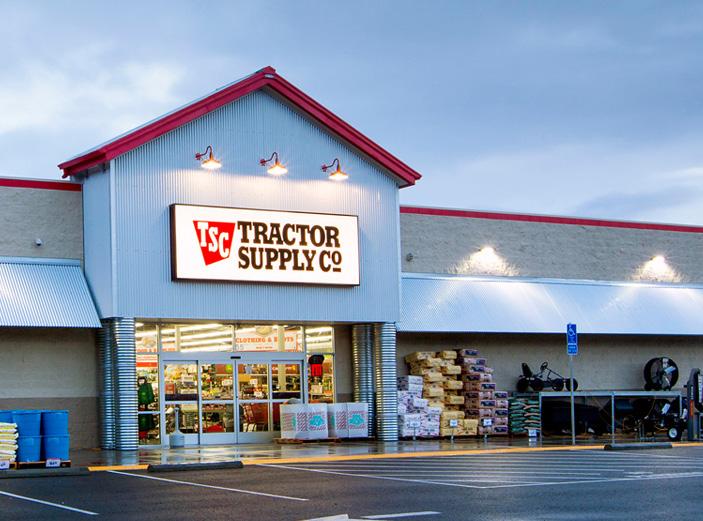


Net Lease Tenant Report | 33 KEY STATISTICS cap rate comparison Stock Symbol TSCO Credit Rating (S&P) BBB Market Cap ±$24.25B Total Locations ±2,016 Headquarters Brentwood, TN 5 Years Remaining 6.00% 10 Years Remaining 5.65% New Construction (15-20 Years) 5.15%
Lease Type NN Rent Increases 5-10% Every 5 Years Lease Term 15 Years Avg. Annual Rent $300,000 Typical SF ±19,000 Avg. Sales -
typical lease structure
Number of Listings 19 Avg. Cap Rate 5.18% Avg. Lease Term Remaining 12.62 Years Avg. Price $5,819,235 Lowest Cap Rate 4.75% Highest Cap Rate 5.50% transactions Transactions 23 20 Avg. Cap Rate 5.30% 5.45% Avg. Term Remaining 12 Years 13 Years Avg. Sale Price $5,850,000 $6,125,000 H2 2022 H1 2022
on market data
CITY STATE PRICE CAP TERM LEFT BUILT SOLD Fountain Hills AZ $6,251,000 5.45% 8 Years 2015 11/4/22 Sylva NC $5,787,500 4.50% 15 Years 2022 5/26/22 Oakland FL $10,000,000 4.99% 15 Years 2021 2/7/22 Lake Wylie SC $6,840,000 5.00% 15 Years 2021 1/19/22 Belen NM $5,926,622 5.15% 14 Years 2020 12/28/21 Woodruff SC $5,625,000 4.76% 14 Years 2020 12/24/21 Elizabethtown KY $6,096,660 5.18% 12 Years 2018 12/10/21 Garner NC $5,500,000 5.00% 14 Years 2021 2/24/22 Truth or Consequences NM $2,241,731 5.95% 5 Years 1998 6/6/22 Hanford CA $6,436,269 5.20% 8 Years 2015 2/14/22 CAP RATE 5 15 10 1 cap rate correlation 4.00% YEARS REMAINING ON LEASE 7.00% 20 6.00% 5.00%
recent sales comparables
typical lease structure

current on market data


cap rate correlation
recent sales comparables

Net Lease Tenant Report | 34 KEY STATISTICS cap rate comparison Stock Symbol WBA Credit Rating (S&P) BBB Market Cap ±$35B Total Locations ±8,886 Headquarters Deerfield, IL 5 Years Remaining 7.00% 10 Years Remaining 6.00% New Construction (15-20 Years) 5.30%
Number of Listings 365 Avg. Cap Rate 5.50% Avg. Lease Term Remaining 11 Years Avg. Price $5,550,000 Lowest Cap Rate 4.00% Highest Cap Rate 10.95% transactions Transactions 271 318 Avg. Cap Rate 5.60% 5.60% Avg. Term Remaining 10 Years 10 Years Avg. Sale Price $5,792,944 $6,800,000 H2 2022 H1 2022
CITY STATE PRICE CAP TERM LEFT BUILT SOLD Champaign IL $5,800,000 5.05% 12 Years 1998 11/30/22 Tampa FL $5,266,800 4.00% 13 Years 1996 11/16/22 Greenville NC $3,715,000 5.85% 9 Years 2001 10/28/22 Novi MI $4,800,000 5.83% 10 Years 1998 10/18/22 Loganville GA $7,100,000 5.90% 8 Years 2005 9/30/22 Eagle Pass TX $5,258,065 5.00% 15 Years 2014 10/13/22 Fridley MN $3,880,000 6.96% 6 Years 1998 10/12/22 Birmingham AL $4,485,000 6.85% 5 Years 1998 10/5/22 Leominster MA $10,000,000 5.94% 11 Years 2008 9/13/22 Miami FL $35,250,000 4.59% 12 Years 1995 10/20/22 CAP RATE 5 15 10 1
YEARS REMAINING ON LEASE 20 4.00% 5.00% 10.00% 6.00% 7.00% 8.00% 9.00% Lease Type NNN Rent Increases Custom, None or 5% every 5 Years Lease Term 25 Years Avg. Annual Rent $350,000 Typical SF ±14,400 Avg. Deposits -
recent


Net Lease Tenant Report | 35
STATISTICS cap rate comparison Stock Symbol
Credit Rating
Market Cap
Total Locations
Headquarters
5 Years Remaining 5.75% 10 Years Remaining 5.25% New Construction (15-20 Years) 4.75%
KEY
WFC
(S&P) BBB+
±$175.05B
±4,766
San Francisco, CA
Lease
Rent Increases
Lease
Avg. Annual Rent $125,000 Typical SF
Avg. Deposits $75,000,000
typical lease structure
Type NNN
10% Every 5 Years
Term 15 Years
±3,250
CITY STATE PRICE CAP TERM LEFT BUILT SOLD Hendersonville TN $2,420,000 5.00% 10 Years 2006 9/27/22 The Villages FL $4,350,000 4.98% 3 Years 2004 6/21/22 Davie FL $3,960,000 5.00% 4 Years 1977 5/30/22 Fayetteville NC $5,470,000 5.45% 3 Years 1978 5/10/22 Bessemer AL $2,280,000 5.74% 6 Years 2008 4/21/22
sales comparables
data Number of Listings 13 Avg. Cap Rate 5.50% Avg. Lease Term Remaining 8 Years Avg. Price $2,500,000 Lowest Cap Rate 4.00% Highest Cap Rate 6.00% transactions Transactions 5 2 Avg. Cap Rate 5.76% 5.00% Avg. Term Remaining 5 Years 10 Years Avg. Sale Price $3,720,000 $2,475,000 H2 2022 H1 2022 CAP RATE 5 15 10 1 cap rate correlation 4.00% 6.00% YEARS REMAINING ON LEASE 9.00% 20 7.00% 8.00% 5.00%
current on market
current on market data


recent sales comparables

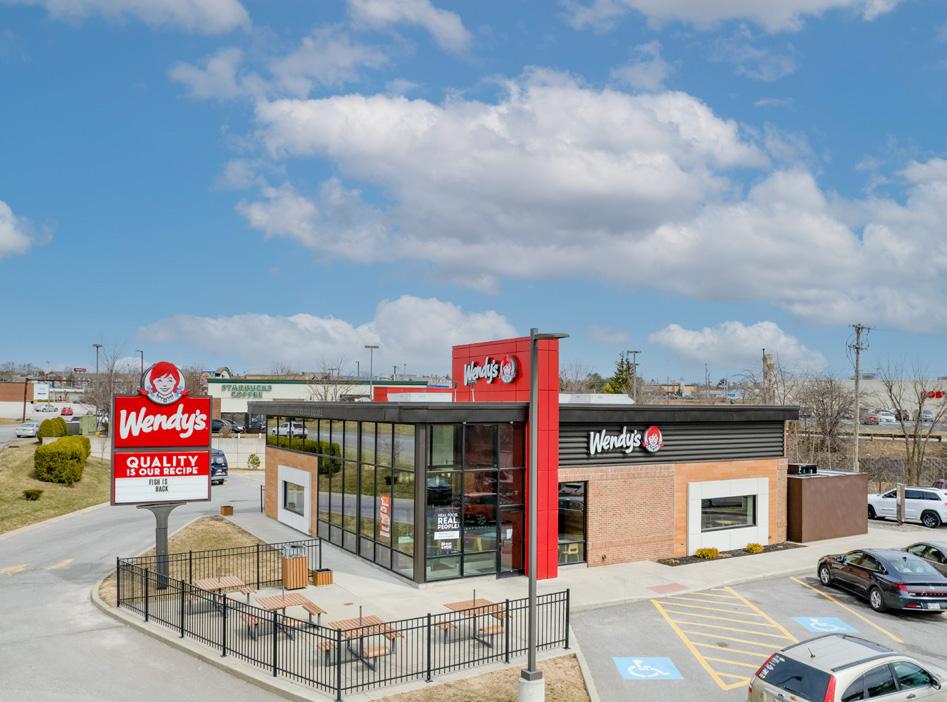
Net Lease Tenant Report | 36 KEY
cap rate comparison Stock Symbol WEN Credit Rating (S&P) B Market Cap ±$4.9B Total Locations ±6,949 Headquarters Dublin, OH 5 Years Remaining 7.25% 10 Years Remaining 6.00% New Construction (15-20 Years) 4.25%
STATISTICS
Lease Type NNN or Ground Lease Rent Increases 5-10% Every 5 Years Lease Term 20 Years Avg. Annual Rent $132,000 Typical SF ±3,200 Avg. Sales $1,900,000
typical lease structure
Number of Listings 29 Avg. Cap Rate 5.30% Avg. Lease Term Remaining 15 Years Avg. Price $2,600,000 Lowest Cap Rate 3.85% Highest Cap Rate 5.95% transactions Transactions 33 20 Avg. Cap Rate 4.90% 4.60% Avg. Term Remaining 16 Years 17 Years Avg. Sale Price $2,900,000 $2,400,000 H2 2022 H1 2022
CITY STATE PRICE CAP TERM LEFT BUILT SOLD Land O'Lakes FL $2,278,481 3.95% 15 Years 2022 1/26/22 Jackson TN $2,711,115 4.75% 18 Years 2000 1/31/22 Tuscaloosa AL $2,440,000 4.18% 17 Years 1996 7/15/22 Morristown TN $3,450,000 4.70% 30 Years 1996 9/30/22 Hopewell VA $2,592,400 4.95% 19 Years 1985 11/1/22 Holland MI $2,950,000 4.75% 18 Years 2020 11/10/22 Jackson TN $2,300,000 5.22% 19 Years 2022 12/6/22 Grand Rapids MI $2,700,000 5.06% 14 Years 2015 2/1/22 Hesperia CA $2,500,000 4.00% 23 Years 2020 10/28/22 Las Cruces NM $3,150,000 4.95% 16 Years 2006 2/22/22 CAP RATE 5 15 10 1 cap rate correlation 4.00% 7.00% YEARS REMAINING ON LEASE 9.00% 20 6.00% 5.00% 8.00%
current on market


typical lease structure


cap rate correlation

Net Lease Tenant Report | 37 KEY STATISTICS cap rate comparison Stock SymbolCredit Rating (S&P) Private Market Cap Private Total Locations ±941 Headquarters Athens, GA 5 Years Remaining 7.50% 10 Years Remaining 6.00% New Construction (15-20 Years) 5.50%
Lease Type NNN Rent Increases 10% Every 5 Years Lease Term 20 Years Avg. Annual Rent $191,712 Typical SF ±3,300 Avg. Sales $2,250,000
data Number of Listings 12 Avg. Cap Rate 5.77% Avg. Lease Term Remaining 17 Years Avg. Price $3,119,219 Lowest Cap Rate 5.35% Highest Cap Rate 6.25% transactions Transactions 7 8 Avg. Cap Rate 6.50% 6.75% Avg. Term Remaining 15 Years 14 Years Avg. Sale Price $2,650,000 $2,850,000 H2 2022 H1 2022 CAP RATE 5 15 10 1
YEARS REMAINING ON LEASE 20 4.00% 5.00% 11.00% 6.00% 7.00% 8.00% 9.00% 10.00%
index
7-Eleven
Alex Goodman (615) 667-0153 • alex.goodman@matthews.com
Advanced Auto Parts Jeff Perkins (646) 216-8104 • jeff.perkins@matthews.com
AutoZone
Bank of America
Bojangles
Buffalo Wild Wings
Burger King
Caliber Collision
Carl’s Jr
Chase Bank
Chili’s
Chipotle
Circle K
CVS
Dollar General
Dunkin’
Firestone Complete Auto Care
Fresenius Medical Care


Goodyear Tires
Kevin McKenna (214) 295-6517 • kevin.mckenna@matthews.com
Gerard Hamas (615) 535-0105 • gerard.hamas@matthews.com
Harrison Wachtler (615) 667-0160
• harrison.wachtler@matthews.com
Saxon Gallegos (949) 945-6007 • saxon.gallegos@matthews.com
Cade Norland (949) 662-2265 • cade.norland@matthews.com
Jake Marthens (949) 544-1724 • jake.marthens@matthews.com
Vincent Renna (949) 207-6396 • vincent.renna@matthews.com
Gerard Hamas (615) 535-0105
• gerard.hamas@matthews.com
Tucker Brock (615) 216-7921 • tucker.brock@matthews.com
Michael Wolsiefer (704) 209-4046
• michael.wolsiefer@matthews.com
Chris Sands (925) 718-7524 • chris.sands@matthews.com
Preston Schwartz (972) 587-9149
Eddie DeSimone (310) 919-5696
• preston.schwartz@matthews.com
• edward.desimone@matthews.com
Jonathon Tako (415) 342-9252
Jake Sandresky (512) 535-1759
Andrew Fagundo (310) 955-5834
Jake Sandresky (512) 535-1759
• jonathon.tako@matthews.com
• jake.sandresky@matthews.com
• andrew.fagundo@matthews.com
• jake.sandresky@matthews.com
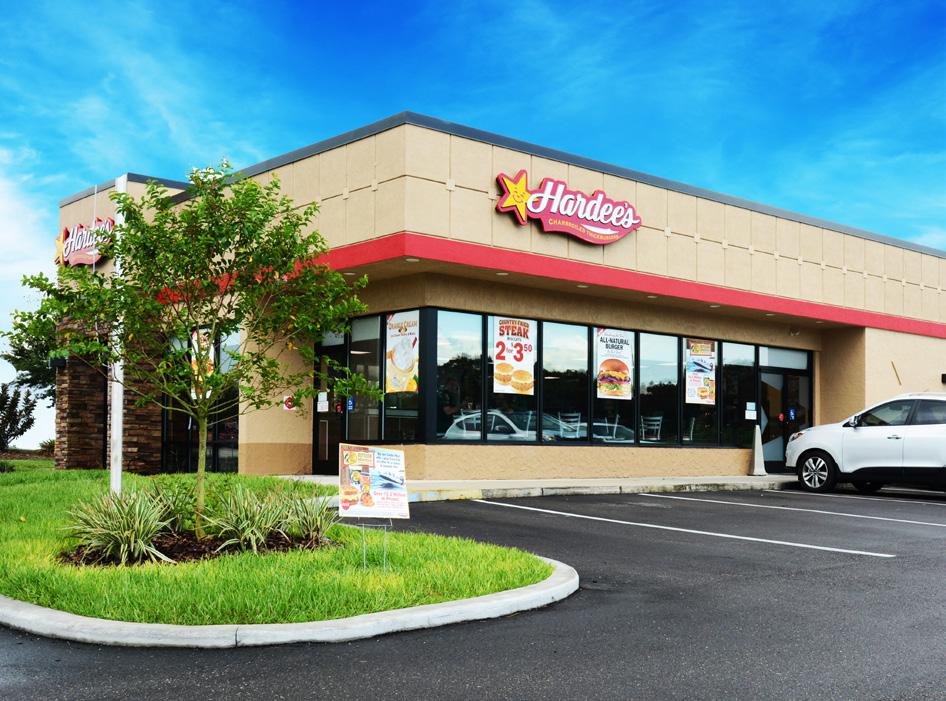
Hardee’s Vincent Renna (949) 207-6396 • vincent.renna@matthews.com
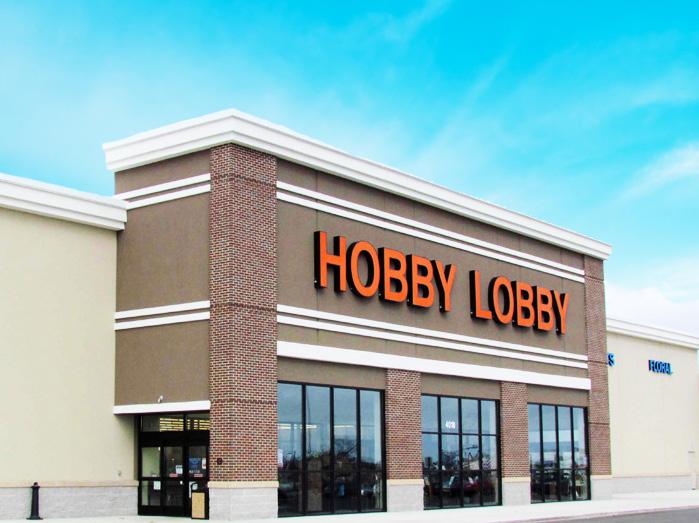
Hobby Lobby Ryan Marmoros (216) 255-9337 • ryan.marmoros@matthews.com
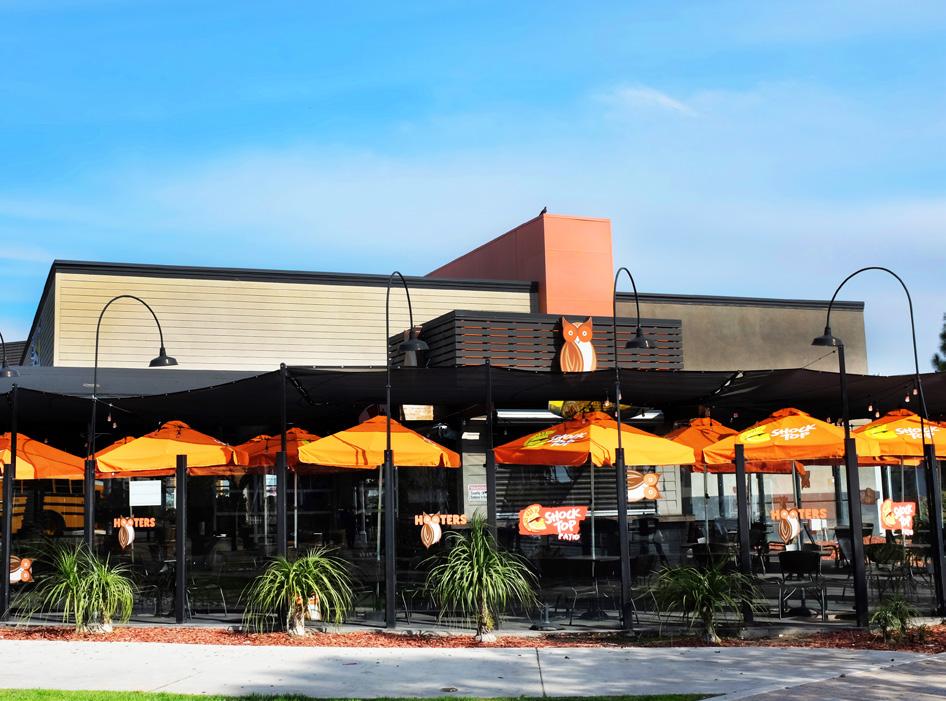
Hooters
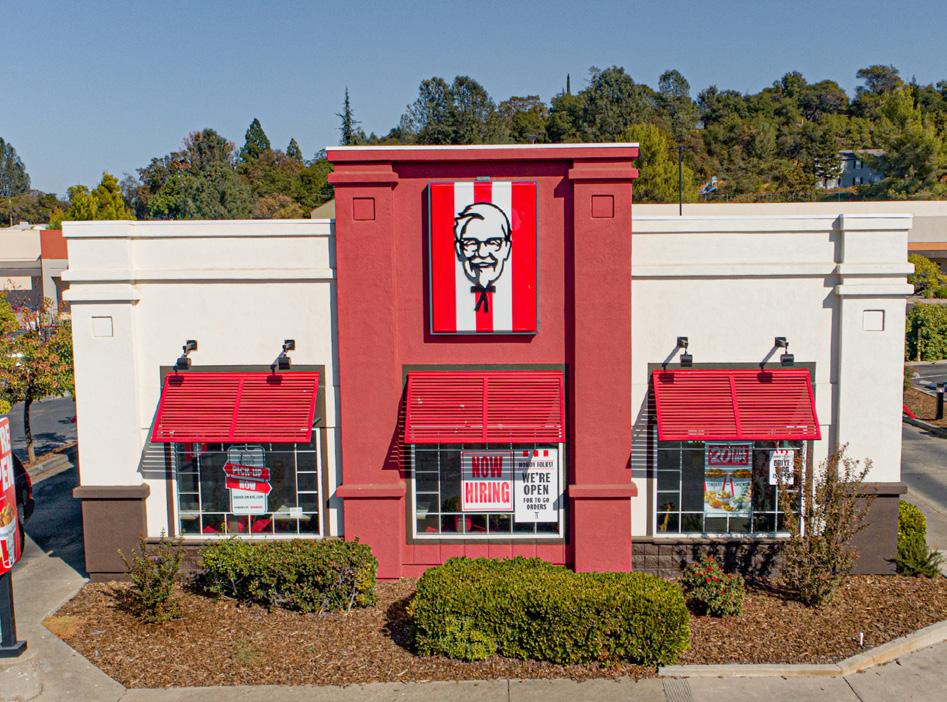
KFC
Kum & Go
Nathan Roberto (949) 200-7916 • nathan.roberto@matthews.com
Tim Campbell (949) 200-7165 • tim.campbell@matthews.com
Alex Goodman (214) 295-8753 • alex.goodman@matthews.com
Mattress Firm Antonio Sibbio (330) 931-9780 • antonio.sibbio@matthews.com
NTB
O’Reilly Auto Parts
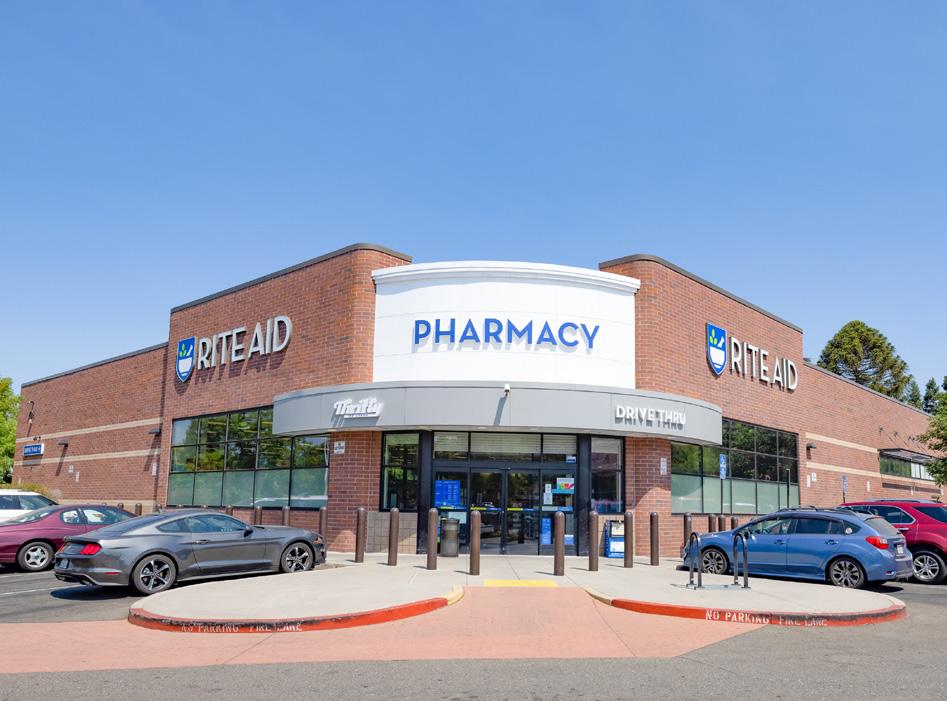
Rite Aid
Antonio Sibbio (330) 931-9780 • antonio.sibbio@matthews.com
Kevin McKenna (214) 295-6517 • kevin.mckenna@matthews.com
Antonio Sibbio (330) 931-9780 • antonio.sibbio@matthews.com
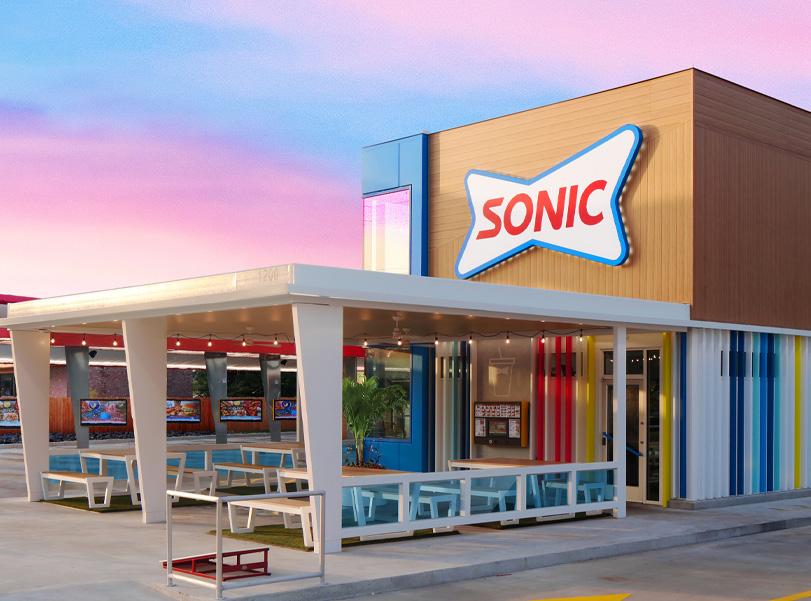
Sonic Saxon Gallegos (949) 945-6007 • saxon.gallegos@matthews.com
Starbucks Jack Morrell (925) 236-3827 • jack.morrell@matthews.com
Taco Bell
Tractor Supply Co.
Walgreens
Wells Fargo
Wendy’s
Zaxby’s
Harrison Wachtler (615) 667-0160 • harrison.wachtler@matthews.com
Ryan Schulten (949) 432-4519 • ryan.schulten@matthews.com
Tarik Fattah (949) 544-1723 • tarik.fattah@matthews.com
Gerard Hamas (615) 535-0105
Vince Chapey (925) 718-7525
Ryan Schulten (949) 432-4519
• gerard.hamas@matthews.com
• vincent.chapey@matthews.com
• ryan.schulten@matthews.com


net lease tenant report WWW.MATTHEWS.COM DISCLAIMER : This information has been produced by Matthews Real Estate Investment Services™ solely for information purposes and the information contained has been obtained from public sources believed to be reliable. While we do not doubt their accuracy, we have not verified such information. No guarantee, warranty or representation, expressed or implied, is made as to the accuracy or completeness of any information contained and Matthews Real Estate Investment Services™ shall not be liable to any reader or third party in any way. This information is not intended to be a complete description of the markets or developments to which it refers. All rights to the material are reserved and cannot be reproduced without prior written consent of Matthews Real Estate Investment Services™.


