INDUSTRIAL INVESTMENT GUIDE


The industrial sector has remained steady throughout the first two quarters of the year, despite macroeconomic uncertainties such as maturing loans, stricter loan underwriting, and a decline in import volumes. While the pace of development starts may be decreasing, it is essential to note that this slowdown is compared to the exceptional growth observed in recent years. Looking at historical trends, the construction pipeline remains significant. With that in mind, new supply entering the market is still expected to increase the national vacancy rate in 2023, while rent growth has slowed from the three percent peak in H2 2022. The rent growth rate will slow down even more in H2 2023 because of the record amount of new supply about to hit the market. As of Q2 2023, over 600 million square feet of industrial space are under construction. According to a report by Commercial Edge, 162.4 million square feet of industrial space were delivered in the first four months of 2023. Further, multiple electric vehicles and semiconductor plants opening in 2024-25 will generate additional leasing activity.


Industrial real estate has become an increasingly attractive investment choice in the past few years. U.S. industrial rent growth remains near record highs at 9.1 percent on a year-over-year basis. However, quarterly gains have been moderating since mid-2022, accompanied by a rise in the national vacancy rate. CoStar Group’s forecast predicts that increasing new construction will further raise vacancy rates in 2023, leading to a deceleration in rent growth by the end of the year.
According to GlobeSt, the semiconductor industry has witnessed an unprecedented increase in manufacturing spending over the past decade, with an average annual growth in capital expenditure of 30 percent. While the demand for PC production declined following the pandemic, there is a rising need for semiconductors in artificial intelligence applications. Given the intense global competition and the increasing demand for AI chips, the semiconductor industry is projected to thrive and expand. This growth will significantly impact the commercial real estate (CRE) industrial sector as a whole, as the semiconductor industry will drive technological advancements and innovation for years
come.

Top-performing industrial properties encompass a range of sectors driven by evolving market demands.
• E-commerce fulfillment centers have experienced high demand due to the surge in online shopping, with notable players like Fulfillment by Amazon and FedEx Fulfillment leading the way.
• Data centers have also seen substantial growth as cloud computing and digital services continue to expand, with major providers including Google, Microsoft, Amazon, Facebook, and Equinix.

• Last-mile distribution centers are increasingly popular to meet the need for faster deliveries, with FedEx, UPS, and USPS leading the pack. Cold storage facilities have witnessed increased demand from the food and pharmaceutical industries, ensuring the safe storage of perishable goods.

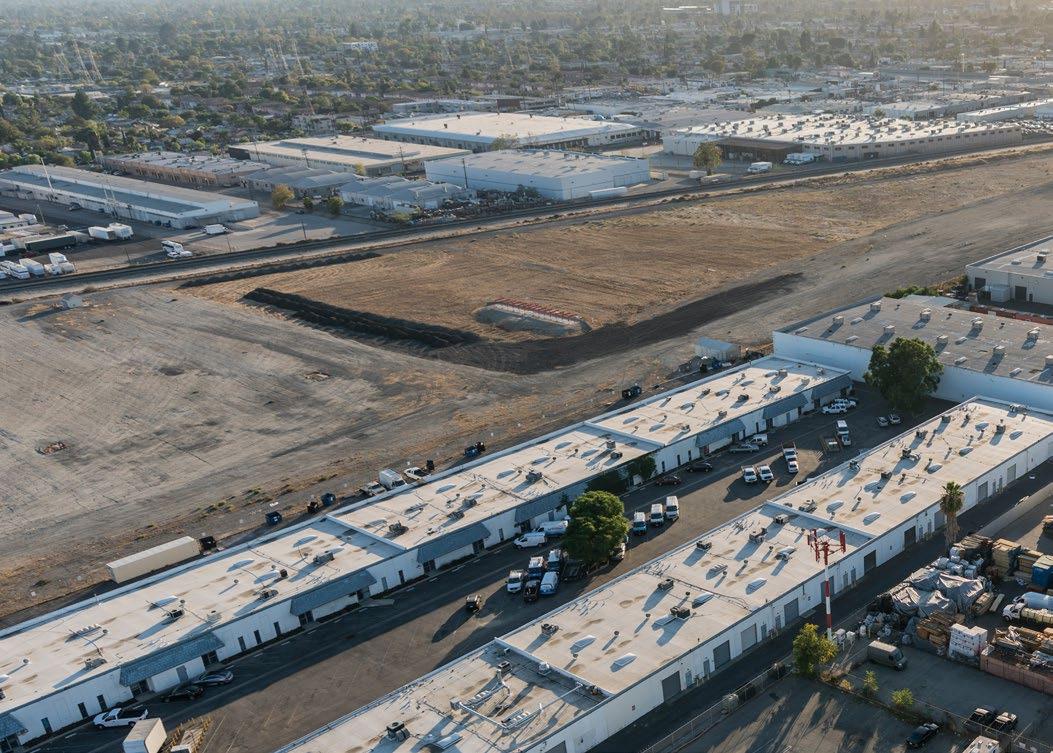
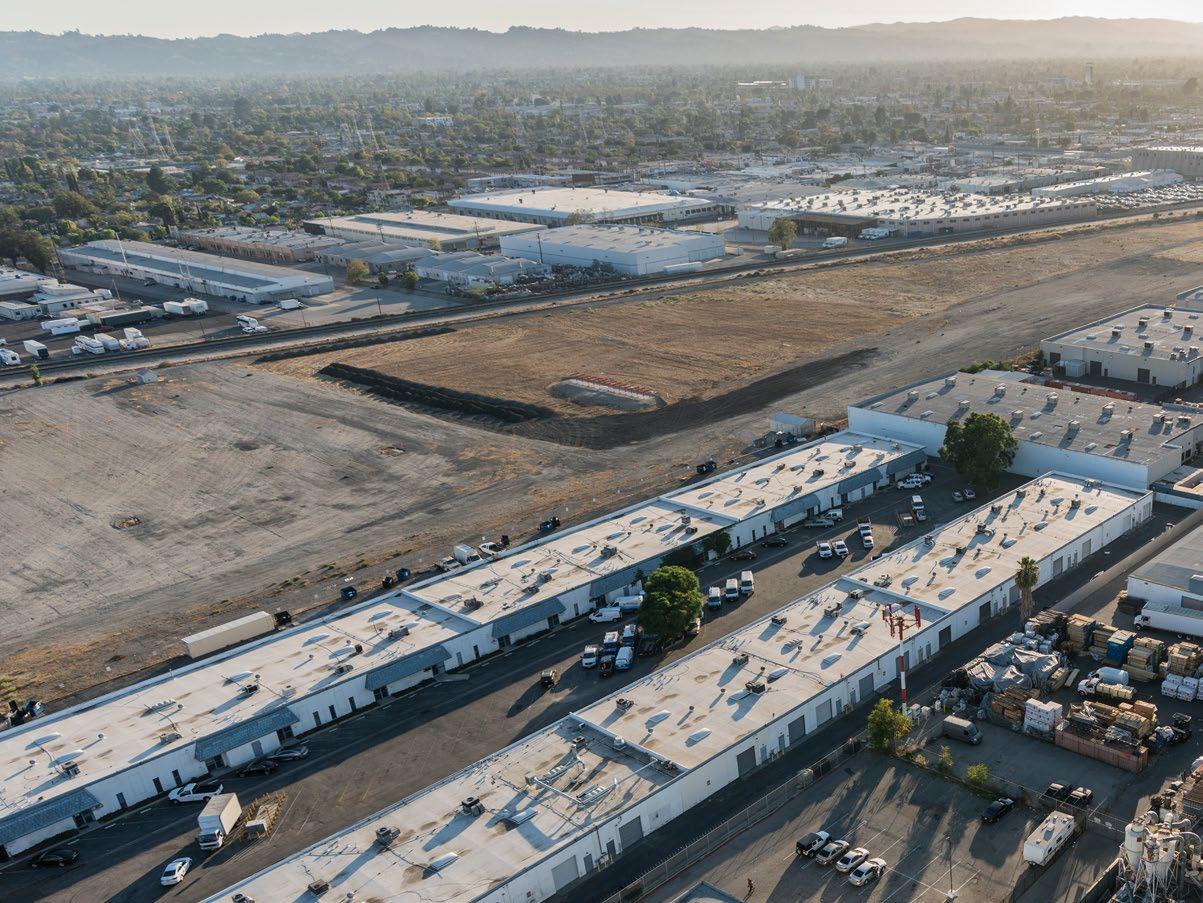
• Industrial parks and flex spaces offer customizable solutions for various industrial needs, attracting a diverse range of tenants.
• Electric vehicle and semiconductor plants are expected to generate significant leasing activity, particularly in the Austin/San Antonio area, Phoenix, and the I-85 corridor.
Disclaimer:
This information has been produced by Matthews Real Estate Investment Services™ solely for information purposes and the information contained has been obtained from public sources believed to be reliable. While we do not doubt their accuracy, we have not verified such information. No guarantee, warranty or representation, expressed or implied, is made as to the accuracy or completeness of any information contained and Matthews REIS™ shall not be liable to any reader or third party in any way. This information is not intended to be a complete description of the markets or developments to which it refers. All rights to the material are reserved and can-not be reproduced without prior written consent of Matthews Real Estate Investment Services™.