Timing the market
LOOKING BACK TO MOVE FORWARD
WHERE TO FIND OPPORTUNITIES IN THE CURRENT ECONOMY
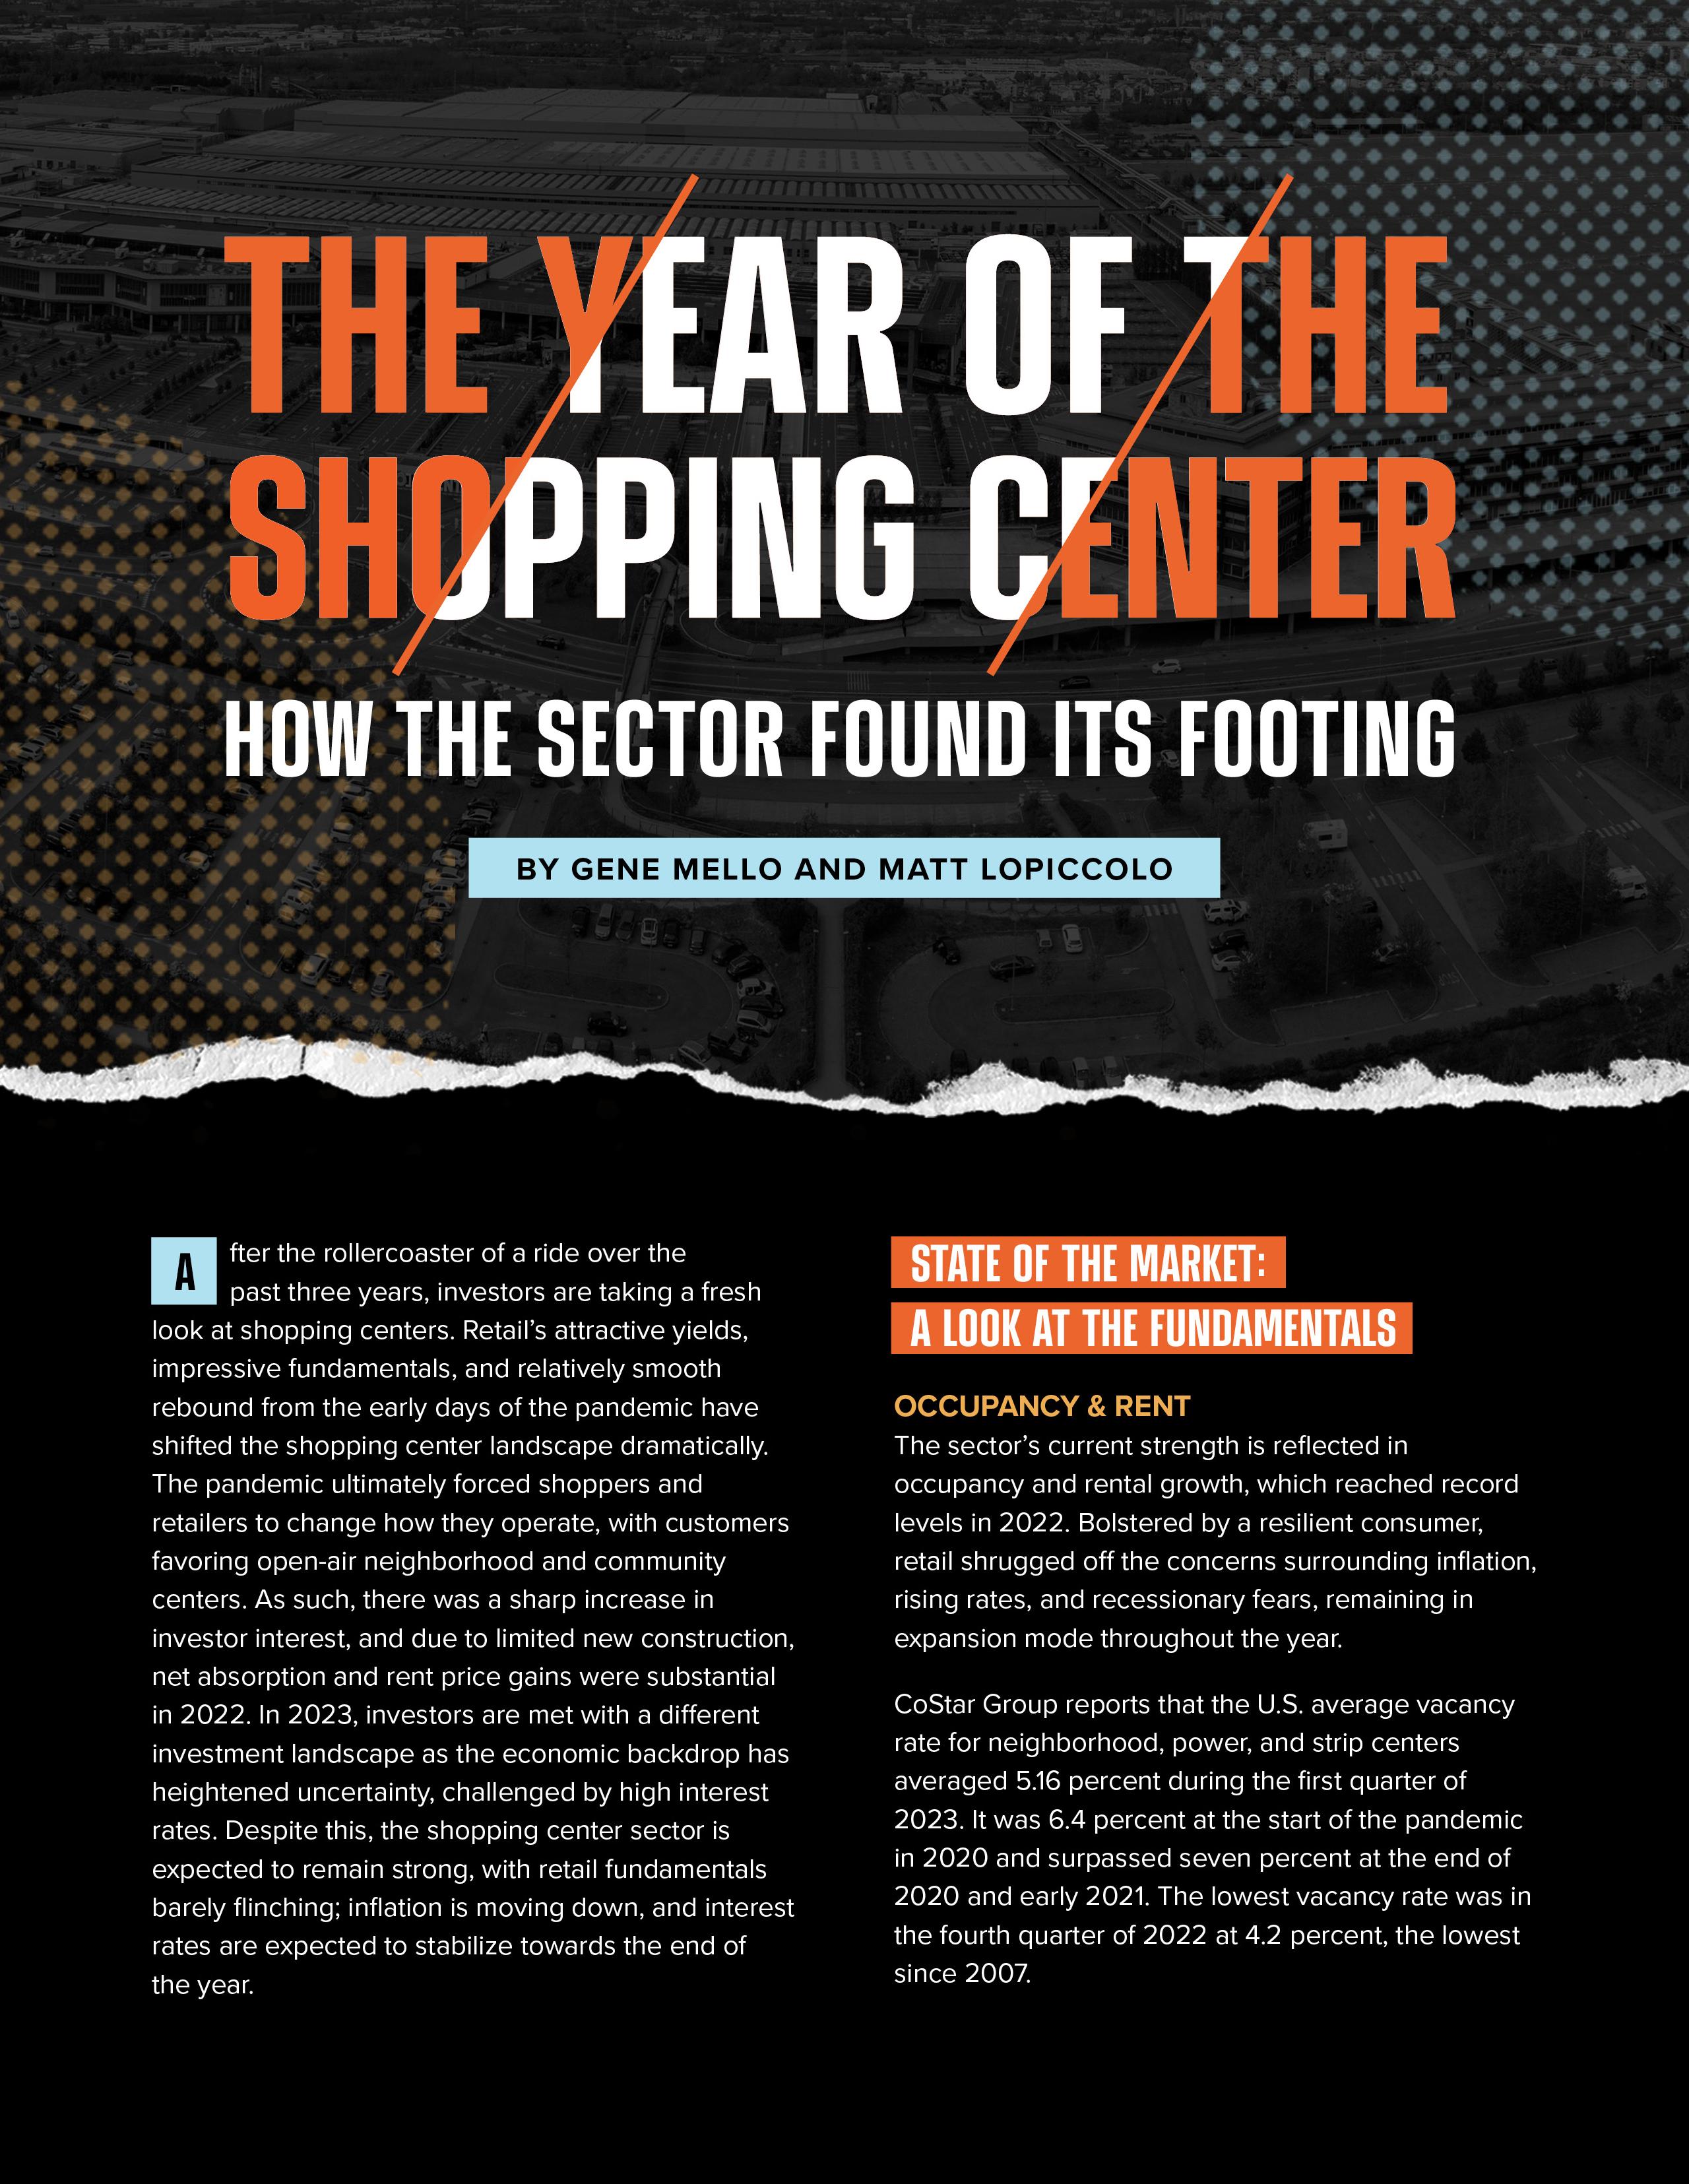
THE YEAR OF THE SHOPPING CENTER

TM SPRING/SUMMER 2023


FEATURED articles THE YEAR OF THE SHOPPING CENTER How the Sector Found Its Footing 32 LOOKING BACK TO MOVE FORWARD How the Great Financial Crisis Compares to Today’s Market 07 MARKETS TO WATCH Where to Find Opportunities in the Current Economy 16


52 HOSPITALITY SUCCESS IN 2023 56 MIDWEST SPOTLIGHT A Look at Multifamily Performance 64 INCREASING PROPERTY VALUE OF SELF-STORAGE FACILITIES 68 THE ROAD TO RECOVERY A Capital Markets Overview 74 MOM-AND-POP Top Leasing Trends to Watch 80 THE FUTURE OF MEDTAIL Trends Transforming Healthcare 84 HOW TO CAPITALIZE IN A DOWN MARKET 07 LOOKING BACK TO MOVE FORWARD How the Great Financial Crisis Compares to Today’s Market 16 MARKETS TO WATCH Where to Find Opportunities in the Current Economy 28 WHAT’S BEHIND THE RECENT DECLINE IN APARTMENT RENTS? 32 THE YEAR OF THE SHOPPING CENTER How the Sector Found Its Footing 38 SECURING STABILITY Why Invest in Government Tenants 43 INDUSTRIAL DEVELOPMENT Movement in the Markets 49 CONTRARIAN APPROACH What. Why. How. TABLE OF CONTENTS
Contributors
Executives
Kyle Matthews
David Harrington
Raddie Zlatkov
Duerk Brewer
Sean Clancy
Paul Mudrich
Featured Agents
Adam Feldman
Austin McLeod
Brian Brady
Catherine Lueckel
Clark Finney
Publications

Kaylee Stock
Lauren Huling
Leanne Jenkins
Lori Valencia
Matt Fitzgerald
Bill Pedersen
Cliff Carnes
Michael Pakravan
Ben Snyder
Daniel Withers
Maxx Bauman
Hutt Cooke
Chuck Evans
Laura Gonzales
Andrew Gross
Keegan Mulcahy
Bob Osbrink
Kurt Sauer
L.B. Sierra
David Treadwell
Matthew Wallace
J. A. Charles Wright
Corey Selenski
Devon Dykstra
DeWitt Goss
Finley Askin
Gene Mello
Design

Erica Ragland
Marina Rubio
Brooke Farris
Alfonso Lomeli
Harrison Auerbach
Hunter Reynolds
Jacob Friedman
Kate Dockery
Matt LoPiccolo
Michael Federico
Mitchell Glasson
Ryan Kawai Sanchez
Thomas Wilkinson
Explore the mindsets, mentality, and motivations of people who have achieved the pinnacle of success in their respective professions.


Listen, Watch, Subscribe Scan to visit website



8 | SPRING/SUMMER 2023

10 | SPRING/SUMMER 2023
MATTHEWS™ | 11

12 | SPRING/SUMMER 2023

MATTHEWS™ | 13


Investors entered 2023 on uncertain footing, facing a different investment landscape compared to the start of the previous year. The front-loaded nature of real estate growth in 2022 decreased as economic growth and supply shocks drove inflation to record levels. Today’s commercial real estate landscape presents some challenges (and opportunities) for investors trying to navigate the uncertainty.
THE FACTORS THAT DETERMINE WHERE TO PLANT CAPITAL
Overall, markets across the U.S. are down as transaction activity decreased, with investors pausing to reassess the risks they face and underwrite appropriately. While it is clear that sentiment is weak, this pause in activity has provided some real estate professionals with time to reposition their portfolios to ride out the current slump and plan for another period of sustained growth and strong returns, and others with opportunities to buy at discounted prices.
This report highlights the markets investors are targeting now and, in the future, based on factors such as population growth, economic growth, job growth, affordability, and real estate market conditions. These factors are only a selection of the growing number of inputs that drive asset performance in certain markets despite an increasingly complex investment environment. These outlooks will largely be dictated by inflation and how the Fed responds throughout 2023. The big six markets – Chicago, Boston, Los Angeles, New York City, San Francisco, and Washington, D.C. – are facing a more pronounced inflationary cycle due to already inflated prices than the rest of the nation. Higher interest rates amid the spike in the cost of living are expected to weaken demand in these markets, pushing investors to explore options outside the big six mentioned above.

16 | SPRING/SUMMER 2023
The Top Three
ALL EYES ARE ON THE SOUTH
It’s important to note that the markets mentioned are primarily located along the Sunbelt, with Northern New Jersey as an outlier. Following the pandemicinduced changes on what aspects are essential for business operations and residents, population and rapid economic growth along the Sunbelt increased. The Sunbelt holds approximately 50 percent of the national population (326 million), which is expected to rise to about 55 percent by 2030. From the affordable nature of the markets across the region to tax-friendliness and quality of life, the Sunbelt’s markets are expected to grow faster than any others in the nation.
Nashville Dallas-Fort Worth Atlanta
Nashville is ranked at the top of the markets to watch list as it holds one of the strongest office-job markets in the nation and benefits from expanding industrial, automotive, and healthcare industries. Several large corporations have announced headquarters relocations or expansion plans to the market for its businessfriendly environment.


Dallas-Fort Worth took the number-two spot as many investors witnessed the fastgrowing market’s ability to balance the continuous supply with corresponding absorption. Compared to other markets, DFW makes a point to adequately expand infrastructure alongside real estate development, the failure to do this is an impediment to growth.

Dubbed “The New York of the South,” Atlanta is poised to experience the most population growth in 2023, according to the National Association of Realtors. Atlanta’s metro area population increased by 1.55 percent in 2023 from 2022 and 1.73 percent in 2021 versus 2020.

MATTHEWS™ | 17
AN IN-DEPTH LOOK AT THE MARKETS
NASHVILLE TENNESSEE
Nashville has made monumental strides in growth, including population, construction, and employment. Household formation has more than doubled the national average, partly due to the numerous significant universities that call the metro home. Additionally, millennials account for a majority of the population growth, thanks to the ever-expanding job market.

"The quality of life that Nashville provides is a principal cause as to why people are moving here. There is a much lower cost of living compared to larger coastal markets, and wages continue to grow. Nashville attracts and produces talented workers, and large companies like Oracle and Amazon recognize that. These large companies are moving high-paying jobs to the market, bringing in talent while maintaining a strong quality of life for their employees."
HUTT COOKE
Nashville Market Leader
The developers and investors interested in Nashville provide insight into the market’s trajectory. Buyers continue to make their way to the area, but with a
different regularity than in 2021 and early 2022. Rising rates have impacted local deal flow in the market, but that hasn’t stopped the flight toward quality. All sectors of CRE are seeking top-quality assets, introducing the under-construction pipeline with spec builds and build-to-suits, with other projects waiting in the wings.
The industrial market continues to flourish from above historical norms, benefiting from the national logistics boom occurring since the onset of the pandemic. Nashville’s geographic position allows companies based here to reach over half the country’s population in roughly a day’s drive, helping the market attract third-party logistics firms, e-commerce companies, and retailers.
Over the past several years, the above-average economic and population growth has helped boost Nashville’s retail market, allowing property owners to raise rents briskly. In fact, Nashville’s retail rents have increased at one of the fastest rates in the country over the past 12 months, with annual rent growth coming in at an impressive 7.8 percent.
18 | SPRING/SUMMER 2023
DALLAS-FORT WORTH TEXAS
Many experts deem DFW as one of the best markets for overall real estate prospects. Over time, the economic fabric of DFW has become more diversified, with a global reach that resembles that of a big six market. Employment growth is expected to outperform the national benchmark over the next five years. Meanwhile, household incomes continue to rise. Over recent years, median household incomes have grown about four percent annually and are now tracking near $80,000.
"The Dallas-Fort Worth market is a top performer for several reasons. First, it has a strong and diverse economy, with major industries ranging from healthcare and finance to technology and logistics. This diversity helps to mitigate the impact of economic downturns in any one sector.

The market also benefits from its central location in the United States, making it a hub for transportation and distribution. This has led to a thriving logistics industry, with major companies such as FedEx and UPS having significant operations in the area.
Another factor contributing to the strength of the DFW market is its relatively affordable cost of living and business-friendly environment. Finally, the DFW market has seen significant population growth in recent years, with projections indicating continued growth in the future. This growth has fueled demand for housing, commercial real estate, and other services, contributing to the overall strength of the market."
ANDREW GROSS Dallas Market Leader
Robust economic underpinnings have fostered a healthy commercial real estate market. Outperforming demand and rent growth across all CRE sectors have driven interest from investors, pushing sales volume and asset pricing higher. The most substantial shift in growth on record occurred over the past two years. While investors remain keen on the long-run structural advantages of DFW, deal volume was curbed by rising interest rates, which have weighed on investor sentiment. Despite this, continuous supply and leading absorption levels make DFW one of the country’s fastest-growing and balanced markets.
Development within the multifamily market is strong, tracing robust population growth in the region. The trend runs counter to several other major Sunbelt markets whose pipelines are starting to settle after swelling the past two years. Healthy job growth and continuous in-migration are two primary drivers of apartment demand in the metroplex. Since 2010, the market has added about 200,000 new multifamily units, growing its inventory by 33 percent, the most among major markets in the country. The DFW industrial market is also undergoing a massive expansion, as developers can work quickly, thanks to abundant and relatively cheap land. The metroplex is in an excellent position due in part to its central location in the U.S., excellent highway and rail networks, and world-class airports.
MATTHEWS™ | 19
ATLANTA GEORGIA
In recent years, the Southeast has transformed into a hot spot for population and business growth, positioning its real estate to be one of the best performing in the country. The transitionary growth has reached beyond well-known metros and into secondary cities across the market, helping commercial real estate accomplish record-level investment activity. In 2023, the market has downshifted slightly after a record run of tightening vacancies and escalating leasing activity.
Few retail markets, for both owners and tenants, are enjoying success like Atlanta. Space is absorbed quickly, investment demand is present, rent growth is healthy, and pricing power remains with landlords. Interest rate hikes, inflation, and rising debt costs haven’t deterred investors from buying in Atlanta, primarily centers with high-profile national
retailers with good credit. Tenants are still willing to pay higher rents in well-located centers near Atlanta’s varied pockets of strong buying power, growing neighborhoods, and recovering office markets. Unanchored strip center cap rates were up 74 basis points, while the cap rates for groceryanchored centers have risen by 50 basis points as investors flock to those investments. Retail vacancy decreased to the lowest figure in Atlanta’s history, 3.5 percent, after almost 2.8 million square feet were absorbed in 2022, twice as much as in 2021.
Atlanta remains one of the country’s least expensive major industrial markets, commanding significant rent increases but still discounted compared to other large West and East Coast distribution markets. In the multifamily sector, absorption is flat across an inventory nearing 500,000 market-rate units.

20 | SPRING/SUMMER 2023
AUSTIN
The expansive Austin market remains a top market for people to work and live. It is home to a booming tech industry and plentiful employment opportunities, attracting many young professionals. Even with employers, particularly in the tech sector, cutting back on labor costs, the economy continues to add jobs and grow at an annual rate of 4.2 percent. Since 2010, the market has experienced over 25 percent growth in population, with 120 to 150 people moving to the capital daily. Austin has a hefty development pipeline across multiple CRE sectors to accommodate population growth, boasting the third-largest construction pipeline in the country. However, many professionals anticipate supply-side risk as these deliveries become available.
While the Austin market has not been immune to softening in demand, the multifamily sector is still outperforming many other markets nationwide, thanks in part to the resilient labor market. Annual multifamily net absorption as a share of inventory leads the nation’s largest 50 markets, with roughly 6,700 units absorbed within the last 12 months.

Further, the market has approximately 15.6 percent of the market’s existing inventory underway, equivalent to around 42,000 units.
Again, motivated by a lower cost of doing business, access to a growing talent pool, and one of the fastest-growing populations in the country, industrial users continue to make Austin a destination for their relocation or expansion plans. Approximately 17.5 million square feet of space is currently under construction, primarily speculative development.
Austin hasn’t reached the end of the runway yet in terms of expansion. The market is facing its fair share of growing pains as the rapid-fire population continues, resulting in limited land availability, price increases, affordability concerns, and infrastructure challenges. Austin won’t be slowing its roll any time soon as creative developments, redevelopments, and relocations continue to pop up.
MATTHEWS™ | 21
TEXAS
TAMPA/ST. PETERSBURG FLORIDA
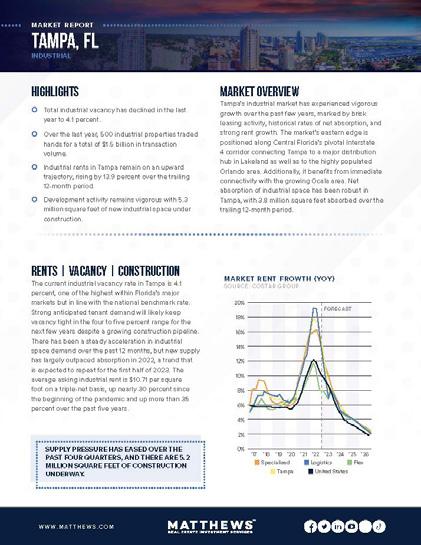
Tampa’s economy has been quite strong in recent years, and its labor market remains one of the strongest in Florida. Job growth has been the market’s biggest success story over the past decade, but population growth has been equally impressive. Oxford economics predicts a population gain on average of one percent from 2022 to 2026. The market, however, doesn’t come without its fair share of challenges, including a below-average medium-income level of $65,000, which trails the U.S. average by 10 percent. Despite this, the market has many factors to help offset the large spread, including no state income tax and one of the nation’s most affordable housing markets.
“It seems like every day you hear Tampa being mentioned in the news. From being named one of Time Magazine’s top 50 “World’s Greatest Places” or hearing national and global corporations being bullish on the Tampa market, Tampa has certainly seen its fair share of recognition. Despite some market headwinds, the commercial real estate market continues to see impressive activity in all facets of the market.”
L.B. SIERRA, Tampa Market Leader
Retail, multifamily, and industrial have experienced vigorous growth over the past few years. Unprecedented levels of multifamily demand have fueled rent growth by roughly 25 percent through the beginning of 2022, but following a recent significant supply wave, the apartment vacancy rate has increased to 7.5 percent. Tampa’s industrial market has seen historical net absorption rates and strong rent growth. The sector is in a great position as Tampa connects to major distribution hubs throughout Florida.
RALEIGH/DURHAM NORTH CAROLINA
In 2022, the Raleigh/Durham market was ranked the fourth fastest-growing city in the U.S., according to the Kenan Institute’s report known as the American Growth Project. The growth is attributed to increases in employment, with companies moving into and hiring from the area. The market is known for its “research triangle,” a powerhouse for biotech, technology, life sciences, manufacturing, and finance, even amid possible cuts in the industry nationwide. This created growth in itself, but with that growth, a rising cost of living followed, pushing many to rent instead of buy. Over the past decade, Raleigh has gained more than 260,000 residents, nearly tripling the national growth rate, according to Carolina Demographic. In the next 15 years, the region expects to expand by another 125,000 residents.


Underpinned by the growth, Raleigh/Durham’s commercial real estate is reaping the same benefits. Retail rents have increased across all asset types at rates well above the national levels, though rent growth may have peaked in late 2022, and moderation is expected for the rest of 2023. Vacancies remain incredibly tight at just 2.5 percent and an availability rate of just 3.4 percent. Growth is robust for power centers, grocery stores, and other necessity-based retailers. A significant trend across the industry is properties being purchased for redevelopment purposes into higher uses. New construction is expanding south and east into outlying communities.
Demand for e-commerce and other distribution operations is strong, particularly towards the western side of the metro. The market’s robust pipeline will likely cause a further rise in the vacancy rate, though it is expected to stay below the region’s historical average. Investors have shown strong interest in Durham, and sales volume is near an alltime high, despite current market conditions.
22 | SPRING/SUMMER 2023
MIAMI/FT. LAUDERDALE FLORIDA
South Florida has always been highly dependent on tourism but has evolved, and Miami now ranks as one of the world’s top cities. South Florida’s high rankings and growing population have spurred the startup network for tech and new businesses in Miami and Fort Lauderdale. Oxford Economics forecasts that Miami will see job growth of 1.2 percent in 2023. The luxury single-family housing market is a significant driver for the growth seen in both metros, translating into immense development in commercial real estate.
"The South Florida commercial market is a top performer nationwide as it continues to benefit from the migration of people, companies, and significant wealth from other parts of the country as well as internationally. What makes South Florida an enticing market is not just the massive population and job growth, but also the high volume of real estate assets with attractive returns and safety for the capital of domestic and international investors. The lack of income tax, high tourism and robust consumer spending will continue to keep South Florida among the top commercial markets across the country. As such, it is poised for
Fort Lauderdale Associate Market Leader
The retail market has seen 1.7 million square feet delivered over the past three years, and there are currently 590,000 square feet underway.
The industrial market has delivered 13.2 million square feet or a cumulative inventory expansion of 5.3 percent over the past three years. The multifamily market has delivered 12,000 units over the past three years or a cumulative inventory expansion of 9.9 percent from 2022 to 2023. There are also 13,000 multifamily units currently underway, representing the largest under-construction pipeline in over three years. Retail rents rose 10.7 percent on an annual rate during the first quarter of 2023 and have posted an average yearly gain of 6.5 percent over the past three years. Industrial rents in Miami rose 17.3 percent and Fort Lauderdale 16.4 percent annually during Q1 2023.
In the office space, the average square footage leased has increased from 500 square feet to 2,500 square feet due to the migration of out-of-state firms to the region. Trends such as co-working office spaces have also played a significant role in filling tenant demand.
With South Florida’s industrial, office, and retail sectors holding steady, growth is expected in 2023. In 2022, Blackstone invested $1.3 billion into industrial properties in Miami-Dade County, an indicator that South Florida’s commercial real estate market will continue to perform in 2023. Additionally, Prologis acquired $1.1 billion worth of industrial properties, pushing asking rents to record highs in the county.

continued growth and success in the future."
DEVON DYKSTRA
MATTHEWS™ | 23
PHOENIX ARIZONA
The Phoenix MSA has a population of approximately 4.95 million, a slight increase from the previous year of over 4.6 million. In addition to the population growth, a diversifying economy, relative affordability, and business-friendly regulation have strengthened Phoenix’s value proposition. These characteristics attract more than 200 people to the market daily. Phoenix remains one of the nation’s best-performing markets for employment growth recording more than 75,000 job additions in 2022. As Phoenix continues to boom, many out-of-state investors, particularly from California, have expanded their portfolios due to proximity, higher yields, and stronger cap rates.

"The growth of The Valley is similar to the "Path of Progress" that occurred in Southern California in the 1980s and 1990s. Los Angeles got expensive and crowded, which pushed its growth to Orange County. As Orange County grew, the Inland Empire became a desired location for businesses and homeownership. As Southern California experiences high taxes and restrictions on development, the "path" is now into Arizona, particularly the Greater Phoenix market. This is the beginning of this growth pattern and should keep Arizona's economy expanding for decades."
BOB OSBRINK
Phoenix Market Leader
Multifamily supply is outpacing demand, as absorption moderated and construction activity ramped up, causing vacancies to rapidly increase. As a result, annual rent growth has turned negative and concession usage has increased. However, the long-term outlook for fundamentals is positive due to Phoenix having the country's strongest employment and household growth and low levels of singlefamily inventory.
The retail market conditions are the tightest they’ve been in recent memory. The MSA may be approaching a supply-constrained market, not because demand is slowing but because retailers are struggling to find space. The construction pipeline remains muted as construction costs are higher and financing for speculative construction is constricted. These dynamics support healthy rent growth; market rents have risen 7.7 percent over the past 12 months. In the industrial sector, the market faces one of the most aggressive construction pipelines in the U.S., with 45.6 million square feet scheduled to be delivered in 2023. This underlying demand is driven by Phoenix’s strong momentum in various industrial-related sectors. Plus, The Valley plays a crucial role in national supply chains, boasting a rapidly expanding consumer base and advanced manufacturing industries.
24 | SPRING/SUMMER 2023
CHARLOTTE NORTH CAROLINA
Nicknamed the Queen City, this rapidly growing Sunbelt market is attractive to many professionals and developing businesses. The market has witnessed massive inbound migration, averaging nearly 100 new people moving to Charlotte each day, and the population is projected to grow by 50 percent by 2030. The area’s robust economy, lower cost of living, and businessfriendly government drive the steadily increasing population. Charlotte is a global hub for businesses with thriving healthcare and financial services. The market is home to the headquarters of three of the nation’s six largest banks – Bank of America, Wells Fargo, and Truist. The relative strength of the financial industry bolstered the market economy through the most recent economic downturn. But, of course, there is a lot more to Charlotte than just business.
Charlotte’s commercial real estate marketplace draws investors and tenants across the county. It is bolstered by demographic tailwinds that bring in new residents with greater education and higher incomes, further fueling economic activity in the region. Charlotte’s apartment inventory is expanding fast, and the market’s construction pipeline, on a percentage basis, remains in the top 10 among U.S. metros. There are currently 30,000 units under construction, representing 14.4 percent of the existing inventory. However, the supply surge led to a slowdown in rent growth heading through early 2023. The industrial market has seen great success due to its proximity to major markets and recent investments in infrastructure. The market expanded its industrial inventory by more than 15 percent. The retail market saw bolstered consumer spending. A recently released census report shows that Charlotte’s market grew by 1.2 percent, making it the seventh-fastest growing large metro in the county, levering the brick-andmortar retail space despite economic uncertainty and the shift to online shopping.

MATTHEWS™ | 25
NORTHERN NEW JERSEY
The Southern and Western portions of the U.S. have been the focus of demographic shifts in the country. Still, the Northeast also sees promising migration numbers, especially in the Northern part of New Jersey. Despite New Jersey being ranked as one of the top outbound states of 2022 due to a high cost of living, the northern portion of the state is among the most popular destinations for renters and has one of the strongest industrial markets in the nation. Like many suburban markets throughout the U.S., the metro has benefitted from robust demand due to residents relocating from more densely populated areas, like New York.
The Northern New Jersey multifamily market sees record-high occupancy rates, gross deliveries, asking rents, and asset pricing. A primary driver is the high home prices and surge in mortgage rates, pushing more would-be buyers toward the apartment rental market. According to a recent Yardi RentCafe analysis, North Jersey is the most competitive rental market in the U.S., outpacing the Sunbelt. North Jersey outranked many other major markets regarding the number of days apartments were vacant, occupancy percentage,

KEY TAKEAWAYS
number of prospective renters competing for a given apartment, percentage of lease renewals, and share of new apartments completed.
Northern New Jersey has also performed remarkably well as the growth of e-commerce and retail distribution networks boosted the need for more logistics space. Already strong, fundamentals were accompanied by increasing cargo volume to the port of New York and New Jersey, helping to propel the metro into the national limelight as importers increasingly sought out the East Coast as a more stable alternative to California Ports. In addition, the population’s enormous purchasing power made Northern New Jersey’s logistical demand necessary as the market boasts one of the strongest retail markets in the country. The retail market has attracted interest from owners and tenants due to the stable consumer base with some of the nation’s highest average incomes. In addition, retailers are right-sizing their spaces and building their logistics network to accommodate shopper preferences gravitating to buy online and pick up instore business models.
Numerous dynamics, on both macro and micro levels, are affecting the short-term and long-term outlook for CRE markets. Fast-growing and business-friendly secondary markets are pushing through an economic slowdown and are prime for CRE investment. Real estate professionals are more willing to consider markets outside the big six, and the perpetual search for new opportunities ensures constant flux in how markets are viewed over time.
26 | SPRING/SUMMER 2023
NEW JERSEY
FROM FUNDING TO CLOSE, THE MATTHEWS™ PLATFORM PROVIDES A ONE-STOP-SHOP.


CAPITAL MARKETS

A FULL SUITE OF CAPITAL SOLUTIONS TO SOLVE EVERY REAL ESTATE FUNDING NEED. MATTHEWS™


WHAT’S BEHIND THE RECENT DECLINE IN APARTMENT
RENTS?
HOW MUCH HAS RENT FALLEN FROM LAST YEAR?
ACCORDING TO RECENT DATA PROVIDED BY APARTMENT LIST, RENTERS WITH NEW LEASES IN JANUARY 2023 PAID A MEDIAN RENT THAT WAS 3.5% LOWER THAN THE AUGUST 2022 RATE, HEAVILY ATTRIBUTED TO THE RECORD NUMBER OF MULTIFAMILY UNITS DELIVERED.
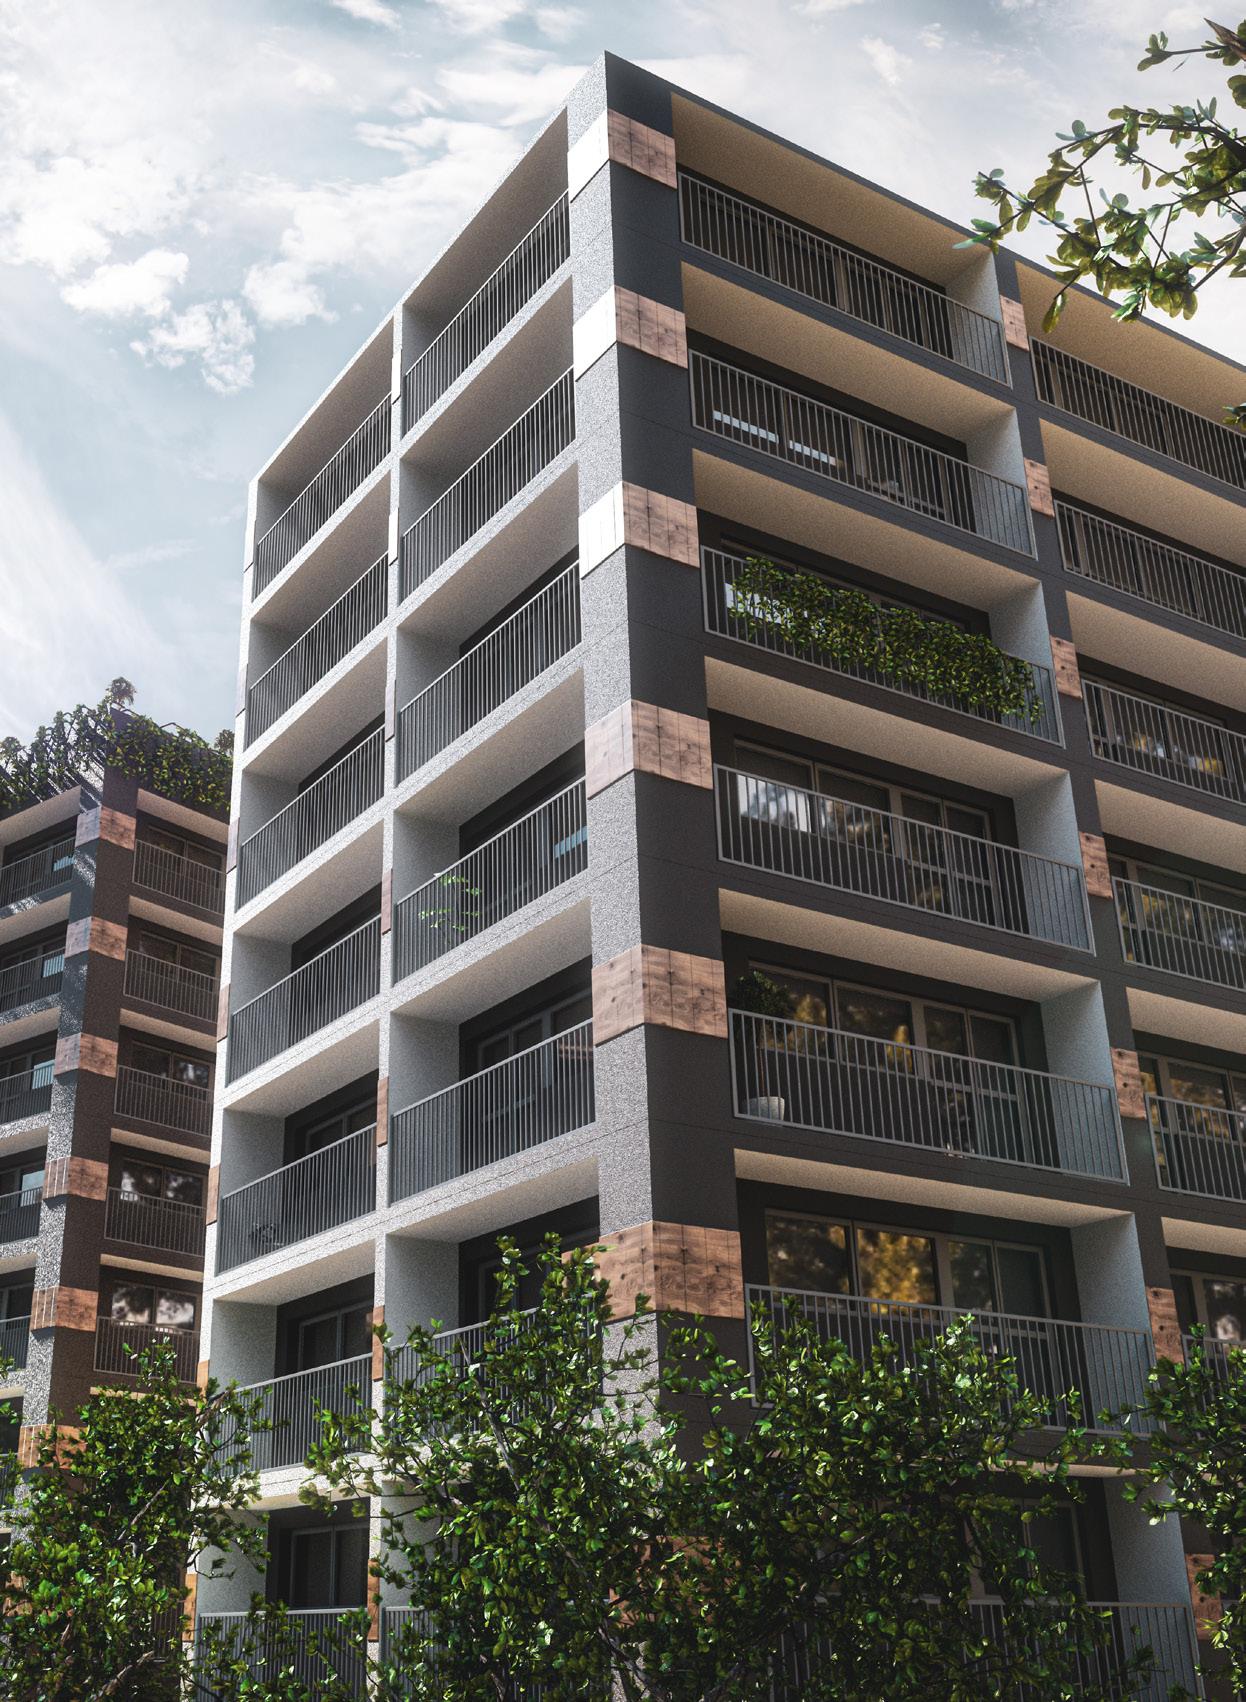
National year-over-year rent growth has noticeably declined, standing at three percent as of March 2023, making it the lowest rent growth level since April 2021. Rents began dropping in September 2022 and proceeded to fall for the next five months until the slight increase seen in February 2023.
The national median rental rate for January 2023 was $1,942, slightly lower than December 2022’s median rental rate of $1,978 and the lowest since February 2022. Rental prices began rising in mid-2021, first surpassing $2,000 in May 2022 and peaking at $2,053 in August 2022.
BY DANIEL WITHERS & ADAM FELDMAN
Rising interest rates, inflation, and recession worries have caused a dramatic shift throughout the multifamily market. After surging from mid-2021 through the first half of 2022, apartment rents are falling in almost every major U.S. metropolitan area. Experts predict this slowdown to continue until year-end 2023 due to supply additions outstripping mediocre demand. However, positive monthly rent growth during seasonality highs could reverse this yearover-year trend.
The national rent index did experience an increase of 0.3 percent for February 2023, ending the fivemonth decline in the rent growth period. However, this minuscule increase does not negate the fact that year-over-year rent growth is seeing a steady decline, and experts do not foresee any noteworthy rent increases in the following months.
YOY CHANGE IN NATIONAL RENT INDEX Source: Apartment List Rent Estimates 2018 2019 2020 2021 2022 2023 20% -5% 0% 5% 15% 10% Start of COVID-19 Pandemic 28 | SPRING/SUMMER 2023
EVERY MAJOR URBAN AREA IN THE COUNTRY HAS EXPERIENCED A FALL IN APARTMENT RENTALS SINCE THE SUMMER OF 2022, INCLUDING SEATTLE, SAN FRANCISCO, SAN JOSE, AND NEW YORK.
U.S. METRO AREAS WITH SLOWEST RENT GROWTH
THE VACANCY INDEX HIT ITS HIGHEST LEVEL IN TWO YEARS IN MARCH 2023, STANDING AT 6.4%.
Source: Apartment List
The San Francisco metro saw the most significant rent reduction in the country during the first year of the pandemic and has been the slowest market to recover since then. San Jose and San Francisco are the only two major metro areas where the median rent is less than it was during the onset of COVID-19. Several urban, densely-populated submarkets in the San Francisco Bay area are rebounding at an even slower rate.
Over the past 12 months, some markets that had been booming have now quickly cooled off, according to Apartment List data. Metros, including Las Vegas and Phoenix, have seen the sharpest rent declines despite both cities being among the top 10 in terms of pandemic-era rent growth.
SLOWEST METRO-LEVEL RENT GROWTH
U.S. METRO AREAS WITH HIGHEST RENT GROWTH
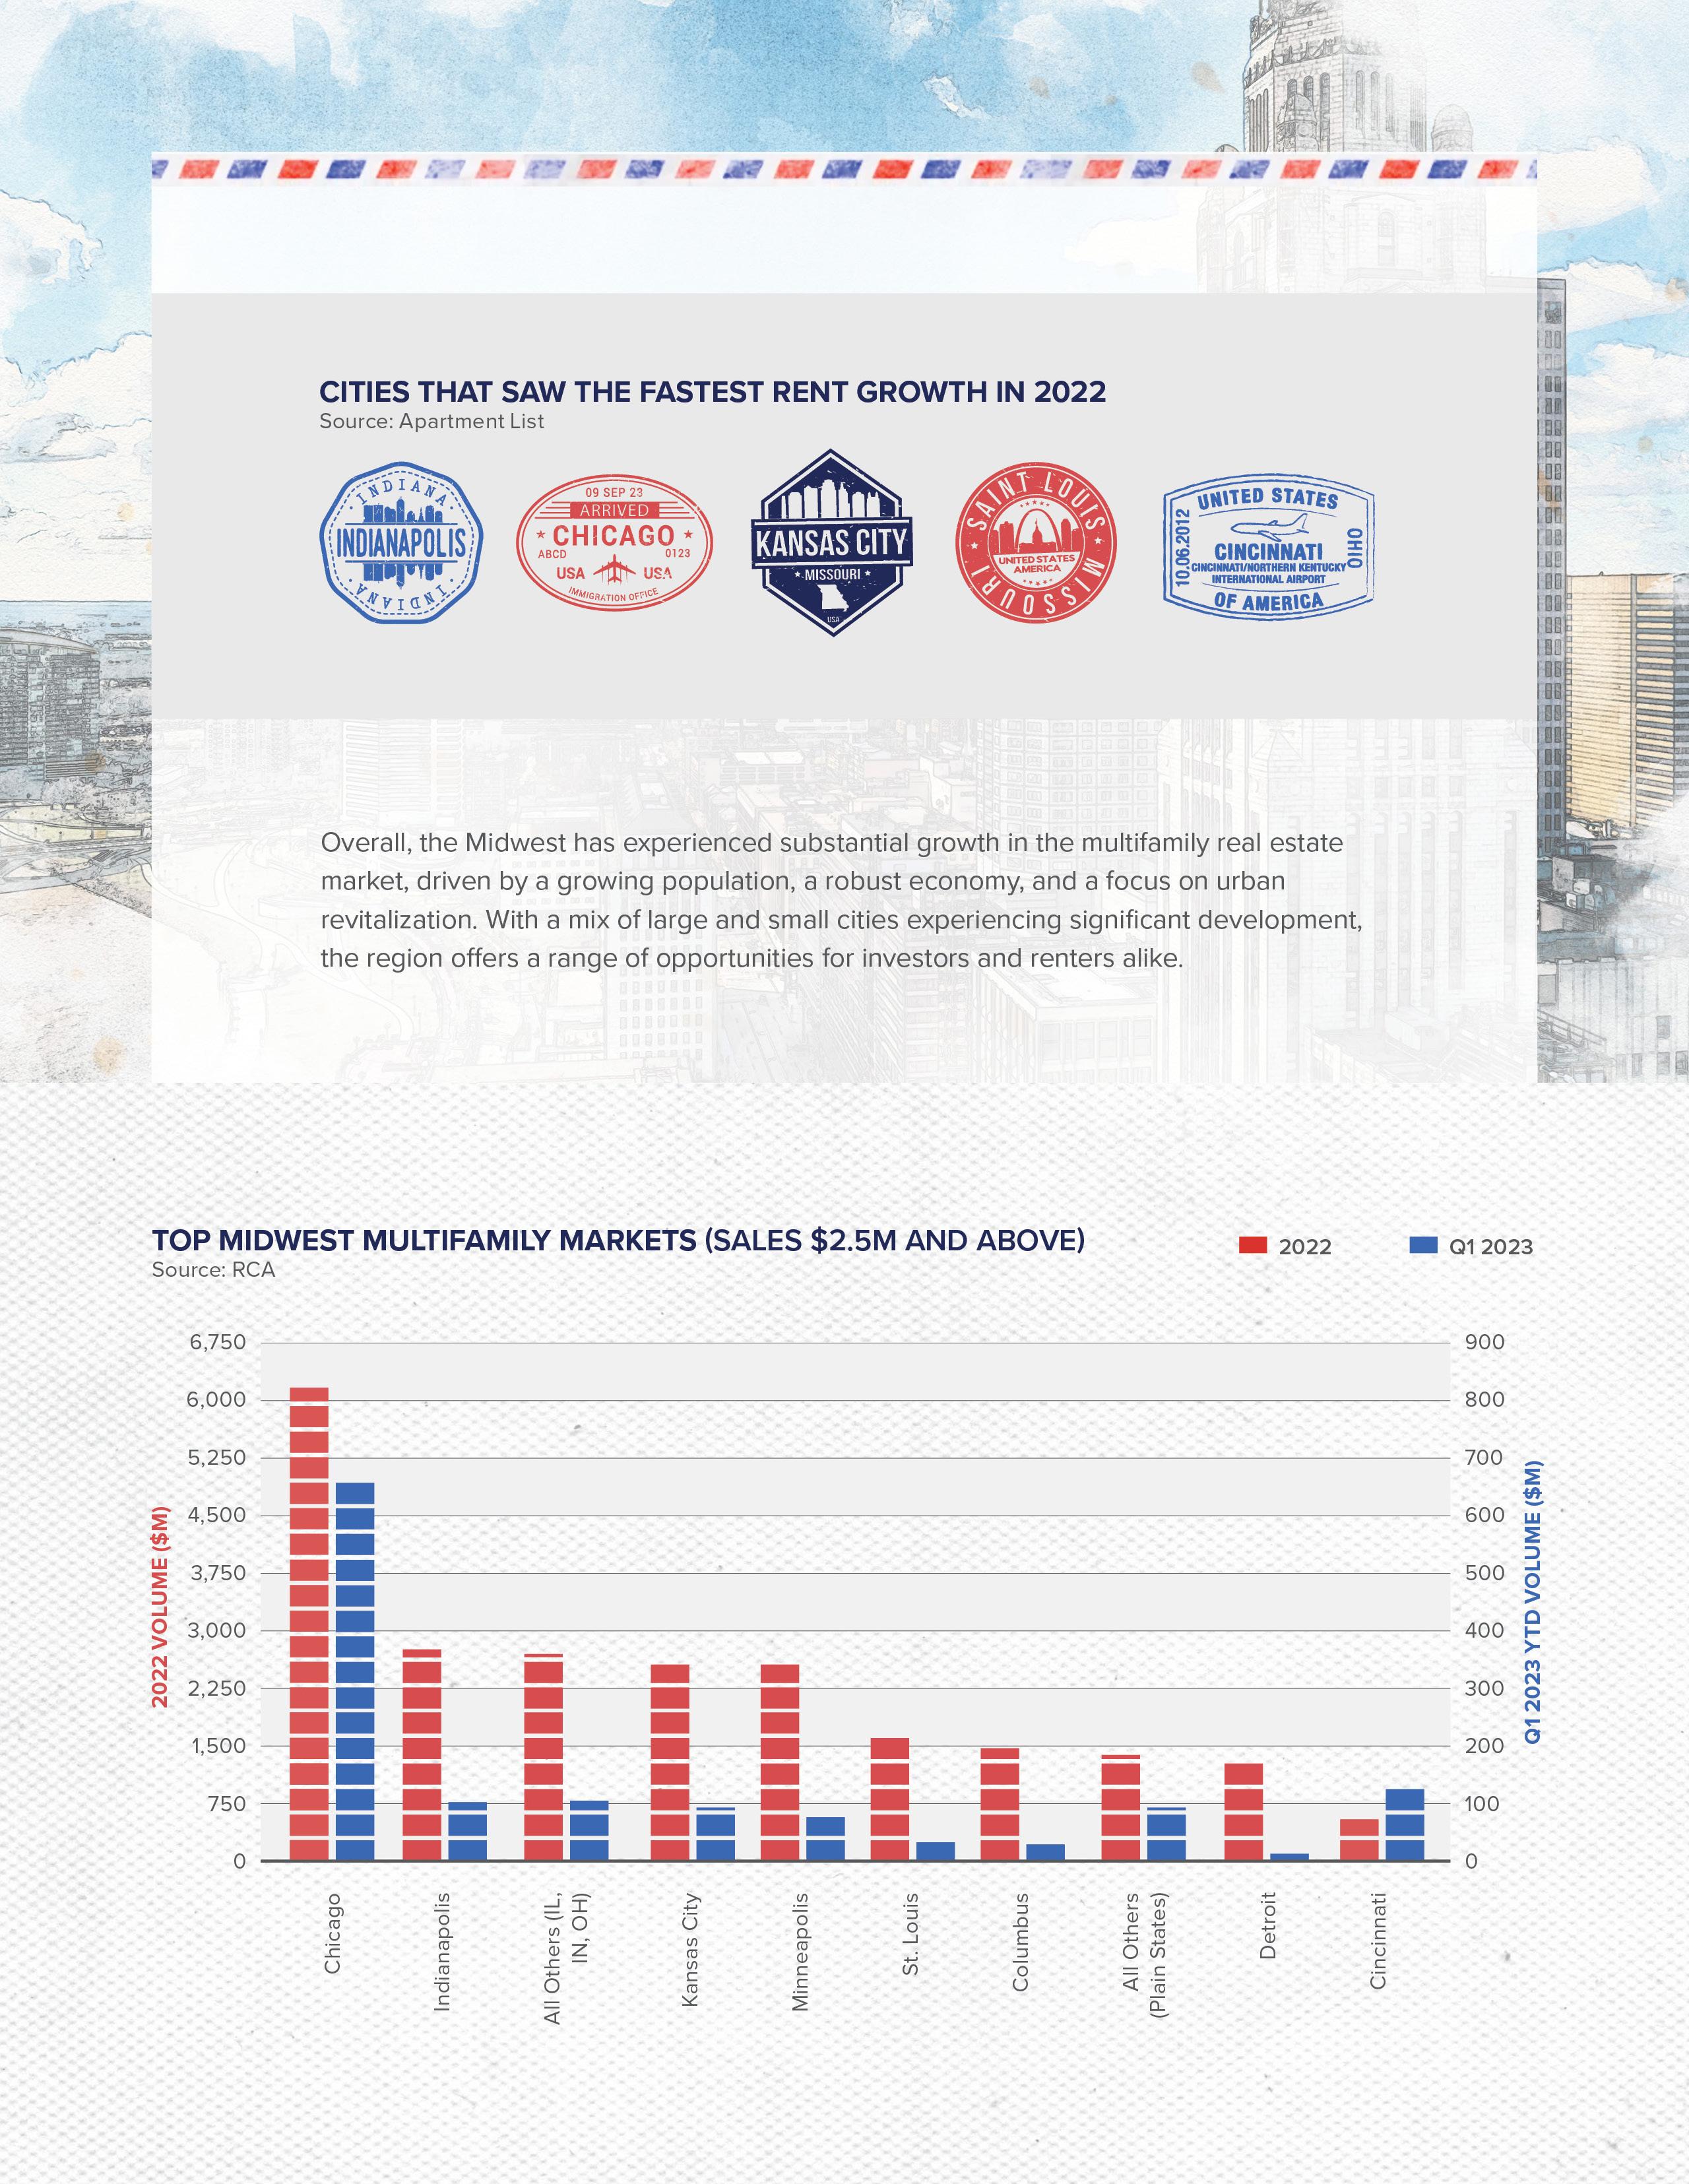
According to Apartment List, the Midwest region boasts the top three metros with the fastest yearover-year rent growth. Chicago takes the lead with a 6.3 percent increase, followed closely by Indianapolis at 6.2 percent and Cincinnati at six percent. The Sunbelt has experienced a surge in rental prices of over 30 percent in the last two and a half years, making the Midwest markets the last affordable option for renters. For coastal markets, Los Angeles is still drawing investors as it is one of the few California metros to see annual rent gains and is known for its resiliency.


Although some metros are performing well yearover-year, rent growth is moderate compared to 2021 and 2022 due to a cooldown in the rental market. For instance, no large metro has seen rental rates increase over the last six months.
FASTEST METRO-LEVEL RENT GROWTH
Source: Apartment List Rent Estimates
Rank Over Past 12 Months
Source: Apartment List Rent Estimates Rank Over Past 12 Months #1 Phoenix (-3%)
#1 Chicago (+6%)
MATTHEWS™ | 29
FOR THE FIRST TIME SINCE THE PANDEMIC’S EARLY BEGINNINGS, PROPERTY OWNERS MAY BE THE ONES COMPETING FOR RENTERS RATHER THAN THE OTHER WAY AROUND.
#3
New
#6 San
Salt
#2 Las Vegas (-3%)
Sacramento (-3%) #4
Orleans (-1%) #5 Riverside (-1%)
Francisco (-1%) #7 Detroit (0%) #8
Lake City (0%) #9 Atlanta (0%) #10 Memphis (+1%)
#2
#3
#4
#5
#6
*Among 52 CBSAs with Population > 1 Million #7
Indianapolis (+6%)
Cincinnati (+6%)
Louisville (+6%)
Boston (+6%)
Columbus (+6%)
Oklahoma City (+6%) #8 Kansas City (+6%) #9 Hartford (+5%) #10 St. Louis
(+5%)
*Among 52 CBSAs with Population > 1 Million
MAJOR DRIVERS BEHIND RENT DECREASES
The cost of rent was 10.1 percent higher in 2021 compared to 2020. In 2022, rent increased five times the pace of 2020 rent growth. Overall, the last two years of rent growth were unprecedented and not expected to last long term. Essentially, the deceleration of rents was bound to happen as the rapid growth was unsustainable.
These decreasing rents are also a result of landlords succumbing to increased vacancy rates since renters cannot afford the higher rent. Landlords are realizing that having expensive rent limits the renter pool and hurts profitability as renters are priced out of the market, increasing the number of vacant units. Other factors within the apartment industry, including increased cost of living, new supply, and demand below seasonal averages, significantly contribute to these price slowdowns.
NEW MULTIFAMILY SUPPLY
According to CoStar Group data, a record 959,000 multifamily units were under construction at the end of 2022, and projections for 2023 new deliveries are 507,000 units. In the fourth quarter of 2022, the top five most active investment multifamily markets were New York City, Atlanta, Los Angeles, Phoenix, and Washington, D.C. Each were among the top 10 in combined net deliveries in 2021 and 2022.
The new supply within the apartment sector will give renters more options, making it challenging for landlords to raise rents at the pace seen in early 2022. According to RealPage, the proportion of apartment residents who extended their leases fell to 52 percent in January, the lowest level for that month since January 2018. More and more renters are finding better options elsewhere, leading owners to head back to the drawing board.
MULTIFAMILY REMAINS A TOP INVESTMENT PICK
Multifamily continues to be a top asset type for investors, even with the fall in rent growth. With national sales volume of $197 billion from Q1 2022 to Q1 2023, trending above the historical average of $87.9 billion, the asset has proven resilient even in low-demand times. This increase in sales volume is from the record investment activity seen at the beginning of 2022. The influx of supply has weakened demand, but the need for housing will never cease. As some generations look to downsize and other generations are priced out of the housing market, demand and supply will balance.
February’s 0.3 percent hike has put an end to the five-month string of rent decreases. Nevertheless, even if demand keeps improving, the heavy development pipeline should restrain rent growth from surging. Rent growth is expected to moderate by the last two quarters of 2023. It is advised that investors look towards markets that are still seeing positive rent growth and growing populations.
DANIEL WITHERS
daniel.withers@matthews.com
(818) 923-6107
ADAM FELDMAN
adam.feldman@matthews.com
(818) 923-6112
THE MORE UNITS ADDED AND THE STRONGER THE CONSTRUCTION PIPELINE, THE SLOWER RENT WILL GROW DUE TO THE SUPPLY AND DEMAND IMBALANCE.
NATIONAL DELIVERIES & DEMOLITIONS Source: CoStar Group 160,000 100,000 140,000 120,000 ’20 ’21 ’22 ’23 Deliveries in Units 80,000 0 20,000 40,000 60,000 ’24 Forecast -20,000 Deliveries Demolished Net Deliveries 30 | SPRING/SUMMER 2023







™ WWW.MATTHEWS.COM Matthews™ is Your Resource FOR COMMERCIAL REAL ESTATE NEWS, INSIGHTS, AND UPDATES! Matthews™ Podcast To Read More
32 | SPRING/SUMMER 2023

MATTHEWS™ | 33

34 | SPRING/SUMMER 2023
MATTHEWS™ | 35

36 | SPRING/SUMMER 2023

SECURING STABILITY
WHY INVEST IN GOVERNMENT TENANTS
BY COREY SELENSKI
The U.S. government holds many hats, but for some, the government is known as a more personal entity, a tenant. Within commercial real estate lies a niche subsector — government-leased investments. These unique assets have strong credit tenancy and higher renewal rates but come with their own standards as they are directly linked to a government agency. As investors battle changes in the retail landscape and a difficult lending market, securing government tenants has gained popularity.
GSA MARKET OVERVIEW
GSA properties refer to real estate properties that are leased or owned by the U.S. General Services Administration (GSA) and used to fulfill the propertyrelated needs of various federal agencies. The GSA is responsible for managing and maintaining federal government buildings, which includes acquiring, leasing, and disposing of properties.
These government properties range from office buildings and federal prisons to warehouses and military installations. The GSA works closely with federal agencies to determine their space

requirements, leasing or purchasing properties accordingly. The agency also oversees the renovation and repair of government buildings, as well as the demolition of properties that are no longer needed.
THE GENERAL SERVICES ADMINISTRATION OWNS AND LEASES OVER 371 MILLION SQUARE FEET OF SPACE IN 8,600 BUILDINGS IN MORE THAN 2,200 COMMUNITIES NATIONWIDE.
For those buildings the GSA does not own, they rely on retail or office investors. Owners can purchase GSA-suited properties “fee simple,” meaning the land and the building is owned by the investor, but it is purchased with a government entity as the intended tenant. The GSA has leasehold rights, which results in the lease often favoring the tenant. However, because the investor is leasing to a government agency, the rent is 100 percent backed.
38 | SPRING/SUMMER 2023
WHY INVEST IN GSA TENANTS
GSA investments offer several advantages to owners that have driven the sector’s popularity over time. As retail shifts in a high operational cost environment, investors seek reliable tenants, less turnover, and higher yields.
Compared to similar single tenant net lease (STNL) assets, government-leased assets can provide yields of +500 basis points over 10 years. This is due to the steady cash flow GSA buildings incur and the strong performance of specific property types like data centers. In addition, these assets provide security and high renewal rates. GSA properties offer strong credit as the federal government backs the leases. Lenders are more likely to finance these investments in the current environment knowing the borrower will receive rent and be able to pay the loan. STNL investments aren’t as attractive as they were in previous years due to the fear their credit isn’t strong enough, making room for GSA capital. Security also comes through the tenant’s long-term leases. Experts stated that GSA-leased properties had a 14.6year lease on average due to the buildings’ purpose-built nature.


With the stability GSA real estate brings, there are also some disadvantages to being such a specialized investment. Although leases are long-term, most contracts negotiated with the GSA include an early termination clause that causes extensive underwriting obstacles. The lease renewal process is also timeconsuming compared to other NNN retail assets, as owners have to negotiate directly with government agencies, which often face delays. In addition, owners of government-leased assets need to be committed to the property management aspect of real estate investing, meaning the leases are full-service, and owners should expect to be responsible for long-term operating costs. Lastly, the U.S. government has announced several measures to consolidate and downsize its real estate footprint over the next decade in an attempt to reduce costs and environmental effects. This could cause issues for investors down the road as consolidations spur relocations and difficulties in finding replacement tenants.
GOVERNMENT AGENCIES ARE CONDUCTING
PORTFOLIO-WIDE OFFICE SPACE ANALYSES TO IDENTIFY THE MOST COST-EFFECTIVE OPPORTUNITIES — THOSE THAT BEST SUPPORT MISSION ATTAINMENT AND CUSTOMER SERVICE — TO CONSOLIDATE, DISPOSE, AND MODERNIZE THEIR PORTFOLIOS.
Source: Office of Management and Budget
MATTHEWS™ | 39
A LOOK INTO USPS INVESTMENTS

Although the United States Postal Service (USPS) is its own entity under the Executive Branch and its properties are not managed by the GSA, USPS still makes for a reliable government tenant.
The United States Postal Service has been undergoing major changes over the past few years to combat decreasing revenue predictions. In 2018, JLL took over as the real estate provider for the United States Postal Service. Previously managed by CBRE, JLL now negotiates leases on behalf of the USPS for those properties rented from private owners. The brokerage also handles the sale of postal service buildings and helps lease any unused space in USPS-owned assets. This change in providers is important for investors to note, as all lease structures, terms, and negotiations will be through the third-party brokerage on the tenant side.
During this same time, the agency rolled out new lease structures that put more responsibility on the landlord. Some major changes included lessors being made explicitly responsible for maintenance of all electrical and plumbing systems, conduit, and related “components” other than those installed by the USPS. In addition, upon lease expiration, the USPS can abandon improvements placed on the premises without the requirement of compensation to the landlord for their removal and any necessary restoration.

Another update came in 2021 when the U.S. passed Delivering for America, a 10-year plan that ensures the USPS’ financial security, streamlines operations, and invests in modern technology. A major tactic of the plan was the disbursement of $10 billion in funding to aid infrastructure and customer service and implement a new pricing authority, along with the Postal Service Reform Act. According to the American Postal Workers Union, the Postal Service Reform Act has four main goals, end the retiree health benefit pre-funding mandate, add transparency to USPS’ service issues, provide prospective Medicare integration, and guarantee six-day delivery.
Out of the four key points, the pre-fund mandate will be the biggest issue tackled. The mandate stated the postal service must pre-fund all its retirees’ health benefit liabilities 75 years ahead of time, costing $5.5 billion annually over the first 10 years. This racked up a debt of $35 billion that the USPS owed the government on unpaid portions of the liabilities, making it difficult for the postal service to put any money into upgrading infrastructure or services. After enacting the Delivering America plan, the USPS is on track to break even from 2021 to 2030. The entity was previously projected to lose $160 billion during this period.
THE
REFORM
ACT
IS
ESTIMATED TO SAVE THE USPS AT LEAST $45 BILLION OVER THE NEXT 10 YEARS.
In another attempt to modernize the USPS and reduce costs, the agency committed to implementing an electric fleet of delivery vehicles starting in 2023. Known as the Next Generation Delivery Vehicles, the USPS stated that 75 percent of its newly acquired fleet over the next five years would be electric. After 2026, all new vehicle acquisitions will be electric.
Lastly, the insurgence of e-commerce has impacted the United States Postal Service on many levels, but one that impacts landlords is its partnership with Amazon. Widely unknown, Amazon relies on the USPS for most of their “last mile” deliveries, in turn, increasing the number of incoming packages and vehicles coming on postal service property. This has caused some lessors to take steps to mitigate potential risks of non-USPS employees onsite and put policies in place to ensure operations continue without disruption.
40 | SPRING/SUMMER 2023
WHY INVEST IN USPS
USPS investments have approximately 98 percent lease renewal rates and guaranteed rent. Leases are typically structured with a five-year lease term and the option for a five-year renewal. The largest benefit of having the USPS as a long-term tenant is its specified interest in investing back into its operations and services. The entity’s ongoing commitment to securing financial security through various initiatives ensures post offices will continue to thrive in the investment sector as revenue increases, helping property values and renewal rates.
ONLY ABOUT 25% OF ALL POSTAL FACILITIES IN THE U.S. ARE OWNED BY THE UNITED STATES POSTAL SERVICE. THE REMAINING 75% ARE PRIVATELY OWNED AND LEASED TO THE USPS.


Investing in government-leased assets is a unique opportunity within the office and retail sector that provides high-level stability and occupancy. As other retail owners face the uncertainty of tenant turnover or missed payments in a volatile market, government services owners are financially backed. The specialty asset class will face some headwinds as the U.S. government looks to consolidate properties, but the efforts will also create more competition, increasing valuations.
COREY SELENSKI
corey.selenski@matthews.com (949) 945-6012
MATTHEWS™ | 41


™ WWW.MATTHEWS.COM THE INDUSTRY'S MOST COMPREHENSIVE CRE DATA SET MODERN, SIMPLIFIED, STREAMLINED UNIFIED & CENTRALIZED DEAL MANAGEMENT Matthews™ Proptech Technology Division with a. Customer-First Approach.
BY THOMAS WILKINSON & HARRISON AUERBACH
In recent years, there has been a noticeable slowdown in industrial development in several markets, while others have seen notable market growth. This growth is attributed to high industrial demand, resource availability, increased investment activity, favorable government policies, and strong demographics. Slower markets are facing the aftereffects of setbacks seen in Q4 2022, including truck tonnage and several imports declining, construction labor and material shortages, and the deceleration of e-commerce sales. However, as inflation eases, construction is anticipated to pick up again and push new developments into late 2023 and 2024.

INDUSTRIAL MARKET OVERVIEW
In 2022, 415 million square feet of industrial space was delivered. As of March 2023, 624 million square feet of new industrial supply was under construction in the U.S. and is on track to exceed completed deliveries seen in 2022, according to Costar Group. Reports conducted at the end of March 2023 state that developers in the U.S. have delivered approximately 73.4 million square feet of industrial space this year. Although a robust pipeline, the distribution is imbalanced, with major metros, especially throughout the Sunbelt region, taking on the majority of projects while others fall to the wayside.

Industrial Space Under Construction (Million Sq. Ft.)
Source: CommercialEdge
Los Angeles Cleveland Portland Bridgeport Orange County Bottom 5 Metros Dallas-Fort Worth 58.97 Top 5 Metros Inland Empire 27.67 Chicago 27.32 Houston 22.13 Phoenix 54.06 3.30 2.52 1.60 1.27 0.57 MATTHEWS™ | 43
The U.S. industrial market is expected to experience a slight downturn in Q2 2023, with net absorption slowing down in the first quarter due to caution over the economic outlook. However, there is potential for net absorption to lift in the future due to seasonality and strong retail sales.
Although U.S. industrial rent growth remains close to record highs with a 10.1 percent yearover-year increase, the quarterly gains pace has slowed in recent months. This is due to the national vacancy rate no longer decreasing as rapidly as it did in late 2021 and early 2022. Consequently, the quarterly rent growth has moderated from three percent in mid-2022 to slightly less than two percent in the first few months of 2023.
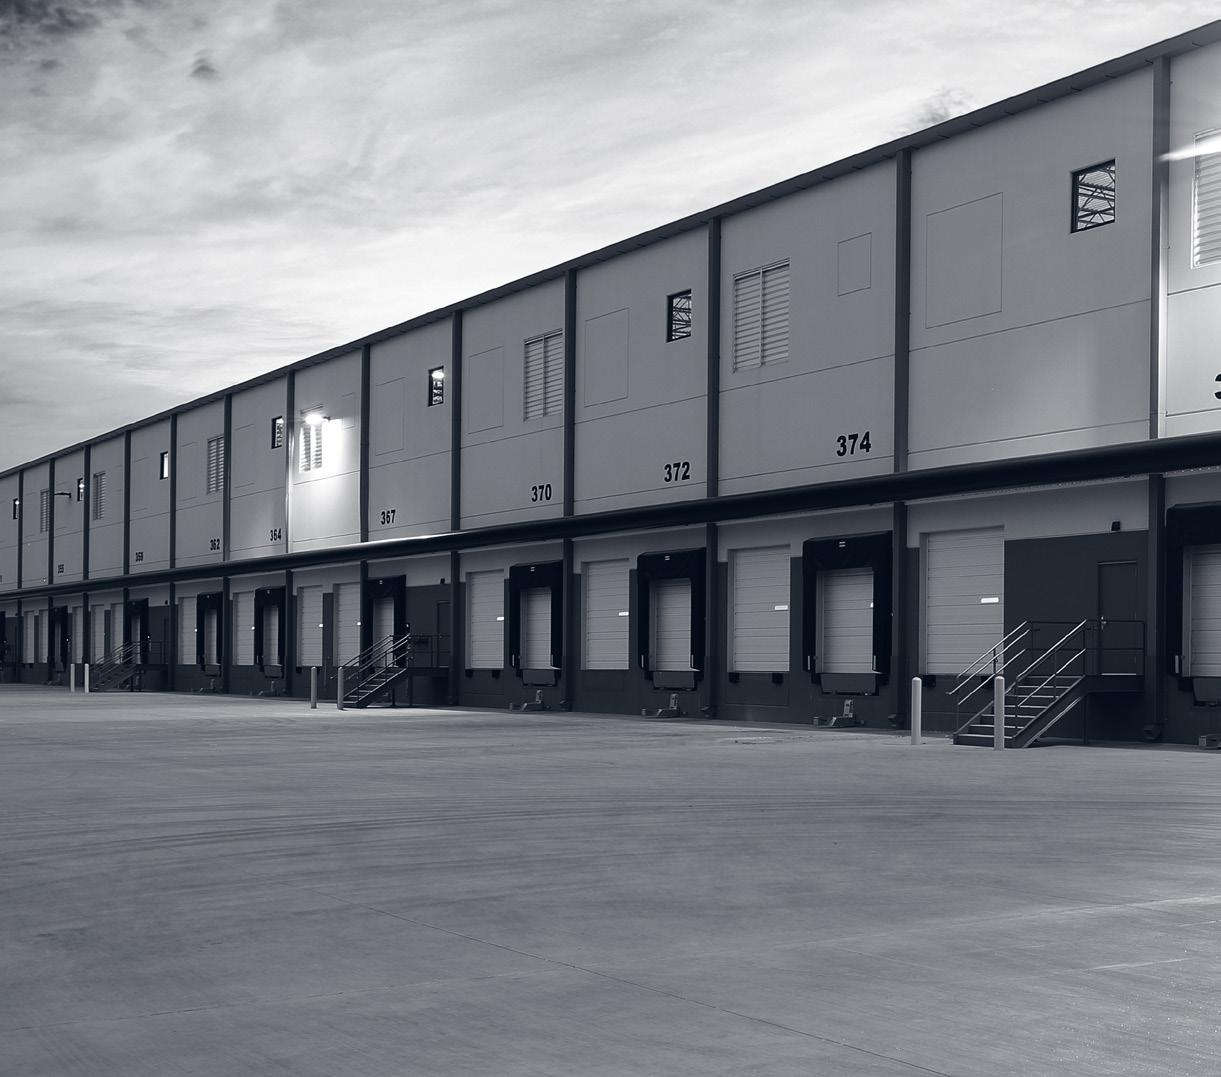
Nevertheless, the industrial market’s longerterm outlook is positive, with major metro areas picking up the slack. Rent growth is unlikely to increase in the near future, given the anticipated acceleration in new development completions for the remainder of 2023. Additionally, the opening of more than 18 electric vehicle, battery, and semiconductor plants throughout the country in 2024-2025 could generate millions of square feet of additional space for lease over that period. Increased consumer interest in EVs will continue to drive demand for manufacturing, storage, and packing facilities nationwide.
DRIVERS INFLUENCING DEVELOPMENT
One significant factor that has affected industrial development in the U.S. is the availability of natural resources. Regions with abundant natural resources, such as oil and gas reserves, have seen a surge in industrial growth. For example, states such as Texas and North Dakota have experienced rapid industrialization due to their vast oil and gas reserves.

The level of investment in infrastructure and technology is also playing a significant role in industrial development in the U.S. Regions that invest heavily in modern infrastructure, such as transportation networks, broadband, and energy systems, tend to attract more industrial development. Additionally, investments in cutting-edge technology, such as robotics and automation, can increase productivity and efficiency, making certain regions more attractive for industrial growth.
Favorable government policies, including tax incentives, regulatory streamlining, and governmentfunded research and development, can stimulate growth in specific industries and regions. Conversely, unfavorable policies, such as increased taxes and burdensome regulations, can hinder industrial growth and drive investment away from certain areas as they increase construction timelines, costing developers more money.
Regions with a growing population and a welleducated workforce tend to attract more businesses and investment, leading to higher levels of industrial growth. For example, regions such as the Pacific Northwest saw a surge in development in recent years.
44 | SPRING/SUMMER 2023
KEY TRENDS AFFECTING THE INDUSTRY
Increased Demand for Same-Day Delivery
The current-day consumer can sit on their couch, open an app on their phone, and buy a new TV for same-day delivery in under one minute. As more and more consumers purchase items for shortened delivery timelines, the demand for shallowbay centers that can complete these orders is in high demand. Shallow-bay industrial properties, primarily ranging from 50,000 to 120,000 square feet, act as both warehouse and distribution facilities, and investors’ interests are peaked. In the future, firms are expected to purchase numerous shallow-bay centers in dense metros, drifting away from traditional 300,000-square-foot fulfillment centers on the outskirts of town. Having numerous smaller, more-centralized facilities decrease timelines and allows for more imports, increasing business.
Affordability of Land
Land affordability is crucial for the development and profitability of industrial facilities in the U.S. Expensive land costs may lead to higher rental rates and hinder the industry’s growth. Conversely, affordable land enables developers to invest in more modern facilities with attractive amenities, making them more appealing to potential tenants, resulting in higher occupancy rates and profitability. Hence, developers must consider land costs carefully when selecting facility locations.
Sale-Leasebacks
In 2022, many owners utilized this strategy for industrial properties because of its stability and attractive cost. The use of a sale-leaseback has become a crucial tactic for releasing hidden value and positioning a company for future expansion. This widely used financing tool enables owner-operators to release their locked-up cash and put it to better use. The capital return is fantastic for reinvesting in the company, funding expansion and additional locations, or even paying off debt.

IN 2022, THE NUMBER OF SALE-LEASEBACK TRANSACTIONS
SURPASSED THE PREVIOUS HIGHEST LEVELS ACHIEVED IN 2019 AND 2021 BY 11%. ADDITIONALLY, THE TOTAL DOLLAR AMOUNT OF THESE TRANSACTIONS REACHED A NEW RECORD OF $31.4 BILLION.
Source: ConnectCRE

MATTHEWS™ | 45
THRIVING INDUSTRIAL MARKETS
Construction along the Sunbelt is growing exponentially, primarily in Dallas-Fort Worth (DFW) and Phoenix. DFW is currently leading the nation in development with a 59.97 million-square-foot pipeline. The DFW metro was pushed to the top of industrial markets due to the influx of logistics, e-commerce, and manufacturing firms entering the market. Amazon is also a huge contributor to the market’s growth. As a central location in the U.S., DFW has access to highway and rail networks, and top-tier airports, all of which are attractions for companies and drivers of industrial growth. Like DFW, Phoenix is a transportation hub due to its proximity to West Coast ports, a major driver for the industrial sector. Phoenix also boasts one of the largest average lot sizes compared to other cities in the U.S. According to Phoenix Business Journal, the city ranks third among U.S. cities with the most vacant land, helping developers find affordable options. A recent study by CommercialCafe also stated that Phoenix possesses 15,897 empty land plots, which amount to 53,022 acres in total. This equates to an average of 3.34 acres per plot.

Additionally, the Inland Empire is expected to grow, with net deliveries projecting 40.2 million square feet in 2023. The Inland Empire has managed to entice the largest amount of capital, making it the leading region in the country. Over one-fifth of the total industrial sales volume across the nation can be attributed to sales in this area. In Atlanta, industrial rents are rising, sitting at 7.2 percent, well over the national average of 6.9 percent. The high growth reflects Atlanta’s growing population, lack of inventory, and high demand. Along the East Coast, New Jersey recorded the second-highest sales volume among leading markets in 2022 at $149 million. The high demand for space in the Midwest can be seen in Columbus, OH, which recorded the second lowest vacancy rate nationwide at 1.7 percent.
AS OF FEBRUARY 28TH, 2023, INLAND EMPIRE HAD THE HIGHEST YEAR-OVER-YEAR SALES VOLUME IN THE ENTIRE COUNTRY, WHICH AMOUNTED TO $855 MILLION.
Source: Commercial Edge
46 | SPRING/SUMMER 2023
There are numerous regions throughout the country where the industrial market is thriving, including the Sunbelt, along the East and West coasts, and densely populated cities. Areas seeing the widest spreads include logistics hubs and port markets.
Markets with access to ports with affordable construction costs are in high demand for investors. Some regions sparking investor and large company interest include North Central Florida, North Carolina, and South Carolina. According to Commercial Search, 7.5 million square feet of industrial space were under construction in North Central Florida at the end of 2022, accounting for 16.8 percent of the total inventory. Additionally, North Carolina, specifically Charlotte, is thriving thanks to its diverse industry base, which saw a large jump in employment, rising 5.1 percent in trade and utilities in 2022. In South Carolina, industrial success can be attributed to its prime location nearby major interstates and transportation corridors, making it a desired state for hubs that transport goods.

SOME OF THE WIDEST SPREADS BETWEEN NEW LEASES AND MARKET RENT WERE IN LOS ANGELES ($7.26 MORE PER SQUARE FOOT), THE INLAND EMPIRE ($6.06), ORANGE COUNTY ($5.43), NEW JERSEY ($3.61), NASHVILLE ($3.35) AND MIAMI ($3.31).
Source: Commercial Edge
INDUSTRIAL’S FUTURE

The industrial sector continues to thrive in several markets despite supply chain disruptions and rising construction costs. Investors should expect a slowdown for the first part of the year, but deliveries and sales volume are on track to surpass 2022 numbers. Large metros that service nationwide distribution hubs will likely continue seeing development growth. Overall, industrial development is expected to overshoot demand on a national level, but not at an alarming rate.

thomas.wilkinson@matthews.com (404) 348-4945 harrison.auerbach@matthews.com (404) 445-1092 MATTHEWS™ | 47


™ WWW.MATTHEWS.COM

MATTHEWS™ | 49

50 | SPRING/SUMMER 2023

MATTHEWS™ | 51
Hospitality Success in 2023
By Mitchell Glasson, Ryan Kawai Sanchez, and Kate Dockery


Last year documented the bounce back of the decade for the hospitality sector. According to CoStar Group, 2022 ranks as the second-highest annual sales total in U.S. history, reaching $48.6 billion. The industry saw an increase in buyers, and experts predict continued demand in 2023, specifically for high-end properties that are seen as recession resistant. In addition, hospitality is receiving the green light from lenders in a tight capital market environment. Overall, the sector is experiencing its strongest Q1 start in years, and investors are intrigued.

52 | SPRING/SUMMER 2023
Demand Moves Forward


Despite high inflation, hotel demand remains strong, increasing occupancy and encouraging higher-priced room rates. The travel site Hopper reported that U.S. hotel prices averaged $212 per night in January 2023, a 54 percent increase year-over-year. This increase is likely due to the pent-up demand to travel after years of restrictions and lockdowns. Consumers don’t seem to be trimming their vacation budgets as historically seen in down markets. In fact, Q1 2023 will be the first time RevPAR will increase during a recessionary period.


In a survey of its users, Hopper found that 37% of people plan to spend more on travel in 2023 compared to 2022, while 43% of people said they plan to spend the same amount.
Although the overall hospitality market is reporting strong numbers, business hotels are struggling to gain the same momentum as leisure hotels, as remote work decreases the need for business travel. Although corporate events and group travel are increasing, the rate of recovery has been much slower than that of other hotel subsectors.
A slow development pipeline and limited deliveries also contribute to the hospitality sector’s high demand. COVID-19 weakened the already laborious and expensive timeframe for hotel construction, and now the sector is trying to play catch up. Pricey capital, fewer land sales, and expensive labor make developing large properties like hotels less appealing when other asset classes can be brought to market for much cheaper and have faster turnaround. According to CoStar Group, more than 155,000 rooms are under construction across the U.S.
HOSPITALITY
National Index YoY Change ADR $152.01 $14.15 RevPAR $91.22 $13.01
PERFORMACE Source: CoStar Group
“ “
2019 2020 2021 2022 *2023 2019 2020 2021 2022 *2023 1.29B 831.64M 1.14B 1.27B 1.30B 65.9% 43.9% 57.5% 62.7% 63.8% *Projected *Projected MATTHEWS™ | 53
HOTEL ROOM NIGHT DEMAND BY YEAR Source: CoStar Group HOTEL ROOM NIGHT OCCUPANCY BY YEAR
Source: CoStar Group
Who’s Buying?
Investors see hotels as a long-term growth option that will outweigh the near-term capital markets challenges. As other commercial real estate sectors experience cap rate compression, hotels become more attractive to buyers since they are able to reprice rooms daily, fighting the high price of inflation. This pricing flexibility isn’t seen in long-term lease assets such as offices, multifamily, industrial, and retail. So, who are hospitality’s most prominent players?
Institutional Capital
Due to the vast amount of capital needed to purchase a hospitality asset, institutional investors have dominated the space for the last five years. Although, this may change as REITs pivot strategies to account for the high-interest rate market and they most likely become more selective. VICI Properties Inc., a New York-based REIT, boasts the most transaction volume since 2018, buying over $16 billion in hospitality assets.
Private Equity
Private equity groups are becoming a well-known buyer group for the sector in recent years. These investors typically look for Class B and C properties that are underperforming or distressed with the potential for improvement, which they can acquire at a discount and then invest in to increase their value. Private equity firms may also look for hotels in attractive locations with high growth potential. Some major private equity firms buying in the sector are Blackstone Inc. and newcomer KHP Capital. Private equity firms typically hold onto their hotel investments for several years before selling them to another buyer or taking them public through an initial public offering.
What’s Next?
With increasing rates and steady demand, the hospitality sector is expected to have a highperforming 2023. As other commercial real estate property types struggle to get financing, lenders seem bullish on hotels, seeing their strong fundamentals as less risky. Consumers plan to increase or spend the same on travel and tourism in 2023, which will help hotels keep occupancy and RevPAR high. The biggest challenge facing hotels is labor shortages as help becomes increasingly difficult to find and more expensive to retain. Hotel owners must invest in their employees and guest services to succeed. High-interest rates will affect the hospitality buying pool as investors, and lenders get more selective, but increasing profit should help balance the high debt costs.
Mitchell Glasson mitchell.glasson@matthews.com (949) 432-4502 Ryan Kawai Sanchez ryan.sanchez@matthews.com (949) 287-5854 Kate Dockery kate.dockery@matthews.com (949) 873-0270 TOP BUYERS Source: CoStar Group VICI Properties Inc. Blackstone Inc. Brookfield Asset Management, Inc. MGM Resorts Host Hotels & Resorts Inc. Starwood Capital Group Gaming and Leisure Properties, Inc. Park Hotels & Resorts KSL Capital Partners Realty Income Corporation $0 $4B $8B $12B $16B 54 | SPRING/SUMMER 2023


\ ™ WWW.MATTHEWS.COM forward TOOLS THAT MOVE YOUR BUSINESS See Matthews™ Career Opportunities SHARED SERVICES PLATFORM • AGENT-FIRST INNOVATIVE TECHNOLOGY • INDUSTRY-LEADING DATA • CULTURE OF EXCELLENCE
56 | SPRING/SUMMER 2023

MATTHEWS™ | 57
58 | SPRING/SUMMER 2023
MATTHEWS™ | 59

60 | SPRING/SUMMER 2023

MATTHEWS™ | 61

62 | SPRING/SUMMER 2023
THE MATTHEWS™ 1031 EXCHANGE
Private Client Advantage Program

A step-by-step process that replaces the unknown in your exchange with the confidence that your up-leg will directly improve your investment position.
Customize a strategy TO MEET YOUR SPECIFIC FINANCIAL GOALS

Create a plan TO GET THE MOST OUT OF YOUR EXCHANGE
Improve your position THROUGH ADJUSTING DOWNTIME IN CASH FLOW
™ WWW.MATTHEWS.COM
INCREASING Property Value
OF SELF-STORAGE FACILITIES
• By Hunter Reynolds & Austin McLeod •
Consumers are seeking convenience over everything else. This evolving consumer preference has caused a dramatic shift in customer-driven operations nationwide. In particular, the selfstorage sector has seen an influx of operation adaptation as the industry works to meet consumers’ needs. Although the industry has experienced record transaction activity and consumer demand since 2021, the sector is in a time of renewal, no longer riding on the coattails of past years' success. But in an unsettled economy, how can owners increase value without increasing operating costs?
Self-Storage Demand
An owner's goal is to enhance the customer experience while increasing their bottom line. One way to do this is by introducing more technology into the business, like self-service kiosks, mobile apps, and touchless payments. The market for self-serve technology is predicted to grow significantly, particularly within self-storage.
SEASONALITY
Typically, the busiest part of the year for self-storage – also known as “leasing season” begins around April or May and ends in September or October. Last year, landlords nationwide noticed a downward trajectory in occupancy beginning in mid-September, leading owners to believe that seasonality had once again returned to the space, as opposed to the year-round trend seen in 2021 and the first half of 2022. While the COVID-19 pandemic drove self-storage demand to new highs by increasing factors such as displacement, home remodels, migration, home/office downsizing, and retirement, these factors continue to fuel consistent demand now, but at a lesser scale.
By The Numbers
Source: Storage Cafe
1.7B+ SF of U.S. self-storage space
38M+ SF delivered in 2022
52.6M SF expected to be delivered in 2023
1 Out of 9 Americans use self-storage
As the market shifts due to rising interest rates and inflation, service-based businesses that are nonnecessity services, such as self-storage, will need to find innovative ways to keep customers coming back and increase their property values.

64 | SPRING/SUMMER 2023
Valuations: What to Watch
Understanding the economic drivers that affect a property's valuation is critical. By knowing the drivers of value, owners can strategize which operational changes will positively impact cash flow and provide the highest yields long term. The market fundamentals listed below all influence the short and long-term profitability of a selfstorage investment and should be carefully considered when executing initiatives.
POPULATION GROWTH
INCREASED DEMAND: As the population continues to expand, there may be greater demand for self-storage facilities nationwide. A larger population increases the need for storage as the potential customer base widens. This is a main reason the Sunbelt states have seen significant rent growth and property appreciation in recent years.
LOCATION: As the population grows, residents are pushed to surrounding communities where new residential and commercial developments are built. Existing facilities in these areas may see increased demand, while new facilities may be built to meet this demand.
DEMOGRAPHIC TRENDS
AGE OF POPULATION: As older individuals downsize their living, the need for self-storage services rises. Also, Gen Z and millennials that opt to rent an apartment versus buying a home often times need additional storage space.
INCOME LEVELS: Income levels can impact rental rates that are able to be charged. Typically, more affluent populations can afford higher rents per square foot, leading to higher valuations in more affluent areas. Additionally, high-income areas have greater demand for premium or specialized services like boat and RV storage.
ENVIRONMENTAL CONCERNS: As more consumers become environmentally conscious, demand for eco-friendly self-storage facilities that
use less energy through Solar Panels or other avenues can increase value. Although the upfront cost of sustainable products can be high, the long-term value is typically beneficial. Oftentimes, there are also significant tax advantages for owners that implement solar panels on their facilities.
LIFESTYLE CHANGES: A trend towards minimalism and decluttering for some generations may increase the demand for selfstorage services. On the other side, Gen Z consumers prefer a maximalist lifestyle, which also pushes the need for storage.

SUPPLY STATISTICS
MARKET SATURATION: If the market is saturated with self-storage facilities, it may become increasingly difficult for existing facilities to compete with newer or better-equipped facilities. As a result, existing rental and occupancy rates may decline, ultimately leading to a lower valuation.
NEW SUPPLY: New supply being delivered in a market can sometimes oversaturate a trade area, oftentimes putting downward pressure on rental rates and occupancy across a three of fivemile trade area. If new facilities are introduced rapidly, they may capture a significant portion of the demand due to offering significant discounts or concessions, thus impacting existing facilities' rental and occupancy rates.
QUALITY: Facilities that are well-maintained, modern, and offer a range of amenities may command higher rental and occupancy rates, ultimately leading to a higher valuation.
MATTHEWS™ | 65
Reducing Operational Costs While Boosting Profit
Automating and converting to an entire self-serve operation is one of the most popular ways to reduce costs within self-storage facilities. A major reason is that automation eliminates the need for human labor and thus reduces the associated costs such as wages, benefits, and training. Additionally, selfservice operations can reduce errors and improve efficiency, in some cases, saving time and resources.
Automation can increase efficiency by allowing customers to complete tasks without staff assistance, reduce wait times, and improve service speed. This type of system can also provide customers with a more personalized experience by allowing them to customize their interactions with a business. Lastly, self-service options can be available 24/7, making it more convenient for customers to interact with a business outside of traditional business hours.
EXAMPLE OF HOW BUSINESSES SUCCESSFULLY CONVERT SELF-STORAGE FACILITIES:
Owners can invest in security cameras and lock technology, allowing customers to access their units through an app on their phones. New customers can also rent units through a kiosk on-site or even through an app, allowing this to be done completely remotely for the owner of the facility. This will reduce labor costs and attract a younger generation of customers.
These facilities can employ a range of additional strategies to increase profitability. One approach is implementing energy-efficient technology, such as LED lighting and energy-saving equipment, which can reduce utility costs and lower expenses. Using drought-tolerant landscaping and rainwater harvesting systems for storage facilities can reduce
costs. Regular maintenance and repair of equipment and facilities can also extend their lifespan, reducing the need for costly replacements.
On the other hand, marketing strategies can help to attract and retain customers, such as promotions, loyalty programs, and targeted advertising.
Overall, self-storage facilities have multiple ways to improve profitability. Implementing a combination of these strategies can help them stay competitive and meet the evolving needs of the market and their customers.
Investment opportunities in today's market, particularly in markets with positive population and job growth, are attractive for self-storage facilities. The move to self-service-based business models is only expected to grow as consumers continue to choose convenience over all else. With the increasing demand for these services, developers and investors can benefit from implementing strategies that reduce operational costs, boost profits, and cater to customers' evolving needs. By implementing these strategies, owners can keep their technology up to date, reduce operating expenses, and drive their assets up in value.
Hunter Reynolds hunter.reynolds@matthews.com (404) 380-1196 Austin McLeod austin.mcleod@matthews.com (404) 445-1093 66 | SPRING/SUMMER 2023
FULL-SERVICE REAL ESTATE SOLUTIONS
Centralized client services that foster personalization and collaboration for all our clients.

A CAPITAL MARKETS OVERVIEW
BY CLARK FINNEY
After years of low rates and liquidity, the capital markets sector has entered a constricted lending environment. The rapid increase in the funds rate adjusted the cost and availability of capital as banks tightened their lending standards. In March 2023, major banks declared bankruptcy, with some experts predicting the collapse would cause the Fed to pull back; others insist the Fed will continue increases as previously stated. With so many fluctuating fundamentals and unknown outcomes, how should investors navigate the changing market, and what opportunities lie beneath the surface?
GOING THROUGH THE CYCLE
Since the 2008 financial crisis, commercial real estate activity has undergone a number of changes and fluctuations, cycling through the real estate phases seen throughout history — recession, hyper supply, expansion, and recovery.

In the immediate aftermath of the crisis, commercial real estate markets experienced significant property value declines and a sharp reduction in investment activity due to a lack of available financing and liquidity.
However, in the years that followed, the commercial real estate market began to recover, driven in part by lower interest rates to stimulate the economy, which yielded strong economic growth, and increased demand for supply. Investment activity in the commercial real estate market rebounded by 2014, with record levels of capital flowing into the market from both domestic and foreign investors. Commercial real estate expansion also led to increased property values, with many markets seeing significant appreciation in property prices. Between 2014 and 2020, the U.S. was experiencing recovery; it was organic and fundamental — then COVID-19 happened.
YOY Change of U.S. CRE Prices
Source: International Monetary Fund
20% 10% 0% -10% -20% -30% ’06 ’07 ’08 ’09 ’10 ’11 ’12 ’13 ’14 ’15 Recession THE
68 | SPRING/SUMMER 2023
Despite the initial 90 days of lockdown in 2020, which put billions of dollars of transaction pipelines on hold, the U.S. economy's reaction of cutting rates to zero seemed to be a pragmatic and rational response to inflating the economy while it was in a state of literal lockdown. The lower rates allowed for transaction activity to continue despite higher credit spreads that were attributable to the risk of investing in an uncertain real estate market. The market did not expect these low-rate indexes to catalyze a mass migration of investor funds out of equity markets that were hit hard during the lockdown into more tangible investments like commercial real estate. Almost overnight, it appeared that professionals who had created wealth by investing their salaries into equity markets since 2008 almost cashed out their portfolios and became commercial real estate experts. The novice yet extremely active and motivated investors pooled funds and knowledge together to form groups that turned into national networks.
THE SHIFT OF CAPITAL MARKETS
The syndication model is a vital component of the current price correction experienced throughout the market today. Years of low rates, paired with pooled investor capital and $5 billion of treasury funds injected into the general population, allowed for a prolonged period of higher leverage, lower costs of debt, and the ability to grow and achieve higher rents in 2021, and early 2022. In turn, cap rates compressed, and property values increased. Between Q3 2020 and Q2 2022, nearly 50 percent of the nation's commercial real estate assets traded hands, and many of those assets exchanged hands more than once, sometimes three or four times in six quarters.
Syndicators were not the only ones staying active in this market. Naturally, other players, even institutions, saw dramatic equity increases in their property values as cap rates seemed to compress by 25 basis points every six months as the cost of funds could be as low as 2.50 percent. At some point, the music had to stop, although clearly, nobody wanted to admit it. Over the last two years, many investors' lives changed forever, and syndicator models established themselves as respected professional networks rather than think-tank forums.
This mass of active investment liquidity, paired with the lowest rate environment witnessed in the U.S. in nearly a decade synthesized the modernday syndication model investors are familiar with.
150% 100% 50% 0% -50% -100% 2018 2020 2022 2017 2019 2021 Transaction Volume YOY Change Source: RCA MATTHEWS™ | 69
THE NEXT PHASE
Welcome to the Summer of 2022! In reaction to inflation soaring up to over nine percent, a rate not seen in decades and admittedly fueled primarily by the surge in housing costs – the Federal Government moved to increase rates over time and manipulate the market to stop it in its tracks aggressively. The question now is, has this been successful? Did the Federal Reserve step up to save the American economy from its greed and ultimately create an unfixable bubble, or did it attempt to muffle a white-hot U.S. economy and potentially a new golden era of the United States? It’s unfortunate that the definition of inflation is integral to raising property values, which increases the cost of capital and creates downward pressure on rent growth, all of which is occurring in today’s market.
Net Percentage of Lenders Tightening Standards
Federal Reserve Senior Loan Officer Opinion Survey on Bank Lending Practices 2015 2016 2017 2018 2019 2020 2021 2022 ■ Construction ■ Commercial ■ Apartment 80% 90% 60% 70% 40% 50% 20% 10% 30% 0% -20% -10% -30% Annual
in U.S. Commercial
Source: RCA 25% 20% 15% 10% 5% 0% -5% 2018 2019 2020 2021 2022
Source:
% Change
Property Pricing
70 | SPRING/SUMMER 2023
The recent economic activity is pressuring people to compare today’s market to the 2008 housing bubble, but no bubble has been found. The U.S. is in a housing undersupply period met by the high demand of an increased population. The increased values witnessed seem to be in perfect flux with the laws of supply and demand.

DESPITE THIS, THE U.S. ECONOMY HAS INCREASED THE FEDERAL FUNDS RATE BY 525 BASIS POINTS SINCE MARCH 2022.
MARKET FAST FACTS
According to Yardi Matrix, 2022 U.S. MULTIFAMILY SALES TOTALED $187 BILLION, down 16.1% from $222.9 billion in record-setting 2021. Despite the decrease, 2022's transaction volume was the second-highest annual total ever.
VALUE CORRECTION TYPICALLY TAKES ~9 MONTHS (3 QUARTERS) TO BE FULLY REALIZED BY MARKET (FED) MOVEMENTS.
The Fed began aggressive rate increases in (+75bps) June 2022; +9 months would be March of 2023. Based on recent commentary, there is still wood to chop here, and THIS CORRECTION COULD TAKE A FULL CALENDAR YEAR.
Sales activity became more difficult as 2022 unfolded, and the Federal Reserve pushed short-term interest rates up by 400 basis points, including an UNPRECEDENTED FOUR STRAIGHT MONTHS OF 75-BASIS-POINT INCREASES.
The Fed's actions produced a sharp rise in commercial mortgage rates, which significantly impacted pricing.
Investor demand was so strong that the market was on pace for another record year before the capital markets disruption.
SALES VOLUME FOR THE FIRST HALF OF 2022 WAS 60.4% ABOVE THE FIRST HALF OF 2021.
Rising mortgage rates—which have increased since Q1 2022 by roughly 200 basis points for fixed-rate loans and more than 400 basis points for floaters—have led to an increase in capitalization rates, which has pushed property values down by 15-25%.
THE PRICING UNCERTAINTY HAS CREATED A LARGE BID-ASK SPREAD BETWEEN BUYERS AND SELLERS.
MATTHEWS™ | 71
HOW TO NAVIGATE 2023
The facts shown state the market is experiencing more of an inconvenient grounding than a longstanding depression. 2023 is expected to be a successful year if the Fed discontinues rapid increases at the correct time.
Many investors withdrew deposit funds to invest and used loans as a vehicle to execute; many bank lenders are in a period where they cannot originate as much as preferred.
● FOLLOW THE CAPITAL.
Advice
from a Capital Markets Expert CLARK
FINNEY
● STICK WITH WHAT YOU KNOW.
Invest in the markets and relationships you know and have confidence in. While working with a neighborhood and legacy lender is preferred, many banks are in a liquidity crunch. Their required ratios of deposits/loans outstanding are currently upside down due to the roaring activity in the last two years.
Lender Compostition Source: RCA
What are the major institutional investment funds doing? Where are they investing? How are they investing? What financing products are they using to invest? For example, many groups that used bridge financing to acquire value-add assets are now straying away from floating rate products citing the increased costs of cap rate purchases. Instead, they are structuring the capital stack with a blended rate of fixed agency and mezzanine financing to solve for cheaper and safer leverage.
CMBS Investor-Driven Private/Other Gov't Agency Insurance Int'l Bank Nat'l Bank Reg'l/Local Bank Industrial Retail Hotel Apartment Snr Housing PROPERTY TYPES Office 10% 14% 19% 17% 14% 13% 10% 17% 23% 38% 12% 13% 15% 11% 14% 21% 12% 17% 12% 31% 37% 32% 19% 46% 11% 18% 30% Secondary Tertiary MARKET TIER Major Metros 10% 14% 13% 12% 24% 20% 12% 12% 35% 23% 10% 15% 17% 30% 2021 2015-19 Avg 2022 BY YEAR 13% 17% 13% 20% 18% 19% 23% 20% 10% 11% 16% 17% 12% 15% 27% 72 | SPRING/SUMMER 2023
● KEEP NEGATIVE LEVERAGE AND ITS EFFECT ON YOUR RETURNS IN CHECK. Negative leverage is the relationship between your cost of capital and purchase cap rate. This ratio is integral to quickly assess investment opportunities and find yield in a higher interest rate environment. You want your purchase cap rate to be higher than your interest, based on the fact that your purchase cap rate is often a way to determine the return of your investment.
● STAY ACTIVE AND UNDERSTAND THAT TIME KILLS DEALS IN A VOLATILE ENVIRONMENT.
Be cognizant of your rate lock expirations and the spread risk during a closing process. The market movement within a few days could add 50+ basis points to your rate, even affecting your final proceeds. Do not wait and stay idle once you are under application.
● KEEP THE FOCUS ON THE SMALL ITEMS BEFORE THEY BECOME LARGE PROBLEMS. Is the American Land Title Association survey current and approved by the title? Have you engaged your insurance broker to begin their respective quoting process? Have you created your LLC yet? Does the lender/title require a zoning report? If engaged too late in the process, all of these items can take up to two to three weeks to deliver and could potentially delay your transaction and provide problems.
● FOCUS ON KEY DATES FOR ECONOMIC REPORTS AND MEETINGS. They will have a dynamic effect on the market, and they could have an impact on your real estate investment.
In all, the economy's foundation is looking strong, despite the current recessionary period. Prices are receiving pressure based on the increased cost of capital rather than an oversaturation of supply paired with a lack of demand. Yes, rents and the prospect of rent growth face downward pressure, but market vacancies are still stabilized in significant markets. Lender rates will continue to increase through the majority of 2023. During this time, many investors create generational wealth even with a higher cost of capital. This wealth was created by understanding that some capital events are short-term solutions to long-term investments and acquiring assets in solid markets at a competitive cost basis.

Clark Finney clark.finney@matthews.com (214) 530-5496 MATTHEWS™ | 73
Mom-and-Pop Top Leasing Trends to Watch
By Catherine Lueckel
Mom-and-pop retailers are community favorites, establishing deep customer connections and personalized shopping experiences. Often familyowned, small businesses can range from drugstores and restaurants to auto shops, grocers, and specialty offerings. Unlike large national chains, mom-andpop owners rely on their store performance as their primary source of income, making them especially vulnerable during economic downturns. COVID-19 introduced billions in aid to small businesses, but now, post-pandemic, business owners face additional challenges with high inflation and rising interest rates. To increase profits, mom-and-pop owners seek specific storefronts and carefully consider their leases.
The Appeal of Mom-and-Pop Stores
Although small in scale, mom-and-pop shops attract a solid and loyal customer base due to the store’s community focus and specialized services and products. Customers also receive more personalized service at mom-and-pops, as small business employees are able to engage with clients compared to the one-size-fits-all service encouraged in large chains. As small businesses continue curating personalized retail services at independent locations, customers will return.
 There are 33.2 million small businesses in the U.S., which account for 99.9% of all U.S. businesses.
74 | SPRING/SUMMER 2023
Source: Small Business Association
40% of millennials are in support of helping local businesses thrive, and 75% of people say they prefer to do business with stores that have already patronized and are satisfied with.
Source: First Union Lending
Mom-and-pop stores appeal to strip and neighborhood retail centers as they increase occupancy of smaller spaces and can complement the center’s anchor stores. While anchors draw customers to the centers, landlords seek small businesses as in-line tenants to provide higher yields. These tenants benefit from the traffic, and landlords increase the property’s occupancy and customer offerings.
Anchor tenants can positively impact mom-and-pop shops by helping them establish credibility and increase foot traffic.

What Mom-and-Pop Tenants Want
Profit margins are narrow in a small business, meaning negotiating strong lease terms is critical. The lease term agreement for mom-and-pop tenants varies based on the property’s location, business type, and area demographics. The economic climate and shifting market fundamentals also greatly impact owners’ preferred rent structures and willingness to negotiate, meaning mom-and-pop tenants may need to look longer for the right space, landlord, and lease combination.
Sustainable Rent Rates
Small businesses do not have the luxury of large amounts of indispensable income. Mom-andpop business owners must utilize their cash flow efficiently and ensure payments fit their budgets. This is especially true for rental rates. While small businesses typically require less square footage, approximately 800 to 1,500 square feet, the limited square footage won’t offset the rent if the rental rate is out of budget. As of Q1 2023, the average rate per
square foot for retail space is approximately $24, expected to increase by 3.3 percent throughout 2023. However, mom-and-pop owners typically pay slightly below the market rate. Small business owners need to ensure the rate they receive is sustainable long-term. If the mom-and-pop is a restaurant or food-based service, the rent should be at most six percent of sales. For non-food-based businesses, rent should be at most 10 percent of sales.
Another way mom-and-pop businesses can find more affordable rent is by looking to lease in secondary or tertiary markets. Major markets will experience rent growth faster than secondary markets, making it difficult for mom-and-pop shops to keep up with rent prices.
Rent Concessions
Tenants who are on the fence about renewing their lease often leverage rent concessions. Rent concessions offered by landlords include a discount or an adjustment to rent, renovations, or free utilities. Concessions can incentivize tenants to extend their stay. Typically, with mom-and-pops, the incentive to renew their lease comes in the form of free rent periods. If the tenant agrees to extend the lease for five years, the landlord may offer one to three months of free rent or agree to a smaller rental increase (typically 10 to 12 percent) to encourage renewals.
Rent concessions can also be made if the lease includes a co-tenancy clause. This clause, popular in mom-and-pop leases with an anchor tenant nearby, allows the secondary tenant to have a level of reprieve if the anchor tenant leaves the retail center.
MATTHEWS™ | 75
Reliable Landlord
Having a landlord who is organized, responsive, and transparent is key for mom-and-pop tenants. Since mom-andpops are subject to unique difficulties, financial or otherwise, it is crucial for tenants to have landlords that are willing to be flexible. It may help for tenants to look for landlords with ties to the community rather than institutional investors, as local investors can be more empathetic to small businesses.
Desired Location and Space
As a result of mom-and-pop’s lack of notoriety, they require locations with established high-foot traffic to bring in customers. Often, mom-and-pop owners prefer in-line spaces in community or neighborhood centers anchored by grocers, department stores, or essential retailers catering to a large audience. In-line retail spaces can charge more per square foot if the space is in a premium position, like an end-cap, or close to large retailers.
Securing a Lease as a Mom-and-Pop
When looking for the right tenant, landlords seek stability, experience, strong business initiatives, and a good financial background. As a small business, it’s important to provide the right credentials and present the benefits of having the shop as a tenant to potential landlords.

Personal Guarantee
Due to small businesses having greater risk, landlords prefer a personal guarantee from momand-pop owners. A personal guarantee allows the landlord rent security if the business occupying their space defaults. A small business should guarantee the entire lease term; however, it is possible to get a “floating guarantee,” so the tenant isn’t responsible for more than that term (I.e., floating two-year guarantee).
Complementing Tenants
It’s important for landlords to research area demographics and current consumer trends before signing a tenant. Small businesses need to showcase that their products or services are curated to the

community and bring a fresh customer base. In addition, landlords want to ensure their smaller tenants complement the anchors. For example, suppose a local juice bar owner is looking to sign at a retail center anchored by Whole Foods. In that case, the owner should explain how their business complements the center’s established healthconscious customer base.
Clear Vision
Property owners look for tenants with well-thoughtout business plans, including where the money is coming from. Mom-and-pops need to produce a marketing strategy, a detailed description of labor and supply costs, committed employees, and a clear plan for bringing in revenue.
76 | SPRING/SUMMER 2023
How Mom-and-Pops are Navigating a Difficult Market
During a shifting market, small business owners must focus on some key operational areas to ensure stable net income.
First, businesses must keep accurate sales, inventory, and client data. Trackable measures such as busiest transaction times, product stock, and more help keep the business on track and make it easier to assess what budgets can be cut and/or stretched in economic downturns.
In addition, working with an experienced small business broker can be a lifesaver for small businesses in a volatile market. Collaborating with a a specialized broker helps mom-and-pop business owners negotiate the best possible lease terms to achieve the greatest financial outcome. A broker who has worked with small businesses understands the nuances and obstacles that mom-and-pops run into, making them well-equipped to navigate a transaction.
Future for Mom-and-Pop Businesses

Mom-and-pop businesses are making a comeback from the pandemic, thanks to consumers’ prioritization of supporting small businesses, forming personal relationships, and having access to one-ofa-kind product selection. Mom-and-pops thrive on maintaining a loyal customer base built from success in popular locations, like strip malls or shopping centers in local neighborhoods.
Catherine Lueckel
(216) 503-3596 MATTHEWS™ | 77
catherine.lueckel@matthews.com
MATTHEWS™ RETAIL LEASING LANDLORD REPRESENTATION


With intimate knowledge of current retail market trends and deep-rooted connections in the industry, Matthews™ is positioned to maximize the value of your property by:
Creating a synergistic and complementing tenant mix
Effectively positioning your property in the marketplace through strategic negotiations
Repositioning an underperforming asset or portfolio
MATTHEWS™ RETAIL LEASING TENANT REPRESENTATION


We currently represent and assist local businesses, regional franchises, and national corporate tenants in identifying, negotiating, and securing lease locations.

FEATURED TENANTS

Every tenant deserves customized real estate representation. Regardless of size or location, Matthews™ is here to help!

The Future of Medtail
Trends Transforming Healthcare
 By Jacob Friedman

The U.S. has the world's largest healthcare industry, and the sector's strength attracts significant market players. With an aging population and the everincreasing need for accessible healthcare, the industry will only expand. Additionally, the demand for ambulatory centers, cosmetic surgery complexes, freestanding medical office buildings (MOBs), urgent cares, and other unique healthcare facilities are increasing nationwide, making the healthcare industry one of the strongest commercial real estate asset classes to invest in.
How the Healthcare Industry is Evolving
The changes impacting the healthcare sector cannot be overstated. The demand for healthcare real estate is anticipated to increase tremendously in the upcoming years due to improvements in medical technology and changing healthcare policies.
As healthcare providers look for new ways to improve patient care and reduce costs, the real estate industry is poised to play a critical role in meeting their needs.
The healthcare industry is becoming more consumer-centric and shifting from hospital campuses to specialized medical office facilities. Examples include adding specialty clinics, medical office buildings, urgent cares, and ambulatory centers into neighborhood locations to improve patient accessibility, increase outpatient surgeries, and lower healthcare costs. These modern spaces attract new clientele and drive up business.
"Medtail" is a growing nationwide trend where healthcare services are offered in retail settings. This trend is a result of healthcare tenants shifting away from large hospitals and standalone buildings to provide services that cannot be offered online.
80 | SPRING/SUMMER 2023
MOBs Movement in the CRE Space
MOBs have been strong performers in healthcare real estate for the past few years, and the trend continues. MOBs are typically multi-tenant properties that house medical practices, clinics, and other healthcare-related businesses intended to improve patient outcomes and enhance the patient experience. As the population ages, the need for MOBs increases; consumers are more healthconscious than ever before, contributing to demand. Investors are increasingly turning to medical office buildings as a stable alternative to suburban office holdings. MOBs boast record high rents, strong deal flow, and demand outpacing supply amid tight vacancy and stable cap rates.
According to Yardi Matrix data, the U.S. now has 1.9 billion square feet of medical office space, 17.6 million square feet under construction, 19.7 million square feet planned, and another 65.6 million square feet are in the prospective phase.

Investors are drawn to the sector mainly because of substantial macroeconomic headwinds, including an aging boomer population and the overwhelming need to provide most healthcare services in person at a physical site. Medical office buildings typically involve long-term leases, less turnover between leases, high occupancy, and better below-theline capital expenditure performance. Medical professionals are also among the most creditworthy tenants, creating a more durable income stream and a significantly lower risk profile. Despite economic headwinds, MOBs are viewed as a recession-proof or recession-resistant asset class. Healthcare real estate transaction volume slowed in the latter half of 2022 due to rising borrowing costs and mounting economic uncertainty. Rising interest rates were the most significant concern facing the MOB investment landscape, with large domestic banks slowing lending activity.
Experts predict a promising outlook for healthcare in 2023 with increased absorption and low vacancy rates. The medical office sector has compelling investment qualities that will keep investors returning, namely its longterm leases and stable tenants.

TOP 10 MARKETS BY MEDICAL OFFICES SQUARE FEET Source: CommercialEdge Los Angeles 40,940,000 Houston 33,220,000 Dallas 33,080,000 Chicago 28,830,000 Washington, D.C. 24,320,000 Atlanta 24,000,000 Philadelphia 23,240,000 Phoenix 21,440,000 Denver 19,650,000 Seattle 18,670,000 MATTHEWS™ | 81
Additional Subsectors Performing Well in Healthcare
Several subsectors in healthcare real estate are currently thriving. Here are some examples:
COSMETIC SURGERY CENTERS
In recent quarters, cosmetic surgery centers have become an increasingly favorable asset. In 2022, private equity firms significantly focused on med spas, aesthetics, and plastic surgery offices, all of which offer a range of revenue streams, including insurance fees and steady cash flow. Successful mergers with dermatology and plastic surgery groups have also been observed, bringing in-house crossreferral and substantial insurance revenues. These two business models align perfectly.

According to Precedence Research, the size of the global cosmetic surgery market is anticipated to increase at a compound annual growth rate (CAGR) of 12.42 percent from 2022 to 2030. The estimated value in 2022 was $80.38 billion and will reach $205.1 billion by 2030. North America saw a market value of nearly $17 billion in 2022.
SPECIALTY CLINICS
According to Report Linker, the specialty clinics market in North America is expected to grow at a CAGR of five percent from $95.67 billion in 2018 to $119.89 billion by 2025. The increase is due to technological advancements in diagnostic medicine, leading to more specialty clinics. A rise in chronic diseases and the number of older adults are also responsible for this market growth.
The U.S. is expected to lead the adoption of specialty clinics in North America, with private hospitals being the preferred choice for patients due to the amenities and better treatment offered.
The increasing competition and improvement in healthcare services are driving the growth of private, specialty hospitals, and ambulatory surgical centers.
DENTISTS
Market analysis estimates the demand for dental care treatment will increase significantly in the coming decade. The growing prevalence of oral care for adults and children is expected to fuel this future market growth. These offices are being seen in retail locations nationwide more and more.
The U.S. oral care market was valued at $9.3 billion in 2022 and is projected to hit around $12.9 billion by 2030, poised to grow at a CAGR of 4.13 percent from 2022 to 2030, according to Precedence Research.
URGENT CARE FACILITIES
Urgent care centers nationwide are converting to medtail spaces. This trend is in response to consumers' growing preference for accessible health and wellness services.
’21 ’22 ’23 ’24 ’25 ’26 ’27 ’28 ’29 ’30
$210B $168B $189B $147B $126B $105B $84B $63B $42B $21B $0 ’21 ’22 ’23 ’24 ’25 ’26 ’27 ’28 ’29 ’30 $71.5B $80.38B $90.37B $101.59B $114.21B $128.40B $144.35B $162.28B $182.44B $205.1B COSMETIC SURGERY MARKET SIZE Source: Precedence Research U.S. ORAL CARE MARKET SIZE Source: Precedence Research $14B $12B $10B $6B $8B $2B $4B $0 $8.96B $9.33B $9.72B $10.12B $10.54B $10.97B $11.42B $11.90B $12.39B $12.90B 82 | SPRING/SUMMER 2023
FREESTANDING EMERGENCY ROOMS
The U.S. freestanding emergency department market is expected to grow at a CAGR of 4.9 percent between 2022 and 2027, according to Mordor Intelligence. Freestanding emergency rooms can be excellent investments due to high demand, faster care, higher reimbursements, lower overhead costs, and market growth. As the number of insured Americans continues to grow, this will enable more Americans to afford convenient medical care. Freestanding emergency rooms differ from urgent cares by providing emergency medical care for patients who require immediate attention. In contrast, urgent care centers offer non-emergency care for minor illnesses and injuries.
The West Journal of Emergency Medicine published a study which found the number of freestanding emergency departments (FSED) is increasing rapidly in the United States. Supporters of FSEDs argue that they can offer advantages such as shorter wait times and reduced travel distance for necessary emergency care. As a result, the growing number of FSEDs is anticipated to contribute to market growth during the forecast period.
AMBULATORY CENTERS
Ambulatory centers, also known as outpatient centers, are medical facilities that provide nonemergency medical care and procedures, such as surgeries, diagnostic tests, and rehabilitation services. They are usually located outside of a hospital setting and offer patients a more convenient and cost-effective alternative to hospital-based care.
Global Market Insights reports that in 2022, the market size of ambulatory centers was greater than $87.5 billion, and it is anticipated to experience a CAGR of over 4.5 percent from 2023 to 2032.

DIALYSIS CENTERS
Dialysis centers can be a promising investment due to the growing demand for dialysis treatment and the potential for long-term lease agreements with stable tenants. Despite challenges such as high costs and a shortage of qualified healthcare professionals, technological advancements and medical treatments have improved the quality of care within the sector.
Investors who are looking for opportunities in the commercial real estate market should consider investing in healthcare real estate. The demand for accessible and affordable healthcare is constantly growing, making it a promising sector for investment. The healthcare real estate industry is changing, with new subsectors emerging and new models such as specialty clinics and freestanding emergency departments gaining popularity. Healthcare real estate is an up-and-coming asset class that has not been fully realized yet in the CRE space. With this in mind, now is the time for investors to get on board and take advantage of the sector's stable income, and long-term leases.
Jacob Friedman
(773) 446-7583
jacob.friedman@matthews.com

MATTHEWS™ | 83
HOW TO CAPITALIZE IN A


 BY MICHAEL FEDERICO
In a changing commercial real estate market, investors should reconsider their investment portfolio and strategic outlook, evaluating whether their current investment principles are best practice for the current economic climate. As valuations and market fundamentals shift, private and institutional investors look for the best ways to continue NOI growth.

TO SELL OR TO HOLD…


The decision to buy or sell commercial real estate in a downturned market depends on several factors, including investment goals, risk tolerance, and financial situation. The Fed’s consecutive rate hikes caused debt costs to rise, encouraging owners to tighten their buying criteria and target returns to protect downside risk. In addition, due to increased interest rates, property valuations of commercial assets have decreased as buyers are unwilling to pay the prices they once deemed acceptable in 2021 and early 2022, forcing sellers to reprice. Many REITs believe the first half of the year will remain slow from a transactional standpoint but will pick up in the second half of the year as the bid-ask spread narrows.

Real estate strategies like 1031 Exchanges can be especially profitable in volatile markets because owners can exchange out of a depreciating investment and into a property type that produces higher yields.
Sellers must consider their balance sheets and ensure they are well-positioned to weather a moderate downturn. Furthermore, those that are highly leveraged may be forced to sell due to upcoming debt maturities.
84 | SPRING/SUMMER 2023
OWNERS WITHOUT CAPITAL TO BACKFILL OR REDEVELOP VACANT SPACE MAY DECIDE TO SELL IN THE CURRENT MARKET.
Despite the sticky market conditions, buyers that have capital to deploy are in search of opportunities at discounted pricing. Additionally, investors looking to diversify their portfolios have negotiation leverage and seek assets located within high-performing markets. In hot real estate markets, sellers are often strictly motivated by profit, expect top-of-themarket pricing, and resist negotiating. Whereas in slowing markets, sellers are motivated more out of necessity to dispose of an investment. The difference in motivation gives the buyer an upper hand, and sellers typically will accept reasonable pricing and are more likely to accept looser terms.


INTEREST RATE EFFECT ON CRE VALUATIONS
Source: Federal Reserve Economic Data
The increasing cost of debt causes hesitation among buyers, but if the market allows, the property can be acquired for a better price under more favorable terms. This is especially true for asset types such as multifamily, healthcare, and industrial, which have all performed well in times of economic stress throughout the past few years. The saying “It’s not timing the market, it’s time in the market” rings true. If an investor plans to hold an investment long-term, the rental income acquired over time will outweigh the heavy short-term costs of interest.
STRATEGIES TO CONSIDER
For those looking to capitalize on the current market, there are plenty of strategies to consider.
LOOK FOR VALUE-ADD PROPERTIES


There are typically more value-add properties available for purchase in a down market. Investors should consider near-term mark-to-market opportunities. By improving the operational efficiency of a building, renovating, or rebranding assets, owners can improve cash flow and increase occupancy, establishing long-term profits.
1031 EXCHANGES

Property values are declining, making it more difficult for investors to sell their properties for a profit. By using a 1031 Exchange, investors can sell their investments and use the proceeds to purchase higher-yield assets without paying capital gains taxes on the sale. 1031 Exchanges help investors preserve their capital, maintain their purchasing power, and strategically shift portfolios to better align with their long-term goals and objectives.
OF THE LARGEST MSAS TRACKED BY CRED IQ, OF THOSE MARKETS EXHIBITED COMPARATIVELY HIGHER LEVELS OF DISTRESS IN COMMERCIAL REAL ESTATE LOANS THAN ONE MONTH PRIOR. THE AVERAGE MONTH-OVER-MONTH INCREASE IN DISTRESSED RATES FOR THESE MARKETS WAS APPROXIMATELY BASIS POINTS. *As of March 2023
Federal Funds Effective Rate 30-Year Fixed Rate Mortgage Average in the United States 2002 2004 2006 2008 2010 2012 2014 2016 2018 2020 2022 1% 9% 7% 6% 5% 0% 8% 4% 3% 2% Recessionary Period Market Yield on U.S. Treasury Securities at 10-Year Constant Maturity MATTHEWS™ | 85
LOOK FOR OPPORTUNITIES IN SECONDARY MARKETS
While prices may be falling in some areas, there may be secondary markets that are poised for growth. Investors who do their research and identify these areas can purchase properties at lower prices and see their value increase as the market expands. Midwest markets such as Indianapolis and Cincinnati are reporting strong annual multifamily rent growth, hitting 6.6 percent and 6.1 percent, respectively, as of February 2023. Northern New Jersey boasts one of the nation’s strongest retail markets, offering high average income translating to enormous purchasing power. For industrial, Salt Lake City has been gaining popularity, featuring a low vacancy rate of 4.2 percent, a 13.9 percent year-overyear rent growth, and six million square feet under construction.
FOCUS ON CASH FLOW
It’s important for investors to focus on cash flow. They should ensure that their investment properties are generating positive cash flow and that they have sufficient reserves to cover any unexpected expenses. Owners should negotiate strong lease terms when signing new tenants to include higher percentage rent increases to match industry averages and inflation.
CONSIDER CREATIVE FINANCING


Investors should consider alternative financing options such as private lenders, bridge loans, hard money loans, or seller financing. Private lenders are bridge lenders/hard money lenders. An investor can benefit from these loans because they can increase leverage by sizing to a supported proforma rather than in-place operations. While these products are generally higher in pricing, an investor can benefit by appreciating leverage, full-term interest-only payments, and usually non-recourse. Seller financing is another unique method to acquire commercial real estate. Seller financing terms are usually more competitive than what the wider market can provide. However, there is a risk with trusting an asset with a seller that may or may not be credible or reliable. Only consider seller financing if they are institutional in nature or if there is an established relationship. Another interesting method to solving for leverage is exercising mezzanine, preferred, or JV equity participation. The structures of these options vary by product but are generally good to provide 10 to 20 percent of the full capital stack as long as the subject commercial opportunity is in line with the private equity placements’ investment criteria.
If there’s one thing an investor needs to remember in a down market, real estate is cyclical. There will be more robust markets for sellers and stronger markets for buyers, each with its own unique set of opportunities and challenges. The current real estate cycle is set to last 12 to 24 months. Sellers can capitalize by collecting passive income from secure investments or look into different real estate strategies like 1031 Exchanges to shift their portfolios. On the other hand, buyers can capitalize in the down market by evaluating their investment goals, taking advantage of value-add opportunities, and increasing the cash flow of current assets.


michael.federico@matthews.com


(619) 372-8969

86 | SPRING/SUMMER 2023
YOUR BUSINESS CAN GO IN A MILLION DIFFERENT DIRECTIONS, but only one is right. Market your listing with Matthews™ and gain access to a 1,000,000+ proprietary database.


™ WWW.MATTHEWS.COM


 There are 33.2 million small businesses in the U.S., which account for 99.9% of all U.S. businesses.


 By Jacob Friedman


 BY MICHAEL FEDERICO


