Net Lease Rankings


2023 REport


Despite inflation and rising rates, the latest trends in consumer spending indicate a strong preference for single-tenant assets. Notably, Americans’ income and spending both increased in 2023, indicating economic resilience in the face of rising prices and persistent Fed rate hikes. Although this heightened spending has led to increased consumer debt, the labor market has remained resilient due to above-average job creation, resulting in stable low unemployment rates.
Like other asset classes, investment volumes in triple-net lease properties dropped significantly at the end of last year and have persistently decreased in 2023. Sale-leaseback transactions are contributing to the inventory and driving new investment activity. Investors are highly sensitive to yield due to the higher cost of capital, and cap rates have already increased by approximately 75 basis points. The CRE market has been experiencing a standoff between buyers and sellers regarding asset pricing for over a year. Despite expectations that cap rates would rise with increasing interest rates, pricing has not followed this pattern. However, in the last three months, there has been some relief for NNN retail assets as the pricing gap has started to narrow.
Automotive 4 Bank 6 C-Store & Gas Station 7 Car Wash 8 Dollar Store 9 Drugstore 10 Fitness 11 Grocery Store 12 Restaurant 14 Superstore 17 Distribution & Medical 18
Automotive
The automotive sector is transforming. This shift primarily focuses on automation, electric vehicles, and urban mobility solutions. Despite experiencing a setback during the pandemic, current trends indicate that it is bouncing back without any significant longterm damage. According to Zippia Research, the auto industry accounts for 3.0% of America’s GDP, and the total value of the U.S. car and automobile manufacturing market is estimated to be $104 billion in 2023. The U.S. market for automotive collision repair services exceeded $89 Billion in the year 2020 and is anticipated to exhibit a CAGR of 2.3% between 2021 and 2027.
Car manufacturers are producing a record number of emission-free vehicles. This commitment is inspiring state governments and consumers to embrace the electric vehicle revolution. While there are concerns about the impact on the automotive industry,
EVs offer numerous opportunities for real estate investors. EVs are another type of car needing specialized servicing and parts, a significant benefit for automotive CRE investors. According to the New York Times, United Auto Workers pledged that 40 to 50% of their new car sales will be electric vehicles by 2030, up from just 2.0% in 2022.

MOST VISITED AUTOMOTIVE CHAINS Last 12 months, Nationwide - Source: Placer.ai 49.46M VALVOLINE INSTANT OIL CHANGE 51.57M DISCOUNT TIRE STORE 93.94M ADVANCE AUTO PARTS 117.02M O’REILLY AUTO PARTS 215.32M AUTOZONE AUTO PARTS AUTO PARTS AUTO PARTS AUTO PARTS Tenant Name Advance Auto Parts Autozone O'Reilly Auto parts Caliber Collision Credit Rating (S&P) BBB- BBB BBB N/A Market Cap - - -Corporate or Franchisee? Corporate Corporate Corporate Corporate Typical Price Range $800K - $2.25M $1.5M - $2.15M $1.75M - $2.75M $2.5M - $3.94M Cap Rate Range 5.75% - 7.75% 4.85% - 6.50% 15 Year - 5.50%; 10 Year6.20%; 5 Year - 6.75% 5.75% - 6.50% Typical Lease Term 5-10 Years 15 Years 15 Years + Multiple 5 Year Options 15 Years Typical Lease Structure NN (Roof & Structure) NNN or Ground Lease NN+ (Roof/Structure) NN or NNN Rent Increases None in Base Terms, 5-10% Every 5 Years in Options 10% Every 5 Years and in Options 6% at Year 11 and in Each Option 10% Every 5 Years and in Options Average Store Sales $1.85M $2.33M $2.1MReport Store Sales (Yes/No) Sometimes No No No 4
AUTO SERVICE
Tenant Name Firestone Goodyear
Take 5 Oil Valvoline Credit Rating (S&P) A BB- Private BBB- BB Market Cap $30.64B $3.71B Private $5.92B $4.75B Corporate or Franchisee? Corporate Corporate Both Both Both Typical Price Range $2M - $4M $8K - $2.5M $7.5K - $3M $1.2M - $2.5M $500K - $3M Cap Rate Range 5.25% - 7.50% 6.00% - 8.00% 6.00% to 8.50% 5.50% - 6.50% 5.00% - 7.75% Typical Lease Term 15 Years 15 Years 15 or 20 Years 15 Years 15 or 20 Years Typical Lease Structure NNN NN NNN NNN or Ground Lease NNN Rent Increases 5% Every 5 Years 5% Every 5 Years 10% Every 5 or 1 - 2% Annually 10% Every 5 Years 10% Every 5 or 1-3% Annually Average Store Sales - - ±$1,009,000 $1,031,000 $1,420,000 Report Store Sales (Yes/No) No No Sometimes No Sometimes AUTO SERVICE RENTAL CARS Tenant Name National Tire & Battery Tire Kingdom Enterprise Hertz Credit Rating (S&P) N/A N/A BBB+ BB Market Cap N/A N/A $1.59B $5.35B Corporate or Franchisee? Corporate Corporate Corporate Corporate Typical Price Range $1.5M - $3.6M $2M - $4M $750K - $1.25M $1M -$3M Cap Rate Range 5.00% - 8.00% 5.00% - 7.20% 5.00% - 7.50% 6.00% - 7.50% Typical Lease Term 15 Years 15 Years 10 Years 10 Years Typical Lease Structure NNN NNN NNN or NN NNN or NN Rent Increases 10% Every 5 Years 10% Every 5 Years 2.5% Annually 10% Every Option 2.5% Annually 10% Every Option Average Store Sales - - -Report Store Sales (Yes/No) No No No No 5
Jiffy Lube
Bank
During Q1 2023, two bank failures occurred, causing significant stress in the financial sector and raising concerns among businesses and investors nationwide. On March 10th, 2023, California regulators closed Silicon Valley Bank, leading to its takeover by the Federal Deposit Insurance Corporation (FDIC) on the same day. This represents the second-largest bank failure in U.S. history, with around $209 billion of asset deposits in an uncertain state. Furthermore, on Sunday, March 13th, New York regulators closed Signature Bank, marking the third-largest bank failure in U.S. banking history. These recent bank failures can explain the fall in overall foot traffic for the banking and financial services category.
In addition to these recent bank failures, there has also been a shift toward online banking, which has investors concerned about retail banks in the next 15 years. Millions of Americans were already using digital banking for financial transactions, but COVID-19 forced resistant customers to embrace it, pressuring retail banks to invest in technology. In fact, it is anticipated that ATMs will complete almost 90% of transactions currently performed by tellers in the near future.
Tenant Name Bank of America Chase Bank Wells Fargo Credit Rating (S&P) A- A+ BBB+ Market Cap ±$232.30B ±$411B ±$157.89B Corporate or Franchisee? Corporate Corporate Corporate Typical Price Range $3M - $5M $3M - $6M $2.5M - $4.5M Cap Rate Range 4.5% - 5.5% (10 Year Lease Term 4.5% - 5 Year Lease Term 5.5%) 4.75%- 5.75% 5.25% - 6.25% Typical Lease Term 20 Year Base Lease. 4, 5 Year Option 20 Years 20 Years Typical Lease Structure 20 Year Ground Lease 20 Year Ground Lease Absolute NNN Rent Increases 5% - 10 % Increases Every 5 Years 10% Every 5 Years 10% Every 5 Years Average Store Deposits N/A $230,000,000 $302,567,000 Report Store Sales (Yes/No) FDIC FDIC FDIC 111.6M 133.6M 141.5M MOST VISITED BANKS Last 12 months, Nationwide TRUIST PNC BANK WELLS FARGO CHASE BANK 36.4M 40.9M BANK OF AMERICA 10% 0% 2% 4% 5% 8% -4% -2% -6% -8% 60M 50M 40M 10M 20M 30M 0 YOY Change Visits BANK VISITS Last 12 months, 2022 vs. 2023 Jul ’22 Sept ’22 Nov ’22 Jan ’23 Mar ’23 May ’23 ■ 2022-2023 ■ 2022-2021 ■ YoY Change 6
C-Store & Gas Station
Over the years, consumers have traditionally depended on gas stations and convenience stores (C-Stores) for refueling themselves and their vehicles. Yet, with inflation, soaring gas prices, and a growing number of drivers transitioning to electric vehicles (EVs), gas station operators are now exploring ways to adapt and better serve their customers. Many operators are pursuing new business avenues beyond fuel and are actively looking to revolutionize the operations of gas stations. One way is through the advancement of convenience stores. Around 80% of fuel sales in the U.S. take place at local convenience stores, with approximately 55% of these establishments operated by a single store.
Furthermore, with consumers resuming their daily commutes and engaging in out-of-home activities, there is an increase in traffic at convenience stores. C-stores heavily rely on impulse purchases, and vehicle and pedestrian traffic influences these consumer behavioral changes.

Tenant Name Circle K Kum & Go Wawa 7-Eleven Credit Rating (S&P) BBB Private Private A Market Cap ±$48.21B Private Private ±$39.21B Corporate or Franchisee? Both Corporate Corporate Corporate Typical Price Range $1M - $4M $3.8M - $9.5M $5M - $10M $1M - $10M Cap Rate Range 4.50% - 7.00% 5.50% - 7.00% 4.25% - 5.90% 4.00% - 6.00% Typical Lease Term 15 Years 15 - 20 Years 20 Years 15 Years Typical Lease Structure Absolute NNN or Ground Lease Absolute NNN Ground Lease NNN or Ground Lease Rent Increases Every 5 Years 7.5% Every 5 Years 5% - 10% Every 5 Years 10% Every 5 Years Average Store Sales - $6,976,744 $12,900,000Report Store Sales (Yes/No) No No No No 434.1M 480.7M MOST VISITED C-STORES & GAS STATIONS Last 12 months, Nationwide CUMBERLAND FARMS ROYAL FARMS QUIKTRIP 7-ELEVEN 188.3M 42.9M 44.2M WAWA 14% 12% 10% 8% 6% 4% 2% 0% 120M 100M 80M 20M 40M 60M 0 YOY Change Visits C-STORE VISITS & GAS STATION Last 12 months, 2022 vs. 2023 Jul ’22 Sept ’22 Nov ’22 Jan ’23 Mar ’23 May ’23 ■ 2022-2023 ■ 2022-2021 ■ YoY Change 7
Car Wash
In recent years, the car wash industry has experienced substantial growth in customer visits, surpassing the levels seen before the pandemic. With the gradual resolution of supply chain issues, the increasing availability of electric vehicles in 2023, and increased regular automotive maintenance, car wash visits should continue to grow throughout the year.

The car wash industry has emerged as a profitable segment in the ever-changing CRE market, attracting investors and entrepreneurs nationwide. As vehicles on the road rise and consumers enjoy higher disposable income, the demand for car wash services is expected to grow. According to CoStar Group data and B+E research, the triple-net lease (NNN) car wash real estate market expanded in 2022, with over 245 leased properties changing hands for a total market value of more than $1 billion. The average sale price of a NNN car wash was $4,480,273, with deals trading at an average cap rate of 5.79%.
Last 12 months, Nationwide
Last 12 months, 2022 vs. 2023
3.71M 4.38M 13.66M MOST VISITED CAR WASHES
WATERWAY CARWASH AUTOBELL CAR WASH SAM’S XPRESS CAR WASH 2.44M TIDAL WAVE AUTO SPA Visits 300M 400M 200M 0 100M -5% -10% -15% -20% 0% -25% YoY Change Aug ’22 Oct ’22 Dec ’22 Feb ’23 Apr ’23 June ’23 ■ 2022 % Change ■ Visits ■ 2023 % Change CAR WASH VISITS
8
Dollar Store
Numerous discount and dollar store chains have experienced a substantial expansion in recent years. However, current visit data provided by Placer.ai suggests that the pace of growth is starting to moderate. Nevertheless, despite economic volatility, the sector’s ability to sustain its visit gains from the pandemic period indicates dollar stores have become a crucial part of the regular shopping habits for many consumers.
According to IBIS World, over the last five years, the revenue of dollar and variety stores has experienced a CAGR of 3.9%, reaching $114.2 billion. In the first months of 2023, there was a further increase of 1.7%, and the profit is projected to reach 4.6% by the end of the year.

Tenant Name Family Dollar
Credit Rating (S&P) BBB
Market Cap ±$30.02B
Corporate or Franchisee? Corporate
Typical Price Range $1M - $2M
Cap Rate Range 6.50% - 7.50%
Typical Lease Term 10 or 15 Years
Typical Lease Structure NN+ or NNN
Rent Increases 5% - 10% in Options
Average Store Sales ±$1.6M
Report Store Sales (Yes/No) Sometimes 414.8M 1.02B 1.15B MOST VISITED DOLLAR STORE CHAINS Last 12 months, Nationwide 99 CENTS ONLY STORES FIVE BELOW FAMILY DOLLAR DOLLAR GENERAL 102.31 214.24M DOLLAR TREE SHARE OF VISITS BY CHAIN Q2 2023 Dollar Tree 39.4% Dollar General 32.9% Other 7.0% Family Dollar 13.4% Five Below 7.3%
STORES Q2 2023, Nationwide 04/03 04/10 04/17 04/24 05/01 05/08 05/15 05/22 05/29 06/05 06/12 06/19 06/26 -20% -10% 0% 10% 20% 9
WEEKLY VISITS TO DOLLAR
Drugstore
The retail sector, particularly drugstore investments, has seen a surge in interest, leading to historically low cap rates. Private investors and those involved in 1031 exchanges remain the primary buyers of pharmacies in this market. Established drugstore chains, such as CVS, are witnessing revenue growth, and the market outlook for this sector appears promising.
The drugstore market has diversified its offerings, including medications, cosmetics, and groceries. With over 25,000 drugstores nationwide, the market is poised for expansion and transformation. Projections indicate that the market will experience significant growth, with its value expected to increase from $560 billion in 2021 to $861.67 billion by 2028, exhibiting a CAGR of 6.3% during 2021-2028.

Tenant Name Rite Aid Walgreens CVS Credit Rating (S&P) CCC+ BBB or S+P BBB+ Market Cap ±$92.15M ± $27.18B $85.62B Corporate or Franchisee? Corporate Corporate Corporate Typical Price Range $2.5M - $10.5M $2M - $10M $2M - $10M Cap Rate Range 7.00% - 10.00% 4.75% - 7.00% 4.65% - 7.00% or 6.50% - 12% Typical Lease Term 10 - 12 Year / 2 - 5 Years 13, 15, or 25 Years 10 - 20 Years Typical Lease Structure NN or Absolute NNN NNN Absolute NNN Rent Increases Flat, or 5 - 10% in options Flat or 5% Every 5 Years Flat, or 5 - 10% in options Average Store Sales $6M (Unreported In Most Cases) $2.5M Not Reported Report Store Sales (Yes/No) Sometimes Yes Not Reported 5% 0% -5% -10% -25% -15% -20% YOY Change 300M 250M 200M 0 150M 100M 50M Visits July ’22 Sept ’22 Nov ’22 Jan ’22 Mar ’23 May ’23 DRUGSTORE VISITS Last 12 months, 2022 vs. 2023 181.43M 1.04B 1.18B MOST VISITED DRUGSTORE CHAINS Last 12 months, Nationwide RITE AID CVS WALGREENS ■ 2022-2023 ■ 2022-2021 ■ YoY Change 10
Fitness
The Fitness industry has made a strong comeback in H1 2023, with impressive foot traffic numbers. Throughout the first quarter, weekly visits consistently surpassed those of 2022, indicating a positive trend. In January 2023, there was a notable 22.5% increase in weekly visits, reaching a total of 31.5%, according to Placer.ai. Additionally, a double-digit increase in foot traffic was observed later in the first quarter. When compared to the already high weekly visit numbers in February and March 2022, this surge highlights the resilience of the Fitness industry.
Investor demand in the net lease retail sector is steadily increasing for assets in the fitness industry. While many large gyms and fitness facilities temporarily closed during the pandemic, they have swiftly recovered as consumers recognize the crucial role of physical activity in their lifestyles.

129.6M 207.1M 870.2M MOST VISITED FITNESS CHAINS Last 12 months, Nationwide ANYTIME FITNESS 24 HOUR FITNESS CRUNCH FITNESS LA FITNESS 124.1M 124.6M PLANET FITNESS WEEKLY VISITS TO FITNESS CHAINS Q2 2023, Nationwide 04/03 04/10 04/17 04/24 05/01 05/08 05/15 05/22 05/29 06/05 06/12 06/19 06/26 0% 4% 8% 12% 16% 20% 24% 28%
SHARE OF VISITS BY CHAIN Q2 2023 Planet Fitness 40.1% Other 26.2% 24 Hour Fitness 6.2% LA Fitness 10.6% Crunch Fitness 6.9% ALL MAJOR FITNESS CHAINS EXPERIENCED POSITIVE YOY VISITS AND REVENUE TRENDS IN H1 2023. 11
Grocery Store
Grocery stores have witnessed significant price hikes due to rising inflation, leading to decreased visits. However, more private-label offerings from grocery stores have recently emerged, which are usually priced lower than well-known brand names. This means that consumers who have shifted their food shopping away from traditional grocery stores may reconsider and contribute to increased foot traffic.
Within the CRE industry, grocery-anchored shopping centers are at the top of investors’ lists due to their resilience. Further, the grocery space is adapting to changing times and new consumer trends. Tenants are prioritizing immersive experiences, smaller footprint stores, and offering more affordable alternatives.
590.21M 960.57M 1.08B
VISITED GROCERS Last 12 months, Nationwide ALDI SAFEWAY PUBLIX 508.04M KROGER H-E-B 479.32M SHARE OF VISITS BY CHAIN Q2 2023 Other 58.5% Kroger Brands 19.2% UNFI 1.1% Albertson’s Brands
Ahold Delhaize
MOST
12.1%
9.1%
Q2 2023, Nationwide 04/03 04/10 04/17 04/24 05/01 05/08 05/15 05/22 05/29 06/05 06/12 06/19 06/26 -8% -4% 0 4% 8% 12
WEEKLY VISITS TO GROCERS
Tenant Name Albertsons Kroger Smart & Final Credit Rating (S&P) BB BBB Private Market Cap ±$12.9B ±$34B Private Corporate or Franchisee? Corporate Corporate Corporate Typical Price Range $10M - $20M $8M - $10M $10M - $15M Cap Rate Range 5.50% - 6.00% 5.00% - 6.00% 4.50% - 5.25% Typical Lease Term 10 - 20 Years 10 - 20 Years 15 - 20 Years Typical Lease Structure NNN NNN NNN Rent Increases 5% Every 5 Years Store by Store 10% Every 10 Years Average Store Sales $30M - $40M $30M - $40M $15M - $25M Report Store Sales (Yes/No) Store by Store Store by Store Store by Store Tenant Name ALDI Sprouts Trader Joe’s Credit Rating (S&P) Private AAA Private Market Cap Private N/A Private Corporate or Franchisee? Corporate Corporate Corporate Typical Price Range $3M - $10M $9M - $13M $6M - $10M Cap Rate Range 4% - 5% 5.00% - 6.00% 4.50% - 5.50% Typical Lease Term 15 - 20 Years 15 Years 15 Years Typical Lease Structure NNN Ground Lease NNN NNN Rent Increases 10% Every 5 Years 10% Every 5 Years 10% Every 5 Years Average Store Sales N/A N/A N/A Report Store Sales (Yes/No) No No No 13
Restaurant
The restaurant sector was one of the most negatively affected industries by the COVID-19 pandemic and had little time to recuperate before 2022 inflationary pressures started damaging consumer spending and foot traffic. However, the restaurant sector is experiencing a gradual rebound in foot traffic. The visit gap progressively narrowed in the second half of Q2 until finally swinging positive during the last two weeks of the quarter. In fact, there has been a prominent rise in demand for sit-down dining and QSRs. This can be attributed to the shift in consumer preferences towards satisfying their hunger and seeking a pleasant dining experience. Fast casual restaurants have also been on the rise nationwide, attracting consumers with their efficient dining experiences. As for casual dining, a family favorite within the industry, restaurants are increasingly utilizing apps and rewards programs to improve their operations and create better client experiences.
CHIPOTLE IS CURRENTLY THE MOST VISITED RESTAURANT ACCORDING TO PLACER.AI DATA, WHILE CASUAL DINING RESTAURANTS ARE STILL SOME OF THE TOP RESTAURANTS NATIONWIDE.
CASUAL DINING CASUAL DINING CASUAL DINING CASUAL DINING Tenant Name Applebee's Chili's IHOP Golden Corral Credit Rating (S&P) NR BB- NR N/A Market Cap ±$930.90M ±$1.61B ±$931M N/A Corporate or Franchisee? Franchisee Corporate Both Both (Mainly Franchisee) Typical Price Range $2.5M-$3.75M $2M - $4M $1.5M - $3.5M $2M - $4M Cap Rate Range 6.25% - 7.75% 5.00% - 6.00% 5.75% - 6.75% 5.75% - 6.50% Typical Lease Term 20 Years 20 Years 20 Years 15 Years Typical Lease Structure Absolute NNN Absolute NNN Absolute NNN Absolute NNN Rent Increases 10% Every 5 Years 10% Every Five 10% Every Five 10% Every 5 Years Average Store Sales $2,950,000 $2,650,000 $1,700,000 $3,750,000 Report Store Sales (Yes/No) Varies per lease Varies Varies Varies
SHARE OF VISITS BY TYPE Q2 2023 Breakfast, Coffee, Bakeries, Dessert Shops 6.0% Restaurants 33.6% Fast Food & QSR 60.4% 274.17M 276.8M 313.69M MOST VISITED RESTAURANTS CHAINS Last 12 months, Nationwide CHILI’S BAR & GRILL OLIVE GARDEN APPLEBEE’S TEXAS ROADHOUSE 229.85M 361.24M CHIPOTLE MEXICAN GRILL WEEKLY VISITS TO RESTAURANTS Q2 2023, Nationwide, Year-Over-Year 04/03 04/10 04/17 04/24 05/01 05/08 05/15 05/22 05/29 06/05 06/12 06/19 06/26 -2% 0 2% 6% 4% 14
QSR QSR QSR QSR Tenant Name Del Taco Church's Texas Chicken Jack in the Box Dairy Queen Credit Rating (S&P) Public Subsidiary Private NR Private Market Cap ±$455.89M Private ±$1.79B Private Corporate or Franchisee? Corporate Both Corporate Franchisee Typical Price Range $2.3M - $3M $1.1M - $1.9M $2,975,808 $1.5M - $2M Cap Rate Range 4.25% - 5.50% 4.80%-6.70% 4.75% - 5.50% 5.25% - 5.75% Typical Lease Term 20 Years 20 Years 20 Years 20 Years Typical Lease Structure NNN NNN NNN or Ground Lease NNN Rent Increases 10% or CPI Every 5 Years (10% Max) 10% Every 5 Years or 1.50% Annually 8% - 10% Every 5 Years 8% - 10% Every 5 Years Average Store Sales $1,525,000 $1,256,000 $1,837,053 $1,100,000 Report Store Sales (Yes/No) Yes Yes No No QSR QSR QSR QSR Tenant Name Burger King hardee’s Carl's Jr Chick-Fil-A Credit Rating (S&P) B+ Private Private Private Market Cap ±$34.3B Private Private Private Corporate or Franchisee? Corporate & Franchisee Both Both Corporate Typical Price Range $1M - $3.5M $1.2M - $2.8M $2.3M - $4.8M $2.5M - $7.2M Cap Rate Range 4.75% - 7.50% 5.00% - 7.00% 4.25% - 5.75% 4.00% - 4.50% Typical Lease Term 20 Years 20 Years 20 Years 15 - 20 Years Typical Lease Structure NNN NNN or Ground Lease NNN or Ground Lease NNN or Ground Lease Rent Increases 5-10% Every 5 Years 5 - 10% Every 5 Years 5 - 10% Every 5 Years 10% Every 5 Years Average Store Sales $1.4M $1.15M $1.42M $5.01M Report Store Sales (Yes/No) Varies by location Per Lease Per Lease Yes 15
KFC Taco Bell Wendy's Buffalo Wild Wings

QSR QSR QSR FAST CASUAL Tenant Name
Credit Rating (S&P) BB+ BB+ B+ B+ Market Cap $9.45B $37.71B $4.70B Privately Held Corporate or Franchisee? Franchisee Per Lease Both Corporate Typical Price Range $1.5M - $2.5M $1.1M - $5M $1M - $3.5M $2M - $4M Cap Rate Range 5.25% - 6.25% 4.50% - 5.50% 4.30% - 7.00% 5.00% - 6.00% Typical Lease Term 15-20 Years 20 - 25 Years 20 Years 10 Years Typical Lease Structure NNN NNN NNN or Ground Lease Absolute NNN Rent Increases 5-10% Every 5 Years, or 1-2% Annually 10% Every 5 Years or 2% Annually 5 - 12% Every 5 Years or Annual Increases 10% Every Five Years Average Store Sales $1.3M $1.64M $1.85M $3.3M Report Store Sales (Yes/No) Per Lease Varies Per Lease Per Lease Varies FAST CASUAL FAST CASUAL COFFEE COFFEE Tenant Name Chipotle Panera Bread Dunkin’ Starbucks Credit Rating (S&P) N/A Private NR BBB+ Market Cap ±$56B Private ±$8.8B - Inspire Brands ±$113.79B Corporate or Franchisee? Corporate Both Franchisee Corporate Typical Price Range $3.5M $3M - $5M $1M - $2.5M $2M - $3M Cap Rate Range 4.80% - 5.50% 4.50% - 5.50% 4.25% - 6.75% 4.50% - 6.25% Typical Lease Term 15 Years 15 Years 15 Years / 20 Years 10 - 15 Years Typical Lease Structure Absolute NNN Mostly NNN NNN NN Rent Increases 10% Every 5 Years 7.5% - 10% Every 5 Years 10% Every 5 Years 10% Every 5 Years Average Store Sales $2.6M $2.6M $1.15M Not Reported Report Store Sales (Yes/No) No No Sometimes No 16
Superstores
Although the first week of Q2 saw Superstore visits up YoY, the strength was short-lived, and the YoY visit gap widened significantly the following week. But since mid-May, the YoY weekly visit gaps remained below 4.0%, and the last two weeks of Q2 even saw YoY visit trends swing positive. While certain patterns in superstore visits are changing, Walmart being the industry leader, remains the same. In fact, the superstore chain has a 58.3% share of visits in Q1 2023, according to Placer.ai.
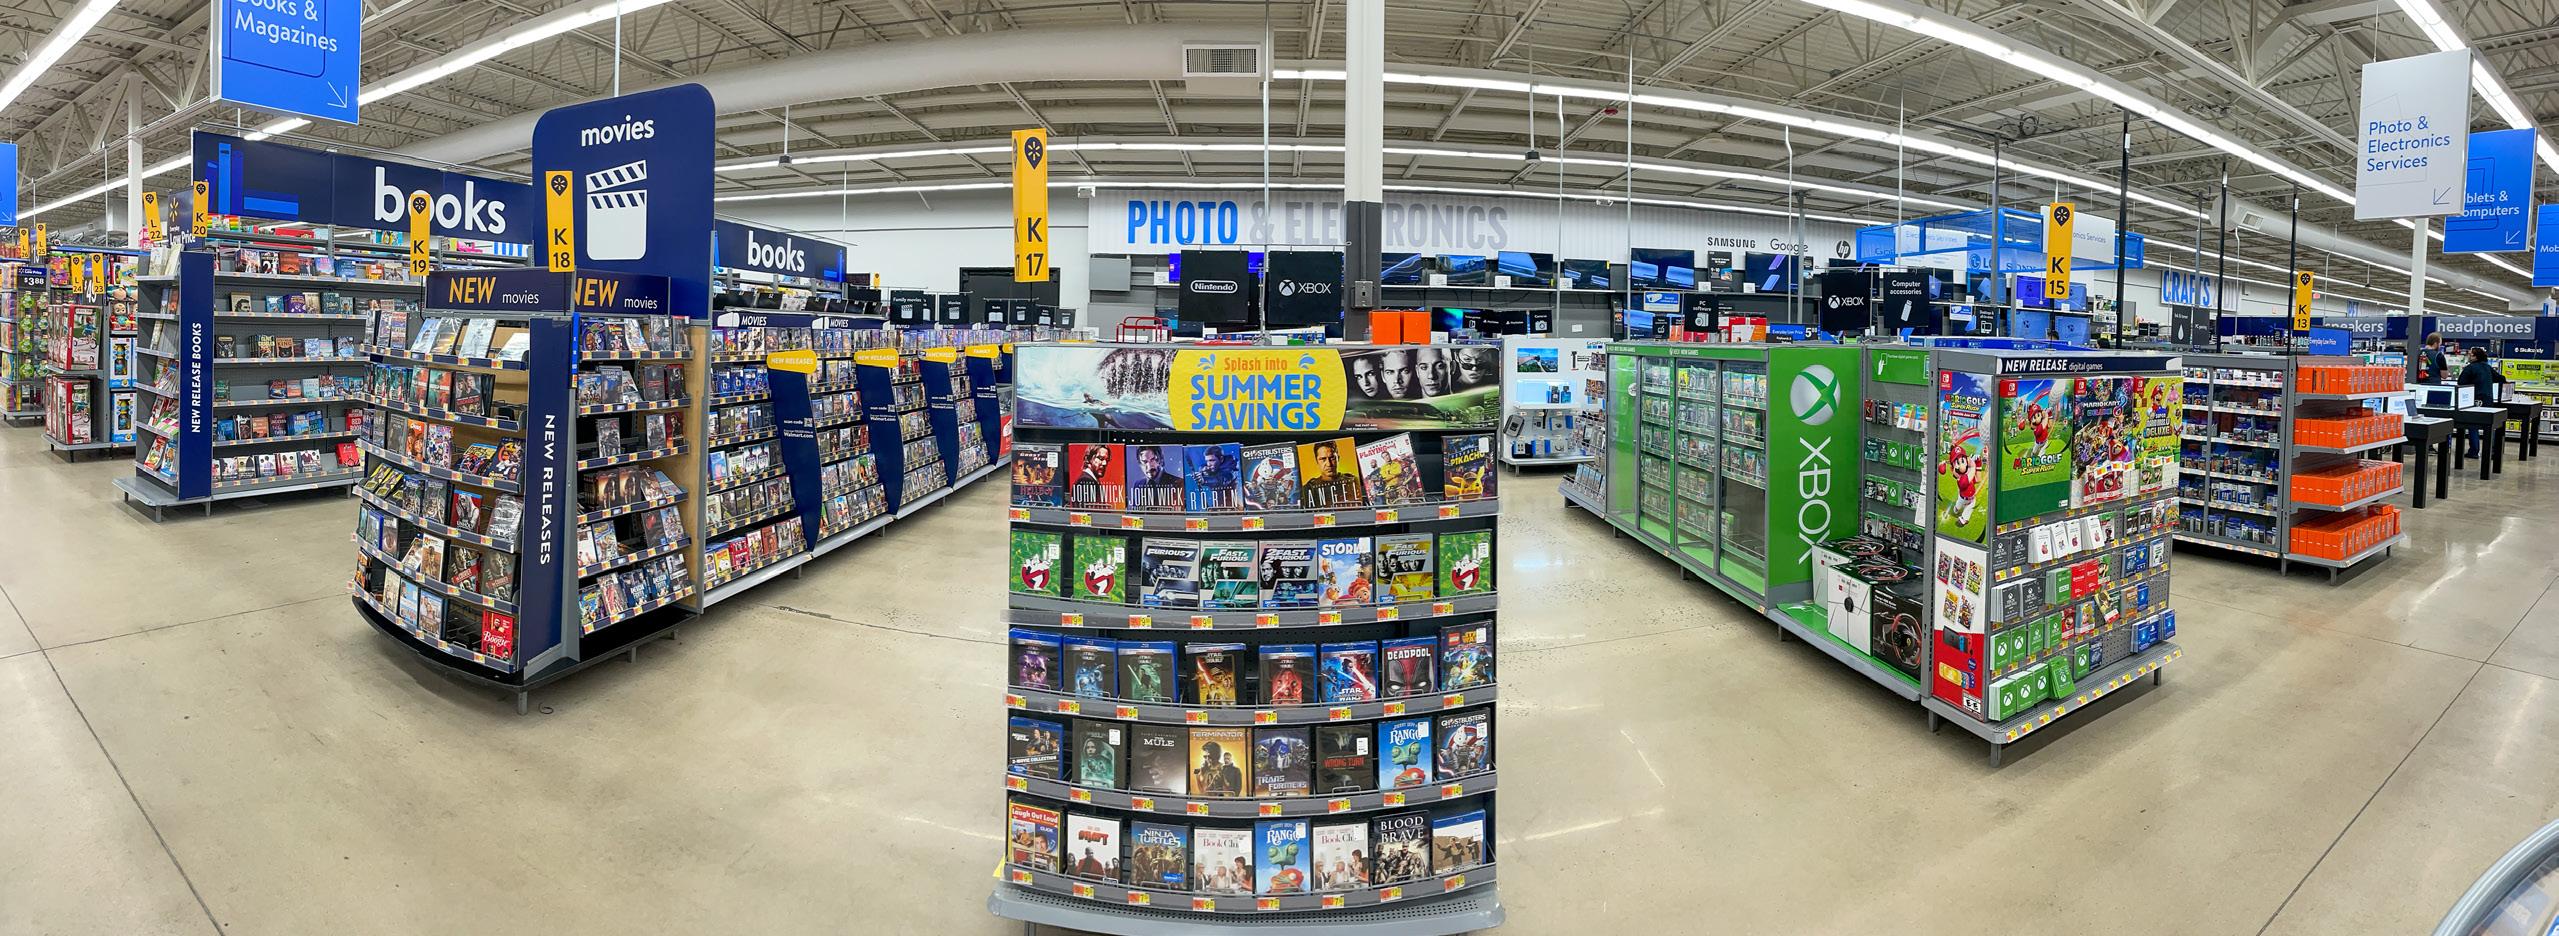
BIG BOX BIG BOX Tenant Name Mattress Firm Tractor Supply Walmart Credit Rating (S&P) B+ BBB AA Market Cap ±$2.39B ±$24.18B ±$418.82B Corporate or Franchisee? Various Corporate Corporate Typical Price Range $1.5M - $5M $5M - $9M $10M - $60M Cap Rate Range 5.75% - 8.00% 5.65% - 6.30% 4.10% - 7.00% Typical Lease Term 10 - 12 Years or 2 - 5 Years 15 or 20 Years 20 Years Typical Lease Structure NN or Abs NNN NN NNN Rent Increases 10% Every 5 years 10% or 5% Every Five Years 5-10% in Options Average Store Sales N/A N/A N/A Report Store Sales (Yes/No) No Not Disclosed No SHARE OF VISITS BY CHAIN Q2 2023 Walmart 58.3% Target 20.7% Other 1.7% Costco 11.8% Sam’s Club 7.5%
1.27B 2.51B 6.92B MOST VISITED SUPERSTORES Last 12 months, Nationwide BIG LOTS SAM’S CLUB COSTCO TARGET 219.56M 871.29M WALMART WEEKLY VISITS TO SUPERSTORES Q2 2023, Nationwide 04/03 04/10 04/17 04/24 05/01 05/08 05/15 05/22 05/29 06/05 06/12 06/19 06/26 -8% -4% 0 4% 17
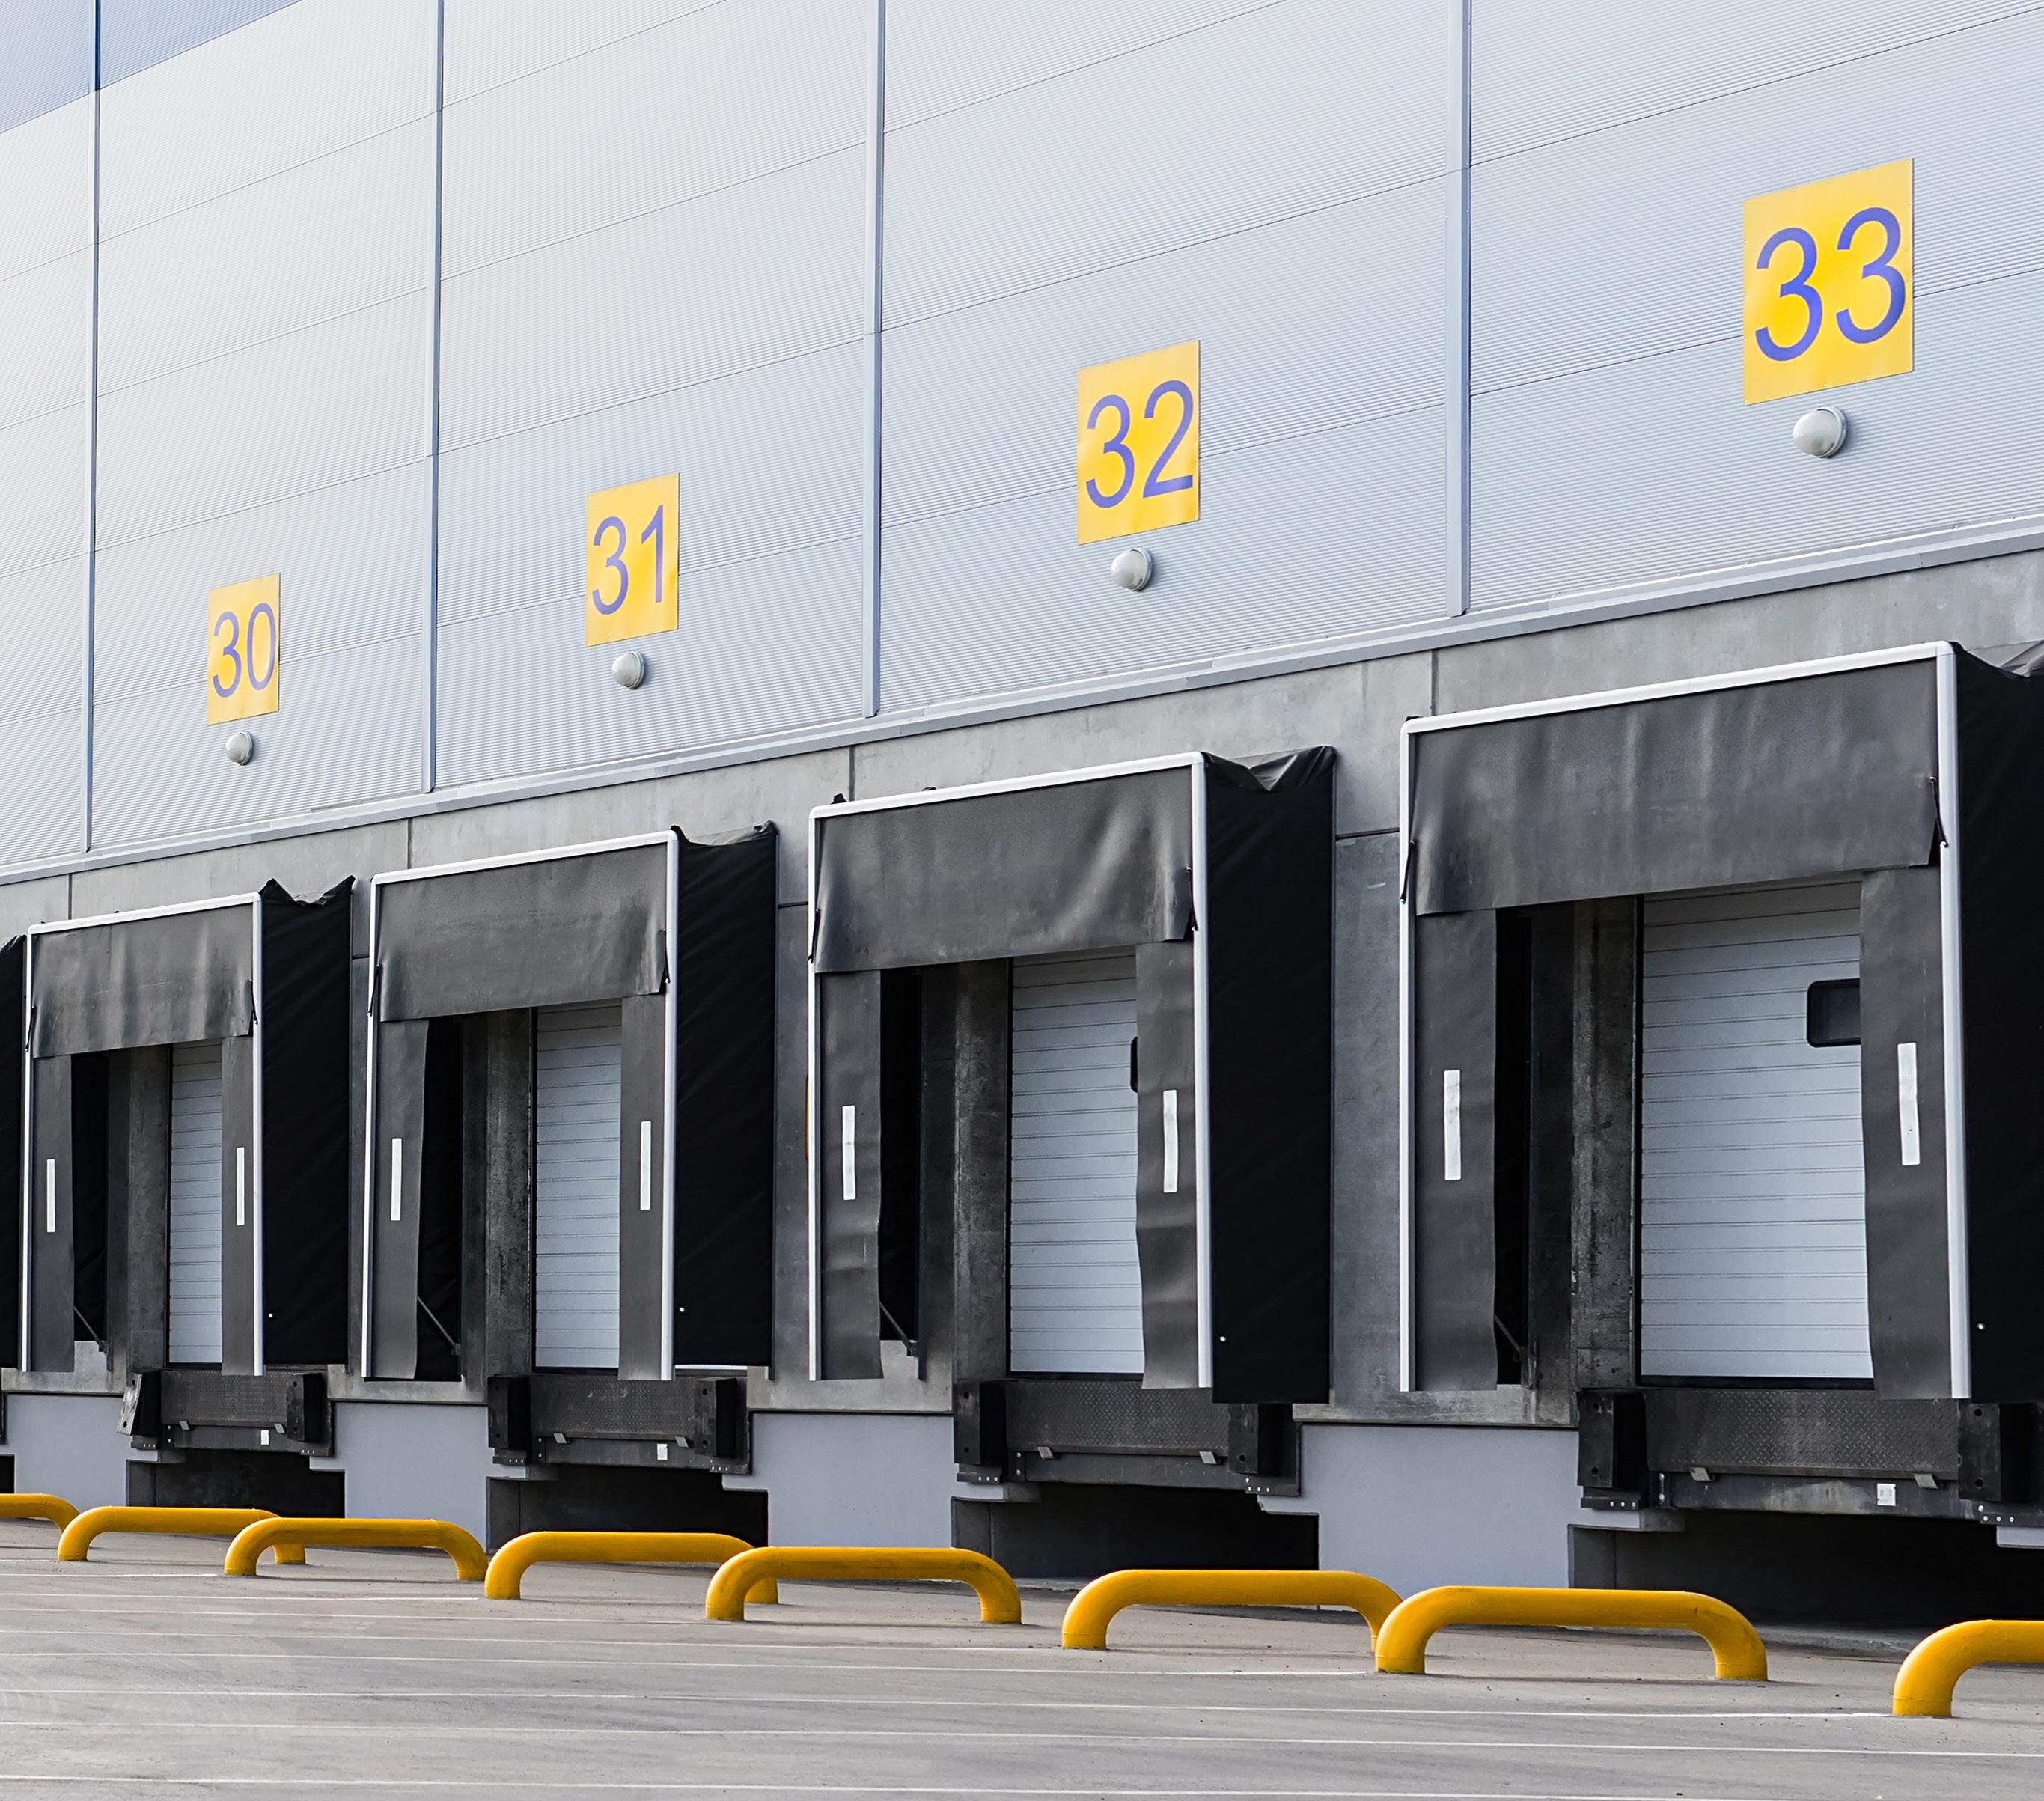
DISTRIBUTION DISTRIBUTION Tenant Name Ferguson Sunbelt Rentals Credit Rating (S&P) BBB+ BBBMarket Cap ±$30.93B 6.30% Corporate or Franchisee? Corporate Corporate Typical Price Range $1M - $10M $1M - $10M Cap Rate Range 5.50% - 7.00% 5.25% - 6.50% Typical Lease Term 3 - 5 Years 5 to 10 Years Typical Lease Structure NN or NNN NN or NNN Rent Increases 2% Annually or CPI Increases 2% - 3% Annually or 10% Every 5 Years Average Store Sales N/A N/A Report Store Sales (Yes/No) No N/A 18
Distribution

Medical
Tenant Name
Credit Rating (S&P) BB BBBMarket Cap ±$8.82B ±$13.81B Corporate or Franchisee? Corporate Corporate Typical Price Range $1M - $8M $1M - $6M Cap Rate Range 5.75% - 8.00% 5.50% - 8.00% Typical Lease Term 10 Years 15 Years Typical Lease Structure NNN NNN Rent Increases 2% Annual or 10% Every 5 2% Rent Increases Average Store Sales N/A N/A Report Store Sales (Yes/No) No No 19
MEDICAL MEDICAL
DaVita Dialysis Fresenius Medical Care
Automotive
Bank
C-Store & Gas Stations
Dollar
Grocery Store
Advance Auto Parts Ryan Fitzgibbons (818) 206-4468 ryan.fitzgibbons@matthews.com AutoZone Jeff Perkins (646) 216-8104 jeff.perkins@matthews.com O’Reilly Auto Parts Kevin McKenna (214) 295-6517 kevin.mckenna@matthews.com Caliber Collision Jeff Perkins (646) 216-8104 jeff.perkins@matthews.com Firestone Jake Sandresky (512) 535-1759 jake.sandresky@matthews.com Goodyear Jake Sandresky (512) 535-1759 jake.sandresky@matthews.com Jiffy Lube Jack Kulick (310) 919-5711 jack.kulick@matthews.com Take 5 Oil Megan Matthews (602) 946-4852 megan.matthews@matthews.com National Tire & Battery William Atsaves (214) 227-7441 william.atsaves@matthews.com Tire Kingdom William Atsaves (214) 227-7441 william.atsaves@matthews.com Enterprise Samuel Griffeth (602) 807-6971 samuel.griffeth@matthews.com Hertz Samuel Griffeth (602) 807-6971 samuel.griffeth@matthews.com
Bank of America John Simonson (858) 301-6108 john.simonson@matthews.com Chase Bank Joshua Longoria (602) 412-3318 joshua.longoria@matthews.com Wells Fargo Gerard Hamas (615) 535-0105 gerard.hamas@matthews.com
7-Eleven Nick Hahn (949) 662-2267 nick.hahn@matthews.com Circle K Chase Cameron (214) 692-2040 chase.cameron@matthews.com Wawa Alex Goodman (615) 667-0153 alex.goodman@matthews.com Kum & Go Alex Goodman (615) 667-0153 alex.goodman@matthews.com Valvoline Megan Matthews (602) 946 4852 megan.matthews@matthews.com
Store Family Dollar Carter Beatty (615) 623-9855 carter.beatty@matthews.com
Store Rite Aid Antonio Sibbio (216) 201-9295 antonio.sibbio@matthews.com Walgreens Tarik Fattah (949) 544-1723 tarik.fattah@matthews.com
Drug
Albertsons Rob Goldberg (954) 237-4510 rob.goldberg@matthews.com Kroger Rob Goldberg (954) 237-4510 rob.goldberg@matthews.com Smart & Final Rob Goldberg (954) 237-4510 rob.goldberg@matthews.com Aldi Cole Voyles (972) 636-8441 cole.voyles@matthews.com Sprouts Cole Voyles (972) 636-8441 cole.voyles@matthews.com Trader Joe’s Cole Voyles (972) 636-8441 cole.voyles@matthews.com index 20
Restaurant
Applebee’s Josh Lesaca (602) 412-3775 josh.lesaca@matthews.com
Chili’s Tucker Brock (615) 216-7921 tucker.brock@matthews.com
IHOP Tucker Brock (615) 216-7921 tucker.brock@matthews.com
Golden Corral Javadian Shaheen (949) 210-9650 shaheen.javadian@matthews.com
Del Taco Nolan Lehman (949) 336-3527 nolan.lehman@matthews.com
Church’s Texas Chicken Nolan Lehman (949) 336-3527 nolan.lehman@matthews.com
Jack in the Box Belall Ahmed (925) 718-7522 belall.ahmed@matthews.com
Dairy Queen Belall Ahmed (925) 718-7522 belall.ahmed@matthews.com
Burger King Jack Morrell (925) 236-3827 jack.morrell@matthews.com
Hardee’s Nathan Roberto (214) 295-8753 nathan.robert@matthews.com
Carl’s Jr Nathan Roberto (214) 295-8753 nathan.robert@matthews.com
Chick-fil-A Nolan Lehman (949) 336-3527 nolan.lehman@matthews.com
KFC Ryan Cousens (949) 287-5872 ryan.cousens@matthews.com
Taco Bell Harrison Wachtler (615) 667-0160 harrison.wachtler@matthews.com
Wendy’s Vincent Renna (949) 207-6396 vincent.renna@matthews.com
Buffalo Wild Wings
Chipotle Ryan FIna (615) 216-0422 ryan.fina@matthews.com
Panera Bread
Superstores
Distribution
Medical
Tucker Brock (615) 216-7921 tucker.brock@matthews.com
Dunkin’ Jonathan Tako (949) 873-0508 jonathan.tako@matthews.com Starbucks Jack Morrell (925) 236-3827 jack.morrel@matthews.com
Grant Morgan (205) 610-8670 grant.morgan@matthews.com
Mattress Firm Antonio Sibbio (216) 201-9295 antonio.sibbio@matthews.com Tractor Supply Ryan Schulten (949) 432-4519 ryan.schulten@matthews.com Walmart Matthew Quamina (949) 777-5983 matthew.quamina@matthews.com
Ferguson Ryan FIna (615) 216-0422 ryan.fina@matthews.com Sunbelt Rentals Grant Morgan (205) 610-8670 grant.morgan@matthews.com
Davita Dialysis Roman Stuart (214) 295-8565 roman.stuart@matthews.com Fresenius Medical Care Roman Stuart (214) 295-8565 roman.stuart@matthews.com index 21
MATTHEWS.COM


