






Cannabis Report ALEXANDER MACHADO Associate (305) 359-5207 alexander.machado@matthews.com Lic No. SL3507121 (FL)


Notable Recent News
SOURCE: BLOOMBERG
U.S. health officials have recommended a loosening of restrictions on marijuana, potentially paving the way for an expansion of the national cannabis market. A high-ranking Department of Health and Human Services official penned a letter urging the Drug Enforcement Agency to reclassify marijuana as a Schedule III drug under the Controlled Substances Act, a move that would signify a significant departure from its current Schedule I status associated with high abuse risk. While not full legalization, this change could be instrumental in reducing taxes on cannabis businesses and encouraging banks and financial institutions to offer traditional banking services to cannabis companies. The announcement led to a surge in marijuana stocks, with the MJ PurePlay 100 Index climbing 13%, showcasing the potential economic impact of such a regulatory shift.

YOUR MATTHEWS™ REPRESENTATIVES
ALEXANDER MACHADO
Associate
(305) 359-5207
alexander.machado@matthews.com
Lic No. SL3507121 (FL)
DANIEL GONZALEZ

Senior Associate
(305) 395-6972
daniel.gonzalez@matthews.com
Lic No. SL3463209 (FL)
ROBERT GOLDBERG
Senior Associate


(954) 237-4510
rob.goldberg@matthews.com

Lic No. 2018005194 (OH)
BEN SNYDER
Executive Vice President & National Director
(216) 503-3607
ben.snyder@matthews.com
Lic No. 2018002569 (OH)

Alabama



SOURCE: MARIJUANA MOMENT

Alabama's medical marijuana program has hit a roadblock as officials have decided to postpone the issuance of business licenses due to inconsistencies in the scoring of applications. The Alabama Medical Cannabis Commission (AMCC) discovered discrepancies and potential errors in the scoring process, thus prompting the delay. This setback comes after months of anticipation following the legalization of medical cannabis in the state in 2021.
The decision to delay the licensing process aims to ensure fairness and accuracy in the evaluation of applications. The AMCC intends to address the discrepancies and reevaluate the scoring to uphold transparency and maintain the integrity of the licensing process. While this delay may be disappointing for prospective business owners and patients eager to access medical marijuana, it demonstrates the state’s commitment to a thorough and reliable evaluation process to select qualified operators for the successful implementation of the medical cannabis program. The AMCC is now working diligently to rectify the inconsistencies and proceed with the licensing as soon as possible, providing much-needed clarity and confidence to the industry stakeholders and patients eagerly awaiting the program’s launch.

Alaska
Alaska has been involved in the cannabis industry for quite some time. The journey began in 1975 with the decriminalization of cannabis. Later, in the case of Ravin v. State, the Alaska Supreme Court ruled in favor of privacy rights under the state constitution, specifically safeguarding the right of adults to privately use and possess small quantities of cannabis. As a result, Alaska was the first and only U.S. state to recognize a constitutional right to the use of cannabis at the time. Alaska holds the fifth position in the country when it comes to the number of dispensaries per person. It falls behind Oregon, Oklahoma, Montana, and Colorado in this aspect. Altogether, the state boasts over 150 active retail stores.


SALES SUMMARY (JANUARY
-
2023) Month Total Taxable Marijuana and Marijuana Product Sales Total Marijuana Retail Sales Tax Jan ‘22 $9,221,510 $461,075 Feb ‘22 $8,569,741 $428,487 Mar ‘22 $9,774,046 $488,702 Apr ‘22 $9,488,761 $474,438 May ‘22 $9,490,703 $474,535 Jun ‘22 $9,277,009 $463,850 Jul ‘22 $9,748,514 $487,426 Aug ‘22 $9,870,815 $493,541 Sep ‘22 $10,304,016 $515,201 Oct ‘22 $10,483,588 $524,179 Nov ‘22 $9,603,486 $480,174 Dec ‘22 $10,248,253 $512,413 Jan ‘23 $9,168,539 $458,427 Feb ‘23 $8,624,908 $431,245 Mar ‘23 $9,868,936 $489,724 Apr ‘23 $9,327850 $466,392 May ‘23 $9,556,062 $477,803 Jun ‘23 $9,374,792 $468,740 TOTAL $172,001,529 $8,596,352
SOURCE: MUNICIPALITY OF ANCHORAGE
ALASKA MUNICIPALITY OF ANCHORAGE CANNABIS RETAIL
2022
JUNE
Arizona
SOURCE: ARIZONA DEPARTMENT OF HEALTH SERVICES
In November 2020, Proposition 207 was successfully passed by Arizona voters, legalizing recreational cannabis use for adults aged 21 and above. Following this development, Arizona rapidly emerged as a prominent cannabis market within the U.S.

AS OF 8/1/2023, THERE ARE A TOTAL OF 169 ESTABLISHMENTS, WITH 148 OPERATING FACILITIES
AS OF 8/1/2023, THERE ARE A TOTAL OF 22 LABS.

ARIZONA MEDICAL MARIJUANA 2023 TRANSACTION SUMMARY IN OUNCES AND POUNDS Marijuana Ounces Edible Ounces Other Ounces Total Ounces 532,164.85 11,677.38 79,283.98 623,126.27 Marijuana Pounds Edible Pounds Other Pounds Total Pounds 33,260.45 729.88 4,955.30 38,945.45 ARIZONA MEDICAL MARIJUANA 2023 TRANSACTIONS AND POUNDS SOLD Total Transactions Total Pounds JAN APR FEB MAY MAR JUN JULY AUG Total # of Transactions 100K 0K 250K 200K 50K 150K 300K Amount of Marijuana Sold (in Pounds) 2K 0K 5K 4K 1K 3K 6K


Arizona cont.
ARIZONA DEPARTMENT OF REVENUE ARIZONA MARIJUANA TPT AND EXCISE TAX COLLECTIONS AND TAXABLE SALES, BY PERIOD COVERED TOTAL TAX COLLECTIONS (FOR ALL JURISDICTIONS) TAXABLE SALES (ESTIMATED) Period Covered Medical - 203 Adult-Use - 420 Excise Tax - 920 EFT Payment Fees - 180 Medical - 203 Adult-Use - 420 Excise Tax - 920 Jan ‘21 $3,556,838 $626,204 $1,829,216 - $42,496,049 $7,664,486 $11,432,601 Feb ‘21 $4,670,229 $2,770,811 $6,390,058 - $55,551,167 $32,366,006 $39,937,865 Mar ‘21 $6,158,263 $4,312,015 $9,450,604 - $73,050,921 $50,785,678 $59,066,273 Apr ‘21 $6,155,475 $4,556,231 $9,841,286 - $73,411,088 $53,962,062 $61,508,040 May ‘21 $5,914,657 $4,485,374 $9,675,313 - $70,523,272 $53,066,320 $60,470,705 Jun ‘21 $5,476,781 $4,345,912 $9,195,969 - $65,298,123 $51,314,496 $57,474,807 Jul ‘21 $5,999,852 $4,630,565 $9,692,478 - $71,545,356 $54,940,119 $60,577,985 Aug ‘21 $5,501,900 $4,403,899 $9,415,503 - $65,747,099 $52,214,009 $58,846,894 Sep ‘21 $5,348,297 $4,537,283 $9,616,074 - $64,394,373 $53,744,275 $60,100,463 Oct ‘21 $5,381,055 $4,971,593 $10,716,949 - $64,449,376 $59,101,175 $66,980,929 Nov ‘21 $5,019,457 $4,994,493 $10,595,121 - $60,311,914 $59,553,798 $66,219,507 Dec ‘21 $4,868,859 $5,868,713 $11,731,774 - $58,052,631 $70,131,422 $73,323,587 Jan ‘22 $4,578,387 $5,260,791 $11,215,718 - $54,745,456 $62,545,854 $70,098,235 Feb ‘22 $4,853,874 $6,156,853 $11,699,032 - $58,308,701 $73,784,093 $73,118,949 Mar ‘22 $4,648,034 $6,196,387 $13,200,291 - $55,559,813 $73,667,642 $82,501,817 Apr ‘22 $4,267,465 $6,151,322 $13,274,984 - $50,993,125 $73,250,820 $82,968,649 May ‘22 $3,795,967 $6,050,756 $12,513,194 - $45,493,189 $72,257,876 $78,207,465 Jun ‘22 $3,360,555 $5,882,249 $12,347,790 $8,061 $40,114,679 $70,277,982 $77,173,689 Jul ‘22 $3,174,744 $6,076,631 $12,622,420 $8,864 $38,021,970 $72,442,149 $78,890,122 Aug ‘22 $2,950,430 $6,047,081 $12,584,513 $690 $35,367,982 $72,212,369 $78,653,203 Sep ‘22 $2,738,176 $6,192,362 $12,944,884 $3,111 $32,701,807 $73,846,721 $80,905,528 Oct ‘22 $2,731,839 $6,401,461 $13,495,403 -$181 $32,715,349 $76,578,183 $84,346,266 Nov ‘22 $2,658,796 $6,615,908 $12,807,162 - $32,151,961 $79,447,612 $86,294,760 Dec ‘22 $2,847,056 $7,318,296 $14,947,550 -$953 $34,459,378 $87,583,376 $93,422,190 Jan ‘23 $2,441,538 $7,079,670 $14,496,490 $2,546 $29,494,366 $84,461,610 $90,603,060 Feb ‘23 $2,375,586 $6,617,135 $13,698,489 - $28,669,792 $79,028,086 $85,615,559 Mar ‘23 $2,660,379 $7,459,746 $15,944,594 - $32,091,483 $89,070,009 $99,653,710 Apr ‘23 $2,570,623 $7,229,262 $14,426,562 - $30,986,268 $86,346,258 $90,166,011 May ‘23 $2,345,550 $6,609,170 $13,274,177 - $28,317,954 $78,542,234 $82,963,603 TOTAL $119,050,663 $159,848,170 $334,643,595 $21,500 $1,425,024,921 $1,904,186,622 $2,091,522,471
SOURCE:
Arkansas


 SOURCE: TALK BUSINESS


According to an article on Talk Business, medical marijuana sales in Arkansas have seen a significant increase of 5.2% through June of this year. The state has witnessed record-breaking sales, reaching $141 million in the first half of 2023. The growth in sales can be attributed to various factors, including the expansion of dispensaries and an increase in patient registrations. With more patients accessing medical marijuana for therapeutic purposes, the industry in Arkansas is flourishing. Experts predict that the positive trend will continue, with overall sales projected to exceed $1 billion by the end of 2023, especially as more dispensaries open across the state.


California

SOURCE: CALIFORNIA DEPARTMENT OF TAX AND FEE ADMINISTRATION

EVOLUTION OF MARIJUANA POLICY REFORM IN CALIFORNIA:
The Compassionate Use Act was approved by voters, permitting the medical use of marijuana.
The state’s legislature expanded the medical marijuana law, enabling patients and caregivers to collectively or cooperatively cultivate marijuana.
California’s legislature implemented a licensing and regulatory framework for medical marijuana businesses.
A ballot initiative was passed by voters, legalizing marijuana for adult use and establishing a regulated market for it.
The regulatory system for medical marijuana businesses was combined with a similar system being developed for non-medical use under a single agency.
The first legal sales for adult consumers were initiated.
1996: 2003: 2015: 2016: 2017: 2018:
CANNABIS TAX REVENUES $600,000,000 $400,000,000 $200,000,000 $1,600,000,000 $1,400,000,000 $1,200,000,000 $1,000,000,000 $800,000,000 $1,800,000,000 ‘23 Q1 ‘22 Q2 ‘22 Q4 ‘22 Q1 ‘22 Q3 ‘21 Q4 ‘21 Q3 ‘21 Q2 ‘21 Q1 ‘20 Q4 Cultivation Tax Excise Tax Total Tax Sales Tax Excise Tax Paid to Distributors Cannabis Sales Taxable Sales Vendor Comepnsation
The Colorado government prohibited the growth and consumption of psychoactive cannabis in 1917. This ban persisted until 2000 when the residents of Colorado voted to legalize its cultivation and use specifically for medical reasons. Then, in 2012, Colorado voters further approved the legalization of non-medical cannabis cultivation and usage for individuals aged 21 and above. As for hemp cultivation, it had been prohibited since the enactment of the federal Marijuana Tax Act of 1937, but in 2013, it was legalized through the implementation of the Colorado Industrial Hemp Act.


COLORADO
JANUARY
Year Total Medical Marijuana Sales Total Retail Marijuana Sales Total Marijuana Sales 2014 $380,284,040 $303,239,699 $683,523,739 2015 $418,054,912 $577,536,343 $995,591,255 2016 $445,616,062 $861,587,411 $1,307,203,473 2017 $416,516,062 $1,091,185,437 $1,507,702,219 2018 $332,173,492 $1,213,517,589 $1,545,691,081 2019 $338,488,190 $1,409,502,438 $1,747,990,628 2020 $442,539,368 $1,748,552,311 $2,191,091,679 2021 $404,410,531 $1,824,584,022 $2,228,994,553 2022 $230,824,588 $1,537,864,249 $1,768,688,837 2023 (Through June) $95,208,288 $687,536,072 $782,744,360 Colorado
REVENUE
MARIJUANA SALES REPORT
2014
SOURCE: COLORADO DEPARTMENT OF
Connecticut
SOURCE: CT DATA

Connecticut joined the ranks of medical marijuana-approved states on May 31, 2012, when HB 5389, also known as “An Act Concerning the Palliative Use of Marijuana,” was signed into law. This act offers legal safeguards to patients, doctors, caregivers, licensed dispensaries, and licensed producers who abide by the regulations when using, suggesting, or dealing with medical marijuana. On October 1, 2016, these protections were expanded to include advanced practice registered nurses. In September 2014, the initial six dispensaries commenced their operations in the state.

CANNABIS RETAIL SALES BY MONTH Retail Sales in Dollars TOTAL MONTHLY RETAIL SALES FOR ADULT-USE CANNABIS AND MEDICAL MARIJUANA JAN ‘23 FEB ‘23 MAR ‘23 APR ‘23 MAY ‘23 JUN ‘23 JUL ‘23 4M 0M 8M 6M 14M 10M 2M 12M AVERAGE PRODUCT PRICE BY MARKET 10 0 30 20 50 40 Average Price in Dollars JAN ‘23 FEB ‘23 MAR ‘23 APR ‘23 MAY ‘23 JUN ‘23 JUL ‘23 AVERAGE RETAIL COST OF CANNABIS PRODUCTS SOLD Medical Average Product Price Adult use Average Product Price Medical Average Product Price Adult use Average Product Price
Delaware


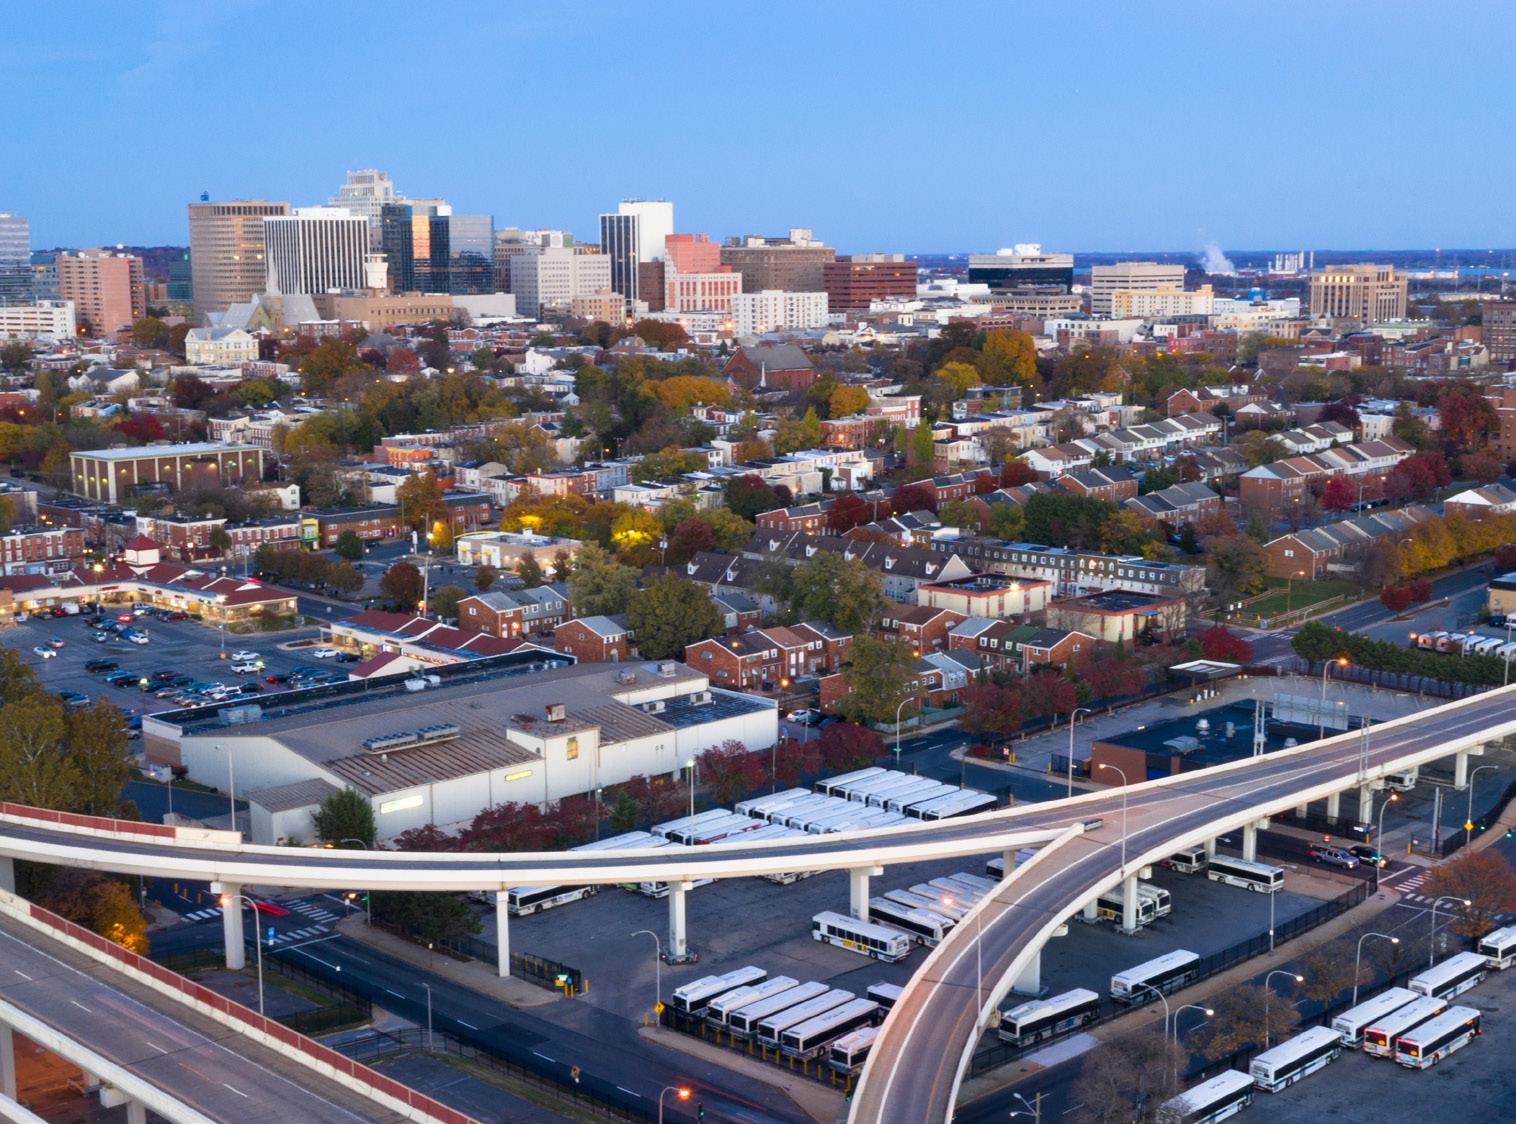
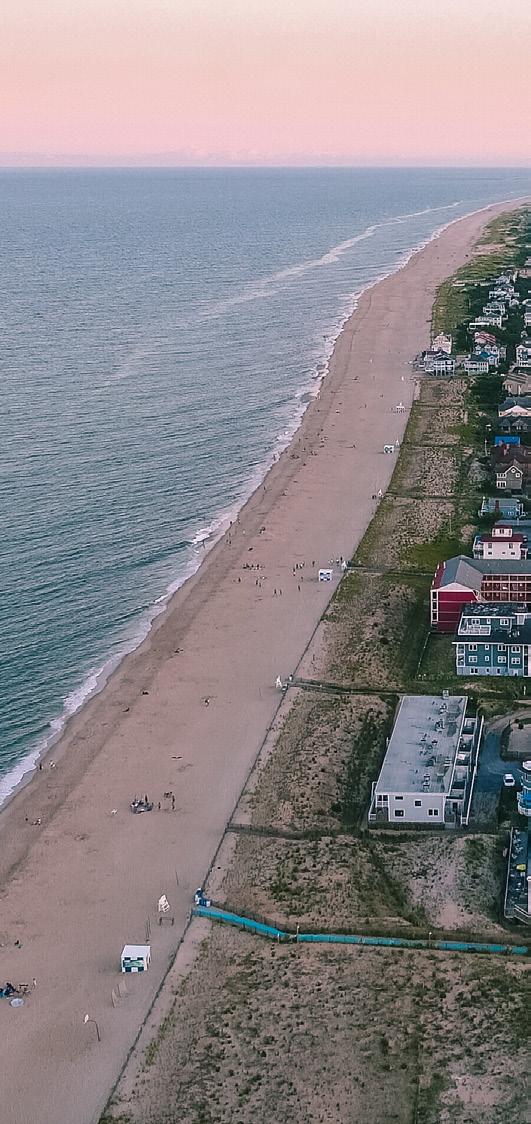
Delaware, the latest state to legalize adult-use cannabis, is not expected to begin recreational marijuana sales until early 2025, possibly a year and a half from now. WHYY News reports that the market is scheduled to launch in September 2024, with a few additional months needed for operators to open their doors. Prior to that, the state must appoint a cannabis commissioner, establish a regulatory office, and issue 125 new business permits. The process begins with accepting business license applications by August 1, 2024. Deadlines for cultivation, manufacturing, testing lab licenses, and retail permits follow, with the potential launch date estimated to be in 2025, depending on the completion of necessary steps. State Representative Ed Osienski notes that it is speculative to provide an exact launch date but suggests it may occur approximately three months after the first cannabis crops are planted and a testing lab is operational.



 SOURCE: GREEN MARKET REPORT
District of Columbia
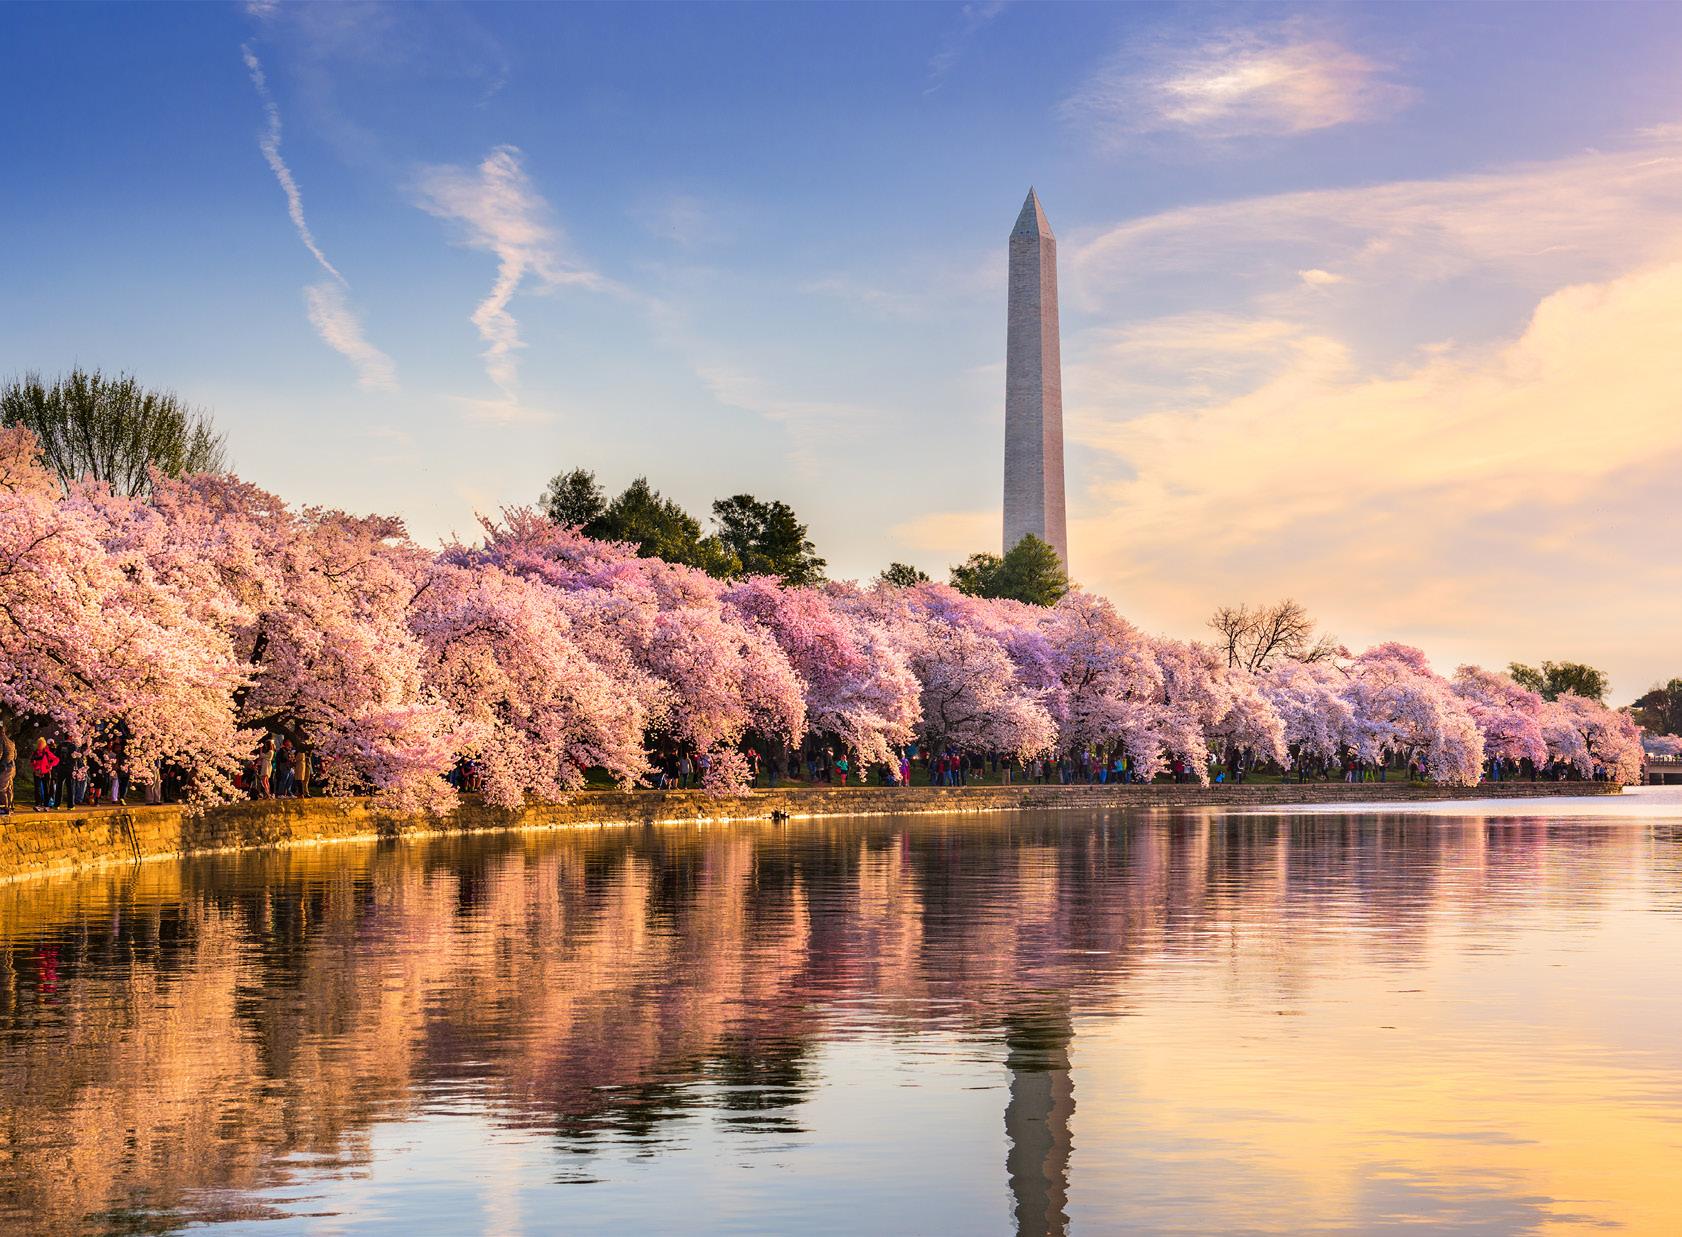
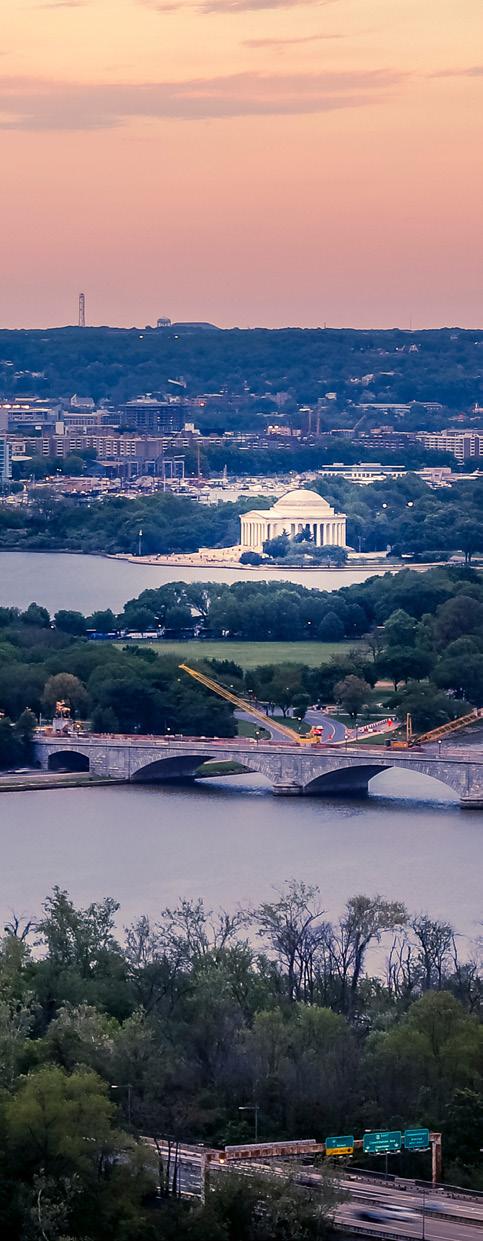


The House and Senate have taken steps to continue blocking the implementation of recreational marijuana sales in Washington, D.C., while protecting medical cannabis laws in states. Both chambers have included provisions in their respective fiscal year 2023 spending bills that prevent the District of Columbia from using funds to regulate and tax recreational marijuana sales. However, the bills also maintain protections for medical cannabis programs in states that have legalized it.
This move reflects the ongoing conflict between federal and local authorities regarding marijuana legalization in D.C. Despite the District of Columbia passing a measure in 2014 to legalize recreational marijuana, Congress has consistently used its authority to intervene and prevent the establishment of a regulated retail market. Advocates argue that this interference undermines the will of the voters and hampers the potential economic benefits that could arise from a legal marijuana industry in the nation’s capital. Nonetheless, the inclusion of provisions safeguarding state medical cannabis laws demonstrates a growing recognition of the importance of protecting patients’ access to this form of treatment.
 SOURCE: MARIJUANA MOMENT
EXCITING NEWS FROM PLANET 13!
Though the company has yet to launch its first dispensary in Florida, it has reached a significant milestone by entering into a definitive agreement to acquire VidCann. The total consideration for this strategic move amounts to $48.9 million.

If this deal is successfully completed, Planet 13 will elevate its position within the retail landscape. What once was a lack of operating dispensaries in Florida will be transformed into a robust footprint, propelling the company to the 9th position with an impressive total of 26 dispensaries in the state.

MEDICAL MARIJUANA (MGS THC) Q2 2023 Q2 2022 3,400,000,000 4,000,000,000 3,800,000,000 3,200,000,000 3,600,000,000 4,200,000,000
Florida
FLORIDA DISPENSATIONS DATA Q2 YOY Medical Marijuana (mgs THC) Low-THC Cannabis (mgs CBD) Marijuana in a Form for Smoking (oz) YOY Change 16.44% -9.98% 25.32% FLORIDA DISPENSATIONS DATA Q2 2022 Month Medical Marijuana (mgs THC) Low-THC Cannabis (mgs CBD) Marijuana in a Form for Smoking (oz) Apr 1Apr 28 1,290,905,486 19,434,404 394,644 Apr 29May 26 979,493,980 13,781,825 305,680 May 27Jun 30 1,233,761,255 15,658,162 402,196 TOTAL 3,504,160,721 48,874,391 1,102,520 FLORIDA DISPENSATIONS DATA Q2 2023 Month Medical Marijuana (mgs THC) Low-THC Cannabis (mgs CBD) Marijuana in a Form for Smoking (oz) Mar 31Apr 27 1,306,178,821 14,548,116 434,339 Apr 28Jun 1 1,548,056,381 16,382,666 522,652 Jun 2Jun 29 1,226,131,364 13,064,693 424,635 TOTAL 4,080,366,566 43,995,475 1,381,626
SOURCE: YAHOO FINANCE & FLORIDA OMMU
Georgia
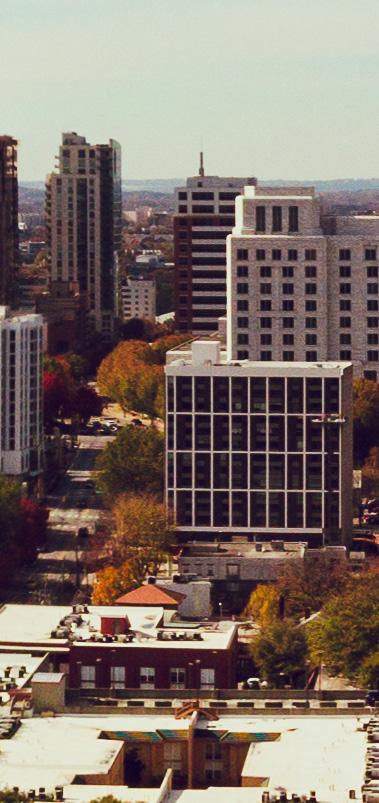

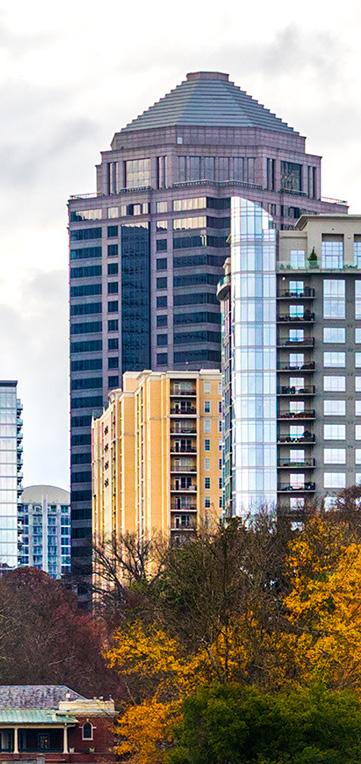
In April, Georgia achieved a significant milestone as the state’s first medical dispensaries were finally opened, more than 8 years after the legalization of medical cannabis. The Georgia Access to Medical Cannabis Commission granted dispensary licenses to two companies: Botanical Sciences LLC and Trulieve GA Inc. (dba Trulieve). Trulieve has since commenced sales at their Macon and Marietta stores, providing patients with access to medical cannabis products.




 SOURCE: CANNABIS BUSINESS TIMES
SOURCE:


Illinois
ILLINOIS CANNABIS REGULATION OVERSIGHT OFFICER Retail Adult Use Sales Retail Medical Sales ILLINOIS MONTHLY RETAIL CANNABIS SALES Retail Sales (Millions) $40M $0M $100M $80M $20M $60M $120M ILLINOIS ADULT USE CANNABIS SALES In-State Resident Sales Out-of-State Resident Sales Sales (in Millions) $40M $0M $100M $80M $20M $60M $120M Liquid Marijuana Infused Edible AUC/Gram Marijuana Infused Topical AUC/Gram Solid Marijuana Infused Edible AUC/Gram Usable Marijuana AUC/Gram Liquid Marijuana RSO AUC/Gram Marijuana Extract for Inhalation AUC/Gram ADULT USE CANNABIS PRODUCTS AVERAGE PRICE/GRAM Price per Gram $40 $0 $100 $80 20 $60 $120 $140 MEDICAL CANNABIS PRODUCTS AVERAGE PRICE PER GRAM Price per Gram $40 $0 $70 $60 $20 $50 $80 $90 $30 $10 Liquid Marijuana Infused Edible AUC/Gram Marijuana Infused Topical AUC/Gram Solid Marijuana Infused Edible AUC/Gram Usable Marijuana AUC/Gram Liquid Marijuana RSO AUC/Gram Marijuana Extract for Inhalation AUC/Gram 2020 2021 2022 2023 2020 2021 2022 2023 2016 2019 2017 2018 2020 2021 2022 2023 2015 2016 2017 2018 2019 2020 2021 2022 2023
Illinois cont.


ILLINOIS CANNABIS
Wholesale Adult Use Sales Wholesale Medical Sales ILLINOIS MONTHLY WHOLESALE CANNABIS SALES Wholesale Sales (Millions) $80M $0M $40M $100M $20M 2015 2016 2017 2018 2019 2020 2021 2022 2023
SOURCE:
REGULATION OVERSIGHT OFFICER


Maine SOURCE: DEPARTMENT OF ADMINISTRATIVE AND FINANCIAL SERVICES OFFICE OF CANNABIS POLICY Retail Sales - Overview SALES (JULY 2023) $20,872,185 AVG. PRICE/GRAM (JULY 2023) $7.79 SALES (YTD) $118,344,134 TRANSACTIONS (YTD) 2,033,596 AVG. PRICE/GRAM (YTD) $7.88 At-a-Glance # OF REGISTERED CAREGIVERS (JUNE 2023) 1,970 # OF REGISTERED EMPLOYEES/ASSISTANTS 4,112 # OF MEDICAL PROVIDERS 737 CARE GIVER APPLICATIONS 182 EMPLOYEE/ASSISTANT APPLICATIONS 331 # OF PRINTED PATIENT CERTIFICATES 9,829 TRANSACTIONS (JULY 2023) 360,886 2020 2021 2022 2023 $4,278,391.19 RETAIL SALES - ANNUAL TREND $200M $100M $0M Sales Amount $81,963,009.29 $158,890,993.75 $118,344,133.51 STATE TREND Number of Registered Caregivers 4K 3K 2K 1K ‘12 ‘13 ‘22 ‘21 ‘20 ‘19 ‘18 ‘17 ‘23 ‘14 ‘15 ‘16 575 1,197 2,161 2,921 3,257 2,993 2,462 2,596 3,046 3,032 2,276 SALES AMOUNT 20M 10M 0M SEP‘22AUG‘22 OCT‘22 JUL‘23JUN‘23MAY‘23APR‘23MAR‘23FEB‘23 AUG‘23 NOV‘22DEC‘22JAN‘23 SALES AMOUNT - BY PRODUCT CATEGORY 20M 10M 0M SEP‘22AUG‘22 OCT‘22 JUL‘23JUN‘23MAY‘23APR‘23MAR‘23FEB‘23 AUG‘23 NOV‘22DEC‘22JAN‘23 Concentrate Plants Infused Product Usable Cannabis REGISTERED CAREGIVERS TREND 2K 0K 4K ‘12 ‘13 ‘14 ‘15 ‘16 ‘17 ‘18 ‘19 ‘20 ‘21 ‘22 2,276 Retail Sales - Previous 12 Months
Maryland
SOURCE: MARYLAND CANNABIS ADMINISTRATION & FORBES
Maryland has recently commenced legal sales of recreational marijuana, allowing adults aged 21 and older to purchase and possess cannabis for personal use. This development follows the passage of a bill earlier this year and provides a significant boost to the state’s cannabis industry. While the initial supply has been limited due to the number of licenses issued, the opening of recreational sales has generated substantial consumer demand, leading to long lines and high sales volumes at dispensaries. This enthusiastic response indicates a promising market potential, and experts predict that additional licenses will be issued in the future to meet the growing demand. The launch of legal sales not only benefits consumers by providing a regulated market but also holds the potential for economic growth and increased tax revenue for Maryland.
2023 Cannabis Legalization Sales Report
Saturday, July 1st - Monday, July 31st total retail sales: $87.43 million
Saturday, July 1st - Sunday, July 30th total retail sales: $84.95 million
Saturday, July 1st - Sunday, July 23rd total retail sales: $65.70 million
Saturday, July 1st - Friday, July 7th total retail sales: $20.90 million
Friday, June 30th - Sunday, July 2nd (July 4th weekend)
2022 total retail sales (medical-only): $3,985,527
2023 total retail sales (medical and adult-use):$10,429,736
Saturday, July 1st, 2023

Total retail sales (medical and adult-use): $4,518,377
Total medical sales: $959,430
Total adult-use sales: $3,558,947

DISPENSARY RETAIL SALES - 2023
JAN ‘23 FEB ‘23 MAR ‘23 APR ‘23 MAY ‘23 JUN ‘23 $37,966,817 $37,701,562 $42,301,162 $39,941,731 $40,781,021 $42,697,445 $20M $0M $40M
$30M $60M $50M $80M


Massachusetts
CANNABIS CONTROL COMMISSION YEAR-TO-DATE ADULT-USE MARIJUANA RETAILER (1/1/23 - 8/20/23) JAN ‘23 FEB ‘23 MAR ‘23 APR ‘23 MAY ‘23 JUN ‘23 JUL ‘23 AUG ‘23 $120.1M $114.8M $129.4M 125.4M $128.7M $132.9M $136.0M $90.8M MON 8/14 TUE WED THU FRI SAT SUN 8/20 $3.7M $4.0M $4.3M $4.7M $5.9M $5.1M $3.9M ADULT-USE MARIJUANA RETAILER LAST WEEKS SALES BY DAY (8/14/23 - 8/20/23) Shake/Trim Concentrate Kief
(bulk)
Plants Suppository Seeds
Pre-Rolls
(edible)
(each)
(by strain)
Pre-Rolls
Beverage Infused (non-edible) Buds Vape Product SALES BY PRODUCT CATEGORIES $2M $4M $6M $8M $10M $12M $14M GROSS SALES TOTAL SINCE ADULT-USE MARIJUANA RETAILERS OPENED NOV 2018 2019 2020 2021 2022 AUG 2023 $0B $0.03B $0.17B $0.26B $0.40B $0.56B $0.62B $0.83B $1.07B $1.24B $1.64B $2.00B $2.35B $2.70B $3.07B $3.32B $3.83B $4.20B $4.48B $4.85B
SOURCE:
Concentrate
Immature
Raw
Infused
Concentrate
Shake/Trim
Infused
Infused
Massachusetts cont.


SOURCE: CANNABIS CONTROL COMMISSION MEDICAL MARIJUANA TREATMENT CENTER GROSS SALES TO PATIENTS AND CAREGIVERS 2018 2019 2020 2021 2022 2023 $0.03M $2.3M $22.6M $65.9M $107.1M $150.5M $241.5M $292.1M $316.7M $390.8M $521.5M $650.9M $747.1M $887.3M $971.8M $1,050.3M $1,069.5M MEDICAL MARIJUANA TREATMENT CENTER YEAR-TO-DATE SALES TO PATIENTS AND CAREGIVERS (1/1/2023-8/20/2023) JAN ‘23 FEB ‘23 MAR ‘23 APR ‘23 MAY ‘23 JUN ‘23 JUL ‘23 AUG ‘23 $19.8M $18.6M $20.4M $19.0M $18.7M $12.2M $19.8M $19.2M ADULT-USE MARIJUANA ESTABLISHMENT AVERAGE RETAIL COST OF FLOWER PER OUNCE 2020 2021 2022 2023 $200 $0 $400 $300 $150 $250 $100 $50 $450 $350 Average Retail Price
Michigan
SOURCE:
On November 4, 2008, Michigan approved the Michigan Medical Marijuana Initiative, allowing individuals to legally use up to 2.5 ounces of cannabis if they possessed a doctor’s note. This represented the first instance of cannabis being permitted, even in a limited capacity, in the entire history of Michigan.
A decade later, in November 2018, Michigan achieved another milestone by becoming the 10th state in the U.S. and the first in the Midwest to legalize recreational marijuana. Subsequently, in December 2019, the state granted approval for dispensaries to lawfully sell recreational cannabis products.
MICHIGAN MEDICAL MARIJUANA ADDITIONAL INFORMATION Q2 2023

MICHIGAN ADULT-USE RECREATIONAL MARIJUANA ADDITIONAL SALES INFORMATION Q2 2023

MICHIGAN MEDICAL MARIJUANA PRODUCT SALES Q2 2023 + JULY Month Pounds Sold Fluid oz Sold Total Sales Apr ‘23 15,085.31 9,237.98 $7,842,858.60 May ‘23 11,946.93 10,220.60 $7,051,723.96 Jun ‘23 10,929.58 10,246.52 $6,643,877.89 Jul ‘23 10,979.78 8,979.78 $6,143,046.23 MICHIGAN ADULT-USE RECREATIONAL MARIJUANA PRODUCT SALES Q2 2023 + JULY Month Pounds Sold Fluid oz Sold Total Sales Apr ‘23 420,227.13 553,693.96 $238,211,384.43 May ‘23 395,565.01 563,267.85 $238,867,535.00 Jun ‘23 404,620.62 757,155.13 $254,153,133.37 Jul ‘23 434,292.89 838,742.93 $270,603,217.84
CANNABIS REGULATORY AGENCY
Month Sales to Date Sales Deliveries Average Retail Flower Price (oz.) Apr ‘23 $1,561,326,466.24 $252,964.61 $94.12 May ‘23 $1,568,445,069.60 $237,317.00 $96.41 Jun ‘23 $1,575,127,561.55 $241,651.84 $99.70
Month Sales to Date Sales Deliveries Average Retail Flower Price (oz.) Apr ‘23 $4,824,354,219.13 $5,318,409.46 $87.76 May ‘23 $5,066,069,354.42 $5,310,622.26 $90.64 Jun ‘23 $5,321,355,224.14 $5,360,719.48 $89.27


Minnesota SOURCE: MINNESOTA DEPARTMENT OF HEALTH PATIENTS APPROVED IN THE REGISTRY PATIENTS APPROVED IN THE REGISTRY 2015 2016 2017 2018 2019 2020 2021 2022 2023 837 8,075 4,017 14,481 18,249 28,522 39,008 (Q2) 39,577 29,402 PATIENTS APPROVED IN THE REGISTRY 2015 837 2016 4,017 2017 8,075 2018 14,481 2019 18,249 2020 28,522 2021 29,402 2022 39,577 2023 (Q2) 39,008 New Patients (approved within 1 year) Returning Patients (approved more than 1 year) 2017 2018 2019 2020 2021 2022 2023 NEW PATIENTS VS. RETURNING PATIENTS 20,000 0 35,000 30,000 10,000 25,000 40,000 NEW PATIENTS VS. RETURNING PATIENTS New Patients (approved within 1 year) Returning Patients (approved more than 1 year) 6/30/2017 5,641 543 6/30/2018 7,868 2,870 6/30/2019 11,131 6,071 6/30/2020 9,890 12,343 6/30/2021 21,511 14,482 6/30/2022 17,348 19,764 6/30/2023 15,428 23,580


Minnesota
SOURCE: MINNESOTA DEPARTMENT OF HEALTH 0-4 5-17 18-24 25-35 36-49 50-64 65+ ACTIVE PATIENTS BY AGE AND GENDER 4,000 0 10,000 8,000 2,000 6,000 12,000 ACTIVE PATIENTS BY AGE AND GENDER Female Male Prefer Not to Answer 0-4 N/A N/A N/A 5-17 141 311 N/A 18-24 817 1,020 67 25-35 3,448 4,126 189 36-49 5,903 6,906 137 50-64 5,234 4,877 60 65+ 2,880 2,852 18 QUALIFYING MEDICAL CONDITIONS Chronic Pain 23,139 Post-Traumatic Stress Disorder 12,628 Severe and Persistent Muscle Spasms 2,217 Cancer 1,834 Obstructive Sleep Apnea 1,737 Inflamm. Bowl Disease (Incl. Crohn’s) 882 Seizures 789 Autism 802 Glaucoma 220 HIV/AIDS 206 Tourette Syndrome 139 Terminal Illness 119 Chronic Vocal or Motor Tic Disorder 61 ALS 41 Alzheimer’s Disease 39 Sickle Cell Disease 17 Female Male Prefer Not to Answer QUALIFYING MEDICAL CONDITIONS Chronic Pain Post-Traumatic Stress Disorder Severe and Persistent Muscle Spasms Cancer Obstructive Sleep Apnea Inflamm. Bowl Disease (Incl. Crohn’s) Autism Seizures Glaucoma HIV/AIDS Tourette Syndrome Terminal Illness Chronic Vocal or Motor Tic/Disorder Sickle Cell Disease 23,139 12,628 2,217 1,834 1,737 882 802 789 220 206 139 119 61 ALS 41 Alzheimer’s Disease 39 17
cont.
Minnesota cont.

SOURCE: MINNESOTA DEPARTMENT OF HEALTH
DATA REFLECTED THE TOTAL NUMBER OF PATIENT VISITS TO A MEDICAL CANNABIS DISPENSARY THAT RESULTED IN THE PURCHASE OF MEDICAL MARIJUANA CANNABIS PRODUCTS, BY MONTH.

MEDICAL CANNABIS DISPENSARY VISITS Oct ‘21 19,727 Nov ‘21 20,030 Dec ‘21 21,498 Jan ‘22 19,578 Feb ‘22 19,047 Mar ‘22 35,506 Apr ‘22 36,109 May ‘22 37,213 Jun ‘22 37,797 Jul ‘22 38,664 Aug ‘22 43,724 Sep ‘22 42,826 Oct ‘22 41,983 Nov ‘22 39,956 Dec ‘22 42,869 Jan ‘23 38,239 Feb ‘23 38,735 Mar ‘23 44,382 Apr ‘23 41,637 May ‘23 45,054 Jun ‘23 45,254 NUMBER OF HEALTH CARE PRACTITIONERS 2015 472 2016 788 2017 1,080 2018 1,412 2019 1,681 2020 1,829 2021 2,080 2022 2,303 2023 (Q2) 2,339 NUMBER OF HEALTH CARE PRACTITIONERS WHO HAVE REGISTERED HAS INCREASED STEADILY SINCE THE PROGRAM FIRST LAUNCHED 2015 2016 2017 2018 2019 2020 2021 2022 2023 470 1,080 1,410 1,681 1,820 2,339 2,303 2,080 788 MEDICAL CANNABIS DISPENSARY VISITS
APR’22MAY‘22JUN‘22JUL‘22AUG‘22SEP‘22OCT‘22NOV‘22DEC‘22JAN’23FEB‘23MAR‘23APR’23MAY‘23JUN‘23 45,254 46,000 45,000 44,000 43,000 42,000 41,000 40,000 39,000 38,000 37,000 36,000 35,000 45,054 41,637 44,382 38,735 38,239 42,869 39,956 41,983 43,724 38,664 37,213 36,109
Mississippi



SOURCE: AP NEWS

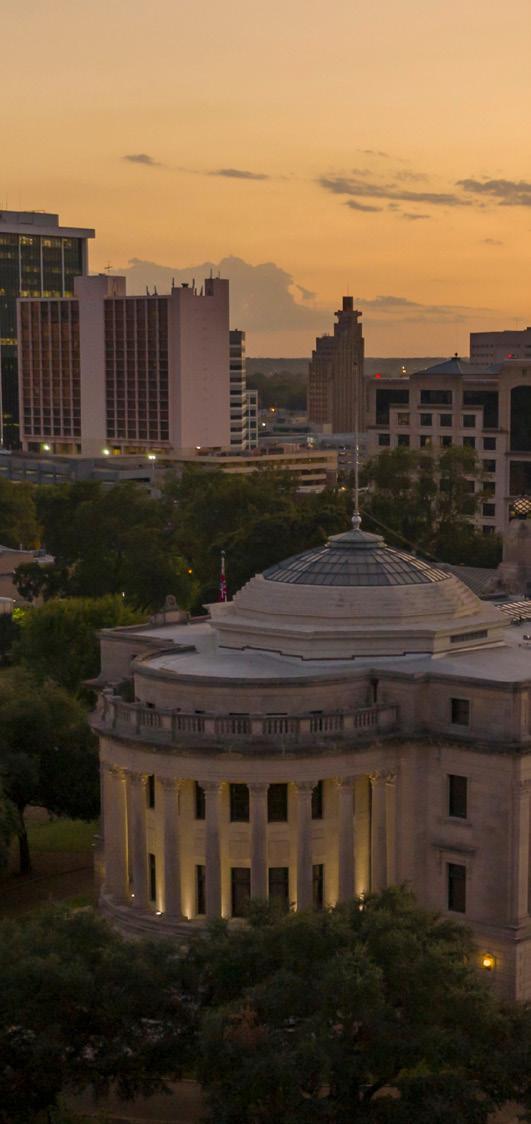
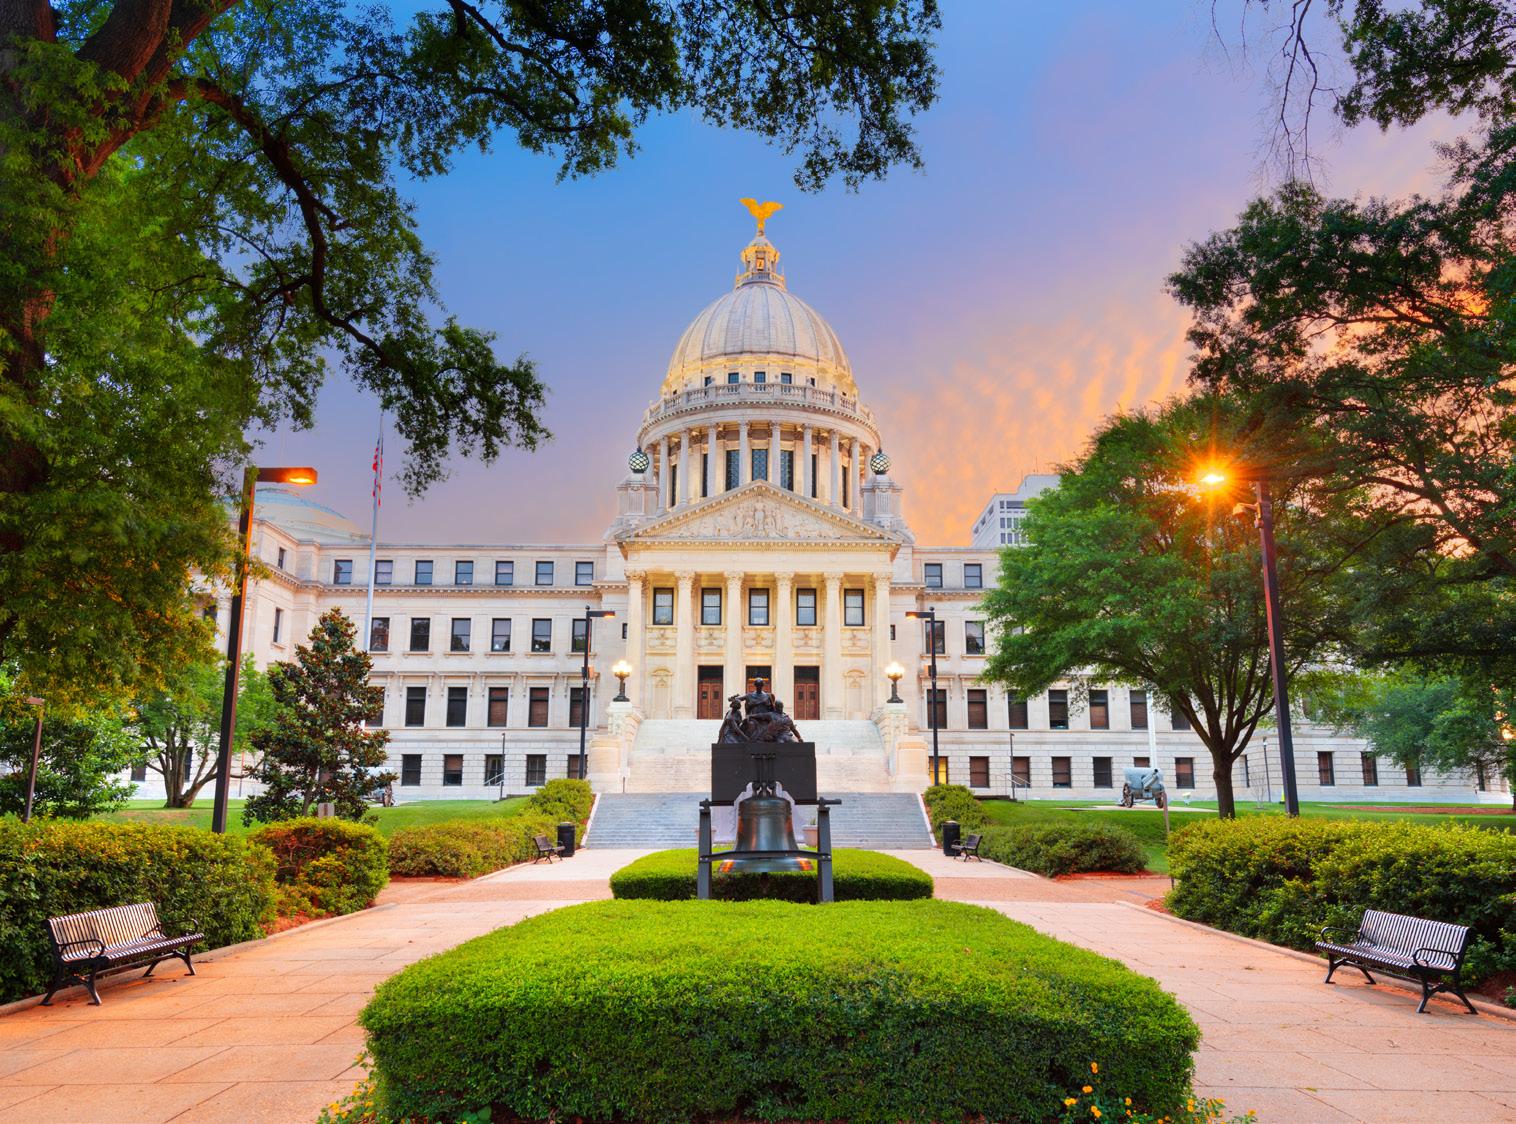
Medical marijuana sales have commenced in Mississippi in 2023. The Mississippi Medical Marijuana Association announced that the first purchases took place at three dispensaries - The Cannabis Company in Brookhaven, Hybrid Relief, and Star Buds in Oxford. Over 1,700 patients have enrolled in the medical marijuana program. After a majority of voters approved a medical marijuana initiative in 2020, the state Supreme Court invalidated it, but a bill passed by the Legislature in 2022 authorized the sale of medical marijuana, leading to the current developments. Dispensary owners have expressed their relief and hope for the future as more businesses enter the market to serve patients.


Missouri SOURCE: MISSOURI DEPARTMENT OF HEALTH & SENIOR SERVICES LICENSE TYPE ACTIVE Agent 16,271 Caregiver 2,375 Consumer Cultivator 1,444 Patient 163,787 Patient Cultivator 21,283 Physician & Nurse Practitioner 616 Agent Patient Cultivator Patient Caregiver ACTIVE BY LICENSE TYPE | HISTORICAL Count 0K 100K 200K 2020 2023 2021 2022 APPLICATIONS RECEIVED PER MONTH 2020 2021 2022 2023 0K 10K 20K Count Agent Patient Cultivator Patient Caregiver 2020 2021 2022 2023 LICENSES ISSUED PER MONTH 0K 10K 20K Count Agent Patient Cultivator Patient Caregiver


Missouri
MISSOURI DEPARTMENT OF HEALTH & SENIOR SERVICES MONTHLY AND CUMULATIVE MARIJUANA SALES $1,200M $1,000M $200M $0M $400M $800M $600M $1,600M $1,400M DEC ‘22 JAN ‘23 FEB ‘23 MAR ‘23 APR ‘23 MAY ‘23 JUL ‘23 JUN ‘23 Cumulative Sales Since 2020 Monthly Adult Use Sales Monthly Medical Sales $605.3M $642.3M $745.2M $871.4M $1,113.4M $1,234.7M $1,356.9M $40.3M $37.0M $71.7M $31.2M $93.5M $32.7M $92.6M $28.3M $95.2M $26.0M $98.7M $24.5M
cont. SOURCE:


Montana SOURCE: CANNABIS CONTROL DIVISION MONTANA JANUARY 2022 TO JULY 2023 ESTIMATED SALES Medical $131,373,324 Adult-Use $356,167,352 Total $487,540,676 JANUARY 2022 TO JULY 2023 ESTIMATED TAXES Medical $5,254,933 Adult-Use $71,233,470 Total $76,488,403 MONTANA MONTHLY CANNABIS SALES Year Month Medical Sales Adult-Use Sales Monthly Total January 2022-to-Date Total 2022 JAN $10,143,750 $14,141,897 $24,285,647 $24,285,647 FEB $9,357,699 $13,533,697 $22,891,396 $47,177,043 MAR $9,872,283 $15,861,517 $25,733,800 $72,910,843 APR $9,062,420 $16,312,202 $25,374,723 $98,285,465 MAY $8,259,976 $16,629,200 $24,889,176 $123,174,642 JUN $7,628,733 $17,268,597 $24,897,330 $148,071,971 JUL $7,364,378 $19,172,146 $26,536,524 $174,608,495 AUG $7,001,158 $19,807,451 $26,808,609 $201,417,104 SEP $6,726,746 $19,828,958 $26,555,703 $277,972,808 OCT $6,372,707 $19,519,042 $25,891,749 $253,864,557 NOV $5,842,101 $18,203,534 $24,045,635 $277,910,192 DEC $5,984,601 $19,669,086 $25,653,688 $303,563,879 2023 JAN $5,639,106 $19,307,431 $24,946,537 $328,510,417 FEB $5,376,838 $19,153,224 $24,530,061 $353,040,478 MAR $5,874,897 $21,223,782 $27,098,679 $380,139,157 APR $5,443,376 $20,373,979 $25,817,355 $405,956,512 MAY $5,288,730 $20,808,098 $26,096,828 $432,053,340 JUN $5,087,029 $21,848,306 $26,935,335 $458,988,675 JUL $5,046,795 $23,505,205 $28,552,001 $487,540,676
SOURCE: STATE OF NEVADA DEPARTMENT OF TAXATION


Nevada
NEVADA DEPARTMENT OF TAXATION CANNABIS TAX REVENUE Excise Taxes Jul. ‘22 Aug. ‘22 Sep. ‘22 Oct. ‘22 Nov.22 Dec. ‘22 Jan. ‘23 Feb. ‘23 Mar. ‘23 Apr. ‘23 May ‘23 Jun. ‘23 Fiscal YTD State Wholesale Cannabis Excise Tax $4,083,551 $5,103,227 $3,975,705 $3,604,050 $4,466,180 $4,914,502 $4,834,228 $4,322,915 $4,860,509 $4,372,900 $4,029,020 - $48,566,788 State Retail Cannabis Excise Tax Clark County $2,66,996 $3,730,190 $2,791,441 $2,687,283 $2,880,561 $3,348,384 $3,354,782 $2,892,333 $3,320,333 $4,372,900 $4,029,020 - $48,566,788 Washoe County $912,869 $878,153 $774,405 $656,762 $1,075,514 $728,715 $835,775 $875,324 $1,048,488 $858,517 $751,888 - $9,396,411 Other Counties $503,686 $494,884 $409,859 $260,005 $510,104 $837,403 $643,671 $555,258 $491,038 $534,552 $477,119 - $5,717,580 TOTAL $6,591,049 $6,169,050 $6,397,384 $6,724,698 $6,429,758 $6,696,780 $7,159,865 $6,188,788 $7,428,033 $7,009,814 $6,797,124 - $73,592,342 Total Cannabis Excise Tax Revenue Clark County $5,017,687 $4,640,968 $5,016,706 $5,257,448 $4,917,528 $5,075,006 $5,475,767 $4,853,292 $5,687,142 $5,333,242 $5,285,635 - $56,560,421 Washoe County $918,526 $903,228 $751,798 $804,388 $930,397 $947,740 $925,111 $668,817 $1,117,845 $960,219 $873,183 - $9,801,251 Other Counties $654,836 $624,855 $628,879 $662,862 $581,834 $674,034 $758,986 $666,679 $623,045 $716,354 $638,306 - $7,230,670 TOTAL $10,674,600 $11,272,277 $10,373,089 $10,328,749 $10,895,938 $11,611,282 $11,994,093 $10,511,703 $12,288,541 $11,382,714 $10,826,144 - $122,159,130 NEVADA DEPARTMENT OF TAXATION CANNABIS TAX REVENUE Excise Taxes Jul. ‘22 Aug. ‘22 Sep. ‘22 Oct. ‘22 Nov.22 Dec. ‘22 Jan. ‘23 Feb. ‘23 Mar. ‘23 Apr. ‘23 May ‘23 Jun. ‘23 Fiscal YTD Taxable Sales Reported by Adult-Use Retail Stores and Medical Dispensaries $71,920,964 $67,920,567 $71,574,547 $66,644,316 $70,813,925 $73,190,438 $70,254,611 $67,814,368 $75,023,166 $72,083,328 $72,685,112 - $779,557,342 Clark County $55,020,971 $50,959,261 $54,682,010 $51,061,446 $54,442,675 $56,523,711 $53,799,145 $52,712,577 $57,130,747 $54,469,868 $56,015,810 - $596,818,221 Washoe County $9,906,487 $9,862,693 $9,595,785 $9,160,982 $9,664,223 $9,763,363 $9,342,271 $8,801,907 $10,477,265 $9,705,888 $9,533,993 - $105,814,957 Other Counties $6,993,507 $6,730,613 $7,296,752 $6,421,888 $6,707,026 $6,903,365 $7,113,195 $6,299,883 $7,415,054 $7,907,573 $7,135,308 - $76,924,164
New Hampshire


SOURCE: NEW HAMPSHIRE DEPARTMENT OF HEALTH & HUMAN SERVICES

Starting from June 28, 2023, New Hampshire’s Therapeutic Cannabis Program has granted permission to the state’s Alternative Treatment Centers (ATCs) to provide therapeutic cannabis to visitors from outside the state and Canada who are legally allowed to possess cannabis for therapeutic purposes. Visiting patients can buy therapeutic cannabis from a New Hampshire ATC up to three times a year using a valid therapeutic cannabis identification issued by another state or Canada. If the visiting patient has a documented qualifying medical condition that is approved by New Hampshire, they can purchase cannabis from New Hampshire ATCs at the same frequency as qualifying patients from New Hampshire. Visiting patients must present their out-of-state cannabis ID card along with matching photo identification. They are subject to a possession limit of 2 ounces and can purchase a maximum of 2 ounces of cannabis within any 10-day period. Compliance with state laws regarding therapeutic cannabis use is mandatory for visiting patients. New Hampshire currently operates seven ATC therapeutic cannabis dispensary locations in Chichester, Conway, Dover, Keene, Lebanon, Merrimack, and Plymouth, which are listed on the Alternative Treatment Centers webpage.


New Jersey


SOURCE: CANNABIS REGULATORY COMMISSION

License Awards Totals (as of the July 18, 2023 public meeting)
1,208

287
198
135
42
97
22
723
436
64
29
41
55
14
CANNABIS SALES TOTALS Medicinal Sales Recreational Sales Total Recreational Tax Revenue Social Equity Excise Fees Q1 2022 $55,838,072 - $55,838,072 -Q2 2022 $59,262,014 $79,698,831 $138,960,845 $4,429,720Q3 2022 $61,138,231 $116,572,533 $177,710,764 $7,482,618Q4 2022 $49,874,667 $132,484,179 $182,358,846 $8,227,317Q1 2023 $34,456,270 $144,865,706 $179,321,976 $9,362,309 $459,093 Q2 2023 $32,883,539 $160,205,269 $193,088,808 $9,490,747 $702,071
Conversions:
Cultivation:
Manufacturing:
Retail:
Micro-business:
Conditionals:
Cultivation:
Manufacturing:
Retail:
Micro-business:
Annual:
Cultivation:
Manufacturing:
Retail:
Testing Labs:
Micro-business: 12
6
New Mexico


TRANSACTIONS 799,768

SALES $244,391,092.36 MEDICAL TRANSACTIONS 4,758,964
SALES $431,229,953.42 ADULT-USE TRANSACTIONS 9,757,890

NEW
MONTHLY SALES DATA $30,000,000 $25,000,000 $5,000,000 $0 $10,000,000 $20,000,000 $15,000,000 $40,000,000 $35,000,000 APR‘22 MAY‘22 JUN‘22 JUL‘22 AUG‘22 SEP‘22 OCT‘22 NOV‘22 DEC‘22 JAN‘23 FEB‘23 MAR‘23 APR‘23 MAY‘23 JUN‘23 JUL‘23 Total Medical Sales Total Adult-Use Sales MONTHLY SALES TREND $30,000,000 $25,000,000 $5,000,000 $0 $10,000,000 $20,000,000 $15,000,000 $40,000,000 $35,000,000 APR‘22 MAY‘22 JUN‘22 JUL‘22 AUG‘22 SEP‘22 OCT‘22 NOV‘22 DEC‘22 JAN‘23 FEB‘23 MAR‘23 APR‘23 MAY‘23 JUN‘23 JUL‘23 Total Medical Sales Total Adult-Use Sales July 2023 Sales Data All Time Sales Data MEDICAL
ADULT-USE
ADULT-USE
TOTAL
TOTAL
TOTAL
MEDICAL
ADULT-USE
TOTAL
SOURCE:
MEXICO REGULATION & LICENSING DEPARTMENT
SALES $13,688,372.76 MEDICAL TRANSACTIONS 268,267
SALES $34,077,883.07
SALES $47,766,265.83
DISPENSARIES 1,040
TRANSACTIONS 1,068,035
SALES 675,621,045.78 TOTAL DISPENSARIES 14,516,854
New Mexico CONT.

SOURCE: NEW MEXICO REGULATION & LICENSING DEPARTMENT


AVERAGE SALES TREND PER TRANSACTION APR‘22 MAY‘22 JUN‘22 JUL‘22 AUG‘22 SEP‘22 OCT‘22 NOV‘22 DEC‘22 JAN‘23 FEB‘23 MAR‘23 APR‘23 MAY‘23 JUN‘23 JUL‘23 $40 $30 $0 $20 $10 $60 $50 AVERAGE SALE PER TRANSACTION $40 $30 $0 $20 $10 $60 $50 APR‘22 MAY‘22 JUN‘22 JUL‘22 AUG‘22 SEP‘22 OCT‘22 NOV‘22 DEC‘22 JAN‘23 FEB‘23 MAR‘23 APR‘23 MAY‘23 JUN‘23 JUL‘23 Average Medical Sales Average Adult-Use Sales MONTHLY SALES BY CATEGORY Total Medical Sales Total Adult-Use Sales MONTHLY TRANSACTIONS BY CATEGORY Total Medical Sales Total Adult-Use Sales Average Medical Sales Average Adult-Use Sales
New York


 SOURCE: MJBIZ DAILY
Despite experiencing delays in the rollout of its recreational market, New York has made headway in granting adult-use licenses. A total of 251 licenses for adult retail have been issued, yet only 16 dispensaries and delivery outlets have been able to commence operations. To combat the illicit cannabis market, the governor of New York has signed legislation aimed at implementing stricter regulations and penalties, with the objective of establishing a safer and more regulated industry. However, New York’s cannabis farmers are facing significant frustrations due to the sluggish rollout of retail dispensaries, resulting in surplus cannabis that cannot be sold to meet market demand. This has caused financial concerns for farmers who made substantial investments in cannabis cultivation. The situation highlights the necessity for an expedited licensing process and prompt opening of retail shops to support local farmers.


Dakota SOURCE: NORTH DAKOTA HEALTH & HUMAN SERVICES TOTAL DISPENSARY SALES (BY FISCAL YEAR) 2020 2021 2022 2023 Total Dispensary Sales $6,361,000 $15,336,000 $19,970,000 $21,606,000 Percent of Total Sales that were Dried Leaves and Flowers 67% 72% 69% 66% N ew Applications Renewal Applications DESIGNATED CAREGIVER APPLICATION INFORMATION 60 20 120 100 40 80 140 0 2019 2020 2021 2022 2023 N ew Applications Renewal Applications QUALIFYING PATIENT APPLICATION INFORMATION 60 20 120 100 40 80 140 0 2019 2020 2021 2022 2023 N ew Applications Renewal Applications AGENT APPLICATION INFORMATION 60 20 120 100 40 80 140 0 2019 2020 2021 2022 2023 NUMBER OF QUALIFYING PATIENT REGISTRY IDENTIFICATION CARDS Qualifying Patients 8,000 4,000 6,000 10,000 0 2,000 MAR‘19JUN‘19SEP‘19DEC‘19MAR‘20JUN‘20SEP‘20DEC‘20MAR‘21JUN‘21SEP‘21DEC‘21MAR‘22JUN‘22
North
North Dakota cont.
DEBILITATING MEDICAL CONDITIONS SELECTED BY HEALTH CARE PROVIDERS FOR REGISTERED QUALIFYING


MEDICAL MARIJUANA EXPENSES AND REVENUE 2017-2019 Biennium 2019-2021 Biennium 2021-2023 Biennium Salaries and Wages $633,819 $907,214 $1,005,742 Operating $452,357 $347,118 $603,916 Total Expenses $1,086,176 $1,254,332 $1,609,658 General Funds $677,064 $0 $0 Special Funds $409,112 $1,254,332 $1,609,658 Medical Marijuana Fees $1,023,300 $1,874,374 $2,114,824 REGISTERED QUALIFYING PATIENTS BY COUNTY (AS OF JUNE 30, 2022) Cass 23% Ward 14% Burleigh 11% Grand Forks 9% Williams 6% All other counties 37% PATIENT POPULATION BY AGE
OF JUNE 30, 2022 10% 0% 25% 20% 5% 15% 30% 30-39 40-49 50-59 60-69 20-29 O ther
SOURCE:
NORTH DAKOTA HEALTH & HUMAN SERVICES
AS
PATIENTS JUNE 30,2022 Anxiety Disorder PTSD Spinal Stenosis or Chronic Back Pain Chronic or Debilitating Disease or Medical Condition Severe Debilitating Pain Migraine Fibromyalgia Neuropathy All Other Conditions
Ohio
Program Update by the Numbers
23 level 1 provisional licenses
21 provisional licenses have received certificates of operation
14 level 2 provisional licenses
13 provisional licenses have received certificates of operation
Dispensaries
101 certificates of operation
34 active provisional dispensary licenses Patients & Caregivers (as of 7/31/2023)


800,682 recommendations (a patient may have multiple recommendations)
384,705 registered patients (historical)
22,670 patients with veteran status
23,682 patients with indigent status
1,357 patients with terminal diagnosis
178,709 patients with both an active registration and an active recommendation
303,997 unique patients who purchased medical marijuana (as reported to OARRS by licensed dispensaries
36,470 registered caregivers Physicians (as of 8/10/2023)
650 certificates to recommend

Processors
46 provisional licenses
44 provisional licenses have received certificates of operation
OHIO MEDICAL MARIJUANA HISTORICAL SALES DATA Q2 2023 (COMPOUNDING SALES DATA) Date Plant Material (pounds) Manufactured Product (units) Total Products Sales Plant Sales Average (per gram) Manufactured Sales Average (per unit) April 30th 2023 161,760 15,063,714 $1,294,544,024 $6.77 $32.62 May 29th 2023 168,045 15,622,312 $1,331,267,179 $6.55 $31.11 June 26th 2023 174,574 16,194,496 $1,367,405,998 $6.28 $30.38 July 31st 2023 183,114 16,944,430 $1,413,601,360 $6.07 $29.68 August 21st 2023 188,435 17,397,125 $1,441,380,835 $6.04 $28.97
SOURCE: OHIO MEDICAL MARIJUANA CONTROL PROGRAM
SOURCE: OKLAHOMA MEDICAL MARIJUANA AUTHORITY
The OMMA has accepted 136,838 licenses:
130,288 patients

1,022 caregivers
5,528 business

The OMMA has approved a total of 135,219 licenses:
129,085 patients
818 caregivers
3,026 growers
1,479 dispensaries
Oklahoma
FISCAL YEAR 2022-2023 (CUMULATIVE AMOUNTS) Jul. ‘22 Actual Aug. ‘22 Actual Sept. ‘22 Actual Oct. ‘22 Actual Nov. ‘22 Actual Dec. ‘22 Actual Jan. ‘23 Actual Feb. ‘23 Actual Mar. ‘23 Actual Apr. ‘23 Actual May. ‘23 Actual Jun. ‘23 Actual Medical Marijuana Excise Tax $4,735,858 $8,943,341 $13,503,803 $17,680,164 $22,020,197 $26,335,350 $30,527,824 $35,017,744 $39,304,722 $43,388,581 $44,258,050 $48,643,897 MM Commercial License $2,339,125 $8,473,580 $12,749,969 $15,159,446 $18,011,900 $20,572,542 $23,158,790 $22,630,665 $24,321,780 $26,089,305 $27,430,040 $29,011,975 MM License $1,508,531 $2,526,055 $3,615,215 $4,759,850 $5,719,810 $6,605,810 $7,548,790 $11,280,512 $12,465,612 $14,062,812 $19,032,585 $20,605,805 Total $8,583,514 $19,942,976 $29,868,987 $17,680,164 $45,751,907 $53,513,702 $61,234,926 $68,928,921 $76,092,114 $83,540,698 $90,720,675 $98,261,677
GENERAL LEDGER MONTHLY SUMMARY 20M 10M 0M 40M 30M Dollars JUL ‘22 AUG ‘22 SEP ‘22 OCT ‘22 NOV ‘22 DEC ‘22 JAN ‘23 FEB ‘23 MAR ‘23 APR ‘23 MAY ‘23 JUN ‘23 FISCAL YEAR 2022-2023 (CUMULATIVE AMOUNTS) Jul. ‘22 Actual Aug. ‘22 Actual Sept. ‘22 Actual Oct. ‘22 Actual Nov. ‘22 Actual Dec. ‘22 Actual Jan. ‘23 Actual Feb. ‘23 Actual Mar. ‘23 Actual Apr. ‘23 Actual May. ‘23 Actual Jun. ‘23 Actual Medical Marijuana Excise Tax $4,735,858 $8,943,341 $13,503,803 $17,680,164 $22,020,197 $26,335,350 $30,527,824 $35,017,744 $39,304,722 $43,388,581 $44,258,050 $48,643,897 Total $4,735,858 $8,943,341 $13,503,803 $17,680,164 $22,020,197 $26,335,250 $30,527,824 $35,017,744 $39,304,722 $43,388,581 $44,258,050 $48,643,897 Medical Marijuana Excise Tax OKLAHOMA GENERAL LEDGER MONTHLY SUMMARY 40M 20M 0M 80M 60M Dollars JUL ‘22 AUG ‘22 SEP ‘22 OCT ‘22 NOV ‘22 DEC ‘22 JAN ‘23 FEB ‘23 MAR ‘23 APR ‘23 MAY ‘23 JUN ‘23 MM License Medical Marijuana Excise Tax MM Commercial License
WHOLESALE


MARKET SHARE BY PRODUCT TYPE, ALL CUSTOMER TYPE (OCT. 2016-JULY 2023)

Oregon SOURCE: OREGON LIQUOR AND CANNABIS COMMISSION MEDIAN RETAIL PRICE PER GRAM $40 $20 $30 $50 0 $10 2017 2018 2019 2020 2021 2022 2023 Median Price Per Gram Extract/Concentrate Usable MJ
USABLE MJ) 2017 2018 2019 2020 2021 2022 2023 Median Wholesale Price $12,000 $8,000 $10,000 $14,000 $0 $6,000 $4,000 $2,000 SALES $80M $40M $60M $100M $0M $20M 2017 2018 2019 2020 2021 2022 2023 Sales
(EXTRACT/CONCENTRATE &
USABLE MJ CONCENTRATE/EXTRACT EDIBLE/TINCTURE INHALABLE PRODUCT OTHER Extract/Concentrate Usable MJ
Pennsylvania


 SOURCE: MJBIZ DAILY


Senator Dan Laughlin and Sharif Street have introduced a bipartisan approach, known as Senate Bill 846, to legalize marijuana in Pennsylvania. Their proposal centers around establishing a regulated market for adult-use cannabis, with a strong emphasis on public safety, social equity, and economic growth. The legislation encompasses key provisions related to licensing, taxation, and expungement of past marijuana offenses. The bipartisan effort aims to garner support from both political parties and respond to the increasing public backing for cannabis legalization in the state. If passed, the bill would allow adults aged 21 and older to possess up to 30 grams of flower or 1,000 milligrams of edibles, levy a 5% excise tax on adult-use sales, and enable medical marijuana patients to cultivate cannabis at home.


Rhode Island
MONTH CULTIVATOR TO COMPASSION CENTER SALES ($) CULTIVATOR TO COMPASSION CENTER SALES (G) CULTIVATOR TO COMPASSION CENTER SALES (LBS) RETAIL SALES (TOTAL) RETAIL SALES (MEDICAL) ACTIVE PATIENT COUNT RETAIL SALES (RECREATIONAL) AVG. SALES RECEIPTS DEC ‘22 $1,139,942.42 300,732 663 $7,395,989.02 $3,987,523.93 15,062 $3,408,464.84 $32.19 JAN ‘23 $1,264,665.50 387,821 855 $7,384,697.00 $3,881,843.92 14,590 $3,505,853.08 $31.01 FEB ‘23 $1,220,864.45 333,844 736 $7,443,218.55 $3,185,842.26 14,673 $4,257,394.41 $30.61 MAR ‘23 $2,213,956.77 234,961 518 $8,741,428.95 $3,359,873.02 13,691 $5,381,556.56 $30.07 APR ‘23 $1,729,156.93 188,241 415 $8,421,924.28 $2,959,442.26 12,956 $5,392,693.68 $30.08 MAY ‘23 $2,083,913.12 70,760 156 $8,892,593.99 $2,979,828.99 12,480 $6,037,183.97 $25.55 JUN ‘23 $2,877,986.35 307,536 678 $9,170,619.08 $2,768,840.24 11,963 $6,401,678.67 $26.23 JUL ‘23 $2,668,244.18 295,289 651 $9,465,617.47 $2,713,023.61 11,689 $6,753,464.17 $25.12 MONTH CONCENTRATES EDIBLES INFUSED NON-EDIBLE PRE-PACKAGED BUD RAW PRE ROLLS INFUSED PRE ROLLS TINCTURES TOPICALS VAPE CART JAN ‘23 9,884 47,994 2,155 138,522 80,658 5,319 1,162 744 24,747 FEB ‘23 9,415 48,114 1,529 147,446 79,568 8,652 894 815 23,329 MAR ‘23 11,833 57,923 1,707 155,076 98,943 8,624 1,109 875 13,680 APR ‘23 11,430 63,597 1,391 166,615 119,949 6,637 989 864 38,119 MAY ‘23 11,680 60,879 1,607 172,261 131,086 7,117 1,074 740 40,901 JUN ‘23 12,725 65,711 1,514 169,590 146,997 10,442 1,007 751 46,696 JUL ‘23 12,536 72,016 1,709 186,647 160,333 15,211 936 976 47,901
SOURCE: STATE OF RHODE ISLAND DEPARTMENT OF BUSINESS REGULATION
South Dakota


SOURCE: SDSTATE & MEDICAL CANNABIS IN SOUTH DAKOTA

Data as of August 21st, 2023:

Approved Practitioners: 231

Approved Patient Cards: 11,534
Dispensaries: 94
Recreational marijuana has been a prominent issue in recent election cycles, garnering significant attention. In 2020, the electorate approved a measure to legalize recreational marijuana with a 54-46 majority. However, the state Supreme Court nullified the measure on procedural grounds. Activists made another attempt in 2022, but the measure fell short with a 53-47 vote.

Now, there are indications that a third attempt may be pursued in 2024. Advocates for reform point to lower turnout rates during midterm elections as a potential factor contributing to their previous electoral setbacks. In 2020, the statewide turnout reached 427,529, representing a high 73.9% turnout rate. However, in 2022, only 354,670 ballots were cast, resulting in a lower 59.4% turnout rate. These differing electorates could have played a role in the outcomes. Regardless of the reasons behind the previous failures, it is evident that the state remains divided on this issue, and its resolution is far from settled.
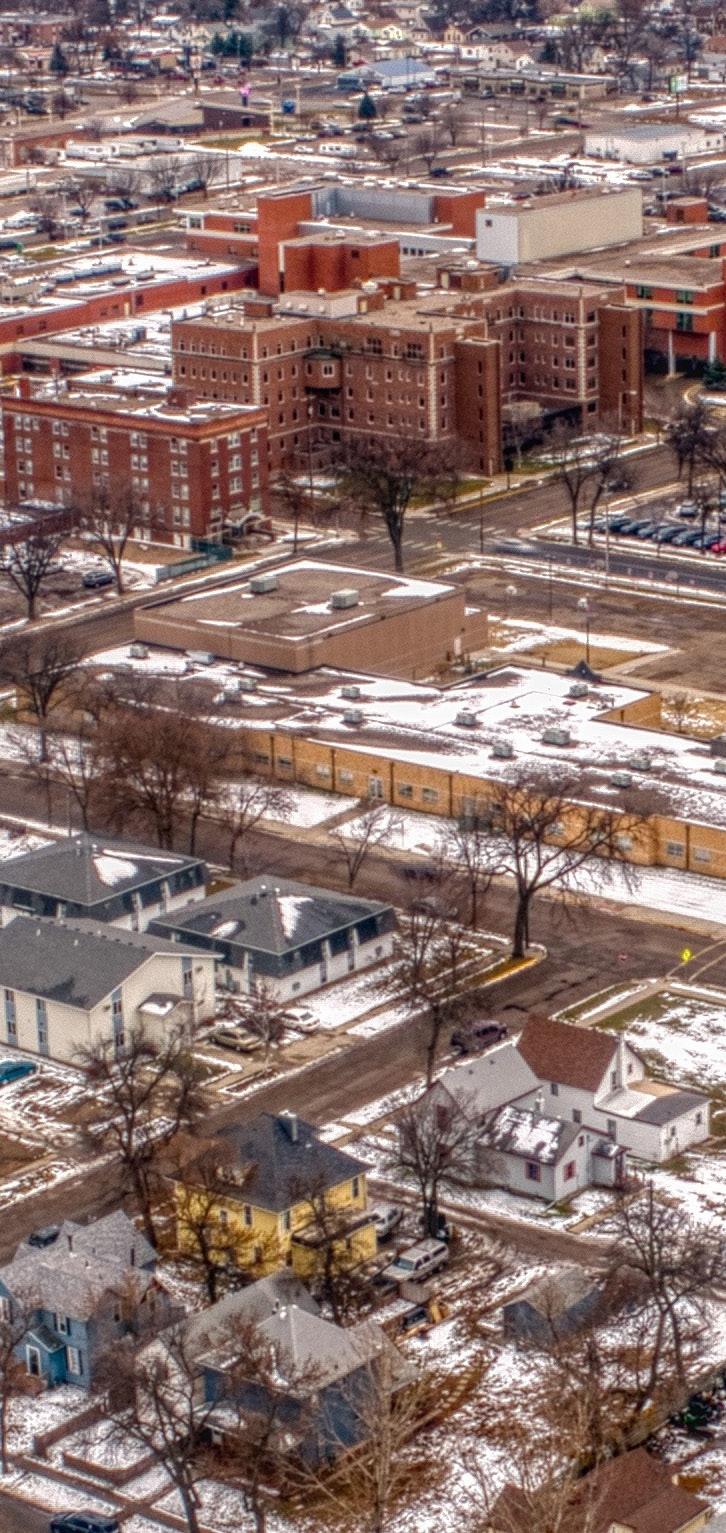
SOURCE: UTAH DEPARTMENT OF HEALTH & HUMAN SERVICES CENTER FOR MEDICAL CANNABIS


Utah
SALE BY TYPE (MARCH 2020-JUNE 2023) Category Inventory Quantity Net Sales Cartridges/Pens 2,040,115 109,735,266.96 Concentrate 10,081 846,479.81 Flower 2,197,254 97,841,567.75 Infused Edible 1,797,160 62,143,259.53 Infused Non-Edible 65,697 3,518,290.63 Non Medicated 265,458 4,425,322.72 UTAH MEDICAL CANNABIS SALES Quarter Gross Sales Total Discounts Order Count Net Sales Q2 2020 $3,588,062.97 $49,163.08 25,665 $3,538,899.89 Q3 2020 $7,535,623.36 $209,338.84 54,960 $7,326,287.52 Q4 2020 $11,783,820.38 $712,682.50 85,718 $11,071,013.69 Q1 2021 $13,863,820.38 $814,801.42 99,433 $13,049,199.96 Q2 2021 $18,229,824.99 $1,462,710.36 126,422 $16,768,855.49 Q3 2021 $23,144,812.23 $2,784,358.55 161,752 $20,373,913.24 Q4 2021 $27,576,667.11 $3,004,411.85 192,123 $24,574,426.41 Q1 2022 $29,154,611.34 $2,826,924.47 204,838 $26,329,529.78 Q2 2022 $33,270,243.66 $4,118,100.46 235,145 $29,154,293.72 Q3 2022 $34,583,189.81 $4,319,253.87 256,326 $30,265,276.21 Q4 2022 $38,348,784.83 $5,391,336,69 283,935 $32,958,525.94 Q1 2023 $39,238,936.19 $5,075,597.09 297,192 $34,164,194.43 Q2 2023 $41,448,912.81 $5,950,817.99 320,402 $35,499,966.90
Virginia





SOURCE: ABC 8 NEWS
Virginia’s plans for retail marijuana sales by 2024 have been dealt a setback as the last remaining bill to establish a legal market failed to pass. In a party-line vote of 5-3, a Republican-controlled House of Delegates subcommittee rejected the legislation proposed by Senator Adam Ebbin. The bill aimed to enable recreational sales to commence in January 2024, allowing retail transactions through medical cannabis dispensaries and businesses owned by individuals from historically disadvantaged communities.


Currently, Virginians aged 21 and over can possess up to one ounce of cannabis or grow up to four plants at home. While medicinal marijuana can be purchased with a prescription, there is no legal means for adults to buy it for recreational use. The 2021 bill that permitted marijuana possession included a provision for the General Assembly to reapprove the measure and establish a regulatory framework for retail sales. However, efforts to develop this framework have faced delays in the legislature since Republicans gained control of the House of Delegates and Governor Glenn Youngkin assumed office.

SOURCE: WASHINGTON STATE LIQUOR AND CANNABIS BOARD


WASHINGTON CANNABIS RETAIL SALES AND EXCISE TAX BY COUNTY (FISCAL YEAR 2022)

Washington
County Total Sales Excise Tax Adams $2,004,027.07 $741,490.03 Asotin $14,165,353.62 $5,241,326.16 Benton $39,960,616.33 $14,785,879.89 Chelan $14,002,373.31 $5,180,879.89 Clallam $15,545,166.91 $5,751,715.98 Clark $83,897,808.73 $31,044,099.28 Columbia $918,753.84 $339,938.92 Cowlitz $24,571,224.27 $9,091,402.79 Douglas $5,147,580.00 $1,904,604.61 Ferry $1,391,976.61 $515,031.35 Grant $14,831,812.53 $5,565,251.73 Grays Harbor $18,398,900.38 $6,807,601.05 Island $12,995,594.70 $4,808,470.45 Jefferson $6,251,373.07 $2,313,020.74 King $356,142,216.32 $131,778,383.59 Kitsap $45,681,133.98 $16,902,026.20 Kittitas $9,519,911.15 $3,522,367.16 Klickitat $2,416,791.23 $894,228.29 Lewis $8,822,255.04 $3,264,288.32 CONT. County Total Sales Excise Tax Lincoln $1,391,402.80 $514,923.17 Mason $14,040,035.28 $5,194,813.09 Okanogan $7,891,402.80 $2,919,822.21 Pacific $4,989,181.05 $1,845,996.99 Pend Oreille $1,164,932.49 $431,025.01 Pierce $167,926,645.61 $62,133,054.32 San Juan $3,558,446.84 $1,327,728.20 Skagit $26,537,551.36 $9,818,894.02 Skamania $1,375,427.46 $508,908.17 Snohomish $142,704,810.49 $52,801,164.16 Spokane $151,694,468.59 $56,127,392.11 Stevens $7,678,767.97 $2,841,144.17 Thurston $68,219,982.36 $25,241,442.54 Wahkiakum $604,750.56 $223,757.70 Walla Walla $10,330,449.42 $3,82,363.65 Whatcom $43,790,263.81 $16,202,535.47 Whitman $12,684,765.54 $4,693,363.25 Yakima $33,121,229.04 $12,254,917.57 TOTAL $1,376,399,663.93 $509,354,815.02
WEST VIRGINIA





SOURCE: OFFICE OF MEDICAL CANNABIS West Virginia omc stats AT A GLANCE PATIENT APPLICATIONS RECEIVED 32,897 PATIENTS APPROVED 26,555 REGISTERED PHYSICIANS 132 ACTIVE TELEMEDICINE COMPANIES 18 OPERATIONAL GROWERS 8 OPERATIONAL DISPENSARIES 53 OPERATIONAL PROCESSORS 7 TOTAL SALES $66,221,497 POUNDS SOLD 10,988 UNITS SOLD 1,339,067 PLANTS ACTIVELY GROWING 15,438
*The medical cannabis industry supports approximately 2000 jobs in west Virginia through direct and indirect employment*


YOUR MATTHEWS™ REPRESENTATIVES ALEXANDER MACHADO Associate (305) 359-5207 alexander.machado@matthews.com Lic No. SL3507121 (FL) DANIEL GONZALEZ Senior Associate (305) 395-6972 daniel.gonzalez@matthews.com Lic No. SL3463209 (FL) ROBERT GOLDBERG Senior Associate (954) 237-4510 rob.goldberg@matthews.com Lic No. 2018005194 (OH) BEN SNYDER Executive Vice President & National Director (216) 503-3607 ben.snyder@matthews.com Lic No. 2018002569 (OH) Please contact a Matthews™ specialized agent for more information. DISCLAIMER : This information has been produced by Matthews Real Estate Investment Services™ solely for information purposes and the information contained has been obtained from public sources believed to be reliable. While we do not doubt their accuracy, we have not verified such information. No guarantee, warranty or representation, expressed or implied, is made as to the accuracy or completeness of any information contained and Matthews Real Estate Investment Services™ shall not be liable to any reader or third party in any way. This information is not intended to be a complete description of the markets or developments to which it refers. All rights to the material are reserved and cannot be reproduced without prior written consent of Matthews Real Estate Investment Services™.


 SOURCE: TALK BUSINESS


 SOURCE: GREEN MARKET REPORT


 SOURCE: MARIJUANA MOMENT


 SOURCE: CANNABIS BUSINESS TIMES


 SOURCE: MJBIZ DAILY


 SOURCE: MJBIZ DAILY


