Draft Manning River Catchment and Estuary and Catchment Management Program 2021-2031 - Main document

Page 51

Figure 14: Program Logic Model

GOAL

“The Manning River, its tributaries and the estuary give life to our community connecting the mountains to the sea. Together w manage the catchment holistically and respond to a changing climate - safeguarding environmental, social, cultural and economic values.”

ULITIMATE OUTCOMES 50years

Manning catchment, river, estuary and marine receiving waters are healthy and resilient.

INTERMEDIATE OUTCOMES 10years (2030)

Improved land management practices reduce pressures on ecosystem health and resilience

SHORT-TERM OUTCOMES 5years (2025)

Evidence-based science informs ongoing management of the catchment and estuary.

ACTIVITIES

ACTIVITIES

FOUNDATION ACTIVITIES

WQ and Ecosystem Health actions Biodiversity actions Land-use Planning actions WQ & Ecosystem Health MER

Science program

Literature review, gap analysis, Threat and risk assessment Issue analysis

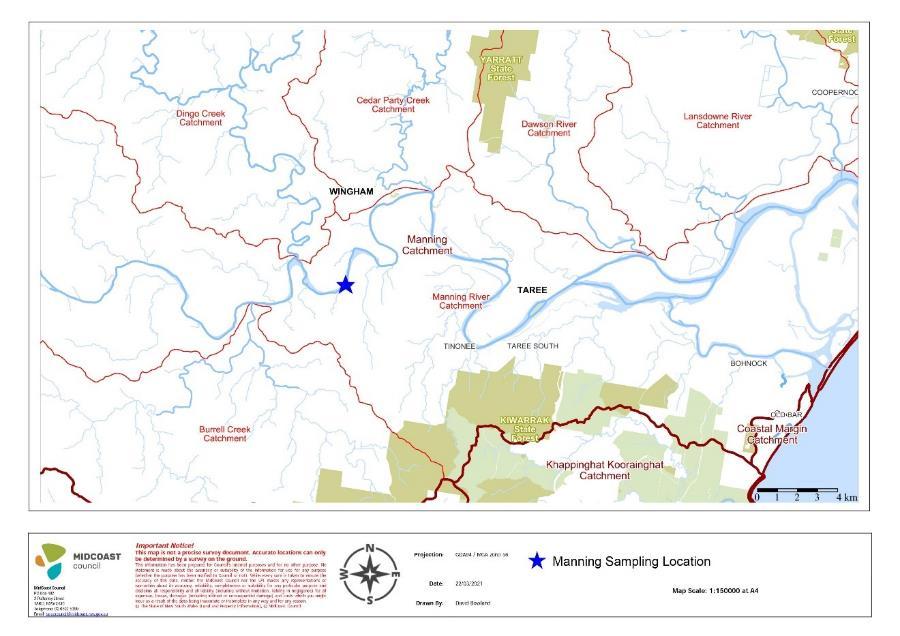
Manning River ECMP Exhibition Draft V2 June 2021

The connection between river ecosystem health, a sustainable economy and a healthy community is widely understood, valued and supported

The community adopts sustainable behaviours and best practice for land and water management Improved community understanding and commitment to catchment values, function and stewardship. Stewardship program in place. Stewardship actions Aboriginal Custodianship actions Economic and Social Values actions Stakeholder engagement

Confirm strategic direction

Stakeholder analysis Engagement Strategy

Cohesive NRM management, continuous improvement and partnerships are “business as usual” in the Manning catchment. CMP is implemented with strong partnerships between responsible agencies.

M&E provides feedback and learning

Governance actions ECMP Monitoring, Evaluation and Reporting (MER)

Establish project team and governance Page 39


Turn static files into dynamic content formats.

Create a flipbook

Articles inside

Figure 39 MidCoast Council Organisational Structure

4min
pages 194-196

Appendix 6: MCC land-use strategies aligned to the CM SEPP objectives

8min
pages 186-192

Implementation Streams

10min
pages 197-203

Appendix 2: The Public Participation Spectrum

0
page 167

13. Bibliography

4min
pages 162-164

12. Proposed amendments to the CM SEPP

3min
pages 160-161

11.3 The Manning River ECMP Research Program

3min
pages 158-159

11.1 MERI for the Manning River, Estuary and Catchment

4min
pages 148-151

7. Management Actions

4min
pages 106-108

6.15 Systems thinking: the interaction between issues

1min
page 105

10. Coastal Zone Emergency Sub-Plan

1min
page 146

6.13 Sewerage and Septic System Pathogens

2min
page 102

Figure 33: The Manning River floodplain, 20 March 2021

5min
pages 98-101

Figure 32: Cattle on the riverbank is a common sight

10min
pages 91-97

Table 4: Key impacts associated with water pollution from diffuse-source runoff

1min
page 90

Figure 25: Estuary with negative impacts vs well-managed estuary

1min
pages 78-79

Figure 27: Cattai Wetlands

1min
pages 84-85

Figure 26: Conceptual diagram of the Greenhouse Effect

6min
pages 80-83

Figure 24: The relationship between activities, stressors and ecological impacts

0
page 76

Figure 22: Risk ratings for sediment and nutrient loading in drainage units

2min
pages 70-71

Table 2: Subcatchments posing the highest risk to ecological and community values

1min
page 69

Figure 21: Stock intensity in the catchment

1min
page 65

Figure 18: Manning River TN and TP readings from 2015-18

0
page 62

Figure 17: The sampling location for water quality data

1min
page 61

Figure 9: The Integrated Planning and Reporting Framework

2min
pages 31-32

Figure 15: National Parks make up18.5% of the Manning catchment

2min
pages 58-59

Figure 14: Program Logic Model

9min
pages 51-57

Figure 12: Values our community ascribed to each subcatchment

10min
pages 41-49

Figure 11: The consultation program

2min
pages 38-40

Figure 16: Water quality monitoring sites in the estuary

1min
page 60

Figure 10: Option for the Manning River ECMP Governance Structure

7min
pages 33-37

Figure 7: The five stages of a Coastal Management Program

2min
pages 26-29
Issuu converts static files into: digital portfolios, online yearbooks, online catalogs, digital photo albums and more. Sign up and create your flipbook.