7 minute read
UK HSE offshore safety report for 2018


The Offshore Statistics & Regulatory Activity Report for 2018 from the UK Health & Safety Executive (HSE) has shown that most safety trends in offshore oil & gas and wind operations have continued to improve. 2018 was the second consecutive year without a fatality and the longer-term rolling reportable non-fatal injury rate continues to fall on the UK Continental Shelf.
One possible cause for concern is the rate of hydrocarbon releases (HCRs) which stagnated in 2018, after having risen slightly in 2017. While industry continues to look for ways to curb HCRs, there is a possible risk that progress is now stalling after steady improvement year-on-year between 2010-15.
Advertisement
The Offshore Statistics & Regulatory Activity Report provides details of offshore injuries, dangerous occurrences and ill health reported to HSE under the Reporting of Injuries, Diseases and Dangerous Occurrences Regulations (RIDDOR), and the HSE’s regulatory activity offshore during 2018. The data in this report is a frozen, validated snapshot of operational information from HSE systems, and is published as Official Statistics.
Wherever possible, data is based on a calendar year. Data for the most recent year is marked as provisional to allow for minor adjustments to be made when they are released as final in the subsequent annual report. This may be necessary if there are, for example, late reports or corrections. In practice, such changes are infrequent and would usually make a negligible difference to the numbers.
The RIDDOR data includes incidents occurring on offshore installations, offshore wells and activities in connection with them, offshore pipelines, pipeline works and certain activities in connection with pipeline works, and offshore diving operations.
The Offshore Statistics & Regulatory Activity Report does not include incidents arising from marine activities that are not directly connected with offshore operations (e.g. vessels or rigs in transit). The Maritime and Coastguard Agency (MCA) has primary responsibility for maritime safety. The report also excludes air transport activities (including transport to, from or between installations), except incidents involving
safety report for 2018

helicopters whilst on an offshore installation. The Civil Aviation Authority (CAA) has responsibility for aircraft flight safety.
Industry profile
The UK offshore industry operates the Vantage personnel tracking system, which records the number of nights of Persons on Board (PoB). Details can be found at www.logic-oil.com/vantagepob. Using this information, it can be determined that in 2018, 4.8 million days were spent offshore.
It is estimated that there was an offshore population of 29,000 full time equivalent (FTE) workers in 2018, compared to 29,700 in 2017 and 30,400 in 2016.
FTE is based on the assumption that each shift on average lasts 12 hours, and an FTE worker works 2000 hours annually: FTE = Total PoB Nights x 12 ÷ 2000
The assumption that a full time equivalent works 2000 hours a year is based on what other regulators do, in particular the Occupational Safety and Health Administration (OSHA).
All reported injuries
RIDDOR data for the period 2007/08 to 2012/13 is based on fiscal year (AprilMarch). Data from 2012 onwards is based on calendar year (January-December). Furthermore, several changes to the reporting system and legal requirements have occurred over recent years, making comparisons difficult with previous data.
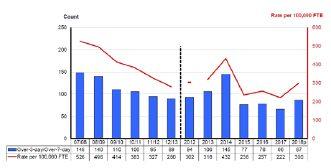
The key findings regarding reported injuries for 2018 are that there were a total of 106 injuries reported under RIDDOR, with a rate of 365 injuries per 100,000 FTE and there were no fatal injuries (see Figure 1). While there have been three fatalities in the last five years and six in the last 10 years, 2018 was the second consecutive year without a fatality.
Major/Specified injuries
There were 19 specified injuries reported, a similar number to the previous two years. The rate was 66 per 100,000 FTE workers in 2018, compared to 61 per 100,000 in 2017 and 63 per 100,000 in 2016.
Over-3-day/Over-7-day injuries
In April 2012, the legal requirement to report injuries to workers resulting in more than three days absence (’over-3-day’) changed to ‘over-7-day’.
The key points for 2018 (see Figure 2) were: • There were 87 over-7-day injuries reported, compared to 66 in 2017 • The rate was 300 injuries per 100,000
FTE workers, compared to 222 in 2017
The nature of the injuries reported in 2018 included: • Fractures (accounted for nearly 90% of specified injuries reported (17 of 19) • Sprains and strains (accounted for 32% of over-7-day injuries reported (28 of 87) • Upper limb accounted for 50% of all injuries reported (53 of 106) Lower limb accounted for 26% of all injuries reported (28 of 106) In total, injuries to limbs accounted for all 19 of the specified injuries and 71% of over-7-day injuries (62 of 87) Slips, trips or falls on same level were the most common injury type and accounted for 25% of all injuries reported (26 of 106). This was followed by handling, lifting or carrying (22%; 23 of 106) and striking against something fixed or stationary (17%; 18 of 106)
Dangerous occurrences
As part of the changes introduced in October 2013 following a full-scale review of RIDDOR, many defined dangerous occurrence (DO) categories changed ‘type number’ as well as description. In 2018, there were 235 DOs reported, compared to 217 in 2017 (and 249 in 2015); longerterm analysis of the trend in reported DOs is complicated by the above change.
Hydrocarbon releases accounted for over a third of the DOs reported under RIDDOR (41%; 96 of 235), while the number of reported wells DOs is the same as last year having previously been decreasing steadily.
While the number of hydrocarbon releases reported under RIDDOR increased in 2018, the grand total was similar to last year as there was a smaller number reported under EU Offshore Directive arrangements (see Figure 3).
Hydrocarbon releases
HCRs are classified as ‘Minor’, ‘Significant’, or ‘Major’ on the basis of their severity; these definitions have been agreed with the offshore industry. By combining incident and population data, estimates of the frequency of loss of containment incidents for equipment and system types can be determined.
The HCR release rate is based on the level of production in million barrels of oil equivalent per day (boe/d) reported by OGUK; latest data is available at https:// oilandgasuk.co.uk/product/businessoutlook-report.
As a result of the new EU Commission Implementing Regulation No. 1112/2014,
some of HSE’s voluntary notification scheme became mandatory. As such, from July 2015, some non-process HCRs were allocated severity classifications again and by July 2017 all non-process HCRs were classified.
Since the introduction of the ROGI (‘Reporting of Oil and Gas Incidents’) form, all non-process HCRs (e.g. heli fuel and diesel spills) reported under the EU Offshore Directive arrangements are classified in the same way and against the same criteria as process HCRs.
Key points for 2018: • 16 of a total 112 HCRs were reported solely under the EU Offshore Directive arrangements, i.e. they did not meet the criteria to be reportable under RIDDOR. • The HCR release rate has fluctuated over the past 10 years but has increased slightly in each of the last two years. • Non-process HCRs account for over 30% of HCR figures for 2016 to 2018, higher than in previous years. • There were 4 Major HCRs during 2018, the most in a single year since 2013 (see
Figure 4).
Regulatory activity
HSE’s regulatory programme for the offshore industry seeks to ensure major hazard and personal risks are properly managed in compliance with legislative requirements. Where appropriate, HSE will
Figure 1 – All reported injuries (offshore), 2007/08 – 2018

Figure 2 – Reported over-3-day/over-7-day injuries (offshore), 2007/08 – 2018
take formal enforcement action to prevent harm and secure justice in line with its Enforcement Policy.

Key regulatory activities are assessing safety cases, inspecting installations, investigating incidents, following up concerns, identifying non-compliance issues, and formal enforcement. Data on regulatory activity covers the last seven-year period from 2012 to 2018.
Key points for 2018: • ED Offshore assessed 134 Safety Case
Submissions; similar to the previous year. Figures have been higher since the introduction of the 2015 Safety
Case Regulations. • ED Offshore undertook 126 planned offshore inspections at 111 offshore installations, the lowest • number in the last seven years. • ED Offshore completed 35 investigations, higher than the previous year having previously been decreasing year on year. • ED Offshore followed up 22 health and safety concerns; higher than in the previous year but still much lower than at any point in the five-year period before that. • ED Offshore identified 1257 noncompliance issues • There were 30 improvement notices and two prohibition notices issued • There was one case instituted, following a serious injury to an employee attempting to change a compressed gas cylinder. The employee was struck by the cylinder when it became a projectile following an instantaneous release of its contents.
To see the HSE’s full report, visit: https:// www.hse.gov.uk/offshore/statistics/ hsr2018.pdf
Figure 3 – Reported dangerous occurrences (offshores), 2007/08 - 2018

Figure 4 – Hydrocrabon releases (offshore), 2007-2018
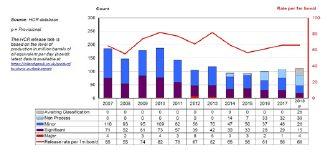

Figure 5 – Offshore Topic Inspection Scores – Overview, 2017 and 2018