Automation of building information modelling process of sanitary drainage system with Dynamo
Jing
Ting Jamie Chua and Moshood Olawale Fadeyi,*
Sustainable Infrastructure Engineering (Building Services) Programme, Singapore Institute of Technology, 10, Dover Drive, Singapore 138683, Singapore
*Corresponding author’s email: fadeyi.moshood@singaporetech.edu.sg
ABSTRACT
This project aims to design an adoptable solution that improves the quality of work and increases work productivity for the modelling of inspection chambers, waste sumps and manholes, and their pipe connections in Revit. Existing workflows and design requirements of the sanitary discharge system at a consultancy firm were analysed. Since the project aims to address a practical problem, the mixed-methods research (MMR) overall approach was employed for this study. The MMR was conducted across four phases with different data collection and analysis approaches. Phase 1 involves understanding existing workflows and the design requirements of the sanitary discharge system the existing Dynamo workflow used at the consultancy firm managed to generate pipe connections. Phase 2 involves evaluating the performance and user experience of existing workflows. Phase 3 involves the creation and development of the solution. Phase 4 involves evaluating the performance and adoptability of the solution – the new Dynamo workflow. The new Dynamo workflow developed in this study provided users a better work experience than the existing modelling workflows. The new Dynamo workflow significantly reduced labour hours required for completing the given modelling tasks accurately.
Keywords: Design Productivity, Dynamo workflow, Buildinginformation modelling, Design management, ComputationalBIM
1.0 INTRODUCTION
A major component of the plumbingandsanitarysystem that requires rework is the sanitary drainage system. It removes wastewater, water no longer suitable for use, out of the building to prevent flooding andreduce sewer odor. The system involves a networkof drain pipelines,
2
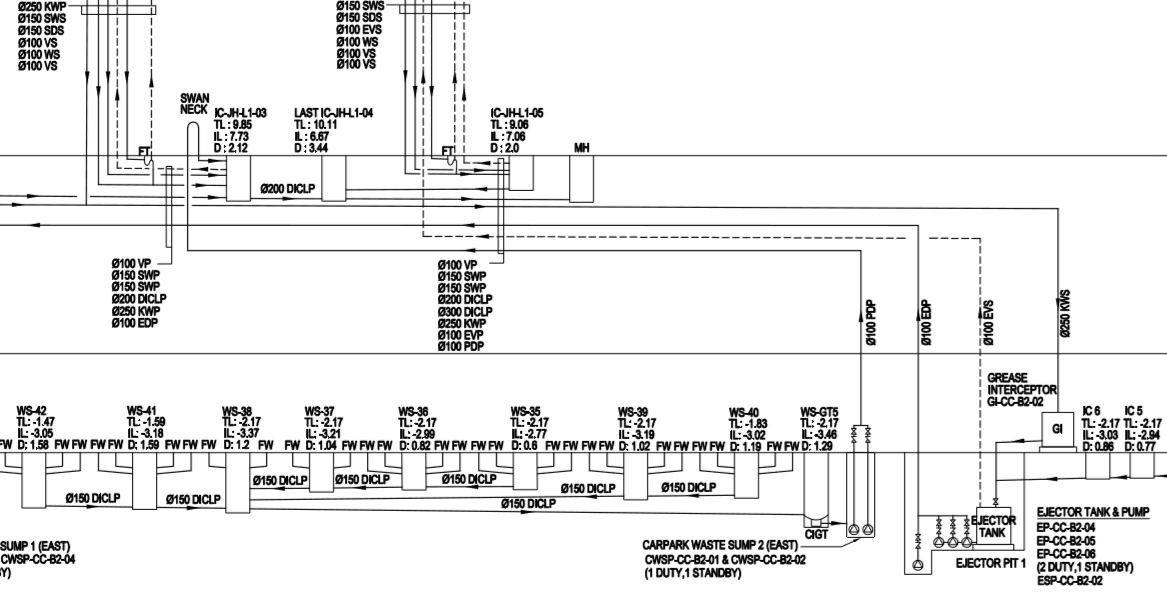
floor traps, floor wastes, waste sumps, inspection chambers, grease traps from food establishments, gully traps,manholes,carparkwastesumpsandejectorpits.Anillustrationof connections from the sanitaryplumbingtothesanitarydrainagesystemisprovidedinFigure1 toaidinthedescription ofhowthetwosystemsoperate.
Figure1:Schematicconnectionsfromriserstobasementdrainagesystem
Thesanitarysysteminvolvesconnectionstosanitaryappliancessuch aswater closets, urinals, washbasins, baths and showers. Soil waste pipes carrying soiled water from toilets and waste pipes carrying water from floor drains such as floor traps and floor wastes would bedirected into vertical soil waste stacks and waste stacks found in risers. Wastewater flowing through the main discharge stacks would then enter inspection chambers located at the basement or ground level. At this stage, the sanitary system is considered to be connectedtothesanitary dischargesystem.
Wastewaterfrominspectionchambersatthebasementlevelwouldentertheejectortank found inanejectorpit.Theejectorpumpswouldthendirectthewastewatertoconnectingground level inspection chambers. It is to note that waste sumps located at the basement level are connectedsolelytofloordrainsunlikeinspectionchamberswhichmaybeconnectedtothemain discharge stacks foundin risers and gully trap from the bin center. Pipes from waste sumps at the basement level would enter a grease trap, removing any grease that may have entered the floordrains.Theywouldthenenterlargercarparkwastesumpsthroughdrainpipelinesandthe wastewater would be pumped to ground level inspection chambers by pumps found in the
3
carparkwastesumps.Groundlevelinspectionchambersarefinallydirectedtoamanholeoutside thebuilding.
At a consultancy firm, the design stage consists of a design process where mechanical, electrical,andplumbing(MEP)engineers are responsible for designing the sanitary drainage system according to design requirements while modellers are responsible for building two dimensionalorthree-dimensionalmodelsontomodellingsoftware.Inthepast,thedesignstage consists solely of the design process where multiple hardcopy drawings are submitted to the relevantauthoritiesforreview.Agrowingtrendintheconstructionindustrytousesustainable technologiessuchasbuildinginformationmodelling (BIM) in many stages of the building lifecyclewas discovered.BIM,anintelligent3Dmodel-basedprocess,isusedasasolutionto improvethe planning, design, and management of infrastructures (Li et al., 2014). It is an attractive technology as it has high potential in reducing project costs and material wastage.
BIM modellers and engineers can easily identify changes to be made, make revisions and streamline repetitive tasks during the design stage (Röck et al., 2018). Other additional BIM tools such as Dynamo, a plug-in found in Revit that functions as a visual programming design tool, could be utilized as well (Nezamaldin, 2019). Despitethe multipleadvantagesof utilizing modelling software platforms, factors such as users’ competency, complexity of designanduseofsuitableadditionaltoolscontributeto thetimerequiredtomodelthesanitary discharge system. BIM professionals must constantly communicate with MEP engineers to check if models are abiding to design requirements. The internal depth of waste sumps, inspectionchambers,greasetrap,gullytrapandmanholesmust be calculated individually as it affects the internal depth of connecting components. Pipe connections modelled and aligned individually where section views must be created for visualization during this process. Ultimately, modelling the sanitary discharge system using currentmethodsisatimeconsumingprocessthatincreasesprojectcosts,reworktimeandoften result in multiple design errorsnotabidingtotheCOP.
It is important to consider not just the solution’s effectiveness in resolving errors but adoptabilityaswell.IftheRevituserperceives that Dynamo scripts would not increase their work productivity or is hard to use, no matter how effective the solution might be, it would
4
not be adopted (Batarseh and Kamardeen, 2017). The aim of this project is to design an adoptablesolutionthatimprovesthequalityofworkand increases work productivity for the modelling of inspection chambers, waste sumps and manholesandtheirpipeconnectionsin Revit.
The project addresses the effectiveness of computational BIM where algorithms are defined to increase the effectiveness of work processes. End users of the developed solution include competent Revit users in relevant working industries such as BIM professionals in consultancyfirms,educationalinstitutionssuchasstudentsorprofessorsandotherindividuals.
The number of errors, time spent, and estimated project costs generated for the modelling process using the traditional and existing Dynamo scripts would be examined. A solution wouldbedesignedtoresolvethepresentissuesandadditionalfeaturesthatimprovethequality ofwork.Thesolution’seffectivenesswouldthenbeevaluatedintermsofthenumberoflabour hoursreduced,adoptabilityandqualityascomparedtotheexistingmethods.
2.0 LITERATUREREVIEW
Inefficientprocessessuchaspoorcommunicationhaveledtonotonly highenergyconsumption butlargeamountsofresourcewastages,highprojectcostsandpoor quality of work delivered (Loveand Edwards, 2004). As a result,clientson thereceiving end would be unsatisfied due to the increasedconstruction costs,delayinprojectscheduleand unsafestructuresconstructed (Rahmanetal.,2013).
Rework was found to be a result of inefficient work processes that impacted project costs, quality and material wastage (Love and Edwards, 2004). Chidiebere and Ebhohimen (2018) conducted a study which revealed the impacts rework had on building project and organizational performance. It was discovered that rework could contribute up to 12.4% of thetotalprojectcosts.Suchadditionalcostswere six times the cost of rectifying construction failures and could have been avoided (Love and Edwards,2002a).Overtimewaspresentat bothconstructionsitesanddesignconsultancyfirms to conduct rework (Love and Edwards, 2002b). Additional manpower may be required to completetheprojectscopeandthepossible downfallofincludingotherworkersmidwayduring aproject wouldbe adecreasing qualityof work.
5
Sustainable and innovative solutions were adopted by the built environment sector to reduce theneedfor rework.BIM iscurrently consideredthe mostinnovative technology used in the built environment sector (Vilutieneetal., 2019). The multidimensionalinformationplatform integrates project data for professionals to access and use throughout the entire project lifecycle(WangandLove,2012).Suchlevelofvisualization andintegrationimprovesdecision making during the design stage as well (Chen et al., 2018). Objectives such as improving project performance by reducing the occurrence of errors can be achieved with the use of BIM (Baldwinetal.,2008).KeyindicatorsusedtomeasuretheimpactBIMhasonproductivity are quantity of request for information (RFI), amount of rework, schedule compliance and change orders due to plan conflicts (Fanetal., 2014). A study was conducted to measure the impact BIM has on productivity and found that actual number of labour hours was less than budgetedwiththeuseofBIM(Poirieretal.,2015).
Dynamo is a popular visual programming extension in Revit used to reduce repetitive work such as calculations by having users create algorithms (Khosakitchalertetal., 2018). Across multiple studies, Dynamo was found to be a popular tool used as comparedtocomputational BIMtoolssuchasGrasshopperandRhino.Dynamowasselected to automate the compliance checking for BIM as it is a plugin already available in Revit (Reinhardt and Matthews, 2017). When comparing its effectiveness to other methods used to extract BIM data, the advantages and restrictions of Dynamo was highlighted. Users do not require programming skills to operate the Dynamo BIM tool as it is a visual programming platform (Ignatovaet al., 2018). They can simply connect what is known as ‘nodes’ which have integrated functions to one another. Users who are trained in C## and Pythonprogramminglanguage couldusetheirskillstosimplifyconnectionsinDynamoaswell (Asl et al., 2015). However, one restriction of the Dynamo BIM toolis that nodeshave to bedownloaded from packages availablein eitherits libraryoronline as the generic set of nodes available do not cover all functions of the Revit application programminginterface(API)(Ignatovaetal.,2018).
Adoptability of a solution is also highlighted by previous research as an important factor to consider.Resistance toutilizingsolutionsmaybedueto factorssuchasperceived usefulness, perceivedeaseofuse(Asletal.,2015).Thesefactors may be influenced by external variables such as output quality, job relevance and even the appearanceofthesolutionaccordingtothe technologyacceptancemodel.Theuserexperience questionnaire was used to evaluate aselfmonitoringtooldesignedandresultshighlightedthe need to improve both usability and user-
6
experience of a product or solution for it to have a wideradoption(Santosoetal.,2017).
The above cited articles have indicated that rework is a common occurrence in the built environment sector and its negative impacts on the environment and work performance. The benefits brought about with the integration of BIM and computational BIM tools during the design stage were highlighted across multiple studies as well. A crucial discovery was that despitetheeffectivenessofasolutiontoresolvingpresentissues,theywouldnotbeadoptedif usersperceivethemtobeunhelpfulandhardtouse.
3.0 METHODOLOGY
Since the aim of the project is to address a practical problem, the mixed-methods research (MMR) overall approach was employed for this study. The five primary characteristicsof anMMRareasfollows(SchoonenboomandJohnson,2017).First,thereneeds tobeapurpose forintegratingboth qualitativeand quantitativemethodstoachievethegoalof answering the researchquestion.Second,thetheoreticaldrivehastobediscoveredwhereitin thiscaseitisto identify if the research is qualitatively driven, quantitatively driven or an equal- status study where both datacanprovide insightfor allareasofthe study.Third,the simultaneityofdata collectionandanalysisishighlightedwherequalitativeandquantitative data may be obtained and analysed concurrently or sequentially. Fourth, the dependency of qualitative data on quantitative data and vice versa is to be defined. For example, the implementation of a qualitative data may be independent or dependent on the results of the quantitativedata obtained.Fifth,thepointofintegrationwherebothqualitativeandquantitative datacollectedare mergedisknown.
In the field of engineering education, the MMR approach is still an emerging methodology due to variations found from existing MMR literature on its characteristics. Variations include the terminology used and amount of integration required to qualify as a mixedmethodsanalysis.However,thismethodologyisstillacceptedinthefieldasitisknown to be a rigorous process that produces extensive results. For this project, MMR was deemed suitable asitmeetstheprimarycharacteristicslistedabove.
First,thisstudyrequiredbothquantitativeandqualitativemethodstoobtainadditional insight
7
intothenumberofhoursrequired,qualityofwork,andadoptabilityofasolutionthat improves current workflows for the sanitary discharge system. Second, the research was qualitatively driven where quantitative data was used to support results generated from qualitative analysisandmeasureproductivityandnumberoferrorsgeneratedthatare quantifiable.Third, datacollectionandanalysiswereconductedseparately acrossallphasesof the study. Fourth, quantitative data obtained were independent from qualitative data and vice versa.Fifth,both qualitativeandquantitativedataweremergedfordataanalysisandpresented under the results section. The MMR was conducted across four phases with different approachesused fordata collection and analysis methods during each phase. The results and discussion would be conductedacrossthesamefourphasesaswell.
3.1 Phase1–Understandingworkflowsanddesignrequirements
Qualitativemethodswere appliedfordatacollectionontheworkflowanddesignrequirements ofthesanitarydischarge system.Firstly,observationwasconductedonfiveBIMprofessionals and five MEP engineers at consultancy firm X using an objectivist approach. Access to consultancy firm X for the conduct of this research was granted due to connections from a previous internship with them. However, objectivity is maintained where the research participants were neither influenced nor interfered during the observation process. The sample size was determined based on the number of workers who have projects that require the design and modelling of a sanitary discharge system. In the span of one week, the design and modelling process of a sanitary discharge system were observed and documented using notetaking. The qualitative data collectedservesasavisualrepresentation ofthenumberoflabourhoursthatmightbespentto completethemodellinganddesignprocess.
Ideally, quantitative data on the number of labour hours spent would be collected through a laboratory designed experiment. However, it is uncommon to have multiple BIM professionals working on the same project simultaneously and the depth of analysis for an understandingoftheworkflowwouldnotbejustifiable.Suchlevelofanalysiswouldbeapplied at a later phase of the project instead and the general steps applied the design of the sanitary dischargesystemacrossvariousprojectswererecordedatthisphase.
To examine the reliability of data collected, observations were made under different circumstances such as different times of the day and across three different pairs of BIM
8
professional and MEP design engineer. Secondly, informal discussions involving BIM modellers, the BIM leader from the hydraulics division and the BIM manager were held and documentedusingnotetakingaswelltoincreasethevalidityofdatacollected.Thirdly,asemistructuredinterviewwas heldwithaMEPdesignengineerin ameeting room at consultancy firm X. During the interview, the documented steps, calculations and design requirements were checked and corrected by a qualified MEP design engineer who is experiencedin the design of sanitary systems. Only one MEP design engineer was interviewed based on his qualifications as a Qualified Person and also because the presented workflow during the interview was gathered based on the prior observation held with otherMEP design engineers and BIM professionals. The BIM Manager of consultancy firm X verified that the results from the interview were accurate as well. The interview was transcribed using a transcription mobile application called Otter Voice Meeting Notes. The interviewee would be referredtoas‘MEPDesignEngineer1’aspermissiontomentionthenamewasnotreceived.
The documented notes and transcription from observations, discussions and interviews were coded using a thematic analysis. This method of analysis is used to identify repeating themes across the various responses. An inductive approach was used for the observations and discussions where the themes were determined based on the data collected while a deductive approach wasused fortheinterviewwherepreconceivedthemessuch asthestepsrequired for thedesignandmodellingwereidentifiedpriortotheinterview.Datacollectedwasfamiliarized with and coded later by highlighting sections of the texts identified to be of the same group. Themessuchasthestepsforthedesignandmodellingprocessofthesanitarydischargesystem were generated based on identified patterns. The themes were then reviewed, named and organizedintosteps.
3.2 Phase2–Evaluatingtheperformanceanduserexperienceofexistingworkflows
After understanding the workflows and design requirements of existing workflows, a survey was conducted over the span of one and a half weeks in September 2019. Although surveys are generally categorized as quantitative data collection methods, the questions were framed to evaluate their user experience and is recognized as a qualitative data collection method. However, the qualitative data collected was presented quantitatively to provide statistical comparison that could be useful for continuous improvement to the modelling process of sanitary discharge systems. Thus, the survey is considered to be both a qualitative and
9
quantitativemethod fordata collection.Survey 1was used as market research to confirm an assumption that long hours are spent, and errors are frequent during the completion of various sanitary discharge system designs using existing methods, supporting the need for a solution.Inaddition,an understandingoftheusers’experience couldbegainedandcorrelated totheimportanceofadoptabilityofasolutionasameasurementofitseffectiveness.Additional feedbackontheirthoughtsontheexistingmethodsandpossibleareasforimprovementscould besimultaneouslyreceived.
Though the end users of the developed solution include competent Revit users in relevant workingindustriesandeducationalinstitutions,onlyBIMprofessionalsinconsultancy firm X were familiar with the existing methods at that point. Thus, they were selected as the target population for the survey. In this study, ten BIM professionals were selected as the sample for the survey. Participants were referred to as ‘Participant 1’ to ‘Participant 10’ as their namesdonotaffecttheanalysisinthisstudy.
The survey was conducted at the consultancy firm X’s BIM office in the form of an online questionnaireasit iseasiertodistribute, hashighflexibilityand oflow cost.Itwas developed using an online tool, Google Forms, and the online link was sent to ten BIM professionals selected at random through Skype. Survey participant had to utilize the two existing workflows to complete the sanitary design of project models they are currently working on before completing the survey. Variables across project models such as different levelsof complexitywereconsideredduringthisdatacollectionprocess.Sincethepurposeof Survey1 wastoidentifytheperformanceanduserexperienceoftheexistingworkflowsacross various sanitarydischargesystemdesigns,thevariablesidentifiedwereneglectable.
The survey consists of a short introduction explaining its purpose and goals followed by a section on ‘Evaluating Existing Workflows for the Sanitary Discharge System’. A user experience questionnaire (UEQ) approach was used to evaluate the user experience of BIM professionals when using existing workflows to complete the sanitary discharge system. Considering the user experience of existing workflows when developing a solution would increase its adoptability at a later stage. User experience is defined as the perception and response resulted from the use of a product, system, or service. Although there is a lack of present research conducted on BIM using the UEQ approach, it was used more than other
10
approachessuchasthetechnologyacceptancemodelasitisadataanalyticalapproachonother areasofstudies.PreviousstudiesdousetheUEQtoevaluatetheuserexperienceofengineering products andservicesaswell(Santosoetal., 2017). Thus,this approachcouldbeusedforthe studyofcurrentworkflowswheretheywouldbeconsideredas services.
IntheUEQapproach,BIMprofessionalswereaskedtoindicatetheirlevelofagreement through asetof26closed-endedquestionsonaseven-pointLikertscalerangingfromstrongly disagree to strongly agree. Two set of 26 questions were provided where one was used to analyse thetraditionalworkflowandtheotherwas usedtoanalysetheDynamoworkflow. The listof questions was provided by a given UEQ template found on the UEQ online website. The questions were created and categorized based on six scales (Schrepp et al., 2014). First, attractiveness which refers to whether the user likes or dislikes the product overall. Second, perspicuitywhichreferstowhetheritisunderstandableandeasy touse.Third,efficiencywhich refers to whether little effort is required to complete tasks using the products. Fourth, dependabilitywhichreferstowhethertheproductsaresecureandfeelin controlwhenutilizing them. Fifth, stimulation which refers to whether they are motivating or interesting to use. Sixth, novelty which refers to whether the product is innovative and unconventional. Data collected from the UEQ questions were analysed using a UEQ calculation of a CronbachAlphacoefficientshownbelow: α=n*r/1+(n−1)∗r where r is the mean correlation of items in a scale and n is the number of items in a scale. The mean value of the survey results would then be obtained. Closed-ended questions were provided after the UEQ such as a list of options with a single answer possible on how often they received projects requiring the modelling of the sanitary discharge system, a binary question on whether they foresee themselves using the existing Dynamo workflow over the traditionalworkflow,listsofoptionswithasingleanswerpossibleonhowtheywouldrankthe suggested features to be added to the existing workflows, and a binary question whether they wouldbeinterestedinusingadevelopedsolutionthatprovidessuchfeatures.
Datacollectedfromtheotherclosed-endedquestionswereanalysedbasedonthemean, standard deviation,lowerandupperconfidenceinterval(ci)whichinthiscaseis95ci.Thedata received
11
throughthegoogleformwereexportedontoanexcelspreadsheetandweremanually calculated to present results in the same table form. Insight on the performance and user experience of existing methods were later used to develop a solution. To ensure validity and reliability, questionsweredesignedtobespecificanddirectlyrelatedtoachievingthesurvey’s objective. Sufficient context on the problem would be provided as well. The survey was designed withoutanybiastoachievingdesiredresultsbyphrasingquestionsneutrally.
3.3 Phase3–Creationanddevelopmentofsolution
Instead of delving into resolving errors present in the existing Dynamo scripts, other computational tools such as Rhino and Grasshopper available were considered as well. A secondaryqualitative analysis was conducted on existing datato shareon thethought process behind selecting software or technology to create the solution. Existing journal articles were reviewed and selected based on their relevancy to the problem. In this case, existing data on comparisons of computational tools available was conducted over the course of half a week. Secondary qualitative analysis was later conducted on existing data that discusses how to utilise the selected computational tools. Over the course of half a week, online guides on DynamoandPythonwerestudiedindepth.
Dynamo Primer was used to understand the user interference, installation, anatomy of a Dynamo script and other functions. Next, online tutorial videos on how to use Python Scripting for Dynamo were studied. Topics covered include accessing the Revit application programminginterface(API) andbasicoperatorssuchasvariables,loopsand functions.Alist of common nodes, Dynamo functions and Python functions were compiled in a Dynamo dyn file for reference. At this stage, the existing Dynamo scripts were improved on based on the knowledge obtained through the secondary qualitative analysis conducted. Detailed steps to develop the solution were documented using note-taking and presented under the results section. The steps represent the new workflow for the design and modelling of the sanitary dischargesystem.
An experiment, a quantitative method, was conducted to assess the quality of work produced by existing Dynamo scripts. An existing project’s Revit file was retrieved from consultancy firmXandsanitarydischargecomponentswereinsertedintotheprojectfileas Revitfamilies. Asanitary dischargesystemdetailingthelocationofcomponentswasdesigned to be used for
12
Experiment1,2and3.ThenumberoferrorsthatoccurredduringExperiment1 was recorded through personal observation. Testing conditions under Experiment 1 were designed accordingtotasksthatthescriptmustfulfilwhereaccuracywouldbeevaluatedusing apassor fail criteria. Quantitative data recorded were analysed and presented in the same table. The modelling of the sanitary discharge system in the existing project’s Revit file and Experiment1werecompletedoveraweek.
The two scripts were tediously edited to pass the testing conditions and reduce the number of work hours required to complete the modelling process of the same design used in Experiment1.Stepstakentodevelopthetwoscriptsweredocumentedundertheresultssection and improvements to the scripts were carried out for two weeks. A second experiment, Experiment 2, was conducted on the developed scripts and the traditional workflowwiththe same testing conditions, Revit project file and analysis method. Quantitative data on the accuracy of the developed scripts and the increase in work productivity were comparedto theresultsfromExperiment1.
3.4 Phase4–Evaluatingtheperformanceandadoptabilityofsolution
Despite conducting experiments personally to evaluate the effectiveness of the developed scripts compared to the existing Dynamo script, the developed scripts were not compared to both existingmethodsand it washard to evaluate theiradoptabilitywithout the helpoftest participants.Experiment3,Survey2andSurvey3weredevelopedandconducted duringacross thespanoftwoandahalfweeks.Qualitative andquantitativedataonworkproductivity,quality ofworkandadoptabilitywerecollectedand analysedatthisstage.
Experiment 3, a quantitative method, was conducted to measure the number of work hours requiredbytestparticipantstocompletethedesignprovided.Thepopulationandsample sizeis the same as Survey 1 for consistency. Due to limitations such as time constraint and lack of access to BIM professionals during their non-working hours, a sample size of 5 BIM professionals and 5 students from Singapore Institute of Technology (SIT) were selected to participateinthesurveyandexperiment.Sincetheendusersofthedevelopedsolutioninclude competent Revit users in both relevant working industries and educational institutions, the samplewasdeemedtobeappropriateasstudentswerestillendusersoftheproducts.Purposive sampling,anon-probabilitysamplingmethod,wasusedtoremainconsistentwiththeprevious
13
samplefromtheSurvey1conductedinphase2.Participantswerereferredtoas‘Participant1’ to ‘Participant 10’ as their names do not affect the analysis in this study. In this experiment, ‘Participant 5’ to ‘Participant 10’ were students that replaced BIM professionals from the participants in Survey 1 who were unavailable. The sampling confidence interval and margin oferrorare95%and5%respectively.
The same sanitary discharge system design and existing project Revit’s file used for Experiment 1 and 2 were used for this Experiment to provide consistency and aid in the comparisonofresults.Astopwatchwasusedtorecordthetimenumberofworkhoursrequired. Second, the number of errors that occurred during each test was recorded through personal observation. It was expected that the experiment might be prone to human error as mistakes mademight bemissed afterfacilitating multipleexperiments per day. Screen recordings were captured to remove the possibility of human error by reviewing the recordings to spot the occurrences. Survey 3 was conducted after the participants completed their experiments to re- evaluate theiruserexperience.ThestructureandorganizationofSurvey3isthesameasSurvey 1andthe only differencewas theinclusion of afinal closed-endedquestion. Thesurveywas conducted intheformofanonlinequestionnaireonGoogleFormswherethelinkwasprovided after their experiment was completed. The UEQ approach used for Survey 1 was used for Survey 3 as well where qualitative data on user experience were keyed into the UEQ data analysis tool. The final closed-ended question was included after the list of questions from the UEQ. Participantswouldrankthetwoexistingworkflowsanddevelopedsolutionfromfirstto lastin termsoftheirpreferenceofusageusinglistsofquestionswithonlyonepossibleanswer. Results were analysed based on the mean, standard deviation, lower and upper confidence interval (ci) which in this case is 95ci. The data received was exported onto an excel spreadsheet andmanuallycalculatedtopresentresultsinthesametableform.
To ensure validity and reliability, questions were designed to be specific and directly related to achieving the survey’s objective. Sufficient context on the problem would be provided as well. The survey was designed without any bias to achieving desired results by phrasing questions neutrally. Variables were eliminated by conducting Experiment 3 in the same environmentusing thesametools.Experiment3wasconductedon alaptopatanempty room
14
withnodistractions.Testparticipantswereinformedtoplacetheirmobilephonesaway during theestimated20minutesexperiment.
Prior to the experiment, a guide on the sanitary discharge system was developed to ensure thattestparticipantsunderstoodtheproblembackground,designrequirementsandwere made aware of existing workflows with the inclusion of screen recordings. Test participants hadto readasecondguideonthestepstofollowduringExperiment3andcompleteSurvey2 which includes only one closed-ended binary question on whether they have fully understood what they are to complete for the experiment or uncertainties are still present. They would only proceedwiththeexperimentafterconfirming thattherearenofurtheruncertainties.Theguide andSurvey2wereusedtoensureeliminatefactorssuchasinexperiencefromstudentswhoare introduced to the sanitary discharge system during the experiment that might affect the test results.Survey2wasdesignedwithoutanybiastoincreaseitsreliabilityaswell.
A method to measure improvements to labour productivity when existing Dynamo workflow andnewDynamoworkflowwereused.Previousstudiesintheconstructionindustry discovered a lack of a standardized definition for productivity. where labour productivity was measured by dividing the number of work hoursoverthe quantity forone scientificpaper while it was measured by dividing quantity per man hour for others. It was difficult to apply the calculationsprovidedasnotonly didtheyvarybutitwasdifficulttomeasuremodellinginthe form of quantity. In addition, the time spent on the development of the solution would not be considered. Throughfurtherresearch,workproductivitywouldbequantifiedusingtheformula shown:Number of work hours saved or wasted per year = [Number of times tool is used] x [Time saved with each run compared to the manual method] – [Development time]. The calculation of work productivity would be used as an insight and not a full representation as multipleassumptionsmustbemade.
4.0 RESULTS
Adopting the methods and approaches stated, results from the data collection and analysis acrossthesamephaseswerepresented.
4.1 Phase1–Understandingworkflowsanddesignrequirements
15
After coding the documented notes on the workflow for the sanitary discharge system, four themes repeated across the various observations were identified. They are the design process, modelling process using a traditional workflow, modelling process using existing Dynamoscriptsandthedesignrequirements.Afulltranscriptionoftheinterviewofthedesign processandmodellingprocessusingatraditionalworkflowisshowninFigures2and3below.
16
Figure2:TranscriptofInterviewwithMEPDesignEngineer–Part1
3:TranscriptofInterviewwithMEPDesignEngineer–Part2
MEP Design Engineer X commented that there were no issues regarding the two processes documented based on the observations and informal discussions. The comment provided evidence that the workflows on the design process and modelling processes were accurate and valid. However, multiple corrections were made regarding the design requirements observedanddetailedunder4.1.4.


4.1.1 Designprocess
Thedesignprocess forthesanitary dischargesystemareas follows. Stepone,MEP engineers would locate all components of the system and provided this information through comments

17
Figure
on a portable document format (PDF) file of a basement or ground level floorplan. On the same file, the location of components such as inspection chambers and waste sumps were shown. Only the depth of the first inspection chamber or waste sump, designed according to design requirements from the COP, was provided as the depth of connecting inspection chambers or waste sumps would be calculated based on the first component. Step two, pipe routings, pipe size and slope gradient of the pipes would be provided and designed according todesignrequirementsfromtheCOP.Stepthree,thedesignandcommentswouldbeprovided to the building information modelling (BIM) engineers and modellers to model the design usingsoftwaresuchasRevit.
4.1.2 Modellingprocess–Traditionalworkflow


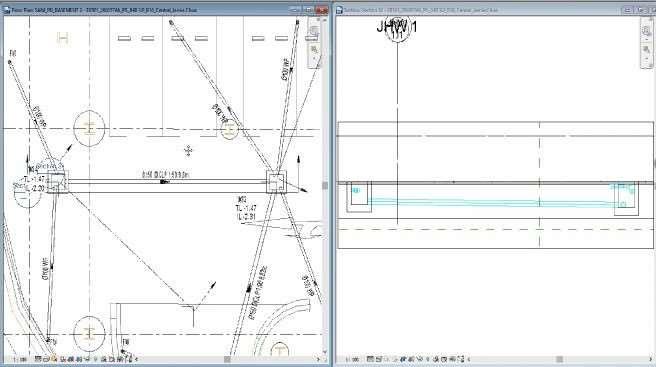
After receiving the PDF comments from the MEP engineers, BIM professionals would open the model in the software that the architecture layout was designed in. Since the sanitary drainagesystem involvesmultiple components, only the connectionsfor inspectionchambers, waste sumps, gully traps, grease traps and manholes were analysed in detail. Waste sump to waste sump connections modelled in Revit are shown and annotated in Figure 4 to aid in the discussiononthetraditionalworkflowatconsultancyfirmX.
18
Figure4:WastesumptowastesumpconnectionsonRevit SanitaryPipe WS1FloorSlab WS2 WS1 WS2 TL1-1.47TL1-1.47 SanitaryPipe
Step one, the right version of the software, in this case Revit, would be opened and the first waste sump or inspection chamber would be placed at the specified location in Revit as an element.ThefirstwastesumpisannotatedasWS1inFigure4.Steptwo,theBIM professional would check if the internal depth of the first inspection chamber or waste sump compliedto thedesignrequirementsfromtheCOP.Iftheinternaldepthprovidedisincorrect, hewouldask the MEP Engineer if changes can be made. Step three, a section view shown on the right in Figure4wouldbecut usingthesectiontoolinRevitto checkonthealignmentof theelement astherearetimeswhenitisaboveorbelowthefloorslab.Theelement’salignment has to be adjustedaccordinglyifitisincorrect.
Step four, the second waste sump or inspection chamber would be placed at the designated location as an element. The second waste sump is annotated as WS2 in Figure 4. Thethird stepisrepeatedforthesecondelementortheprevioussectionviewcouldbeextended todisplay thesectionofthesecondelementifpossible.Stepfive,thedistancefromtheinternal edges of waste sump to waste sump connections or inspection chamber to inspection chamber connectionswouldbemeasured.TheRevitaligneddimensiontoolisusedtodrawadimension wherethemeasured distancesignifiesthepipe length.Ifthedistancedoesnotmeet thedesign requirementsfromtheCOP,adjustmentswouldhavetobemade. Step six, the internal depth of second waste sump or inspection chamber would be calculated manually. The formula usedforcalculatingtheinternaldepthofinspection chambers,wastesumps,gullytraps,grease trapsandmanholesarepresentedbelow:
where IL1 refers totheinternal level ofthe first element, IL2 refers to theinternallevelof the next element that is deeper than the first. L refers to the distance from centre to centre of the twoelementsmeasured,Greferstothegradientofslope,TL1referstothetoplevelofthefirst element and TL2 refers to the top level of the next element. TL and IL are obtained after annotatingtheelementswithspotelevationonRevitandareshowninFigure4.
19
IL2=IL1–L/G IL2>IL1 InternalDepthofFirstElement=TL2–IL2 InternalDepthofNextElement=TL1–IL1
The formula is repeatedly used to calculate each internal depth of the next element as theTL ofthenext element is only adjustedafterthecalculatedinternal depth valueis keyed in asan input under the element’s properties. Depending on the number of elements in the design, calculationsmaybe used from 10 to100 times for asingledesign. Thesecondwaste sump or inspection chamber’s internal depth would be edited on Revit based on the calculated value. The BIM professional would check if the adjusted element’s internal depth meets the design requirementsaccordingtoCOPandconsulttheMEPengineerifchangesareto bemade. Step seven,asectionviewwouldbecuttoprepareforthealignmentofpipes.
Stepeight,theBIMprofessionalwouldalignthestartingpointofthepipetothebottom of the first element.Thepipe gradient,sizeandmaterialwouldhave tobe adjustedaccording to the PDFcommentsbeforemodelling.Designrequirementsforthepipegradient,sizeand material variesdependingonthetypeofelementsforconnection.Forexample,anICtoIC connection compared to an IC to manhole connection has different design requirements. If they do not comply withthedesign requirements of the COP, theMEP engineer hasto be notified of the error again. Pipe connections would be modelled to start from the internal edge of the first elementtothenext.Thesize,discipline,gradientandpipelengthwouldbeannotated.
Step nine, the component connected to the second element would be placed at the specified location in Revit as an element. Steps two to nine would be repeated until all connections are completed. The next element would always be the second element unless the pipe connectingtoitisslopinginanupwardsdirection.Ifthatisthecase,thedeeperelement would bethesecond element and calculationshave tobe madeaccordingly.The seventhstep has to be repeated for the next element or the previous section view could be extended if possible. The elements could be grease traps, gully traps or manholes as well. Step ten, a final check must be made to check the inspection chamber to inspection chamber connections and inspection chamber to manhole connections. A hydraulic drop is present when the height difference of the wastewater entering the element from exit point of the pipe to the bottom of theelementisinsufficientortoolarge.Ifthehydraulicdropdoesnotmeetorexceedsthedesign requirements, a backdrop or tumbling bay connection is required where additional fittings are connectedtothe pipeentering the element afterthe downwardssloping pipe. If reworkon the modelisnotifiedatanypointduringthisworkfloworafterreview,thestepshavetoberepeated accordingly.
20
4.1.3
Modellingprocess–ExistingDynamoworkflow


Through informal discussions held with the BIM Management at the consultancy firm X, it wasdiscoveredthatasecondexistingmethodusedformodellingthesanitarydischarge system was recently developed. Two scripts were developed using Dynamo where the first script generatespipesconnectedinanetworkfromonecomponenttoanotherwhilethesecond script directs all pipes to the component with the lowest depth. The input form generated by the scripts and the Dynamo interface are shown in Figure 5 to aid in the discussion on the traditionalworkflowatconsultancyfirmX.
Figure5:WastesumptowastesumpconnectionsonRevit
Step one to six of the existing Dynamo workflow are the same as the traditional modelling workflow. They would be repeated until all components are placed and adjusted accordingly on Revit. Step seven, Dynamo displayed on the Manage tab is selected to open its interface. Step eight, the respective script is selected and opened as shown in Figure 5. The BIM professionalwouldclickthe‘Run’buttontorunthescriptandaninputformasshownin Figure 5 would be displayed. Step nine, the BIM professional would input the design requirements provided by the MEP engineer for pipe creation. This includes pipe type, pipe system type, pipe slope and pipe diameter. Then,there isaneedtocheckforcompliancewith the design requirementsfromtheCOPandasktheMEPengineerifchangescouldbemadeifnecessary.

21
Dynamo
Inspection Chambers InputForm Manhole
Step ten, the ‘Select’ button on the input form would be clicked and the BIM professional would highlight the elements to generate pipe connections between. When he is done, he would click ‘Finish’ displayed on Revit and ‘Create Pipe’ on the input form. Inspection chambers and manhole were highlighted in Figure 5. The connections generated would depend on the selected Dynamo script. Step eleven, the final check on inspection chamber to inspection chamber connections andinspectionchambertomanholeconnections wouldbe conducted. Similar to the traditional workflow, a backdrop or tumbling bay connection is required if the design requirements for hydraulic drop are not met. Step eleven, the size, discipline,gradientandpipelengthof the generated pipeswouldbe annotated. Similar tothe traditionalworkflow,ifreworkonthemodelisnotifiedatanypointduringthisworkflow or after review, the steps have to be repeated accordingly. The design considerations are consistent regardlessofwhatworkflowsareused.
4.1.4 Designrequirements
TheinterviewwiththeMEPDesignEngineerrevealedincorrectdesignrequirements gathered through observations and informal discussions to be corrected. The first design requirement where the last inspection chamber should be located close to the manhole was verified by the MEP Design Engineer 1 to be correct. The second design requirement was documented as follows. The internal depth of the first waste sump connected with a floor trap should be more or equal to 750mm for the fitting to run under slab as the floor trap with P trap fitting height and basement floor slab were 600mm. If the first waste sump is connected to a floor wasteorisnotconnectedtoafloortrap,theinternaldepthshouldbemoreorequalto 450mm. Theinternaldepthofthefirst inspectionchambershould bemoreor equal to 1000mm and if these arenot met. MEPDesign Engineercommented that the internaldepth of the first waste sumo and adjustedwastesumpsshouldbemoreor equal to450mm instead. Also,the internal depthofthefirstICandadjustedonesshouldbemoreorequalto750mm.
It was documented that pipe gradient of inspection chamber to inspection chamber connections are either 1 is to 60 or 1 is to 90 while the pipe gradient of waste sump to waste sump connections areeither1 is to90 or 1:120or 1:200. MEPDesign Engineer1 commented thatinspectionchambertoinspectionchamberpipegradientsshouldrangefrom1isto30to1 is to 90 instead. Waste sump to waste sump connections would generally follow the same
22
requirementsandinspectionchambertomanholeswoulduseagradientof1isto120.
Thefourthdesignrequirementwasdocumentedasfollows.Pipelengthofwastesump towaste sumpconnectionsshouldbelessorequalto20mwhilethatofinspectionchamberto inspection chamberconnectionsarelessorequalto50m.SinceMEPDesignEngineer1did notcomment on the statement during a pause forhis response, the interview was resumed, and the design requirement was interpreted to be correct.The fifth design requirement was documented as follows. Waste sump to waste sump pipe connections should have a diameter of150mm, inspectionchambertoinspectionchamberpipeconnectionsshouldhaveadiameter of200mm and inspection chamber to manhole connections should have a diameter of more or equalto 200mmandaremadeofvitrifiedclay.However,MEPDesignEngineer1commented thatboth wastesumptowastesumpandpipeconnectionsandinspectionchambertoinspection chamber pipeconnectionsshouldbeallhaveadiameterofmoreorequal to150mm.Thisis applicable forconnectionstogreasetrap,carparkwastesumps,gullytrapsandejectorpitstoo. Inspection chamberstomanholeconnectionsinsteadshouldhaveadiameterofmoreorequal to200mm.
The sixth design requirement was documented as follows. Waste sump to waste sump and inspection chamber to inspection chambers pipe connections are made of cast iron while Inspection chamber to manhole connections and are made of vitrified clay. MEP Design Engineer 1 commented that inspection chamber to manhole connections were correct, but all otherconnectionsshouldbemadeofductileironinstead. Theseventhdesignrequirementwas that a tumbling bay connection to the manhole is required for inspection chambers with an internal depth of more or equal to 500mm and less or equal to 1500mm while a backdrop connectionisneededforinspectionchamberswithaninternaldepthexceeding1500mm.MEP DesignEngineer1 highlightedthataccording tothenew 2019COP forsanitary and sewerage works, a tumbling bay or backdrop connection can be used for a hydraulic drop of more or equalto500mmnotexceeding6000mmforICtoICorICtomanhole.
23
4.2 Phase2–Evaluatingtheperformanceanduserexperienceofexistingworkflows


The mean value per item analysed from UEQ questions found in Survey 1 for the traditional workflowareshowninFigure6.
MeanvalueperItem
-3-2-1 123
notunderstandable/understandable difficulttolearn/easytolearn notinteresting/interesting slow/fast conventional/inventive obstructive/supportive usual/leadingedge notsecure/secure doesnotmeetexpectations/meetsexpectations
Figure6:MeanvalueperitemoftraditionalworkflowfromSurvey1
Results would either have a “negative evaluation” where the mean value is less than 0.8, “neutral evaluation” where the mean value between -0.8 and 0.8 or a “positive evaluation” wherethemean valueismorethan0.8.Theminimumand maximum result ofthemean value isbetween-3 and +3. Figure6 showsthat thereweremorenegative evaluationsregardingthe traditionalworkflowwithanaveragemeanvalueof-1.Thetopthreenegativeevaluationswere that it was foundto be dull, boring, andconventional. Thetopthreepositiveevaluations were thatitwasunderstandable,meetstheiruserexpectationsandeasytolearn.
24
The mean value per item analysed from UEQ questions found Survey 1 for the existing DynamoworkflowareshowninFigure7.
MeanvalueperItem -3 0123


notunderstandable/understandable difficulttolearn/easytolearn
notinteresting/interesting slow/fast conventional/inventive obstructive/supportive usual/leadingedge notsecure/secure doesnotmeetexpectations/meetsexpectations
Figure7:MeanvalueperitemofexistingDynamoworkflowfromSurvey1
Figure 7 shows that there were more positive evaluations towards the existing Dynamo workflow.However,theevaluationswereonlyslightlypositivewithanaveragemeanvalueof 1. The top three positive evaluations were that it was found to be enjoyable, understandable andfast while the bottom three negative evaluations werethat it was not secure, demotivating andunattractive.UEQ benchmarks analysed from UEQ questions found in Survey 1 for the traditional workflow areshown in Figure 8.Surveyresults were categorized according tothe six scales: attractiveness,perspicuity,efficiency,dependability,stimulation,andnovelty.
25
Excellent Good AboveAverage BelowAverage Bad Mean
Figure8:UEQbenchmarkoftraditionalworkflowfromSurvey1


Based on the benchmark found in Figure 8, the attractiveness, efficiency, dependability, stimulationandnoveltyofthetraditionalworkflowwerefoundtobebadwhiletheperspicuity of the traditional workflow was found to be below average. The stimulation of the traditional workflowhadameanvalueof-1whileitsnoveltyhadameanvaluebelow-1.UEQbenchmarks analysed from UEQ questions found in Survey 1 for the existing Dynamo workflow are showninFigure9.



Excellent Good AboveAverage BelowAverage Bad Mean


Figure9:UEQbenchmarkofexistingDynamoworkflowfromSurvey1
Based on the benchmark found in Figure 9, the attractiveness, perspicuity, dependability andstimulation werefoundto be bad. Noveltyofthe existing Dynamo workflow was below average while the efficiency of the existing Dynamo workflow was found to be above average.Survey results on the frequency of projects which require the modelling of sanitary discharge system, likelihood of using the existing Dynamo workflow and features to integrate intothesolutionweretabulatedintoTable1.
26
Table1:ResultsfromSurvey1
SurveyQuestions N/10 Response Rate Mean SD 95ci
upper lower
Q1.HowoftendoyoureceiveprojectsfromMEPDesignEngineersthatrequirethe modellingof sanitarydischargesystem?
Daily 0 100%
0 0 0 0
Onceaweek 2 0.2 0.42 0.46 -0.05 Morethanonceaweek 7 0.7 0.48 1.00 0.40 Onceayear 1 0.1 0.32 0.30 -0.20 Never 0 0 0 0 0
Q2.DoyouforeseeyourselfusingtheexistingDynamoscriptsinsteadofthetraditional methodto generatepipeconnectionsforthesanitarydischargesystem?
Yes 3 100% 0.3 0.48 0.59 0.01 No 7 0.7 0.48 1.00 0.40
Q3.RankthefeatureswouldyouliketoseeaddedtotheexistingDynamoscriptsand traditional method.
A. GeneratedCalculations
FirstChoice 6 100%
0.6 0.52 0.92 0.28 SecondChoice 1 0.1 0.32 0.30 -0.20 ThirdChoice 3 0.3 0.48 0.59 0.01
B. AutomaticAlignmentofPipes
FirstChoice 1 100%
0.1 0.32 0.30 -0.20 SecondChoice 3 0.3 0.48 0.59 0.01 ThirdChoice 6 0.6 0.52 0.92 0.28
C. AutomaticChecksforCompliance
FirstChoice 3 100%
0.3 0.48 0.59 0.01 SecondChoice 6 0.6 0.52 0.92 0.28 ThirdChoice 1 0.1 0.32 0.30 -0.20
Q4.WehavetheabilitytodevelopasolutionthataddsthefeatureslistedinQ5.Would yoube interestedinusingthedevelopedsolutiontomodelthesanitarydischarge
Yes 10 100% No 0 0 0 0 0
Surveyparticipants feedbacked thatprojects that required the modelling of sanitary discharge systems were received more than once a week. That response selected had a mean value of 0.7, upper confidence interval of 1 and lower confidence interval of 0.4. The next response
27
addition, the development cost and adoptability of the software are to be considered as some firms currently do not own such software or utilize them for their projects. After much deliberation,itwasdecidedthatexistingDynamoscriptswouldbeimprovedonforthisproject.
As it is a visual programming tool, no programming languages would be required for its utilization.Dynamohasthehighestadoptabilityatpresentasitisin-builtinRevitsoftwareand Python scripting could be integrated into Dynamo to write custom coding through text scripts withbasicprogrammingskills.
4.3.2 UnderstandingthecreationofexistingDynamoscripts
Twoscripts of different uses, existing Dynamo script 1 usedtogeneratepipes connected in a network from one element to another and existing Dynamo script 2 used to directs all pipes to the element with the lowest depth were currently used. After reviewing online tutorials and Dynamo Primer guide, dynamo nodes and common functions were documentedunder Appendix A. The nodes and functions obtained were used to analyse the creation of the existingscripts.ThestepstocreatetheexistingDynamoscriptswere documentedinAppendix B.
4.3.3 ResultsfromExperiment1
Thefirststoreyfloorplanofanexistingproject’sRevitfilewasfirstlyeditedtocreate aclean modeltouseforExperiment1,2and3.Figure10showsthedesignedsanitarydischarge system indicating the location of components. The first component’s depth and pipe connections areprovidedaswell.
29
IC1(FirstWS) InternalDepth–750mm WS6 WS5
WS1(FirstWS) InternalDepth–700mm WS2 WS3 WS4


30
Figure10:Designedsanitarydischargesystemforexperiments IC3 IC2
Tests were conducted on the model created and their pass and fail results during Experiment1weredocumentedunderTable2.
Table2:ResultsfromExperiment1

Table 2 shows that a total of 3 errors each were generated from the Dynamo existing scripts. Pipe connections from one waste sump, WS, to another waste sump of different top levels where the first waste sump with a higher top level’s internal depth was less than the second wastesumpwithalowertoplevel’sinternaldepthwerefoundtobeinaccurateforboth existing Dynamoscripts. Pipesgeneratedhadthe wrongslopingdirectionsandstartedfrom thelowest point of the wrong waste sump. Multiple waste sump connections to one waste sump from differentdirectionsinanetworktoonewaste sumpfromdifferentdirections inanetwork for componentsofthesametoplevelhadpipeconnectionsthatweregeneratedincorrectlyand at

31
times not at all for both Dynamo scripts. Lastly, waste sump to grease trap pipe connections werenotgeneratedforbothexistingDynamoscriptsaswell.
4.3.4 Creationofthesolution
Two Dynamo scripts were ultimately developed as the final deliverables of this project. The new Dynamo Script 1 is an improved script from the existing Dynamo script 1 where generatedpipesareconnectedinanetworkfromonecomponenttoanother.Ontopofresolving errors generated in Experiment 1, The improved scripts included features such as generated calculations, automatic alignment of pipes and automatic checks for compliance to design requirements.Figure11showsthenodalconnectionsforthenewDynamoscript1.
Figure11:DynamoScript1nodalconnections
Nodes were grouped based on their functions where green represents the main functions of generating pipes, generating calculations and aligning pipes to the bottom of the prior component while orange represents checks for compliance to design requirements where messageswouldbedisplayedonRevitwhendesignrequirementswerenotmet.Thescriptwas able to check compliance to internal depth, pipe gradient, pipe length, pipe size and pipe

32
material design requirements. Compliance to design requirements such as hydraulic drop and locating the last inspection chamber close to the manhole were not checked when the new Dynamo script 1 was used. Additional features such as filtering only sanitary components for theselectionanddisplayingcomponentsinorderwereincluded.The new Dynamo Script 2 is an improved script from the existing Dynamo script 2 where generated pipes are directed to the component with the lowest depth. The improved scripts were created by resolving errors and including features as well. Figure 12 shows the nodalconnectionsforthe newDynamo script2.
Figure12:DynamoScript2nodalconnections
Similarly,thenodesweregroupedbasedontheirfunctionswiththesamecolourcoding. Due to time constraints, the new Dynamo script 2 integrated only one compliance checks on the internal depth design requirements. Compliance to design requirements such as pipe gradient, pipe length, pipe size, pipe material, hydraulic drop and locating the last inspection chamber close to the manhole were not checked when the new Dynamo script 2 was used.

33
Additionalfeaturessuchas filteringonlysanitarycomponents forthe selectionand displaying componentsinorderwereincluded.


4.3.5 ModellingProcess–NewDynamoWorkflow
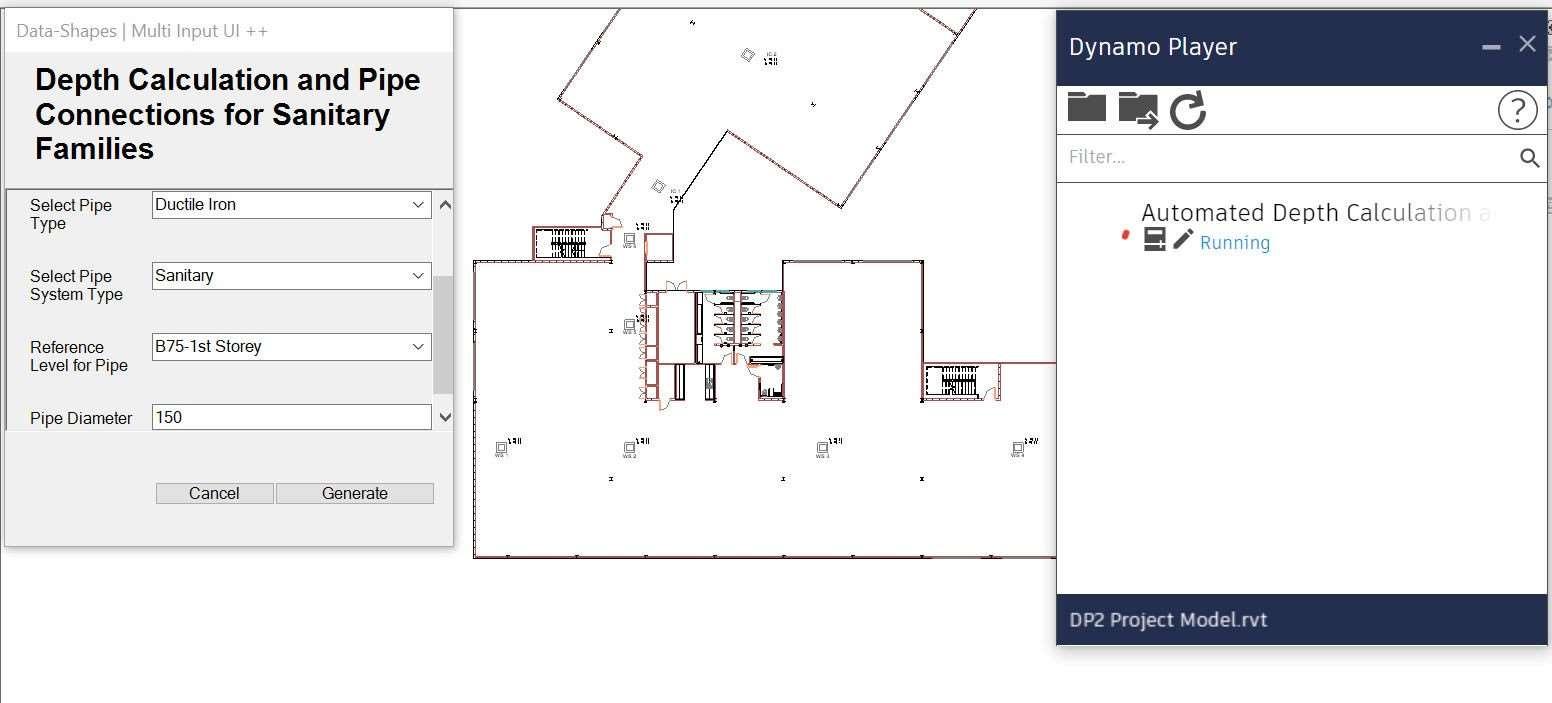
After creating the new Dynamo scripts, the new Dynamo workflow where the scripts were used to complete the designed sanitary discharge system was analysed. Step one, the right version of the software, in this case Revit, would be opened and all the waste sumps and inspection chamber would be placed at the specified location in Revit as elements. They are annotated accordingto the givendesign as well wherethe waste sumps areannotated as WS1 to WS 6 and the inspection chambers are annotated as IC1 to IC3. Step two, section views would be cut using the section tool in Revit to check on the alignment of the element as there are times when it is above or below the floor slab. The element’salignmenthastobe adjustedaccordinglyifitisincorrect.Stepthree,thefirstwaste sump or inspection chamber’s internal depth would be edited. The BIM professional would checkiftheinternaldepthofthe firstinspectionchamberorwastesumpcompliedtothedesign requirements from the COP. If the internal depth provided is incorrect, he would ask the MEP Engineer if changes can be made.Stepfour,DynamoPlayerdisplayedontheManagetabis selectedtoopenitsinterface. Step five,the respectivescriptisselectedand opened as shown inFigure13.
Dynamo Player
Waste Sumps
Figure13:Wastesumptowastesumpconnectionsbasedondesignandeditedmodel
34
InputForm
TheBIM professional would click the play icon to run the script and aninput form as shown in Figure 13 would be displayed. Step six, messages are displayed to prompt the BIM professionaltoselect the componentsin theirdesiredorders. When heisdone,hewould click ‘Finish’ displayed on Revit. Step seven, the BIM professional would input the design requirementsprovidedbytheMEPengineerforpipecreation.Thisincludes slopingdirection, pipe sloping gradient, pipe type,pipe system type, referencelevel for pipe and pipe diameter.
The next is to check if they comply to the design requirements from the COP and ask the MEP engineerifchangescouldbemadeifnecessary.
Step eight, the BIM professional would click ‘Generate’ on the input form. Pipe connections would be generated according to the inputs provided. Step nine, a final check on inspection chamber to inspection chamber connections and inspection chamber to manhole connections would be conducted. Similar to the traditional workflow, a backdrop or tumbling bay connection is required if the design requirements for hydraulic drop are not met. Step ten, section views would be cut using the section tool in Revit to check on the alignment of the generated pipes. Step eleven, the size, discipline, gradient, and pipe length of the generated pipes would be annotated. Similar to the traditional workflow, If rework on the model is notified at any point during this workflow or after review, the steps have to be repeated accordingly.
4.3.6 FindingsfromExperiment2
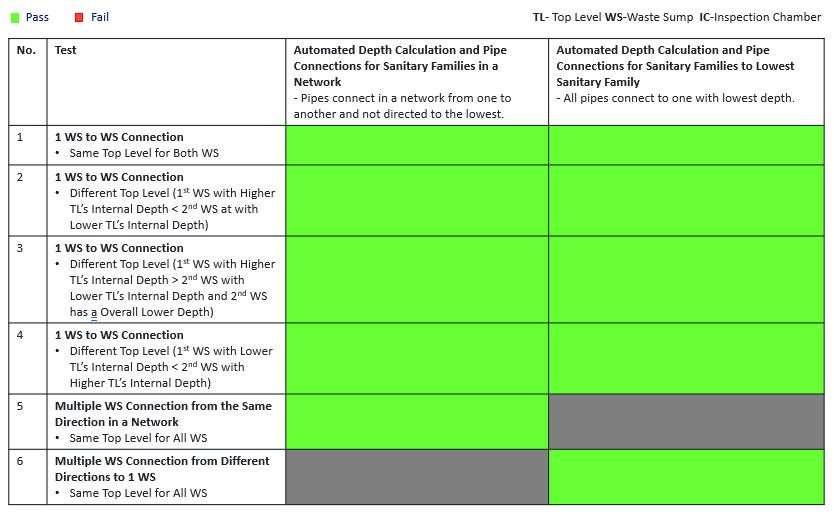
Tests were conducted on the model created and their pass and fail results during Experiment1weredocumentedunderTable3.
35


36
Table3:ResultsfromExperiment2 0
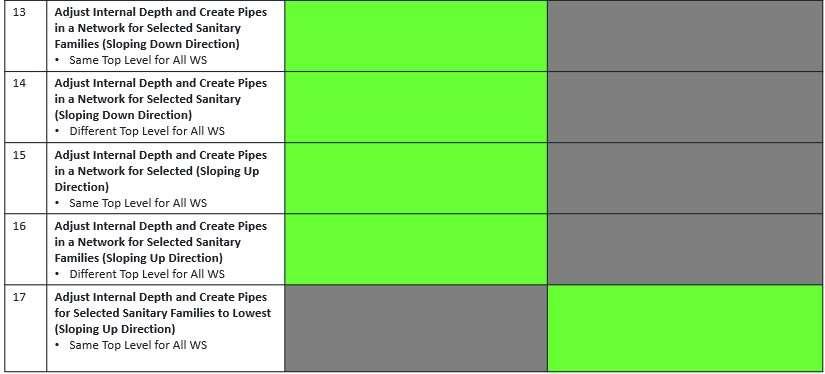
Table 3 shows that no errors were generated from both new Dynamo scripts. Test conditions 11 to 18 were developed to conduct further testing on the quality of work when the new Dynamo scripts were in use. Certain test conditions such as multiple waste sump connections to 1 waste sump from different directions in a network were deleted to provide flexibility while othertest conditions such as multiple waste sump connections from the same direction in a network for components with different top levels and multiple waste sump connections to one waste sump from different directions for components with different top levelswerecoveredintheaddedtestconditions.
4.4 Phase4–Evaluatingtheperformanceandadoptabilityofthesolution
Survey results on the understanding of the experiment guide provided before Experiment3 weretabulatedintoTable2.
Table2:Survey2resultsonunderstandingexperimentguide
Survey Question on Understanding of Experiment Guide
N/10 Response Rate Mean SD 95ci upper lower
Q1.Doyouhaveanyotheruncertaintiesbeforeproceedingwiththeexperiment?
Yes 2 100% 0.2 0.42 0.46 -0.05 No 8 0.8 0.42 1.06 0.54
Whenaskediftheyhadanyotheruncertaintiesbeforeproceedingwiththeexperiment, the‘No’ responseobtainedameanvalueof0.8,upperconfidenceintervalof1.06andlower confidence intervalof0.54.The‘Yes’responseobtainedameanvalueof0.2,upperconfidence intervalof 0.46andlowerconfidenceintervalof-0.05.
37
ThemeanvalueperitemanalysedfromUEQquestionsfoundinSurvey3forthetraditional workflowisshowninFigure14.
MeanvalueperItem
-3 0123
notunderstandable/understandable
difficulttolearn/easytolearn notinteresting/interesting slow/fast conventional/inventive obstructive/supportive usual/leadingedge notsecure/secure
doesnotmeetexpectations/meetsexpectations


Figure14:MeanvalueperitemoftraditionalworkflowfromSurvey3
Figure 14 shows that there were more negative evaluations towards the traditional workflow. The evaluations were found to be highly negative with an average mean value of -1. The bottom three negative evaluations were that it was found tobe dull, usual and conservative while the top three positive evaluations were that it met their user expectations, waseasy to learnandwassecure.
38
ThemeanvalueperitemanalysedfromUEQquestionsfoundinSurvey3fortheexisting DynamoworkflowisshowninFigure15.


MeanvalueperItem -3 0123
notunderstandable/understandable difficulttolearn/easytolearn notinteresting/interesting slow/fast conventional/inventive obstructive/supportive usual/leadingedge notsecure/secure doesnotmeetexpectations/meetsexpectations
Figure15:MeanvalueperitemofexistingDynamoworkflowfromSurvey3
Figure 15 shows that there were more negative evaluations towards the existing Dynamo workflowwithanaveragemeanvaluebetween0and-1.Thebottomthreenegative evaluations were that it was found to be unattractive, unfriendly, and dull while the top three positive evaluationswerethatitwaspleasant,organisedandefficient.
39
The mean value per item analysed from UEQ questions found in Survey 3 for the new DynamoworkflowisshowninFigure16.
MeanvalueperItem -3 0123


notunderstandable/understandable difficulttolearn/easytolearn notinteresting/interesting slow/fast conventional/inventive obstructive/supportive usual/leadingedge notsecure/secure doesnotmeetexpectations/meetsexpectations
Figure16:MeanvalueperitemofsolutionfromSurvey3
Figure 16 shows that there were no negative evaluations towards the existing Dynamo workflowwhereallparticipantshadpositiveevaluationswithanaveragemeanvalueof2.The topthreepositive evaluationswerethatit was foundto be clear,innovative, andmeetingtheir expectations.
40
UEQ benchmarks analysed from UEQ questions found in Survey 3 for the traditional workflowisshowninFigure17.
Excellent Good AboveAverage BelowAverage Bad Mean
Figure17:UEQbenchmarkoftraditionalworkflowfromSurvey3
Based on the benchmark found in Figure 17, the attractiveness, perspicuity, efficiency, dependability, stimulation and novelty of the traditional workflow were all found to be bad. Attractiveness of the traditional workflow had a mean value of -1 while factors such as efficiency, stimulation and novelty had a mean value below -1. UEQ benchmarks analysed fromUEQquestionsfoundinSurvey3fortheexistingDynamoworkflowareshowninFigure 18.
Excellent Good AboveAverage BelowAverage Bad Mean


Figure18:UEQbenchmarkofexistingDynamoworkflowfromSurvey3
Based on the benchmark found in Figure 18, the attractiveness, perspicuity, dependability, stimulation and novelty of the existing Dynamo workflow were found to be bad while its efficiency was evaluated as below average. UEQ benchmarks analysed from UEQ questions foundinSurvey3forthenewDynamoworkflowareshowninFigure19.





41
Excellent Good AboveAverage BelowAverage Bad Mean

Figure19:UEQBenchmarkofSolutionfromSurvey3
Based on the benchmark found in Figure 19, the attractiveness, perspicuity, efficiency, dependability, stimulation and novelty of the traditional workflow were all found to be excellent with an average mean value of 2. The results from Experiment 3 measuring the number of errors, number of queries and time taken to complete the drawings were next tabulatedintoTable4.


Table4:Experiment3results
ExperimentResults N/10 Response Rate Mean SD 95ci upper lower
NumberofErrorsGenerated 10 100% 1.2 1.03 1.84 0.56


NumberofQueriesRaised 10 100% 1.5 1.08 2.17 0.83
TimeTakentoComplete[mins] 10 100% 6.5 1.08 7.17 5.83
A mean value of 1.2 with an upper confidenceinterval of 1.84 and lower confidence interval of0.56wasobtainedwhenobservingthenumberof errorsgeneratedbyeach participantduring Experiment 3. A mean value of 1.5 with an upper confidence interval of 2.17 and lower confidence interval of 0.83 was obtained when observing the number of queries raisedby eachparticipantduringtheexperiment.Ameanvalueof6.5withanupperconfidence interval of7.17andlowerconfidenceinterval of5.83wasobtainedwhen measuring thetime takento completewithastopwatch.SurveyresultsonthelikelihoodofusingthenewDynamo workflow forthesanitarydischargesystemweretabulatedintoTable5.
42
Table2:Survey3resultsonlikelihoodofusingthesolution Survey Questions on Adoptability of Solution
N/10 Response Rate Mean SD 95ci
upper lower
Q1.DoyouforeseeyourselfusingthedevelopedDynamoscriptsinsteadofthe existing methodsfor modellingofthesanitarydischargesystem?
Yes 10 100% 1 1 1 1 No 0 0 0 0 0
A mean value of 1 for the ‘Yes’ response was obtained when participants were asked if they foresee themselves using the developed Dynamo scripts instead of existing methods for modelling of the sanitary discharge system. After conducting the survey and experiments, labour productivity was calculated. To determine the number of work hours saved peryear, it was assumed that the projects in each year were all similar to the existing project model used fortheexperimentsintermsofsizeandcomplexityofsanitarydischargesystemdesign.Other assumptions were made for the number of times the Dynamo scripts would be used per year, consistent number ofhours savedwith the useofDynamo and anequal numberofhoursused to develop the scripts. Users may only utilize the Dynamo scripts occasionally due to preferenceorwhetherthedesignissimpleenoughtobecompletedusingthemanualmodelling method. Not to mention, other solutions may be developed within that year where improvements are made to the existing script as such is the case for this project. Calculations usingthelabourproductivityformulabasedonthelistedassumptionsareasfollows.
Estimatedtimedspenttocompletethemanualmethod=30minutes=0.5hours
NumberoftimesnewDynamoworkflowisused=720timesifusedthreetimesaweek by5 workers
Time saved with each run of new Dynamo workflow (Table 4) = 6.5 minutes = 0.108 hours Developmenttime=2weeks
Number of work hours saved or wasted for the first year using the new Dynamo workflow= [720timesx(0.5–0.108)]-(2x x5)=282–112=170hours
Number of work hours saved or wasted for the second and following years using the new Dynamoworkflow=282hours
43
5.0 DISCUSSION
Thissectionprovidesaninsightintotheobservedresultsfromtheexperimentconductedtotest theeffectivenessandefficiencyofthedevelopedsolution.
5.1 Phase1–Understandingworkflowsanddesignrequirements
While the design process for the sanitary discharge system consisted of only three steps, the modellingprocessusingexistingworkflowswerefoundtobetedious.Intotal,thereareten steps requiredforthemodellingprocesswhen thetraditionalworkflowisbeingused.Although ten steps are listed, many steps are repeated from 10 to 100 times per project. Some of which includesthecuttingofsectionviews,measurementofcentretocentreforcomponents,manual calculationsfortheinternaldepthofcomponentsandalignmentofpipestothebottomofprior components. Analysing the existing Dynamo workflow, a total of eleven steps were listed. Althoughit appearedtohavemoresteps than thetraditionalworkflow, some stepssuchasthe alignment ofpipes to thebottom ofthepriorcomponentwereeliminated.Thestepsto runthe existing Dynamo script were much shorter than the process of aligning pipes individually. Overall,theexistingDynamoscriptmanagedtogeneratepipeconnectionsbutdidnotmanage to eliminate many other repetitive steps as listed. The documented workflow was verified by MEPDesignEngineer1tobecorrectduringtheinterview.
In total, there are seven design requirements for the sanitary drainage system that BIM professionals must be aware of. They are internal depth, pipe gradient, pipe length, pipe size, pipe material, hydraulic drop and that the last inspection chamber has to be close to the manhole. Recorded design requirements from observations conducted on five BIM professionals and MEP engineers working on projects with sanitary discharge systems were proventobeincorrectthroughaninterviewheldwithMEPDesignEngineer1.Thishighlights a concern where although BIM professionals are familiar with the workflow of a sanitary discharge system, design requirements were not effectively communicated between MEP engineersandBIMprofessionals.Thisultimatelyaffectsthequalityofworksasnon-compliant projectsmaybesubmitted.
5.2 Phase2–Evaluatingtheperformanceanduserexperienceofexistingworkflows
Positive evaluations and negative evaluations are reflections of the users’ experience when
44
utilizing the existing workflows. When data collected from UEQ questions in Survey 1 were found to have more positive evaluations, it means that the survey participants feel that there are more advantages than disadvantages brought about by utilizing the workflows. Likewise, if more negative evaluations are present, it means that the survey participants feel thattherearemoredisadvantagesthanadvantageswhenusingsuchworkflows.
FromtheresultsoftheanalysisonmeanvalueperitemandUEQbenchmarkforthe traditional workflow,BIMprofessionalsfeltthatthetraditionalworkflowwasdisadvantageous for certain characteristics while advantageous for others when compared to the existing Dynamo workflow. Perspicuity and dependability of the traditional workflow was found tot be better thanthe existing Dynamoworkflow while efficiency, stimulation and novelty of the Dynamo workflowwas found tobebetterthantheother.This showsthat while BIM professionals felt that the existing Dynamo workflow requires lesser effort to complete the sanitarydischarge system, is more interesting to use and is innovative, there are still chances that they may continue to utilize the traditional workflow as it is understandable, easy to use andtheyfeel more in control when using the conventional method that they are familiar with. From this interpretation, it is possible that the existing Dynamo workflow may not be adopted as adoptabilityanduserexperiencearecorrelated.
From the results gathered from other questions in Survey 1, it was discovered that BIM professionals often receive projects requiring the modelling of sanitary discharge systems thrice a week. Its frequency of use supports the need for this study to produce a innovative solution increases the effectiveness of the process. Another survey question discovered that mostBIMprofessionalsdidnotwanttousetheexistingDynamoscriptsdespiteitscapabilities in improving efficiency. Qualitative data gathered from the UEQ questions were supporting evidenceasothercharacteristicssuchasitsdependabilityandeaseofuse areconsideredwhen selecting a workflow to use as well. When analysing features to integrate into the solution, most BIM professionals preferred generated calculations, followed by automated checks for compliance and lastly alignment of pipes. Their preference of features to be integrated could signify that the present workflows for such functions may be problematic and are to be improved on.
5.3 Phase3–Creationanddevelopmentofsolution
45
Dynamo was selectedas the desiredBIM tool to beused forthecreation and development of solution in this project. This was as previous research have supported that Dynamoishighly adoptable at present as it is in-built in Revit software and allows integration with other programming languages. The two new Dynamo scripts developed were then tested in Experiment 1 to identify present errors to resolve. Although the existing Dynamo script was developedtoreducethetimespentonthemodellingprocessandimprovethequality ofwork, it was found to be not as effective as imagined. The script focused only on pipe generations and thesteps for calculation ofeach element’s internaldepthstill had tobedone manually. In addition, there were occurrences when multiple errors were present such as incorrect sloping direction, pipes generated that do not meet the design requirements and pipes that were not generatedatall.Thiswouldultimatelyaffectthequalityofworkdeliveredtotheclients.
Afterdevelopingthesolution,thenewDynamoworkflowconsistedofelevensteps. However, many repetitive steps such as cutting of section views, measurement of centre to centrefor components,manualcalculationsfortheinternaldepthofcomponentsandalignment of pipes to the bottom of prior components were eliminated. Simply steps remained such as placing the components into Revit, selecting the components, inputting their properties, generating pipe connecting and automatic adjustments of internal depth. Despite adding more testing conditions for the new Dynamo scripts, no errors were generated when running the scripts. ThisshowsthatnotonlydothenewDynamoscriptsresolveerrors,thequalityofwork produced isalsoimproved by integrating additional features that eliminate repetitive work and human error.
5.4 Phase4–Evaluatingtheperformanceandadoptabilityofsolution
When providing participants with the experiment guide, most of them did not have any questions.However,somedidhavequeriesandthishighlightedaneedtoimproveontheclarity of the provided guide. From the results of the analysis on mean value per item and UEQ benchmark for the three workflows, BIM professionals felt that the existing workflows were disadvantageous. While the existing Dynamo workflow was still found to be more advantageous than the traditional workflow, poorer user experiences were recorded when compared to the previous UEQ benchmarks from Survey 1. Both existing workflows scored lower in terms of their ease of usage and effort required to complete the modelling of the sanitary discharge system. The felt less in control of the processes and felt that the existing
46
workflows were more uninteresting and conventional than before. This shows that when in comparison with the new Dynamo workflow, users would have a different user experience as thenewworkflowinfluencestheirperceptions.
BIM professionals now had the greatest number of positive evaluations for the new Dynamo workflow.Whencomparedtotheothertwoworkflows,thenewDynamoscriptswere found to be exceedingly advantageous, obtaining excellent across all six scales. The survey participantsfeltthatthesolutiondesignedwaseasytouse,requiredlittleefforttocompletethe modelling of the sanitary discharge system, interesting, innovative and were still able to still feel a sense of control whileusing the scripts. Quantitativedata such as the number of errors, number of queries raised and time taken to complete the modelling of the sanitary discharge system areuseful indicatorsofthelabourproductivity ofexisting andnewworkflows.During theexperiment,onetotwoerrorsandweregeneratedonaveragewithameanvalueof1.2.One to two queries were raised during the experiment as well. In the construction industry, such queries are also known as ‘Request for Information’ which is a factor contributing largely to project delay. Fortunately, there were few errors and requests for information during Experiment3,highlightingthatthenewDynamosolutionwasaccurateandclear.Onaverage, participants took 6.5 minutes to complete the given task which is fairly low compared to the estimated10minutesallocatedforthem.
All of the participants for Experiment 3 agreed that they could foresee themselves using the developed Dynamo scripts instead of existing methods for modelling of the sanitary discharge system. The new Dynamo workflow proved to not only excel in its user experience butwasequallyeffectiveinimprovingthequalityofworkandtimespentoncompletionofthe system. When translating the results to labour productivity, multiple assumptions had to be madeonthe numberofprojectswithsanitarydischargesystemsreceivedperyear,complexity ofdesign according to the sizeof project and frequencyof use. Aftermaking the assumptions stated,thenewDynamoworkflowasfoundtosaveupto170labourhoursduringitsfirstyear of use and up to 282 labour hours during the following years as development time no longer hasto be considered. The calculatedlabourhours aresignificant onan organizational scale as theyreflectthecostsavingsthatcouldbegenerated.
47
6.0
CONCLUSION
Themodellingofsanitarydischargesystemisacrucialareatobeimprovedon.When analysing existingworkflowsusedaconsultancyfirm,thetraditionalmodellingworkflowwas observed to be tedious and inaccurate as discrepancies such as incorrect calculations or misalignments during the repetitive work resulted in multiple revisions. Adjustments of elementpropertiesandcalculationsmustthenberedonewitheveryrevisionaswell.Whilethe existing Dynamo workflow was proven to be more efficient to use as compared to the traditional workflow, it had a low adoptability where the existing scripts were barely utilized asusersperceivedthemtobehardtouseandineffectiveinincreasingtheirworkproductivity. The new Dynamo workflow developed in this study provided users a better work experience than the existing modelling workflows. The new Dynamo workflow significantly reduced labourhoursrequiredforcompletingthegivenmodellingtasksaccurately.
ACKNOWLEDGEMENT
ThesupportoftheSingaporeInstituteofTechnologyincarryingoutthisappliedresearchstudy is gratefully acknowledged. Ms. Chua Jing Ting Jamie did the work and contents of this paper as part of her BEng final year design project in the Sustainable Infrastructure Engineering (BuildingServices)programme.Dr.Moshood Olawale Fadeyi guided the developmentof the prototypesolutionandexperimentaldesigntotesttheeffectivenessofthedevelopedsolution. Dr.Fadeyialsocontributedtothedevelopmentofthisarticle.
REFERENCES
Asl, M. R., Zarrinmehr, S., Bergin, M., and Yan, W. (2015). BPOpt: A framework for BIMbasedperformanceoptimization. EnergyandBuildings, 108,401-412.
Baldwin,A.N.,Shen,L.Y.,Poon,C.S.,Austin,S.A.,andWong,I.(2008).Modellingdesign information to evaluate prefabricated and pre-cast design solutions for reducing construction wasteinhighriseresidentialbuildings. AutomationinConstruction, 17(3),333-341.
Batarseh, S.,and Kamardeen, I. (2017). The impact of individual beliefs and expectations on BIMadoptionintheAECIndustry. EPiCSeriesinEducationScience, 1,466-475.
Chen,W.,Chen,K.,Cheng,J.C.,Wang,Q.,andGan,V.J.(2018).BIM-basedframeworkfor
48
automaticschedulingoffacilitymaintenanceworkorders. AutomationinConstruction, 91,1530.
Chidiebere, E., and Ebhohimen, I. (2018). Impact of Rework on Building Project and Organisation Performance: A View of Construction Professionals in Nigeria. International Journal of Sustainable Construction Engineering Technology, 9(1), 29-44.
Fan, S. L., Skibniewski, M. J., and Hung, T. W. (2014). Effects of building information modelingduringconstruction. JournalofAppliedScienceandEngineering, 17(2),157-166.
Ignatova, E., Zotkin, S., and Zotkina, I. (2018, June). The extraction and processing of BIM data. In IOP Conference Series: Materials Science and Engineering, 365(6), 062033. IOP Publishing.
Khosakitchalert, C., Yabuki, N., and Fukuda, T. (2018). The accuracy enhancement of architectural walls quantity takeoff for schematic BIM models. In ISARC. Proceedings of the International Symposium on Automation and Robotics in Construction, 35, 1-8. IAARC Publications.
Li, J., Hou, L., Wang, X., Wang, J., Guo, J., Zhang, S., and Jiao, Y. (2014). A project-based quantificationofBIMbenefits. InternationalJournalofAdvancedRoboticSystems, 11(8),123.
Love, P. E. D. (2002a), Auditing the indirect consequences of rework in construction: a case basedapproach. ManagerialAuditingJournal,17(3),138–146.
Love,P.E.D.(2002b),InfluenceofprojecttypeandprocurementMethodofReworkCostsin Building Construction Projects. Journal of Construction Engineering and Management, 128 (1):129.
Love, P. E., and Edwards, D. J. (2004). Determinants of rework in building construction projects. Engineering,ConstructionandArchitecturalManagement 11(4),pp.259-274.
Nezamaldin, D. (2019). Parametric design with Visual programming in Dynamo with Revit: The conversion from CAD models to BIM and the design of analytical applications [Ebook]
49
(p.7). Stockholm: KTH Royal InstituteofTechnology.
Poirier,E.A.,Staub-French,S.,andForgues,D.(2015).MeasuringtheimpactofBIMonlabor productivity in a small specialty contracting enterprise through action-research. Automationin Construction, 58,74-84.
Rahman, I. A., Memon, A. H., Karim, A. T. A., and Tarmizi, A. (2013). Significant factors causing cost overruns in large construction projects in Malaysia. Journal of Applied Sciences, 13(2),286-293.
Reinhardt, J., and Mathews, M. (2017). The automation of BIM for compliance checking: a visual programming approach. CITA BIM Gathering 2017, November 23rd-24th November 2017,CrokePark,Dublin,Ireland.
Röck, M., Hollberg, A., Habert, G., and Passer, A. (2018). LCA and BIM: Visualization of environmental potentials in building construction at early design stages. Building and Environment, 140,153-161.
Santoso, H. B., Nurrohmah, I., Suci, F., and Goodridge, W. H. (2017). Evaluating and Redesigning the Self-Monitoring Tool. International Journal on Advanced Science, EngineeringandInformationTechnology, 7(1),228.
Schrepp, M., Hinderks, A., and Thomaschewski, J. (2014). Applying the user experience questionnaire (UEQ) in different evaluation scenarios. In InternationalConferenceofDesign, UserExperience,andUsability,383-392.Springer,Cham.
Vilutiene, T., Hosseini, M. R., Pellicer, E., and Zavadskas, E. K. (2019). Advanced BIM applicationsintheconstructionindustry. HindawiAdvancesinCivilEngineering, 1-3.
Wang,X.,and Love,P.E.(2012).BIM+AR:Onsiteinformationsharingandcommunication viaadvancedvisualization.In Proceedingsofthe2012IEEE16thInternationalConferenceon ComputerSupportedCooperativeWorkinDesign(CSCWD) (pp.850-855).IEEE.
50
SUPPLEMENTARYINFORMATION(SI)
SI-A:Designandmodellingworkflowofexistingmethods.
SI-B:StepstocreateexistingDynamoscripts
SI-C:Presentationslides
51
SI-A:Designandmodellingworkflowofexistingmethods.
CommonNodes
NodeDictionary
TypeofNodes Input Output
Point.ByCoordinates
Formpointby3givencoordinates x –defaultvalue:0 y –defaultvalue:0 z–defaultvalue:0
point
point x –x coordinate y –y coordinate z–zcoordinate Number (InputNode)
Points.DeconstructPoint ReturnstheX,Y,Zcoordinatesofa point
NIL > String (InputNode) Seriesofcharactersortext Entertext
Createnumber Entervalue
NIL > NumberSlider (InputNode)
Dynamicnumericvalueforwhole anddecimalnumbers
Slidetonumber,editminmax andstepifneeded.
IntegerSlider (InputNode)
Dynamicnumericvalueforwhole numbers
Slidetonumber,editminmaxand stepifneeded.
NIL >
NIL >
52
Range
Createasequenceofnumbersor lettersinthespecifiedrange
start–number/letter tostartsequenceat defaultvalue:0 end– number/letterto end sequence at default value:9 step–spacebetween thenumbersorletters, defaultvalue:1
seq–Newsequence
Sequence
Createasequenceofnumbers
seq–Newsequence > > Boolean Selectionbetweentrue/false NIL NIL + Addxtoy x–xvalue y–yvalue var[]..[]ysubtractx x–xvalue y–yvalue var[]..[] * Multipliesxbyy x–xvalue y–yvalue var[]..[] / Dividesxbyy x–xvalue y–yvalue var[]..[]
53
start–number/letter tostartsequenceat defaultvalue:0 amount–amountof numbersinthe sequence,default value:10 step–spacebetween thenumbersorletters, defaultvalue:1 Watch (OutputNode) Visualizeoutputorresultofnode
Number:*value*;
Range: *value*..*value*..*value*;
Sequence: *value*..#*value*..*value*;
List:list[*value*];
Boolean:“true”;or“false”;
Listoflist: list[*value*][*value*]
Rangefromlistoflist: lst[*value*][*value...*value*]
onlist-
54
== Checkifx=y x–xvalue y–yvalue var[]..[] Count Returnsnumberofitemsinthe specifiedlist list–listofvalues int s CodeBlock (InputNode) AllowsforDesignScriptcodetobe authoreddirectly
Retrieve[0]listedfirst
*x[0]* NIL > Line.ByStartPointEndPoint Createstraightlinebetweentwo inputpoints startPoint,endPoint Line SelectModelElement(s) (InputNode) Selectmodelelement(s)from documenteg.Revit Selectsingle/multipleelements frommodel NIL Element(s)–the selectedelement(s)
ElementTypes (InputNode)
Allelementsubtypes
Dropselectionforelementtypes
NIL Types–theselected types
AllElementsofType Getallelementsofspecifiedtype elementtype Elements–all elementsintheactive documentofagiven type
AllElementsinActiveView (InputNode) Selectallelementsinactiveview
Categories (InputNode) Allbuilt-incategories Dropselectionforcategories
AllElementsofCategory Getallelementsofspecified category
NIL elements–getall visibleelementsin theactiveview
NIL Category–the selectedcategory
Category Elements–element type
Family.Name Nameofthisfamily Family–Revit.Elements.Family string FamilyTypes (InputNode) Allfamilytypes Dropselectionforfamilytypes
NIL FamilyType–the selectedfamilytypes FamilyInstance.Location Getsthelocationofthespecific familyinstance
familyInstance–Revit.Elements.Family Instance
Point
AllElementsofFamilyTypes FamilyType Elements–thelistof elementsmatching thequery
55
Element.GetParameterValueBy Name Getvalueofoneoftheelement’s parameter
element–Revit.Elements.Elemen t parameterName–nameoftheparameter toset
var[]..[]
Element.SetParameterByName Setoneoftheelement’s parameters
element–Revit.Elements.Elemen t parameterName–nameoftheparameter toset value-number
Element Element.TemporarilyIsolateinVi ew
Temporarilyisolateselementsin thegivenview
Element.Parameters ObtainalloftheParametersfrom anElement
Element.OverrideColorinView
Overridetheelement’s colorinthe activeview
view,element view–returnvalue element–return value
Element–Revit.Elements.Elemen t
element–Revit.Elements.Elemen t color–colortoapply toasolidfillonthe element
Color.ByARGB Constructacolorbyalpha,red, greenandbluecomponents
a–alphavalue,default value:255 r–redvalue,default value:0 g–greenvalue,default value:0
Parameter[]
element
color
56
List.Create Makesanewlistoutofthegiven inputs
List.GetItemAtIndex
Returnitemfromgivenlistat specifiedindex
List.TakeItems
Fetchesanamountofitemsfrom startoflist
b–bluevalue,default value:0
item0–itemindex#0 item1–itemindex#1 list
list–listtofetchan itemfrom index–indexofthe itemtobefetched
list–listtotakefrom amount–amountof itemstotake.If negative,itemsare takenfromtheendof thelist
List.FilterByBoolMask
Filterasequencebylookingup correspondingindicesinaseparate listofBooleans
list–listtofilter mask–listof Booleansrepresenting amask
item–iteminthelist atthegivenindex
list–listofextracted items
List.Transpose Swaprowsandcolumnsinalistof lists
in–itemswhose maskindexistrue out–itemswhose maskindexisfalse
Lists–listtobe transposed,var[]..[] lists–alistof transposedlists
List.AddItemtoFront
Additemtobeginningoflist item–itemtobe added,canbeanobject oralist list–listtoaddto
List.RemoveItemAtIndex
Removesanitemfromthegiven listatthespecifiedindex
list–newlist
list–listtoremovean itemoritemsfrom list–listwithitems removed
57
indices–indexor indicesoftheitem(s)to beremoved
Sortlistbasedonitskeys list–listtobesorted, var[]..[] keys–listofkeys, var[]..[]
List.SortByKey
sortedlist,sorted keys
List.OfRepeatedItem
Createsalistcontaininggivenitem thegivennumberoftimes
SortIndexByValue Sorts a specified list by the values ofits membersin eitherascending ordescendingorder
Flatten
Returntheflattened1Dlistofthe multidimensionalinputlist.Ifthe inputisasinglevalue,returnsthat value.
item–itemtorepeat amount–numberof timestorepeat
list–listofvalues, double[] ascending–bool
int[]
list–listofvalues, var[]..[] var[]..[]
Document.Current (InputNode) Getthecurrentdocument
document–Revit.Application.Doc ument
view
NIL Document Document.ActiveView Gettheactiveviewforthe document
IsolatedPickModelElements (From“Rhythm”Package) Allowmultipleselectionof elementsofspecifiedcategory
Springs.Collector.CurrentSelecti on
refresh–bool,default value:false category–var[]..[]
Elements–return value
refresh–bool,default value:false element(s)–return value
58
(From“springnodes”Package)
Getsthecurrentlyselected elements.ConnectaBoolean switchtorefreshtheselection
Input (for Custom Nodes) (Input Node) Specifythe type anddefault value forparameter *x:double* Doubleisafundamentaldatatype usedtodefinenumericvariables holdingnumberswithdecimal pointsandisrecognizedasatype. Adoubletypecanrepresent fractionalaswellaswholevalues
NIL >
Output (for Custom Nodes) (Input Node) Specifythe type anddefault value forparameter
> NIL StringfromObject Convertanobjecttoastring representation
obj–objecttobe serialized str–resultofmath computation
string0–Listof stringstoconcatenate string1–Listof stringstoconcatenate Line,PipeType, SystemTypeandDiameter
Createapipeby
–var[]..[] Pipes–returnvalue
str–stringmadeof strings Pipe.ByLines Lines–var[]..[] PipeType–var[]..[] SystemType–var[]..[] Level–var[]..[] Diameter
59
String.Concat Concatenatesmultiplestringsinto asinglestring
UI.SelectModelElementsData
CreateaRevitelementselection inputforUI.MultipleInputForm++
InputName–string, defaultvalue:“Input” ButtonText–string, defaultvalue:“Select ModelElement(s)” CategoryFilter–var[], defaultvalue:“”
SelectSingleElement–bool,defaultvalue: false
SelectModelElement sinput–returnvalue
UI.DropDownData
CreatedataforDropDowninputin UI.MultipleInputForm++
InputName – string, default value: “Input” Keys:[]–var[]..[] Values:[]–var[]..[]
DefaultValueIndex–int,defaultvalue:null
DropDowninput–returnvalue
UI.TextBoxData
CreatedataforTextBoxinputin UI.MultipleInputForm++
UI.MultipleInputForm++
Createaformwithmultipleinputs
InputName–string, defaultvalue:“Input” DefaultText–string, defaultvalue: “Default”
Description_optional –string,defaultvalue: “”
Logo_optional–var, defaultvalue:“” ButtonText–string, defaultvalue:“Set Values”
Inputs–var[]..[] Toggle–bool,default value:“false”
TextBoxinput–returnvalue
UserInputs–return value
WasRun–return value
WasCancelled–returnvalue
60
LinktoHelp_optional
–string,defaultvalue: “null”
CancelButtonText_op tional–string,default value:null MaxHeight_optional –int,defaultvalue:0 Width_optional–int, defaultvalue:350 ExcelNodes
FilePath (InputNode)
Selectafileonthesystemtogetits filename - Browsebutton
NIL > File.FromPath Createafileobjectfromapath path–pathtothefile file–fileobject Excel.ReadFromFile ReaddatafromExcelbyrowand returninaseriesoflistsbyrow. ValueincellA1is[0,0]
file–representthe MicrosoftExcel spreadsheet sheetName–nameof worksheetcontaining data readAsStrings–toggletoswitch betweenreadingexcel fileasstringsonlyor not,bool,default value:fale
data–rowsofdata fromtheexcel worksheet
Excel.WriteToFile filePath–filepathto excelspreadsheet data–datawrittento spreadsheet
61
WritedatatoExcelbyrowwith
sublistswritteninsuccessiverows. ValueincellA1is[0,0]
sheetName–nameof worksettowritedatato startRow–enter0for row1.1forrow2etc. startCol,data,–enter 0forcolumnA,1for columnB,etc. data–datawrittento spreadsheet overWrite–bool, defaultvaluet:false
62
CommonFunctions
No. Function Nodes
Watch/ListNumbersofSpecified Range
- Number>[start][end][step]Range> Watch OR - CodeBlock>Watch
Watch/ListNumbersofSpecified Sequence
- Number>[start][amount][step] Sequence>Watch OR - CodeBlock>Watch
Select/ObtainItemsonList - Watch>[list]List.GetItemAtIndex - CodeBlock>[index] List.GetItemAtIndex - List.GetItemAtIndex>Watch OR - Watch>CodeBlock>Watch
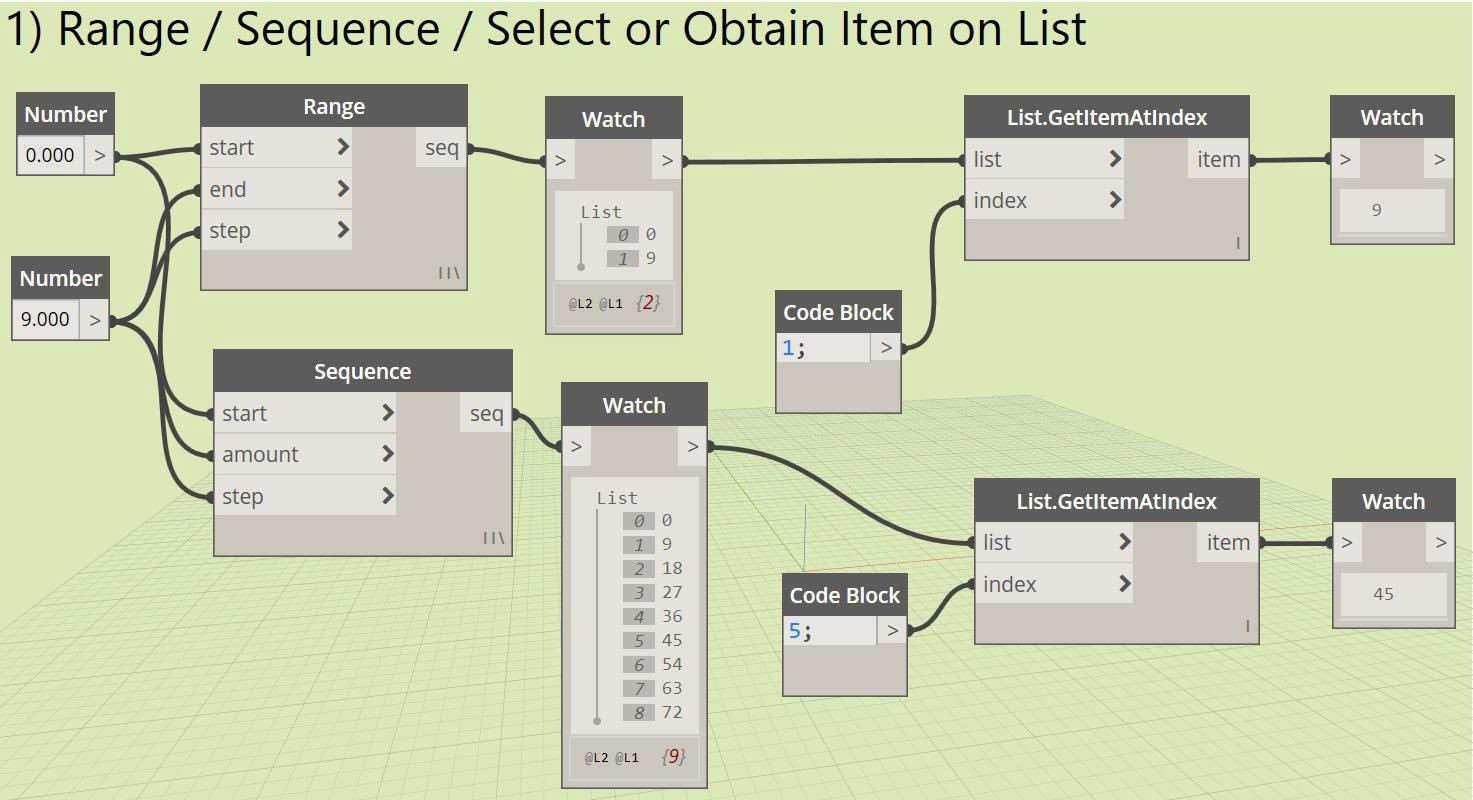
63
- Watch>[list]List.GetItemAtIndex
- CodeBlock>[index] List.GetItemAtIndex - List.GetItemAtIndex>[list] List.GetItemAtIndex - CodeBlock>[index] List.GetitemAtIndex - List.GetItemAtIndex>Watch OR

64
ObtainItemsonListofList
Select/
Lacing Determineshowtheinputport shouldusethedata.Bottomright cornerofnode.Shortest/Longest/ CrossLacing. - Changelacing
Sequence> Point.ByCoordinates> Line.BystartPointEndPoint - ChangeLacing Rightclickicon>Lacing
Watch>CodeBlock>Watch
CodeBlock>
SearchforCustomNodes(Package Manager)
- Downloadandinstallpackage - Downloadandinstallpackage Packagestoolbar>selectsearchfora package>searchinsearchbar/right clicksortbynumberofvotesor downloads>clickdownloadicon
65
ConvertSingle/MultipleNodesto Code
**Cannotrevertcodeblockbackto node
Selectnode/multiplenodes>right clickonemptyspace>selectnodeto code
CreateCustomNode–Create PercentageCustomNode
FileinDynamo>New>CustomNode >InputPercentageforName>Input Calculatethepercentagevalueofone valueinrelationtoanotherfor Description>InputCore.Mathfor Category
Input*x:double*>[x]CodeBlock *(x/y)&100;*

Input*y:double*>[x]CodeBlock *(x/y)&100;*>StringfromObject> [string0]String.Concat
CodeBlock“%”>[string1]>Output “percentage”
66

67 ConvertExistingNodestoCustom Nodes
Selectnode/multiplenodes>right clickonemptyspace>selectcustom node
InputName,DescriptionandCategory ofCustomNode
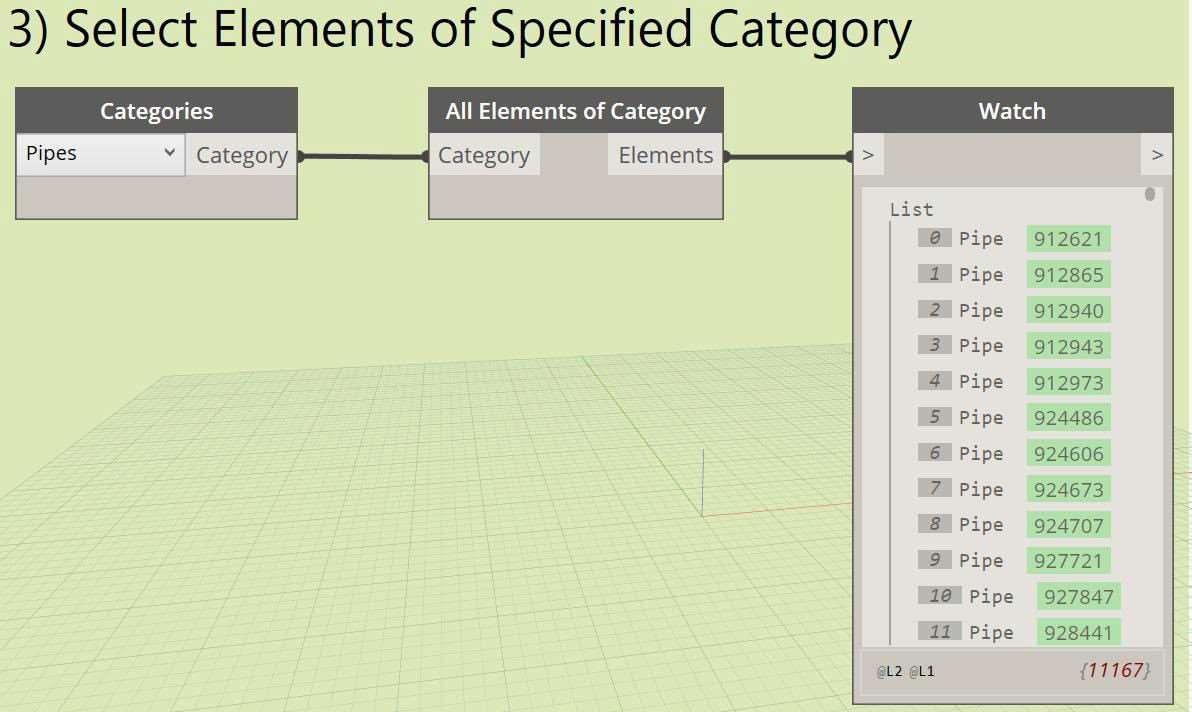
68 SelectAllElementsinProjectof SpecifiedCategory Categories>AllElementsofCategory >Watch
SelectAllElementsinProject SystemofSpecifiedElementType
ElementTypes>AllElementsofType >Watch
SelectAllElementsinProject SystemofSpecifiedFamilyType
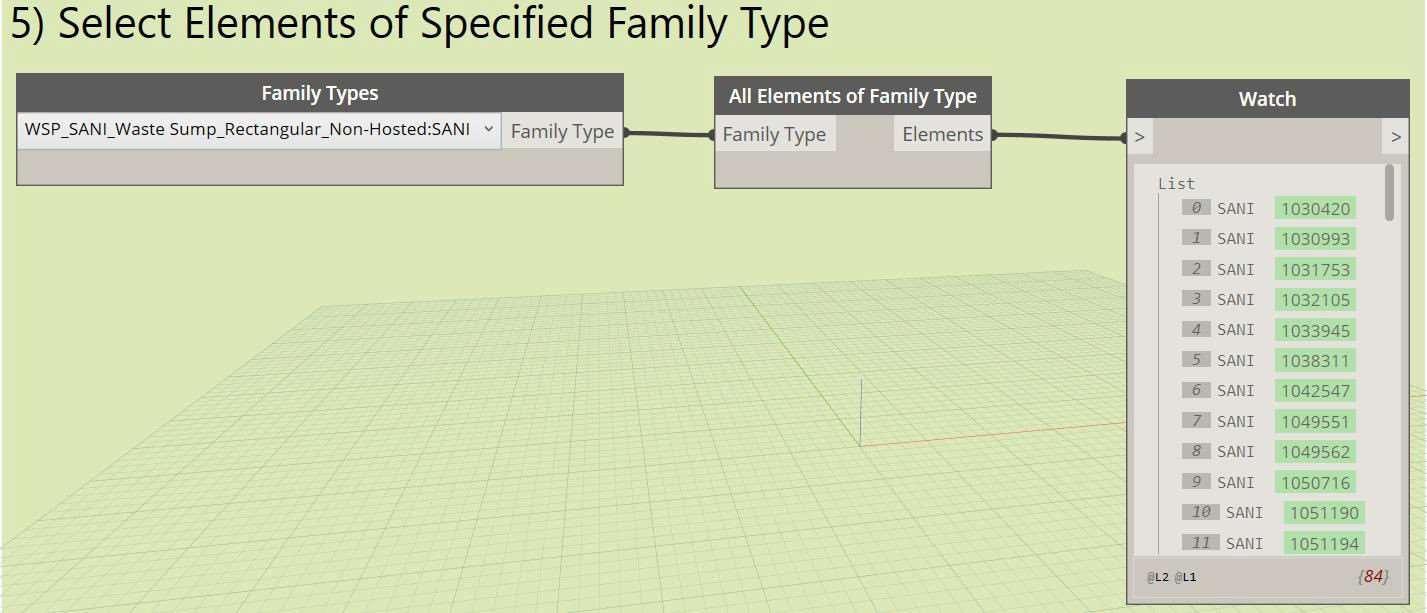
FamilyTypes>AllElementsofFamily Type>Watch

69
GetandSetParameters
- Matchheightofoneelementto otherelementsofspecified category
- Matchheightofoneelementtoother elementsofspecifiedcategory
SelectModelElement>[element]
Element.GetParameterValueByName CodeBlock“TopOffset”;> [parameterName] Element.GetParameterValueByName> Watch>[value]
Element.SetParameterByName CodeBlock“TopOffset”;> [parameterName]
Element.SetParameterByName Categories>AllElementsofCategory >[element]
Element.SetParameterByName
- Setting/Creatinganelement’s parameter–Parametercomments forelement
- Setting/Creatinganelement’s parameter Categories>AllElementsofCategory >[element]
Element.GetParameterValueByNamex 2
CodeBlock“ColumnLocationMark”; >[parameterName]>Watch
Element.GetParameterValueByName
CodeBlock“Type”;> [parameterName]
Element.GetParameterValueByName> Watch
CodeBlock“-“;>[B]CodeBlock *A+B+CC*
70
Watch>[A][C]CodeBlock
*A+B+C;* >Watch>[value] Element.SetParameterByName Categories>AllElementsofCategory >[element]
Element.SetParameterByName CodeBlock“Comments”;> [parameterName] Element.SetParameterByName
71
FilterElementSelectionusingFilter byBoolMask–IsolatePartition WallsViewfromAllWalls
Elements.GetParameterValueByName

CodeBlock“Comments”> [parameterName] Element.GetParameterValueByName> Watch>[x]==

CodeBlock“PartitionWall’>[y]==> Watch>[mask]List.FilterByBoolMask
Categories>AllElementsofCategory> [list]List.FilterByBoolMask
[in]List.FilterByBoolMask>Watch> [element]
Element.TemporarilyIsolateinView
Document.Current> Document.ActiveView>[view] View.TemporarilyIsolateElement
72
RevitVG>IsolateWalls Categories>AllElementsofCategory >[element]
- UsingIsolatedPickModelElements
CodeBlock*255;*>[r] Color.ByARGB
CodeBlock*255;*>[r] Color.ByARGB

73
IsolatePickedElementswithColor Overlay–IsolateWallsandOverlay ColortoRed - UsingIsolatedPickModel Elements - Using Springs.Collector.CurrentSelection
[true]Boolean>[refresh]IsolatedPick ModelElements
Categories>[Category]IsolatedPick ModelElements>[element] Element.OverrideColorInView
CodeBlock*0;*>[g]Color.ByARGB
CodeBlock*0;*>[b]Color.ByARGB >[color]Element.OverrideColorInView
Run>SelectelementsinRevitView> ClickFinishinRevitoptionsbar - Using Springs.Collector.CurrentSelection
[true]Boolean>[refresh] Springs.Collector.CurrentSelection> [element] Element.OverrideColorInView
CodeBlock*0;*>[g]Color.ByARGB
CodeBlock*0;*>[b]Color.ByARGB
>[color]Element.OverrideColorInView SelectelementsinRevitView>Hit Run
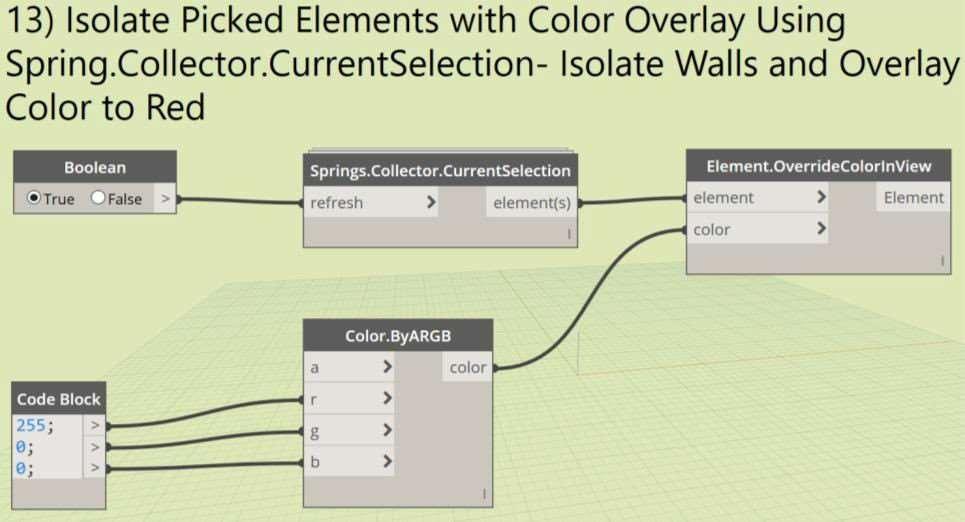
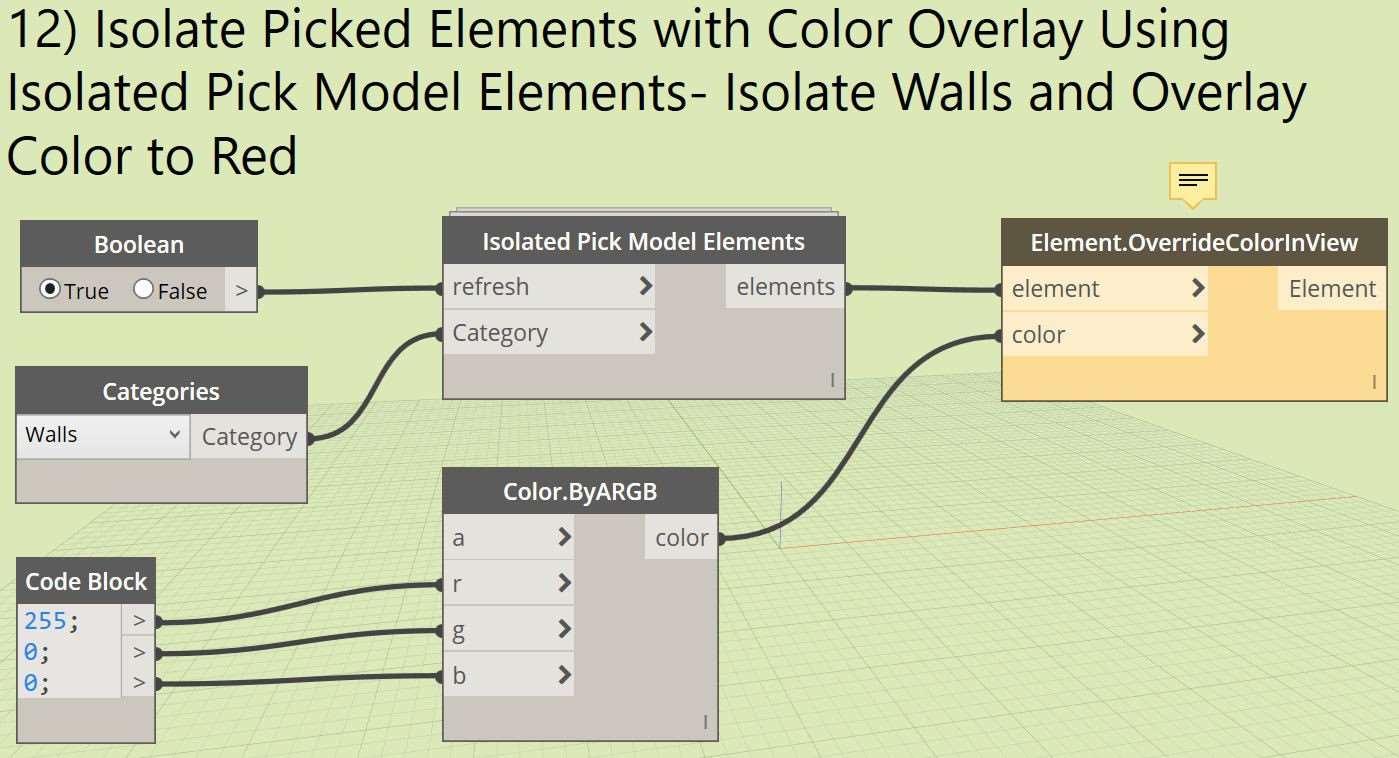
74
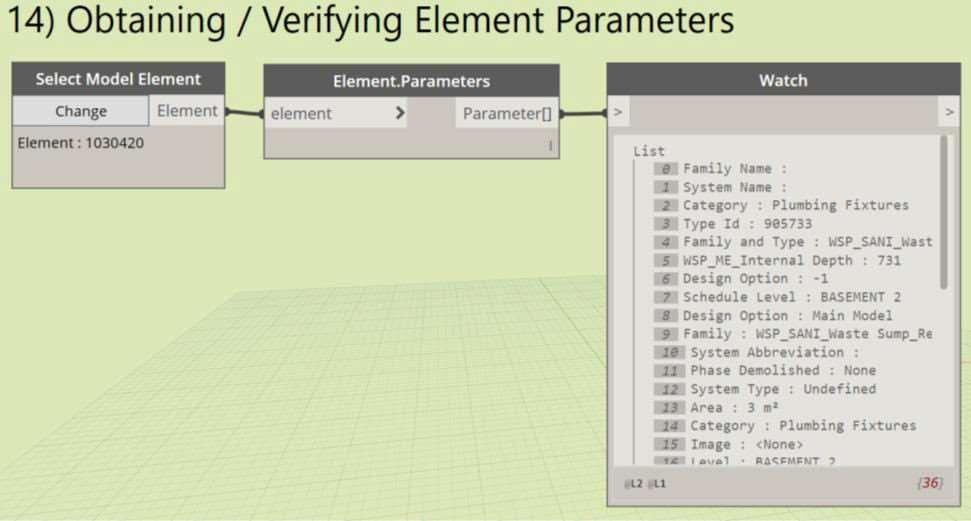
75 Obtain/VerifyElement(s) Parameters SelectModelElement> Element.Parameters>Watch>HitRun ExcelFunctions
LoadDatafromExcelFiletoCreate SeriesofPoints(ExceltoDynamo)

FilePath>File.FromPath>[file] Excel.ReadFromFile
CodeBlock“Worksheetnamein excel”:>[sheetName] Excel.ReadFromFile
[false]Boolean> [readAsStrings] Excel.ReadFromFile
Excel.ReadFromFIle>watch> List.Transpose>Watch>individual CodeBlocks(eg.3codeblocks)toget output>[x/y/z]Point.ByCoordinates
76
LoadDataintoExcelFile(Dynamo toExcel)

FilePath>[filePath]Excel.WriteToFile
CodeBlock“Worksheetnametocreate inexcel”>[sheetName] Excel.WriteToFile
CodeBlock>[startRow] Excel.WriteToFile
CodeBlock>[startCol] Excel.WriteToFile
CodeBlock“true;”>[overwrite] Excel.WriteToFile
CodeBlock“stringname”>[item] List.AddItemtoFront
CodeBlock*sequence*>[list] List.AddItemtoFront
List.AddItemtoFront>Watch>[item0] [item1][item2]..ListCreate>Watch >List.Transpose>Watch>[data] Excel.WriteToFile
77
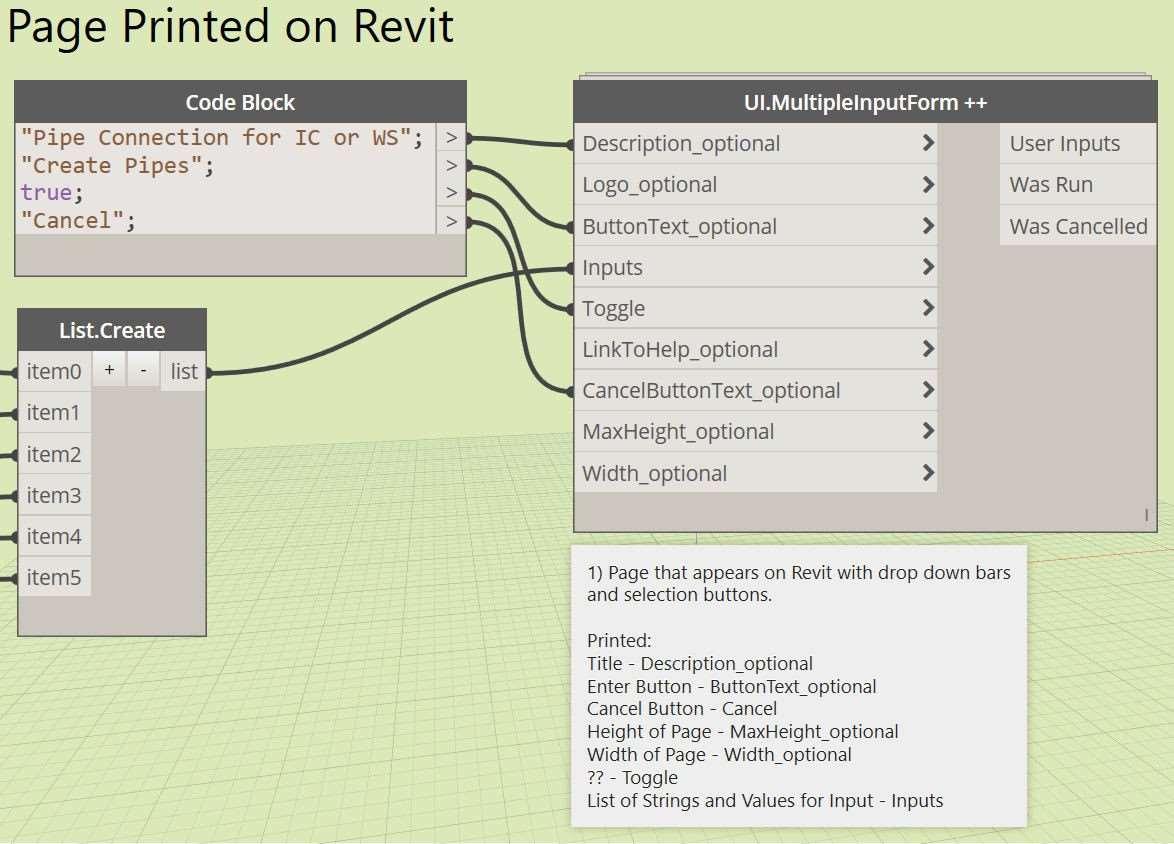
78
B:StepstocreateexistingDynamoscripts
create
SI-
Stepsto
Dynamoscript1
1. CreatePagePrintedonRevit
CodeBlock“PipeConnectionforICor WS”;“CreatePipes”;“True”;“Cancel”;> [Description_optional] [ButtonText_optional][Toggle] [CancelButtonText_optional] UI.MultipleForm++
List.Create>[Inputs]UI.MultipleForm++
2. Create“SelectICorWSONLY” Option
CodeBlock“Select ICor WSONLY”; “Select”;>[InputName][ButtonText] UI.SelectModelElementsData>[item0] List.Create
3. Create“SelectPipeType:”Option –Chooseeg.PS02CatPB_DI_Generic_80to200 - IC-IC/WS-WS:PS02CatPB_DI_Generic_80to200 WSTOWS:“Ø150DICLP1:90 _m”≤20m,DuctileIron ICtoIC: “Ø200DICLP1:90_m” ≤50m,DuctileIron - IC-Manhole:PS09CatSE_VC_Generic_200to300
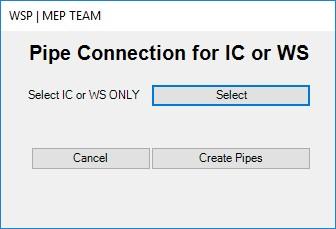
ICtoManhole: “Ø300DICLP 1:90_m”≥Ø200mm,≤50m VitrifiedClay
ElementType(PipeType)>AllElementsof Type>[x]CodeBlock“SelectPipeType”; “x.Name;”>[InputName][Keys:[]] UI.DropDownData AllElementsofType>[Values:[]] UI.DropDownData>[item1]List.Create
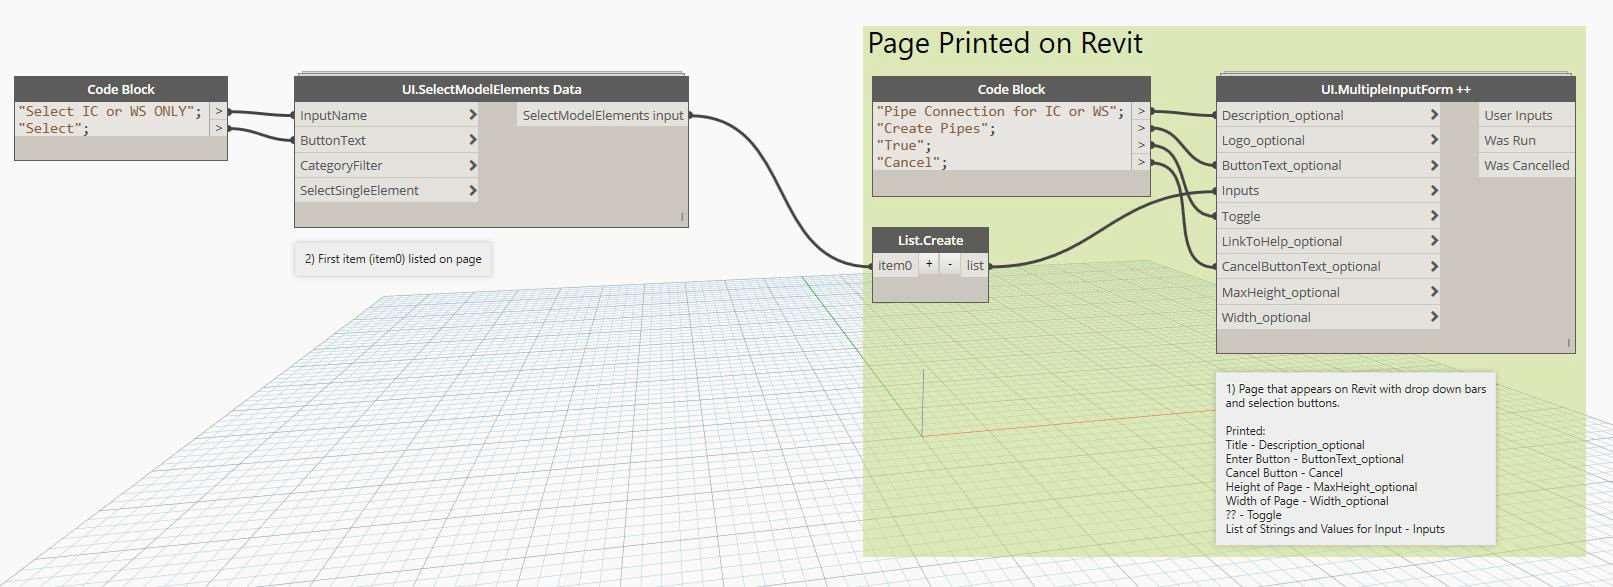
79
➢ NormallyDesignEngineer requestforØ225mm
4. Create“SelectPipeSystemType:” Option–Chooseeg. SANI06_SoilWaste_SWP - AllIC-IC/WS-WS/WS-Grease Trap/GT-IC/ICManhole/GreaseTrap-IC/ICEjectorPitpipes: SANI06_SoilWaste_SWP
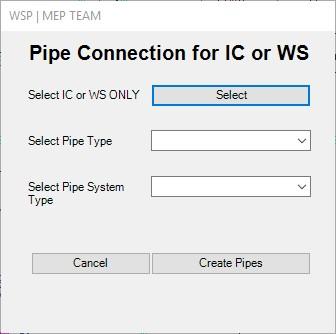

ElementType(PipeSystemType)>All ElementsofType>[x]CodeBlock“Select PipeSystemType”;“x.Name;”> [InputName][Keys:[]]UI.DropDownData AllElementsofType>[Values:[]] UI.DropDownData>[item2]List.Create

80


81
Create“ReferenceLevelforPipes:” Option–Chooseeg.BASEMENT2
6. Create“PipeSlope1/”TextBox withDefaultTextas90 IC-ICGradient:1:60/1:90 WS-WSGradient:1:90/1:120/ 1:200
Block
Slope:1/”:“90”;>
5.
ElementType(Level)>AllElementsof Type>[x]CodeBlock“ReferenceLevel forPipes”;“x.Name;”> [InputName][Keys:[]]UI.DropDownData
AllElementsofType>[Values:[]] UI.DropDownData>[item3]List.Create
Code
“Pipe
[InputName][DefaultText]UI.TextBox Data>[item4]List.Create
7. CreateTextBoxforInputofPipe DiameterwithDefaultTextas150 WSTOWS:“Ø150DICLP1:90 _m”≤20m,DuctileIron
ICto IC: “Ø200DICLP1:90_m” ≤50m,DuctileIron
ICtoManhole: “Ø300DICLP 1:90_m”≥Ø200mm,≤50m VitrifiedClay
CodeBlock“PipeSlope:1/”:“90”;> [InputName][DefaultText]UI.TextBox Data>[item5]List.Create
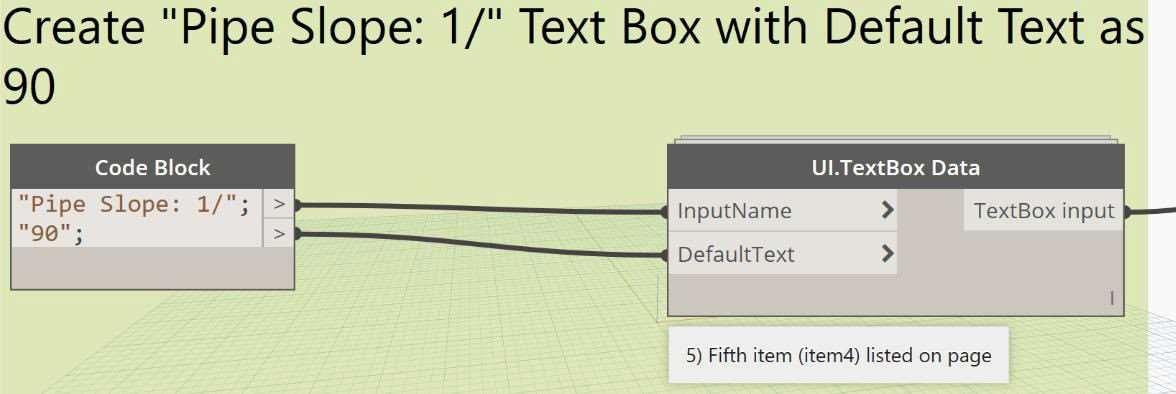

82
lst[0]-SelectedIC/WSitem0
lst[1]-SelectedPipeTypeitem1 lst[2]-SelectedPipeSystemType item2

lst[3]-SelectedReferenceLevelfor Pipeiem3
lst[4]-PipeSlopeValueEntered item4 lst[5]-PipeDiameterValueEntered item5

83
8. CreateIndividualLstforitem0item5fromUserInputs
UI.MultipleInputForm++[UserInputs]> CodeBlock
*lst[0];lst[1];lst[2];lst[3];lst[4];lst[5];*
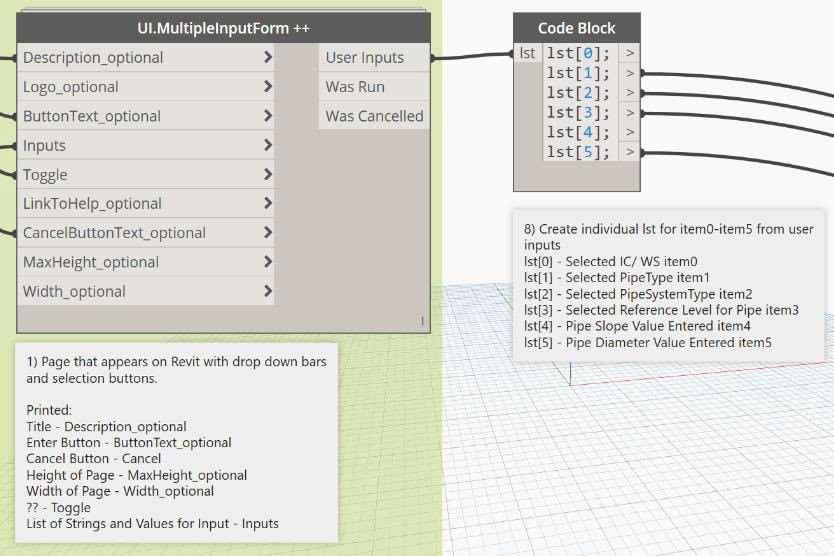

84 9. AddSelectedPipeType, PipeSystemType,ReferenceLevel forPipeandEnteredSlopeValue andDiameterValueasInputsfor PipeCreation CodeBlock*lst[1];lst[2];lst[3];*> [PipeType][SystemType][Level][Diameter] Pipe.ByLines 10. Obtain“WSP_ME_InternalLevel” ParameterofSelectedIC/WS,Sort ElementsfromDeepesttoMost Shallow Eg.IC/WSfrommostshallowto deepestcalledA-D CodeBlock*lst[0]*>Flatten>[list] List.SortByKey CodeBlock“WSP_ME_InternalLevel”> [parameterName] Element.GetParameterValueByName CodeBlock*lst[0]*>[element] Element.GetParameterValueByName> [keys]List.SortByKey
- IC/WSareunsortedinlistafter selection
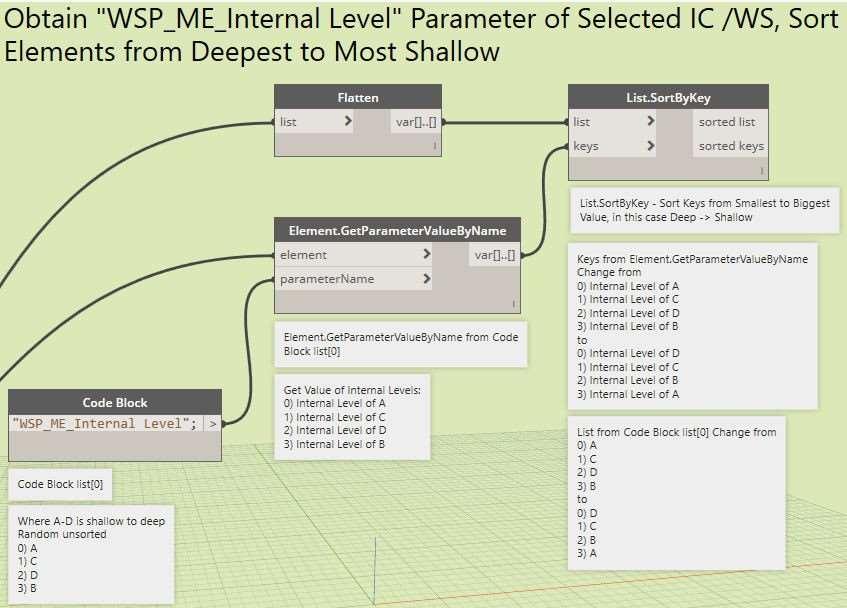
- Obtaintheirinternallevelsandsort keysfromsmallesttobiggestvalue (inthiscasedeepesttomost shallowaslargestnegativevalue tosmallestnegativevalue)
- Sortedlistisrearranged,following sortedkeysorder
11. RemoveMostShallowIC/WSand SortRemainingfrom2nd Most Shallow->Deepest - Sortkeysindescendingorderof3) ->0)(inthiscase,mostshallow-> deepest) - RemovemostshallowIC/WS - Continuefrompreviouslistsorted fromdeepest->2nd mostshallow now
85
CodeBlock*false;*>[ascending] SortIndexByValue
List.SortByKey[sortedkeys]>[list] SortIndexByValue>CodeBlock*x[0]*;> [indices]List.RemoveItemAtIndex> [element] Element.GetParameterValueByName
CodeBlock“WSP_ME_InternalLevel”;> [parameterName] Element.GetParameterValueByName> [list]SortIndexByValue
- Obtaininternallevelsofremaining IC/WS,sortindescendingorder from2)->0)(inthiscase2nd most shallow->deepest)
- Sortkeysfromsmallesttobiggest value(inthiscasestill2nd most shallow->deepest)
- Sortedlistisrearranged,following sortedkeysorder
12. RemoveDeepestIC/WSandSort
RemainingfromMostShallow-> 2nd Deepest
CodeBlock*false;*>[ascending]
SortIndexByValue>[keys]List.SortByKey
List.RemoveItemAtIndex>[list] List.SortByKey
CodeBlock*true;*>[ascending]
SortIndexByValue
- Sortkeysinascendingorderof0)>3)(inthiscase,deepest->most shallow)
- RemovedeepestIC/WS
- Continuefrompreviouslistsorted from2nd deepest->mostshallow now
- Obtaininternallevelsofremaining IC/WS,sortindescendingorder from2)->0)(inthiscasemost shallow->2nd deepest)
- Sortkeysfromsmallesttobiggest value(inthiscasestillmost shallow->2nd deepest)
- Sortedlistisrearranged,following sortedkeysorder
SortIndexByValue>CodeBlock*x[0]*;> [indices]List.RemoveItemAtIndex> [element]
Element.GetParameterValueByName
CodeBlock“WSP_ME_InternalLevel”;> [parameterName]
Element.GetParameterValueByName> [list]SortIndexByValue
CodeBlock*false;*>[ascending]
SortIndexByValue>[keys]List.SortByKey
List.RemoveItemAtIndex>[list] List.SortByKey
86
List.SortByKey[sortedkeys]>[list]
13. Obtain PointCoordinates,TL and IL of 2nd Most Shallow -> Deepest IC/WS
- Get(x,y,z)pointcoordinatesfor 2nd mostshallow->deepestIC /WS - TL=zcoordinates - IL=zcoordinates+internallevel
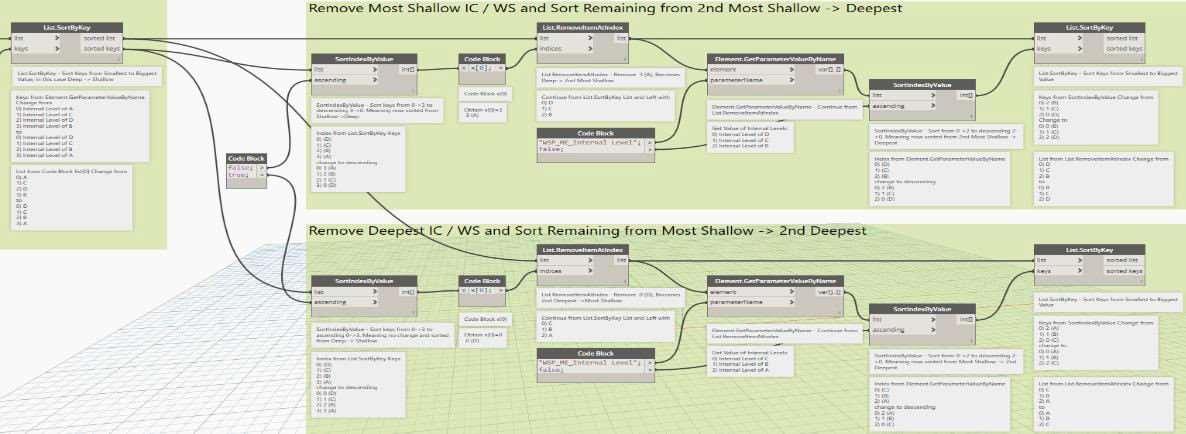
[sortedlist]List.SortByKey>
FamilyInstance.Location>
Points.DeconstructPoint[x][y][z]> [x][y][z]CodeBlock
*Point.ByCoordinates(x,y,z+ InternalLevel); CodeBlock“WSP_ME_InternalLevel”> [parameterName]
Element.GetParameterValueByName [sortedlist] List.SortByKey > [element]
Element.GetParameterValueByName > [internalLevel]CodeBlock
*Point.ByCoordinates(x,y,z+Internal Level);
14. Obtain PointCoordinates,TL and IL of Most Shallow -> 2nd Deepest IC/WS - Get(x,y,z)pointcoordinatesfor mostshallow->2nd deepestIC /WS - TL=zcoordinates - IL=zcoordinates+internallevel
[sortedlist]List.SortByKey> FamilyInstance.Location>
Points.DeconstructPoint[x][y][z]> [x][y][z]CodeBlock
*Point.ByCoordinates(x,y,z+ InternalLevel);
CodeBlock“WSP_ME_InternalLevel”> [parameterName]
Element.GetParameterValueByName
[sortedlist]List.SortByKey>[element]
Element.GetParameterValueByName>
87
[internalLeve]*CodeBlock
Level);
CodeBlock*Point.ByCoordinates(x,y,z+ InternalLevel)from13.>[startPoint] Line.ByStartPointEndPoint
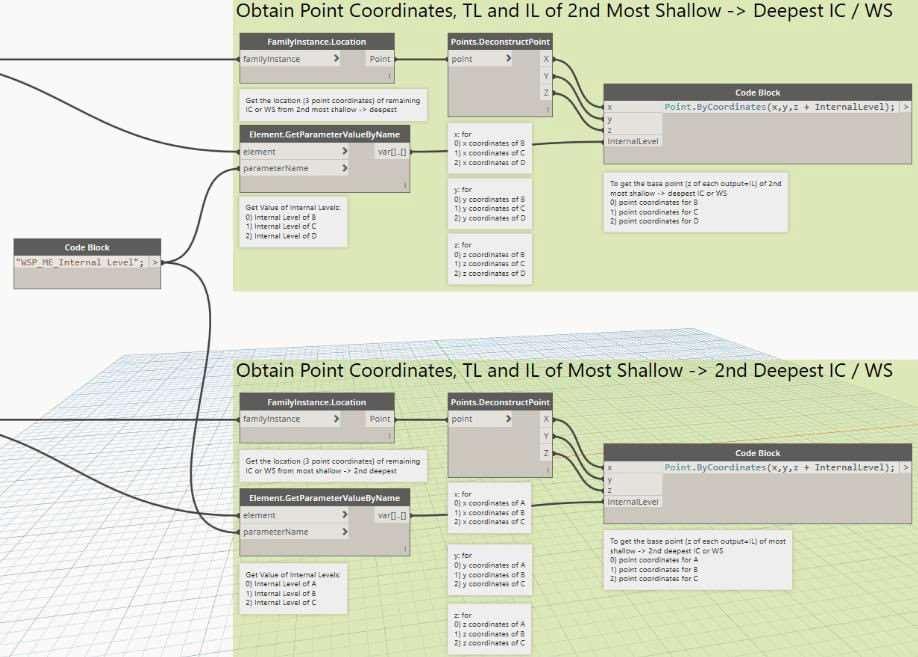
CodeBlock*Point.ByCoordinates(x,y,z+ InternalLevel)from14.>[endPoint] Line.ByStartPointEndPoint 16.
CodeBlock*Point.ByCoordinates(x,y,z+ InternalLevel)from14.>[startPoint] Line.ByStartPointEndPoint
CodeBlock*Point.ByCoordinates(x,y,z+ InternalLevel)from13.>[endPoint] Line.ByStartPointEndPoint
88
-
1) 2nd
2) 2nd
3) Deepest
*Point.ByCoordinates(x,y,z+Internal
15. CreateLinesBetweenEachIC/WS SlopingUpwards
Create3linesslopingupwards:
MostShallow->MostShallow
Deepest->2nd MostShallow
->2nd Deepest
Each
-
1) MostShallow->2nd MostShallow 2) 2nd Most
2nd Deepest 3) 2nd Deepest
CreateLinesBetween
IC/WS SlopingDownwards
Create3linesslopingdownwards:
Shallow->
->Deepest
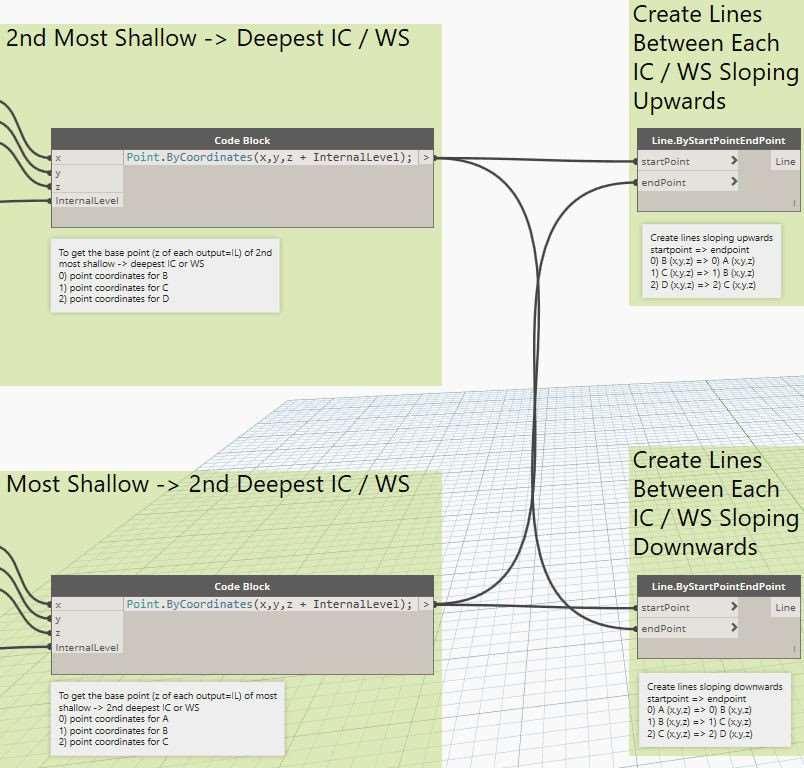
89
17. ShortenLinestoEdgesofIC/ WS,ObtainStartandEnd PointsofPipes
- From3linessloping upwards,-300tomeetedges ofmostshallow,2nd most shallowand2nd deepestIC/ WS - Startlinefromedgeoffirst3 IC/WSandendatedgesof last3IC/WS
Line.ByStartPointEndPointfrom15.>[lst1] ShortenLinestoEdgesofIC/WSEdges
CodeBlock*Point.ByCoordinates(x,y,z+ InternalLevel)from13.>[startpoint1]Shorten
LinestoEdgesofIC/WSEdges
Line.ByStartPointEndPointfrom16.>[line3] ShortenLinestoEdgesofIC/WSEdges
ShortenLinestoEdgesofIC/WSEdges *lst1.Direction; l1=lst1.Length; lst2=
Line.ByStartPointDirectionLength(startpoint1, lst1.Direction,l1-300); l2=lst2.Length; lst3=
Line.ByStartPointDirectionLength(lst2.EndPoint, line3.Direction,l2-300); lst3.StartPoint; lst3.EndPoint;*
90

91
18. ObtainIL2of2nd MostShallowto DeepestICorWS
IL2=IL1–L/G InternalDepth=TL2-IL2
- Obtainlengthoflinesslopingup from2nd MostShallow->Most Shallow,2nd Deepest->2nd Most ShallowandDeepest->2nd Deepest - Takezcoordinatesoffirst3IC/ WS-l/gradient
- Obtainnewcoordinatesofedges of2nd mostshallow,2nd deepest anddeepestIC/WS
ShortenLinestoEdgesofIC/WS,Obtain
StartandEndPointsofPipes [lst3.StartPoint][lst.EndPoint]>[PT2][PT1] ObtainIL2of2nd MostShallowtoDeepest ICorWS
Code Block[lst[4]] > String.ToNumber > [slope]Obtain IL2of 2nd MostShallowto DeepestICorWS ObtainIL2of2nd MostShallowtoDeepest ICorWS
*x1=PT1.X; y1=PT1.Y; x2=PT2.X; y2=PT2.Y; z2=PT2.Z; Startpt = Point.ByCoordinates(x1,y1,0); Endpt = Point.ByCoordinates(x2,y2,0); CL
=Line.ByStartPointEndPoint(Startpt,Endpt); l=CL.Length; loverg=l/slope; Point.ByCoordinates(x1,y1,z2-loverg);*
92
SI-C:Presentationslides
Clickthelinkbelowtoviewthepresentationslides.
https://www.dropbox.com/s/gq3iyqx4j5y4ctr/Applied%20Research%20Project%20Presentati on.pdf?dl=0
93

