
The 1st Joint PhD Symposium School of Architecture, Tsinghua University Department of Architecture, National University of Singapore
DESIGN RESEARCH AND URBAN IN THE CONTEXT OF ARTIFICIAL INTELLIGENCE
November 13–15, 2024, Singapore
Cover and Book Design
Xiaohan MEI & Yihan ZHU
Copyright
School of Architecture, Tsinghua University
Department of Architecture, National University of Singapore
All rights are reserved. No part may be reproduced in any form by any electronic or mechanical means without permission in writing from the universities.
Copyright for all diagrams are owned by the authors unless otherwise noted in the figure caption.
Copyright for all photos are owned by Ye ZHANG.


Preface
As part of the Tsinghua-NUS Joint Research Initiative programme, the first collaborative PhD symposium between the two universities’ architecture schools was held in Singapore on 13 Nov 2024. This brochure documents the proceedings of this symposium to mark the beginning of a new chapter of the long-term research exchange and sharing between these two schools.
For this symposium, five upper year doctoral students from Tsinghua University and seven from National University of Singapore were selected to share their latest works on how to use AI technologies to deal with pressing urban challenges in China and Singapore. Presentations and discussions were organised under four topics to enable effective connection, conversation and hopefully future collaboration.
Taking this opportunity, we would like to sincerely thank all PhD students and guests for joining this symposium, especially the supervisors of participating PhD students who openly shared their insightful observations and inspiring feedback throughout the event. We would also like to express our gratitude to Prof. ZHANG Li, Dean of the School of Architecture, Tsinghua University and Prof. Jeffrey HOU, Head of the Department of Architecture, National University of Singapore for their strong supports.
We look forward to meeting more PhD students and colleagues from both schools as well as new friends in the second join Tsinghua-NUS PhD symposium to be held in Beijing in late 2025.
Best Regards,
Ye ZHANG & Chao YUAN
Dec 2024
Theme 1 Sensing the City
Theme 2 Evaluating the City
Keynote


Presentation by Yuan Lai
Urban Intelligence Towards Techno-Humanistic City Planning
Yuan Lai, Tsinghua University
The physical, social, and cyber dimensions of cities are increasingly integrated as information technology continues to penetrate urban living spaces. By leveraging diverse information technology and AI, urban intelligence utilizes multi-source heterogeneous data across different spatial scales and temporal frequencies to promote synergy between various subsystems and domains, aiming to support more responsive, precise, and forwardlooking planning. Urban intelligence will also help scientifically understand the nonlinear relationships between ecological, economic, and social factors related to human settlement, supporting coordinated digital transformation and urban management. The rapid emergence of information technology also brought new challenges, such as the digital divide, information explosion, algorithmic injustice, and AI ethical concerns. Urban planning plays a key role in guiding the utilization of urban information technology and defining the basics for future urban intelligence.
Prof. Yuan Lai is an Associate Professor at Tsinghua University School of Architecture Department of Urban Planning. His research interest lies at the intersection of urban informatics, urban planning, and smart cities. He is the deputy secretarygeneral of the Technology Innovation Center for Smart Human Settlements and Spatial Planning & Governance, China Ministry of Natural Resources, and the deputy secretary-general of the Expert Committee in Digital Twins and Future Cities, Chinese Society for Urban Studies (CSUS). Before Tsinghua, Dr. Lai was a Lecturer in Urban Science and Planning at MIT Department of Urban Studies and Planning and a research affiliate at NYU Marron Institute of Urban Management and NYU Urban Intelligence Lab. His work has been featured at the United Nations, Bloomberg Technology, Urban Design Forum, NYC Media Lab, American Planning Association, and American Society of Civil Engineers.
Theme 1 Sensing the City
Dai Hui
Large-scale soatiotemporal deep learning model for predicting urban residential PM2.5 concentrations
Merve Esmebasi
lnvestigating biophilic design and adaptive acoustic comfort in office spaces
Chen Taihan
Effects of tree plantings and street aspect ratio on the thermal environment using a mechanistic urban canopy model UT&C


(Source:
Fig 1 Schematic view of (a) The development of the Bayesian neural network (BNN). (b) Workflow of overall research.
Hui Dai)
Large-Scale Spatiotemporal Deep Learning Predicting Urban Residential Indoor PM2.5 Concentra-
tion
Hui Dai, Tsinghua University
With more extreme weather and airborne transmission diseases outbreaks in the future due to climate change, the health hazards of indoor air pollution have received unprecedented attention from the international community. Almost all Chinese cities have concentrations of aerodynamic particulate matter smaller than 2.5 microns (PM2.5) that exceed the interim guidelines of 5 μg/m3 issued by the World Health Organization (WHO), and 42% of the Chinese population still faces unacceptably high health risks because of air pollution. Furthermore, the high cost of COVID-19 has prompted countries to focus on indoor air quality like never before. Given that indoor PM2.5 contributes over 50% of the total PM2.5 exposure and the associated disease burden for urban residents, it is urgent to obtain indoor PM2.5 concentrations on a large spatiotemporal scale, especially in residences where people spend 68.7% of their time.
Modeling indoor PM2.5 by means of the mass balance principle is complicated because such models usually have multiple interactions and synergies. Such a complex and nonlinear problem is challenging for large-scale indoor PM2.5 concentration prediction. Therefore, some studies have applied machine learning models to predict indoor PM2.5. These models are mainly based on artificial neural networks (ANN), with a few based on decision trees and Markov chains. Although traditional neural networks can approximate any continuous function as long as the number of hidden neurons is sufficient, modeling strongly nonlinear data usually leads to overfitting. Their predictions are solely single-point predictions, and they cannot reflect the uncertainty of the forecast. Furthermore, the input strategies in these studies were applied to estimate PM2.5 concentrations at regional levels, such as in subway stations, offices, classrooms, and residences in one city. Few studies have assessed indoor PM2.5 concentrations and captured their temporal and spatial characteristics at the city or national level. Such models only work for indoor PM2.5 concentration prediction on

a small scale because they require prior indoor PM2.5 concentration as input or detailed household information. Besides, the use of a single training data source results in a model with insufficiently generalizable. Unlike outdoor air pollutants, it is challenging to monitor indoor PM2.5 concentrations on a large scale over a long period because of the limited number of indoor monitoring sites. These disadvantages greatly limit the universality of existing models. Therefore, predicting daily average PM2.5 concentrations and their spatiotemporal variations require a universal input strategy, modeling method, and data sources.
The Bayesian neural network (BNN) is an alternative approach that can eliminate the aforementioned weaknesses. To capture the inherent variation in the observed data, the BNN model describes it using a conditional probability distribution, through which fluctuations in the output can be modeled. It can be observed that BNN performs better than conventional ANN models on small datasets. In addition, a BNN can generate a more realistic conditional probability distribution, which cannot be achieved using conventional ANN models with deterministic model parameters (i.e., weights and biases). BNNs have been applied to problems such as toxicity prediction in preclinical compound medicine and comfort prediction with regard to thermal occupant preference, but their overall use in scientific modeling has been rare up to this point. They have not been used for indoor air quality predictions, especially in the field of indoor pollutant prediction.
This study established BNN model for predicting the city-scale distribution of Chinese daily average residential PM2.5 concentration. The deep-learning model was developed with multiple data sources available from nationwide comprehensive sensor-monitoring records
Fig 2 Comparison of measured urban residential daily average PM2.5 concentrations and predicted urban residential daily average PM2.5 concentration distributions on partial test dataset in different cities of Data Source Ⅰ. (a) Beijing; (b) Shanghai. (Source: Hui Dai)

Fig 3 Spatial distribution of residential annual average PM2.5 concentration and PM2.5-attributable deaths across 340 Chinese cities in 2050. (a) annual average residential PM2.5 concentration under SSP126; (b) annual average residential PM2.5 concentration under SSP585; (c) residential PM2.5-attributable deaths under SSP126; (d) residential PM2.5-attributable deaths under SSP585. (Source: Hui Dai)
in China, with a 10-fold cross-validation R2 of 0.70, mean-absolute-error of 9.45 μg/m3, root-mean-square error of 13.3 μg/m3, and 95% prediction interval coverage of 85%. We compared three input strategies to determine the optimized input factors by analyzing the mechanisms driving particulate matter transport using a correlation coefficient matrix. The model performance was then evaluated with the test dataset of the training database. It encompassed the impact of complex indoor mechanisms with multiple interactions, synergies and intrapopulation differences, filling a gap in the large-scale modeling of indoor PM2.5. This study fills a gap in the large-scale modeling of indoor PM2.5, a critical parameter for population exposure characteristics and attributable disease burden evaluation.
Based on this model and exposure–response (IER) curve employed in the Global Burden of Disease Study, we predicted Chinese urban residential PM2.5 concentrations and exposureattributable premature deaths in 2050. First, we utilized meteorological parameters and socioeconomic indicators for the year 2050 as input data, sourced from cohort study, to predict residential PM2.5 concentrations using BNN. We then estimated deaths attributable to PM2.5 for six diseases in 2050. The disease-related input data were extracted from widely recognized IER curves. The calculation employed a two-stage Monte-Carlo simulation to fulfill the sampling. Our findings indicate that under two climate change scenarios, although severe indoor air pollution is reduced, the residential PM2.5 concentration in almost all cities in China remains above the air quality guidelines recommended by WHO and the health risks continue to rise. It’s necessary to make informed decisions regarding urban development and governance, while effectively protecting residents from health threats of climate change.

Investigating Biophilic Design and Adaptive Acoustic Comfort in Office Spaces
This study investigates the interplay of audio-visual perception in office environments, focusing on the effects of intruding traffic sounds, window states, and biophilic design elements such as indoor greenery. Aiming to assess the relationship between auditory and visual stimuli, the research explored how different combinations of traffic noise levels (50–65 dBA) and greenery dosages (0%, 7%, 10%, and 13%) affect user perception in a shared office setting. The experiment utilized 32 controlled audio-visual stimuli presented to 42 participants through over-ear headphones and a two-dimensional screen in an indoor office environment. Window states (open vs. closed) were also investigated to evaluate their impact on participant perception of auditory pleasantness, annoyance and appropriateness.
A partial least squares structural equation model (PLS-SEM) was employed to analyze the effects of greenery dosage, window state, and traffic sound levels on perceptual constructs, including pleasantness, eventfulness, appropriateness, preference, and visual perception (VP). Results reveal a complex interaction between visual and auditory cues, where visual aesthetics and appropriateness mediate the perception of intrusive traffic sounds. Notably, the presence of indoor greenery positively influenced visual perception and indirectly enhanced auditory pleasantness. This underscores the potential of biophilic design to mitigate the negative impacts of noise and foster adaptive acoustic comfort.
Key findings highlight the bidirectional influence of auditory and visual stimuli. Higher greenery dosages were associated with improved VP ratings, such as “aesthetic,” “appealing”, “harmonious,” and “relaxing,” which in turn reduced annoyance from traffic noise. Window states significantly impacted appropriateness ratings, with open windows increasing the perceived appropriateness of traffic sounds despite identical auditory stimuli. Experimental results reveal that traffic noise is perceived as more appropriate with open windows rather
Fig 1 Visual images depicting closed window states (above) and open window states (below) across four different greenery dosages (Source: Merve Esmebasi)
Merve Esmebasi, National University of Singapore

than closed, resulting in lower self-reported traffic noise annoyance. This finding suggests The study advances the understanding of soundscape perception in indoor environments by integrating biophilic design and audio-visual interaction. It demonstrates that traffic sound levels significantly affect both auditory and visual evaluations, with higher sound levels reducing visual aesthetic ratings. Furthermore, VP and appropriateness were found to mediate the relationship between traffic noise and annoyance, emphasizing the importance of designing visually appealing environments with indoor greenery to enhance auditory pleasantness.
Incorporating preference as a higher-order construct in the PLS-SEM further revealed its mediating role between appropriateness, VP, and annoyance. The importance-performance map analysis (IPMA) identified traffic sound levels, visual aesthetics, and appropriateness as the most critical variables influencing annoyance and preference. The research also addresses methodological challenges, including the use of controlled environments to isolate variables such as sound levels, window states, and greenery dosages. While this approach offers valuable insights, the ecological validity of the findings requires further validation in real-world settings. Factors such as facade insulation, thermal comfort variations due to open windows, and room acoustics were controlled in this study but could influence outcomes in practice.
In conclusion, this study underscores the potential of biophilic design in creating office environments that are both visually and acoustically comfortable. By highlighting the mediating role of visual perception and appropriateness in traffic noise annoyance, it offers valuable insights for architects and interior designers. The findings advocate for adaptive
Fig 2 Analysed SEM showing substantial positive (+, red) and negative (−, blue) relations indicated by arrows from predecessors to the exogenous target constructs. Path coefficients are presented beside the relevant arrows representing direct relations (Source: Merve Esmebasi)

acoustic comfort strategies, such as open windows and natural ventilation, to promote healthier and more enjoyable indoor environments. Furthermore, this research lays the groundwork for future studies to explore the combined effects of auditory and visual stimuli across diverse architectural contexts, paving the way for more refined approaches to noise management and soundscape design for indoor environments.
References
Eşmebaşı, M., & Lau, S. K. (2024). Traffic sounds in office spaces: PLS-SEM study on audio-visual perception with open or closed windows and biophilic design. Building and Environment, 264, 111915.
Eşmebaşı, M., & Lau, S. K. (2024, October). Ambient noise criteria framework for future environmental noise mitigation targets in Singapore. In INTER-NOISE and NOISE-CON Congress and Conference Proceedings (Vol. 270, No. 5, pp. 6600-6610). Institute of Noise Control Engineering.
Fig 3 Presentation by Merve Esmebasi

1 (a) SOMUCH scaled outdoor experiment; (b) schematic illustration of the energy transfer in the UT&C model based on air/surface temperatures and resistances. (Source: Taihan Chen)

Fig
Fig 2 Measured and calculated wind speed (V) based on the original model: (a) street without trees; (b) street with trees; and modified model: (c) street without trees; (d) street with trees. (Source: Taihan Chen)
Effects of Tree Plantings and Street Aspect Ratios on the Thermal Environment Using a Mechanistic Urban Canopy Model UT&C
Taihan Chen,
National University of Singapore
As a typical high-density city, Singapore is going through rapid urbanization and facing serious challenges to the high Urban Heat Island effect (UHI) intensity. Urban vegetation has been widely adopted in urban design to improve the thermal environment and alleviate pedestrian heat stress. Although the cooling effects of trees have been widely reported, the understanding of the integrated effects of street morphologies and tree parameters on the thermal environment is insufficient, especially in high-density cities. To improve the impact of urban climate science on practicing urban planning and design, we aim to evaluate the coupling effects of tree characteristics and street morphologies on the thermal environment in high-density cities. A parametric study is conducted to investigate the impacts of the tree leaf area index (LAI) and crown radius (rtree) on the thermal environment inside streets with various aspect ratios (H/W). We use the mechanistic urban canopy model Urban TethysChloris (UT&C) (Fig. 1b) and integrated a new semi-empirical wind parameterization into the model. A unique scaled outdoor experiment (Fig. 1a) is used to validate UT&C through the comparison with air temperature Ta, relative humidity RH, wind speed V, and thermal comfort indices (Mean Radiant Temperature Tmrt and Universal Thermal Climate Index UTCI). The results can be summarized as follows: (1) The integration of the new wind parameterization into UT&C significantly improves the performance of V calculation (Fig. 2); (2) The calculated Ta, RH , and thermal comfort indices (Tmrt and UTCI) are in good agreement with measured results; (3) Though greater tree density and crown size cause stronger wind reduction and higher humidity, they also can decrease air temperature and radiation, thus improving thermal comfort (Fig. 3); (4) Maximum cooling effects of about

Fig 3 Boxes of calculated parameters with various rtree=2.0-5.0 m and fixed aspect ratio (H/W=1): (a) Ta; (b) Tground; (c) Ttree; (d) Tcanyon; (e) RH; (f) V; (g) Tmrt; (h) UTCI. (Source: Taihan Chen)

Fig 4 Daily maximum reduction of Universal Thermal Climate Index (ΔUTCImax) for various H/W=1.0-5.0 and: (a) LAI=1.0-6.0; (b) rtree=2.0-5.0 m. (Source: Taihan Chen)

4.0℃ of UTCI occur for LAI=4.0 and large rtree, and such cooling effects are weakened as H/W increases (Fig. 4); (5) LAI=4.0 and rtree=5.0 m are found to be optimal for wide streets (H/W=1.0-3.0) to provide maximum UTCI cooling effects (about 4.0℃), while LAI=4.0 and rtree=3.4 m are optimal for narrow streets (H/W=3.0-5.0) (Fig. 4). The above research outputs can provide guidelines for architects and planners on urban tree selection strategies.
References
Chen T, Meili N, Fatichi S, Hang J, Tan PY, Yuan C. Effects of tree plantings with varying street aspect ratios on the thermal environment using a mechanistic urban canopy model. Building and Environment 2023; 246.
Fig 5 Presentation by Taihan Chen
Theme 2 Evaluating the City
Gao Xinting
The Calculation of Space Utilization Assessment Index Supported by Artificial Intelligence and Big Data
Zhao Huimin
Intelligent Measurement of Urban Housing Vacancy in China Leveraging Large-Scale Open-Source Data
Pradeep Alva
Urban Digital Twins: Use Case of Building Operational Greenhouse Gas (GHG) Emissions Dashboard

(
Fig 1 Spatio-temporal distribution
Source: Xinting Gao)
The Calculation of Space Utilization Assessment Index Supported by Artificial Intelligence and Big Data
Xinting Gao, Tsinghua University
In the post-pandemic era, effective space utilization has become increasingly critical for promoting public health, ensuring efficient building management, and preventing the spread of infectious diseases. As society adapts to new ways of working, learning, and socializing, it is essential to understand how spaces are used, how occupancy fluctuates over time, and how well buildings support the activities of their users. Spatial utilization, which measures occupancy relative to the capacity of a space across the dimensions of people, time, and space, plays a crucial role in this process. Post-occupancy evaluation (POE) is an essential tool in assessing the effectiveness of space design, identifying patterns of space usage, and providing insights into potential improvements in adaptability, efficiency, and occupant satisfaction. POE is useful for both designers—who use it to optimize spatial configurations—and engineers—who use it to enhance HVAC system performance, improve indoor environmental quality (IEQ), and optimize energy consumption in buildings.
Traditional methods of measuring space utilization, such as interviews, surveys, and direct observations, are time-consuming and labor-intensive. While useful, they often provide limited data and may not capture real-time, dynamic usage patterns. More modern technologies, such as Pyroelectric Infrared (PIR) sensors, depth sensors, and environmental sensors (e.g., CO2 concentration, temperature), provide an automated way to track occupancy. However, these approaches still face limitations, such as issues with accuracy, low spatial resolution, privacy concerns, or environmental interference. Emerging technologies, particularly indoor positioning systems (IPS) that utilize Wi-Fi, Bluetooth Low Energy (BLE), and Ultra-Wideband (UWB), offer scalable, precise, and non-intrusive methods for tracking occupancy. These systems leverage mobile devices and wireless signals to capture detailed data on how spaces are utilized, enabling large-scale, real-time monitoring of occupancy and space usage over time.
This study introduces a novel spatial utilization index, built on high-precision Wi-Fi and

Bluetooth positioning systems, to enhance POE in urban and architectural design. The goal is to offer a more accurate, comprehensive, and dynamic understanding of space utilization, particularly in the context of open-plan office environments. By applying this methodology to an office building, the research quantifies space utilization and explores the spatio-temporal characteristics of space usage across multiple functional zones. Over the course of two months, more than 220,000 occupancy points were collected, providing a rich dataset for analysis. The Space Utilization Index captures both spatial and temporal dimensions of occupancy, offering a nuanced view of how different areas of a building are utilized throughout the day. The results show that high-density areas with longer occupancy durations—such as open discussion zones, multifunctional atriums, and elevator lobbies— demonstrate the highest space utilization. These areas not only have a large volume of people passing through them but also exhibit prolonged use, reflecting their central role in the daily activities within the office.
A key contribution of this study is its investigation into the spatio-temporal data requirements for accurate occupancy analysis. The research explores various grid sizes (5m, 9m, 27m, and 36m) and uses Kullback-Leibler (KL) divergence to assess the consistency of occupancy patterns across different spatial scales. The findings suggest that after 20 workdays (approximately four weeks) of data collection, occupancy patterns stabilize across grid sizes. Smaller grids (e.g., 5m) reach stability within 6 days, while larger grids (e.g., 36m) take longer, with patterns stabilizing after about 12 days. This indicates that the spatial resolution of the analysis significantly affects the accuracy and reliability of occupancy pattern detection, with smaller grids providing faster convergence and greater precision. The KL divergence analysis also reveals that, over time, occupancy patterns tend to converge to stable usage
Fig 2 Spatio-temporal distribution (Source: Xinting Gao)

profiles, regardless of the grid size, though smaller grids offer more detailed insights into fine-grained occupancy behavior.
The study leverages a data-driven approach that integrates Wi-Fi and Bluetooth positioning systems with Pedestrian Dead Reckoning (PDR) to improve the accuracy of location data. This system collects real-time location data from mobile devices, which is then processed to generate occupancy points linked to specific times and spatial coordinates. By aggregating these points, the Space Utilization Index quantifies space usage, providing insights into the duration of stay and the number of people occupying specific functional areas. This allows for a more detailed analysis of how users interact with different spaces, offering valuable information for designers and engineers seeking to optimize building layouts and systems.
In addition to its methodological contributions, this study also provides practical insights into how space utilization can be improved. The data-driven approach helps identify areas with underutilized space, as well as high-traffic zones that may require reconfiguration to accommodate varying needs. For example, spaces with high occupancy but short dwell times, such as corridors or restrooms, may benefit from improvements in accessibility or functionality. Conversely, spaces with low occupancy but high dwell times, such as meeting rooms or break areas, might be reimagined to increase their utility and efficiency. By providing a detailed view of how space is used in real-time, this methodology supports more informed decision-making in the design and management of buildings.
Fig 3 Presentation by Xinting Gao

Intelligent Measurement of Urban Housing Vacancy Rate in China
Huimin Zhao, Tsinghua University
Housing vacancy rates serve as a critical indicator of urban development and housing market health. Regions with elevated vacancy rates often face diminished property values, increased crime risks, and higher resource wastage. In recent years, the issue of housing vacancy has become increasingly pronounced in China. The predominant focus on multifamily residential developments has, however, introduced considerable challenges in accurately measuring urban vacancy rates. To date, no comprehensive national data on housing vacancy rates in China has been publicly released. Thus, this study focuses on the phenomenon of housing vacancies in China, following a structured approach of “literature review–methodology development–empirical study” to assess the current status of housing vacancy rates.
In the initial phase, a systematic literature review was conducted, covering 333 Englishlanguage studies from the WOS database and 297 Chinese studies from CNKI. These studies reveal that existing data sources include government statistics data, electricity usage data, street view imagery, location-based services (LBS) data and field-collected data such as Wi-Fi probe data, field survey data. However, the varied temporal and spatial resolutions of these datasets have led to inconsistencies in study units and scope across research. Both domestic and international studies largely rely on traditional data sources, such as government statistics and field surveys, which, while accessible to researchers, require substantial resources to update. Recently, the emergence of big data and advanced analytical techniques has shown significant potential in identifying vacant housing and calculating vacancy rates. This study compares these data sources in terms of accuracy and accessibility, identifying datasets most suitable for large-scale measurements of housing vacancy within the multi-family residential context in China, such as the LBS data, the mobile signaling data, the Jilin-01 nighttime light data, the Luojia-01 nighttime light data and the NPP/VIIRS
Fig 1 Research Methods (Source: Huimin Zhao)

nighttime light data.
In the second phase, a methodology was developed and tested across 5,337 residential communities within Beijing’s Fifth Ring Road. Using three-dimensional building data from Baidu Map alongside unit-area data from property platform, the study calculated household capacities for each residential community. Five data sources—Baidu Maps LBS data, China Unicom mobile signaling data, and night-time satellite data from Jilin-01, Luojia-01, and NPP/VIIRS—were employed to estimate household counts. Given inconsistencies across these data sources, a validation process was included, utilizing Wi-Fi probe data collected from 103 communities to verify household counts. Findings indicate that Baidu LBS data performed best, correlating most strongly with Wi-Fi probe data (correlation coefficient: 0.89), making it suitable for broader application in future studies. By contrast, data from China Unicom and Jilin-01 were less effective, while Luojia-01 and NPP/VIIRS data proved inadequate for community-level vacancy calculations.
In the third phase, the methodology was expanded nationwide to 2,967 spatial city areas larger than 5 km², with a total area of 91,714 km². High-resolution Google satellite imagery dated between 2022 and 2024, with a resolution of 0.3-1m was gathered, with building rooftops identified using the OCRnet deep learning model based on the BITC dataset and manually labeled data. Baidu Map building height data was integrated, and XGBoost machine learning models were used to estimate building heights and functions, resulting in a national-scale, multi-attribute building dataset of unprecedented accuracy. The analysis identified 329,866 residential parcels and calculated their housing vacancy rates.
In summary, the primary contributions of this study are as follows: First, the study establishes
Fig 2 Housing vacancy rate of residential communities wihtin Beijing Fifth Ring Road (Source: Huimin Zhao)

a methodology for accurately calculating housing vacancy rates in multi-family residential contexts, which is adaptable for use in other countries outside China. Second, the study produces a comprehensive, multi-attribute national building dataset that can support further research in fields such as urban development assessment and building energy consumption. Third, it provides the first national measurement of housing vacancy rates across all Chinese cities, offering a valuable foundation for future housing policy decisions.
This study, however, has several limitations. First, it focuses solely on measuring housing vacancy rates, and further research is needed to investigate the underlying mechanisms driving these vacancies. Second, the current analysis does not account for the phenomenon of single households owning multiple properties, which will need to be incorporated in subsequent research.
Fig 3 Presentation by Huimin Zhao

Fig 1 Comparison of residential buildings’ total GHG emissions for the year 2022 (x-axis) and GHG emission intensity (x-axis) respectively with building height (y-axis), with buildings categorised based on dwelling types (a, b) and built year (c, d).
(Source: Alva, P., Mosteiro-Romero, M., Miller, C., & Stouffs, R. (2024). Mitigating operational greenhouse gas emissions in ageing residential buildings using an Urban Digital Twin dashboard. Energy and Buildings, 322.)
Urban Digital Twins: Use Case of Building Operational Greenhouse Gas (GHG) Emissions Dashboard
Pradeep Alva, National University of Singapore
The concept of an Urban Digital Twin (UDT) serves as a control room environment for short-term city operations and a policy instrument for long-term planning. Recent examples of UDTs have shown their potential as a tool for decision-making and guiding stakeholders in various domains [1]. UDT is a nascent concept with limited use cases developed so far. UDTs are primarily developed within organisations, and access to authoritative open 3D datasets for UDT testing or research is limited. There is a significant lack of demonstrations showcasing UDT use cases tailored for smart city energy applications. Underscoring the urgent need for more examples in this sector.
A top-down approach is commonly found in current workflows for organisational UDT development. The starting point of such UDTs is highly reliable and accessible measured data. There is a requirement for workflows that demonstrate a low-cost, sophisticated architecture and infrastructure, despite being built using a bottom-up approach based on open data. These approaches need to replicate the traditional cyber-physical system layers in their architecture, offering clear component distribution in the physical, digital, and cognitive layers.
This Ph.D. research contributes to the understanding of both the theoretical and practical aspects of UDT development by presenting a clear conceptual architecture and frameworks. It delivers valuable insights into the development of UDTs, with a particular emphasis on building operational GHG emissions. These frameworks and architecture are essential for both general UDT development and targeted use cases, asserting the importance of structured approaches in this field.
As a practical demonstration, a web-based open-access tool called the GHG App—has been developed to aid in smart city management in Singapore. The GHG App is built using a 3D integrated dataset with open data related to building information and electricity use in Singapore (as shown in Fig 1).

Fig 2 Dashboard Scene of GHG App showing PFI results in a heat map for a sample case. The purple colour indicates buildings with very high PFI values and ranks, while dark green indicates very low-ranked buildings. Sliders at the bottomleft of the dashboard. Sliders at the bottom-left of the dashboard help users set each parameter weight, based on which PFI maps are automatically generated.
(Source: Alva, P., Mosteiro-Romero, M., Miller, C., & Stouffs, R. (2024). Mitigating operational greenhouse gas emissions in ageing residential buildings using an Urban Digital Twin dashboard. Energy and Buildings, 322.)
A real-world case study of Singapore has been developed in collaboration and guidance of local government agencies and policy experts [2]. The case study focuses on how to manage the city’s ageing residential buildings with a target of decarbonisation. The GHG App is utilised for renovating public housing in Singapore through a multi-criteria decision analysis (MCDA). A Potential for Intervention (PFI) analysis was conducted generating a heat map for buildings. The heat map indicates the urgency for renovations in buildings for future scenarios projected for 2040 (as shown in Fig 2).
A usability study was conducted on the GHG App by collecting user feedback based on an online questionnaire. The outcome of user feedback led to the development and addition of a serious game for GHG mitigation within the GHG App. The learning environment and knowledge transfer to users within the GHG App were further improved through the generative artificial intelligence technology-based conversation assistant, ChatGHG.
This research further identifies issues broadly related to developing UDTs. Particularly, UDTs that focus on building energy use, GHG emissions, and effectively contributing to climate action. This research develops a city-scale UDT with limited access to an authoritative 3D dataset to start with. Various scenarios are demonstrated for GHG mitigation in the built environment. Two pilot case studies at both the district and city scales demonstrate that UDTs can be created even without an authoritative 3D dataset [3][4][5]. In addition, UDT development instances were found during the literature review that used synthetic and simulated data to replace highly reliable authoritative 3D datasets.
This research provides a robust UDT user experience of a web browser dashboard—GHG App. GHG App has input scenarios modelled along with visualisations to read historical building electricity use data and corresponding operational GHG emissions estimated. In

addition, users can extract 3D city features on-demand using 3D Tiles format and Cesium Ion cloud data server. This approach highly improves the performance of the applications in comparison to explicit data formats. User feedback validates that the GHG App has great potential to support decision-makers with mandatory and voluntary decarbonisation initiatives for cities.
The UDT concept, GHG App, and the use cases were explored for Singapore, a tropical island city-state. However, the UDT conceptual architecture and framework presented in this thesis can be utilised around the world. Further applied in various domains to a considerably larger (country/state/regional) and smaller (neighbourhood/campus/district) administrative scale.
References
Alva, P., Biljecki, F., and Stouffs, R.: USE CASES FOR DISTRICT-SCALE URBAN DIGITAL TWINS, Int. Arch. Photogramm. Remote Sens. Spatial Inf. Sci., XLVIII-4/W4-2022, 5–12.
Alva, P., Mosteiro-Romero, M., Miller, C., & Stouffs, R. (2024). Mitigating operational greenhouse gas emissions in ageing residential buildings using an Urban Digital Twin dashboard, Energy and Buildings, Volume 322, 2024, 114681.
Alva, P., Mosteiro-Romero, M., & Stouffs, R. (2024). Estimating operational greenhouse gas emissions in the Built Environment using an Urban Digital Twin: Sustainable city management tool for decarbonisation of cities”. In 29th International Conference on Computer-Aided Architectural Design Research in Asia: Accelerated Design, CAADRIA 2024, Volume 2 (pp. 365–374).
Alva, P., Mosteiro-Romero, M., Pei, W., Bartolini, A., Yuan, C. & Stouffs, R. (2023). “A bottom-up approach for creating an Urban Digital Twin platform and use cases: A city energy system dataset visualisation and query”. In 28th International Conference on Computer-Aided Architectural Design Research in Asia: Human-centric, CAADRIA 2023 (pp. 605-614)
Alva, P., Mosteiro-Romero, M., Miller, C., & Stouffs, R. (2022). “Digital twin-based resilience evaluation of district-scale archetypes - A COVID-19 scenario case study using a university campus pilot”. In 27th International Conference on ComputerAided Architectural Design Research in Asia: Post-carbon, CAADRIA 2022 (pp. 525-534)
Fig 3 Presentation by Pradeep Alva
Theme 3 Perceiving the City
Mei Xiaohan
Key Cues on Wayfinding in Large-Scale Windowless Spaces
Zhu Yihan
Understanding the Imageability of Urban Public Spaces through Multi-Source Data in Singapore
Fan Zicheng
Coverage and Bias of Street View Imagery in Mapping the Urban Environment

Information
Fig 1 Clustering Results of Horizontal Distances between Eye and Fixation Points on Guidance
above Eye Level in the People’s Square Station (Source: Xiaohan Mei)
Key Cues on Wayfinding in LargeScale Windowless Spaces
Xiaohan Mei, Tsinghua University
With the accelerating process of global urbanisation and the demand for high-quality urbanisation in China, large-scale windowless spaces, such as metro stations and commercial complexes, have become essential parts in daily life. However, the lack of natural light and external environmental references makes wayfinding challenging, which has become one of the key factors limiting the quality of experience in such spaces. Clarifying the spatial cues people rely on for wayfinding and enhancing the spatial experience through design interventions is a critical issue that must be addressed in the construction of high-quality large-scale windowless spaces.
This study focus on the core question: What spatial cues do people select during wayfinding in large-scale windowless spaces? To achieve this, this study develops a framework for studying wayfinding spatial cues based on ergonomic measurements. In terms of analytical methods, this study explores existing theories of spatial cognition and taxonomy of spatial elements affecting wayfinding, proposing two key types of spatial cues for wayfinding in windowless spaces: guidance information cues and spatial structure cues. Additionally, based on the characteristics of wayfinding behaviour, this study establishes and refines ergonomic measurement indicators for spatial cue studies. In terms of data collection, this study conducts wayfinding experiments in a virtual reality environment, gathering 239 valid sets to build an ergonomic dataset on wayfinding in windowless spaces.
Regarding guidance information cues, this study discusses people’s selection of the position of guidance information and their understanding of its content. Using eye-tracking data and spatial-temporal location data, this study analyses people’s choices in viewing guidance information at intersections of 4 representative spatial typologies: T-type, cross, roundabout, and portal. People’s choices of the signages’ positopn include vertical height, horizontal distance, and vertical viewing angle. Furthermore, this study examines people’s path decisions after viewing different types of arrow-based and number-based guidance

information, suggesting the importance of aligning guidance information with decision points and encoding spatial adjacency in guidance information. This analysis provides concrete parameters and positivistic evidence for the layout and content setting of guidance information at different intersection types.
Regarding spatial structure cues, this study reveals differences in spatial cue selection when people find their way in large-scale windowless spaces of different typologies. The results show that in corridor-type and grid-type windowless spaces, cues that suggest the overall spatial structure play a critical role in improving wayfinding efficiency. In atriumcorridor-type windowless spaces, cues that emphasise topological nodes significantly enhance wayfinding efficiency. In free-form windowless spaces, people rely more on guidance information cues than spatial structure cues. Based on these findings, this study further discusses the spatial interface features that can serve as structural cues. In corridor and grid spaces, each zone’s basic configuration should maintain relatively simple forms and a consistent topological structure. Features of the spatial interface, such as colour and decoration, should align with these structural features. In atrium-corridor spaces, the basic configuration should emphasise adjacent topological nodes and the connections between them. Spatial interface features, such as the differentiation of landmarks and the openness of nodes, should correspond to these topological elements.
Based on these findings, this study develops a design strategy checklist aimed at improving wayfinding efficiency in large-scale windowless spaces, which includes both a guidance information cues design checklist and a spatial structure cues design checklist. This tool offers an empirical reference for designing wayfinding cues tailored to different spatial typologies
Fig 2 Research Methods (Source: Xiaohan Mei)

in windowless spaces. This study applied this tool to real-world built spaces, implementing design interventions and validating the effectiveness of the research conclusions and the design tool through VR experiments.
In conclusion, the core aim of this study is to explore the key cues on wayfinding in windowless spaces. To achieve this, the study constructs a framework for researching wayfinding spatial cues based on ergonomic measurements. Through positivistic analysis, it reveals differences in people’s selection of guidance information and spatial structure cues when wayfinding in large-scale windowless spaces of different typologies. This study also develops a design strategy checklist, providing a more precise reference tool for the quality improvement of large-scale windowless spaces.
Fig 3 Presentation by Xiaohan Mei

Fig 2 Maps indicating the spatial distribution of 15 Imageability Meaning Categories scores across all places in Singapore. Stronger colored places mean higher scores; places with a score of zero are not displayed. (Source: Yihan Zhu)
Understanding the Imageability of Urban Public Spaces through Multi-Source Data in Singapore
Yihan
Zhu, National University of Singapore
Imageability, a core concept in urban design, significantly influences how people perceive and interact with urban space. First introduced by Kevin Lynch in The Image of the City (1960), imageability has remained a critical quality in urban design, focusing on memorable and distinctive urban elements that enhance social interaction, place attachment, and liveability. This concept is closely related to qualities such as legibility, human scale, and diversity, with its application seen in urban design practices that prioritize the famous five imageability elements: paths, edges, districts, nodes, and landmarks. Despite its significance, this concept lacks clarity and standardized measurement methods due to the inconsistent understanding of user perception and over-reliance on visual elements measurement. Imageability consists of three components, namely identity, structure and meaning. Nevertheless, the concept is hitherto primarily built on the first two components, and the third one of meaning has yet to be clearly and fully studied. Therefore, the understanding of imageability needs to be examined and the meaning component should be clarified, so that the imageability concept could be revitalized in the new era. These consist the three parts of My PhD research: First, a systematic review of understanding the user perspective on urban public spaces has been conducted, as studying urban public spaces from the user’s perspective is crucial for understanding imageability and is also significant for effective urban design, planning, and policy-making. The rapid advancement of machine learning (ML) techniques has enhanced the ability to analyze and understand user data in urban public spaces, such as usage patterns, activities, and public opinions. However, limited efforts have been made on a structured understanding of urban public spaces from the user’s perspective. These knowledge gaps have also hindered the full realization of ML’s potential in describing and analyzing urban public spaces. After systematically reviewing 319 relevant papers, this review analyzes ten dimensions of the user’s perspective (Fig 1) on urban public spaces and identifies three unaddressed issues: (1) interpretation of user’s perception, (2) overlooked

user demographics, and (3) data acquisition. In addition, this review also examines the applications of ML to these dimensions and their potential to tackle the three issues, and highlights two main opportunities to integrate ML for more rigorous and data-driven public spaces studies: (1) combining Computer Vision and Natural Language Processing in public spaces quality measurement and (2) investing in high-quality user data.
Second, a research to explore the meaning component of imageability has been conducted. During the literature review process, the social media data shared by users and Large Language Model (LLM) has been found to be helpful in studying the meaning attached to places. The rise of new urban data, particularly the booming availability of reviews of urban spaces on platforms such as TripAdvisor and Google, offers a valuable opportunity to incorporate the meaning into the imageability study. By adapting several open-source algorithms, this research efficiently extracts both objective (e.g. location, number of reviews) and subjective (e.g. ratings, review text) information from the online platform, proposing a novel approach to studying the meaning component through a fine-tuned BERT model. These data and methods enable this research to capture and categorize the meaning components for describing the image of the city, using Singapore as a case study. The results present 15 imageability meaning categories, which provide valuable insights into why the public perceives certain places in Singapore as imageable (Fig 2). It also shows that the existing imageability concept could potentially be enhanced by incorporating the meaning into the study of imageability. While Lynch’s original framework focused on elements like paths, edges, and landmarks, this research demonstrates how meaning could represent the way people perceive urban environments and enhance the five elements of imageability in two ways: First, for the landmarks or nodes that defined by their physical characteristics,
Fig 1 The 10 Dimensions of the User Perspective on Urban Public Spaces (Source: Yihan Zhu)

their meanings amplify their distinctiveness by adding more social and cultural significance. Second, certain imageability meaning categories could make new imageable “nodes” emerge, the physical setting of these “nodes” may not be impressive, but they have rich meaning. Along with these findings, the research method introduces a new approach for using online text data and LLMs in urban studies, providing a valuable reference for future research, which can be scaled elsewhere due to the wide availability of data.
Third, as the above research findings and approaches open a new agenda for future studies, a new study comparing the image of the city measured from the multiple datasets is ongoing, aiming to build a new framework of imageability.
References
Zhu, Y., Zhang, Y., Biljecki, F., 2025. Understanding the user perspective on urban public spaces: A systematic review and opportunities for machine learning. Cities 156, 105535.
Fig 3 Presentation by Yihan Zhu

Fig 1 Completeness and frequency distribution of SVI coverage on buildings (Source: Zicheng Fan)
Coverage and Bias of Street View Imagery in Mapping the Urban Environment
Zicheng
Fan, National University of Singapore
Street View Imagery (SVI) has gained a significant role in urban studies and in spatial data infrastructure as a new means to map and sense urban environments. Research efforts have been predominantly focused on the development of use cases, while fundamental concerns of data quality and reliability of this emerging form of data have not been given sufficient attention in international scientific literature. The lack of understanding of questions such as reach and coverage of SVI data may have adverse effects on use cases and downstream analyses. For example, SVI has been used intensively for mapping street greenery and buildings, assessing walking environment and microclimate, and understanding human perception at the urban scale, but not much is known about the representativeness and suitability of the data for the corresponding road and sidewalk scenarios, or for the investigated neighbourhoods and local zones, e.g. it is not known what is the reach of data and to what extent can we sense an urban aspect using SVI, and whether the (incomplete) coverage is representative or biased.
To address the questions, the research proposes a novel workflow to estimate SVI’s coverage on elements in urban environment. The workflow integrates both the positional relationships between SVI and the target element, and the obstructions from environmental objects and settings into consideration, applying isovist analysis and semantic segmentation methods. Moreover, an accompanying indicator system is developed to evaluate and describe the coverage extent. Key considerations include the degree to which total street elements in a city can be captured in SVI, and whether certain instances in the element are repeatedly covered while others are frequently left out of sight.
Taking the central area in the Greater London as the case study area, the research is further structured around three experiments to identify potential bias of SVI in covering and representing environment information. Urban building facade is selected as the example element for these experiments. In Experiment 1, we examine the distribution characteristics of building information captured by SVI and compare it with the initial distribution based on building footprint data. Experiment 2 focuses on SVI coverage at the aggregated level,

comparing the proposed element-level coverage estimates with traditional coverage estimates that rely on spatial distribution. In Experiment 3, we explore the impact of different SVI collection intervals, an important aspect of SVI metadata, on the variability of elementlevel SVI coverage. Through the experiments above, we hope to justify our element-level SVI coverage estimation workflow and metrics, and offer useful suggestions and reference in improving the reliability of further SVI-based urban research.
Our study shows that, though high availability on urban road network, SVI only reach 62.4 % of buildings in the case study area. The completeness of SVI coverage on building facades remains low, averaging 12.4 %. Further, our results indicate that there are biases between SVI reached building information and the initial distribution of building information. Residential and retail buildings, and buildings with smaller sizes tend to have more complete facade coverage in SVI. SVI tends to significantly over-represent building types such as mixed use, industry & business, and transport. Community and retail buildings are slightly
Fig 2 Steps to approach an optimal interval for SVI collection (Source: Zicheng Fan)

over-represented, while residential buildings, especially in suburban areas, are generally under-represented. Our study goes further by revealing that the completeness and frequency indicators decrease non-linearly as the SVI sampling interval increases, but at different rates. We identified a critical interval: below this threshold, the frequency indicator decreases faster than the completeness indicator; above it, the reverse occurs. This suggests that SVI collected near this critical interval threshold balances higher building coverage completeness with lower redundancy, maximizing cost-effectiveness. Further analysis confirmed this critical interval, typically ranging between 50 m and 60 m, is consistently distributed across most local grids, supporting current common practices and providing valuable guidance for future SVI-based urban research.
Regarding both the infrastructural and human aspect, for the first time, we reveal at a very high resolution and large-scale, the reach and usability of SVI for urban sensing and mapping. Our study argues that the element-level coverage of SVI, with respect to building, greens, and other useful street view elements and visual information, should be included as a new dimension for SVI data quality assessment. The findings also suggest that while SVI offers valuable insights, it is no panacea -- its application in urban research requires careful consideration of data coverage and element-level representativeness to ensure reliable results. The research highlights the limitations of traditional spatial data quality metrics in assessing SVI, and variability of SVI coverage under different data acquisition practices.
References Fan, Z., Feng, C.-C. and Biljecki, F. (2024) ‘Coverage and Bias of Street View Imagery in Mapping the Urban Environment’. arXiv.
Fig 3 Presentation by Zicheng Fan
Theme 4 Unearthing the City
Liu Ke
Exploring the Identity Space of the Ding Hui Community in Quanzhou, China
Qiao Runze
Adapt for Survival: A Comparative Research on Chinese Overseas Zones in Southeast Asia
Feng Lishen
A Taste of Jiangnan in Lingnan: The Temple of Longevity and Cross-Regional Garden Culture in Early Qing Dynasty Central Guangdong

Exploring the Identity Space of a Hui Community in China
Ke Liu, Tsinghua University
A contemporary Hui family in a town of Quanzhou, China, underwent “de-ethnicization” at the turn of the Yuan-Ming dynasties, followed by an active quest for “re-ethnicization” since 1978. They possess a well-developed clan culture and a subdued Islamic faith, presenting an atypical image of the Hui ethnicity and a need for the reconstruction of the Hui community identity. Through over forty years of efforts, they have come to be regarded as a model for ethnic development, cultural integration and economic progress in Southeast China. Among these efforts, spatial practice, as an important showcase of the Hui community reconstruction, has played a critical role in the reformation and manifestation of this Hui community, and showcased a complex interweaving of ethnic space, religious space, and clan space.
This research focuses on this contemporary community from the perspective of spatial practice. Using methods such as fieldwork and case study, the research explores the structure and narrative of the identity space of this community, thereby revealing the spatial mechanism behind the identity construction of “the Hui community”.
Specifically, through the lens of both historical development and contemporary context, this research delineates three distinct types of identity space of this community: ethnic space, religious space, and clan space. By analyzing individual spatial practices of each type, the research summarizes the structure and narrative of the three identity spaces, thereby deriving the overall structure and narrative of the identity space of this community. A synthesis of the strategies employed in the spatial practices yields the spatial mechanism behind the identity construction of “the Hui community”. Moreover, the research attempts to explore the potential reasons for the unexpected exclusion of this community’s relevant important space from the 22 component sites of Quanzhou: Emporium of the World in Song–Yuan China included in the World Heritage List, with an eye on its development paths going forward.
Fig 1 Eid al-Fitr in the Mosque besides the Hui History Museum/the Ancestral Hall (Source: Ke Liu)

The research highlights that space, as a form of capital, played a crucial role in the reformation of “the Hui community”. These Huis leveraged the ancestral hall and the fifth patriarch and madam’s tomb as two key historical resources, and employed proactive spatial practices and flexible spatial strategies. Over the years, they have developed many ethnic spaces, including the Hui history museum, the family tomb group, the ethnic Nanyin society and the new campus of the ethnic middle school, religious space of the mosque, and clan spaces such as the ancestral hall and numerous branch ancestral temples inside and outside the town. Together, these spaces created a community structure of the identity space characterized by stark ethnic space, subdued religious space, and hidden clan space. This structure presents a spatial narrative of salient ethnic identity, characterized by “patriotism and loyalty to the Party, respect for ancestors and harmony with neighbors, unity, ethnic self-reliance, openness and friendliness, and gratitude”. Additionally, it encompasses a subdued religious identity spatial narrative of “Islamic revival” and a hidden clan identity spatial narrative focused on “clan prosperity”. The construction of the multi-faceted, wellorganized, and highly adaptive community identity allows these Huis to strategically select and combine spatial fragments and their associated narratives to meet various real-world needs, thereby contributing to their economic prowess and social standing. However, this “art of balance”, aimed at creating a stark image of a “typical Hui community”, has also resulted in a certain degree of spatial and identity ambiguity, which limits this community’s capacity to attract the agglomeration of the Huis and their spaces in a spontaneous way. The deviation between identity space and daily space reveals a misalignment of their public identity and hidden identity, which is closely related to the historical encounters of these Huis, the obfuscation of the Hui concept, and the shifts in the state’s attitudes towards ethnic
Fig 2 The Spatial Structure of the Identity Space of this Community (Source: Ke Liu)

development. Looking ahead, this community calls for the creation and development of space that embrace diversity and truth.
Through a micro, focused case study, the research aims to understand the spatial practice, culture, and identity of contemporary Hui communities in China and provide potential insights and recommendations for their sustainable development in a rapidly changing world. In a broader sense, the research aims to highlight patterns in how contemporary cities established their unique identities by designing their identity space, paving the ground for more comprehensive analyses using artificial intelligence tools.
Fig 3 Presentation by Ke Liu

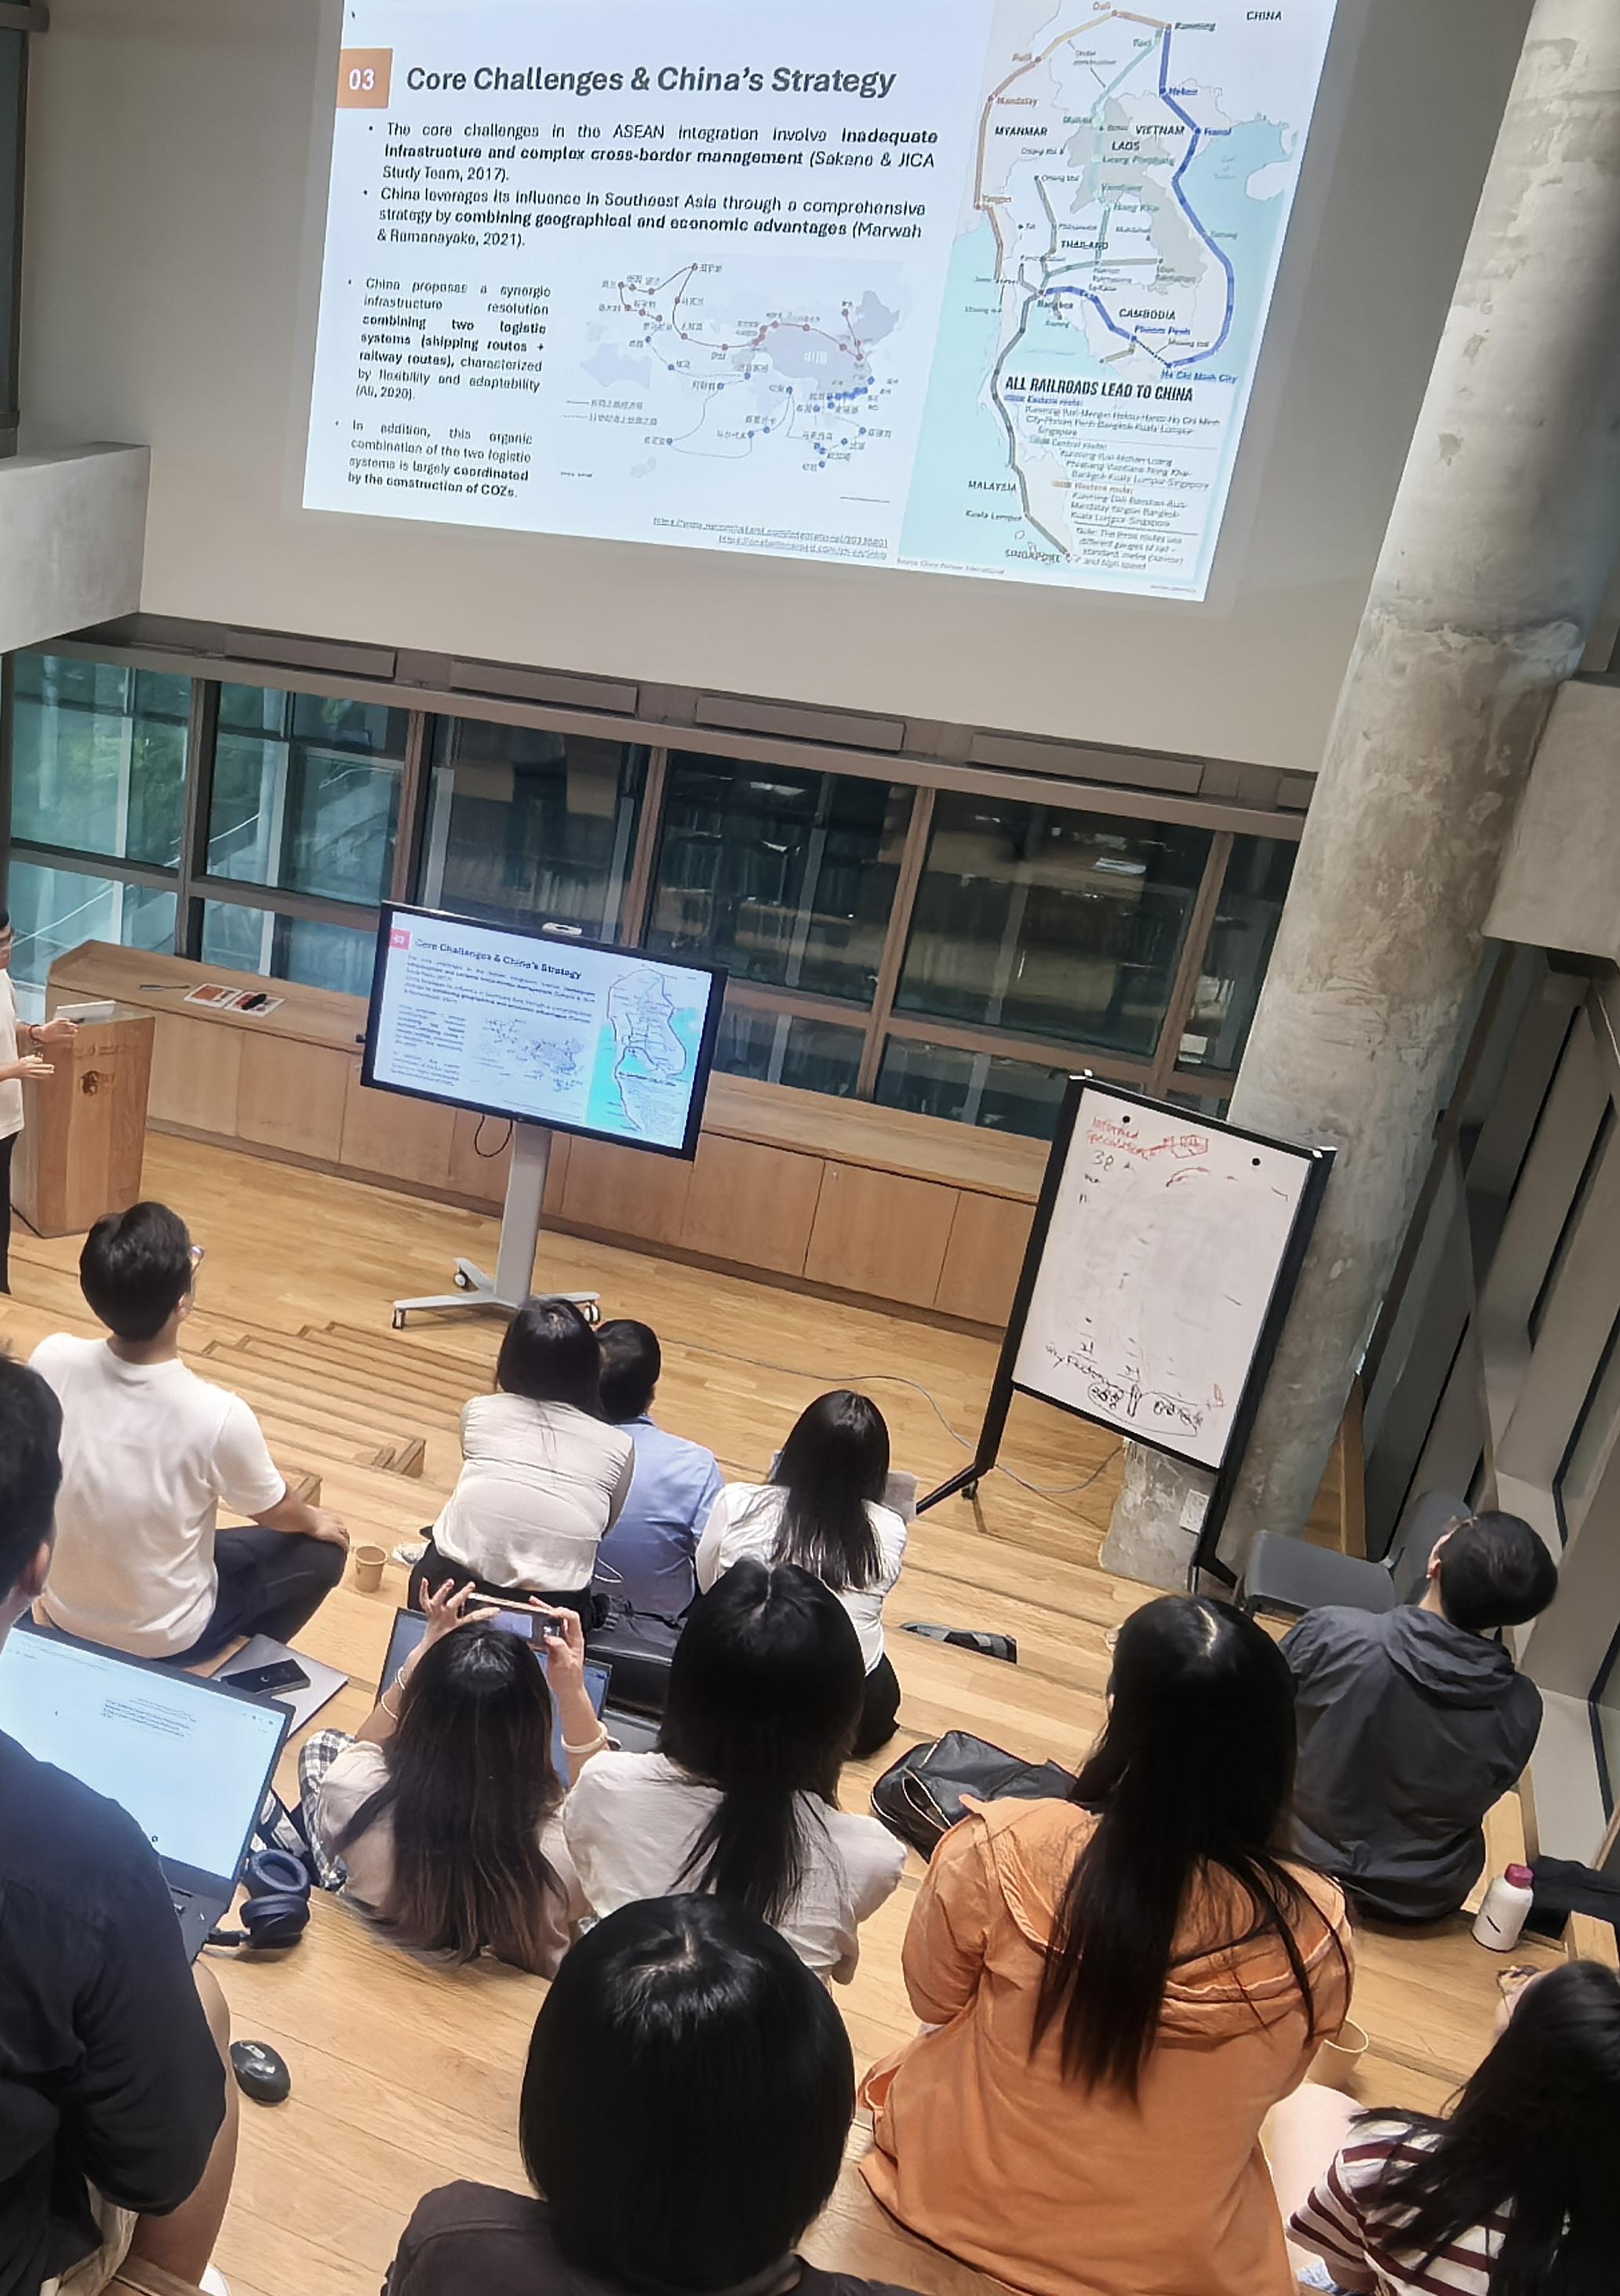
Fig 1 Three Selected COZs for Comparative Research in Southeast Asia
(Source: Redrawn by the Author based on Pic from Yuan, X., Yuan, F., & Wang, X. (2020). The main characteristics and development strategies of China's overseas industrial parks in Southeast Asia. Planners, 36(7), 60-68.)
Integration and Adaption: A Comparative Research on Chinese Overseas Zones in Southeast Asia
Runze Qiao, National University of Singapore
In the context of intensifying globalization and the ongoing Sino-U.S. geopolitical rivalry, Southeast Asia has emerged as a critical site for global capital flows and industrial relocation. Among these dynamics, Chinese Overseas Zones (COZs) have become pivotal spatial and economic hubs for Chinese investments in the region. COZs represent a unique form of bilateral cooperation, integrating Chinese capital and expertise with the development ambitions of host countries. However, the adaptation of COZs to local socio-political, economic, and cultural contexts, especially on the regional scale, remains an underexplored area. This research aims to fill this gap by investigating the adaptation strategies of COZs in Southeast Asia through a multi-scalar lens, focusing on three key questions: (1) How do COZs adapt to the foreign contexts of host countries? (2) How do these adaptations align with the subnational regional development plans (SRDPs) of the host countries? (3) Do stateowned enterprise (SOE)-owned COZs differ from private ones in their adaptation processes, and if so, why?
Theoretically, this research bridges the fields of geopolitics and regional studies. It investigates the relationships between COZs and local development strategies, using infrastructure urbanism to explore the connections between discourse, technical practices, and politics. The study highlights how COZs serve as “partially dis-embedded” spaces—detached from their immediate surroundings yet deeply integrated into the global economy. By examining the interplay between COZs and SRDPs, this research seeks to uncover a growing alternative trend in global-local dynamics that challenges conventional neoliberal narratives of economic zones as profit-maximizing entities.
This proposal hypothesizes that the relationships between COZs and their host countries are shaped by dual dynamics driven by the current geopolitical climate. At the regional scale, host countries employ SRDPs—often framed as “economic corridors”—to integrate foreign capital, especially Chinese investments, into their long-term development visions. These

plans act as intermediaries between the global and local levels, aligning transnational flows of capital with national and regional objectives. At the site scale, Chinese developers adopt phased, embedded, and interactive modes of operation to localize their investments and minimize risks. Whether SOE-owned or privately owned, COZs employ various strategies to balance their global ambitions with the realities of local governance and community needs. Methodologically, the research uses a case-study approach to explore these dynamics in three COZs: the Malaysia-China Kuantan Industrial Park (MCKIP), the Thailand-China Rayong Industrial Zone (TCRIZ), and the Sihanoukville Special Economic Zone (SSEZ) in Cambodia. The selection of these cases is justified by their varied ownership structures (SOE vs. private) and the different socio-political and economic contexts of their host countries. These case studies are structured in a “2+1” manner, with MCKIP and TCRIZ serving as the primary cases and SSEZ providing supplementary insights. This structure ensures a balance between representativeness and informativeness. In addition, the research applies exploratory methods, including pilot studies, stakeholder interviews, site observations, and document reviews.
The findings of this research are expected to contribute significantly to the academic and practical understanding of COZs and their role in global-local dynamics. First, the study addresses the adaptation strategies of COZs, revealing how these zones negotiate their position within complex host environments. This includes examining mismatches between COZ objectives and local priorities, such as differing approaches to infrastructure development—e.g., whether to prioritize infrastructure completion or enterprise attraction. Second, the research sheds light on the alignment between COZs and SRDPs, offering insights
Fig 2 A Conflict Management Process with Multi-Scale Interactions (Source: Runze Qiao)

into how regional planning frameworks can accommodate or challenge foreign investments. This is particularly relevant in the context of Southeast Asia, where SRDPs, such as Malaysia’s East Coast Economic Region (ECER) and Thailand’s Eastern Economic Corridor (EEC), serve as key instruments for integrating foreign capital into regional development. Additionally, the study explores the differences between SOE-owned and privately owned COZs. While SOEs often prioritize strategic and political objectives, private enterprises are more profit-driven, leading to divergent adaptation strategies. These distinctions reflect the broader duality in China’s overseas investments, which balance state-directed goals with market-driven imperatives. The research also emphasizes the role of local governance and community engagement, highlighting the need for COZs to address grassroots concerns to ensure long-term viability.
From a theoretical perspective, this research contributes to the broader literature on Global China, the Belt and Road Initiative (BRI), and enclave urbanism. It positions COZs as key nodes in China’s global economic network, illustrating how these zones connect land and sea transportation networks while navigating geopolitical tensions. Furthermore, by linking COZs to regional planning, the study bridges the gap between urban studies and economic geography, providing a multi-dimensional framework for analyzing infrastructure-led development.
Fig 3 Presentation by Runze Qiao


Fig 1 The garden in 1860 (Source: Li, Changrong & Tan Shouqu (ed.), Collection of the Xi Gathering in the Gengshen Year, 1860.)
Fig 2 The garden in around 1900 (Source: Rautenstrauch Joest Museum)
A Taste of Jiangnan in Lingnan: The Temple of Longevity and Cross-Regional Garden Culture in Early Qing Dynasty Central Guangdong
Lishen Feng, National University of Singapore
In the early Qing Dynasty, the upper class in Lingnan was significantly reshuffled due to an influx of individuals from north of the Five Ridges, particularly from Jiangnan. These newcomers played a prominent role in Lingnan’s literary circle, leaving enduring marks of Jiangnan across various domains, encompassing arts, literature and garden design. The best-documented garden from this period in Guangzhou was situated within the Temple of Longevity. Designed by the legendary Jiangnan sojourner Abbot Shilian Dashan (1633–1705) in the late 17th century, it served as both his residence and a venue for entertaining guests, particularly high-ranking officials and their advisors from Jiangnan. Although now demolished, this garden is remembered through a variety of historical materials, including texts, paintings and photographs, that enable a detailed reconstruction of its design. However, research on this garden from a landscape history perspective has been limited, leaving unanswered the question of how Dashan infused a Jiangnan aesthetic into his garden to distinguish it from others in Guangzhou.
This paper aims to address this question by analysing the regional and historical characteristics of the garden in the Temple of Longevity within the context of 17th-century garden culture in Jiangnan and Lingnan. While this garden is often regarded as a Jiangnan design, its distinctiveness from other gardens in central Guangdong seems less apparent, with numerous local features evident in its flora, building materials, and craftsmanship, as depicted in historical images from later periods. Nevertheless, Dashan’s efforts to incorporate Jiangnan features into the garden were multifaceted, reflecting the complexity of its historical context and his personal identity. For instance, plants symbolic of Jiangnan were intermingled with other southern species, taking advantage of the cooler climate of the time.

Architectural elements evocative of Jiangnan, such as covered walkways, were extensively constructed, while the decorative details of Jiangnan architecture were replicated using the local craftsmanship of Guangzhou. More importantly, the sense of Jiangnan in the garden was not confined to physical elements. Dashan incorporated Jiangnan design theories, particularly in rockery, architecture and horticulture, with names of scenes reminiscent of Jiangnan places and figures.
Dashan’s writings on the rockeries in his garden are perhaps the earliest surviving texts in central Guangdong to document the ‘picturesque’ design principles originating in Jiangnan during the late Ming Dynasty. Relevant ideas were adapted and integrated with local materials and craftsmanship. This adaptation process is further examined through comparisons between Dashan’s rockery design, as recorded in texts and images, and contemporaneous examples from both Jiangnan and Lingnan. Similarly, ‘picturesque’ ideas, alongside other Jiangnan design concepts, were also applied in Dashan’s arrangements of plants and buildings.
A Jiangnan impression in the garden of the Temple of Longevity was thus created through Dashan’s practical selection and interpretation of Jiangnan symbols, combined with the use of materials and craftsmanship available in Guangzhou. The meticulously arranged representations of Jiangnan in Dashan’s garden were intended to convey metaphors for his social and regional identities. The latest design trends reflected in the garden, alongside his artistic and literary accomplishments, demonstrate his mastery of the refined artistry associated with Jiangnan scholars, thereby solidifying his position within the local elite circle despite his humble origins. Furthermore, an investigation into Dashan’s social network
Fig 3 The rockery island in the 1870s (Source: Leiden University Library)

reveals that the rockery island in the garden was a subtle symbol of his bond with the senior masters from the Caodong school of Chan Buddhism and his sympathy for the Ming loyalists he encountered in his youth.
From a broader perspective of landscape and art histories, the garden in the Temple of Longevity marks the beginning of a period when Lingnan elites increasingly embraced Jiangnan ideas, as also reflected in the contemporaneous arts and literature of central Guangdong. The design concepts and elements Dashan employed to express his Jiangnan identity became widely adopted among local garden owners in the following decades. This transition probably correlates with a shift in the core of Guangzhou’s elite circle from influential native literati to officials from the north during the regime change of the mid17th century, as indicated in the identities of the guests whom Dashan entertained in his garden. Through these contextualised analyses, this paper seeks to offer a fresh perspective on the regional characteristics of garden art, contributing to a deeper understanding of the intricate and dynamic processes of cultural exchange between regions during this historic epoch.
Fig 4 Presentation by Lishen Feng


The 1st Joint PhD Symposium
School of Architecture, Tsinghua University
Department of Architecture, National University of Singapore