
21 minute read
Universities making an impact


EACH YEAR STUDENTS on MSc programmes in analytical subjects at several UK universities spend their last few months undertaking a project, often for an organisation. These projects can make a significant impact. This issue features reports of projects recently carried out at one of our universities: University of Southampton. If you are interested in availing yourself of such an opportunity, please contact the Operational Research Society at email@ theorsociety.com
VALUE OF FREE TEXT DATA AND CAUSAL MAPPING
Laura Hannula, University of Southampton, MSc Operational Research (part-time)

Wärtsilä is a global leader in innovative technologies and lifecycle solutions for the marine and energy markets, operating in more than 70 countries. While numerical data is widely and successfully used across the company to support customers, Laura’s dissertation focused on generating actionable insights from less-commonly utilised free text data.
The topic for the dissertation stemmed from the need to better collect and use the innovative ideas and opinions of customer-facing staff in management decision making, without engaging in resource-intensive qualitative interviews. Wärtsilä’s Marine Power Sales team therefore trialled data collection via an ad-hoc staff survey, which became the source data for the exploratory dissertation project in summer 2021.
Laura’s dissertation focused on assessing the benefits and challenges associated with the use of free text data. Her practical work highlighted the immense value of drawing insights from free text comments written by employees of various levels of seniority and using these to establish a development roadmap.
With support from Selin Ahipasaoglu from the University of Southampton, she analysed 660 survey responses using Python, experimenting with methods such as sentiment scoring with a lexical model, word similarity, and clustering. Particularly for the text pre-processing phase, it was beneficial that Laura had been working for Wärtsilä during her MSc studies. This is because the high prevalence of company-specific jargon in the responses meant many of the outof-box sentiment scoring packages tested failed to capture the true sentiment of the comments.
Secondly, she researched Soft Systems Methodology and Causal Mapping to see if problem structuring could help resolve some of the problems noted in the survey. As a practical demonstration, a causal map with over 200 components was constructed to visualise, and thus help the company move towards solving, the challenge of unclear roles and responsibilities – an issue commonly encountered by large organisations.
Lastly, findings were gathered into a Miro dashboard, enabling stakeholders to interact with the output. This increased the value of the work, as subject matter experts could easily drilldown on insights and make, and share, their own conclusions.
Fraser Scott, the thesis supervisor and Chief, Project Evolution, at Wärtsilä: "Our operative staff are keen to tell us of ways we can improve and things that don’t quite work optimally, but the challenge is effectively consolidating the many voices and words into an understandable set of actionable insights. Laura’s project enabled that and much more as we are able to not only hear the insights, but understand the feelings, allowing us to focus on the actions that will drive the biggest impacts for our business. In a further step, Laura was able to drill into what appears to be a simple problem: ‘clarity of roles and responsibilities’, to breakdown the multitude of reasons why this issue subsists, despite management efforts."
This is an excellent demonstration of theoretical knowledge obtained from MSc Operational Research studies being applied to a real-life business problem, to create value and actionable insights.


O.R. CONTRIBUTES TO THE COVID-19 RESPONSE IN THE BRISTOL NHS SYSTEM
RICHARD WOOD COVID-19 HAS CAUSED PROBLEMS for health services at the national, regional and local levels. In response, modelling – now a household term – has played a significant role in influencing government policy, particularly the timing and magnitude of various societal restrictions employed over the last two years. However, the vast majority of this effort has been at the national and regional level, with very little actionable insight available for local healthcare systems, where much of the operational decision making takes place, e.g. how many beds to set aside for incoming COVID-19 demand, how many staff to put on standby, how many elective procedures to postpone.
Time and again, experience has shown that individual systems can fare very differently, even within the same region, with local intricacies – demographics, rurality, employment type – prohibiting the meaningful abstraction of nation-level forecasts of cases and hospitalisations. What local systems need is locally-relevant modelling. And there is more to modelling than epidemiological modelling, with the pandemic raising a vast multitude of challenges whose solutions are best approached through an equally diverse range of modelling and analytical techniques.
In the one million resident Bristol, North Somerset and South Gloucestershire (BNSSG) system, we have called upon various methods
from the O.R. toolkit to confront an evolving set of problems experienced during COVID-19. This article chronicles such efforts from the start of the pandemic in March 2020 to the time of writing in December 2021.
INTENSIVE CARE CAPACITY Our first concern was for intensive care, following the Imperial College estimate that COVID-19 demand would be over 30 times maximum capacity were no action taken. A discrete event simulation model of the intensive care admissions process was quickly constructed. The problem was that it is not easy to convert beds to intensive care specification, but if we didn’t then patients could die as a result. In order to help understand the scale of this problem, we used our model to project such ‘capacity-dependent’ deaths under a range of possible surge capacities. This informed local decisions on capacity for both ICU beds and temporary morgue space. Some of the projections – based upon the ‘do nothing’ Imperial College projections – are presented in Figure 1, noting that ultimately no capacitydependent deaths occurred due to the lockdown imposed on 23 March 2020.
The model was later extended from its ‘first-come first-served’ assumption to consider other queue disciplines if ICU capacity were overwhelmed (see Wood et al., 2021a). Results revealed that the greatest saving of aggregate life-years lost would be through reverse triage – an ethically debatable policy in which the right is reserved to prematurely discharge certain patients if the admission of others deemed more likely to benefit from care cannot otherwise be guaranteed. This takes into account survival odds and length of stay, in maximising the benefit from the available resource (i.e. the ICU beds). While, in BNSSG, ICU triage has not been implemented to date, we came perilously close in January 2021, with results of the modelling informing discussions at our Clinical Cabinet. The work was also recognised by Health Data Research UK’s Impact Committee and has helped support further UKRIfunded studies.
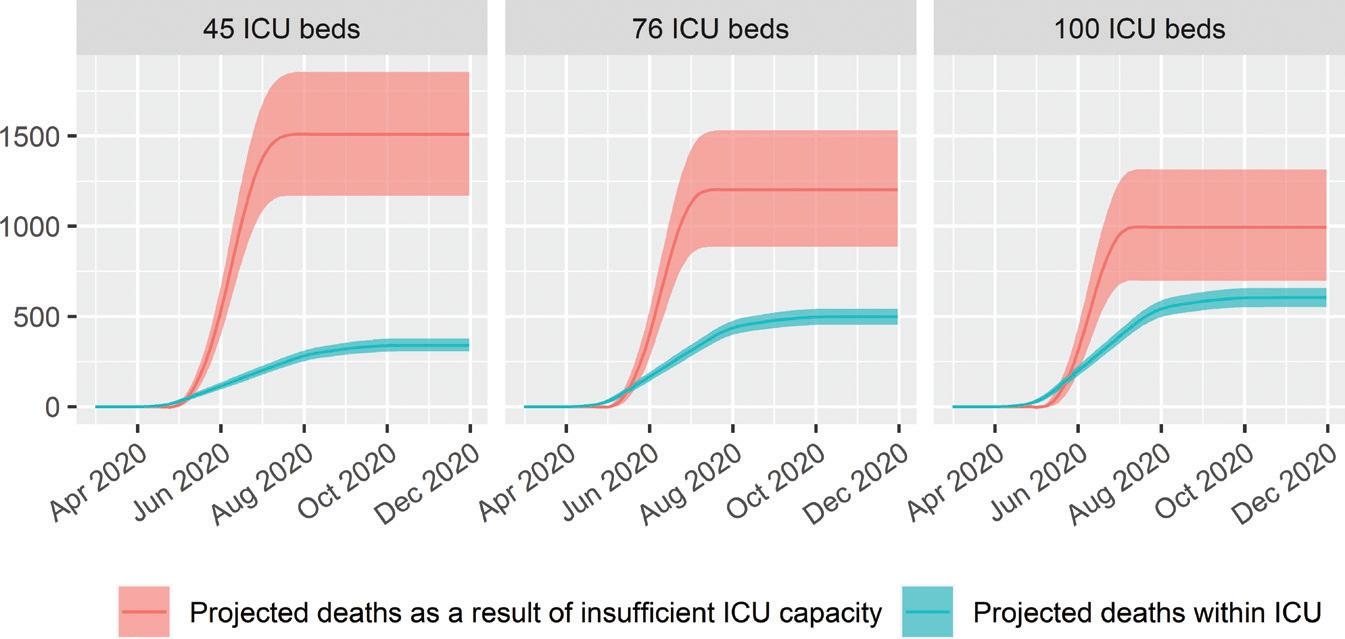
FIGURE 1 PROJECTED CUMULATIVE DEATHS FOR A MAJOR ACUTE HOSPITAL WITHIN BNSSG
LOCAL EPIDEMIOLOGICAL MODELLING Much of our early work on intensive care made use of patient demand trajectories derived from national studies. Given the aforementioned drawbacks of abstracting nationlevel estimates, misalignment to local conditions at the time, and a lack of control over scenario generation, our attention turned to developing our own admission forecasting model. Thankfully, as of Spring 2020, colleagues at the University of Bristol were already working on an SEIR-type compartmental model which could be purposed to meet our needs (see Booton et al., 2021). This led to the formation of the BNSSG Scenario Review Working Group, comprising public health analysts, epidemiologists, modellers and managers from across the system. Meeting weekly, this group would use the model to refresh the ‘best guess’ predictions of bed occupancy based on the latest information available at the time. An example is provided in Figure 2, for the model run on 10 June 2020 (actual values are represented by black dots).
As well as the acute setting, surges in severe COVID-19 can also pressure downstream community services, given that roughly one in five acute admissions require some form of post-discharge support. To project spot purchase capacity requirements, we developed discrete time simulation models of patient flow to both bedded and home visit community care, using the outputs of the SEIR model as inputs for the demand-related parameters. And another important use of the SEIR model came in early 2021, when we carried out substantial adaptations in order to estimate the longer-term effect of mass vaccination on COVID-19 hospitalisations, and thus to understand the residual
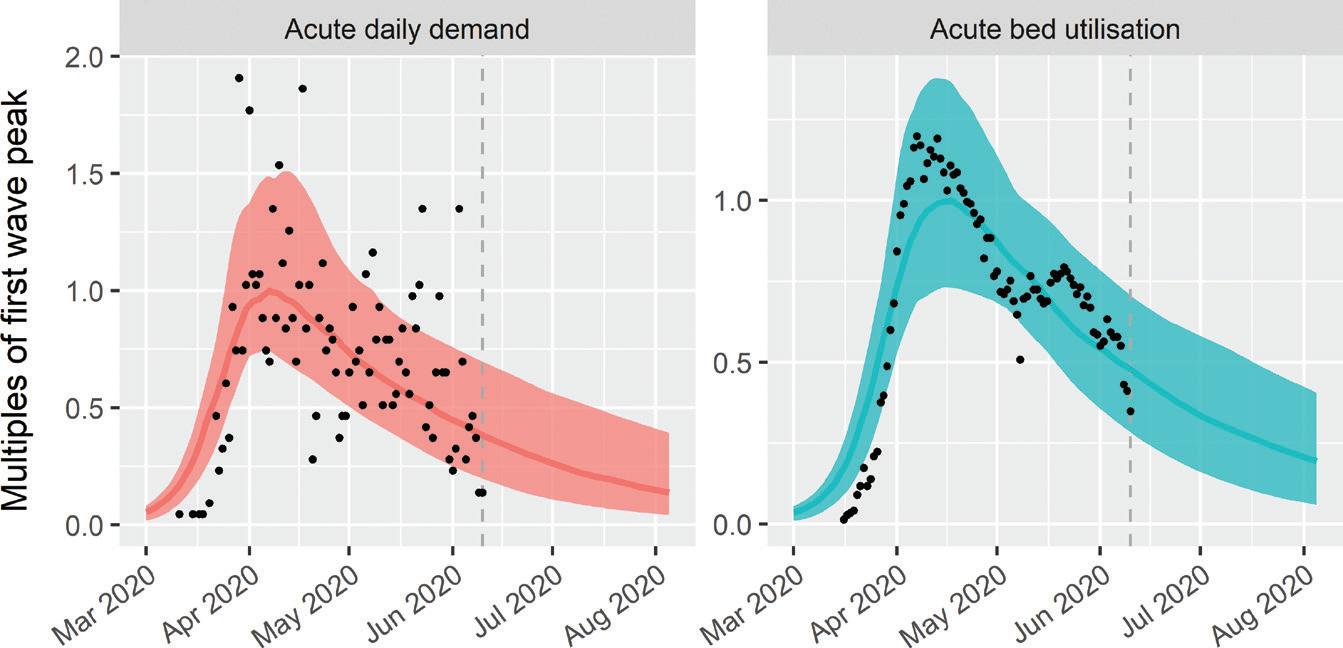
FIGURE 2 MODEL PREDICTIONS FOR COVID-19 HOSPITALISATIONS WITHIN THE BNSSG SYSTEM
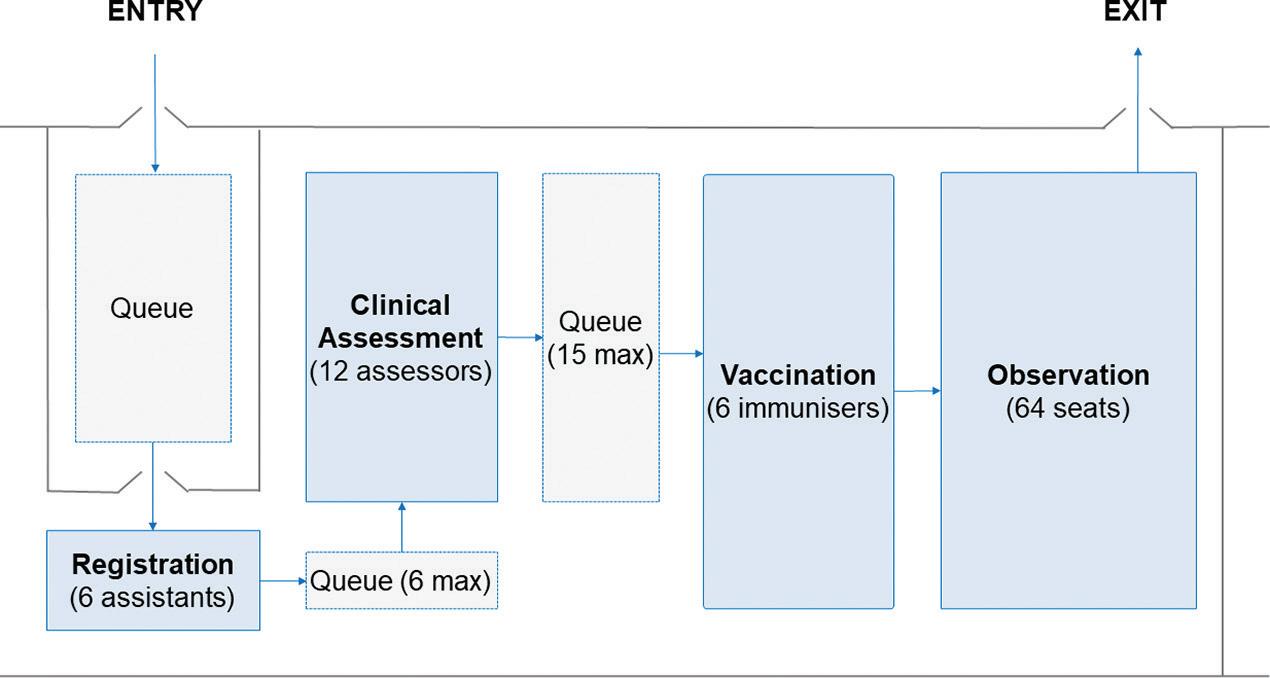
FIGURE 3 CONFIGURATION OF BRISTOL’S ASHTON GATE MASS VACCINATION CENTRE
capacity for working through the elective backlog. Projections were later validated with peak bed occupancy, reached in Autumn 2021, residing comfortably within the long run modelled inter-quartile range.
OPTIMISING MASS VACCINATION We also supported the mass vaccination effort by helping with the design of mass vaccination centres. Again, much of the operational decision making took place at the local level, with little centrally provided information to guide healthcare systems in configuring these new and unfamiliar sites. The sequence of events in a vaccination centre actually represents a quite straightforward queueing process (Figure 3), and so, working with Prof Christos Vasilakis of University of Bath’s Centre for Healthcare Innovation and Improvement (with whom the team does much collaborative work), we were able to deploy our generic healthcare pathway modelling software, PathSimR (https://github.com/nhs-bnssg-analytics/ PathSimR), to consider optimal operational parameters.
In advance of Bristol’s Ashton Gate site opening to the public, modelling revealed that the daily throughput being considered by managers was much too high and would result in severe congestion (see Wood et al., 2021b). This would not just dissuade future vaccines from attending but would also be bad for the first booked patients, many of whom were elderly and had limited capacity to stand around. Instead, management went with our lower throughput figure, with modelling also influencing other aspects of site design, such as less postvaccination Observation capacity in favour of more queueing space between Clinical Assessment and Vaccination. Other regional vaccination centres were also modelled, with the work being shortlisted for the OR Society’s 2021 Presidents Medal.
MODELLING THE ELECTIVE BACKLOG Much press coverage has been given to the size of the NHS waiting list, which has grown by 1.6 m from the start of the pandemic to the time of writing. At the local BNSSG level, we have used a fairly basic computer simulation to model overall waiting list size and referral-to-treatment (RTT) waiting times under various scenarios relating to future demand and capacity. With much O.R. interest typically in the more granular detail of individual pathways or services, this kind of high-level ‘coarse’ modelling has been somewhat neglected – yet, arguably, modelling at this level better aligns with senior decision making.
We have also applied the same model to national data. In April 2020, following central guidance to postpone all non-urgent planned treatments to make way for COVID-19, we estimated that it would take £14.7bn to recover
elective performance in the longer term (see Wood, 2022). Despite being only weeks after the pandemic was declared, this figure has now received support from the Health Foundation’s recent estimate of £12.3–16.8bn and the Government’s own pledge of £14bn. Lately, we’ve adapted the model to take account of the increased risk of patients leaving the waiting list (reneging) as waiting times get prohibitively large (see Howlett & Wood, 2021), using the enhanced model to obtain long run projections for England. These are presented in Figure 4, assuming the ‘return’ of various proportions of the estimated 7.1 million referrals ‘missed’ during the pandemic.
In April 2020, following central guidance to postpone all non-urgent planned treatments to make way for COVID-19, we estimated that it would take £14.7bn to recover elective performance in the longer term
OTHER INDIRECT IMPACTS OF COVID-19 In BNSSG, we have used various other O.R. techniques over the course of the pandemic. We have performed clustering on the 30,000 strong shielding cohort – using an improved understanding of their various needs to better tailor care and advice (see Kenward et al., 2020). We have used discrete time simulation to model the effect of COVID-19 on our mental health system. Analysis of survey and activity data has led to the finding that certain patient groups may benefit from continued use of outpatient telehealth. And regressing upon community mobility data has shown that, along with directly related COVID-19 demand, societal restrictions have a significant impact on the volume of nonCOVID-19 urgent care demand as well.
THE CONTRIBUTION OF O.R The examples given here illustrate just some of the potential ways in which agile use of O.R. can usefully inform local healthcare decision making in highly pressured and uncertain times. Other organisations, such as the Midlands-based Strategy Unit, can count on many more examples during the course of the pandemic. While much of our work in BNSSG is done under the ‘O.R. banner’, there is much ostensibly-O.R. work happening without overt reference to the discipline – consider, for instance, the similarities between the stock-and-flow setup of system dynamics and the compartmental epidemiological models used aplenty to influence government policy on lockdowns and other restrictions.
Apart from SEIR models and projecting hospitalisations, there is a golden opportunity for O.R. on the bigger question of optimising healthcare resource allocation more widely – the short- and longer-term costs and benefits of prioritising COVID-19 versus elective and cancer care. As we look to ongoing COVID-19 pressure, most recently through Omicron, health bosses would be indebted for robust analysis of this depth. There is also an opportunity for O.R. to contribute to modelling at the next level up – of balancing health outcomes with the wider macroeconomic impacts of societal restrictions and other government policy.
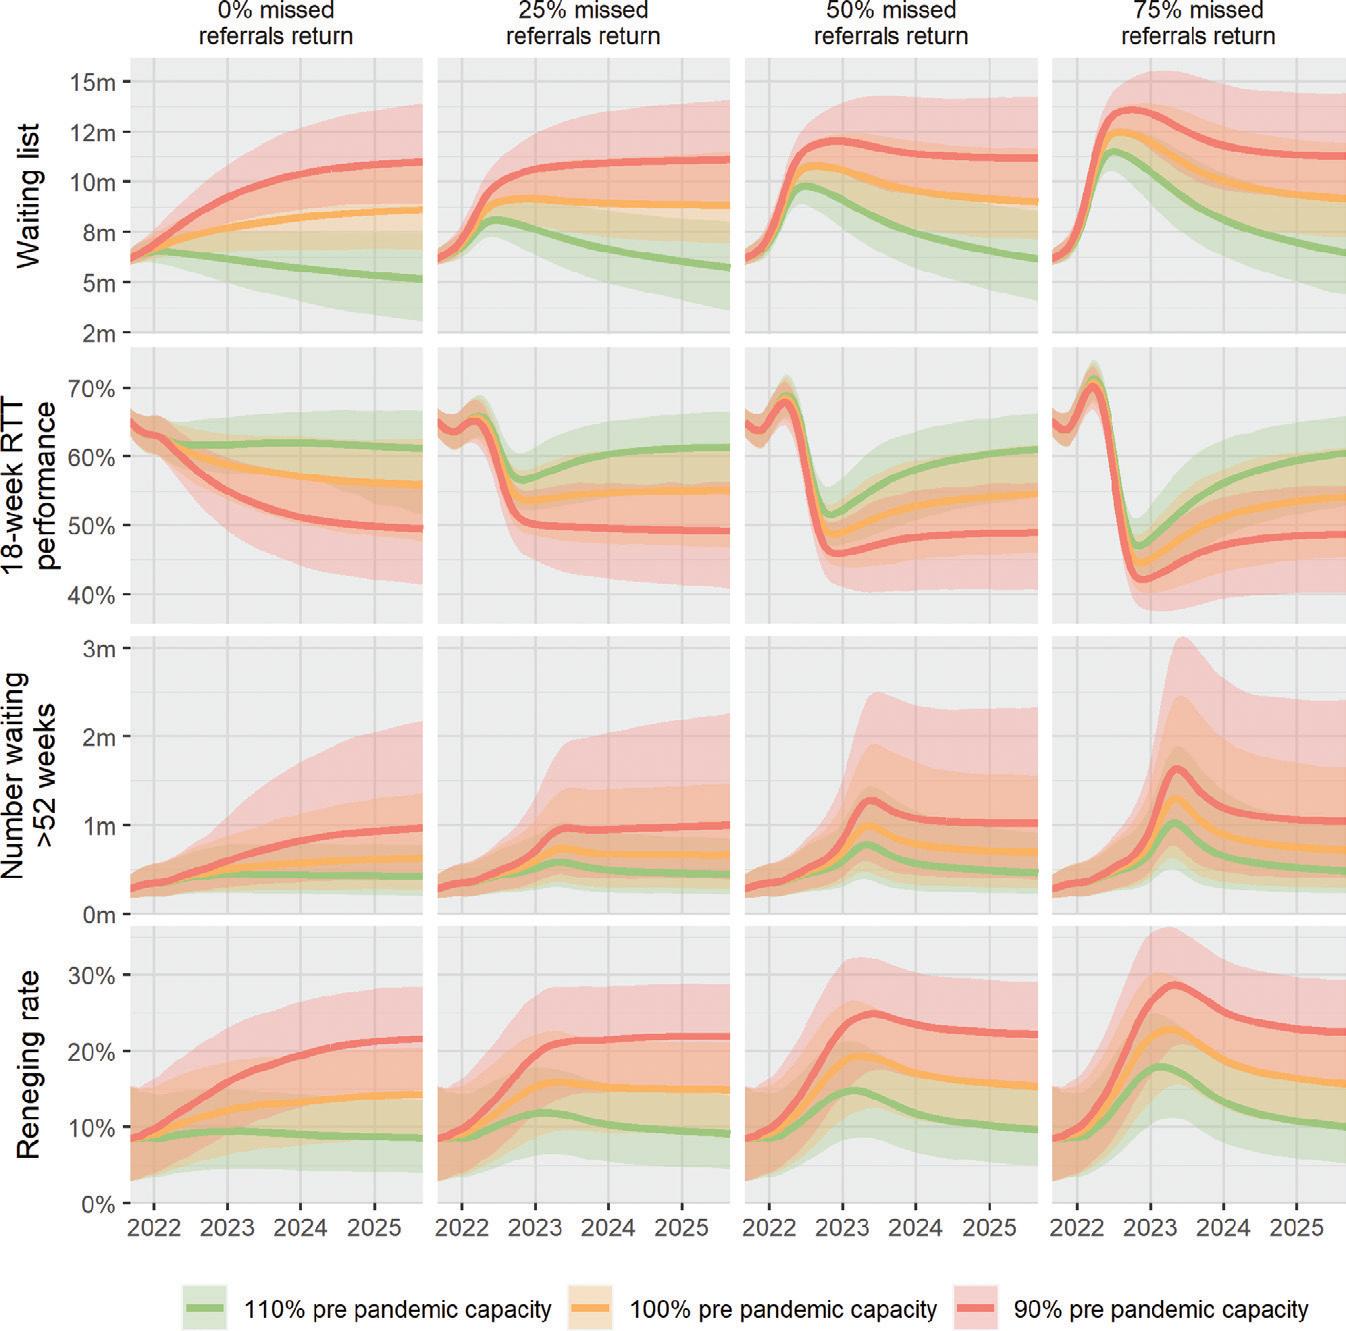
FIGURE 4 ELECTIVE PERFORMANCE PROJECTIONS FOR ENGLAND
This kind of constrained multi-objective optimisation is a perfect conceptual fit with techniques from the O.R. toolkit. Through addressing these important matters in the months and years to come, O.R. will cement its role as a force for good in confronting the many difficult challenges posed by COVID-19.
Richard Wood AFORS is Head of Modelling and Analytics at NHS Bristol, North Somerset and South Gloucestershire Clinical Commissioning Group (BNSSG CCG), which oversees the organisation of healthcare services across a one million resident population in South West England. He has a background in O.R. and has applied various O.R. techniques to a number of settings from mathematical biology to credit risk capital modelling. He has particular interests in working at the interface of academic theory and practical application.
FOR FURTHER READING
Booton, R.D., et al. (2021). Estimating the COVID-19 epidemic trajectory and hospital capacity requirements in South West England: a mathematical modelling framework. BMJ Open 11: e041536. https://doi.org/10.1136/ bmjopen-2020-041536. Howlett, N.C., and R.M. Wood (2021). Modelling the recovery of elective waiting lists following COVID-19: scenario projections for England. medRxiv. https://doi.org/10.1101/2021.12.13.21267732. Kenward, C., A. Pratt, S. Creavin, R. Wood, and J.A. Cooper (2020). Population Health Management to identify and characterise ongoing health need for high-risk individuals shielded from COVID-19: a crosssectional cohort study. BMJ Open 10: e041370. https://doi.org/10.1136/ bmjopen-2020-041370. Wood, R.M. (2022). Modelling the impact of COVID-19 on elective waiting times. Journal of Simulation, 16: 101–109. https://doi.org/10.1080/17477778. 2020.1764876. Wood, R.M., et al. (2021a). The Value of Triage during Periods of Intense COVID-19 Demand: Simulation Modeling Study. Medical Decision Making 41: 393(407). https://doi.org/10.1177/0272989x21994035. Wood, R.M., et al. (2021b). Operational research for the safe and effective design of COVID-19 mass vaccination centres. Vaccine 39: 3537–3540. https://doi.org/10.1016/j.vaccine.2021.05.024.
© Copperleaf

NATIONAL GRID CIRCUIT OPTIMISATION
STEFAN SADNICKI NATIONAL GRID PLC is one of the world’s largest investor-owned energy utilities. It operates in the UK and US, supplying gas and electricity to millions of customers and communities. It operates at the heart of the energy system, connecting millions of people safely, reliably and efficiently to the energy they use every day. National Grid Electricity Transmission (NGET) owns the high-voltage electricity transmission network in England and Wales. It is responsible for ensuring electricity is transported from where it is produced to distribution networks and businesses. It facilitates the connection of assets to, and management of assets on, the transmission system.
WHAT IS THE PROBLEM? An optimal schedule for the interventions on each NGET asset can be computed independently by considering the cost of performing each possible intervention in each year and the monetised risk reduction achieved from the intervention, as illustrated in Figure 1.
However, in scheduling this work, there are several “portfolio” considerations.
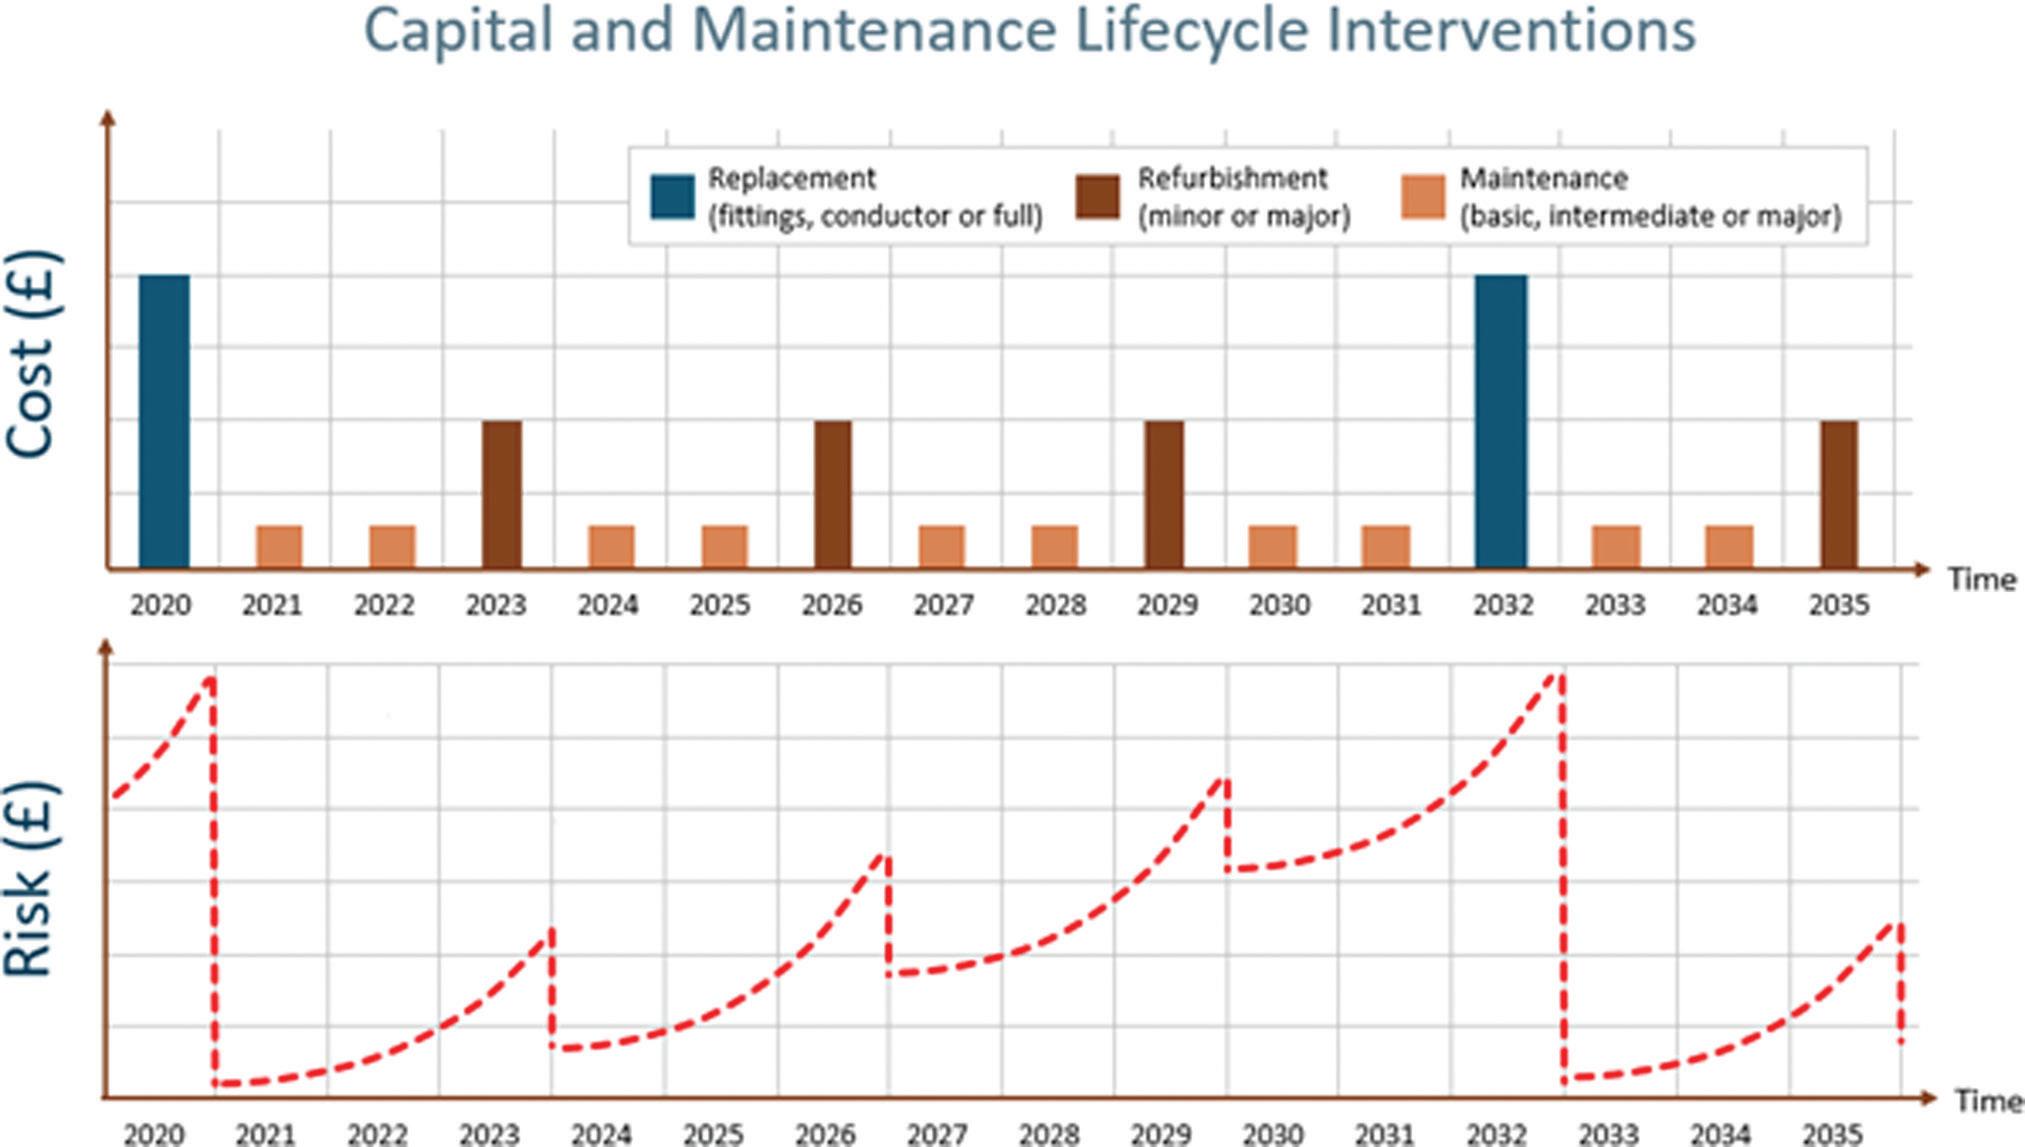
FIGURE 1 FULL LIFE CYCLE STRATEGY FOR ASSETS
Bundling Gains: In order to perform each intervention, an outage must be taken on the circuit containing the asset and there is a cost associated with these outages. However, because multiple assets belong to the same circuit, an overall reduction in costs and outage time can be achieved by scheduling interventions on different assets in the same circuit at the same time.
Outage Constraints: In order to maintain reliability of the network, the circuit outages must be carefully coordinated. For example, there may be a set of four circuits where only one of the four circuits can be taken out in one year.
Resource Constraints: In addition, there are resources required to perform each intervention and the interventions must be scheduled in a way such that these resource constraints are met.
The optimal solution is that which provides the greatest value, where the value is defined as the risk mitigated minus the cost.
CHALLENGES The technical challenge is to find the optimal intervention schedule for each asset in the network while considering the benefits of the bundling gains and while honouring the outage and resource constraints. Prior to the project, the work schedule was manually created. This relied on a planner recognising a potential work bundling opportunity, then building all the resource and outage requirements together into a deliverable package. A further challenge was therefore to capture all the relevant business rules – a ‘modelled’ plan which is theoretically optimal but not truly reflective of the system under consideration would not be fit for purpose.

There was no current industry practice for solving this problem as existing solutions can only handle a smaller number of assets and cannot support the non-linear outage duration calculations. The technical uncertainty was therefore whether or not an algorithm could be found that could compute the optimal intervention schedule.
Using the multi-step technique, NGET and Copperleaf were able to run network wide optimisations involving more than 60,000 assets, considering over 5,000 interventions per year, with 50 teams each using up to five different resource type and 100 overlapping boundaries for circuit constraint management
SOLUTION OVERVIEW In early 2019, NGET started working with Copperleaf, a global decision analytics software provider. Copperleaf provides decision analytics to companies facing the challenges of managing critical infrastructure. Its enterprise software solutions leverage operational, financial and asset data to empower its clients to make investment decisions that deliver the highest business value. Copperleaf and NGET worked together to combine the power of the Copperleaf optimisation platform, Copperleaf’s consulting and software development expertise, with the engineering knowledge and prototypes that have been nurtured within National Grid over many years. “This is the most complex optimisation problem Copperleaf has ever solved” (Stan Coleman, CTO Copperleaf).
The following approach was developed to divide the optimisation into a sequence of steps. Specifically:
Step 1: Asset Level Value Model. This value model considers: • monetised risk which is calculated from asset history, asset age, network risk, and failure mode effect analysis data. • up to eight different interventions per asset: basic/intermediate or major maintenance, minor or major refurbishments and replacement of the entire asset or individual components. • lifecycle costs and value (in terms of risk mitigation) of various intervention schedules e.g. basic, refurbishment, replacement on a five-year cycle.
Step 2: Circuit Optimisation. Each circuit was optimised multiple times with different constraints. Because each circuit is relatively small it is possible to express this as a MixedInteger Linear Programme (MILP) and identify optimal solutions for each circuit quickly. The output of the stage one optimisation was multiple bundled solutions for each circuit.
Step 3: Outage Duration Calculation. The outage duration for each of the solutions was computed.
Step 4: Network Wide Optimisation. In this optimisation, each of the bundled solutions computed in step 2 and the network-wide outage and resource constraints are considered. Because the bundling gains were already computed in Step 2, and because the non-linear duration calculation was implemented as part of Step 3, the problem can be expressed as a MILP that is possible to solve even for a large network in a reasonable amount of time. Using the multi-step technique, NGET and Copperleaf were able to run network wide optimisations involving more than 60,000 assets, considering over 5,000 interventions per year, with 50 teams each using up to five different resource type and 100 overlapping boundaries for circuit constraint management.
Using the multi-step approach described, we were able to find what industry experts deemed to be a valid solution to a problem, where previously it was not possible to find a solution. A patent application for the multi-step technique is in progress.
EMBEDDING THE SOLUTION The challenge with complex analytical solutions such as this is to truly embed new capability into business processes. Far too often a valuable solution is ‘owned’ by a small number of individuals in a silo who are the

© National Grid
only ones able to understand the data input process, the algorithms and then interpret the results. What makes this project stand out is how NGET has embedded the capability to be a central part of their business as usual asset investment planning process.
Having developed prototypes using Python, NGET made a conscious decision to implement the solution using a commercial off the shelf (COTS) solution. Data input has been automated by integrating asset, maintenance and investment data from existing enterprise systems. There are eight programmatic integrations which run either nightly (e.g. to import updated asset data), monthly (e.g. to bring in existing investments, such as a commitment to connect a customer, that are fixed in the schedule) or when required (e.g. to update FMEA risk model inputs).
The increased agility and speed to carry out what-if analyses has been particularly important as NGET has had to deconstruct the plan and rebuild under different scenarios through the course of the COVID-19 pandemic
BENEFITS Having gone live in September 2019, the new capability is delivering significant benefits. These include:
• Centralised Platform: one simple platform for monetised risk, asset intervention planning and circuit optimisation.
Instead of having to look in five different tools or spreadsheets, NGET now has everything available in a single screen in the Copperleaf Solution. • Planning Efficiency of 50%: Reducing the time to build the plan for fiscal year 2022 by 50% (from 12 weeks to 6 weeks). The increased agility and speed to carry out what-if analyses has been particularly important as
NGET has had to deconstruct the plan and rebuild under different scenarios through the course of the
COVID-19 pandemic. • Reduction in Outage Costs of £6m per year: The Copperleaf Solution has reduced outage requirements across the network – for example, the number of circuits requiring an outage three times in a five-year period has reduced from 18% to just 8%.
Specifically, compared to manual bundling, the Copperleaf optimisation for the FY22 plan has increased the “Bundling Ratio” (number of interventions per outage) by 66%.
This aims to save up to 1,000 network outages and £6m in corresponding outage setup costs. • Higher Value Plans: enhanced asset lifecycle modelling leading to improved risk management and ensuring NGET selects the right interventions at the right time and the right cost for consumers. • Strategic Workforce Planning:
The output from the Copperleaf optimiser has also provided greater visibility into long-term resource requirements and pinch-points across the electricity transmission network where there is a requirement to recruit and build resource capacity.
David Wright, Director of Electricity Transmission, National Grid: “The Circuit Optimiser platform is underpinned by a cutting-edge and complex algorithm that was co-developed with Copperleaf. This is helping National Grid Electricity Transmission further improve our ability to anticipate and manage asset risks, ensuring we continue to make the right investment decisions across our network.”

Stefan Sadnicki is Copperleaf’s Managing Director for Europe, Middle East and Africa (EMEA). Reporting directly to the CEO, Stefan joined Copperleaf as employee #1 in Europe in 2014 and has since led the development of Copperleaf’s business and team of 50 distributed across EMEA. Prior to Copperleaf, Stefan was a Management Consultant with Capgemini Consulting where he worked in the cross-sector Operational Research consulting team, which itself had its origins in the OR groups at British Gas and British Coal. Stefan graduated from Queen’s College, Oxford University with a first-class degree in Mathematics and an MSc. with distinction in Computer Science. He also has a Post Graduate Certificate in Operational Research from Strathclyde University and an Asset Management Diploma with distinction from the Institute of Asset Management (IAM).


