43 minute read
Supporting your efforts on understanding the potential impact of climate change


Nicola Morrill
“Complex dynamic systems often generate counterintuitive behaviour” John Sterman
COP26 has happened since my last column, and I thought climate change would be an interesting topic to explore. I will briefly outline several ways that O.R. and Analytics can help with understanding the potential impact of climate change. It’s not possible to cover all the possible ways O.R. could help – there are far too many! Instead, I’ve tried to highlight where perhaps lesser-known areas of O.R. can help. In my next article I will explore where more traditional areas of O.R. and Analytics are able to help.
EXPRESSING CLIMATE CHANGE AS A PROBLEM Firstly, I think it’s helpful to consider the nature of climate change as a problem. In previous columns, I have talked about planning in Volatile, Uncertain, Complex and Ambiguous (VUCA) environments and where improving understanding is key. climate change most certainly creates a VUCA situation.
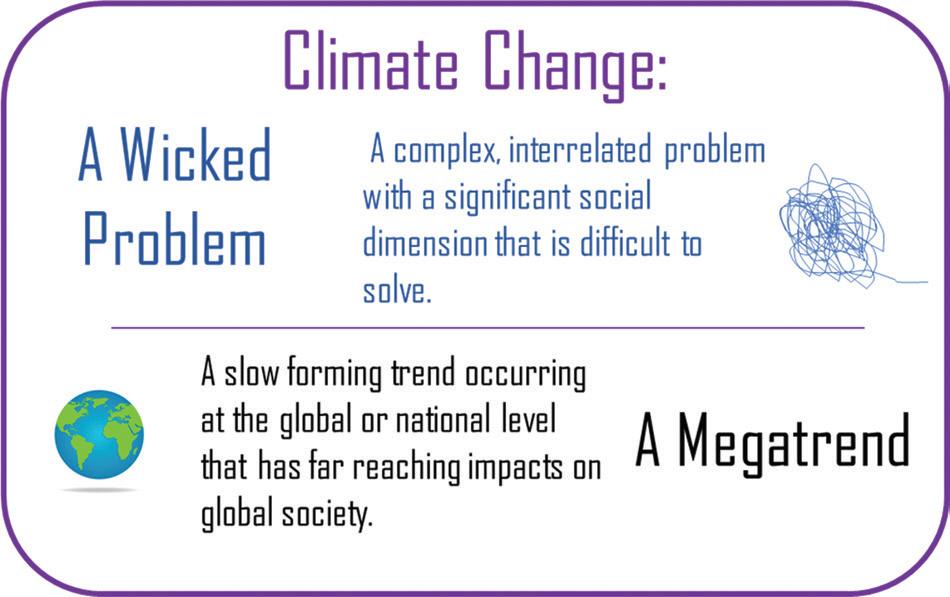
Aligned with this, climate change is what is referred to as a ‘wicked problem’: generally, a social or cultural problem that’s difficult or impossible to solve—normally because of its complex and interconnected nature. It’s really difficult to get a good understanding of the problem. Typically, wicked problems cannot be solved in the generally accepted sense and the focus should be on how to mitigate their immediate impact. Gaining a deep understanding of the problem, the people involved and how this problem may impact on others is key. Addressing a wicked problem requires an interdisciplinary, iterative approach.
From the Futures and Foresight worlds, climate change is an example of a Megatrend. These are large, transformative global forces that define the future by having far reaching impacts on global society. Megatrends are typically slow to form; persist for a long time (circa. 10-15 years); occur at a global or large scale; and are visible and well known to everyone. They are the underlying forces that drive trends. Again, the guidance is about understanding megatrends and how they might impact on your world.
So how on earth can O.R. help?
IT’S ALL A BIT COMPLEX Climate change is made for a systems approach! It is such a complex space that a holistic approach needs to be taken. It is necessary to think about the link between different elements and what behaviour this might drive over time. There is a significant amount of material written about climate change and the link to systems thinking. An example is an article in Nature by Berry et al. in 2018, which presented the case for systems thinking for climate change. See https://www.nature.com/articles/s41558-018-0102-4.
The Systems Thinking for Efficient Energy Planning (STEEP) Project (see https://www.cse.org.uk/projects/ view/1244) is an example of Systems Thinking being used to support low-carbon urban energy master planning in three cities. The work undertaken highlights the complexity of the problem space and the impact different stakeholder
views can have on a successful outcome. A paper by Freeman and Yearmouth in 2017 (see https://doi.org/10.1016/j. erss.2016.11.009) includes the work which looked at Bristol: subsequently published as an undated ‘miniStern Review,’ by Gouldson and Millward-Hopkins, The Economics of Low Carbon Cities. This reviewed the cost and carbon effectiveness of a wide range of the low carbon options that could be applied in Bristol in households, industry, commerce and transport. (See https://bit.ly/ BristolLowCarbon). There are lots of ‘mini-Stern Reviews’ covering different cities within the UK.
SIMULATION & GAMING Another example of systems approaches being used is The Climate Action Simulation which has a system dynamics model at its heart. This is a simulation-based role-playing game that enables participants to learn for themselves about the response of the climate-energy system to potential policies and actions. It helps improve understanding about the dynamics and interactions of different policy choices. The Climate Action Simulation is framed by the En-ROADS, or Energy Rapid Overview and Decision Support, computer model. Figure 1 is a screenshot of EnROADS, showing the main control panels and graphs of the energy mix and expected global temperature outcomes to 2100. More details are available here: https://www. climateinteractive.org/climate-action-simulation/
My2050 and the MacKay Carbon Calculator, both developed by the UK Government’s Department for Business, Energy & Industrial Strategy (BEIS), are examples of models designed to aid understanding of options for meeting emission targets. The interactive analytical models, built around spreadsheets, explore the possible scenarios for cutting greenhouse gas emissions by encouraging users to identify and explore different possibilities. The models are used to support understanding with the general public and within schools. For further details please see an article by Bevan Freake in the Autumn 2021 issue of this Magazine.
The O.R. models are being used to aid understanding about a complex problem across a range of stakeholder communities. In these examples the models are being used in a participatory way with the general public.
HOW MIGHT CLIMATE CHANGE UNFOLD Climate change could unfold in many different ways and, from a planning point of view, it’s good to be cognisant of this. One commonly used approach in Futures and Foresight to help with this is Scenario Planning. Scenarios are vehicles to explore how the future could unfold and they are not about prediction. The examples below highlight the range of ways that scenarios can assist from the strategic to the local level.
The Intergovernmental Panel on Climate Change’s (IPCC) Sixth Assessment Report has a number of scenarios:
1. Taking the green road. 2. Taking the green road but a little bit slower. 3. The middle ground. 4. Countries retreat from international cooperation over climate change. 5. Humanity doesn’t care about climate change and actions are actually making things worse.
It is possible to use these scenarios or others to support your business planning. It is certainly worth contemplating if your current planning is based around one or many of these future possibilities.
Rolls-Royce are an example of one organisation that uses scenarios to improve understanding of the potential impact of climate change on its business. Scenarios are commonly used to assess the resilience of business models and strategy. In this case, Rolls Royce noted that climate change accelerated some of its core risks, identified climate change needed to be treated as a key risk in its own right and the work also identified some business opportunities related to the transition to a low carbon economy. For an insight into the nature of the scenarios used see https://bit. ly/RollsRoyceSustainability.
In 2018, Flynn et al. (see https://doi.org/10.1016/j. envsci.2017.10.012) highlighted that Participatory
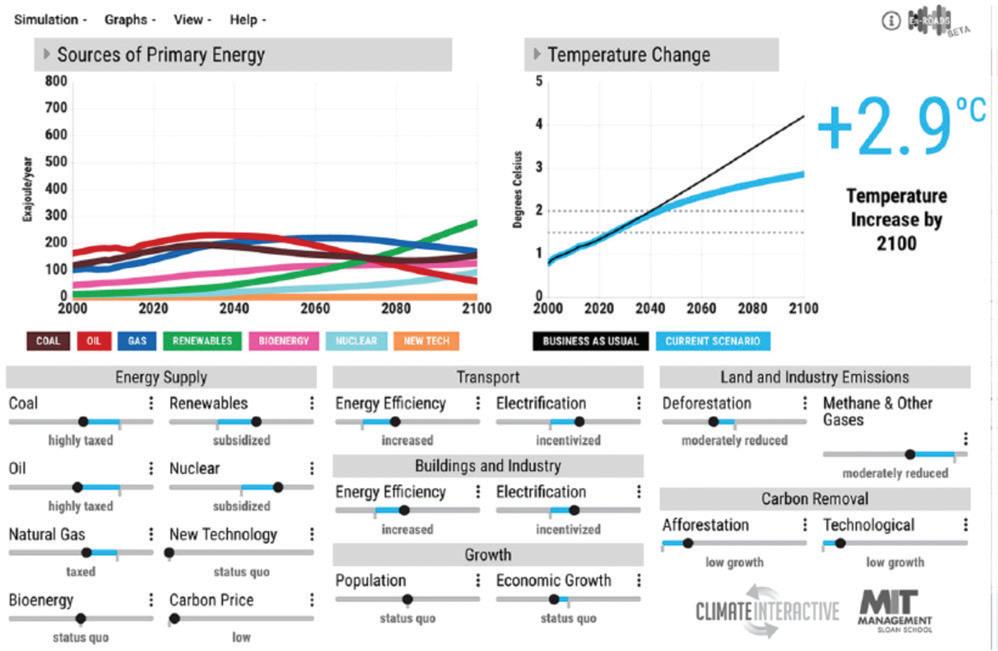
FIGURE 1 SCREENSHOT OF EN-ROADS (Source: https://journals.sagepub. com/doi/full/10.1177/1046878119890643 with permission)
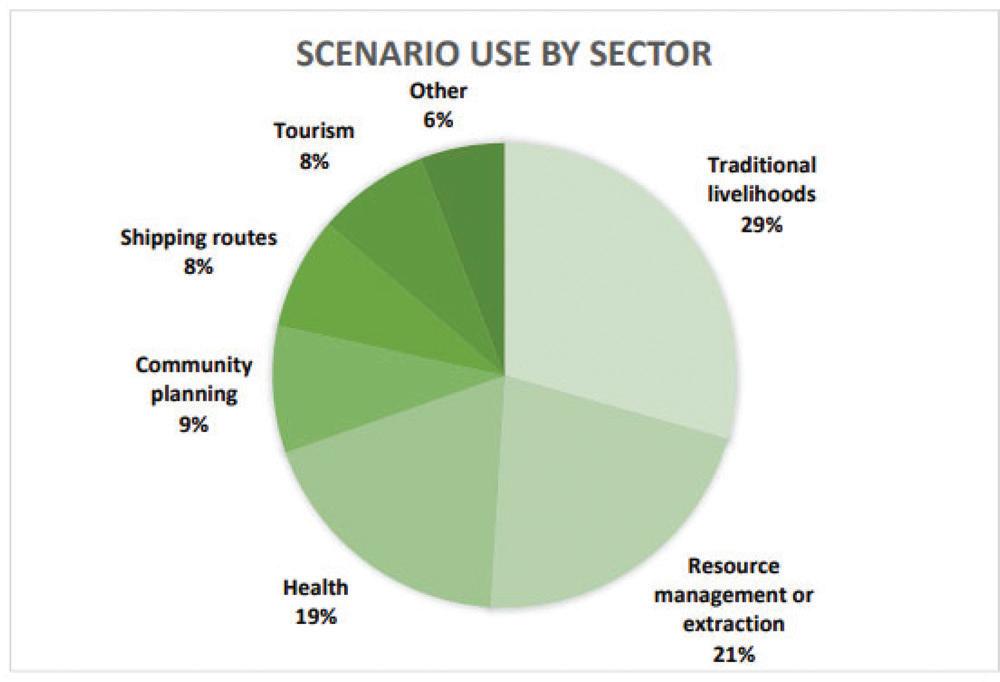
FIGURE 2 SECTORS ENGAGED IN PSP IN THE ARCTIC (Reprinted from Environmental Science & Policy, 79, pp 45-53, Flynn et al., Participatory scenario planning and climate change impacts, adaptation and vulnerability research in the Arctic, Copyright (2018), with permission from Elsevier)
Scenario Planning (PSP) approaches are increasingly being used in research on climate change Impacts, Adaptation, and Vulnerability (IAV). This is where the scenarios are created by working directly with the potentially impacted community; sometimes referred to as bottom-up scenario work. The work referred to in their paper undertook a systematic review of participatory scenario work about climate change in the Arctic area. This identified a range of Sectors engaged in bottom-up scenario work related to climate change, which is detailed in the Figure 2.
The three distinct types of scenarios mentioned in this section highlight the breadth of areas where scenario planning can have an impact, and it is, in helping people think through the possible impacts of climate change – whether this is at a national, company, community or individual level.
POWER OF PEOPLE There is a growing area of O.R. called Behavioural O.R. that could assist. Given that a lot of the change required to achieve the desired outcomes related to climate change are about people. Behavioural O.R. is about the use of O.R. methods to model human behaviour in complex settings and the role and impact of behavioural aspects related to the use of O.R. to support problem solving and decision making. An area to look out for.
I have only scratched the surface in this article with some of the areas where O.R. is able to help understand the potential impacts of climate change. I hope you agree O.R. has much to contribute!
SHAPING MY NEXT PIECE I plan to use my next article to highlight the way that other areas of O.R. and Analytics support planning around the impact of climate change across different types of organisations.
Beyond this, if there is something, related to O.R., that you would like me to consider for future columns in Impact then please get in touch. The goal is to share the discipline with users/potential users of O.R. by highlighting how it could support ‘business’ challenges they may be facing.
WANT TO LEARN MORE? The OR Society runs training courses on much of the above if you want to bolster your in-house team. Also, The OR Society Conference is in September each year and is a good opportunity to hear about the application of a broad range of O.R. being applied across a diverse set of challenges. Maybe this year there will be some papers on climate change.
Nicola Morrill is a Systems Thinking Consultant at Dstl, a certified coach and the current Diversity Champion of the O.R. Society. She writes in a private capacity – all views expressed are her own and all examples are available in the open domain. You can contact her on Nicola.Morrill@googlemail.com

©Pieter van den Berg
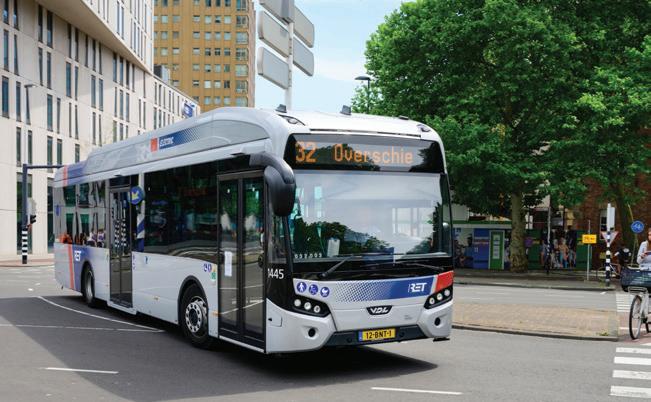
ELECTRIFYING BUSES IN ROTTERDAM
PIETER VAN DEN BERG IN THE FIGHT AGAINST CLIMATE CHANGE, almost all countries in the world are taking measures to limit CO2 emissions. A significant sector in this energy transition is the transportation sector, where it is particularly important to replace fossil fuel-powered vehicles with sustainable vehicles. Within public transportation, this mainly concerns bus transport, which is still often carried out with diesel buses. In 2016, the Dutch government and the public transport operators expressed the ambition to replace all diesel buses with sustainably powered buses by 2030 at the latest.
For the public transport operator in Rotterdam, RET, this has led to an enormous operational challenge. It soon became clear that the existing planning would not be feasible due to the limited range and long charging times of the newly purchased electric buses. As a result, a bus can no longer be used continuously throughout the day but will have to be connected to a charger during the day.
In addition, the operational uncertainty has a major impact on the battery level of the buses. For example, unforeseen delays can cause a bus to miss a charging moment and
© Rick Keus
unfavourable weather conditions can lead to higher energy consumption. Events like this can lead to a situation where a bus has insufficient energy to carry out all scheduled trips. Finally, if the energy used to power the chargers comes from renewable sources such as solar or wind, this will add another layer of uncertainty.
In order to achieve a smooth transition, there has been collaboration between the Rotterdam School of Management, Erasmus University (RSM) and the RET. The project consisted of three phases. First, there was phase 0 in which preparations were made for the introduction of electric buses. Subsequently, the first part of the network was electrified in December of 2019. Finally, the electrification of the second part of the network in the coming years was prepared. At every stage, RSM has contributed to making the transition operationally feasible.
PHASE 0: PREPARATION In the early stages of the project, RET’s main goal was to quantify the impact of the electrification given the current schedule. This schedule was evaluated by fluctuating a wide range of parameters, including the capacity of the battery, the energy consumption and the capacity of the chargers. To support this analysis, RSM developed a simulation model that evaluates for each set of parameters how many buses would have low battery levels at the end of the day. This analysis clearly showed that even in the most optimistic scenario with a large battery, low energy consumption and high charging capacity, multiple buses would have insufficient energy to complete all trips in the current schedule. This analysis confirmed that the RET should adapt the planning and take into account the specific characteristics of electric buses in the planning.
Wibout van Ede, head of business operations at RET, said “In the early phases, the simulation tool developed by RSM gave us the opportunity to easily evaluate the impact of different specifications regarding the battery size, the charging power and the energy consumption. The simulation convincingly showed that significant changes had to be made to our schedule to allow for a feasible electric bus operation and that electric-specific features of the electric buses should be taken into account while designing the trip and bus allocation schedule”.
PHASE 1: NORTHERN NETWORK From that moment on, the focus was on the first set of buses that would be electrified. This concerned 50 buses that were put into service at the end of 2019. The buses run on seven different lines on the north side of the city of Rotterdam, where they can charge at seven different terminal stations during the day at fast chargers. During the night, the buses are connected to chargers in the garage with a lower power in order to start the next day with a full battery. In this phase, RET mainly focused on the assignment of trips to the different buses. The schedule should provide sufficient time between rides to make use of the fast chargers.
RSM focused on the development of optimised charging strategies that would strike a balance between a planning that is robust against uncertainty and that avoids unnecessary use of fast chargers. The limited use of the fast chargers is important because it has a major impact on the battery life and on the city’s electricity network. This trade-off was modelled by minimising the number of charging moments during the day under the condition that every bus would have a state-of-charge above a certain threshold at all times. It turned out that the number of charging moments could be more than halved compared to a naive charging strategy in which buses would use all available charging moments.
The question soon arose as to what the impact of delays would be on the state-of-charge of the buses. If a bus misses a charging moment due to a delay, this can cause the bus to get into trouble later in the day. To evaluate this impact, we extended the simulation model developed in phase 0 to also be able to analyse the situation with uncertainty. This analysis showed that even with a relatively high state-of-charge threshold in the planning phase, several buses per day could still encounter problems if no real-time adjustments were made. As a result of the uncertainty, it is not clear in advance for which buses measures are required. It is therefore necessary to make real-time adjustments to the charging schedule based on the
realisations of the uncertainty. For this, we have developed a real-time charging strategy that, based on the optimal offline charging schedule and real-time information, indicates which bus should charge at what time. This strategy appears to provide a robust solution while the number of charging moments can be kept low.
PHASE 2: SOUTHERN NETWORK The first 50 electric buses were put into service in December of 2019. From that moment on, the focus of the research has shifted to the second set of buses that will be put into service in the coming years. This set of buses will mainly be used on the south side of Rotterdam. Unlike the first set of buses, this set will operate on routes that share a common terminal station. This allows for a situation where all buses charge at the same station. This clustering of the charging activities makes it important to consider the interaction between the lines and to investigate the required number of chargers at this station. This network structure also offers the opportunity of locally generating renewable energy and using it directly to charge the buses. To this end, the possibility of constructing a solar park at the bus station was evaluated. The uncertainty in the amount of energy generated by this solar park adds an extra layer of complexity to the problem. The question was what the impact of this solar park would be on the total energy consumed from the grid and whether the use of renewable energy could be increased by storing part of the generated energy in a battery.
The results of this analysis show that during summer months, even without the possibility of storage, up to 70% of the energy consumed to charge the buses can come directly from the solar panels. For the winter months this is only 30% due to lower energy generation. In both cases, only a small part of the generated energy cannot be used directly for charging. We also see this when we look at the added value of a battery at the bus station in which part of the unused energy can be stored. This can lead to an increase in the renewable energy used for charging of about 7%. This is mainly caused by the charging of the battery in the morning before any bus needs charging and discharging the battery at the end of the day after sunset.
Interestingly enough, we see that the added value of the battery is highest in spring and autumn and not in summer. Due to the high amount of energy generated in summer, there are only few opportunities for the energy in the battery to be used to charge the buses. In spring and in autumn this is more common due to the limited generation of energy and therefore the battery has a greater added value.
LESSONS LEARNED In this project, RSM and the RET worked closely together to make the implementation of the electric buses as smooth as possible. Throughout the project, multiple important insights have been obtained. For example, it soon became clear that the impact of electrifying RET’s bus network should not be underestimated and that this requires major changes to their operations. In phase 1, we saw that the impact of delays means that even conservative charging strategies cannot prevent buses from getting into trouble. It is therefore crucial to apply real-time adjustment to ensure that buses with low battery levels are allocated extra charging moments. Finally, we have seen that a network with a hub for charging the buses is very suitable for using locally generated renewable energy and that in such a situation energy storage has only limited added value.
Writing in May 2020, van Ede, said “the charging schedule optimization model has shown that we could do with fewer charging facilities and that significant improvements can be made to the charging schedule. Using this optimization model, we are able to control various parameters and compare different charging strategies. We are now in the process of implementing the model in our software so that it can be used for our day-to-day planning”.
Pieter L. van den Berg is an associate professor of transportation and logistics at the Rotterdam School of Management, Erasmus University. He obtained his MSc in econometrics and operations research from VU University Amsterdam and his PhD in applied mathematics from the Delft University of Technology. His research focuses on the application of operations research to the logistics of emergency service providers and public transportation.
An earlier version of this article appeared in StatOR.

© deepblue4you/iStockPhoto.com
USING MATHEMATICAL OPTIMISATION TO ACHIEVE NET POSITIVE COMPANIES
GOOS KANT AND GUIDO DE WIT
MATHEMATICS AND AI ARE POWERFUL TOOLS to create more efficient and effective organisations. Investments in optimisation and AI technology have enabled businesses to improve their financial performance. However, in today’s business context, environmental, social, and governance (ESG) issues are playing a more important role in companies’ decisions. The focus is shifting from maximising shareholder value to maximising positive impact. How can mathematics and AI help facilitate this shift?
ORTEC is the world’s leading supplier of mathematical optimisation software and advanced analytics. Our
mission is to improve the world with our passion for mathematics. Since 1981, ORTEC is a global and leading partner in data-driven decision support. By leveraging data with our passion for mathematics, we enable many of the best run organisations to optimise their business decisions. Our smart solutions, ranging from business analysis and data analytics to mathematical modelling and optimisation technology, lead to more efficient, adaptive, effective, and sustainable organisations. With 1100 employees across 13 countries, ORTEC globally supports more than 1200 customers to take the best decisions in an ever-changing environment. We are leveraging data and mathematics for a better world. (Discover more at https:// ortec.com/). In this article, we will share examples of how organisations are applying optimisation in an integrated way to maximise their positive impact and contribute to a better world.
STEP 1: IDENTIFY IMPACT OPPORTUNITIES As with any math problem, the first step is to determine the right objective function. When we speak about impact, this objective function should be defined as an organisation’s desired contribution to the United Nations Sustainable Development Goals (SDGs). This collection of 17 interlinked, global goals provide a ‘blueprint for peace and prosperity for people and the planet, now and into the future’ (United Nations).
Initially, the SDGs were meant for commitment and participation at the country level. Since then, they have been widely adopted by other organisations as a framework to communicate the impact of their company strategy, both negative (e.g. greenhouse gas emissions, waste generation) and positive (e.g. decent jobs, technological innovation).
To formulate organisational goals as SDG commitments and derive the right objective function for each project, we developed a ‘Project impact methodology’ based on the theory of change. The methodology provides a structured approach to link activities to impact (as shown in Table 1, using a maritime voyage estimation project as an example, and Figure 1).
By understanding how a project is linked to one or more SDGs, we can determine how the underlying mathematical model should be adjusted to maximise the positive contribution to those company goals. In the following section, we explain how this can be achieved by either changing the objective function or by making the best decisions to accelerate transformation.
STEP 2: ADJUSTING THE PROJECT GOALS TO MAXIMISE POSITIVE IMPACT IN THE CURRENT SYSTEM After identifying impact opportunities, the project goals should be modified to achieve these opportunities. For example, when you implement new routing solutions, you reduce your mileage. This, in turn, results in cost savings and CO2 savings. ORTEC sees an average of 5% CO2 savings when implementing new routing solutions. But often, this is only seen as a positive side effect of cost savings. With more companies setting emission reduction targets, there is a growing need for efficient ways to minimise emissions in current processes. By putting CO2 in the objective function of the model, both economic and environmental benefits can be in balance or even accelerate each other.
Let’s consider a supply chain network optimisation case in the energy sector. A large energy company with ambitious emission reduction
TABLE 1 PROBLEMS AND OPPORTUNITIES
STEP QUESTION EXAMPLE: MARITIME VOYAGE ESTIMATION PROJECT
1. Problems & Opportunities What needs improvement? Ships often travel too fast and arrive too early. High speed leads to unnecessarily high fuel consumption.
2. Activities What is done?
Predict the ship arrival time based on historical data, currently selected route, and weather conditions. 3. Output What is delivered? A forecasting engine. 4. Outcome What is achieved? Determine the most fuel-efficient engine settings to arrive on time. 5. Impact Why we do the project? Lower costs and emissions through reduced fuel consumption.
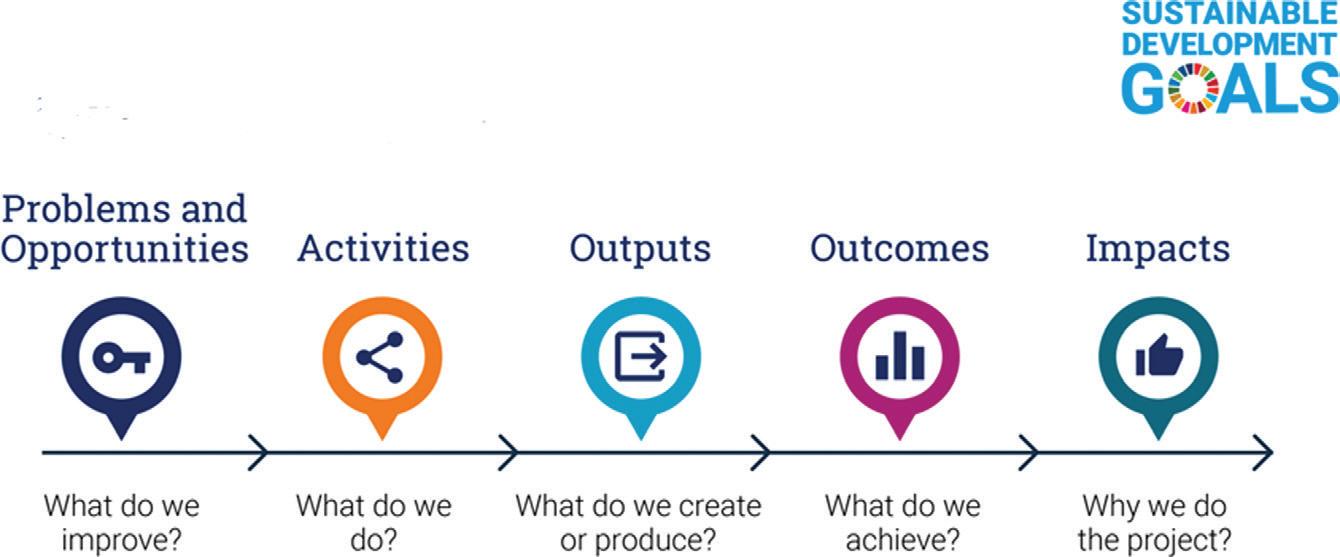
FIGURE 1 QUALITATIVE IMPACT VALUE CHAIN
targets was looking for the smartest way to achieve them.
Their challenge was optimising downstream distribution. Specifically, they had to find the best way to transport products (gasoline, LNG or biofuels) from the production location to a refinery and to end users. To maximise positive impact, we added CO2 emission targets, pricing and local emission legislations to the supply chain network’s design. The model needed to incorporate requirements such as:
1. Making sure all local emission requirements are fulfilled. 2. Taking future CO2 pricing into account when determining the total network cost. 3. Making sure the total network CO2 emissions are in line with the emission reduction goals of the company.
The resulting model can be used to evaluate trade-offs between costs and emissions. It gives the organisation actionable insights to achieve their sustainable ambitions. Since there is a lot of detailed data available on carbon emissions, these kinds of examples are fairly common. With data quality and availability improving across sectors, we expect that more SDG KPIs will be modelled in a similar way in the future.
STEP 3: ACCELERATE TRANSFORMATION To meet the UN SDGs, many systems need to undergo a transformation. Optimising the current way of working with different KPIs, as discussed in the previous section, simply won’t be enough. Systemic transformations are taking place all around us: the global energy transition, the transition from a linear to a circular economy, and the transition to mainly plant-based nutrition. These transformations are complex, costly and risky. Data and maths can help organisations make the right decisions.
The transition to zero emission transport is another example. SDG KPIs are seldom considered in the objective functions of models that deal with questions surrounding this kind of transition. Typically, a decision must be made at a strategic level: should we invest in new technology or a process change? The question at hand is how to achieve this in the most effective way.
Let’s consider a specific case. An online grocery retailer wants to achieve zero-emission home-delivery distribution in 30 to 40 inner cities by 2025. This retailer currently has a national fleet of about 1500 vans. To meet their goal, at least 20% of their fleet must be composed of electric vehicles (EVs) by 2025. Yet, today, they own a few.
That said, the company is growing extremely fast due to COVID-19 restrictions and market trends. They are forecasting a fleet size of 2500 vans by 2025. In their projected growth, every other new van must be an EV to achieve their goal. To analyse the right fleet mix, they are now testing various brands and characteristics, like the maximum driving range. What makes this a complex decision for the retailer is that there are no EVs currently on the market which can run for a full day of operation. And there won’t be by 2025.
So, if this retailer wants to meet its ambition, driven by local inner-city legislation, their operational model must change, along with the vans that are being bought. They are applying simulations using routing optimisers to compute the optimal fleet mix, considering that deliveries to 30–40 inner cities must be by an EV, while other areas can be delivered by an EV.
The routing plan is followed by a calculation that determines which van must be charged at which moment and at which charging station dock. For the morning shift, there is enough loading time; charging can take place overnight. The afternoon shift is more challenging. If there is no feasible charging schedule, they must consider alternatives. For example:
• Using more EVs, which can be loaded overnight or increasing the charging capacity.
• Accepting fewer orders in the corresponding 30–40 inner cities for the afternoon shifts.
There are many practical bottlenecks in this mathematical puzzle: EV availability, the available electricity power provided by the national grid, and whether the company can generate its own power. These complex variables can only be considered with an integrated model.
ORTEC’S IMPACT AI and maths are powerful tools to improve the world. ORTEC is applying advanced and unconventional techniques to support customers in reaching their SDG goals. In this article, we covered two cases with a focus on reducing our customers’ CO2 footprint. We measure and publish our contribution in our annual sustainability report (see https://ortec. com/en/news-more/sustainabilityreport-2020).
Sometimes, our work leads to other, surprising results. For example, we work with several pallet pooling companies in Europe. Through our work, these customers reduced the number of wooden pallets and plastic crates they use. They now save almost 60,000 wooden pallets every year. That’s nearly 1.5 million kilograms of wood, which is the equivalent of over 7000 trees. These customers have also reduced their stockpile of plastic crates by 3.5 million. A single stack of this many unfolded crates would be over 400 kilometres high. If you climbed this tower, you could highfive the astronauts in the International Space Station!

© Photo by Lucas van Oort on Unsplash
Stories like these inspire us to continue contributing to a better world.
Goos Kant, from being a farmer’s son who helped his dad calculate which cows to keep, to logistics optimisation expert and Managing Partner at ORTEC he has been committed to making an impact since a very young age. Goos specialises in logistic planning and prefers combining academia with a more practical, applied approach. He has been a professor of logistics optimisation since 2005. He is a regularly an invited speaker at conferences and lectures for executive education programs. Optimising mathematical models is in his nature, but he is also driven to scout out improvements that cannot be found in models.
Guido de Wit is Practice Lead Sustainability within ORTEC. He is in charge of developing the right propositions to make a positive, sustainable impact with mathematics. Guido has extensive experience as a consultant in the transportation and storage industry and the energy sector.

© Lenny Kuhne/Unsplash; sol/Unsplash; Charanjeet Dhiman/Unsplash
O.R. INCREASES EFFICIENCY AND PRODUCTIVITY WHILST REDUCING CO2 EMISSIONS
GIULIA BURCHI AND ALEXA SALLES
APPLIED MATHEMATICS CAN BE USED to solve almost any kind of problem in our daily life. When mathematical optimisation is applied to solve industrial problems the results that can be obtained are very beneficial thanks to the accuracy that can generate a solution. DecisionBrain, a company that develops decision support optimisation solutions, based in Paris, Montpellier, Hong Kong, the United States and Brazil, uses Operational Research techniques every day to help its customers make better decisions and grow their business with advanced analytics solutions. Combining Optimisation and Machine Learning techniques for business variables forecasting, DecisionBrain creates innovative and customisable decision support solutions that drive operational efficiency, increase productivity and generate a significant positive environmental impact by reducing the carbon footprint.
The solutions help companies make the most of their resources, minimising inefficiency and reducing waste. Depending on the application (manufacturing, mobile workforce, logistics, etc…), their customers have experienced significant reductions in CO2 emissions, energy consumption, material waste. Thanks to the type of solutions that DecisionBrain develops, companies are able to combine significant financial return, in the form of high ROI projects, with an impressive reduction in their operations’ CO2 footprint.
DECISIONBRAIN: SMARTER DECISIONS, BETTER RESULTS DecisionBrain is able to easily develop customisable solutions for the specific
needs of each company and delivers significant ROI thanks not only to the techniques they apply but also to the technology they use. Their technology stack consists of:
1. A development platform, called DB
Gene, which provides out-of-thebox approximately 70% of the code needed for an optimisation solution (UI components, user access, data and scenario management, task server). This allows them to easily customise solutions to specific customer needs. DB Gene is also commercialised by IBM within its
Data and AI product offering as the new version of IBM Decision
Optimization Center (DOC) 2. Industry-specific modules made of general-purpose optimisation engines that can easily be deployed across different use cases within the same industry 3. An optimisation solver: IBM
CPLEX
The company’s main areas of expertise are Manufacturing and Supply Chain, Logistics, Workforce, and Maintenance. Focusing on solving problems on sizing, planning, scheduling, and dispatching optimisation across several industries, from Field Services and Pharma Salesforce to Automotive, Transportation, Semiconductors, and Textile manufacturers. The solutions span from real-time to operational, tactical, and strategic planning horizons.
To give a flavour of the type of projects that DecisionBrain develops, there follows three different case studies: Inbound Logistics Optimisation for Toyota, Field Service Scheduling Optimisation for Integral-JLL, and Operational Scheduling and Tactical Planning Optimisation for a Customer Centre.
INBOUND LOGISTICS OPTIMISATION FOR TOYOTA Toyota wanted to streamline the logistics from its suppliers to its assembly plants in Thailand, just-insequence and just-in-time, targeting a 2% transportation costs reduction. With 5 assembly plants and more than 4000 supplier plants, Thailand is the third larger car producer for Toyota after Japan and the US. Due to the very high volume of vehicles produced, the current inbound logistics planning process, mainly performed manually, was very complex and human-intensive.
DecisionBrain used mathematical models to replicate planners’ decisionmaking, reducing planning time from 2.5 days to 1 hour. Optimisation techniques were applied to produce more efficient plans, reducing transportation costs while preserving service levels. The solution focused on optimising order grouping, truck routing, and 3D packing specific to each truck. Results led to over 10% cost reductions, considerably above customer expectations, and also a 10% reduction in CO2 emissions.
The inbound logistics optimisation solution was developed using DecisionBrain’s DB Gene platform and uses IBM CPLEX optimisation libraries. It enabled data scientists and developers to quickly prototype, test, and select the best optimisation strategy. Planners were part of the process at an early stage, reviewing the solution results as they were produced, thus facilitating their final acceptance. The project was completed in eight months, from business requirements to full deployment. This allowed for a high ROI and a payback time of less than one year.
FIELD SERVICE SCHEDULING OPTIMISATION FOR INTEGRAL-JLL Integral UK Ltd is the leading Mechanical, Electrical, and Fabric property maintenance business in the UK, providing both Planned Preventative and Reactive Maintenance

© Xavier Rabasa/Unsplash
to over 1,600 clients in 60,000 locations. In 2016, Integral was acquired by JLL, making it part of the larger JLL real estate management brand. The challenge was how Integral could take its engineer field service distribution to higher productivity levels with optimisation and dynamic scheduling tools.
The FSO (Field Service Optimization) solution was a platform built using DecisionBrain workforce Dynamic Scheduler. This platform was customised to the needs of the entire Integral field service team (20,000 technicians) and took into account several organisational layers: project executives, planning managers, planners, and field service workers. By blending real-time optimised plans into an intuitive and easy-to-use interface, FSO provided several benefits for both planners and managers: minimised technician travel and idle time, ability to quickly focus on most urgent issues, possibility to easily adapt and adjust plans to unexpected events, seamless collaboration across teams. The outcome was a 40% productivity increase measured as jobs-per-man per day
The outcome was a 40% productivity increase measured as jobsper-man per day, increased service level agreement (SLA) adherence, measured as contractual timing constraints met, with significant improvements for SLAs with 4-hour response time. Without DecisionBrain’s optimisation project, 190 technicians would have traveled about 20% more, (135,505 more miles), meaning there was a reduction in carbon emissions of 35 metric tons.
OPERATIONAL SCHEDULING AND STRATEGICAL-TACTICAL PLANNING OPTIMISATION FOR A CUSTOMER CENTRE Vivetic is a French company that focuses on delivering outsourcing, customer relations, and call-centre services. It is based in France and Madagascar, employing about 2,000 employees. The company wanted to leverage advanced
© Emmanuel Ikwuegbu/Unsplash analytics to deploy a decision support tool for planning their leave of absences, hiring, and training and for scheduling their day-by-day activities with a granularity of 15minutes.
They used excel sheets for scheduling, and the process was highly timeconsuming and complex: Vivetic has a large number of customers, and the employees are very specialised. Skills and competencies need to be taken into consideration for the planning. In addition, some Vivetic customers require 24/7 support, thus the employee’s shifts need to be designed to cover this need while respecting French legislation and the employees’ preferences.
DecisionBrain was tasked to develop a customised planning and scheduling tool that could generate optimal plans in minutes. The solution is structured around two modules, one for tactical and strategical planning and the other for operational planning.

1. The strategical and tactical planning module looks up to a year ahead and allows to optimally plan for hiring, upskilling, and leave of absences. It includes the following plans. • Recruitment plan: this allows doing what-if analysis to define an optimal recruitment plan that takes into consideration the initial training plan for the new hires. • Upskilling plan: this proposes an optimal upskilling plan that allows to better cover the workload while reducing the need for new hires. • Leaves of Absences Planning (LoA): this distributes each employee’s Leave of Absences across the planning period to maximise demand coverage and productivity while respecting labour regulations and employees’ preferences.

• High-level Workload Distribution: this designs a high-level workload distribution taking into consideration the employees’ available time and skills.
2. The short-term operational scheduling module looks at the next few days, up to two weeks, and optimally assigns the tasks to the employees taking into consideration their skills and competencies, maximising the operational KPIs achievements, and following the tactical plan guidelines. • Shift Design: this defines each employee’s optimal shift (start and end time, breaks, and days off) while respecting the complex country-specific labour regulations, and taking into account employees’ preferences. • Activities Scheduling: this defines an optimal 15-minutes schedule of the activities each employee should do in the upcoming days, to maximise demand coverage while respecting employees’ skills and preferences.
Operational schedules and tactical plans can be run in a matter of minutes, allowing planners to test different scenarios and perform what-if analysis: planners have access to a set of parameters and can easily create alternative scenarios, compare them and select the most relevant. They can also make manual adjustments to the plan and schedule and run a consistency check (compliance with rules) following the changes made.
Results led to a productivity gain of +20% demand coverage (up to 50% in certain cases) compared to manual plans, saving time for planners by creating an optimal plan in 10 minutes instead of days, and improving customer satisfaction. The company managed to reduce costs by 5% thanks to the improved operational efficiency and the simplification of the HR tasks. The payback time is estimated to be less than a year.
CONCLUSIONS DecisionBrain has a track record of successful deployments in several countries across the globe, building and deploying solutions for global leading organisations such as Toyota, European Central Bank, Carhartt, IBM, Daimler, SNCF, and ISS World.
Our solutions help companies make the most of their resources, minimising inefficiency and reducing waste. Depending on the application, our customers have experienced significant reductions in CO2 emissions, energy consumption, material waste. By covering different planning horizons, from real-time to operational, tactical and strategic, the environmental impact is immediate and sustained for the long term.
Giulia Burchi is Business Analyst at DecisionBrain since 2016. Giulia has experience in Project Management for developing and implementing Workforce Solutions. She is the Product Manager for DecisionBrain Gene, a platform that reduces the effort, time, and risk associated with creating tailored solutions. Since December 2019, this platform has been included in IBM Data and AI offering as an OEM: it’s commercialized as the new version of IBM Decision Optimization Center (DOC). Giulia holds a Master’s Degree in Industrial Engineering from the University of Bologna (Italy).
Alexa Salles is Marketing Manager at DecisionBrain. She has experience in developing B2B strategic activities, producing assets resources (videos, brochures, whitepapers, etc.) and improving search engine optimisation. Besides marketing activities, she has also been involved in several projects as a business analyst. Alexa holds an Advanced Master’s Degree in Digital Business Strategy from Grenoble Ecole de Management (France).

© CDC/Unsplash
IMPROVING HOUSING SUPPORT FOR THE VULNERABLE
ANTUELA TAKO
UK PUBLIC SECTOR HEALTH AND SOCIAL CARE ORGANISATIONS are under pressure to reduce costs and increase the efficiency and effectiveness of their services. The provision of integrated health and social care services has become a priority for government health policy in the UK and other countries. This involves offering care services to patients in the community or at home, away from hospital. In 2021, the Health Foundation argued that such an approach can achieve lower health care costs in the longer term and disease prevention. Since 2014, across Leicester, Leicestershire and Rutland (LLR) local authorities, health and social care teams and NHS organisations have been collaborating to transform healthcare services. As part of this initiative, several new community-based services offered to frail and older people were being tested locally.
One example of such service is the Leicestershire’s Lightbulb programme based in Blaby County Council.
This service delivers housing support solutions such as level-access showers or stairlifts for the frail and elderly in Leicestershire and Rutland. It aims to enable residents to lead independent lives and to stay safe in their homes and prevent falls, which in turn helps reduce the need for hospital beds.
THE CHALLENGE Leicestershire County Council (LCC) needed an independent evaluation of its planned provision of communitybased services. These are complex multi-agency services that require coordination amongst many partners, including healthcare organisations, housing support providers at county and district council level, as well as the local Clinical Commissioning Group. These are governed by de-centralised hierarchical structures, with distributed power and knowledge, which is typical of today’s organisations in the health and other industries. There was a requirement to involve both service providers and service users in the evaluation. The expertise of the research team at Loughborough University suited this need. The SIMTEGR8 project, which means SIMulation To Evaluate GREAT care, came about as a result. Other project partners included Leicestershire County Council, Healthwatch Leicester and SIMUL8 Corp. It supported the design and development of eight integrated health and social care services in LLR between 2014 and 2017.
OUR APPROACH In this project we used participative methodologies, which underpinned the development of simulation models used in facilitated workshops with groups of stakeholders. We worked collaboratively with relevant stakeholder groups to evaluate the chosen pilot services in terms of their effectiveness in avoiding emergency admissions and to identify ways in which the patient journey could be improved.
A key part of the evaluation involved running a set of workshops with both service providers and service users (patients), using a computer simulation as a dynamic process map to stimulate discussion about the patient journey and to identify improvements in workflows.
A simulation analyst and a facilitator worked closely with the stakeholder group in workshops. We co-produced simulations of the service which underpinned the analysis of the evaluation. We explored the model results to help the group understand the effectiveness of the service and find ways to improve organisational processes and performance. This approach offers more clarity and transparency in understanding the system at hand and to significantly increase commitment to change within the stakeholder organisation, as they feel an integral part of the OR intervention.
FIGURE 1 STAGES OF THE SIMTEGR8 APPROACH
The approach consists of five main stages, of which three are facilitated workshops: project briefing, conceptual modelling (workshop 1), model development, service providers (workshop 2) and service users (workshop 3) (see Figure 1).
Undertaking this project was challenging as we had to adapt our expertise to a new and complex setting, that of community-based health and social care services, and to involve a new stakeholder group, service users, in the evaluation. Utilising our previous experience of developing other collaborative approaches PartiSim and SimLean, we used soft systems methodology and lean service improvement concepts to design the facilitation process and to co-produce simulations with the stakeholder group. For the first time, we incorporated patient input into the evaluation process. This meant that we needed to introduce further simplifications to our models and analysis so technical aspects did not affect service users’ participation.
THE SOLUTION The model developed shows the flow of patient cases offered different types of services in the new redesigned service pathway, starting from a central hub where they are initially triaged for self-help or sent to the locality. The model represents each locality separately, which the user can select at the start of the simulation. For example, Figure 2 displays a screenshot of the model where the Blaby service is chosen. At locality level an initial housing MOT appointment takes place and then, depending on the type of service
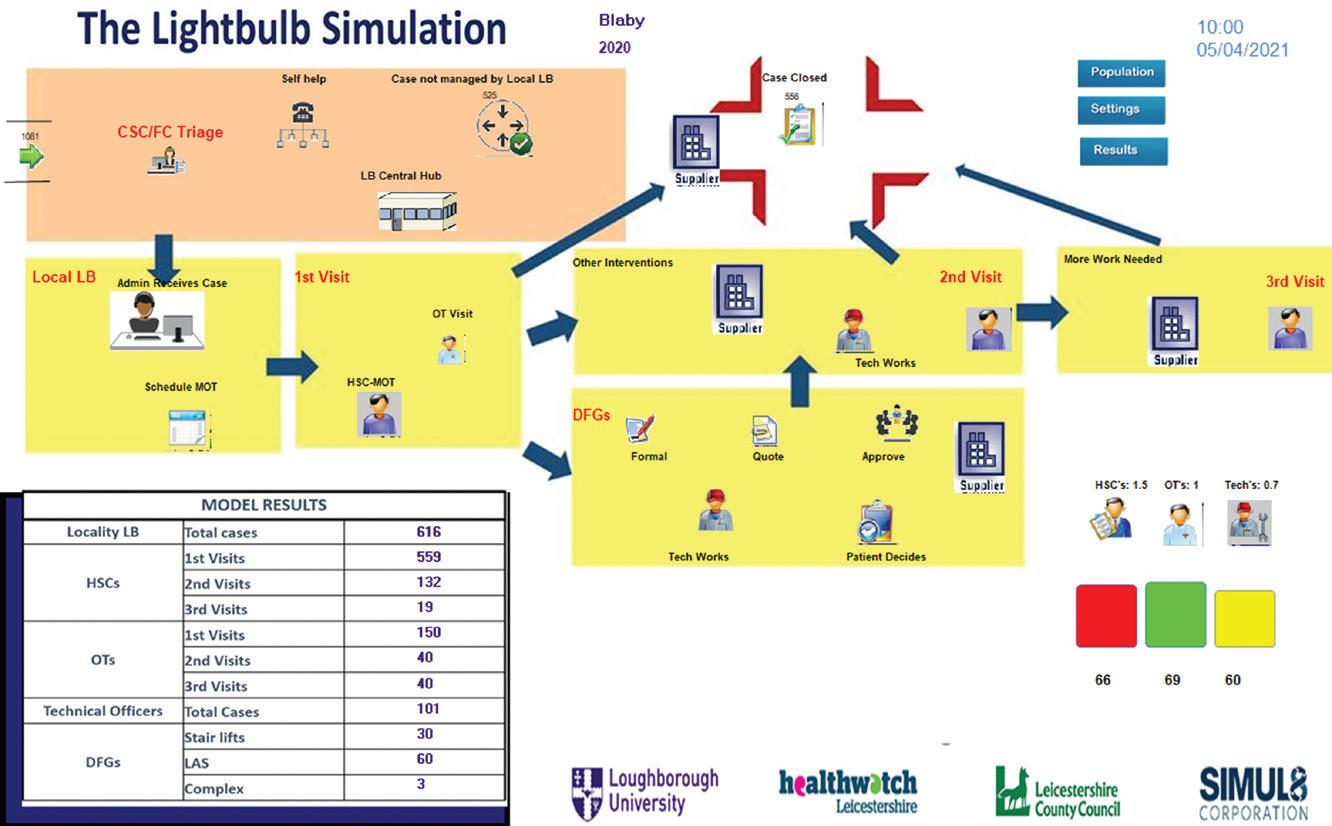
FIGURE 2 THE LIGHTBULB SIMULATION MODEL AS A DYNAMIC PROCESS MAP OF THE LIGHTBULB SERVICE
required, minor home alterations (installation of handrails) or major home adaptations (installing a downstairs bathroom or stair lift), service times and number of visits differ. Services funded via the Disabled Facility Grants (DFGs) follow a separate process, which also require approval by the service. Staffing levels (housing support coordinator, occupational therapist and technical officers) are also depicted depending on the locality chosen.
The model outputs include staff utilisation, as a percentage, for the three types of staff involved in providing services and the number of cases completed (throughput) by type of service and resource. Flexibility is embedded in the model so participants could test the model and the customer journey at different staffing and demand levels. This enabled us to validate the model and its outputs at our workshops, which increased participants’ and our confidence in the model and our analysis.
The model and its results provided evidence to support the business case developed for Lightbulb, while the service operated on a pilot basis between 2015 and 2017. Following the success of the business case, Lightbulb became fully operational in November 2017.
Analysis based on our simulations identified changes in processes and workforce configuration. Our analysis made it clear to the service providers that Lightbulb needed one point of contact for customers needing support in their homes, rather than the seven that were in place at the beginning of the pilot phase.
These changes were implemented in the real service, which led to a more efficient service, resulting in a reduction in waiting times and in the stages involved. Requests for a level-access shower could be resolved in 13 stages (in 2017), as opposed to 27 previously (2016). A 40% fall in case completion times – down from 42 days to 25 days on average – was also achieved. In addition, the service consistently met the 20-week performance target for household adaptations for disabled facility grants during the period from 2017 to 2019, having taken approximately six to eight months prior to the implementation of the changes.
As a consequence of the redesigned Lightbulb service, a 50% reduction in service costs per case – £200 versus £400 – was achieved. This led to direct cost savings for the service of £180,000 per year during the 2017-2019 period. The resources released enabled the service to deliver 37% more cases than projected at the planning stage (20162017).
As a result of the SIMTEGR8 work, a change in working practices was put in place to enable faster hospital discharges. Staff responsible for housing at the district councils worked closely alongside their colleagues in hospitals, which meant that patients could get out of hospital quicker, because they had better housing support. Over the two-year period (2017-2019) 1716 patient discharges in total were supported.
Our analysis helped in achieving improved service satisfaction levels for the frail and elderly in Leicestershire and Rutland. This meant that the service consistently met service users’ expectations, who also reported an improvement in their wellbeing, with the biggest areas of impact being quality of life and mental health.
Lightbulb also delivered economic benefits to the wider local and national health and care system, through savings of approximately £2.1 million during the period from 2017 to 2019. Estimated cost savings consist of costs avoided due to reductions in falls, falls call-out conveyances, housing support co-ordinator savings to social care, the hospital housing team in acute and mental health hospitals and disabled facility grants process reduction and the overall costs of the disabled facility grants themselves.
The then Director of Health and Care Integration at Leicestershire County Council, Cheryl Davenport, stated: ‘The SIMTEGR8 modelling was an essential part of developing the care pathway and the evaluation process during the development phase of this project… [It] helped prove the concept both operationally and financially. The service has since been fully implemented and commissioned on a recurrent basis over multiple financial years.’
IN CONCLUSION It has been rewarding to work with a service that makes a difference to our local communities, especially for the elderly and frail. We are grateful to our project partners, especially the former Director of Health and Care Integration at Leicestershire County Council for the collaboration and for allowing us to support the redesign of such a great service.
The success of this project provides evidence that the concept of using computer simulations to stimulate discussion with stakeholder groups and to find ways to improve the service collaboratively is effective. We have had lively discussions with many contributors at our workshops. Engagement with the models was also high.
Our engagement with service users brought a complementary perspective to the evaluation. It helped the researchers and the evaluation project overall to reach more meaningful conclusions. In the case of the Lightbulb model, the participants confirmed that the resulting patient waiting times were acceptable to them.
The combination of quantitative analysis (through simulation) with the qualitative analysis (through facilitation) have been useful to support stakeholder groups in understanding complex services. I hope our example inspires readers to realise the value of using collaborative methodologies to improve their organisational practices and services.
Antuela Tako is a Reader (Associate Professor) in Operational Research at Loughborough University. In her research she uses simulation approaches (discrete-event simulation, system dynamics, agent-based simulation) and problem structuring methods to help organisations improve their processes, primarily in healthcare. She is a recipient of the OR Society’s 2021 President Medal.